the eyeballs have it: searching for the value in … · the eyeballs have it: searching for the...
TRANSCRIPT
THE EYEBALLS HAVE IT: SEARCHING FOR THE VALUE IN INTERNET STOCKS
Brett TruemanDonald and Ruth Seiler Professor of Public Accounting
M.H. Franco WongAssistant Professor of Accounting
Xiao-Jun ZhangAssistant Professor of Accounting
Haas School of BusinessUniversity of California, Berkeley
Berkeley, CA 94720
January, 2000
We would like to thank David Aboody, Eli Amir, Brad Barber, Mary Barth, Bill Beaver, GeorgeFoster, Ron Kasznik, Roby Lehavy, Doug McFarland, Maureen McNichols, Karen Nelson, JimPatell and workshop participants at Stanford University for their helpful comments. We alsothank Andrew Hyde of snap.com and Alfred Lin of Venture Frogs for useful discussions in theformative stages of this project. We gratefully acknowledge Media Metrix Inc. for allowing usaccess to their Web Reports and the Center for Financial Reporting and Management at UC-Berkeley for providing financial support. B. Baik, G. Jiang, D. Li, M. Luo, A. Sribunnak, andB. Zeng provided able research assistance.
Abstract
In this paper we provide insights into the manner in which (relatively sparse) accounting
information, along with measures of internet usage, are employed by the market in the valuation
of internet firms. Consistent with those who claim that financial statement information is of
very limited use in the valuation of internet stocks, we are unable to detect a significant positive
association between bottom-line net income and our sample firms’ market prices; in fact, the
association is actually negative. However, when we decompose net income into its components,
we find gross profits to be positively and significantly associated with prices. In addition, both
unique visitors and pageviews, as measures of internet usage, are found in most instances to
provide incremental explanatory power (in some cases considerable) for stock prices. We also
separately analyze the e-tailers, and the portal and content/community firms (the p/c firms) in
our sample. For the e-tailers we find that bottom-line net income generally has a negative
association with stock prices (as for the sample as a whole), while a positive and significant
association exists for the p/c firms. In this respect, p/c firms’ shares behave more like those of
non-internet companies. Further, we find for the p/c firms that the incremental explanatory
power of pageviews and of unique visitors is approximately the same; in contrast, pageviews has
much greater incremental explanatory power for the e-tailers than does unique visitors. This
suggests that pages viewed per visitor is an especially important metric for the e-tailers, as
compared to the p/c firms.
1
THE EYEBALLS HAVE IT: SEARCHING FOR THE VALUE IN INTERNET STOCKS
1. INTRODUCTION
In this paper we provide insights into the valuation of internet stocks by examining the
extent to which their market values are associated with fundamental accounting information and
by exploring the role played by internet usage data in explaining the firms’ stock prices. This
study is motivated by the fact that many internet stocks have, for some time, been selling at high
prices relative to their operating performance. For example, as of November 23, 1999 Yahoo!
had a P/E of 1,382, eBay a P/E of 3,351, and Amazon.com traded at a multiple to revenue of
22.9 (it has been unprofitable since inception) and sported a market cap of $29.7 billion.
Statistics such as these have led many players in the stock market to scratch their heads trying to
make sense of the valuation of internet stocks. Toward this end, many new (and sometimes
unique) valuation measures have popped up, such as market value per eyeball or acquisition cost
per user, which have been used to justify the high prices that investors are paying for internet
shares.
Just how hard it is to value these companies is reflected in a recent analyst research
report on Amazon.com. At a time when the stock was trading for $130 a share, the analyst
issued a buy recommendation, even though his official projections led him to a valuation of only
$30. Admitting that he could justify any valuation between $1 and $200 (!) by varying his
assumptions, the analyst stated that his recommendation was based on the opportunity, the
company, and its management – all somewhat amorphous concepts.
There are two fundamental reasons why it is difficult to value internet firms. First, the
1That current web traffic is a leading indicator of future revenue is consistent with the notion that attractingvisitors and establishing a brand name is a very important determinant of a firm’s success. In a recent Wall StreetJournal article (“Finding the Needles”, November 22, 1999, p. R44), Ann Winblad, co-founder of Hummer WinbladVenture Partners, stated that “Internet companies need to attract customers early and fast. That means reaching a bigaudience and achieving stickiness – keeping visitors at your site once they come. Those two goals drive the Internetbranding process.” In another article in the same issue (“Buying the Buyers”, p. R42), Bruce Mowery, vice presidentof marketing and business development for more.com stated that “[w]e’ll invest what it takes to be competitive inbuilding a large customer base and maintaining a large share of the market”. Additionally, many internet analystsemploy web site usage measures in their forecasts of revenues for the firms they cover.
2
industry and the firms within it are so young that there is very little historical financial
information available with which to forecast future profitability. (Most of the firms have never
reported a quarterly profit and are not expected to do so for some time.) Second, the industry is
evolving at such a rapid pace that whatever historical information exists is likely to be less
useful for valuing these firms than for valuing those in more established industries, or even those
in non-internet high-tech industries.
These difficulties notwithstanding, the internet industry does offer one important
advantage – the availability of a substantial amount of non-financial data on internet usage,
which investors can employ in the prediction of future revenues. It is expected that current
traffic at an internet firm’s web site(s) will be positively related to future revenues, as it reflects
potential future demand for the company’s products and, at least indirectly, affects the rates the
firm can charge for advertising on its web site(s).1 This data comes directly from the internet
companies, as well as from independent rating firms (such as Media Metrix, PC Data, and
Nielsen//Netratings), and includes, among other numbers, statistics on web site pageviews and
visitors. The availability of this data provides an opportunity to explore how investors
supplement relatively sparse financial information with non-financial data in the valuation
process.
2See, for example, “Do Profits Really Matter?”, by Dan Mitchell (The Standard, December 20, 1999), athttp://www.thestandard.com/article/display/0,1151,8221,00.html.
3
In our study we focus on a subset of the internet stock universe – the portals (those
providing a gateway to the internet), the content/community providers (those catering to certain
segments of the population or to groups of people with specific interests), and the e-tailers (who
sell goods and services on the internet). These firms share a common characteristic in that their
primary business involves direct contact with users on the web. They are arguably among the
best-known internet firms and include the four largest internet companies – America Online,
Yahoo!, eBay, and Amazon.com. Other types of internet firms, such as those providing security
or those solely offering internet access, were excluded from our study, as they are of a distinctly
different nature from those which we have chosen to include. Our final sample consists of 56
publicly traded internet firms spanning 179 firm-quarters. For each firm-quarter we collected
detailed financial statement information, and were provided with measures of internet usage by
Media Metrix.
Consistent with those who claim that financial statement information is of very limited
use in the valuation of internet firms,2 we are unable to detect a significant positive association
between bottom-line net income and our sample firms’ stock prices. In fact, in a regression of
market value on book value and net income, the adjusted R2 comes to just 3 percent, with the
coefficient on net income actually turning out negative. The picture changes dramatically,
though, when we decompose net income into gross profits (revenues minus cost of revenues)
and its various other components (to allow for the possibility that the individual line items have
different implications for future firm profitability). Not only do we find a positive and
4
significant association between gross profits and prices, but there is a large jump in the adjusted
R2, to 50 percent. These results are consistent with the observation that internet firms’ bottom
lines often include large transitory items (such as merger-related costs), upon which investors
likely place less weight in valuation, as well as items that might be considered in some firms to
be investments rather than expenses (such as sales and marketing expenses or research and
development costs). Gross profits, in contrast, reflects a firm’s current operating performance
and is often considered of a more permanent nature. In addition to these results, we find book
value to have significant explanatory power for stock prices, over and above bottom-line net
income. The significance disappears, however, when book value is instead included with the
components of income.
Turning to the non-financial information, we find in general that internet usage measures
complement the accounting data, by providing (often considerable) incremental explanatory
power for stock prices. In particular, combining web site pageviews with bottom-line net
income increases the adjusted R2 by 34 percentage points, while adding unique visitors leads to
a more modest increase of 6 percentage points. Alongside all the components of net income,
pageviews still increases the adjusted R2, but by a smaller 16 percentage points; unique visitors
does not increase it at all.
These findings, taken together, suggest that internet usage measures play a significant
role in the valuation of internet stocks. That the increase in the adjusted R2 is much less when
usage is combined with the components of net income, though, implies that usage data and
individual income statement line items (especially gross profits) capture some of the same
information. Once the information conveyed by the components of net income is taken into
5
account, the informational role of internet usage appears to be considerably diminished.
Furthermore, the fact that pageviews provides more explanatory power for stock prices than does
unique visitors in our sample of firms implies that the number of pages viewed by each visitor
conveys important information to investors.
These results apply to our sample of firms taken as a whole. To obtain further insights
into the pricing of internet stocks we divide our sample into two groups: the e-tailers, and the
portal and content/community firms (together referred to as the p/c firms). A major difference
between these two groups of firms is in the way that they generate revenues. The e-tailers
produce revenues by attracting visitors to their web sites and selling products, while the p/c
firms depend for their revenues largely on advertising. Because of this, we expect there to be
differences in the way in which investors use the available financial data in valuation, as well as
differences in the relative importance of visitors and pageviews as measures of internet usage.
For the e-tailers we find it to be the case that bottom-line net income is negatively associated
with stock prices, as for our sample as a whole; however, a positive and significant association
exists for the p/c firms. In this respect, p/c firms’ shares behave more like those of non-internet
companies. Further, we find for the p/c firms that the incremental explanatory power of
pageviews and of unique visitors is approximately the same, while pageviews has much greater
incremental explanatory power for the e-tailers than does unique visitors. This suggests that
pages viewed per visitor is an especially important metric for the e-tailers, as compared to the
p/c firms.
While ours is the first paper to consider the role of non-financial data in the valuation of
3In concurrent research Hand (1999) analyzes the pricing of internet stocks using financial data.
4See, for example, Ohlson (1995) for a detailed discussion of this model.
6
internet stocks,3 others have explored its role in other contexts. For example, Amir and Lev
(1996) examined the valuation implications of different types of non-financial information, in
conjunction with the available financial data, within the wireless communications industry. The
usefulness of patent citations for predicting future market-to-book ratios and stock returns for
high-tech firms was explored by Deng, Lev, and Narin (1999), while Chandra, Procassini, and
Waymire (1997) examined price reactions to the announcement of the book-to-bill ratio within
the semiconductor industry. Finally, Ittner and Larker (1998) considered the relation between
customer satisfaction measures and both accounting numbers and market values, and examined
the ability of these measures to predict revenues.
The plan of this paper is as follows. In Section 2 we link internet firm stock prices to the
underlying financial and non-financial information available to investors and specify our
regression equations. This is followed in Section 3 by a description of the data collected for our
tests. The results of our regression analyses are presented in Section 4. A summary and
conclusions section ends the paper.
2. THE EMPIRICAL MODEL
2.1 LINKING INTERNET STOCK PRICES TO FUNDAMENTAL INFORMATION
As a foundation for our empirical tests, in this subsection we relate an internet firm’s
stock price to its underlying financial and non-financial data. We begin with the well-known
residual income model:4
7
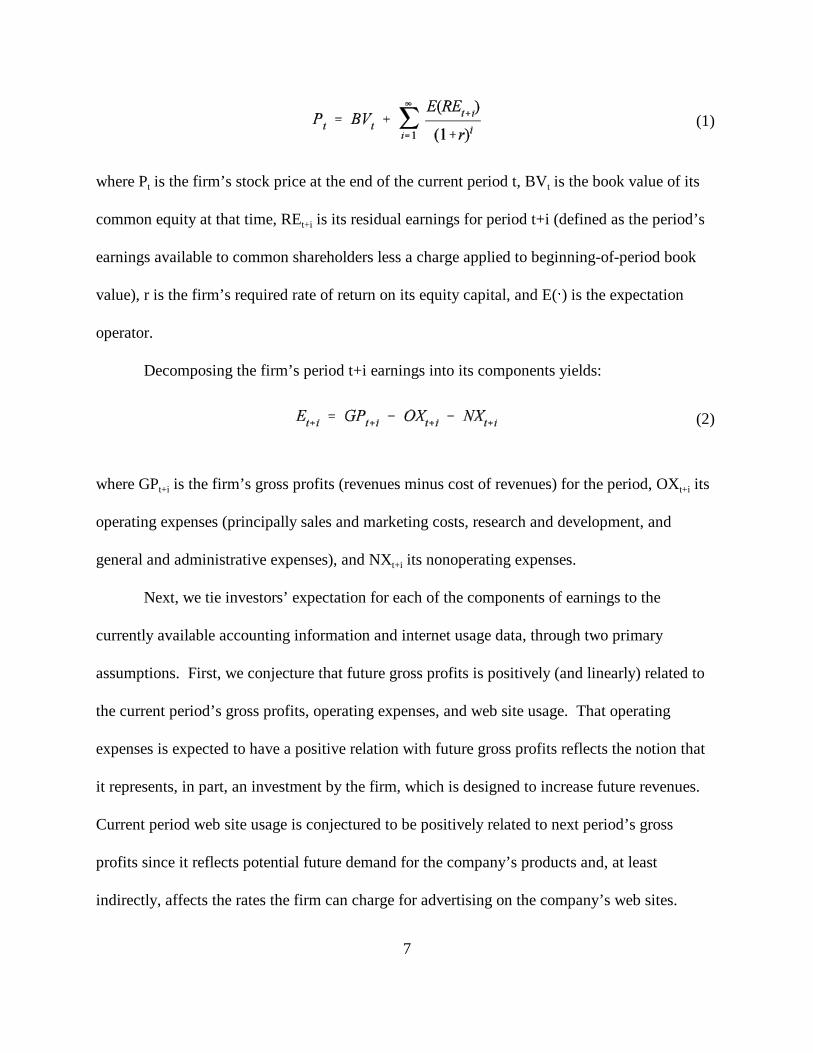
(1)
(2)
where Pt is the firm’s stock price at the end of the current period t, BVt is the book value of its
common equity at that time, REt+i is its residual earnings for period t+i (defined as the period’s
earnings available to common shareholders less a charge applied to beginning-of-period book
value), r is the firm’s required rate of return on its equity capital, and E(A) is the expectation
operator.
Decomposing the firm’s period t+i earnings into its components yields:
where GPt+i is the firm’s gross profits (revenues minus cost of revenues) for the period, OXt+i its
operating expenses (principally sales and marketing costs, research and development, and
general and administrative expenses), and NXt+i its nonoperating expenses.
Next, we tie investors’ expectation for each of the components of earnings to the
currently available accounting information and internet usage data, through two primary
assumptions. First, we conjecture that future gross profits is positively (and linearly) related to
the current period’s gross profits, operating expenses, and web site usage. That operating
expenses is expected to have a positive relation with future gross profits reflects the notion that
it represents, in part, an investment by the firm, which is designed to increase future revenues.
Current period web site usage is conjectured to be positively related to next period’s gross
profits since it reflects potential future demand for the company’s products and, at least
indirectly, affects the rates the firm can charge for advertising on the company’s web sites.
5From a theoretical perspective, Penman (1998) shows that the sign of the coefficient on book value, a1,should be positive. Empirically, though, he finds it to be negative in some cases. Zhang (1999) argues that a negativecoefficient is consistent with conservative accounting. That a3 can be of either sign follows from the fact thatoperating expenses enters expression (2) negatively, while, at the same time, is assumed to have a positive impact onfuture gross profits.
6It should be recognized that the magnitudes of the coefficients in expression (3) are likely to vary over time,as each of our internet firms evolves and matures. Consequently, it does not follow that the change in a firm’s stockprice over time is linearly related to the change in the right-hand side variables in (3).
8
(3)
(4)
Second, we assume that future expected operating expenses is (linearly) related to current
operating expenses and that future nonoperating expenses (aside from net interest expense) is
expected to be zero.
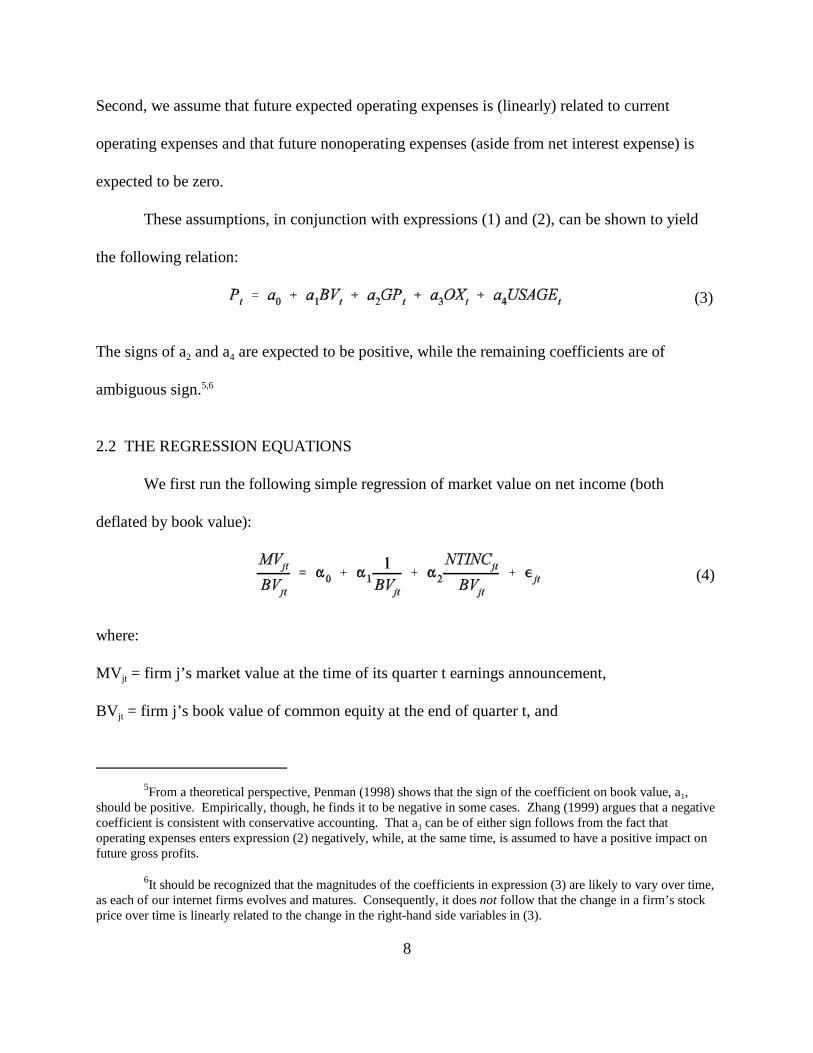
These assumptions, in conjunction with expressions (1) and (2), can be shown to yield
the following relation:
The signs of a2 and a4 are expected to be positive, while the remaining coefficients are of
ambiguous sign.5,6
2.2 THE REGRESSION EQUATIONS
We first run the following simple regression of market value on net income (both
deflated by book value):
where:
MVjt = firm j’s market value at the time of its quarter t earnings announcement,
BVjt = firm j’s book value of common equity at the end of quarter t, and
9
(5)
NTINCjt = net income available to firm j’s common shareholders in quarter t.
Expression (4) strictly follows from (3) only under restrictive conditions on the growth rates of
the various income statement line items, and under the assumption that financial data, alone, is
sufficient for valuation purposes. Nevertheless, we run this regression in order to directly
address the often-heard assertion that net income plays only a small role, at best, in the valuation
of internet stocks.
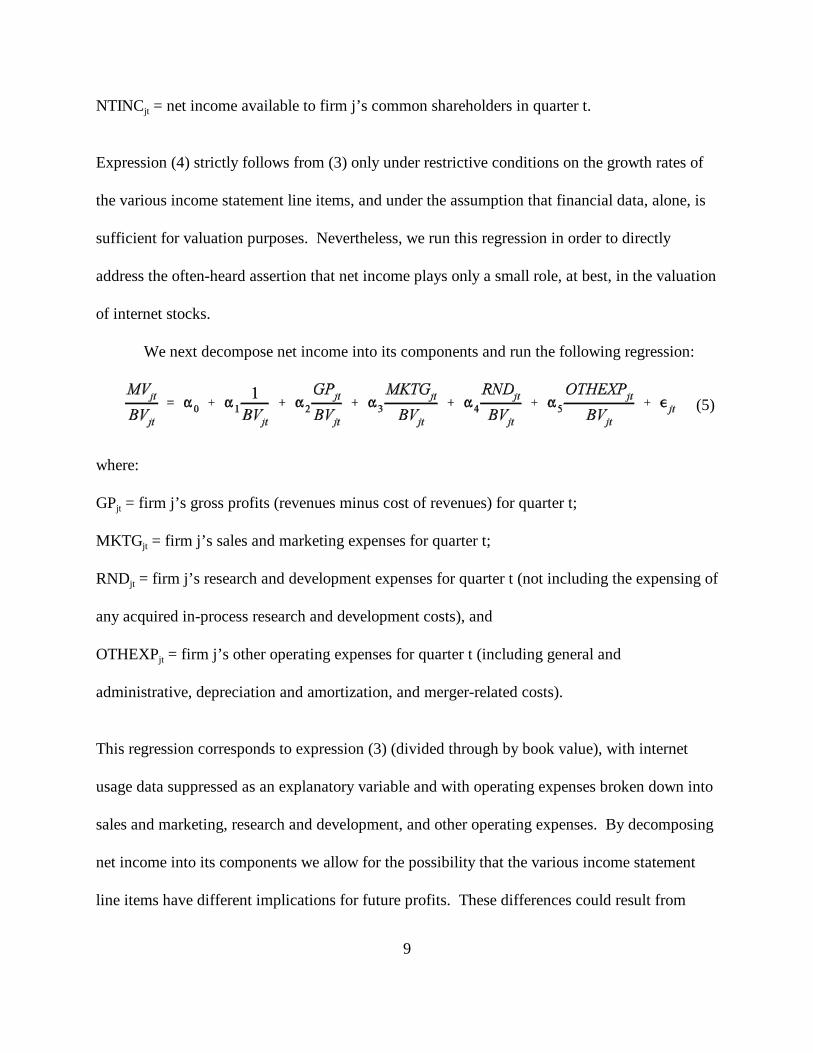
We next decompose net income into its components and run the following regression:
where:
GPjt = firm j’s gross profits (revenues minus cost of revenues) for quarter t;
MKTGjt = firm j’s sales and marketing expenses for quarter t;
RNDjt = firm j’s research and development expenses for quarter t (not including the expensing of
any acquired in-process research and development costs), and
OTHEXPjt = firm j’s other operating expenses for quarter t (including general and
administrative, depreciation and amortization, and merger-related costs).
This regression corresponds to expression (3) (divided through by book value), with internet
usage data suppressed as an explanatory variable and with operating expenses broken down into
sales and marketing, research and development, and other operating expenses. By decomposing
net income into its components we allow for the possibility that the various income statement
line items have different implications for future profits. These differences could result from

7This decomposition is likely to prove important in understanding how investors value firms in otherindustries as well.
10
(4’)
(5’)
variations in growth rates across individual line items and the possibility that investors consider
some expenses to actually be investments in the company’s future. This decomposition is
particularly important for internet firms that are growing rapidly, and spending significant
amounts of money to ensure the continuation of this growth.7
We then augment regressions (4) and (5) by including a measure of internet usage,
USAGEjt, as an additional independent variable, along with the financial data. This yields:
and
In running (4') and (5') we alternatively measure internet usage by the number of unique visitors
to the firm’s web site(s) and by the number of pageviews at its site(s). Based on our previous
discussion, we expect the signs of "2 and $ to be positive, with the other coefficients of
ambiguous sign.
3. THE DATA AND DESCRIPTIVE STATISTICS
3.1 SAMPLE SELECTION CRITERIA
Our initial sample consisted of all those firms appearing on the InternetStockList
8According to internet.com, the InternetStockList is “[a] comprehensive list of the more than one hundredpublicly-traded companies involved solely in Internet-related business”.
9In classifying firms we relied primarily on the self-descriptions contained in their earnings announcements.
10We require book value to be positive since we deflate by it in our regressions.
11
(compiled by internet.com) as of July 15, 1999.8 To this list we added Netscape, geocities, and
broadcast.com, which were acquired prior to July 1, 1999, and Excite, which merged with
@Home earlier in the year. From this sample we retained only those firms that we judged to be
primarily portals, content/community providers, or e-tailers.9 This left us with 73 firms. We
then deleted those firm-quarters for which either the firm’s earnings announcement did not
disclose all of the individual income statement line items that were needed for our analysis, or
for which the firm’s common equity book value was negative.10 Of the remaining firm-quarters
we eliminated those for which Media Metrix did not supply internet usage data (as described
below). Our final sample consists of 56 firms and 179 firm-quarters of earnings
announcements. The appendix provides a list of these firms.
3.2 FINANCIAL INFORMATION
The financial statement information in our study was taken directly from the quarterly
earnings announcement press releases (appearing on either PR Newswire or Business Wire) for
each of our firms, from the time of its initial public offering. From each announcement we
extracted the following information: (1) revenues, (2) cost of revenues, (3) sales and marketing
expenses, (4) research and development costs, (5) total operating expenses other than cost of

11In a few cases a firm would report earnings for the quarter ending just prior to its initial public offering. Inthat case the firm’s end-of-quarter book value would not include the proceeds of the offering. For each such quarterwe restated the book value on a pro forma basis, to reflect the offering proceeds. We did so by setting it equal to thebook value at the end of the succeeding quarter (after the firm’s share offering) minus the earnings for the quarter.
12For those instances in which companies participate in conference calls right after the earningsannouncement, investors may actually have access to additional financial information than what is available in thepress release. While this will introduce noise into our data, it should not bias our findings.
13Since we were unable to determine the exact number of common shares outstanding on the day followingthe earnings announcement, we used as an approximation the number of outstanding shares listed on the face of thefirm’s 10-Q. This number is reported as of a date that is usually within a few weeks of the earnings announcement.
14If investors discount a firm’s stock price to account for the possibility of future stock option exercise, thenmultiplying price per share by number of shares currently outstanding (without adding an estimate of the number ofoptions expected to be exercised) will give a conservative estimate of the firm’s total market value. However, it is notexpected to introduce a bias into our results.
12
revenues, (6) net income, and (7) end-of-quarter book value.11
We chose to obtain our financial data via this route, rather than retrieve it from
Compustat, because we wanted our data set to consist solely of information known to investors
at the time of the earnings announcement. Compustat’s data may differ from that available to
investors at the earnings release date because (1) its data is obtained from companies’ 10-Q
filings, which may include more detailed information than what is available in the original press
release, and (2) Compustat restates historical financial information whenever the firms,
themselves, issue restated numbers.12
We computed the total market value of equity (the undeflated dependent variable) at the
time of each earnings announcement by multiplying the firm’s closing price per share on the
trading day subsequent to the earnings announcement by the number of shares outstanding at
that time.13,14 We used the time of the earnings announcement to measure market value, rather
than the end of the quarter, to ensure that the stock price incorporated the earnings information
released.
15See “The Tricky Task of Tracking Web Users” (November 22, 1999, p. C1), by Nick Wingfield.
16An official at Media Metrix told us that the web usage data for months prior to October 1998 is not strictlycomparable to that for the post-October period due to the company’s merger with RelevantKnowledge, another webrating firm, around that time.
13
3.3 NON-FINANCIAL INFORMATION: INTERNET USAGE DATA
There are two potential sources for web site usage data – the internet companies,
themselves, and independent measurement firms. It might be expected that the internet
companies would be the superior source for usage data on their own web sites. Unfortunately,
not all companies provide such data each quarter. Even those that do may not define their usage
measures in the same manner, making intercompany comparisons problematic. (For example,
one firm might count the same page viewed twice by a given user in a single day as two
pageviews, while another might count it as only one. Or, one firm might count as two users a
single person who logs onto its web site twice in a given time period, while another firm might
count that user only once.) Using an independent measurement firm as the data source, on the
other hand, avoids these problems by providing a reliable time series of usage data that is
consistently defined across internet companies.
For our study we obtained web usage data from Media Metrix, which has the longest
time series of data of any independent internet rating firm, and which was described in a recent
Wall Street Journal article as the most widely used web rating company.15 Their services are
utilized by more than 500 clients, including financial services companies, advertising agencies,
and e-commerce marketers. Media Metrix provided us with their monthly Web Report for the
months of October and December 1998, and March, June, and September 1999.16 This report

17Media Metrix defines reach as the “percentage of projected individuals...that accessed the web content of aspecific site or category among the total number of projected individuals using the web during the month.”
18Until recently, Media Metrix only tracked domestic web users. It has expanded its coverage globally, andis now the only web rating company in the U.S. that tracks international users.
19Since access to the Web Report is fee-based, the extent to which (non-client) investors have access to it ona timely basis is unclear. To the degree that they do not, we are less likely to find a significant association between theweb usage measures and market prices.
20The other major web rating firms use similar sampling techniques to compute their internet usage numbers.
14
provides a number of different metrics for all reportable web sites that have a projected reach of
0.4% or higher.17,18 It is normally released to clients (who pay a fee to obtain access to the
report) a few weeks after the end of the month.19 The company also issues a press release each
month listing the number of unique visitors to the top 50 web sites during the previous month.
This information, however, is a very small subset of that contained in the monthly Web Report.
Media Metrix generates its raw data from a random panel of 50,000 internet users who
are willing to install tracking software on their computers at home and/or at work. This data is
retrieved either in real-time via the web (for one-third of its panel members) or on a monthly
basis by mail via disk (for two-thirds of the panel). The monthly web usage figures are
extrapolated from the sample data based on the firm’s estimate of the total number of web
users.20
We choose to focus on two measures of internet usage, “unique visitors” and
“pageviews”, which are among the most often-cited measures in the popular press. For a given
firm, unique visitors is the estimated number of different individuals who visit the firm’s web
site(s) during a particular month. The numbers for unique visitors are taken directly from Media
Metrix’s monthly Web Report. Pageviews is the estimated number of pages viewed by those
individuals visiting the firm’s web site(s) during the month. While it is not directly reported by
21Media Metrix gives the precise definition of unique visitor as “[t]he estimated number of differentindividuals within a designated demographic or market break category that accessed the Web content of a specific siteor category among the total number of projected individuals using the web during the month.” Average usage daysper visitor is defined by them as “[t]he average number of different days in the month, per person, in which a site orcategory was visited.” Average (daily) unique pages per visitor in a month is defined as “the average number ofdifferent page requests made per day over the course of the month by those persons visiting the specific site orcategory.”
22A very small minority of firm-quarters end approximately one month later than the rest. For the purposesof pairing these firm-quarters with non-financial data, we treat the quarters as if they ended at the same time as theothers. This means that the internet usage data for these sample points will be a month out-of-date.
23For some firm-quarters the Web Report comes out after the earnings announcement date. In these cases,the firm’s stock price at that date would not be expected to fully reflect the non-financial data. This will reduce thepower of our tests, but will not introduce any bias. This problem will be minimized to the extent that investors haveaccess to Media Metrix’s Weekly Flash. According to the company’s web site the Weekly Flash “is designed toprovide preliminary ‘snapshot’ audience measurement indicators”.
15
Media Metrix (there is no universally agreed-upon definition of this measure), we estimate it by
multiplying together three measures that they do provide: (1) the number of unique visitors, (2)
the average usage days per visitor in a month, and (3) the average daily unique pages viewed per
visitor in a month.21
For the firm-quarters ending December 1998, and March, June, and September 1999 we
pair our financial data with the non-financial data in Media Metrix’s report of the same
month.22,23 For the firm-quarters ending in September 1998 we use the October 1998 data,
extrapolating back to September by taking the difference between the October and December
1998 Media Metrix usage numbers and assuming constant growth per month over the quarter.
3.4 DESCRIPTIVE STATISTICS
Table I provides descriptive data on the firms and firm-quarters in our final sample. As
measured by length of time since their initial public offering, our firms are quite young. Our
oldest firm has been trading (as of December 31, 1999) for more than 7½ years and the youngest
for slightly less than 6 months. The mean (median) trading duration is 21 (16) months.
24With internet shares so much in demand, the pace of initial public offerings has accelerated during 1999,with over 150 internet firms going public in the last half of the year.
16
Unreported statistics show that only two of our firms came public before 1996, while 6 began
trading during 1996, 8 in 1997, 14 in 1998, and 26 in the period from January 1 - July 15,
1999.24 As is true for the internet firm population in general, most of our sample firms are
unprofitable. In only 28 (16 percent) of the 179 firm-quarters in our sample, and for only 10 (18
percent) of our 56 firms, were positive profits reported. The market value/earnings (P/E) ratio
for these few profitable firm-quarters averages an astounding 3,731 (the median is 866), and
ranges as high as 34,919 (for Netscape - 3rd fiscal quarter 1998). The market value/revenue ratio
also averages a very high 135 (median of 86), with a maximum of 771 (eBay - 1st fiscal quarter
1999). The average market capitalization over these 179 firm-quarters is $6.3 billion (the
median is $715 million), and ranges as high as $155 billion (America Online - 1st fiscal quarter
2000). In contrast, the book value of these firms averages only $224 million (median of $84
million), with a maximum of $3.8 billion. The market-to-book ratio, as a consequence, averages
21 (the median is 8.8), with a maximum of 351 (Amazon.com - 1st fiscal quarter 1999). With
respect to the internet usage measures, the average number of unique visitors per month at our
firms’ web sites is 7.1 million (the median is 3.1 million), with a maximum of 42.6 million. The
average number of web site pageviews per month is 798.9 million (median of 63.0 million), and
ranges as high as 16.6 billion.
While our firms are, in general, not profitable and have relatively low revenues, they are
growing rapidly. The average quarter-to-quarter revenue increase is 37 percent (with a median
of 28 percent), and ranges as high as 179 percent. At the same time, the growth in unique
17
visitors averages 21 percent (median of 10 percent), with a maximum of 366 percent, and the
growth in pageviews is 35 percent (median of 16 percent), with a maximum of 473 percent. As
these statistics confirm, investors in the market are clearly paying for growth, rather than current
performance.
Table II, panel A provides statistics on both the dependent variable and all of the
explanatory variables included in at least one of our regressions. All of these variables are
deflated by book value. The dependent variable, the market-to-book ratio, has a mean of 21.0
and a standard deviation of 39.6. By comparison, the mean net income-to-book value is -0.11,
with a standard deviation of 0.13. Each of the components of net income, as a fraction of book
value, have means and standard deviations that are roughly equal to each other and no greater
than 0.10 in magnitude. The mean unique visitors-to-book value is 0.05, with a standard
deviation of 0.06. In contrast, pageviews/book value has a much higher mean, 2.8, and a
standard deviation of 6.4, more than twice as large as its mean.
Panel B of Table II presents the correlation matrix for the independent variables in the
regressions (all deflated by book value). Somewhat surprisingly, net income has a significant
correlation with only one income statement component, sales and marketing expenses (and the
correlation is unexpectedly positive). It is also significantly (and positively) correlated with only
one of the two measures of internet usage, unique visitors. Gross profits is positively and
significantly correlated with each of the expense components, as well as with both internet usage
measures. The correlation between the two non-financial measures, unique visitors and
pageviews, is positive and relatively high, at 0.40. This is not surprising, given that unique
visitors is one of the three components used to calculate pageviews.
25All t-statistics are adjusted for heteroscedasticity using White’s (1980) standard errors, if the null ofhomoscedasticity is rejected at the 5 percent level.
26Hayn (1995) documents differences in the market implications of earnings for firms reporting profits andfor those reporting losses. She argues that the differences are due to the market’s perception of losses as transitory. We have chosen not to decompose our sample in this manner, for two reasons. First, the vast majority of our firmshave losses. Second, unlike more traditional firms, these losses stem to a large extent from ongoing operatingexpenditures, such as sales and marketing, and research and development. Therefore, investors may not view astransitory the losses of internet companies.
27We also ran a regression that included revenues and cost of revenues as separate independent variables inplace of gross profits. As expected, the coefficients on these variables is found to be opposite in sign, andinsignificantly different from each other in magnitude. This decomposition has no effect on the significance of theother independent variables.
18
4. EMPIRICAL RESULTS
4.1 THE FULL SAMPLE
In columns A and D of Table III we report the results of regressing market value on
bottom-line net income, and on the components of net income, respectively (with all variables
deflated by book value), without including any of the measures of internet usage.25 Consistent
with those who claim that financial statement information is of very limited usefulness in the
valuation of internet firms, we are unable to detect a significant positive association between net
income and market value; in fact, the adjusted R2 is only 3 percent and the association is
actually negative. The lack of a significant positive association may be the result of the fact that
the net income of internet firms frequently includes transitory items, for which investors likely
place less weight in valuation, as well as the possibility that investors consider some income
statement line items to be investments rather than expenses.26
Once we include the components of net income in the regression the adjusted R2 jumps
to 50 percent. In addition, we find that gross profits is positively and significantly associated
with market value.27 This suggests that gross profits is viewed by investors as more permanent
28Lev and Sougiannis (1996) show that in other industries, capitalized research and development costs arepositively priced in the market, consistent with investors viewing research and development as an investment, ratherthan an expense.
29In line with our results, Hand (1999) independently finds a negative coefficient on core net income (netincome minus special items) for a subsample of firms whose core net income is negative. In contrast to what weshow, he also finds revenues to be negatively associated with stock prices, while cost of revenues, sales and marketingcosts, and research and development expenses have a positive association.
30While several prior studies have shown a significant association between book value and stock prices inother industries (see, for example, Easton and Harris (1991) and Penman (1998)), none have examined its incrementalexplanatory power when combined with the income statement components.
19
in nature and as a less noisy measure of current operating performance than is bottom-line net
income. In contrast to gross profits, neither research and development nor sales and marketing
costs is significantly associated with market prices, in a positive or a negative direction. This
result is consistent with investors finding these expenses to be of little use in valuing internet
firms. However, the result could also be due to investors viewing these costs as normal expenses
for some internet firms, and as investments for others (more about this below).28 Other operating
expenses as well does not exhibit a significant association with stock prices. Since this variable
includes many individual income statement line items, we do not attempt to interpret the lack of
a significant coefficient.29
It is also interesting to note that the intercept term (which corresponds to the coefficient
on book value in expression (3)) is statistically positive when included with bottom-line net
income (panel A), but insignificant alongside the components of income (panel D). Stated
another way, book value has incremental explanatory power for the stock prices of internet firms
over and above net income; in contrast, when net income is decomposed into its components,
book value loses its significance.30
In the remaining columns of Table III we report the results of examining the incremental
31We also ran a set of regressions in which both unique visitors and pageviews were included as independentvariables along with the financial data. These regressions yield qualitatively similar results to those discussed here.
32To control for cross-correlations in the residuals across time, we repeated our tests separately for each ofthe quarters ending September and December 1998, and March, June, and September 1999. The results arequalitatively very similar to those obtained using the full sample. In particular, the coefficients on both gross profitsand pageviews remain positive and significant in virtually all the quarters, while that for unique visitors becomesinsignificant in a few cases.
33As a robustness check, we added firm age, growth in revenues, and growth in internet usage as controlvariables to our regressions. The results obtained are very similar to those reported above.
20
explanatory power of the internet usage measures. We find that unique users and pageviews are
in general positively and significantly associated with market value when included alongside the
financial statement information.31 Combined with bottom-line net income, for example,
pageviews increases the adjusted R2 from 3 percent to 37 percent (column C), while alongside
the components of net income, the increase in the adjusted R2 is a more modest 16 percentage
points (column F). When included with bottom-line net income, unique visitors also increases
the adjusted R2, but by a relatively small 6 percentage points (column B). Combined with the
income statement components, though, there is no change in the adjusted R2 (column E). Taken
as a whole, these findings imply that measures of internet usage are important factors in the
valuation of internet stocks, even after allowing for investors to interpret the individual line
items of net income differentially. However, the fact that the increase in the adjusted R2 is so
much less when these measures are included with the components of net income suggests that
the individual income statement line items (especially gross profits) and the non-financial data
capture some of the same information. Once the information conveyed by the components of
net income is taken into account, the informational role of internet usage appears to be
considerably diminished.32,33
21
4.2 PARTITIONS BY FIRM-TYPE
Our results thus far pertain to our sample of firms taken as a whole. To obtain further
insights into the pricing of internet stocks we analyze separately the e-tailers, and the portal and
content/community firms (together referred to as the p/c firms). We choose this partition
because these two groups of firms differ in the way they generate revenues. Specifically, the e-
tailers produce revenues by attracting visitors to their web sites and selling products, while the
p/c firms depend for their revenues largely on advertising. Because of this, certain individual
income statement line items may be relatively more useful in the prediction of the future
revenues and profits of the e-tailers than in the prediction of the revenues and profits of the p/c
firms (and vice-versa). As a result, it is possible that some line items will show up as having a
significant association with the stock prices of the e-tailers (p/c firms), but not with the prices of
the p/c firms (e-tailers). Alternatively, it is possible that a particular line item could be
significantly associated with the prices of both sets of firms, but in opposite directions, as
investors consider the line item to be an investment for one type of firm and an expense for the
other. For example, sales and marketing might be viewed as an investment for the e-tailers,
necessary to bring in visitors who will buy products in future periods, and as an expense for the
p/c firms, used to generate the current period’s advertising revenues. Furthermore, there may be
differences in the relative importance of unique visitors and pageviews as measures of internet
usage. Ex-ante, one might conjecture that pageviews should be relatively more important for the
p/c firms, as revenues from advertisers are normally calculated on the basis of number of web
site pages viewed by visitors, while unique visitors should be relatively more important for the e-
tailers, as the amount of purchases made depends on the number of customers the firms attract.
22
Table IV presents descriptive statistics for these two groups of firms. With respect to
time since public offering, both the e-tailers and the p/c firms are quite young (with a median
time on the market of less than 1½ years). The p/c firms are larger than the e-tailers, both in
terms of median market value ($796 million vs. $604) and book value ($102 million vs. $79
million). The median market-to-book ratio is also higher for the p/c firms than for the e-tailers
(9.8 vs. 6.2) as is the median market value/revenue ratio (104 vs. 49). (Differences in the
market value/earnings ratio are not very meaningful, given the small sample sizes.) In terms of
internet usage, the p/c firms have a greater number of visitors (a median of 4.6 million vs. 2.0
million) and pageviews (a median of 106 million vs. 41 million) per month than the e-tailers.
The p/c firms are also growing faster than the e-tailers, as measured by median quarter-to-
quarter revenue growth (30 percent vs. 24 percent) and median pageview growth (18 percent vs.
13 percent). However, the median growth rate in unique visitors is higher for the e-tailers than
for the p/c firms (13 percent vs. 6 percent).
Table V provides the results of separately regressing the e-tailers’ and p/c firms’ stock
prices on the available financial and non-financial information (with all variables again deflated
by book value). As shown in panel A, bottom-line net income is negatively associated with
market prices for the e-tailers, as is true for our sample as a whole. In contrast, there is a
positive and significant association between net income and market value for the p/c firms. In
this regard, p/c firms’ shares behave more like those of non-internet companies. When net
income is decomposed into its components (panel D), gross profits is found to have a
statistically positive association with the market values of both firm types, as for the sample as a
whole. Additionally, sales and marketing costs exhibit a significantly negative association with
34As we did for the full sample, we checked the robustness of our findings by adding firm age, growth inrevenues, and growth in internet usage in our subsample regressions. The qualitative findings remained unchanged.
23
the stock prices of the p/c firms; this is not true for the e-tailers. Apparently, investors view
sales and marketing costs for the p/c firms as normal expenses of doing business, rather than as
investments, just as would be expected for firms in more established industries. In contrast to
sales and marketing expense, research and development costs are not significantly associated
with stock prices. Additionally, in both sets of regressions we find book value to have
significant incremental explanatory power for the stock prices of p/c firms, but not for the e-
tailers. This characteristic suggests, once again, that the p/c firms are more like non-internet
companies than are the e-tailers.
With respect to the non-financial data, both unique visitors and pageviews exhibit a
significant and positive association with the market prices of the e-tailers and the p/c firms in
every instance but one (as is true in our sample as a whole). For the p/c firms the incremental
contribution of pageviews to the adjusted R2 is slightly more than that of unique visitors; for the
e-tailers, in contrast, the incremental impact of pageviews is considerably greater than that of
unique visitors. For example, the adjusted R2 for the e-tailers increases by 15 percentage points
when unique visitors is combined with net income, but it jumps by 46 percentage points when
pageviews is included instead. That pageviews provides a much larger increase in the adjusted
R2 for the e-tailers, as compared to unique visitors (contrary to prior conjectures), suggests that
investors consider it insufficient for an e-tailer to bring visitors to its site(s); the visitors must
actually spend time searching the pages for items to buy.34
As in any industry classification, our e-tailers and our p/c firms each reflect somewhat

24
diverse groups of companies. For example, in the e-tailer group, Amazon.com fits the
traditional retailer definition in that it buys at wholesale and sells at retail, while eBay is in some
sense an e-commerce enabler, in that it provides services and software that enable individuals to
buy and sell goods among themselves. Furthermore, some of the e-tailers provide content as
well. In the p/c group, iVillage is more of a pure content/community firm, delivering
information of interest to women, while Autoweb.com not only provides information for car
buyers and owners, but also serves to match potential buyers with car dealers. America Online,
in addition to serving as a portal, receives subscription revenues from customers.
While this diversity permits increased subsample sizes, it has the potential for
introducing noise into our regression results. In a second series of tests we included in our e-
tailer group only those firms whose business model entails, for the most part, buying goods and
services at wholesale and selling them at retail. This meant, for example, that we eliminated
eBay since they don’t sell their own goods, and Ticketmaster Online-City Search since they not
only sell tickets, but also provide free city guides through the City Search web site. We removed
from our p/c group those firms with a substantial amount of e-commerce or subscription
revenues, such as America Online and Student Advantage.
For the restricted e-tailer subsample we find bottom-line net income to be significantly
and negatively associated with stock prices, while gross margin has a positive and significant
association, as before. In contrast to our prior results, book value in general now has a
significant and negative association with stock prices. Furthermore, research and development
costs are now positively and significantly associated with prices, suggesting that investors
consider it to be an investment, rather than an expense. As before, unique visitors and
25
pageviews provide incremental explanatory power alongside net income. However, when
income is decomposed into its components, the significant explanatory power disappears. The
pure e-tailers, therefore, look very much like traditional retailers in the sense that the detailed
financial statement numbers have a strong association with stock prices, but measures of internet
traffic do not. The regression results for our restricted sample of p/c firms is, for the most part,
the same as previously found. One major difference is that research and development expenses
now exhibits a significant association with stock prices, as is true for the e-tailers. Overall, these
results suggest that the role played by financial and non-financial data in the valuation of e-
tailers depends on how e-tailers are defined; this is less true for the p/c firms.
4.3 ASSESSING THE IMPACT OF THE SHARE LOCK-UP PERIOD
As previously mentioned, most of our sample firms are quite young, as measured by time
from initial public offering. Consequently, several of our firm-quarter observations fall within
the insider share lock-up period. During this period insiders (such as managers, directors,
employees, and venture capitalists) are prohibited from selling their shares; as a result, the share
float is a small fraction (often 20 percent or less) of the total number of shares outstanding. To
the extent that a firm’s stock price is artificially inflated during the lock-up period due to a
restriction on the supply of shares, the relation between the financial and non-financial measures
and market value during this time might not be representative of that existing after lock-up ends.
To explore the impact of the lock-up period on our results, we run separate regressions
for the 70 firm-quarter observations (out of 179) falling within the first six months after the
initial public offering and for those falling outside of that period. We choose six months since it
26
is the normal lock-up period. For the most part we find the (untabulated) subsample results to
be similar to each other and to our full-sample results. In particular, gross profits and pageviews
remain positively and significantly associated with stock prices, while unique users provides
relatively little, if any, incremental explanatory power. Our subsample results differ from each
other only with respect to bottom-line net income and book value. For the firm-quarters that are
past the lock-up period, net income is negatively associated with stock prices, as for our sample
as a whole; however, the association is generally insignificant for the firm-quarters subject to the
lock-up restriction. Furthermore, alongside the components of net income, book value has a
negative association with stock prices for the firm-quarters beyond the lock-up period. In
contrast, it is positively associated with prices for the firm-quarters under the lock-up restriction.
5. SUMMARY AND CONCLUSIONS
In this paper we have examined the ways in which investors employ (relatively sparse)
financial information, along with measures of internet usage, in the valuation of internet firms.
Consistent with the claim by some that financial information is of little use in the valuation of
internet stocks, we cannot detect a significant positive association between net income and
market prices; in fact, we find a negative association. When net income is broken down into its
components, though, there is a positive and significant association between gross profits and
prices, as well as a large jump in the adjusted R2. These results are consistent with the
observation that internet firms’ bottom lines often include large transitory items, as well as items
that investors might consider to be investments rather than expenses. Gross profits, in contrast,
is usually considered to be more permanent in nature.

27
Both unique visitors and pageviews, when added as measures of internet usage to the
financial statement numbers in our regressions, in general provide significant incremental
explanatory power for stock prices, often increasing the adjusted R2 considerably. Pageviews,
though, provides more explanatory power for stock prices than does unique visitors for our
sample of firms. This implies that the number of pages viewed by each visitor gives important
information to investors. In addition, we find that the increase in R2 is smaller when either
unique visitors or pageviews is combined with the components of net income, than when it is
included alongside just bottom-line net income. This suggests that usage data captures some of
the same information as do the individual income statement line items (especially gross profits);
after the information content of these items is taken into account, the informational role of
internet usage appears to greatly diminish.
We further divide our sample into two groups, the e-tailers and the portal and
content/community firms (the p/c firms). For the e-tailers we find that bottom-line net income is
negatively associated with stock prices, as for our sample as a whole. However, there is a
positive and significant association for the p/c firms, just as is generally the case for non-internet
companies. With respect to the non-financial data, we find for the p/c firms that the incremental
explanatory power of pageviews and of unique users is approximately the same; in contrast,
pageviews has much greater incremental explanatory power for the e-tailers than does unique
visitors. Pages viewed per visitor, therefore, appears to be an especially important metric for the
e-tailers, as compared to the p/c firms.
There are many additional issues of interest that lie within this line of research. One
particularly promising area for future work is an examination of the effect which firm age has on

28
the manner in which investors use the available financial and non-financial information in the
valuation of internet firms. As internet companies mature, we would expect the financial
statement data to provide more information relative to the measures of internet usage. Given
that the vast majority of internet firms are still very young, though, it may take some time before
this issue can be successfully tackled.
29
REFERENCES
Amir, E. and B. Lev. “Value-relevance of Nonfinancial Information: The WirelessCommunications Industry.” Journal of Accounting and Economics 22 (1996): 3-30.
Chandra, U., A. Procassini, and G. Waymire. “The Information Content of NonfinancialDisclosures: Evidence from the Semiconductor Industry’s Book-to-Bill Ratio.” Working paper,Emory University (1997).
Deng, Z., B. Lev, and F. Narin. “Science and Technology as Predictors of Stock Performance.”Financial Analysts Journal 55 (1999): 20-32.
Easton, P. and T. Harris. “Earnings as an Explanatory Variable for Returns.” Journal ofAccounting Research 29 (1991): 19-36.
Hand, J. “Profits, Losses, and the Pricing of Internet Stocks.” Working Paper, Kenan-FlaglerBusiness School, UNC Chapel Hill (1999).
Hayn, C. “The Information Content of Losses.” Journal of Accounting and Economics 20(1995): 125-153.
Ittner, C. and D. Larcker. “Are Nonfinancial Measures Leading Indicators of FinancialPerformance? An Analysis of Customer Satisfaction.” Journal of Accounting Research 36(1998): 1-46.
Lev, B. and T. Sougiannis. “The Capitalization, Amortization, and Value-relevance of R&D.”Journal of Accounting and Economics 21 (1996): 107-138.
Ohlson, J. “Earnings, Book Values and Dividends in Security Valuation.” ContemporaryAccounting Research 11 (1995): 661-687.
Penman, S. “Combining Earnings and Book Value in Equity Valuation.” ContemporaryAccounting Research 15 (1998): 291-324.
White, H. “A Heteroskedasticity-consistent Covariance Matrix Estimator and a Direct Test forHeteroskedasticity.” Econometrica 48 (1980): 817-838.
Zhang, X. “Conservative Accounting and Equity Valuation.” Working Paper, Haas School ofBusiness, University of California, Berkeley (1999).
Appendix: The sample firms
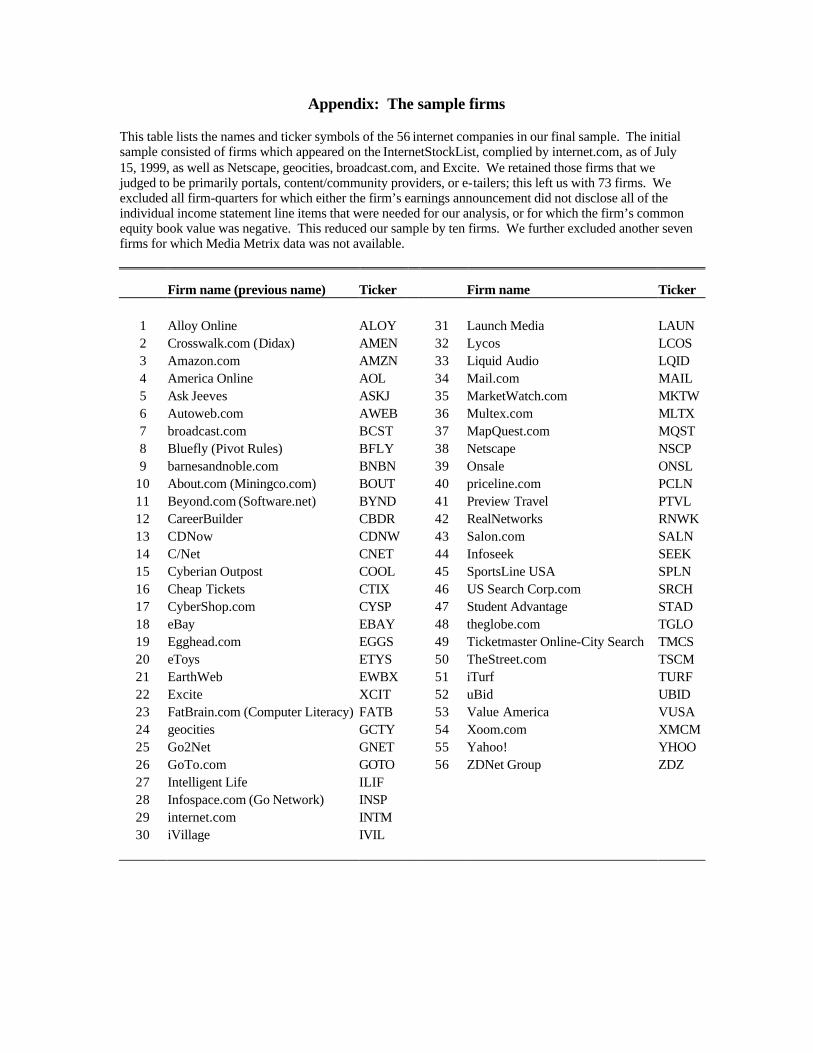
This table lists the names and ticker symbols of the 56 internet companies in our final sample. The initialsample consisted of firms which appeared on the InternetStockList, complied by internet.com, as of July15, 1999, as well as Netscape, geocities, broadcast.com, and Excite. We retained those firms that wejudged to be primarily portals, content/community providers, or e-tailers; this left us with 73 firms. Weexcluded all firm-quarters for which either the firm’s earnings announcement did not disclose all of theindividual income statement line items that were needed for our analysis, or for which the firm’s commonequity book value was negative. This reduced our sample by ten firms. We further excluded another sevenfirms for which Media Metrix data was not available.
Firm name (previous name) Ticker Firm name Ticker
1 Alloy Online ALOY 31 Launch Media LAUN2 Crosswalk.com (Didax) AMEN 32 Lycos LCOS3 Amazon.com AMZN 33 Liquid Audio LQID4 America Online AOL 34 Mail.com MAIL5 Ask Jeeves ASKJ 35 MarketWatch.com MKTW6 Autoweb.com AWEB 36 Multex.com MLTX7 broadcast.com BCST 37 MapQuest.com MQST8 Bluefly (Pivot Rules) BFLY 38 Netscape NSCP9 barnesandnoble.com BNBN 39 Onsale ONSL
10 About.com (Miningco.com) BOUT 40 priceline.com PCLN11 Beyond.com (Software.net) BYND 41 Preview Travel PTVL12 CareerBuilder CBDR 42 RealNetworks RNWK13 CDNow CDNW 43 Salon.com SALN14 C/Net CNET 44 Infoseek SEEK15 Cyberian Outpost COOL 45 SportsLine USA SPLN16 Cheap Tickets CTIX 46 US Search Corp.com SRCH17 CyberShop.com CYSP 47 Student Advantage STAD18 eBay EBAY 48 theglobe.com TGLO19 Egghead.com EGGS 49 Ticketmaster Online-City Search TMCS20 eToys ETYS 50 TheStreet.com TSCM21 EarthWeb EWBX 51 iTurf TURF22 Excite XCIT 52 uBid UBID23 FatBrain.com (Computer Literacy) FATB 53 Value America VUSA24 geocities GCTY 54 Xoom.com XMCM25 Go2Net GNET 55 Yahoo! YHOO26 GoTo.com GOTO 56 ZDNet Group ZDZ27 Intelligent Life ILIF28 Infospace.com (Go Network) INSP29 internet.com INTM30 iVillage IVIL
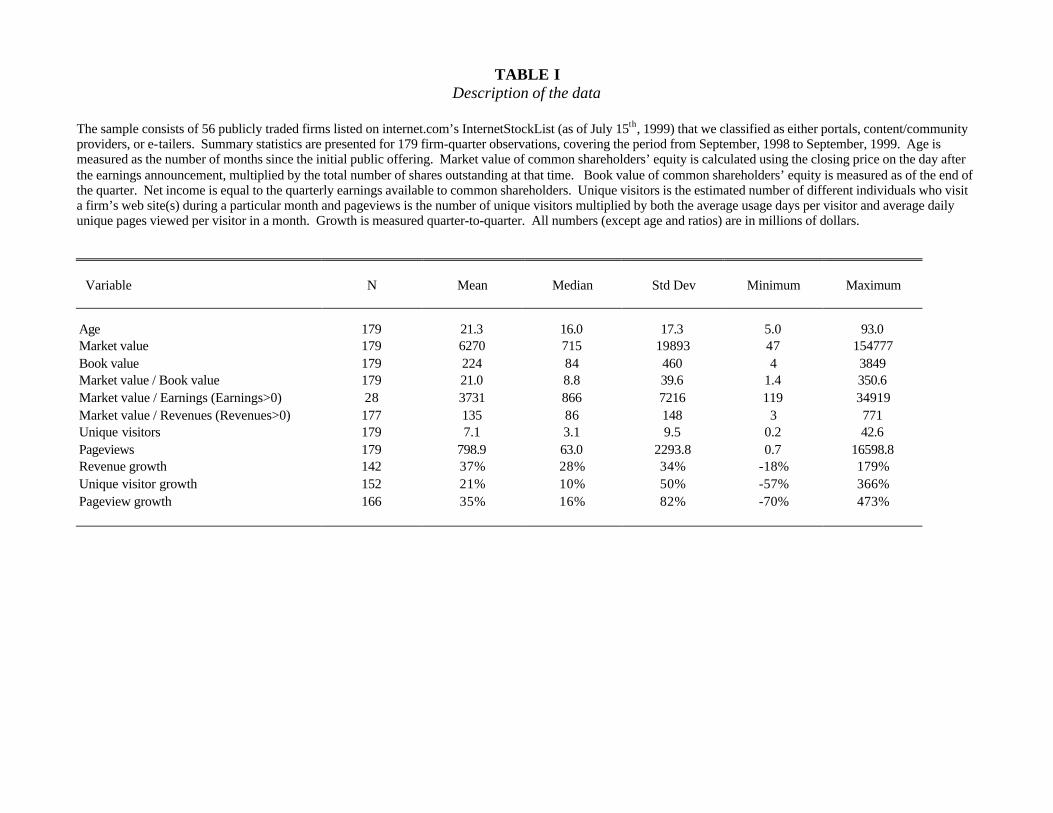
TABLE IDescription of the data
The sample consists of 56 publicly traded firms listed on internet.com’s InternetStockList (as of July 15th, 1999) that we classified as either portals, content/communityproviders, or e-tailers. Summary statistics are presented for 179 firm-quarter observations, covering the period from September, 1998 to September, 1999. Age ismeasured as the number of months since the initial public offering. Market value of common shareholders’ equity is calculated using the closing price on the day afterthe earnings announcement, multiplied by the total number of shares outstanding at that time. Book value of common shareholders’ equity is measured as of the end ofthe quarter. Net income is equal to the quarterly earnings available to common shareholders. Unique visitors is the estimated number of different individuals who visita firm’s web site(s) during a particular month and pageviews is the number of unique visitors multiplied by both the average usage days per visitor and average dailyunique pages viewed per visitor in a month. Growth is measured quarter-to-quarter. All numbers (except age and ratios) are in millions of dollars.
Variable N Mean Median Std Dev Minimum Maximum
Age 179 21.3 16.0 17.3 5.0 93.0Market value 179 6270 715 19893 47 154777Book value 179 224 84 460 4 3849Market value / Book value 179 21.0 8.8 39.6 1.4 350.6Market value / Earnings (Earnings>0) 28 3731 866 7216 119 34919Market value / Revenues (Revenues>0) 177 135 86 148 3 771Unique visitors 179 7.1 3.1 9.5 0.2 42.6Pageviews 179 798.9 63.0 2293.8 0.7 16598.8Revenue growth 142 37% 28% 34% -18% 179%Unique visitor growth 152 21% 10% 50% -57% 366%Pageview growth 166 35% 16% 82% -70% 473%
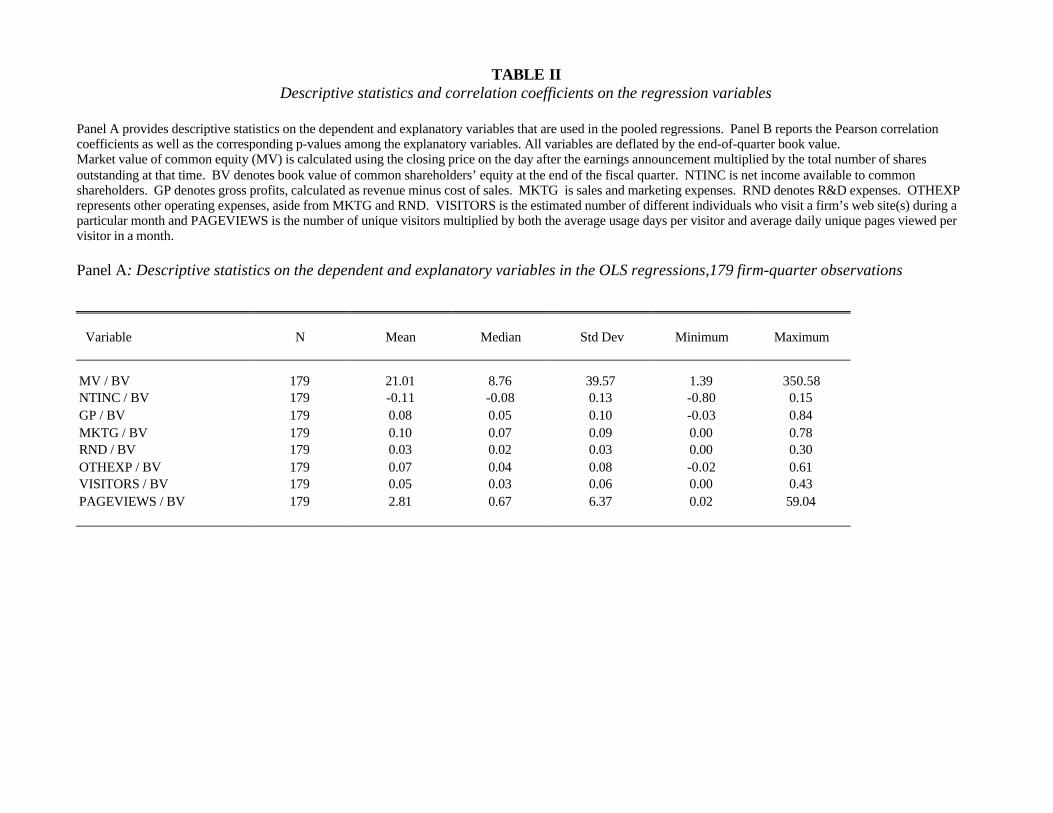
TABLE IIDescriptive statistics and correlation coefficients on the regression variables
Panel A provides descriptive statistics on the dependent and explanatory variables that are used in the pooled regressions. Panel B reports the Pearson correlationcoefficients as well as the corresponding p-values among the explanatory variables. All variables are deflated by the end-of-quarter book value.Market value of common equity (MV) is calculated using the closing price on the day after the earnings announcement multiplied by the total number of sharesoutstanding at that time. BV denotes book value of common shareholders’ equity at the end of the fiscal quarter. NTINC is net income available to commonshareholders. GP denotes gross profits, calculated as revenue minus cost of sales. MKTG is sales and marketing expenses. RND denotes R&D expenses. OTHEXPrepresents other operating expenses, aside from MKTG and RND. VISITORS is the estimated number of different individuals who visit a firm’s web site(s) during aparticular month and PAGEVIEWS is the number of unique visitors multiplied by both the average usage days per visitor and average daily unique pages viewed pervisitor in a month.
Panel A: Descriptive statistics on the dependent and explanatory variables in the OLS regressions,179 firm-quarter observations
Variable N Mean Median Std Dev Minimum Maximum
MV / BV 179 21.01 8.76 39.57 1.39 350.58NTINC / BV 179 -0.11 -0.08 0.13 -0.80 0.15GP / BV 179 0.08 0.05 0.10 -0.03 0.84MKTG / BV 179 0.10 0.07 0.09 0.00 0.78RND / BV 179 0.03 0.02 0.03 0.00 0.30OTHEXP / BV 179 0.07 0.04 0.08 -0.02 0.61VISITORS / BV 179 0.05 0.03 0.06 0.00 0.43PAGEVIEWS / BV 179 2.81 0.67 6.37 0.02 59.04
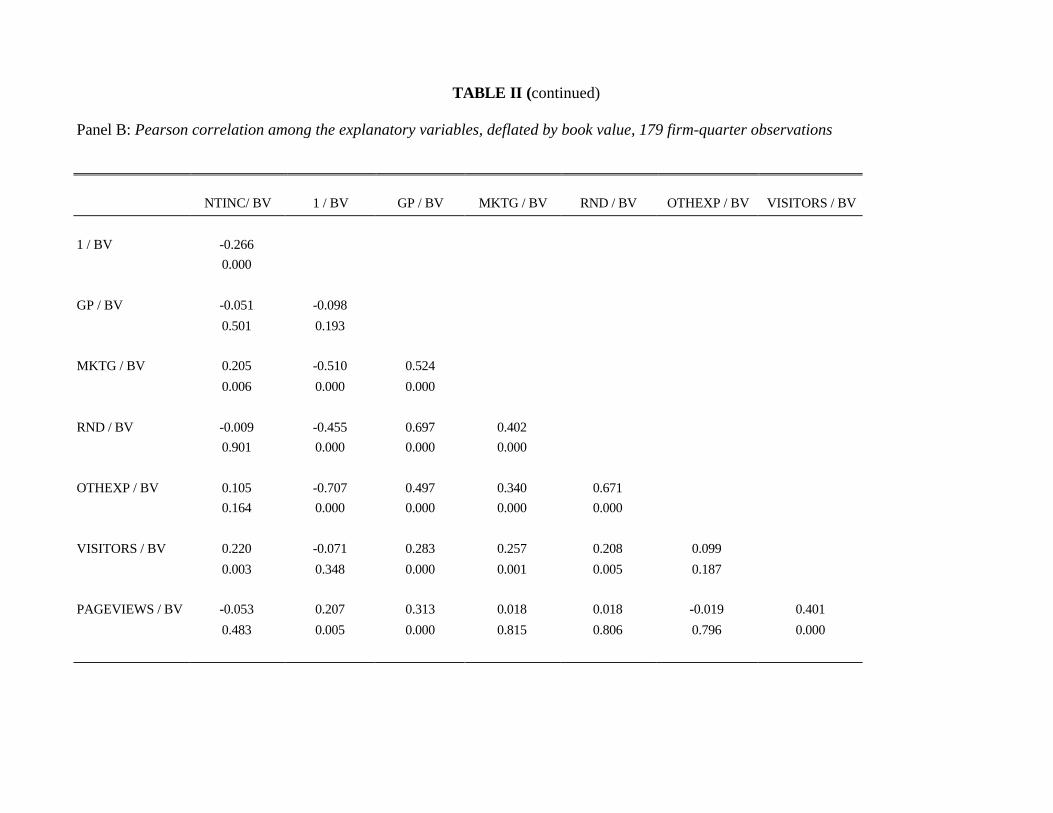
TABLE II (continued)
Panel B: Pearson correlation among the explanatory variables, deflated by book value, 179 firm-quarter observations
NTINC/ BV 1 / BV GP / BV MKTG / BV RND / BV OTHEXP / BV VISITORS / BV
1 / BV -0.2660.000
GP / BV -0.051 -0.098
0.501 0.193
MKTG / BV 0.205 -0.510 0.524
0.006 0.000 0.000
RND / BV -0.009 -0.455 0.697 0.4020.901 0.000 0.000 0.000
OTHEXP / BV 0.105 -0.707 0.497 0.340 0.6710.164 0.000 0.000 0.000 0.000
VISITORS / BV 0.220 -0.071 0.283 0.257 0.208 0.099
0.003 0.348 0.000 0.001 0.005 0.187
PAGEVIEWS / BV -0.053 0.207 0.313 0.018 0.018 -0.019 0.401
0.483 0.005 0.000 0.815 0.806 0.796 0.000
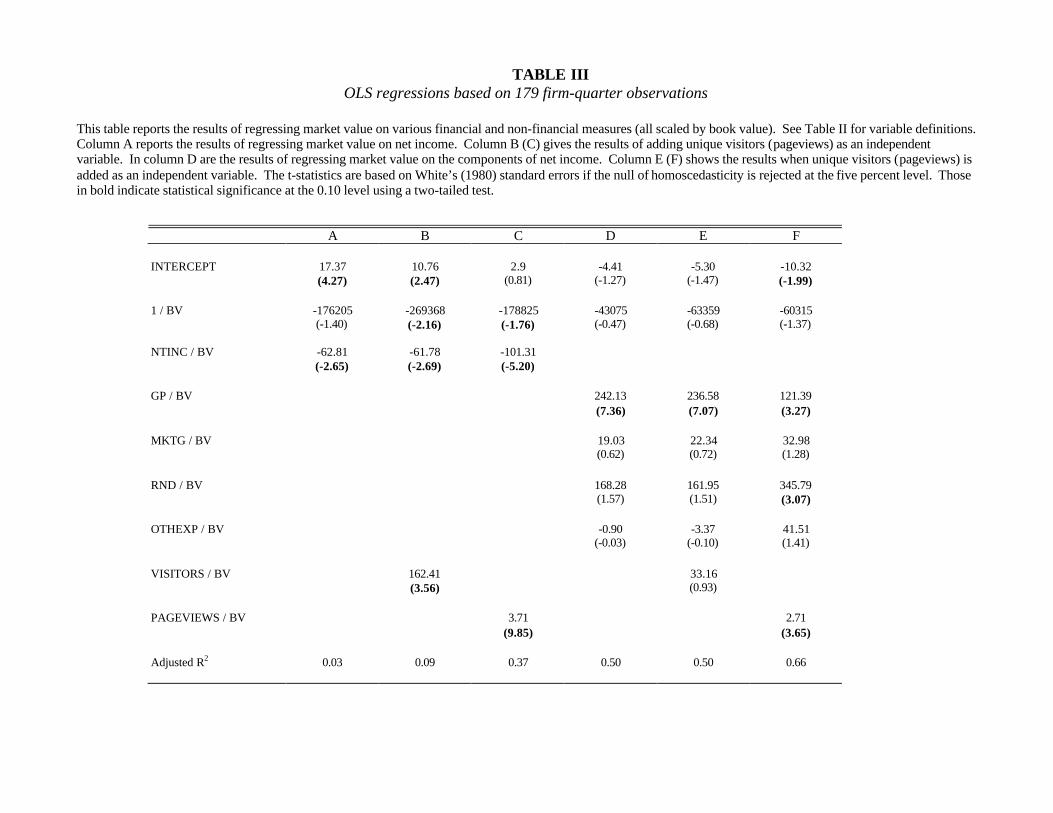
TABLE IIIOLS regressions based on 179 firm-quarter observations
This table reports the results of regressing market value on various financial and non-financial measures (all scaled by book value). See Table II for variable definitions.Column A reports the results of regressing market value on net income. Column B (C) gives the results of adding unique visitors (pageviews) as an independentvariable. In column D are the results of regressing market value on the components of net income. Column E (F) shows the results when unique visitors (pageviews) isadded as an independent variable. The t-statistics are based on White’s (1980) standard errors if the null of homoscedasticity is rejected at the five percent level. Thosein bold indicate statistical significance at the 0.10 level using a two-tailed test.
A B C D E F
INTERCEPT 17.37 10.76 2.9 -4.41 -5.30 -10.32(4.27) (2.47) (0.81) (-1.27) (-1.47) (-1.99)
1 / BV -176205 -269368 -178825 -43075 -63359 -60315(-1.40) (-2.16) (-1.76) (-0.47) (-0.68) (-1.37)
NTINC / BV -62.81 -61.78 -101.31(-2.65) (-2.69) (-5.20)
GP / BV 242.13 236.58 121.39(7.36) (7.07) (3.27)
MKTG / BV 19.03 22.34 32.98(0.62) (0.72) (1.28)
RND / BV 168.28 161.95 345.79(1.57) (1.51) (3.07)
OTHEXP / BV -0.90 -3.37 41.51(-0.03) (-0.10) (1.41)
VISITORS / BV 162.41 33.16(3.56) (0.93)
PAGEVIEWS / BV 3.71 2.71(9.85) (3.65)
Adjusted R2 0.03 0.09 0.37 0.50 0.50 0.66
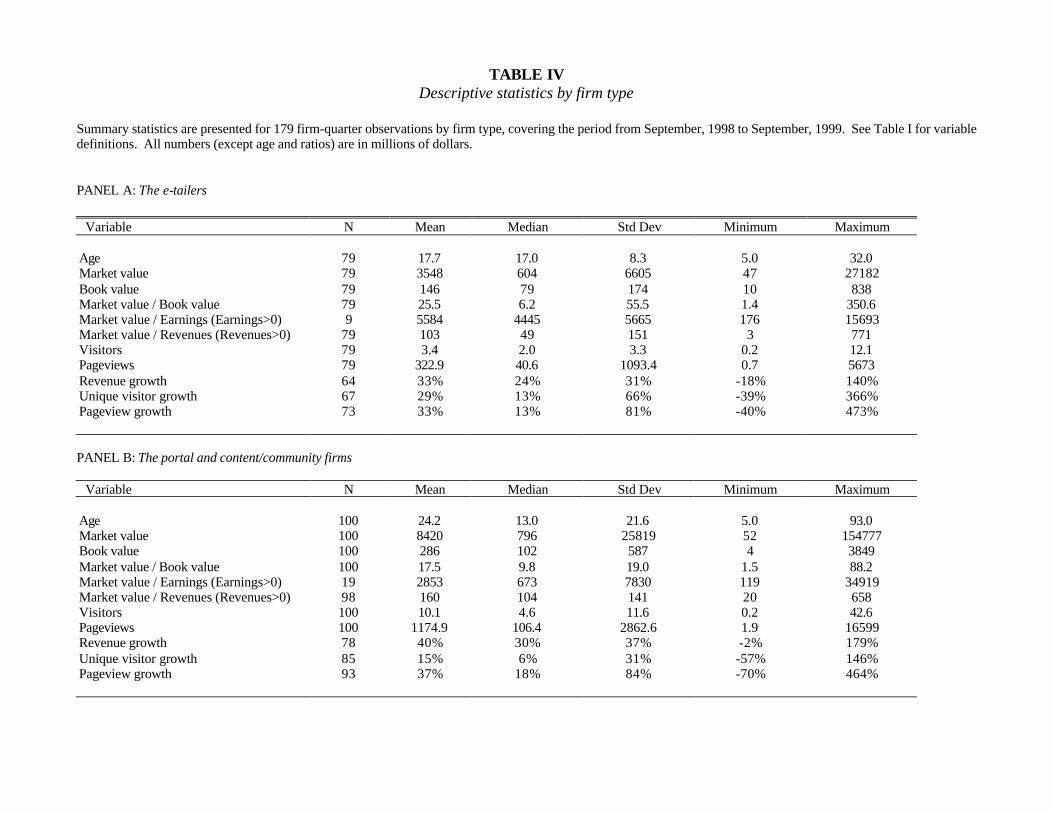
TABLE IVDescriptive statistics by firm type
Summary statistics are presented for 179 firm-quarter observations by firm type, covering the period from September, 1998 to September, 1999. See Table I for variabledefinitions. All numbers (except age and ratios) are in millions of dollars.
PANEL A: The e-tailers
Variable N Mean Median Std Dev Minimum Maximum
Age 79 17.7 17.0 8.3 5.0 32.0Market value 79 3548 604 6605 47 27182Book value 79 146 79 174 10 838Market value / Book value 79 25.5 6.2 55.5 1.4 350.6Market value / Earnings (Earnings>0) 9 5584 4445 5665 176 15693Market value / Revenues (Revenues>0) 79 103 49 151 3 771Visitors 79 3.4 2.0 3.3 0.2 12.1Pageviews 79 322.9 40.6 1093.4 0.7 5673Revenue growth 64 33% 24% 31% -18% 140%Unique visitor growth 67 29% 13% 66% -39% 366%Pageview growth 73 33% 13% 81% -40% 473%
PANEL B: The portal and content/community firms
Variable N Mean Median Std Dev Minimum Maximum
Age 100 24.2 13.0 21.6 5.0 93.0Market value 100 8420 796 25819 52 154777Book value 100 286 102 587 4 3849Market value / Book value 100 17.5 9.8 19.0 1.5 88.2Market value / Earnings (Earnings>0) 19 2853 673 7830 119 34919Market value / Revenues (Revenues>0) 98 160 104 141 20 658Visitors 100 10.1 4.6 11.6 0.2 42.6Pageviews 100 1174.9 106.4 2862.6 1.9 16599Revenue growth 78 40% 30% 37% -2% 179%Unique visitor growth 85 15% 6% 31% -57% 146%Pageview growth 93 37% 18% 84% -70% 464%
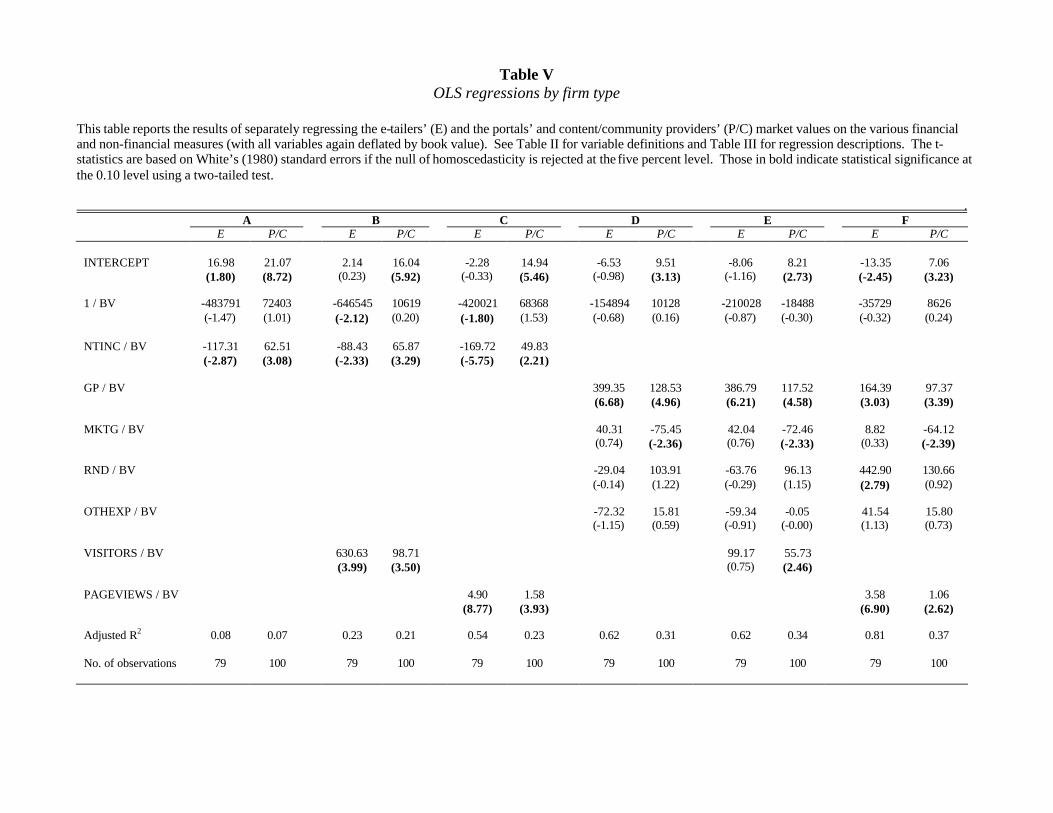
Table VOLS regressions by firm type
This table reports the results of separately regressing the e-tailers’ (E) and the portals’ and content/community providers’ (P/C) market values on the various financialand non-financial measures (with all variables again deflated by book value). See Table II for variable definitions and Table III for regression descriptions. The t-statistics are based on White’s (1980) standard errors if the null of homoscedasticity is rejected at the five percent level. Those in bold indicate statistical significance atthe 0.10 level using a two-tailed test.
.A B C D E F
E P/C E P/C E P/C E P/C E P/C E P/C
INTERCEPT 16.98 21.07 2.14 16.04 -2.28 14.94 -6.53 9.51 -8.06 8.21 -13.35 7.06(1.80) (8.72) (0.23) (5.92) (-0.33) (5.46) (-0.98) (3.13) (-1.16) (2.73) (-2.45) (3.23)
1 / BV -483791 72403 -646545 10619 -420021 68368 -154894 10128 -210028 -18488 -35729 8626(-1.47) (1.01) (-2.12) (0.20) (-1.80) (1.53) (-0.68) (0.16) (-0.87) (-0.30) (-0.32) (0.24)
NTINC / BV -117.31 62.51 -88.43 65.87 -169.72 49.83(-2.87) (3.08) (-2.33) (3.29) (-5.75) (2.21)
GP / BV 399.35 128.53 386.79 117.52 164.39 97.37(6.68) (4.96) (6.21) (4.58) (3.03) (3.39)
MKTG / BV 40.31 -75.45 42.04 -72.46 8.82 -64.12(0.74) (-2.36) (0.76) (-2.33) (0.33) (-2.39)
RND / BV -29.04 103.91 -63.76 96.13 442.90 130.66(-0.14) (1.22) (-0.29) (1.15) (2.79) (0.92)
OTHEXP / BV -72.32 15.81 -59.34 -0.05 41.54 15.80(-1.15) (0.59) (-0.91) (-0.00) (1.13) (0.73)
VISITORS / BV 630.63 98.71 99.17 55.73(3.99) (3.50) (0.75) (2.46)
PAGEVIEWS / BV 4.90 1.58 3.58 1.06(8.77) (3.93) (6.90) (2.62)
Adjusted R2 0.08 0.07 0.23 0.21 0.54 0.23 0.62 0.31 0.62 0.34 0.81 0.37
No. of observations 79 100 79 100 79 100 79 100 79 100 79 100