the external quality assurance system of the who global
TRANSCRIPT
The External Quality Assurance System of the WHO Global Foodborne Infections Network, 2017

2
THE EXTERNAL QUALITY ASSURANCE SYSTEM OF THE WHO
GLOBAL FOODBORNE INFECTIONS NETWORK
YEAR 2017
Susanne Karlsmose Pedersen, Jens-Ole Frimann, Frank M. Aarestrup, Rene S. Hendriksen
1. edition, January 2019
Copyright: National Food Institute, Technical University of Denmark
Photo: Mikkel Adsbøl
ISBN: 978-87-93565-38-8
The report is available at
www.food.dtu.dk
National Food Institute
Technical University of Denmark
Kemitorvet
Building 204
DK-2800 Kgs. Lyngby
Denmark
Tel: +45 35 88 70 00
Fax +45 35 88 70 01
3
List of Abbreviations
AGISAR, WHO Advisory Group on Integrated Surveillance of Antimicrobial Resistance
AMR, Antimicrobial Resistance
AST, Antimicrobial Susceptibility Testing
ATCC, American Type Culture Collection
CAZ, Ceftazidime
CDC, Centers for Disease Control and Prevention
COL, Colistin
CRO, Ceftriaxone
CTX, Cefotaxime
DTU Food, Technical University of Denmark, National Food Institute
EQAS, External Quality Assurance System
ESBL, Extended Spectrum Beta-Lactamase
GMI, Global Microbial Identifier
IP, Institute Pasteur
MERO, Meropenem
MIC, Minimum Inhibitory Concentration
SMX, Sulfamethoxazole
SXT, Sulfamethoxazole-trimethoprim (co-trimoxazole)
WHO, World Health Organization
WHO GFN, WHO Global Foodborne Infections Network

4
1. Introduction Since 2000, 16 WHO External Quality Assurance System (EQAS) reports have been issued with this report being the 17th. The WHO Global Foodborne Infections Network (WHO GFN) and the WHO Advisory Group on Integrated Surveillance of Antimicrobial Resistance (AGISAR) focus on enhancing World Health Organization (WHO) Member States’ capacity to detect and respond to foodborne disease outbreaks and the emerging of antimicrobial resistance (AMR) in bacterial pathogens by conducting laboratory-based surveillance of Salmonella and other important foodborne pathogens. Thus, the WHO EQAS 2017 aligns with the 2015 WHO global action plan to target AMR worldwide, objective 2: Strengthen knowledge through surveillance and research, action 2, laboratory capacity.
Since its inception, the scope of the WHO EQAS has expanded to include additional foodborne pathogens than Salmonella such as Shigella and Campylobacter. Salmonella, Campylobacter and Shigella are among the most important foodborne pathogens worldwide and accounts for millions of cases of diarrheal disease and thousands of deaths per year impacting both developing and industrialized countries. Furthermore, the increased number of Salmonella, Campylobacter and Shigella isolates which are resistant to antimicrobials is of major concern since these bacterial isolates are associated with infections characterized by increased morbidity and mortality.
In the 2017 iteration of the WHO EQAS, a major change was applied as it focuses only on Salmonella serotyping and antimicrobial susceptibility testing (AST). This adjustment was made to balance the costs and focus efforts at continuing the development of the genomic proficiency test adopted by WHO and offered through the Global Microbial Identifier (GMI) (http://www.globalmicrobialidentifier.org/workgroups/about-the-gmi-proficiency-tests).
The WHO EQAS is organized annually by DTU Food in collaboration with World Health Organization (WHO) in Geneva, Switzerland, Centers for Disease Control and Prevention (CDC) in Atlanta, USA, and Institute Pasteur (IP) in Paris, France.
Individual laboratory data are confidential and known only by the participating laboratory, the EQAS Organizer (DTU Food) and possibly the respective WHO GFN regional centre/WHO AGISAR country representative. All summary conclusions are public. The goal set by WHO GFN/AGISAR aims at having all national reference laboratories perform Salmonella serotyping with a maximum of one deviation out of eight strains tested (error rate of 13%) and performing AST of Salmonella with a maximum error rate of 10% (either less than 5% very major / major errors and less than 5% minor errors, or less than 10% minor errors). Minor deviations are defined as classification of an intermediate strain as susceptible, resistant or vice versa (i.e. I ↔ S or I ↔R). Major deviation is the classification of a susceptible strain as resistant (i.e. S → R). Very major deviation is the classification of a resistant strain as susceptible (i.e. R → S). In this report, the deviations of AST results are divided into two categories, i.e. critical deviations which include major and very major deviations, and total deviations which include also the minor deviations. In EQAS 2014, the regions were re-defined for all countries worldwide in relation to the analysis of data from the WHO GFN EQAS. This resulted in some reorganization of countries into new regions compared to previous years, why interpretation of regional-based results from 2014 and onwards

5
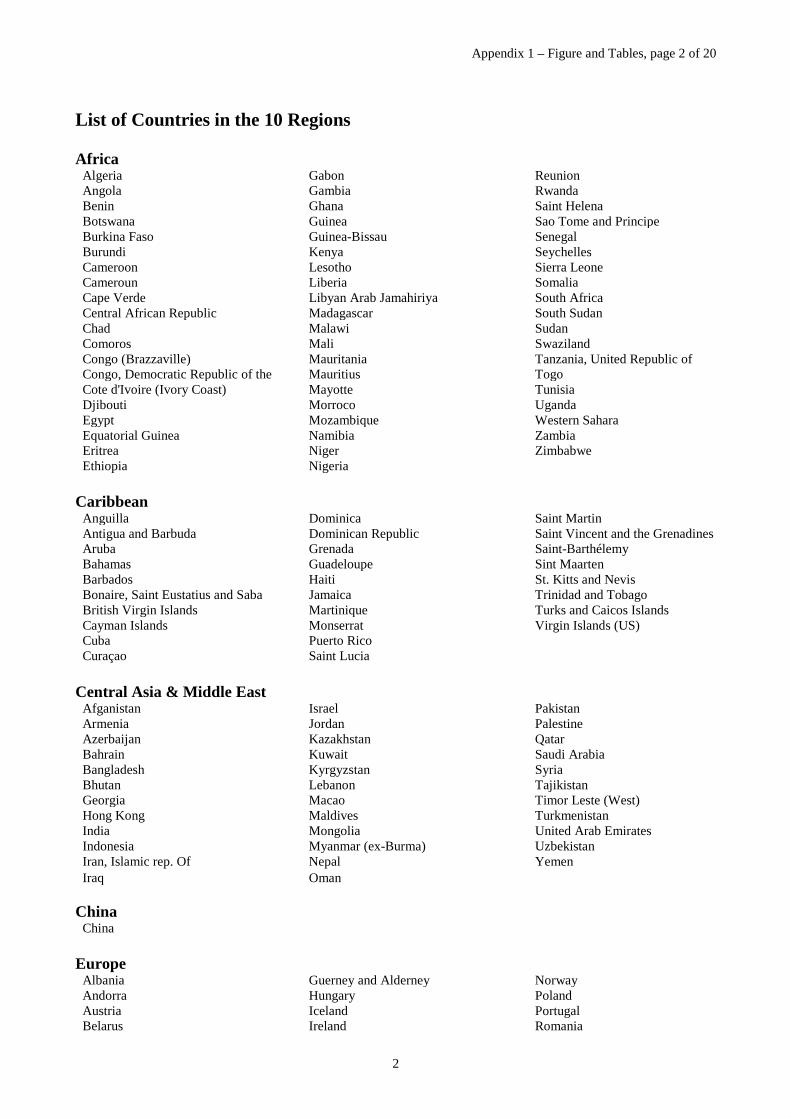
with results from before 2014 should be conducted with care. The countries belonging to each region is listed in Appendix 1.
Appendices 2-5 present additional background information in relation to the WHO EQAS 2017.
2. Summary The summary report is divided into sections; the serotyping component, AMR as well as reporting resistance to Extended Spectrum Beta-Lactamases (ESBL) producing Salmonella. All results reported in the summary can be found in Appendix 1.
Participation
A total of 191 laboratories responded to the pre-notification and were enrolled in the WHO EQAS. When the deadline for submitting results was reached, 181 laboratories in 81 countries had uploaded data.
The following countries provided data for at least one of the EQAS components (Appendix 1): Argentina, Australia (3), Bahrain, Bangladesh, Barbados, Belgium, Belize, Bolivia, Brazil (2), Brunei Darussalam, Bulgaria, Cambodia, Cameroon, Canada (11), Chile, China (15), Colombia (4), Costa Rica (2), Croatia, Cuba, Curaçao, Cyprus, Czech Republic (2), Denmark, Ecuador, Egypt, Gambia, Germany (2), Ghana, Greece (2), Guatemala (2), Honduras, India (4), Iran, Islamic rep. of (3), Ireland, Israel, Italy (14), Jamaica, Japan (2), Kenya (2), Korea, Rep of (2), Kosovo, Lao PDR, Luxembourg (2), Madagascar, Malaysia (5), Malta, Mauritius, Mexico (3), Morocco, Nepal (6), New Zealand, Nigeria (4), Panama (2), Paraguay, Peru, Philippines (2), Poland (3), Portugal, Serbia (2), Singapore (2), Slovakia, Slovenia, South Africa, Spain, Sri Lanka (2), Suriname, Sweden, Taiwan, Tanzania, United Republic of, Thailand (16), Trinidad and Tobago, Turkey, Ukraine, United Kingdom, United States of America (5), Uruguay, Venezuela (2), Viet Nam (2), Zambia, and Zimbabwe.
The level of participation in the WHO EQAS 2017 was the same as at the WHO EQAS 2016.
Salmonella EQAS components
The acceptance threshold for the EQAS Salmonella serotyping component was met by 77% (n = 111) of the 145 participating laboratories (Table 1). In addition, 88% (n = 127) of the laboratories tested all eight strains with a total of 90% (n = 1.014) of all tests being correct, representing results almost at the same level as in 2016 which was one of the best performances observed since the initiation of the EQAS (Table 2). The ability to correctly serotype the internal control strain increased in 2017 to the same level as in 2014, 98%, which is the best performance, recorded and only observed previously in 2011 and 2014. The increase in performance observed compared to

6
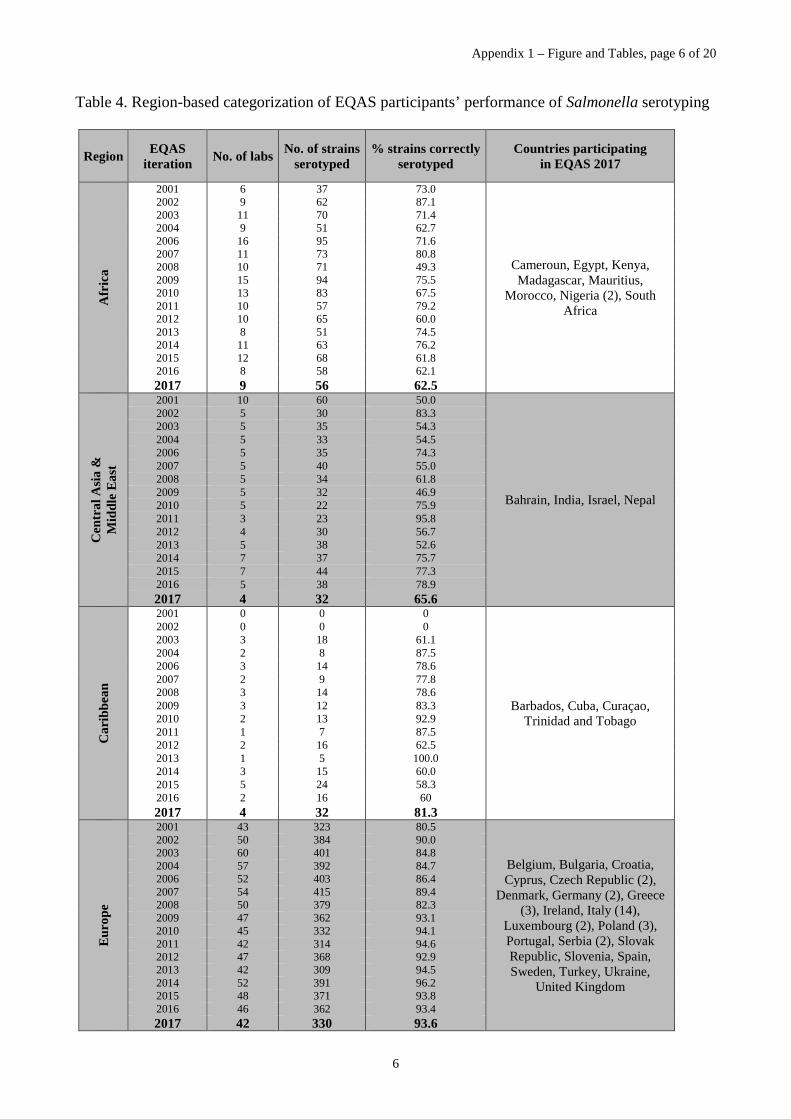
2016 was most likely due to a lower number of participating laboratories serotyping this specific strain. In 2017, the participation in testing the internal control strain decreased from 159 to 142, a level previously recorded over the years (Table 3). On a region-based categorization of participating laboratories, Africa and the Central Asia & Middle East both correctly serotyped between 63% and 66% of the test strains whereas the Caribbean, Southeast Asia, and Latin America, correctly serotyped between 81% and 89% of the test strains. The performance of correct serotyping in Europe, China, North America was between 94 and 99% but reached 100% correct serotyping of all eight strains in only Oceania. In 2017, Russia was again the only region not participating (Table 4). In all regions except for the Central Asia & Middle East region either a marked or consistent improvement was observed and in line with the other data presented.
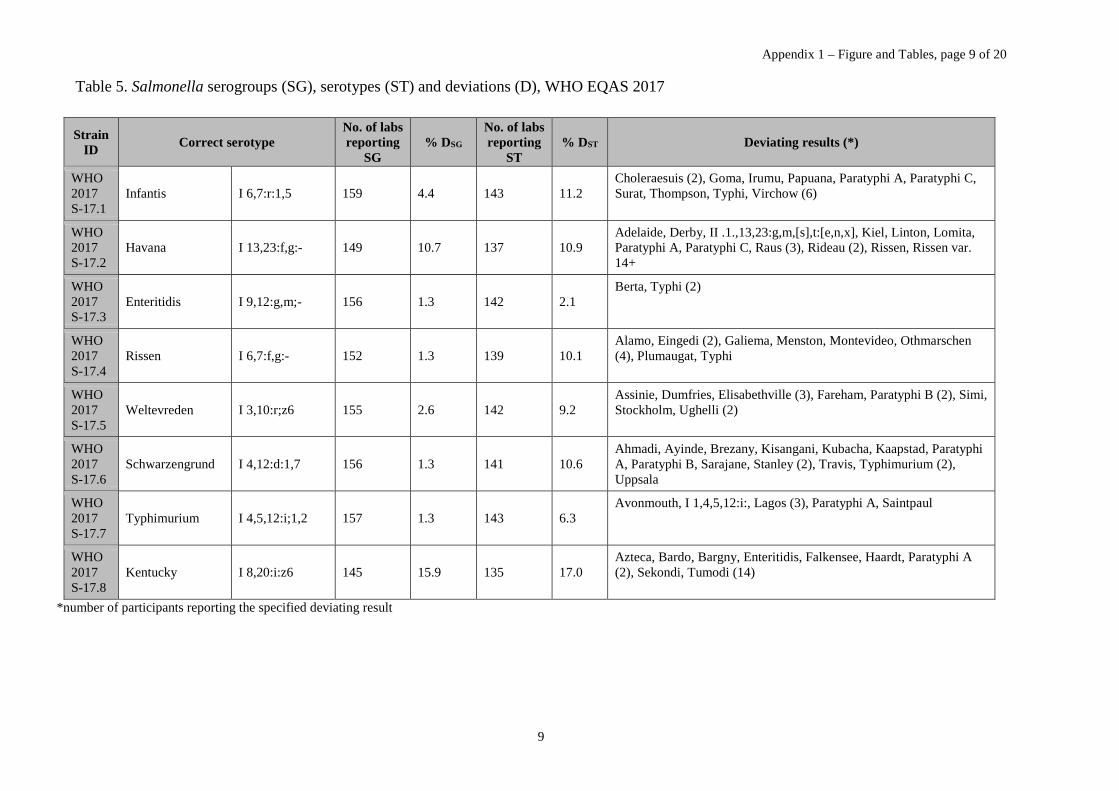
In 2017, the main problem regarding the Salmonella serotyping appeared relatively to be associated with strain, WHO 2017 S-17.8 (Kentucky) whereas the deviations for the rest of the strains seems to be acceptable at a level of approximately 10% (n=5) and for the remaining two strains at 6% and 2%.
As indicated, WHO 2017 S-17.8 (Kentucky, I 8,20:i:z6), revealed a considerable level of deviation at 17.0% (Table 5). Of the 23 deviations, 14 were attributed to Tumodi (I 1,4,12:i:z6) which only differs from the somatic O antigen compared to Kentucky. It is surprising that the problem of the serotyping procedure seems very often to be associated with the somatic O antigen of relatively common antigens. The level of deviation is surprising since the serovars included the 2017 should not pose major difficulties. The somatic O antigens of all the test strains belong to the major serogroups such as O:4, O:3,10, O:7, O:8, and O:9, and the flagella antigens belong to well-known polyvalent antisera complex G and HMD.
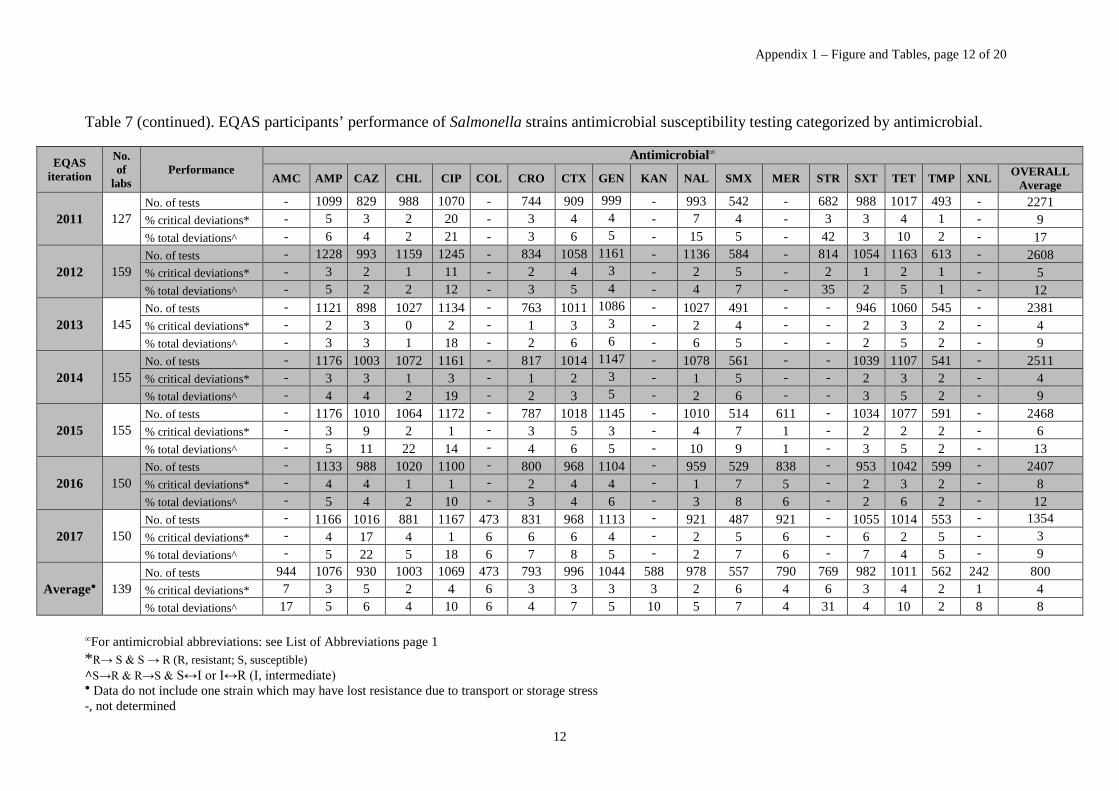
Concerning the Salmonella AST component for the EQAS 2017, the performance slightly decreased compared to the EQAS of 2016, with deviations of 3% minor, 2% major, and 3% very major deviations. Thus, the percentages of critical deviation was 5% (Table 6). Deviations categorized by the tested antimicrobials revealed that ceftazidime (CAZ), ciprofloxacin (CIP), colistin (COL), ceftriaxone (CRO), cefotaxime (CTX), meropenem (MERO), sulfamethoxazole (SMX) and co-trimoxazole (SXT) caused most of the difficulties observed with the following level of total deviations: 22%, 18%, 6%, 7%, 8%, 6%, 7%, and 7%, respectively (Table 7). The deviations to CIP was mostly attributed to minor deviations and most likely due to the often observed hazy double zone when performing disk diffusion where the outer zone often incorrectly is measured. In this year’s iteration, participating laboratories appears to have been too strict measuring the zone diameter categorizing the susceptible strains intermediate. Similarly, the deviations observed to SMX and SXT are due to the bacteriostatic effect complicating reading when conducting both disk diffusion and minimum inhibitory concentration (MIC) determination where 20% of the lawn of growth for disk diffusion equal to 80% reduction of growth for MIC determination determines the read-value. This year, a resistant isolate caused most problems. For the disk diffusion results, it was not surprising to see deviations in relation to COL as disk diffusion is not recommended as a method for AST to colistin. This resulted in 10 participants incorrectly reporting one isolate susceptible despite it being resistant. For the four antimicrobials used to confirm ESBL and carbapenemase production, CAZ, CRO, CTX and MERO, all were responsible
7
for critical deviations with 17% of all tests incorrect for CAZ, which is a great concern (Table 7, Table 8). Assessing the data for the four antimicrobials, no clear patterns was observed, resistance reported as susceptible and visa versa (Table 8).
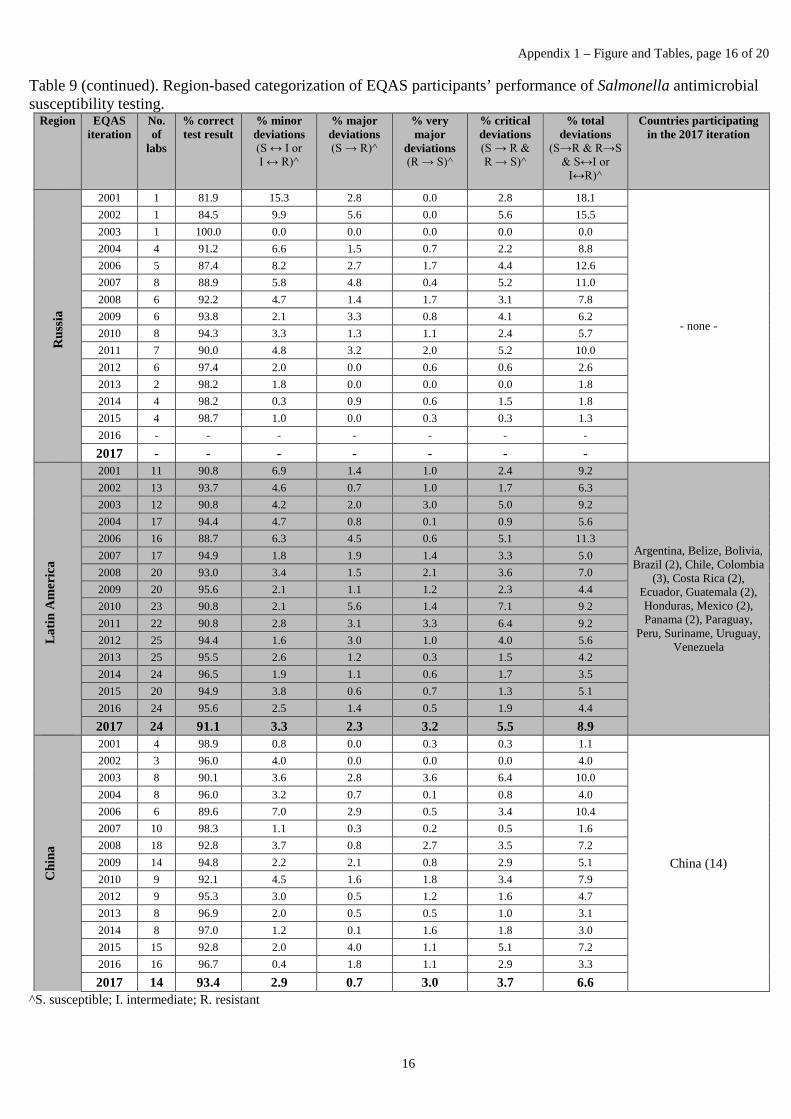
On a region-based categorization of participating laboratories, all regions performed poorly compared to 2016. A greater number of deviations was observed in developing regions, which partly could explain the results as well as the difficulties reporting the results for the third generation cephalosporins. The Caribbean region obtained the highest percentages of total deviations, 24.3% whereas a number of regions obtained a total deviations around 10%, i.e. Africa (12.8%), China (6.6%), Southeast Asia (8.1%), Latin America (8.9%), Europe (7.2%), and Central Asia & Middle East (11.1%). None of the regions obtained a performance of 100% correct AST results, however, North America and Oceania performed better than the other regions with 97.1% and 96.1% correct AST-results. Russia did not participate in the 2017 EQAS (Table 9).
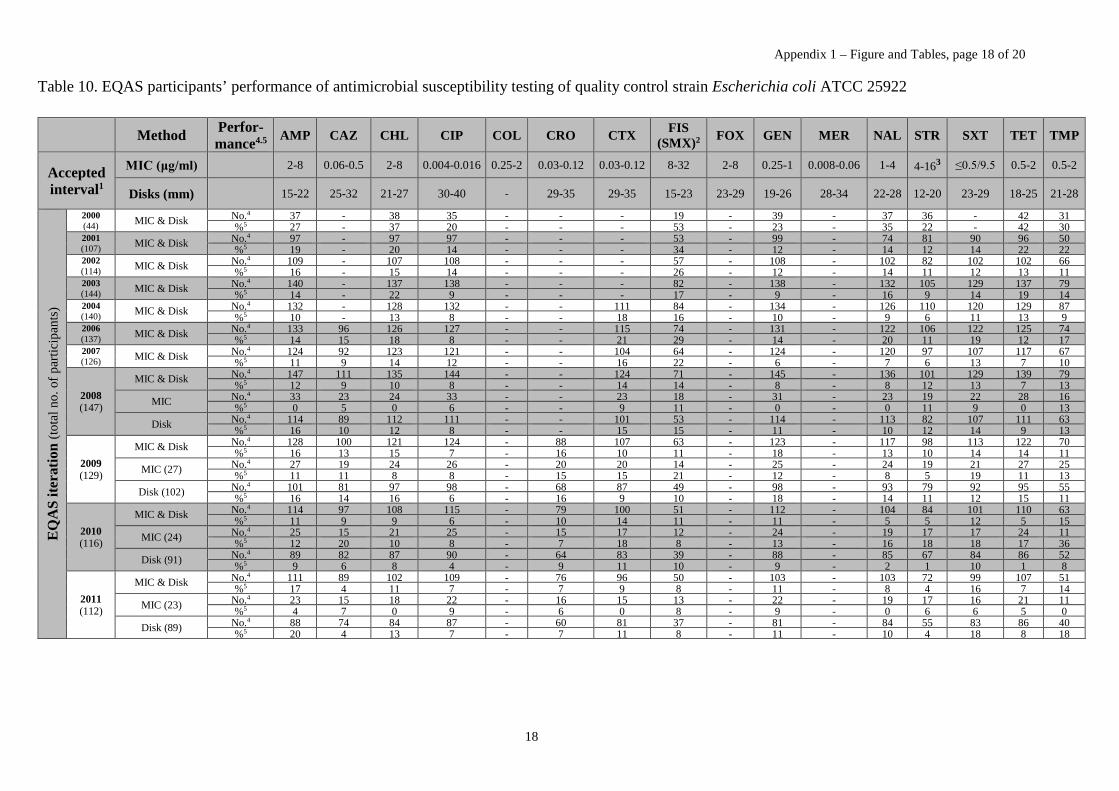
For the 150 laboratories performing the Salmonella AST component (MIC (n = 41)/Disk diffusion (n = 74)), only 77% (115 laboratories) reported data for AST of the control strain E. coli ATCC 25922. As in previous years, this is a very alerting number as it is expected that all participating laboratories follow quality assurance procedures (Table 10). It is of extreme importance to once again emphasize that this component represents the true indicator for the laboratory as to the performance of AST. It is noteworthy that the WHO EQAS organizers provide the control strain E. coli ATCC 25922 free of charge to all new participants of the AST component, why there should not be any excuses not to test this strain.
ESBL EQAS component
The participants of the AST component are offered to detect and confirm ESBL production in the Salmonella strains. If participating in this component of the EQAS, all strains showing reduced susceptibility to cefotaxime (CTX), cefoxitin (FOX), ceftazidime (CAZ) ceftriaxone (CRO) and/or meropenem (MERO) should be tested for ESBL, AmpC and carbapenemase production.
For the EQAS 2017, four AmpC-, ESBL-, carbapenemase-producers were included represented by WHO 2017 S-17.1 Infantis (ESBL), WHO 2017 S-17.2 Havana (AmpC), WHO 2017 S-17.4 Rissen (ESBL), and WHO 2017 S-17.8 Kentucky (carbapenemase producers) (Table 11). The two ESBL producing strains harboured the blaCTX-M14b, and blaCTX-M14 genes whereas the gene accounting for the AmpC phenotype till now curiously is unknown. The carbapenemase producer was conferred by blaNDM-1 and blaCMY-16. The confirmatory tests (CAZ/Cl:CAZ and CTX/Cl:CTX) showed 87% (WHO 2017 S-17.1) and 90% (WHO 2017 S-17.4) of deviations in reporting correct ESBL results (based on phenotypic characteristics). For the WHO 2017 S-17.2 (AmpC) and WHO 2017 S-17.4 (carba), deviations of the confirmatory test resulted in 66% and 34%. In general, the level of correctly identified ESBL, AmpC and carbapenemase producing Salmonella is a great concern and it is suggested that the participating laboratories take steps to ensure that it is improved.
___ ___ ___
8
3. List of Appendices Appendix 1: Figures and Tables
Appendix 2: Prenotification
Appendix 3: Expected results
Appendix 4: WHO EQAS 2017 Protocol
Appendix 5a: Subculture and Maintenance of Quality Control Strains
Appendix 5b: Instructions for Opening and Reviving Lyophilized Cultures

Appendix 1 – Figure and Tables, page 1 of 20
1
Figure and Tables Figure 1. Countries participating* in the WHO EQAS 2017
*marked in green
Appendix 1 – Figure and Tables, page 2 of 20
2
List of Countries in the 10 Regions Africa
Algeria Gabon Reunion Angola Gambia Rwanda Benin Ghana Saint Helena Botswana Guinea Sao Tome and Principe Burkina Faso Guinea-Bissau Senegal Burundi Kenya Seychelles Cameroon Lesotho Sierra Leone Cameroun Liberia Somalia Cape Verde Libyan Arab Jamahiriya South Africa Central African Republic Madagascar South Sudan Chad Malawi Sudan Comoros Mali Swaziland Congo (Brazzaville) Mauritania Tanzania, United Republic of Congo, Democratic Republic of the Mauritius Togo Cote d'Ivoire (Ivory Coast) Mayotte Tunisia Djibouti Morroco Uganda Egypt Mozambique Western Sahara Equatorial Guinea Namibia Zambia Eritrea Niger Zimbabwe Ethiopia Nigeria
Caribbean
Anguilla Dominica Saint Martin Antigua and Barbuda Dominican Republic Saint Vincent and the Grenadines Aruba Grenada Saint-Barthélemy Bahamas Guadeloupe Sint Maarten Barbados Haiti St. Kitts and Nevis Bonaire, Saint Eustatius and Saba Jamaica Trinidad and Tobago British Virgin Islands Martinique Turks and Caicos Islands Cayman Islands Monserrat Virgin Islands (US) Cuba Puerto Rico Curaçao Saint Lucia
Central Asia & Middle East
Afganistan Israel Pakistan Armenia Jordan Palestine Azerbaijan Kazakhstan Qatar Bahrain Kuwait Saudi Arabia Bangladesh Kyrgyzstan Syria Bhutan Lebanon Tajikistan Georgia Macao Timor Leste (West) Hong Kong Maldives Turkmenistan India Mongolia United Arab Emirates Indonesia Myanmar (ex-Burma) Uzbekistan Iran, Islamic rep. Of Nepal Yemen Iraq Oman
China
China Europe
Albania Guerney and Alderney Norway Andorra Hungary Poland Austria Iceland Portugal Belarus Ireland Romania

Appendix 1 – Figure and Tables, page 3 of 20
3
Belgium Italy San Marino Bosnia Jersey Serbia Bulgaria Kosovo Slovak Republic Croatia Latvia Slovakia Cyprus Liechtenstein Slovenia Czech Republic Lithuania Spain Denmark Luxembourg Svalbard and Jan Mayen Islands Estonia Macedonia Sweden European Union Malta Switzerland Faroe Islands Man, Island of Turkey Finland Moldova Ukraine France Monaco United Kingdom Germany Montenegro Vatican City State (Holy See) Gibraltar Netherlands Greece
Latin America
Argentina El Salvador Nicaragua Bolivia Falkland Islands (Malvinas) Panama Brazil French Guiana Paraguay Chile Guatemala Peru Colombia Guyana Suriname Costa Rica Honduras Uruguay Ecuador Mexico Venezuela
North America
Bermuda Greenland United States of America Canada Saint Pierre and Miquelon
Oceania
Australia Papua New Guinea Guam Kiribati Tonga New Caledonia New Zealand French Polynesia Samoa, American Solomon, Islands Micronesia Vanuatu Fiji Samoa Marshall Islands Tuvalu
Russia
Russia Southeast Asia
Brunei Darussalam Lao PDR Taiwan Cambodia Malaysia Thailand Japan Philippines Viet Nam Korea, North Singapore Korea, Rep of Sri Lanka

Appendix 1 – Figure and Tables, page 4 of 20
4
Table 1. Ability of EQAS participating laboratories to serotype the test Salmonella strains
Number of strains correctly serotyped
Participating laboratories
EQAS 2000
EQAS 2001
EQAS 2002
EQAS 2003
EQAS 2004
EQAS 2006
EQAS 2007
No. % No. % No. % No. % No. % No. % No. % 8 9 24 34 35 52 53 66 47 41 32 42 32 66 47 7 9 24 13 14 19 19 29 21 14 11 35 27 29 21 6 4 11 9 9 12 12 13 9 16 13 19 15 13 9 5 3 8 9 9 4 4 11 8 16 13 12 9 11 8 4 3 8 4 4 1 1 7 5 11 9 7 5 7 5 3 4 11 8 8 4 4 6 4 10 8 5 4 6 4 2 2 5 3 3 5 5 2 1 10 8 3 2 2 1 1 2 5 5 5 1 1 6 4 5 4 4 3 6 4 0 1 3 11 11 1 1 0 0 4 3 3 2 0 0
In total 37 100 96 100 99 100 127 100 127 100 130 100 140 100
Participating laboratories
EQAS 2008
EQAS 2009
EQAS 2010
EQAS 2011
EQAS 2012
EQAS 2013
EQAS 2014
No. % No. % No. % No. % No. % No. % No. % 8 50 33 76 50 91 61 82 67 68 47 52 41 70 47 7 36 24 29 19 16 11 17 14 29 20 29 23 32 21 6 11 7 7 5 12 8 10 8 14 10 15 12 17 11 5 14 9 13 8 9 6 2 2 9 6 8 6 6 4 4 12 8 5 3 6 5 4 3 5 3 7 6 5 3 3 9 6 7 5 2 1 4 3 6 4 7 6 7 5 2 8 6 5 3 2 1 1 1 10 7 6 5 4 3 1 9 6 6 4 7 5 3 2 2 1 2 2 4 3 0 2 1 5 3 3 2 0 0 1 1 0 0 4 3
In total 151 100 153 100 148 100 123 100 144 100 126 100 149 100
Participating laboratories
EQAS 2015
EQAS 2016
EQAS 2017
Average EQAS 2000 - 2017
No. % No. % No. % No. % 8 65 43 84 58 85 59 61 46 7 25 17 22 15 26 18 24 19 6 17 11 18 12 14 10 13 10 5 22 15 5 3 7 5 9 7 4 5 3 5 3 5 3 6 5 3 2 1 5 3 3 2 6 5 2 4 3 3 2 0 0 4 3 1 7 5 4 3 4 3 5 4 0 4 3 0 0 1 1 2 2
In total 151 100 146 100 145 100 129 100

Appendix 1 – Figure and Tables, page 5 of 20
5
Table 2. EQAS participating laboratories’ performance of Salmonella serotyping
EQAS iteration
Labs serotyping all provided strains Correct test results
No. % No. % 2000 34 92 165 76 2001 79 82 513 72 2002 80 81 668 91 2003 69 54 692 80 2004 78 61 701 81 2006 105 81 808 85 2007 109 78 920 88 2008 100 66 888 83 2009 119 83 974 86 2010 129 87 998 89 2011 109 89 878 92 2012 122 81 936 83 2013 74 59 812 89 2014 85 57 969 92 2015 104 69 948 87 2016 130 89 1004 90 2017 127 88 1014 90 Average 101 76 817 86
Table 3. EQAS participating laboratories’ performance of internal quality control strain (WHO S-17.3, Salmonella Enteritidis) serotyping).
EQAS iteration
Labs serotyping S. Enteritidis correctly
No. % 2000 34 92 2001 64 84 2004 113 95 2006 116 94 2007 135 96 2008 139 96 2009 141 93 2010 138 97 2011 128 98 2012 139 96 2013 130 96 2014 145 98 2015 125 93 2016 159 89 2017 142 98
Average 123 94
Appendix 1 – Figure and Tables, page 6 of 20
6
Table 4. Region-based categorization of EQAS participants’ performance of Salmonella serotyping
Region EQAS iteration No. of labs No. of strains
serotyped % strains correctly
serotyped Countries participating
in EQAS 2017
Afr
ica
2001 6 37 73.0
Cameroun, Egypt, Kenya, Madagascar, Mauritius,
Morocco, Nigeria (2), South Africa
2002 9 62 87.1 2003 11 70 71.4 2004 9 51 62.7 2006 16 95 71.6 2007 11 73 80.8 2008 10 71 49.3 2009 15 94 75.5 2010 13 83 67.5 2011 10 57 79.2 2012 10 65 60.0 2013 8 51 74.5 2014 11 63 76.2 2015 12 68 61.8 2016 8 58 62.1 2017 9 56 62.5
Cen
tral
Asi
a &
M
iddl
e E
ast
2001 10 60 50.0
Bahrain, India, Israel, Nepal
2002 5 30 83.3 2003 5 35 54.3 2004 5 33 54.5 2006 5 35 74.3 2007 5 40 55.0 2008 5 34 61.8 2009 5 32 46.9 2010 5 22 75.9 2011 3 23 95.8 2012 4 30 56.7 2013 5 38 52.6 2014 7 37 75.7 2015 7 44 77.3 2016 5 38 78.9 2017 4 32 65.6
Car
ibbe
an
2001 0 0 0
Barbados, Cuba, Curaçao, Trinidad and Tobago
2002 0 0 0 2003 3 18 61.1 2004 2 8 87.5 2006 3 14 78.6 2007 2 9 77.8 2008 3 14 78.6 2009 3 12 83.3 2010 2 13 92.9 2011 1 7 87.5 2012 2 16 62.5 2013 1 5 100.0 2014 3 15 60.0 2015 5 24 58.3 2016 2 16 60 2017 4 32 81.3
Eur
ope
2001 43 323 80.5
Belgium, Bulgaria, Croatia, Cyprus, Czech Republic (2),
Denmark, Germany (2), Greece (3), Ireland, Italy (14),
Luxembourg (2), Poland (3), Portugal, Serbia (2), Slovak Republic, Slovenia, Spain, Sweden, Turkey, Ukraine,
United Kingdom
2002 50 384 90.0 2003 60 401 84.8 2004 57 392 84.7 2006 52 403 86.4 2007 54 415 89.4 2008 50 379 82.3 2009 47 362 93.1 2010 45 332 94.1 2011 42 314 94.6 2012 47 368 92.9 2013 42 309 94.5 2014 52 391 96.2 2015 48 371 93.8 2016 46 362 93.4 2017 42 330 93.6

Appendix 1 – Figure and Tables, page 7 of 20
7
Table 4 (continued). Region-based categorization of EQAS participants’ performance of Salmonella serotyping
Region EQAS iteration No. of labs No. of strains
serotyped % strains correctly
serotyped Countries participating
in EQAS 2017
Nor
th A
mer
ica
2001 4 32 87.5
Canada (9), United States of America (4)
2002 2 16 100.0 2003 6 41 95.1 2004 8 55 81.8 2006 10 80 96.3 2007 12 94 97.9 2008 11 84 95.2 2009 12 90 92.2 2010 13 103 100.0 2011 11 81 97.6 2012 14 101 93.1 2013 13 92 97.8 2014 13 84 100.0 2015 13 93 100.0 2016 13 100 99.0 2017 13 99 99.0
Oce
ania
2001 4 30 100.0
Australia (3), New Zealand
2002 6 43 93.0 2003 6 46 93.5 2004 5 38 97.4 2006 5 37 94.6 2007 4 32 100.0 2008 4 30 93.3 2009 4 32 96.9 2010 4 32 100.0 2011 4 32 100.0 2012 4 32 100.0 2013 4 31 100.0 2014 4 32 100.0 2015 4 31 100.0 2016 4 32 100.0 2017 4 31 100.0
Rus
sia
2001 1 8 12.5
- none -
2002 1 8 62.5 2003 1 7 14.3 2004 4 26 69.2 2006 5 40 80.0 2007 8 51 80.4 2008 6 40 90.0 2009 7 49 91.8 2010 8 54 87.1 2011 7 48 87.3 2012 6 48 87.5 2013 2 16 75.0 2014 4 30 93.3 2015 3 24 100.0 2016 - - - 2017 - - -
Lat
in A
mer
ica
2001 11 78 57.7
Argentina, Bolivia, Brazil (2), Chile, Colombia (4), Costa Rica
(2), Ecuador, Guatemala, Honduras, Mexico (3), Panama (2), Paraguay, Peru, Uruguay,
Venezuela
2002 11 82 87.8 2003 13 83 75.9 2004 15 88 79.5 2006 13 84 84.5 2007 15 107 88.8 2008 17 120 71.7 2009 21 150 77.3 2010 22 132 80.0 2011 23 144 83.7 2012 25 182 73.1 2013 22 154 83.1 2014 24 166 84.9 2015 20 133 84.2 2016 23 165 87.9 2017 23 178 89.3

Appendix 1 – Figure and Tables, page 8 of 20
8
Table 4 (continued). Region-based categorization of EQAS participants’ performance of Salmonella serotyping
Region EQAS
iteration No. of labs No. of strains serotyped
% strains correctly serotyped
Countries participating in EQAS 2017
Sout
heas
t Asi
a
2001 15 113 54.0
Brunei Darussalam, Cambodia, Japan (2), Korea, Rep of (2),
LAO PDR, Malaysia (4), Philippines (2), Singapore (2), Sri Lanka, Taiwan, Thailand
(12), Viet Nam (2)
2002 12 90 92.2 2003 15 100 81.0 2004 17 130 81.5 2006 15 117 84.6 2007 19 140 91.4 2008 18 125 81.6 2009 23 180 81.1 2010 24 172 90.5 2011 23 180 98.4 2012 28 207 77.8 2013 22 163 89.6 2014 22 166 94.6 2015 24 179 88.3 2016 28 211 87.7 2017 31 244 89.3
Chi
na
2001 4 32 96.9
China (15)
2002 3 24 100.0 2003 8 60 75.0 2004 7 46 78.3 2006 6 48 85.4 2007 10 80 91.3 2008 15 108 94.4 2009 16 126 95.2 2010 10 74 92.5 2012 10 78 80.8 2013 7 54 92.6 2014 9 71 93.0 2015 15 118 78.0 2016 17 136 95.6 2017 15 120 97.5
Appendix 1 – Figure and Tables, page 9 of 20
9
Table 5. Salmonella serogroups (SG), serotypes (ST) and deviations (D), WHO EQAS 2017
*number of participants reporting the specified deviating result
Strain ID Correct serotype
No. of labs reporting
SG % DSG
No. of labs reporting
ST % DST Deviating results (*)
WHO 2017 S-17.1
Infantis I 6,7:r:1,5 159 4.4 143 11.2 Choleraesuis (2), Goma, Irumu, Papuana, Paratyphi A, Paratyphi C, Surat, Thompson, Typhi, Virchow (6)
WHO 2017 S-17.2
Havana I 13,23:f,g:- 149 10.7 137 10.9 Adelaide, Derby, II .1.,13,23:g,m,[s],t:[e,n,x], Kiel, Linton, Lomita, Paratyphi A, Paratyphi C, Raus (3), Rideau (2), Rissen, Rissen var. 14+
WHO 2017 S-17.3
Enteritidis I 9,12:g,m;- 156 1.3 142 2.1 Berta, Typhi (2)
WHO 2017 S-17.4
Rissen I 6,7:f,g:- 152 1.3 139 10.1 Alamo, Eingedi (2), Galiema, Menston, Montevideo, Othmarschen (4), Plumaugat, Typhi
WHO 2017 S-17.5
Weltevreden I 3,10:r;z6 155 2.6 142 9.2 Assinie, Dumfries, Elisabethville (3), Fareham, Paratyphi B (2), Simi, Stockholm, Ughelli (2)
WHO 2017 S-17.6
Schwarzengrund I 4,12:d:1,7 156 1.3 141 10.6 Ahmadi, Ayinde, Brezany, Kisangani, Kubacha, Kaapstad, Paratyphi A, Paratyphi B, Sarajane, Stanley (2), Travis, Typhimurium (2), Uppsala
WHO 2017 S-17.7
Typhimurium I 4,5,12:i;1,2 157 1.3 143 6.3 Avonmouth, I 1,4,5,12:i:, Lagos (3), Paratyphi A, Saintpaul
WHO 2017 S-17.8
Kentucky I 8,20:i:z6 145 15.9 135 17.0 Azteca, Bardo, Bargny, Enteritidis, Falkensee, Haardt, Paratyphi A (2), Sekondi, Tumodi (14)

Table 6. EQAS participating laboratories’ performance of antimicrobial susceptibility testing of Salmonella strains
EQAS iteration
No. of EQAS participating laboratories
% correct test results
% minor deviations (S ↔ I or I ↔ R)^
% major deviations (S → R)^
% very major deviations (R→ S)^
% critical deviations (R→ S & S → R)^
% total deviations (S → R & R → S & S ↔
I or I ↔ R)^
2000 44 92 4 4 0 4 8 2001 108 91 6 2 1 3 9 2002 119 92 6 2 1 3 9 2003* 147 93 4 3 0 3 7 2004 152 93 4 2 1 3 7 2006 143 88 8 3 1 4 12 2007 143 93 4 2 1 3 7 2008 168 91 4 2 3 5 9 2009 153 94 3 2 1 3 6 2010 152 92 4 3 2 5 8 2011 127 91 4 2 3 5 9 2012 159 94 3 2 1 3 6 2013 145 95 3 2 0 2 5 2014 155 95 3 1 1 2 5 2015 155 92 4 2 1 4 8 2016 150 95 2 2 1 3 5 2017 150 91 3 2 3 5 8 Average* 139 93 4 2 1 4 8 *Data do not include one strain which may have lost resistance due to transport or storage stress ^S, susceptible; I, intermediate; R, resistant

Appendix 1 – Figure and Tables, page 11 of 20
11
Table 7. EQAS participants’ performance of Salmonella strains antimicrobial susceptibility testing categorized by antimicrobial
EQAS iteration
No. of
labs Performance
Antimicrobial∞
AMC AMP CAZ CHL CIP COL CRO CTX GEN KAN NAL SMX MER STR SXT TET TMP XNL OVERALL average
2000 44 No. of tests - 343 - 343 334 - - - 343 312 328 248 - 312 - 335 295 - 798 % critical deviations* - 6 - 4 1 - - - 4 4 1 3 - 4 - 6 1 - 6 % total deviations^ - 8 - 7 6 - - - 5 16 4 5 - 12 - 13 1 - 14
2001 108 No. of tests - 822 - 814 813 - - - 821 623 726 431 - 679 757 804 416 - 1778 % critical deviations* - 4 - 2 1 - - - 2 2 2 6 - 7 2 7 1 - 6 % total deviations^ - 7 - 3 4 - - - 4 7 8 9 - 27 5 18 2 - 15
2002 119 No. of tests - 918 - 903 911 - - - 905 680 885 495 - 718 724 861 499 - 1961 % critical deviations* - 2 - 2 0 - - - 2 2 2 4 - 4 7 3 3 - 5 % total deviations^ - 3 - 3 2 - - - 16 10 4 4 - 34 10 7 3 - 15
2003● 147 No. of tests - 1019 - 996 995 - - - 993 738 947 615 - 768 929 995 582 - 2210 % critical deviations* - 2 - 1 0 - - - 2 2 1 4 - 9 2 4 1 - 5 % total deviations^ - 4 - 2 1 - - - 2 6 4 5 - 39 2 11 1 - 12
2004 152 No. of tests 973 1178 - 1159 1162 - - 995 1201 - 1130 734 - 947 1051 1122 729 - 2653 % critical deviations* 6 3 - 2 0 - - 0 2 - 1 5 - 1 3 5 2 - 5 % total deviations^ 12 5 - 2 1 - - 14 3 - 4 8 - 21 4 11 2 - 13
2006 143 No. of tests 950 1092 769 1060 1110 - - 956 1078 - 1035 649 - 896 996 1054 607 225 2256 % critical deviations* 9 2 7 3 2 - - 7 3 - 2 6 - 5 3 9 1 2 8 % total deviations^ 22 3 11 15 6 - - 15 7 - 6 7 - 22 5 20 2 9 21
2007 143 No. of tests 908 1114 830 1105 1101 - - 914 1111 - 1092 678 - 875 971 1047 583 258 2290 % critical deviations* 6 5 1 0 1 - - 1 3 - 2 5 - 4 3 4 1 0 5 % total deviations^ 17 7 1 6 1 - - 2 4 - 3 6 - 26 3 11 2 6 13
2008 168 No. of tests - 1331 961 1226 1307 - 791 1104 1265 - 1168 718 - 867 1155 1249 696 - 2769 % critical deviations* - 3 3 1 19 - 3 3 4 - 2 4 - 7 3 6 2 - 8 % total deviations^ - 8 6 11 21 - 6 6 6 - 4 5 - 25 4 13 2 - 16
2009 153 No. of tests - 1206 921 1108 1190 - 775 1009 1143 - 1095 624 - 864 1042 1114 616 - 2541 % critical deviations* - 3 1 1 8 - 0 1 2 - 1 7 - 9 3 4 1 - 6 % total deviations^ - 6 1 2 10 - 1 2 3 - 3 9 - 30 4 10 1 - 11
2010 152 No. of tests - 1173 937 1118 1194 - 787 1026 1133 - 1096 566 - 800 1012 1134 604 - 2516 % critical deviations* - 4 2 1 3 - 4 4 5 - 1 14 - 19 4 5 1 - 9 % total deviations^ - 5 3 2 3 - 8 8 6 - 2 17 - 55 4 9 1 - 17
Appendix 1 – Figure and Tables, page 12 of 20
12
Table 7 (continued). EQAS participants’ performance of Salmonella strains antimicrobial susceptibility testing categorized by antimicrobial.
∞For antimicrobial abbreviations: see List of Abbreviations page 1 *R→ S & S → R (R, resistant; S, susceptible) ^S→R & R→S & S↔I or I↔R (I, intermediate) ● Data do not include one strain which may have lost resistance due to transport or storage stress -, not determined
EQAS iteration
No. of
labs Performance
Antimicrobial∞
AMC AMP CAZ CHL CIP COL CRO CTX GEN KAN NAL SMX MER STR SXT TET TMP XNL OVERALL Average
2011 127 No. of tests - 1099 829 988 1070 - 744 909 999 - 993 542 - 682 988 1017 493 - 2271 % critical deviations* - 5 3 2 20 - 3 4 4 - 7 4 - 3 3 4 1 - 9 % total deviations^ - 6 4 2 21 - 3 6 5 - 15 5 - 42 3 10 2 - 17
2012 159 No. of tests - 1228 993 1159 1245 - 834 1058 1161 - 1136 584 - 814 1054 1163 613 - 2608 % critical deviations* - 3 2 1 11 - 2 4 3 - 2 5 - 2 1 2 1 - 5 % total deviations^ - 5 2 2 12 - 3 5 4 - 4 7 - 35 2 5 1 - 12
2013 145 No. of tests - 1121 898 1027 1134 - 763 1011 1086 - 1027 491 - - 946 1060 545 - 2381 % critical deviations* - 2 3 0 2 - 1 3 3 - 2 4 - - 2 3 2 - 4 % total deviations^ - 3 3 1 18 - 2 6 6 - 6 5 - - 2 5 2 - 9
2014 155 No. of tests - 1176 1003 1072 1161 - 817 1014 1147 - 1078 561 - - 1039 1107 541 - 2511 % critical deviations* - 3 3 1 3 - 1 2 3 - 1 5 - - 2 3 2 - 4 % total deviations^ - 4 4 2 19 - 2 3 5 - 2 6 - - 3 5 2 - 9
2015 155 No. of tests - 1176 1010 1064 1172 - 787 1018 1145 - 1010 514 611 - 1034 1077 591 - 2468 % critical deviations* - 3 9 2 1 - 3 5 3 - 4 7 1 - 2 2 2 - 6 % total deviations^ - 5 11 22 14 - 4 6 5 - 10 9 1 - 3 5 2 - 13
2016 150 No. of tests - 1133 988 1020 1100 - 800 968 1104 - 959 529 838 - 953 1042 599 - 2407 % critical deviations* - 4 4 1 1 - 2 4 4 - 1 7 5 - 2 3 2 - 8 % total deviations^ - 5 4 2 10 - 3 4 6 - 3 8 6 - 2 6 2 - 12
2017 150 No. of tests - 1166 1016 881 1167 473 831 968 1113 - 921 487 921 - 1055 1014 553 - 1354 % critical deviations* - 4 17 4 1 6 6 6 4 - 2 5 6 - 6 2 5 - 3 % total deviations^ - 5 22 5 18 6 7 8 5 - 2 7 6 - 7 4 5 - 9
Average● 139 No. of tests 944 1076 930 1003 1069 473 793 996 1044 588 978 557 790 769 982 1011 562 242 800 % critical deviations* 7 3 5 2 4 6 3 3 3 3 2 6 4 6 3 4 2 1 4 % total deviations^ 17 5 6 4 10 6 4 7 5 10 5 7 4 31 4 10 2 8 8

Appendix 1 – Figure and Tables, page 13 of 20
13
Table 8. Antimicrobial susceptibility test results (number of R/I/S) for the EQAS 2017 Salmonella strains*
^For antimicrobial abbreviations: see List of Abbreviations page 1 Marked in bold: expected interpretation. Grey cell: <90% of laboratories did correct interpretation. R, resistant/I, intermediate/ S, susceptible. *The result for the Salmonella strain WHO S-17.3 for chloramphenicol was omitted from evaluation (during the process of analyzing the WHO EQAS 2017 data, it was clear to the organizers that the database evaluation of the result related to the Salmonella strain WHO S-17.3 for chloramphenicol caused a large number of deviations. The expected result related to the testing of WHO S-17.3/chloramphenicol was 16/intermediate, only, due to the large number of deviations, the organizers decided not to evaluate the submitted results related to this strain/antimicrobial combination.)
Strain Antimicrobial^ AMP CTX FOX CAZ CRO CHL CIP COL GEN MER NAL SMX TET TMP SXT
WHO S-17.1 132/0/13 101/2/18 9/4/101 77/15/34 90/0/15 5/2/120 15/73/56 2/0/58 6/1/131 9/1/106 111/1/1 60/0/2 124/2/1 50/0/19 88/1/38
WHO S-17.2 10/2/134 16/8/96 31/36/46 53/14/60 7/0/97 1/0/124 4/11/132 1/0/58 4/2/133 5/0/109 3/2/111 14/7/40 2/2/123 1/0/68 5/1/126
WHO S-17.3 9/6/130 7/3/112 - 5/6/117 8/1/95 * 1/17/127 5/1/53 124/5/7 4/0/109 2/1/113 56/1/5 11/9/106 2/0/69 5/0/127
WHO S-17.4 142/1/3 117/2/2 7/1/107 55/18/54 97/1/6 115/0/10 0/15/130 1/1/57 5/2/132 4/0/111 0/1/114 56/0/4 122/2/3 64/0/5 122/0/11
WHO S-17.5 6/0/140 3/2/116 - 5/0/123 5/1/97 122/2/1 1/13/132 2/1/55 5/0/135 5/0/110 3/1/112 60/0/0 125/1/1 69/0/0 132/1/0
WHO S-17.6 6/0/140 2/3/116 - 4/1/122 2/0/101 7/0/119 0/15/129 4/0/54 4/1/135 4/0/110 3/1/110 60/0/0 124/2/1 69/0/0 128/0/5
WHO S-17.7 141/0/5 10/2/109 - 6/4/117 7/0/96 119/1/6 30/92/26 52/0/10 4/1/135 8/0/107 112/1/3 60/0/0 124/2/1 69/0/0 131/0/1
WHO S-17.8 146/0/0 120/1/0 111/2/0 125/1/0 101/0/4 121/0/3 140/4/4 2/0/56 10/1/130 101/6/12 115/0/0 62/0/0 122/2/2 68/0/0 131/0/2

Appendix 1 – Figure and Tables, page 14 of 20
14
Table 9. Region-based categorization of EQAS participants’ performance of Salmonella AST
Region EQAS iteration
No. of
labs
% correct test
result
% minor deviations (S ↔ I or I ↔ R)^
% major deviations (S → R)^
% very major
deviations (R → S)^
% critical deviations (S → R & R → S)^
% total deviations
(S→R & R→S & S↔I or
I↔R)^
Countries participating in the 2017 iteration
Afr
ica
2001 7 80.1 9.6 7.7 2.5 10.2 19.8
Cameroun, Egypt, Ghana, Kenya (2),
Madagascar, Mauritius, Morocco, Nigeria (4),
South Africa, Tanzania, United Republic of, The
Gambia, Zambia, Zimbabwe
2002 10 94.3 4.1 1.0 0.6 1.6 5.7 2003 13 86.9 6.6 2.8 3.7 6.5 13.1 2004 11 85.7 7.2 5.2 1.9 7.1 14.3 2006 20 85.8 7.5 4.1 2.7 6.8 14.3 2007 16 90.7 4.4 4.0 0.9 4.9 9.3 2008 19 83.8 6.5 5.5 4.2 9.7 16.2 2009 22 90.1 4.5 3.6 1.8 5.4 9.9 2010 22 84.7 6.0 6.5 2.8 9.3 15.3 2011 17 87.0 5.0 4.7 3.3 8.0 13.0 2012 18 89.4 5.3 3.5 1.9 5.4 10.6 2013 16 92.0 3.2 4.0 0.9 4.9 8.0 2014 20 92.5 3.8 2.0 1.7 3.7 7.5 2015 22 86.7 7.3 4.1 1.9 6.0 13.3 2016 18 90.1 4.6 4.2 1.1 5.3 9.9
2017 17 87.2 4.5 4.0 4.3 8.3 12.8
Cen
tral
Asi
a &
Mid
dle
Eas
t
2001 10 87.7 6.3 5.2 0.8 6.0 12.3
Bangladesh, India (4), Iran, Islamic rep. of (3),
Israel, Nepal (6)
2002 6 83.4 9.8 6.6 0.2 6.8 16.6 2003 8 89.9 4.5 4.0 1.6 5.6 10.1 2004 10 87.5 6.7 5.5 0.3 5.8 12.5 2006 7 79.2 10.5 9.8 0.5 10.3 20.8 2007 8 87.8 5.0 6.2 1.1 7.3 12.2 2008 12 86.1 6.5 4.0 3.4 7.4 13.9 2009 6 93.7 4.3 0.9 1.1 2.0 6.3 2010 7 95.8 2.6 0.2 1.4 1.6 4.2 2011 4 91.8 4.1 1.8 2.3 4.1 8.2 2012 8 92.8 4.4 1.6 0.7 2.3 6.6 2013 8 93.6 5.2 1.0 0.1 1.2 6.4 2014 17 91.0 4.2 2.9 2.0 4.9 9.0 2015 14 91.4 4.3 2.3 2.1 4.4 8.6 2016 11 95.5 0.9 1.8 1.8 3.6 4.5
2017 15 88.9 5.0 2.6 3.5 6.1 11.1
Car
ibbe
an
2001 2 83.5 9.5 7.0 0.0 7.0 16.5
Barbados, Cuba, Curaçao, Jamaica,
Trinidad and Tobago
2002 1 95.8 4.2 0.0 0.0 0.0 4.2 2003 8 91.7 6.4 1.5 0.5 2.0 8.4 2004 8 94.1 3.1 1.9 0.9 2.8 5.9 2006 5 92.1 5.4 1.6 1.0 2.6 8.0 2007 4 95.0 3.1 0.9 0.9 1.8 5.0 2008 5 90.7 5.5 0.9 2.9 3.8 9.3 2009 4 93.2 1.8 3.2 1.8 5.0 6.8 2010 4 90.9 5.4 2.7 0.7 3.4 8.8 2011 2 96.5 1.4 0.0 2.1 2.1 3.5 2012 4 91.1 1.5 6.7 0.7 7.4 8.9 2013 3 90.2 2.6 7.3 0.0 7.3 9.8 2014 4 78.3 4.7 9.4 7.6 17.0 21.7 2015 4 87.5 6.6 3.7 2.2 5.9 12.5 2016 2 100.0 0.0 0.0 0.0 0.0 0.0
2017 5 75.7 5.0 10.1 9.1 19.2 24.3

Appendix 1 – Figure and Tables, page 15 of 20
15
Table 9 (continued). Region-based categorization of EQAS participants’ performance of Salmonella antimicrobial susceptibility testing
Region EQAS iteration
No. of
labs
% correct test result
% minor deviations (S ↔ I or I ↔ R)^
% major deviations (S → R)^
% very major
deviations (R → S)^
% critical deviations (S → R & R → S)^
% total deviations
(S→R & R→S & S↔I or
I↔R)^
Countries participating in the 2017 iteration
Eur
ope
8,5
47 91.3 5.7 2.7 0.3 3.0 8.7
Belgium, Croatia, Cyprus, Czech
Republic, Denmark, Greece (3), Ireland, Italy
(8), Kosova, Luxembourg (2), Malta,
Poland (3), Portugal, Serbia (2), Slovak
Republic, Slovenia, Spain, Turkey, Ukraine,
United Kingdom
2002 57 92.7 5.2 1.2 0.9 2.1 7.3 2003 64 92.9 3.8 1.0 2.3 3.3 7.1 2004 58 93.5 4.3 1.4 0.8 2.2 6.5 2006 54 88.7 7.0 3.8 0.6 4.4 11.3 2007 49 94.2 3.7 1.6 0.4 2.0 5.7 2008 51 91.2 4.4 2.5 1.9 4.4 8.8 2009 40 95.1 2.6 1.3 0.9 2.2 4.8 2010 39 92.4 4.1 1.2 2.3 3.5 7.6 2011 36 92.5 4.5 1.7 1.3 3.0 7.5 2012 40 95.5 2.8 1.2 0.4 1.7 4.5 2013 37 95.7 2.5 1.4 0.3 1.7 4.2 2014 40 96.6 2.1 0.8 0.5 1.3 3.4 2015 38 93.4 4.1 1.3 1.2 2.5 6.6 2016 36 96.9 1.5 1.2 0.5 1.6 3.1
2017 33 92.8 2.4 2.1 2.7 4.8 7.2
Nor
th A
mer
ica
2001 4 95.8 3.8 0.0 0.4 0.4 4.2
Canada (5), United States of America (4)
2002 3 90.5 6.9 0.6 2.0 2.6 9.5 2003 7 93.4 5.2 0.0 1.4 1.4 6.6 2004 9 94.2 4.2 1.8 0.0 1.8 6.0 2006 8 94.8 2.9 1.0 1.3 2.3 5.2 2007 10 95.4 2.9 0.8 0.8 1.6 4.6 2008 14 96.4 0.6 0.4 2.6 3.0 3.6 2009 10 98.7 0.0 0.4 0.9 1.3 1.3 2010 11 94.8 2.6 0.2 2.4 2.6 5.2 2011 9 92.1 2.6 1.5 3.8 5.3 7.9 2012 10 96.0 2.1 1.0 0.9 1.9 4.0 2013 7 98.4 1.3 0.0 0.2 0.2 1.6 2014 8 96.9 2.2 0.4 0.6 0.9 3.1 2015 8 94.5 2.0 0.8 2.8 3.6 5.5 2016 8 99.1 0.2 0.0 0.7 0.7 0.9
2017 9 97.1 1.2 0.6 1.2 1.7 2.9
Oce
ania
2001 6 91.8 4.7 2.7 0.9 3.6 8.2
Australia, New Zealand
2002 7 91.7 6.2 0.0 2.0 2.0 8.3 2003 9 94.3 2.5 1.2 2.0 3.2 5.7 2004 11 97.1 2.5 0.3 0.1 0.4 2.9 2006 7 93.4 4.6 0.9 1.1 2.0 6.6 2007 1 98.9 1.1 0.0 0.0 0.0 1.1 2008 4 93.9 3.8 0.0 2.3 2.3 6.1 2009 4 95.9 3.2 0.3 0.6 0.9 4.1 2010 4 92.5 4.6 0.6 2.3 2.9 7.5 2011 4 93.8 5.6 0.6 0.0 0.6 6.2 2012 4 95.5 3.1 0.6 0.9 1.4 4.5 2013 4 96.8 2.9 0.0 0.3 0.3 3.2 2014 5 97.4 2.0 0.0 0.6 0.6 2.6 2015 5 95.3 3.8 0.5 0.5 1.0 4.8 2016 3 98.1 0.0 0.5 1.4 1.9 1.9
2017 2 96.1 2.6 0.0 1.3 1.3 3.9
Appendix 1 – Figure and Tables, page 16 of 20
16
Table 9 (continued). Region-based categorization of EQAS participants’ performance of Salmonella antimicrobial susceptibility testing.
Region EQAS iteration
No. of
labs
% correct test result
% minor deviations (S ↔ I or I ↔ R)^
% major deviations (S → R)^
% very major
deviations (R → S)^
% critical deviations (S → R & R → S)^
% total deviations
(S→R & R→S & S↔I or
I↔R)^
Countries participating in the 2017 iteration
Rus
sia
2001 1 81.9 15.3 2.8 0.0 2.8 18.1
- none -
2002 1 84.5 9.9 5.6 0.0 5.6 15.5 2003 1 100.0 0.0 0.0 0.0 0.0 0.0 2004 4 91.2 6.6 1.5 0.7 2.2 8.8 2006 5 87.4 8.2 2.7 1.7 4.4 12.6 2007 8 88.9 5.8 4.8 0.4 5.2 11.0 2008 6 92.2 4.7 1.4 1.7 3.1 7.8 2009 6 93.8 2.1 3.3 0.8 4.1 6.2 2010 8 94.3 3.3 1.3 1.1 2.4 5.7 2011 7 90.0 4.8 3.2 2.0 5.2 10.0 2012 6 97.4 2.0 0.0 0.6 0.6 2.6 2013 2 98.2 1.8 0.0 0.0 0.0 1.8 2014 4 98.2 0.3 0.9 0.6 1.5 1.8 2015 4 98.7 1.0 0.0 0.3 0.3 1.3 2016 - - - - - - -
2017 - - - - - - -
Lat
in A
mer
ica
2001 11 90.8 6.9 1.4 1.0 2.4 9.2
Argentina, Belize, Bolivia, Brazil (2), Chile, Colombia
(3), Costa Rica (2), Ecuador, Guatemala (2), Honduras, Mexico (2), Panama (2), Paraguay,
Peru, Suriname, Uruguay, Venezuela
2002 13 93.7 4.6 0.7 1.0 1.7 6.3 2003 12 90.8 4.2 2.0 3.0 5.0 9.2 2004 17 94.4 4.7 0.8 0.1 0.9 5.6 2006 16 88.7 6.3 4.5 0.6 5.1 11.3 2007 17 94.9 1.8 1.9 1.4 3.3 5.0 2008 20 93.0 3.4 1.5 2.1 3.6 7.0 2009 20 95.6 2.1 1.1 1.2 2.3 4.4 2010 23 90.8 2.1 5.6 1.4 7.1 9.2 2011 22 90.8 2.8 3.1 3.3 6.4 9.2 2012 25 94.4 1.6 3.0 1.0 4.0 5.6 2013 25 95.5 2.6 1.2 0.3 1.5 4.2 2014 24 96.5 1.9 1.1 0.6 1.7 3.5 2015 20 94.9 3.8 0.6 0.7 1.3 5.1 2016 24 95.6 2.5 1.4 0.5 1.9 4.4
2017 24 91.1 3.3 2.3 3.2 5.5 8.9
Chi
na
2001 4 98.9 0.8 0.0 0.3 0.3 1.1
China (14)
2002 3 96.0 4.0 0.0 0.0 0.0 4.0 2003 8 90.1 3.6 2.8 3.6 6.4 10.0 2004 8 96.0 3.2 0.7 0.1 0.8 4.0 2006 6 89.6 7.0 2.9 0.5 3.4 10.4 2007 10 98.3 1.1 0.3 0.2 0.5 1.6 2008 18 92.8 3.7 0.8 2.7 3.5 7.2 2009 14 94.8 2.2 2.1 0.8 2.9 5.1 2010 9 92.1 4.5 1.6 1.8 3.4 7.9 2012 9 95.3 3.0 0.5 1.2 1.6 4.7 2013 8 96.9 2.0 0.5 0.5 1.0 3.1 2014 8 97.0 1.2 0.1 1.6 1.8 3.0 2015 15 92.8 2.0 4.0 1.1 5.1 7.2 2016 16 96.7 0.4 1.8 1.1 2.9 3.3
2017 14 93.4 2.9 0.7 3.0 3.7 6.6 ^S. susceptible; I. intermediate; R. resistant

Appendix 1 – Figure and Tables, page 17 of 20
17
Table 9 (continued). Region-based categorization of EQAS participants’ performance of Salmonella antimicrobial susceptibility testing.
^S. susceptible; I. intermediate; R. resistant
Region EQAS iteration
No. of
labs
% correct test result
% minor deviations (S ↔ I or I ↔ R)^
% major deviations (S → R)^
% very major
deviations (R → S)^
% critical deviations (S → R & R → S)^
% total deviations
(S→R & R→S & S↔I or
I↔R)^
Countries participating in the 2017 iteration
Sout
heas
t Asi
a
2001 16 88.1 7.7 2.3 1.9 4.2 11.9
Cambodia, Japan (2), Korea, Rep of (2), LAO
PDR, Malaysia (5), Philippines (2), Singapore,
Sri Lanka (2), Taiwan, Thailand (13), Viet Nam
2002 18 89.0 8.1 1.4 1.6 3.0 11.0 2003 17 87.4 5.2 4.7 2.7 7.4 12.6 2004 16 92.8 4.4 2.3 0.5 2.8 7.2 2006 15 90.0 8.1 1.2 0.8 2.0 10.0 2007 20 93.9 4.0 1.4 0.7 2.1 6.1 2008 19 90.5 4.7 2.2 2.6 4.8 9.5 2009 27 91.8 4.1 3.0 1.2 4.2 8.3 2010 25 92.8 3.8 1.5 1.9 3.4 7.2 2011 26 90.5 3.5 2.4 3.5 5.9 9.5 2012 35 91.7 3.9 3.5 0.9 4.4 8.3 2013 35 93.4 3.2 2.5 0.7 3.2 6.4 2014 8 97.0 1.2 0.1 1.6 1.8 3.0 2015 25 89.9 6.0 2.6 1.5 4.1 10.1 2016 30 93.5 2.2 3.5 0.8 4.3 6.5
2017 31 91.9 2.9 2.1 3.2 5.2 8.1
Appendix 1 – Figure and Tables, page 18 of 20
18
Table 10. EQAS participants’ performance of antimicrobial susceptibility testing of quality control strain Escherichia coli ATCC 25922
Method Perfor-mance4.5 AMP CAZ CHL CIP COL CRO CTX FIS
(SMX)2 FOX GEN MER NAL STR SXT TET TMP
Accepted interval1
MIC (μg/ml) 2-8 0.06-0.5 2-8 0.004-0.016 0.25-2 0.03-0.12 0.03-0.12 8-32 2-8 0.25-1 0.008-0.06 1-4 4-163 ≤0.5/9.5 0.5-2 0.5-2
Disks (mm) 15-22 25-32 21-27 30-40 - 29-35 29-35 15-23 23-29 19-26 28-34 22-28 12-20 23-29 18-25 21-28
EQ
AS
itera
tion
(tota
l no.
of p
artic
ipan
ts)
2000 (44) MIC & Disk No.4 37 - 38 35 - - - 19 - 39 - 37 36 - 42 31
%5 27 - 37 20 - - - 53 - 23 - 35 22 - 42 30 2001 (107) MIC & Disk No.4 97 - 97 97 - - - 53 - 99 - 74 81 90 96 50
%5 19 - 20 14 - - - 34 - 12 - 14 12 14 22 22 2002 (114) MIC & Disk No.4 109 - 107 108 - - - 57 - 108 - 102 82 102 102 66
%5 16 - 15 14 - - - 26 - 12 - 14 11 12 13 11 2003 (144) MIC & Disk No.4 140 - 137 138 - - - 82 - 138 - 132 105 129 137 79
%5 14 - 22 9 - - - 17 - 9 - 16 9 14 19 14 2004 (140) MIC & Disk No.4 132 - 128 132 - - 111 84 - 134 - 126 110 120 129 87
%5 10 - 13 8 - - 18 16 - 10 - 9 6 11 13 9 2006 (137) MIC & Disk No.4 133 96 126 127 - - 115 74 - 131 - 122 106 122 125 74
%5 14 15 18 8 - - 21 29 - 14 - 20 11 19 12 17 2007 (126) MIC & Disk No.4 124 92 123 121 - - 104 64 - 124 - 120 97 107 117 67
%5 11 9 14 12 - - 16 22 - 6 - 7 6 13 7 10
2008 (147)
MIC & Disk No.4 147 111 135 144 - - 124 71 - 145 - 136 101 129 139 79 %5 12 9 10 8 - - 14 14 - 8 - 8 12 13 7 13
MIC No.4 33 23 24 33 - - 23 18 - 31 - 23 19 22 28 16 %5 0 5 0 6 - - 9 11 - 0 - 0 11 9 0 13
Disk No.4 114 89 112 111 - - 101 53 - 114 - 113 82 107 111 63 %5 16 10 12 8 - - 15 15 - 11 - 10 12 14 9 13
2009 (129)
MIC & Disk No.4 128 100 121 124 - 88 107 63 - 123 - 117 98 113 122 70 %5 16 13 15 7 - 16 10 11 - 18 - 13 10 14 14 11
MIC (27) No.4 27 19 24 26 - 20 20 14 - 25 - 24 19 21 27 25 %5 11 11 8 8 - 15 15 21 - 12 - 8 5 19 11 13
Disk (102) No.4 101 81 97 98 - 68 87 49 - 98 - 93 79 92 95 55 %5 16 14 16 6 - 16 9 10 - 18 - 14 11 12 15 11
2010 (116)
MIC & Disk No.4 114 97 108 115 - 79 100 51 - 112 - 104 84 101 110 63 %5 11 9 9 6 - 10 14 11 - 11 - 5 5 12 5 15
MIC (24) No.4 25 15 21 25 - 15 17 12 - 24 - 19 17 17 24 11 %5 12 20 10 8 - 7 18 8 - 13 - 16 18 18 17 36
Disk (91) No.4 89 82 87 90 - 64 83 39 - 88 - 85 67 84 86 52 %5 9 6 8 4 - 9 11 10 - 9 - 2 1 10 1 8
2011 (112)
MIC & Disk No.4 111 89 102 109 - 76 96 50 - 103 - 103 72 99 107 51 %5 17 4 11 7 - 7 9 8 - 11 - 8 4 16 7 14
MIC (23) No.4 23 15 18 22 - 16 15 13 - 22 - 19 17 16 21 11 %5 4 7 0 9 - 6 0 8 - 9 - 0 6 6 5 0
Disk (89) No.4 88 74 84 87 - 60 81 37 - 81 - 84 55 83 86 40 %5 20 4 13 7 - 7 11 8 - 11 - 10 4 18 8 18

Appendix 1 – Figure and Tables, page 19 of 20
19
Table 10 (continued). EQAS participants’ performance of antimicrobial susceptibility testing of quality control strain Escherichia coli ATCC 25922
Method Perfor-mance4.5 AMP CAZ CHL CIP COL CRO CTX FIS
(SMX)2 FOX GEN MER NAL STR SXT TET TMP
Accepted interval1
MIC (μg/ml) 2-8 0.06-0.5 2-8 0.004-0.016 0.25-2 0.03-0.12 0.03-0.12 8-32 2-8 0.25-1 0.008-0.06 1-4 4-163 ≤0.5/9.5 0.5-2 0.5-2
Disks (mm) 15-22 25-32 21-27 30-40 - 29-35 29-35 15-23 23-29 19-26 28-34 22-28 12-20 23-29 18-25 21-28
EQ
AS
itera
tion
(tota
l no.
of p
artic
ipan
ts)
2012 (135)
MIC & Disk No.4 134 111 121 131 - 90 115 53 - 127 - 121 89 112 129 66 %5 13 12 7 6 - 11 10 11 - 9 - 9 8 13 10 21
MIC (37) No.4 37 26 31 35 - 23 28 19 - 35 - 31 26 23 35 22 %5 3 4 0 3 - 0 4 5 - 3 - 3 8 0 0 9
Disk (98) No.4 97 85 90 96 - 67 87 34 - 92 - 90 63 89 94 44 %5 16 14 9 7 - 15 11 15 - 11 - 11 8 16 14 27
2013 (122)
MIC & Disk No.4 117 100 112 119 - 82 107 44 - 113 - 113 - 101 114 59 %5 12 7 5 7 - 4 8 10 - 6 - 11 - 8 8 11
MIC (33) No.4 31 25 28 32 - 19 27 17 - 32 - 28 - 22 32 22 %5 6 4 4 13 - 5 11 18 - 9 - 11 - 5 6 5
Disk (89) No.4 86 75 84 87 - 63 80 27 - 81 - 85 - 79 82 37 %5 13 8 6 5 - 5 6 7 - 4 - 9 - 10 7 8
2014 (115)
MIC & Disk No.4 111 99 101 108 - 75 97 49 - 111 - 103 - 102 104 50 %5 5 7 7 6 - 7 14 14 - 8 - 8 - 8 7 2
MIC (28) No.4 27 21 24 27 - 16 22 16 - 28 - 24 - 21 25 12 %5 4 5 4 15 - 6 14 0 - 14 - 8 - 14 0 0
Disk (87) No.4 84 78 77 81 - 59 75 33 - 83 - 79 - 81 79 38 %5 6 8 8 4 - 7 15 21 - 6 - 8 - 6 9 3
2015 (117)
MIC&Disk No.4 113 101 101 112 - 78 99 54 75 112 74 100 - 104 106 57 %5 8 5 7 7 - 9 6 11 9 9 12 7 - 13 8 9
MIC (31) No.4 30 26 25 30 - 16 25 15 20 30 19 24 - 24 27 16 %5 3 8 4 13 - 0 12 7 10 7 11 4 - 8 7 13
Disk (85) No.4 83 75 76 82 - 62 74 39 55 82 55 76 - 80 79 41 %5 10 4 8 5 - 11 4 13 9 10 13 8 - 14 8 7
2016 (106)
MIC&Disk No.4 101 93 95 101 - 76 94 54 84 99 88 91 - 91 97 59 %5 11 5 13 9 - 16 15 24 7 8 10 9 - 8 10 14
MIC (30) No.4 27 24 24 27 - 17 24 13 22 29 25 20 - 20 25 16 %5 4 4 0 7 - 12 4 23 0 3 4 0 - 0 8 13
Disk (76) No.4 74 69 71 74 - 59 70 41 62 70 63 71 - 71 72 43 %5 14 6 17 9 - 17 19 24 10 10 13 11 - 10 11 14
2017 (115)
MIC&Disk No.4 114 101 103 113 56 82 93 56 92 107 93 89 - 95 99 61 %5 13 11 10 10 20 16 14 27 10 7 10 7 - 6 10 8
MIC (41) No.4 41 33 35 41 28 25 31 24 30 38 34 31 - 29 34 26 %5 5 6 0 7 4 12 6 17 3 5 6 3 - 0 6 0
Disk (74) No.4 73 68 68 72 28 57 62 32 62 69 59 58 - 66 65 35 %5 18 13 15 11 36 18 18 34 13 7 12 9 - 9 12 14
0For antimicrobial abbreviations: see List of Abbreviations page 1 1CLSI standard. Performance Standards for Antimicrobial Disk and Dilution Susceptibility testing. 22nd Informational supplement. CLSI document M100-S22. 2012 Wayne. PA. USA 2FIS (sulfisoxazole) covers the group of SMX (sulfonamides); 3Quality control range developed by the manufacturer of Sensititre; 4No.. number of laboratories performing the analysis; 5%. percentage of laboratories reporting erroneous results; -. not determined

Appendix 1 – Figure and Tables, page 20 of 20
20
Table 11. Proportion of laboratories that obtained the expected result. Number (n/N) and percentages of laboratories which correctly detected and confirmed the ESBL-producing Salmonella strains.
Isolate no. Expected interpretation Confirmatory tests
WHO 2017 S-17.1 Presumptive ESBL-phenotype 80/92 (87%)
WHO 2017 S-17.2 Presumptive AmpC-phenotype 26/77 (34%)
WHO 2017 S-17.3 - -
WHO 2017 S-17.4 Presumptive ESBL-phenotype 82/91 (90%)
WHO 2017 S-17.5 - -
WHO 2017 S-17.6 - -
WHO 2017 S-17.7 - -
WHO 2017 S-17.8 Presumptive carbapenemase-phenotype 62/94 (66%)

Appendix 4, page 1 of 2
G00-06-001/01.12.2014
Kgs. Lyngby, Denmark, May 2017
SIGN-UP FOR EQAS 2017 Greetings to the WHO Global Foodborne Infections Network (WHO GFN) Members:
WHO GFN strives to increase the quality of laboratory-based surveillance of Salmonella by encouraging national and regional reference laboratories that attended WHO GFN training courses to participate in the External Quality Assurance System (EQAS). We are pleased to announce the launch of the 2017 EQAS cycle.
WHY PARTICIPATE IN EQAS?
EQAS provides the opportunity for proficiency testing which is considered an important tool for the production of reliable laboratory results of consistently good quality.
WHAT IS OFFERED IN EQAS?
This year, WHO EQAS offers the following components:
- Serogrouping, serotyping and antimicrobial susceptibility testing of eight Salmonella isolates.
WHO SHOULD PARTICIPATE IN EQAS 2017?
All national and regional reference laboratories which perform analysis on Salmonella and are interested in participating in an external quality assurance program are invited to participate.
We expect that all national and regional reference laboratories that attended WHO GFN Training Courses will participate in the EQAS.
The WHO GFN Regional Centers in cooperation with the EQAS Coordinator will evaluate the list of laboratories that sign up for EQAS 2017. Laboratories which signed up and received bacterial isolates in year 2016 but did not submit any result should provide a consistent explanation for this if they want to participate in 2017.
COST FOR PARTICIPATING IN EQAS
There is no participation fee. Laboratories should, however, cover the expenses for parcel shipment if they can afford it. If FedEx has ‘Dangerous Goods-service’ in your country or if you have a DHL-account no, please provide your FedEx or DHL import account number (for import of UN3373 Biological Substance Category B) in the sign-up form or, alternatively, to the EQAS Coordinator (please find contact information below). We need this information at this stage to save time and resources. Participating laboratories are responsible for paying any expenses related to taxes or custom fees applied by their country.

Appendix 4, page 2 of 2
HOW TO SIGN- UP FOR EQAS 2017
This link will open a sign-up webpage: http://eqas.food.dtu.dk/who/signup
In this webpage, you will be asked to provide the following information:
- Name of institute, department, laboratory, and contact person - Complete mailing address for shipment of bacterial isolates (no post-office box number) - Telephone and fax number, e-mail address - FedEx or DHL import account number (if available) - Approximate number of Salmonella isolates annually serogrouped/serotyped - Approximate number of Salmonella isolates annually tested for antimicrobial susceptibility - Availability of ATCC 25922 E. coli reference strain - Components of EQAS 2017 you plan to participate in - Level of reference function in your country
If you experience any problem in the sign-up webpage, please try again a few days later. If problems persist, please contact the EQAS Coordinator Susanne Karlsmose Pedersen: E-mail [email protected].
TIMELINE FOR SHIPMENT OF ISOLATES AND AVAILABILITY OF PROTOCOLS
A number of different institutions will ship the bacterial isolates, and you will receive information concerning the institution shipping your parcel. The bacterial isolates will be shipped in October 2017.
In order to minimize delays, please send a valid import permit to the EQAS coordinator. Please apply for a permit to receive the following: “UN3373, Biological Substance Category B”: eight Salmonella strains, and (for new participants performing antimicrobial susceptibility testing on Salmonella) one Escherichia coli reference strain.
Protocols and all relevant information will be available for download from the website http://www.antimicrobialresistance.dk/233-169-215-eqas.htm.
DEADLINE FOR SUBMITTING RESULTS TO THE NATIONAL FOOD INSTITUTE
Results must be submitted to the National Food Institute (DTU Food) by 28th February 2018 through the password-protected website. An evaluation report will be generated upon submission of results. Full anonymity is ensured, and only DTU Food and the WHO GFN Regional Centre in your region will have access to your results.
Deadline for sign-up for the WHO GFN EQAS 2017 is August 4th, 2017 --- --- ---

Appendix 3, page 1 of 1
Synergy SynergyCTX:/CTX:Cl CAZ:/CAZ:Cl
WHO 2017 S-17.1 Salmonella Infantis I 6,7:r:1,5 ESBL >64 RESIST >64 RESIST synergy 4 SUSC 16 RESIST synergy >32 RESIST <=8 SUSC 0.25 INTER
WHO 2017 S-17.2 Salmonella Havana I 13,23:f,g:- AmpC <=1 SUSC 1 SUSC no synergy 32 RESIST 4 RESIST no synergy 0.12 SUSC <=8 SUSC 0.06 SUSC
WHO 2017 S-17.3 Salmonella Enteritidis I 9,12:g,m;- - 4 SUSC 0.5 SUSC 1 SUSC 0.25 SUSC 16 INTER 0.06 SUSC
WHO 2017 S-17.4 Salmonella Rissen I 6,7:f,g:- ESBL >64 RESIST 32 RESIST synergy 8 SUSC 2 RESIST synergy 64 RESIST >128 RESIST 0.03 SUSC
WHO 2017 S-17.5 Salmonella Weltevreden I 3,10:r;z6 - <=1 SUSC <=0.25 SUSC <=0.5 SUSC 0.03 SUSC 128 RESIST 0.03 SUSC
WHO 2017 S-17.6 Salmonella Schwarzengrund I 4,12:d:1,7 - 2 SUSC <=0.25 SUSC <=0.5 SUSC 0.06 SUSC <=8 SUSC 0.03 SUSC
WHO 2017 S-17.7 Salmonella Typhimurium I 4,5,12:i:1,2 - >64 RESIST 0.5 SUSC <=0.5 SUSC 0.12 SUSC 64 RESIST 0.5 INTER
WHO 2017 S-17.8 Salmonella Kentucky I 8,20:i:z6 Carbapenemase >64 RESIST >64 RESIST no synergy 64 RESIST >128 RESIST no synergy >256 RESIST >128 RESIST 8 RESIST
WHO 2017 S-17.1 Salmonella Infantis I 6,7:r:1,5 ESBL <=1 SUSC <=0.5 SUSC 0.06 SUSC >128 RESIST >1024 RESIST >64 RESIST >32 RESIST >4 RESIST
WHO 2017 S-17.2 Salmonella Havana I 13,23:f,g:- AmpC <=1 SUSC <=0.5 SUSC 0.06 SUSC <=4 SUSC 64 SUSC 4 SUSC 0.5 SUSC 0.12 SUSC
WHO 2017 S-17.3 Salmonella Enteritidis I 9,12:g,m;- - 2 SUSC 32 RESIST 0.06 SUSC 8 SUSC >1024 RESIST 4 SUSC <=0.25 SUSC 0.12 SUSC
WHO 2017 S-17.4 Salmonella Rissen I 6,7:f,g:- ESBL <=1 SUSC 1 SUSC 0.06 SUSC <=4 SUSC >1024 RESIST >64 RESIST >32 RESIST >32 RESIST
WHO 2017 S-17.5 Salmonella Weltevreden I 3,10:r;z6 - <=1 SUSC <=0.5 SUSC 0.06 SUSC <=4 SUSC >1024 RESIST >64 RESIST >32 RESIST >32 RESIST
WHO 2017 S-17.6 Salmonella Schwarzengrund I 4,12:d:1,7 - 2 SUSC <=0.5 SUSC 0.06 SUSC 8 SUSC >1024 RESIST >64 RESIST >32 RESIST >32 RESIST
WHO 2017 S-17.7 Salmonella Typhimurium I 4,5,12:i:1,2 - 8 RESIST <=0.5 SUSC 0.06 SUSC >128 RESIST >1024 RESIST >64 RESIST >32 RESIST >32 RESIST
WHO 2017 S-17.8 Salmonella Kentucky I 8,20:i:z6 Carbapenemase <=1 SUSC 1 SUSC 1 RESIST >128 RESIST >1024 RESIST >64 RESIST >32 RESIST >32 RESIST
ColistinCOL
CIP
GEN MERSulfonamides
NAL SMX
Ceftazidime Ceftriaxone ChloramphenicolCRO
TET TMPTrimethoprimTetracyclinePresumptive
phenotypeTrim/Sulfa
SXT
CHLPresumptive phenotype
CefoxitinFOX
Ciprofloxacin
Gentamicin Meropenem Nalidixic acid
AMP CTX CAZAmpicillin Cefotaxime

WHO Collaborating Centre External Quality Assurance System (EQAS) 2017
Page 1 of 9 G00-06-001/23.06.2017
PROTOCOL for serotyping and antimicrobial susceptibility testing of Salmonella test strains
1 INTRODUCTION ..................................................................................................................... 1
2 OBJECTIVES ............................................................................................................................ 2
3 OUTLINE OF THE EQAS 2017 .............................................................................................. 2
3.1 Shipping, receipt and storage of strains ....................................................................... 2
3.2 Serotyping of Salmonella ............................................................................................... 2
3.3 Antimicrobial susceptibility testing of Salmonella strains and Escherichia coli ATCC 25922 ................................................................................................................................ 3
4 REPORTING OF RESULTS AND EVALUATION .............................................................. 7
5 HOW TO ENTER RESULTS IN THE INTERACTIVE DATABASE ................................ 7
1 INTRODUCTION
In 2000, the Global Foodborne Infections Network (formerly known as WHO Global Salm-Surv) launched an External Quality Assurance System (EQAS). The EQAS is organized by the National Food Institute, Technical University of Denmark (DTU Food), in collaboration with partners and Regional Sites in WHO GFN.
Various aspects of the proficiency test scheme may from time to time be subcontracted. When subcontracting occurs, it is placed with a competent subcontractor and the National Food Institute is responsible for the subcontractor’s work.
The WHO EQAS 2017 includes serotyping and antimicrobial susceptibility testing of eight Salmonella strains and antimicrobial susceptibility testing of the Escherichia coli ATCC 25922 (CCM 3954) reference strain for quality control (QC).
The above-mentioned QC reference strain is included in the parcel only for new participants of the EQAS who did not receive it previously. The QC reference strain supplied is an original
Appendix 4, page 1 of 9

WHO Collaborating Centre External Quality Assurance System (EQAS) 2017
Page 2 of 9 G00-06-001/23.06.2017
CERTIFIED culture provided free of charge, and should be used for future internal quality control for antimicrobial susceptibility testing in your laboratory. The QC reference strain will not be included in the years to come. Therefore, please take proper care of these strains. Handle and maintain them as suggested in the manual ‘Subculture and Maintenance of QC Strains’ available on the WHO Collaborating Centre website (see www.antimicrobialresistance.dk).
2 OBJECTIVES
The main objective of this EQAS is to support laboratories to assess and if necessary improve the quality of serotyping and antimicrobial susceptibility testing of enteric human pathogens, especially Salmonella. A further objective is to assess and improve the comparability of surveillance data on Salmonella serotypes and antimicrobial susceptibility reported by different laboratories. Therefore, the laboratory work for this EQAS should be done by using the methods routinely used in your laboratory.
3 OUTLINE OF THE EQAS 2017
3.1 Shipping, receipt and storage of strains
In October 2017 around 200 laboratories located worldwide will receive a parcel containing eight Salmonella strains. An E. coli ATCC 25922 reference strain will be included for participants who signed up to perform antimicrobial susceptibility testing (AST) and did not receive it previously. All provided strains belong to UN3373, Biological substance category B. Extended Spectrum Beta Lactamase (ESBL)-, AmpC- or carbapenemase-producing strains could be included in the selected material.
Please confirm receipt of the parcel through the confirmation form enclosed in the shipment.
The Salmonella strains are shipped as agar stab cultures whereas the reference strain is shipped lyophilised. On arrival, the agar stab culture must be stored in a dark place at 2⁰C to 8⁰C. If receiving a lyophilized reference culture, store in a dark, cool place. The agar stab cultures must be sub-cultured and prepared for storage in your strain collection (e.g. in a -80°C freezer). This set of cultures should serve as reference if discrepancies are detected during the testing (e.g. they can be used to detect errors such as mis-labelling or contamination).
3.2 Serotyping of Salmonella
The eight Salmonella strains should be serotyped by using the method routinely used in the laboratory. Also serogroup results will be evaluated, therefore, if you do not have all the necessary antisera for a serotyping, please go as far as you can in the identification and report the serogroup. Serogroups should be reported using terms according to Kauffmann-White-Le Minor (Grimont and
Appendix 4, page 2 of 9

WHO Collaborating Centre External Quality Assurance System (EQAS) 2017
Page 3 of 9 G00-06-001/23.06.2017
Weill, 2007. 9th ed. Antigenic formulae of the Salmonella serovars. WHO Collaborating Centre for Reference and Research on Salmonella).
Please fill in information concerning the brand of antisera used for typing in the fields available in the database for entering results. In addition, we kindly ask you to report which antisera you think are required to complete the serotyping, if relevant.
3.3 Antimicrobial susceptibility testing of Salmonella strains and Escherichia coli ATCC 25922
The Salmonella strains as well as the E. coli ATCC 25922 reference strain should be tested for susceptibility towards as many as possible of the antimicrobials mentioned in the test form. Please use the methods routinely used in your laboratory.
For reconstitution of the E. coli reference strain, please see the document ‘Instructions for opening and reviving lyophilised cultures’ on the WHO Collaborating Centre website (see www.antimicrobialresistance.dk).
Testing of gentamicin susceptibility may be valuable for monitoring purposes. Therefore we kindly ask you to disregard, for the purpose of this proficiency trial, that the Clinical and Laboratory Standards Institute (CLSI) guidelines state that Salmonella should not be reported as susceptible to aminoglycosides.
The breakpoints used in this EQAS for interpreting MIC results are in accordance with CLSI values (Table 1). Consequently, interpretation of MIC results will lead to categorization of strains into three categories: resistant (R), intermediate (I) and susceptible (S). In the evaluation report you receive upon result submission, you can find that obtained interpretations in accordance with the expected interpretation will be defined as ‘correct’, whereas deviations from the expected interpretation will be defined as ‘minor’ (I S or I R), ‘major’ (S interpreted as R) or ‘very major’ (R interpreted as S).
Please report the breakpoints that you routinely use in your laboratory for interpretation of antimicrobial susceptibility test results in the fields available in the database (or in the test forms).
Appendix 4, page 3 of 9

WHO Collaborating Centre External Quality Assurance System (EQAS) 2017
Page 4 of 9 G00-06-001/23.06.2017
Table 1. Interpretive breakpoint for Salmonella antimicrobial susceptibility testing
Antimicrobials Reference value, MIC (g/mL) Reference value, Disk diffusion (mm)
Susceptible Intermediate Resistant Resistant Intermediate Susceptible Ampicillin, AMP 8 16 32 13 14-16 17
Cefotaxime, CTX* ≤1 - >1 27 - >27
Cefoxitin, FOX 8 16 32 14 15-17 18
Ceftazidime, CAZ* ≤1 - >1 22 - >22
Ceftriaxone, CRO* ≤1 - >1 25 - >25
Chloramphenicol, CHL 8 16 32 12 13-17 18
Ciprofloxacin, CIP 0.06 0.12-0.5 1
20mm (5µg)
or <23mm (1µg)**
21-30mm(5µg)
or(1µg)**
31mm (5µg) or
23mm (1µg)**
Colistin, COL*** ≤2 - 4 Not
applicable
Not
applicable
Not
applicable
Gentamicin, GEN 4 8 16 12 13-14 15
Meropenem, MER* ≤0.12 - >0.12 <27 - 27
Nalidixic acid, NAL 16 - 32 13 14-18 19
Sulfonamides, SMX 256 - 512 12 13-16 17
Tetracycline, TET 4 8 16 11 12-14 15
Trimethoprim, TMP 8 - 16 10 11-15 16
Trimethoprim +
sulfamethoxazole,
TMP+SMX, SXT
2/38 - 4/76 10 11-15 16
Reference values used in this EQAS are according to CLSI (M100, 27th edition), with the following exceptions: * For the cephalosporins and meropenem, the application of the interpretative criteria is intended to indicate if themicroorganism is a presumptive ESBL- or carbapenemase-producer. Reference values for the cephalosporins areaccording to CLSI M100 Table 3A. These interpretative criteria are also applied for Salmonella test strains forinterpretation of AST results in this EQAS. Reference values for meropenem are based on epidemiological cut offvalues from www.eucast.org.** The publication by Cavaco LM and Aarestrup FM (J. Clin. Microbiol. 2009. Sep;47(9):2751-8) provides thebackground for these interpretative criteria in the WHO GFN EQAS.*** Reference values for colistin are based on CLSI M100 Table 2A-2. In the current EQAS these values should beapplied for the interpretation of Salmonella AST results into the category as susceptible or resistant.
Appendix 4, page 4 of 9

WHO Collaborating Centre External Quality Assurance System (EQAS) 2017
Page 5 of 9 G00-06-001/23.06.2017
Concerning ciprofloxacin susceptibility tests, the applied breakpoints take into consideration mechanisms of resistance due to plasmid-mediated quinolone resistance genes (e.g. qnr-genes) and one-point-mutation in the gyrase gene.
Important notes: beta-lactam resistance The following tests for detection of ESBL-, AmpC-, and carbapenamase-producing phenotypes are optional in relation to the current WHO GFN EQAS.
If choosing to participate in this component of the EQAS, all strains displaying reduced susceptibility to cefotaxime (CTX), ceftazidime (CAZ), and/or ceftriaxone (CRO) should be tested for ESBL-, AmpC, or carbapenemase-production by confirmatory tests. Reduced susceptibility to any of the above-mentioned antimicrobials indicates that the bacterial strain is an ESBL-, AmpC, or carbapenemase-producing phenotype.
Confirmatory test for ESBL production requires the use of both cefotaxime (CTX) and ceftazidime (CAZ) alone, and in combination with a -lactamase inhibitor (clavulanic acid). Synergy is defined either as i) by microbroth dilution methods or E-test; a ≥ 3 twofold concentration decrease in an MIC for either antimicrobial agent tested in combination with clavulanic acid vs. its MIC when tested alone (E-test 3 dilution steps difference; MIC CTX : CTX/Cl or CAZ : CAZ/Cl ratio 8) or ii) by disk diffusion; a 5 mm increase in a zone diameter for either antimicrobial agent tested incombination with clavulanic acid vs. its zone when tested alone (CLSI M100 Table 2A;Enterobacteriaceae). The presence of synergy indicates ESBL production.
Detection of AmpC-type beta-lactamases can be performed by testing the bacterial culture for susceptibility to cefoxitin (FOX). Resistance to FOX indicates the presence of an AmpC-type beta-lactamase.
Confirmatory test for carbapenemase production requires the testing of meropenem (MER). Reduced susceptibility to MER indicates that the bacterial strain is a carbapenemase-producer.
The classification of the phenotypic results should be based on the most recent EFSA recommendations (available in The European Union summary report on antimicrobial resistance in zoonotic and indicator bacteria from humans, animals and food in 2015, EFSA Journal 2017;15(2):4694,212 pp (page 43).
The following summary of these recommendations indicate how the phenotypes should be categorized:
Appendix 4, page 5 of 9

WHO Collaborating Centre External Quality Assurance System (EQAS) 2017
Page 6 of 9 G00-06-001/23.06.2017
ESBL-phenotype: - CTX or CAZ > 1 mg/L AND - MER ≤ 0.12 mg/L AND - FOX ≤ 8 mg/L AND - Synergy for CTX : CTX/Cl and/or CAZ : CAZ/Cl
ESBL+AmpC-phenotype: - CTX or CAZ > 1 mg/L AND - MER ≤ 0.12 mg/L AND - FOX > 8 mg/L AND - Synergy for CTX : CTX/Cl and/or CAZ : CAZ/Cl
AmpC-phenotype: - CTX or CAZ > 1 mg/L AND - MER ≤ 0.12 mg/L AND - FOX > 8 mg/L AND - No synergy for CTX : CTX/Cl nor CAZ : CAZ/Cl (note, presence of ESBLs is not excluded)
Carbapenemase-phenotype: - MER > 0.12 mg/L (note, presence of ESBLs or AmpCs is not excluded)
Other-phenotype: - Not covered by any of the above categories AND - CTX, CAZ, FOX, or MER > interpretative criteria as susceptible in Table 1 (i.e. exhibits
reduced susceptibility)
No ESBL-, AmpC-, or carbapenemase: - CTX, CAZ, FOX, and MER ≤ interpretative criteria as susceptible in Table 1 (i.e. exhibits
susceptibility)
The genotype obtained by PCR and/or sequencing may be necessary to correctly categorize a bacterial test strain as either of the categories, ESBL-, AmpC, and/or carbapenemase-producer, but is not requested as part of this WHO GFN EQAS.
Appendix 4, page 6 of 9

WHO Collaborating Centre External Quality Assurance System (EQAS) 2017
Page 7 of 9 G00-06-001/23.06.2017
4 REPORTING OF RESULTS AND EVALUATION
We recommend that you write your results in the enclosed test forms and that you read carefully the description in paragraph 5 before entering your results in the web database. For entering your results via the web, you will be guided through all steps on the screen and you will immediately be able to view and print a report evaluating your results. Results in agreement with the expected interpretation are categorised as ‘correct’, while results deviating from the expected interpretation are categorised as ‘incorrect’.
Results must be submitted no later than 28th February 2018.
If you do not have access to the Internet, or if you experience difficulties in entering your results, please contact the EQAS Coordinator directly, explaining the issues that occur.
All results will be summarized in a report which will be publicly available. Individual results will be anonymous and will only be forwarded to the official GFN Regional Centre in your region.
We are looking forward to receiving your results.
If you have any questions or concerns, please do not hesitate to contact the EQAS Coordinator:
Susanne Karlsmose Pedersen
National Food Institute, Technical University of Denmark
Kemitorvet, Building 204, DK-2800 Lyngby - DENMARK
Tel: +45 3588 6601
E-mail: [email protected]
Direct communication with the EQAS organisers must be in English.
5 HOW TO ENTER RESULTS IN THE INTERACTIVE DATABASE
Please carefully read these instructions before entering the web page. Remember that you need by your side the completed test forms and the breakpoint values you used.
In general, you can browse back and forth in the pages of the database. Always remember to save your input before leaving a page.
Appendix 4, page 7 of 9

WHO Collaborating Centre External Quality Assurance System (EQAS) 2017
Page 8 of 9 G00-06-001/23.06.2017
1) Enter the WHO Collaborating Centre website (from http://www.antimicrobialresistance.dk), then a. Click on ‘EQAS’ b. Click on the link for the interactive database (http://eqas.food.dtu.dk/who) c. Write your username and password in lower-case letters and click on ‘Login’.
You can find your username and password in the letter following your strains. Your username and password will remain unchanged in future trials. Do not hesitate to contact us if you experience problems with the login.
2) Click on ‘Materials and methods’ a. Fill in the fields relative to brand of antisera (very important because we would like to
compare results obtained with different brands of antisera) b. Fill in the fields relative to the method used for antimicrobial susceptibility testing c. Enter the brand of materials, e.g. Oxoid d. Fill in the field asking whether your institute serves as a national reference laboratory e. In the comment field, report which antisera you think is required to complete your
serotyping, if relevant f. Click on ‘Save and go to next page’ – ALWAYS remember to save each page before
leaving it!
3) In the data entry page ‘Routinely used breakpoints’ a. Fill in the fields relative to the breakpoints used routinely in your laboratory to determine
the antimicrobial susceptibility category. Remember to use the operator keys in order to show – equal to (=), less than (<), less or equal to(≤), greater than (>) or greater than or equal to (≥).
4) In the data entry pages ‘Salmonella strains 1-8’, a. SELECT the serogroup (O-group) from the drop-down list, DO NOT WRITE – Wait a few
seconds – the page will automatically reload, so that the drop-down list in the field “Serotype” only contains serotypes belonging to the chosen serogroup.
b. SELECT the serotype from the drop-down list – DO NOT WRITE – wait a few seconds and you can enter the antigenic formula (e.g. 1,4,5,12:i:1,2)
c. Enter the zone diameters in mm or MIC values in µg/ml. Remember to use the operator keys to show e.g. equal to (=), etc.
d. Enter the interpretation as R (resistant), I (intermediate) or S (susceptible) e. If you performed confirmatory tests for ESBL production, select the appropriate result. f. If relevant, fill in the field related to comments (e.g. which antisera you miss for complete
serotyping) g. Click on ‘Save and go to next page’
If you did not perform these tests, please leave the fields empty
Appendix 4, page 8 of 9

WHO Collaborating Centre External Quality Assurance System (EQAS) 2017
Page 9 of 9 G00-06-001/23.06.2017
5) In the data entry page ‘E. coli reference strain’:a. Enter the zone diameters in mm or MIC values in µg/ml. Remember to use the operator
keys to show e.g. equal to (=), etc.b. Click on ‘Save and go to next page’
6) The next page is a menu that allows you to review the input pages and approve your input andfinally see and print the evaluated results
a. Browse through the input pages and make corrections if necessary. Remember to click on‘save and go to next page’ if you make any corrections.
b. Approve your input. Be sure that you have filled in all the results before approval, as .YOUCAN ONLY APPROVE ONCE!. The approval blocks your data entry into the interactivedatabase, but allows you to see the evaluated results.
c. As soon as you have approved your input, an evaluation report will appear.
7) After browsing all pages in the report, you will find a new menu. You can choose ‘EQAS 2017start page’, ‘Review evaluated results’ (a printer friendly version of the evaluation report is alsoavailable) or ‘Go to WHO GFN homepage’.
End of entering your data – thank you very much!
Appendix 4, page 9 of 9

WHO Collaborating Centre External Quality Assurance System (EQAS)
Subculture and Maintenance of QC strains G00-06-001/23.06.2017 Page 1 of 2
SUBCULTURE AND MAINTENANCE OF QUALITY CONTROL STRAINS 1 PURPOSE AND REFERENCES
Improper storage and repeated subculturing of bacteria can produce alterations in antimicrobial susceptibility test results. The Clinical and Laboratory Standards Institute (CLSI) has published guidelines for Quality Control (QC) stock culture maintenance to ensure consistent antimicrobial susceptibility test (AST) results.
The following can be regarded as a summary of information that should be followed for subculturing and maintaining QC-strains when performing AST by broth dilution methods. For full information related to this subject, the following standards are relevant: M100 (Performance Standards for Antimicrobial Susceptibility Testing) and M7 (Methods for Dilution Antimicrobial Susceptibility Test for Bacteria That Grow Aerobically; Approved Standard).
2 DEFINITION OF TERMS
Reference Culture: A reference culture is a microorganism preparation that is acquired from a culture type collection.
Reference Stock Culture: A reference stock culture is a microorganism preparation that is derived from a reference culture. Guidelines and standards outline how reference stock cultures must be processed and stored.
Working Stock Cultures: A working stock culture is growth derived from a reference stock culture. Guidelines and standards outline how working stock cultures must be processed and how often they can be subcultured.
Subcultures (Passages): A subculture is simply the transfer of established microorganism growth on media to fresh media. The subsequent growth on the fresh media constitutes a subculture or passage. Growing a reference culture or reference stock culture from its preserved status (frozen or lyophilized) is not a subculture. The preserved microorganism is not in a stage of established growth until it is thawed or hydrated and grown for the first time.
3 IMPORTANT CONSIDERATIONS
Do not use disc diffusion strains for MIC determination. Obtain QC strains from a reliable source such as ATCC. CLSI requires that QC be performed either on the same day or weekly (after QC-validation). Any changes in materials or procedure must be validated with QC before implemented For example: Agar and broth methods may give different QC ranges for drugs such as
glycopeptides, aminoglycosides and macrolides.
Appendix 5a, page 1 of 2
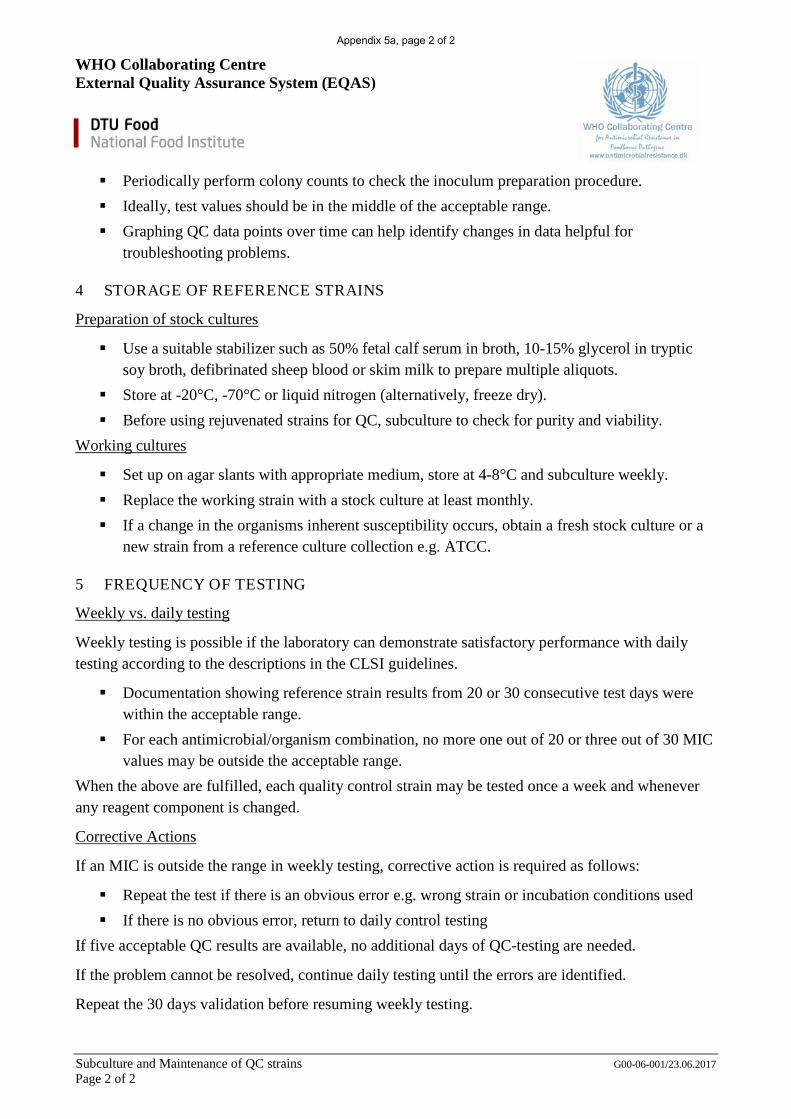
WHO Collaborating Centre External Quality Assurance System (EQAS)
Subculture and Maintenance of QC strains G00-06-001/23.06.2017 Page 2 of 2
Periodically perform colony counts to check the inoculum preparation procedure. Ideally, test values should be in the middle of the acceptable range. Graphing QC data points over time can help identify changes in data helpful for
troubleshooting problems.
4 STORAGE OF REFERENCE STRAINS
Preparation of stock cultures
Use a suitable stabilizer such as 50% fetal calf serum in broth, 10-15% glycerol in tryptic soy broth, defibrinated sheep blood or skim milk to prepare multiple aliquots.
Store at -20°C, -70°C or liquid nitrogen (alternatively, freeze dry). Before using rejuvenated strains for QC, subculture to check for purity and viability.
Working cultures
Set up on agar slants with appropriate medium, store at 4-8°C and subculture weekly. Replace the working strain with a stock culture at least monthly. If a change in the organisms inherent susceptibility occurs, obtain a fresh stock culture or a
new strain from a reference culture collection e.g. ATCC.
5 FREQUENCY OF TESTING
Weekly vs. daily testing
Weekly testing is possible if the laboratory can demonstrate satisfactory performance with daily testing according to the descriptions in the CLSI guidelines.
Documentation showing reference strain results from 20 or 30 consecutive test days were within the acceptable range.
For each antimicrobial/organism combination, no more one out of 20 or three out of 30 MIC values may be outside the acceptable range.
When the above are fulfilled, each quality control strain may be tested once a week and whenever any reagent component is changed.
Corrective Actions
If an MIC is outside the range in weekly testing, corrective action is required as follows:
Repeat the test if there is an obvious error e.g. wrong strain or incubation conditions used If there is no obvious error, return to daily control testing
If five acceptable QC results are available, no additional days of QC-testing are needed.
If the problem cannot be resolved, continue daily testing until the errors are identified.
Repeat the 30 days validation before resuming weekly testing.
Appendix 5a, page 2 of 2

WHO Collaborating Centre External Quality Assurance System (EQAS)
Instructions for Opening and Reviving Lyophilised Cultures G00-06-001/01.12.2014 Page 1 of 1
INSTRUCTIONS FOR OPENING AND REVIVING LYOPHILISED CULTURES
Instructions adjusted from Czech Collection of Microorganisms (CCM) document ’Instructions for Opening and Reviving of Freeze-Dried Bacteria and Fungi’ available on http://www.sci.muni.cz.
Lyophilised cultures are supplied in vacuum-sealed ampoules. Care should be taken in opening the ampoule. All instructions given below should be followed closely to ensure the safety of the person who opens the ampoule and to prevent contamination of the culture.
a. Check the number of the culture on the label inside the ampoule
b. Make a file cut on the ampoule near the middle of the plug (see Figure 1)
c. Disinfect the ampoule with alcohol-dampened gauze or alcohol-dampened cotton wool from just below the plug to the pointed end
d. Apply a red-hot glass rod to the file cut to crack the glass and allow air to enter slowly into the ampoule
e. Remove the pointed end of the ampoule into disinfectant
f. Add about 0.3 ml appropriate broth to the dried suspension using a sterile Pasteur pipette and mix carefully to avoid creating aerosols. Transfer the contents to one or more suitable solid and /or liquid media
g. Incubate the inoculated medium at appropriate conditions for several days
h. Autoclave or disinfect effectively the used Pasteur pipette, the plug and all the remains of the original ampoule before discarding
Notes:
Cultures should be grown on media and under conditions as recommended in the CCM catalogue (see http://www.sci.muni.cz)
Cultures may need at least one subculturing before they can be optimally used in experiments
Unopened ampoules should be kept in a dark and cool place!
Figure 1: from CCM document ’Instructions for Opening and Reviving of Freeze-Dried Bacteria and Fungi’ available on http://www.sci.muni.cz
Appendix 5b, page 1 of 1
National Food InstituteTechnical University of DenmarkKemitorvetBuilding 204DK - 2800 Kgs. Lyngby
Tel. 35 88 70 00Fax 35 88 70 01
www.food.dtu.dk
ISBN: 978-87-93565-38-8