the export exe'erience of developing...
TRANSCRIPT
QCPs3I
BAREND A. DE VRIES
THE EXPORT EXE'ERIENCEOF
DEVELOPING CC)UNTRIES
WORLD BANK STAFF OCCASIONAL PAPERS NUMBER THREE
INTERNATIONAL BANK FOR RECONSTRUCTION AND DEVELOPMENT
Pub
lic D
iscl
osur
e A
utho
rized
Pub
lic D
iscl
osur
e A
utho
rized
Pub
lic D
iscl
osur
e A
utho
rized
Pub
lic D
iscl
osur
e A
utho
rized


INTERNATIONAL BANK FOR RECONSTRUCTION AND DEVELOPMENT
WORLD BANK STAFF OCCASIONAL PAPERS NUMBER THREE

This paper may not be quoted as representing the viewof the Bank and affiliated organizations. They do not accept
responsibility for its accuracy or completeness.

|WBG
BAREND A. DE VRIES
EXPORT EXPERIENCES OFDEVELOPING COUNTRIES
Distributed by The Johns Hopkins PressBaltimore, Maryland

Copyright © 1967by International Bank for Reconstruction and DevelopmentManufactured in the United States of AmericaAll Rights ReservedLibrary of Congress Catalog Card Number 67-28912

FOREWORD
The benefits of research are greater the further they are spread.Because some of the work done within or for the Bank and itsaffiliated organizations may be useful to others who are engagedin the practice of sound economic development, we have decided topublish papers based on this work from time to time. Most of thepapers likely to be published will have an unashamed pragmaticbias, as indeed has the work of the development economist generally.While these papers are published by the Bank, their premises orconclusions are not necessarily accepted by the Bank either in prac-tice or theory; they are entirely the responsibility of the authors.We hope the papers may be a modest stimulus to further research,particularly in the troubled zone where theory meets real life.
November 15, 1967Washington, D.C.
George D. WoodsPresident
International Bank for Reconstruction and Development
v

TABLE OF CONTENTS
Preface ix
I. Introduction 3
II. Framework and Methods of Analysis 9
III. Export Variations 18Variations Relative to the World Market
and Group Averages 23Changes in Structure of Commodity Trade 26Countries Benefiting Most from Rapidly
Expanding Trade 29
IV. Statistical Analysis of Intercountry Differencesin Export Growth 33
V. Domestic Diversification Versus Export Diversification 43
VI. Conclusion 59Statistical Annex 65
TABLES1. Exports from 29 Developing Countries 182. Variations between 1950-53 and
1960-63 in Export Earnings 223. Estimated Variations in Earnings
from Major, Minor, and Total Exports,1960-63 Annual Averages 25
4. Estimated Variations in Minor Exports:Total, Manufactured Goods, and Other Goods 27
vii

5. Countries' Shares in Major ExportCommodity Markets, 1950-53 and 1960-63 28
6. Countries with Increasing Shares in Marketsfor "Buoyant" Major Export Commodities 31
7. Results of Regression Analysis 358. Averages of Trade Position Indices for
29 Developing Countries and Sharesof Major Exports in Total Exports 45
CHARTS1. Trade Position and Domestic Market Size, 1950-53 482. Trade Position and Domestic Market Size, 1960-63 49
STATISTICAL ANNEX
TablesI. Trade Position Index and Average World Market
Share, 29 Countries 66II. Major and Minor Exports, 1950-53 and 1960-63 68
III. Major Exports by Country, Quantity, and Value 69IV. Key Variables in Regression Analysis of
29 Developing Countries 81V. Export Growth Rates, Trade Position Indices, and
Domestic Price Changes 83VI. Grouping of 29 Countries by Characteristics Listed
in Table V 84VII. Consumption and Production of Crude Steel, 1963 85
VIII. Alternative Estimates of Variations inMinor Exports, 1960-63 86
Definitions:Dollars ($) are U.S. dollar equivalents, converted at current par
values.A billion is one thousand million.Averages are mean averages except where otherwise stated.
Notations:. not available-nil or negligible
viii

PREFACE
The World Bank is giving increasing attention to the economicperformance of developing countries, and to the policies which makefor the best utilization of scarce capital resources and for a soundpace and pattern of development. This study deals with a crucialaspect of economic performance-the growth and diversification ofexports and the relation between the export experience of variouscountries and their development policies.
The work originated in a desire to give empirical underpinningto the view that economic development strategy for small countrieshas often been quite different from that of big countries and thatthere may be some good reasons for these differences. The centraltheme became concerned with intercountry variations in the growthof exports since these are often a key element in the differences ingrowth patterns and strategies.
The author has had the benefit of comments on an earlier draftfrom several economists outside the Bank-particularly Harry G.Johnson and Michael Michaely-and from numerous colleagues,including John Adler, Attila Karaosmanoglu, and especially BelaBalassa and Gertrud Lovasy. Messrs. Alfred Conrad, ArabindaKundu, and J. C. Liu have collaborated in the regression analysis.Mrs. Feil, Miss Ryan, Mrs. Curcio, and Mr. Rangachar have alsoprovided assistance in various stages of the study.
November 15, 1967 Andrew M. KamarckDirector
Economics Department
ix
Editorial Commnittee
Barend J. de Vries, chairman
Bernard R. Bell Samuel LipkowitzManfred G. Blobel K. S. KrishnaswamyVinod Dubey K. N. RajHugh Latimer, editor C. H. Thompson
x

INTERNATIONAL BANK FOR RECONSTRUCTION AND DEVELOPMENT
WORLD BANK STAFF OCCASIONAL PAPERS NUMBER THREE

INTRODUCTION
The problems that developing countries face in expanding theirexports have been discussed intensively during the past two decades.The characteristics of demand and of supply of individual commodi-ties have been studied in great detail, and attention has been focusedon crucial policy issues. Among the many aspects that have beencovered are the slow growth of world demand for a large number ofcommodities which bulk large in exports of developing countries,the fluctuations in the volume of trade and in prices on importantcommodity markets, and the measures which might be taken todampen these fluctuations or to insulate or insure individualcountries against them. Currently, much analysis and debate con-cerns the measures which the industrial countries might take toincrease imports from the developing countries. In an arena whichis both economic and political, a considerable amount remains to bedone to formulate concrete measures for stabilizing commodityexports, to estimate the cost of such stabilization (and tacklerelated questions of differences in production costs among developingcountries), and to spell out in detail the actions and policies whichdeveloping countries might adopt to achieve a greater diversificationof exports.
3

Most of the discussions on commodity problems are concernedwith the total problem as it affects all developing countries, andwith the policy measures to be considered by the internationalcommunity or by such broad subgroups as the developing countriesand the industrial countries. By their very nature, the discussionsdo not deal with intercountry differences in the growth of exportsexcept in direct relation to exports of individual commodities. Yetthese differences have been very marked, ranging from absolutedeclines in export earnings to substantial increases over the past10-15 years. They are of central concern in the analysis and dis-cussion of what has come to be called development performance anddevelopment finance: the measurement of various elements of growthof poor countries, and the policies and financing needed to accelerateand sustain such growth. The present study analyzes the dimensionsof the differences and attempts to relate them to certain crucialcharacteristics of export supply and resource allocation policies indeveloping countries. In contrast to this study, which focuses onthe exports of the developing countries, the majority of studies madethus far of the problem analyzed here have concentrated on theexports of industrial countries.'
Variations in the growth of exports can, in part, be related to thedifferences in the growth of major consuming markets and todifferential access to these markets under preference arrangements(European Economic Community or Commonwealth) or to special
' See especially Helen B. Junz and Rudolf R. Rhomberg, "Prices and ExportPerformance of Industrial Countries, 1953-63," Staff Papers, International Mone-tary Fund, (July 1965) and the references quoted by them. Studies of variousaspects of the export performance of developing countries, and to which specificreference will be made in subsequent chapters, include Alfred Maizels, IndustrialGrowth and World Trade, (Cambridge, England, 1963), Chapter 5, and "Exportsand Economic Growth in the Overseas Sterling Area, 1960-61 to 1975," NationalInstitute Economic Review, (London, November 1966); Gertrud Lovasy, "Inflationand Exports in Primary Producing Countries," Staff Papers, IMF, (March 1962);"A Note on the Export Performance of Less-developed Countries," InternationalTrade, 1965, (The Contracting Parties to the General Agreement on Tariffs andTrade [GATT], Geneva, 1966), p. 23; and Van Doorn Ooms, Regionalization andExport Performance: X Study of Primary Commodities (unpublished Ph.D. thesis,Yale University, 1966). See also Alasdair G. Macbean, Export Instability andEconomic Development, (Cambridge, Mass., 1966).
4

commodity policies (such as the U.S. sugar legislation). The focusof this study, however, will be on the variations directly related todifferences in the growth of world exports of major commodities.But even after proper allowance has been made for these differences,the variations among countries remain striking. They exist despitethe fact that in exporting to the developed countries-their mostimportant customers-the developing countries must overcomecommon obstacles: sluggishness of demand for certain primaryproducts, various kinds of barriers against imports into industrialcountries, and difficulties of new entry into highly competitive anddeveloped markets. Numerous proposals for overcoming some ofthese obstacles have been made, in particular, that restrictions beliberalized and that tariffs on industrial products be lowered. How-ever, even if the proposals most favorable to the developing countrieswere to be adopted, experience suggests that different countrieswould continue to show marked variations in the growth of theirexports.
The differences in growth are of immediate relevance to the prob-lems of estimating the "trade gap" of the developing countries-atopic closely related to the estimation of the needs of these countriesfor external capital. Estimates have, on occasion, been arrived at byprojecting exports of major commodities and broad categories ofmanufactured products and comparing them with "needed" orlikely imports.2 This method gives one approximation of the magni-tude of development finance requirements, which must be consideredin conjunction with other estimates obtained by different ap-proaches. But global estimates of trade gaps conceal the differencesin the export growth of individual countries which may be caused bydifferent policies affecting the supply and prices of exports. Suchpolicies might affect the trade gaps of individual countries, and alsothe gap of all developing countries taken together.
Variations in export growth are part and parcel of developmentperformance. Among those who are actively working in economic
2 For example, see United Nations, World Economic Survey, 1963, Part II, Tradeand Development: Trends, Needs, and Policies; and Bela Balassa, Trade Prospectsfor Developing Countries, (Economic Growth Center, Yale University, 1964).
5

development, if not among theorists, there is little dispute that thegrowth of exports is an essential element of a healthy developmentprogram It enables poor countries to benefit from rapidly growingexternal markets and to overcome a slack caused by any slowdownin the growth of domestic markets. Participation of foreign interestsin rapidly growing export sectors may be instrumental in increasingthe flow and assimitlatton of technical and managerial know-hiow.An expansion of exports provides the resources to pay for the largerimports required by a successful development program, or for thedebts incurred to finance part of these requirements It is now gener-ally recognized that imports must rise as development proceeds,particularly if industrialization is to platy a strategic role Increasedindustrial output-either through better utilization of existingplants or by the start of new industries-often requires an increasein imports of raw materials and intermediate goods. Even where apolicy of import substitution has succeeded in suppressing imports,the lag in import growth behind output growth has often provedtemporary, if prolonged1 however, it may harm industrial expansionby imposing a limit on the supplies of new capital goods and rawmaterials Over the longer term, export growth is the only satis-factory solution to the problems posed by a high burden of debtincurred to finance development. Among the countries with theheaviest debt burdens are those countries well on their way toindustrialization An increase in their exports is of special impor-tance, both to mitigate the debt problem and to utilize the marketpotentials for manufactured goods
The relation between export growth and factors influencing exportsupply-an essential element in judging a country's developmentperformance-is not easily established with any precision Severalapproaches are possible. In this paper, the approach is to takecertain key characteristics of a country's policies and its exportposition, and attempt to relate them to cross-country variations inexport growth A basic assumption is that most developing countriesmust take the conditions of demand in the developed countries asgiven The conclusions reached by this method are necessarilytentative, also, they are limited because of shortcomings of the dataand statistical methods and because the analysis takes into account
6
only a few of the many factors on which policies are based. Theeffects on exports of alternative allocations of resources by sub-sector or project are nor explored in detail The study needs to besupplemented by time series analysis of individual countries, analysisof supply responses in individual industries, and analysis of theeffects on exports of aspects of policy other than those singledout here
Tl he conceptual framework and the methods followed in analyzingexport growth and performance are described in Chapter II. Empiri-cal findings are discussed in Chapters III and IV; Chapter Vexplores the interrelation and contrasts between opposite tradeand development strategies-a strategy with outward orientationin which domestic and export diversification are combined and astrategy with more exclusive reliance on domestic diversificationto the detriment of export growth

II
FRAMEWORK AND METHODS OF ANALYSIS
A change in the value and volume of exports of a country mustbe viewed in relation to the total market in order to obtain a clearpicture of the performance of one country relative to others. In theintercountry comparisons made in Chapter III, the growth of exportsis gauged by the changes of country shares in major commoditymarkets. The use of export shares as a basic measurement makes itpossible to avoid giving "bad marks" to those countries which havesuffered from deteriorating export prices and contracting or stag-nating markets.
A distinction is made between "major" exports and all otherexports, called "minor" exports.' Major exports include all com-modities which bulk large in the exports of at least some developingcountries. For most of these commodities, world markets are fairlywell organized. The market position of some developing countriesis a factor to be considered in judging the potentialities for expan-
I Major exports are all commodities including manufactures which accountedfor more than 5 percent of merchandise exports in 1950-63 of at least one of thecountries of the group. Minor exports are the remainder. See Chapter III, page 19for further definition.
9
sion of exports. The distinction made here between major and minorexports is somewhat different from the one usually employed incurrent discussions of trade policy, which divides exports into pri-mary commodities and manufactures. Major exports as defined hereinclude not only most primary commodities but also some manu-factured items, e.g. textiles.
Minor exports-a miscellaneous group of all items not includedin the major category-are by definition relatively small in theexport package of developing countries. The markets for these ex-ports are not well organized internationally, and few developingcountries have a dominant position in the trade of these commodi-ties. Items in this group, which include both manufactures andagricultural commodities, have widely varying market character-istics. In the statistical analysis, the growth of minor exports ismeasured by intercountry comparison of the value of this group inabsolute terms rather than in relation to world markets. One pointbrought out clearly is that minor exports account for most of thegrowth of exports of developing countries. The consensus in currentdiscussion is that this is likely to continue in the next decade and-recognizing a limit of say 3-4 percent to the annual growth ofprimary exports (even if international price stabilization measuresshould succeed more generally than heretofore)-the focus is onthe possible growth of exports of manufactures.2 In the presentpaper, the analysis of the variation in, and prospects for, the growthof exports is broadened to include not only new manufactures butalso new agricultural products (e.g. tomatoes from Mexico, tropicalfruit other than bananas, and mushrooms from Taiwan). The basicreason for doing so is the view that economic development is abroad process which affects all sectors of the economy and all stagesof production, and that, if successful in increasing output at com-
2 For recent examples, see UN Conference on Trade and Development(UNCTAD), Trade in Manufactures and Semi-Manufactures, (February 1964);GATT, Preference and Other Policy Measures to Stimulate Exports of Less-developedCountries, (Geneva, July 1966); and Hal B. Lary, Exports of Manufactures by theLess Developed Countries, (draft, National Bureau of Economic Research, Inc.,New York, June 1966).
10

petitive prices, it must produce a broad diversification of exportswhich is not necessarily confined to manufactured products.
In the search for possible explanatioNns of the variations in exportgrowth-as defined in this study-primary emphasis was given tothe initial trade position of a country and to the trade orientationof development policies. Among the countries studied, these factorsdiffered considerably.
A country's trade position can be measured simply by taking avalue-weighted average of that country's volume shares in majorexport commodity markets. In the short and medium run, thisposition is not under the control of many exporting countries.Differences in the trade positions of countries may help to explaindifferences in the growth of exports of major commodities, since thesize of a country's trade shares may restrain that country fromincreasing its exports. The freedom of opportunity that a countryhas in expanding exports without upsetting market prices variesinversely with the size of its share in the commodity markets. Thelarger a country's trade share, the greater is the chance that aproportionate increase in exports will upset the prevailing pricestructure, disturb the workings of an international commodity agree-ment, or call forth retaliation by competitors. It will be argued inChapter V that the trade position may influence the trade orienta-tion of a country's policies.
The trade orientation of a country's development policies is notas easily defined and measured as its trade position. Broadly speak-ing, a distinction can be made between development policies withinward and those with outward orientation.' The characteristics ofthese contrasting policies would seem relevant to the intercountrydifferences in export supply conditions and responses and, conse-
3See Barend A. de Vries, "The Importance of Economic Size for the Orientationof Monetary Policy in Developing Countries" in David Krivine (ed.), Fiscal andMonetary Problems in Developing States, Proceedings of the Third Rehovoth Con-ference, (Fred A. Praeger, New Y'ork, 1967); and D. B. Keesing, Outward LookingPolicies and Economic Development, (Columbia University International EconomicsWorkshop, May 1966).
11
quently, to the variations in export growth. With inward orientation,countries will strive to diversify and expand their industrial pro-duction, with primary emphasis on the domestic market, substitutingdomestic goods for a wide and growing range of imports. There aremany reasons and rationalizations for such a policy, includingsluggish external demand for primary exports, insulation againstexternal fluctuations, wartime shortages of manufactures, the drivetoward a more urban economy, and the presumed advantages-political or economic-of manufacturing over primary production.
The very essence of such a policy is not merely a stepping up ofindustrialization; it is interference with price relationships for thepurpose of forcing a change in production patterns. In many situa-tions, new investments are steered toward manufacturing and awayfrom agriculture. vFew countries following this policy have found itpossible to base investment decisions on a comparison between thecosts of additional imports and the earnings from additional exports.In situations where the resource cost of reducing, or not increasing,imports exceeds that of producing additional exports, import sub-stitution fosters an allocation of resources which does not maximizedomestic output (calculated at international prices)' and whichpenalizes exports. The penalty on exports may be effected in differentways. Usually the exchange rate, tariff, and restrictions policies willturn the internal terms of trade against the agricultural or mineralsectors (which often are the main export suppliers). 4 In the monetarysphere, the country will tend to assign only secondary importanceto international price competitiveness; consequently, when indus-trialization is accompanied by inflation, the country will be slow inadjusting its exchange rate.
Countries with the opposite policy-outward orientation-will,in their choice of new lines of production and the management of
4See Harry G. Johnson, "Tariffs and Economic Development," Journal ofDevelopment Studies, (October 1965); John H. Power, Import Substitution as anIndustrialization Strategy, Society for International Development, 1966 WorldConference Proceedings; and Michael Bruno, The Optimal Selection of Export-Promoting and Import-Substituting Projects, UN First Interregional Seminar onDevelopment Planning, (September 1965).
12
domestic prices, place greater, if not primary, importance on theprospects for exports and the maintenance of a competitive pricelevel. Given the political, as well as technical, difficulties of frequentexchange rate adjustments, they will seek to maintain domesticprice stability. More often than not, these countries will avoid heavyindustrialization at the expense of agriculture and other primaryproduction. Several countries that have adopted an outward orienta-tion policy have achieved a marked increase in agricultural and
mineral exports. When domestic price pressures do develop, thesecountries will tend to adjust their exchange rates more quickly thanwill countries with inward orientation.
There are, of course, many variations in policies among countries,and no classification can be clear-cut at a given moment or for anindividual country over a period of time. Yet the combination of
industrialization, domestic financial, exchange rate, and protectionpolicies suggests that some countries, such as Brazil and Argentina,have had a predominantly inward orientation during much of thepostwar period. And many smaller countries-with a greater degreeof monetary stability, less emphasis on industrialization oriented
toward their domestic markets, and more emphasis on agricultureand mineral production for export-have had a predominantly out-ward orientation. Some smaller countries with outward orientationare industrializing without building a heavy industry complex andare experiencing a rapid increase in exports of manufactures.
The contrast between inward and outward policy orientationextends to financial and commercial policies as well as to resourceallocation and public expenditure policies. Financial policies covergeneral fiscal, credit, and balance of payments management, andaffect the level of development expenditures, the competitivenessof exports, and the degree of protection. Resource allocation policiesenable the government to give special emphasis to individualsectors through the composition of development expenditures,selective credit measures, price supports and such nonfinancial mea-sures as special training and technical help. Both types of policy
have implications for the pattern of development, e.g. the encourage-ment of individual sectors, such as heavy industry as against
13
agriculture. Emphasis on sectors with an early export potential andthe resulting increase in productive capacity on the margin isclearly essential to the strengthening of a country's basic exportcapability and subsequent performance. Given the production pat-tern prevailing at a certain time, exports can be fostered throughspecial and general incentives-the exchange rate, fiscal rebates,subsidies, etc. On the other hand, if maintained over a longer period,these measures will tend to influence the country's productivecapacity. The pattern of production will determine the country'sbasic export position.
It has not been possible to identify inward and outward orienta-tion with precise statistical measurements. It has, however, beenpossible to use statistical indicators-e.g. price and productionindices-to gauge certain major characteristics of developmentpolicies, particularly those bearing on trade orientation and exportperformance. For example, in the intercountry comparisons of pricemovements relevant for exports, use has been made both of thegeneral price level in terms of domestic currency and of its equivalentin dollars (in order to allow for the effect of exchange rate adjust-ments). Comparisons of production growth have been extended toagriculture and manufacturing. A combination of steady priceinflation and rapid increase in heavy manufacturing output willoften indicate inward orientation. Conversely, a relatively high rateof agricultural growth and price stability may be indicative of out-ward orientation. However, in designating a country's policy ashaving an outward or inward orientation, factors other than thosecovered by the statistical indicators have to be taken into account.
Steady inflation will, of course, normally turn price incentivesagainst exports and may increase domestic consumption, often atthe expense of the supply of exports (particularly of foodstuffs andfibers). The adverse impact on export supply schedules can becounteracted temporarily by exchange rate adjustment. Persistentinflation, however, requires an almost continuous process of ex-change rate correction, which is seldom achieved in practice. Priceinflation should, of course, not be confused with noncompetitiveprices which may prevail even under stable conditions. Steady price
14

rises are taken as symptomatic of domestic pressures against ex-ports. At times, these pressures may be offset by rapid improvementsin productivity and exchange rate adjustments.
Changes in the production pattern, as measured by the relativegrowth of agriculture and manufacturing, may be indicative of thetrade orientation of a country's policies and hence help to explaindifferences in exports. More directly, the addition to agriculturalproduction made possible by the application of modern methods(increasing output per acre for instance) will generally be competi-tive, and the greater productivity will extend to the output ofcommodities in which the country already has export connections.In measuring the relative growth of agriculture, output totals them-selves are inadequate; they need to be read against populationincrease and/or the demand for more and better foods associatedwith urbanization and higher living standards.
The possible effects that a rapid growth of manufacturing outputmay have on exports are highly controversial in developmenteconomics.5 The adverse effects which policies of import substitutioncan have on exports in general have been mentioned above. Inaddition, given the lead of developed industrial countries over thedeveloping countries, industrialization will, initially, pay off slowlyin the form of export growth, even under free trade and exchangepolicies. This is especially true of industrialization programs withemphasis on heavy industry or on industries which require a con-siderable volume of output to become competitive. Once an indus-trial base has been established (e.g. as reflected in the scale anddiversification of production and the availability of managerial andtechnical skills), an appropriate orientation policy may, if main-tained over a long period of time, lead to a relatively rapid increasein exports of manufactures. For many countries, however, indus-trialization is often an integral part of the development program,along with improvement in employment opportunities, educationand training, and the growth of urban areas. The very success ofindustrialization in terms of higher living standards will entailhigher consumption by the growing industrial-urban population,
See, for example, Alfred Maizels, Industrial Growth.
15
part of which may need to be satisfied by an expansion of imports.At the same time, new industrial production will increase demandfor raw materials and intermediate goods which will need to besatisfied by new imports or by a reduction of traditional exports,especially of primary products.' Such a reduction in primary exportsmay be most marked in large countries where the size of the domesticmarket makes possible large-scale production, which in turn shouldhold promise for lowering costs and for exports of industrial goods.The acid test of success in industrial development is whether anincrease in exports of manufactures will compensate for the declinein primary exports.
In the comparisons among countries made here, the trade positionsat the start of the period under study and changes in other variableshave been related to the differences in export growth. The vari-ables have been taken as indicative of the supply conditions in theexporting countries. With the exception of the trade positions,the changes in these variables are essentially a reflection of differ-ences in policies and as such are largely subject to the control of theexporting countries.
Other factors that affect the exports of the developing countriesare the basic economic variables of consuming countries, e.g. income,output of industries utilizing the products of the developing coun-tries, and prices (and availability) of substitutes for the importedraw materials. Demand is also affected by changes in preferentialarrangements, import restrictions, and customs duties imposed byconsuming countries.
Variations in conditions of the developed consumer countries affectthe developing exporting countries in different ways. Total demand(and exports) of individual commodities move in varying degreesbecause consumption differs among importing countries and demand
I A clear-cut case is Mexico where domestic industrial demand has reduced thesupply of minerals for export. These are aspects of the structural and transitionalshifts which, according to some economists, make necessary a large influx of externalassistance in the development process. See for example, H. B. Chenery and A. M.Strout, "Foreign Assistance and Economic Development," American EconomicReview, (September 1966).
16

parameters (e.g. income and price elasticities) also differ. Moreover,a relaxation of trade barriers against primary imports by developedcountries is bound to affect individual commodities differently, evenif the relaxation is undertaken in a concerted, nondiscriminatorymanner.7 However, it is assumed here that the changes in com-modity trade shares caused by shifts in demand are determined bythe differences in supply conditions in the exporting country. Putin another way: if the supply parameters of the producing countriesare the same, the assumption is that the countries' shares in com-modity markets will not be affected by a shift in demand. This isclearly a simplifying assumption in that it abstracts from the effectwhich different growth rates in developed countries may have onthe trade shares of the developing countries as a result of the existinggeographic trade pattern as well as such factors as regional ties,preferential arrangements, and transportation. However, as ex-plained in Chapter IV, specific allowance for regional demand wouldnot change the conclusions of the study.
The analysis is, in the first instance, focused on the question ofhow a country's exports in recent years have fared relative to worldmarkets. However, there is no denying that demand for some com-modities increased much faster than for others. Countries whichmaintained their shares in rapidly growing markets obviously didmuch better than those whose markets were stagnant. Thus a ques-tion to be explored is why some countries were more successful thanothers in capturing a share of the more buoyant markets-whetherfinancial and development policies or just plain luck made thedifference.
' The effect of present barriers varies greatly with the commodities concerned.See UNCTAD, Policy Impediments 4ffecting Primary Commodity Imports intoMajor Industrial Countries (National Commoditv Problems): Proceedings, Vol. III,(1964); D. Gale Johnson, "Agriculture and Foreign Economic Policy," Journal ofFarm Economics, (December 1964); Harry G. Johnson, "Sugar Protectionism andthe Export Earnings of Less-Developed Countries: Variations on a Theme byR. H. Snape," Economica, (February 1966); Alfred Maizels, Alternative FiscalPolicies for Tropical Export Products (to be published under FAO Special StudiesProgram). In a review of the estimates in these studies of the effect of the relaxationof trade barriers, G. Lovasy concludes that sugar exports would benefit the most;see Effects on Developing Countries' Exports of Reducing Trade Barriers to PrimaryProducts: Critical Survey of Recent Estimates, (International Bank for Reconstruc-tion and Development, January 31, 1967).
17
III
EXPORT VARIATIONS
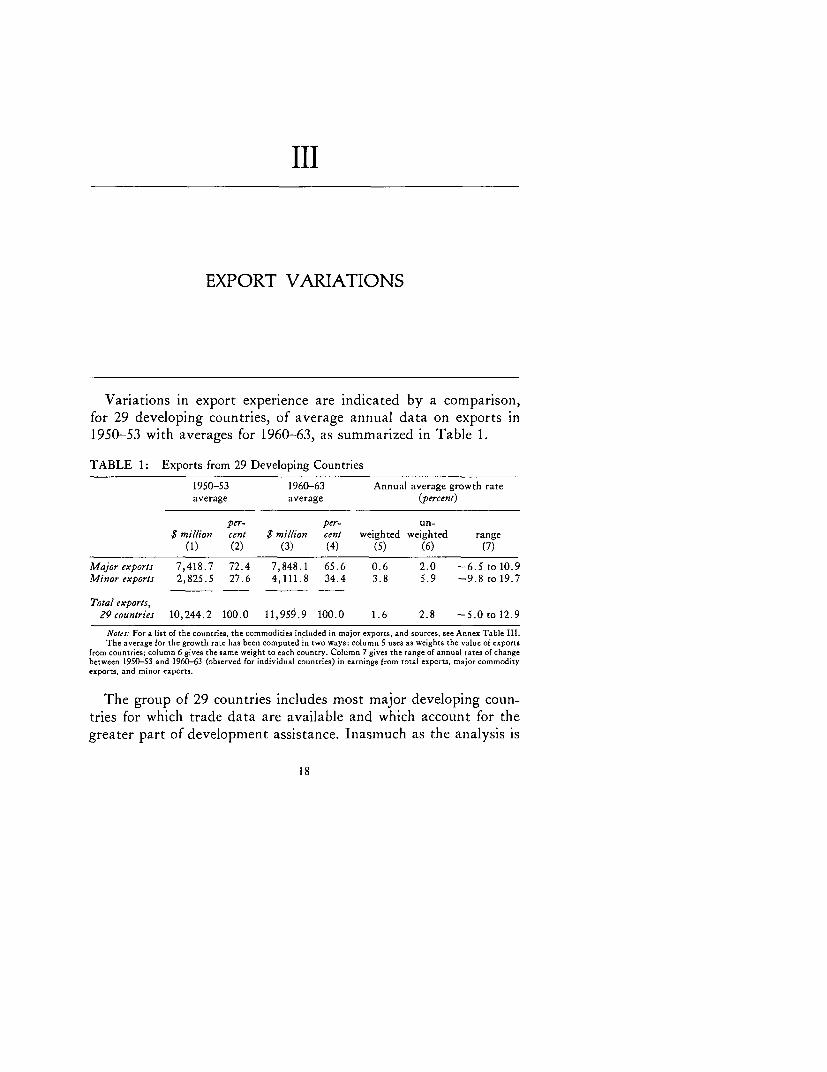
Variations in export experience are indicated by a comparison,for 29 developing countries, of average annual data on exports in1950-53 with averages for 1960-63, as summarized in Table 1.
TABLE 1: Exports from 29 Developing Countries
1950-53 1960-63 Annual average growth rateaverage average (percent)
per- per- un-$ million cent $ million cent weighted weighted range
(1) (2) (3) (4) (5) (6) (7)
Major exports 7,418.7 72.4 7,848.1 65.6 0.6 2.0 -6.5tolO.9Minor exports 2,825.5 27.6 4,111.8 34.4 3.8 5.9 -9.8 to 19.7
Total exports,29 countries 10,244.2 100.0 11,959.9 100.0 1.6 2.8 -5.0 to 12.9
Noses: For a list of the countries, the commodities included in major exports, and sources, see Annex Table 111.The average for the growth rate has been computed in two ways: column 5 uses as weights the value of exports
from countries; column 6 gives the same weight to each country. Column 7 gives the range of annual rates of changebetween 1950-53 and 1960-63 (observed for individual countries) in earnings from total exports, major commodityexports, and minor exports.
The group of 29 countries includes most major developing coun-tries for which trade data are available and which account for thegreater part of development assistance. Inasmuch as the analysis is
18
focused on intercountry differences and is not an assessment ofexport performance of all developing countries taken together, noattempt has been made to give the principal developing regionsequal representation in the group of countries studied. Majorpetroleum exporters (e.g. Venezuela and Iran) are excluded, thuslimiting the investigation to export differences other than thoseresulting from the petroleum bonanza.'
The difference in the economic conditions which face "major"and "minor" exports has been set forth in Chapter II. For thestatistical analysis, major exports include all commodities whichaccounted for more than 5 percent of merchandise exports in 1950-63of at least one of the countries in the group.2
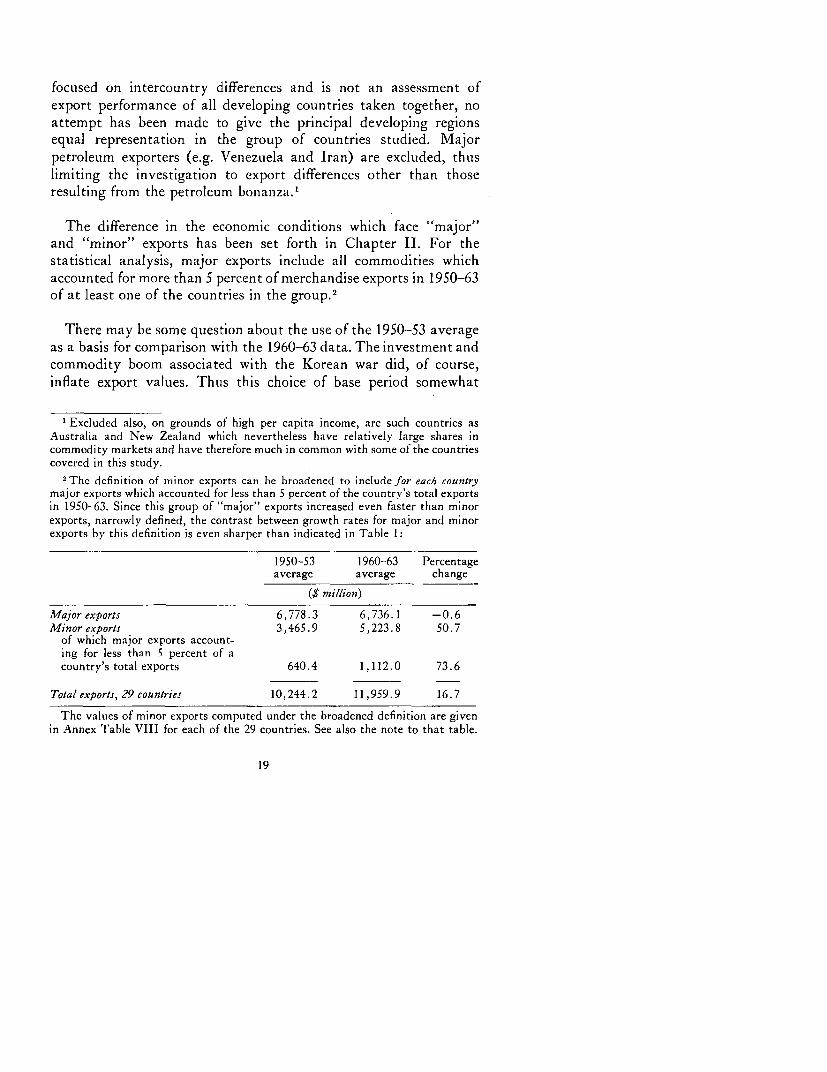
There may be some question about the use of the 1950-53 averageas a basis for comparison with the 1960-63 data. The investment andcommodity boom associated with the Korean war did, of course,inflate export values. Thus this choice of base period somewhat
I Excluded also, on grounds of high per capita income, are such countries asAustralia and New Zealand which nevertheless have relatively large shares incommodity markets and have therefore much in common with some of the countriescovered in this study.
2The definition of minor exports can be broadened to include for each countrymajor exports which accounted for less than 5 percent of the country's total exportsin 1950-63. Since this group of "major" exports increased even faster than minorexports, narrowly defined, the contrast between growth rates for major and minorexports by this definition is even sharper than indicated in Table 1:
1950-53 1960-63 Percentageaverage average change
($ mi/lion)
Major exports 6,778.3 6,736.1 -0.6Minor exports 3,465.9 5,223.8 50.7
of which major exports account-ing for less than 5 percent of acountry's total exports 640.4 1,112.0 73.6
Total exports, 29 countries 10,244.2 11,959.9 16.7
The values of minor exports computed under the broadened definition are givenin Annex Table VIII for each of the 29 countries. See also the note to that table.
19

suppresses the growth rates in subsequent years. It may also affectthe differences in growth rates among countries to the extent thatsome countries managed more rapidly to increase supplies of certainexports in the base period and as a result found it difficult to improvefurther upon their export position in subsequent years.' However,this is possible for almost any base period. It is felt that a shiftin the base period, say to the mid-fifties, would not materiallyaffect the conclusions of the analysis. Earlier years were not chosenfor a base period since comparison of 1960-63 data with those for theyears prior to World War II or the immediate postwar years is lessrelevant. The ten-year period for which cross-country comparisonsare made seems long enough for certain financial and resource alloca-tion policies, pursued over the period, to have had an effect on thegrowth of exports. For example, the impact of heavy industrializa-tion accompanied by considerable price inflation, or emphasis onagricultural development and international price competitiveness,should be noticeable within the span of a decade.
Considerable differences in the growth of exports are noted whenthe countries are grouped by their position in international trade,size of domestic market, and degree of price inflation. The com-modity composition of exports is a further factor influencing thedifferences in export growth (see the next subsection).
A country's position in international trade depends on its sharein world markets for its major exports and the relative importanceof major exports and of minor exports in its total exports. Thisposition is measured here by an index (W) which is the weightedaverage of a country's shares in the markets of its major exportcommodities, the weights being the proportion of these exportsin the country's total exports. In calculating the index, it is assumedthat developing countries have a negligible share in the world
3 The choice of the base period may also affect the comparison of growth ratesof major and minor exports since the Korean war boom had a greater impact onexports of major commodities. When 1952-53 is used as a base, the growth in theten-year period to 1962-63 amounted to 11.6 percent for major exports and to66.2 percent for minor exports, compared with 6.0 percent and 45.5 percent re-spectively, in Table 1.
20

markets for items included under "minor exports." 4 The trade posi-tion index ranges between a country's simple export share (i.e. itsexports as a percentage of total world exports) and 100 (the indexobtained when a country is the world's sole exporter of the com-modities that it exports). The index varies positively with the pro-portion of major commodities in a country's exports and the shareof these exports in world markets. More generally, the index reflectsthe total amount of a country's exports, the extent to which itsexports are concentrated on a few commodities, and total inter-national trade in these few commodities.'
For grouping countries into "small" and "large" ones, the bench-mark was chosen at $4 billion equivalent of gross domestic productin 1963. This choice of a benchmark is somewhat arbitrary andrequires qualifications which are discussed in Chapter V. It isinteresting that this benchmark is equivalent to a domestic marketfor steel exceeding 400,000 tons.6 The steel industry has a strategicplace in the development of heavy and complex manufacturingindustry.7 A domestic market large enough to provide a base for
4 In this respect, the trade position index is different from Michaely's commodityweighted export share index. See Michael Michaely, Concentration in InternationalTrade, (Amsterdam, 1962).
6 For example, in the period 1950-53, the Philippines had 85.92 percent of theworld export market for abaca, 5.49 percent of the market for raw sugar, 34.14percent of the market for tropical hardwood, and 16.67 percent of the market foredible vegetable oils. Multiply these percentages by the proportion they bore toPhilippine exports (respectively 12.54 percent, 19.7 percent, 5.06 percent, and44.97 percent), add the total and multiply by 100 (to counteract the effect ofmultiplying a percentage by a percentage) and the trade position index of thePhilippines emerges as 21.1 approximately.
These major exports accounted for 82.27 percent in value of the Philippines'export trade in this period. If this percentage is used as a divisor to the trade index,the weighted average of the Philippines' major export shares is obtained, 25.62percent (see p. 75 below). For 1960-63, the weighting used is the same as for1950-53.
G See Annex Table VII. Chile is an exception since it had steel consumption over400,000 tons and a GDP slightly below $4 billion.
I Heavy industry, such as machinery, steel and transport equipment, is definedhere as industry requiring substantial capital outlays and need not be capitalintensive (as against labor intensive). Of course, some heavy industry (e.g. ma-chinery) may be labor intensive.
21
efficient steel production is significant in the economic developmentof individual countries.8
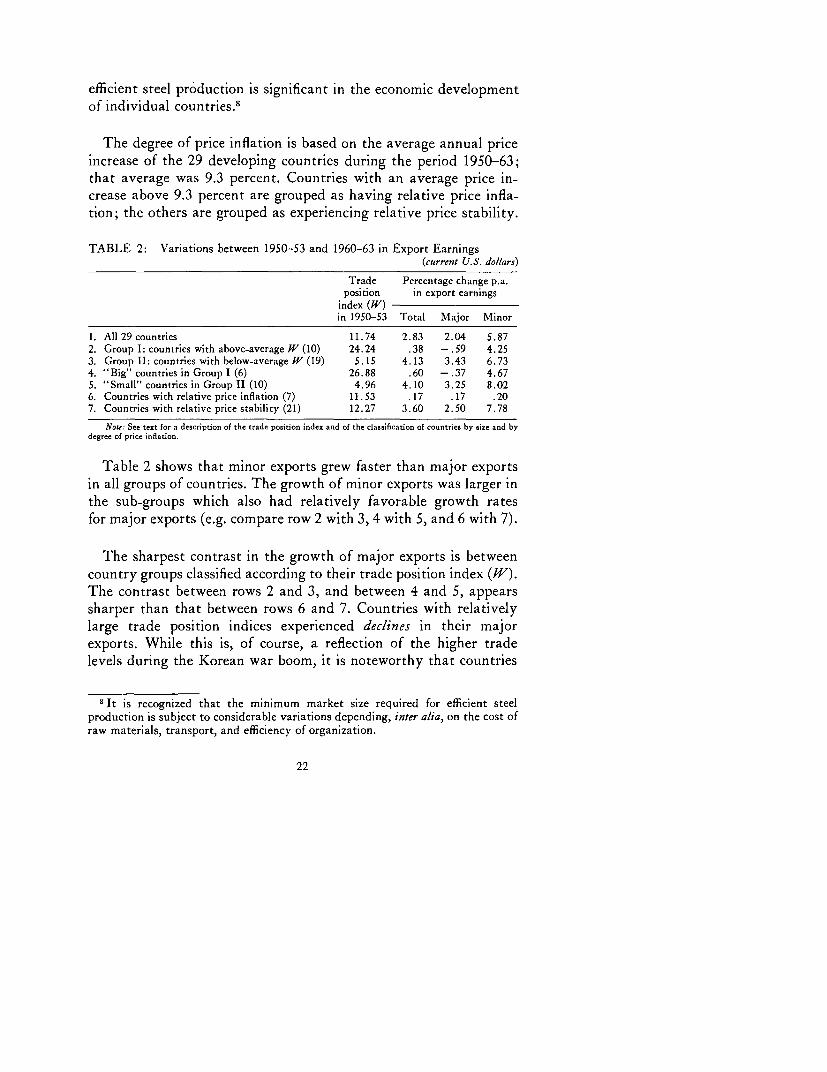
The degree of price inflation is based on the average annual priceincrease of the 29 developing countries during the period 1950-63;that average was 9.3 percent. Countries with an average price in-crease above 9.3 percent are grouped as having relative price infla-tion; the others are grouped as experiencing relative price stability.
TABLE 2: Variations between 1950-53 and 1960-63 in Export Earnings(current U.S. dollars)
Trade Percentage change p.a.position in export earnings
index (W)in 1950-53 Total Major Minor
1. All 29 countries 11.74 2.83 2.04 5.872. Group I: countries with above-average W (10) 24.24 .38 -. 59 4.253. Group ll: countries with below-average W (19) 5.15 4.13 3.43 6.734. "Big" countries in Group 1 (6) 26.88 .60 -. 37 4.675. "Small" countries in Group 11 (10) 4.96 4.10 3.25 8.026. Countries with relative price inflation (7) 11.53 .17 .17 .207. Countries with relative price stability (21) 12.27 3.60 2.50 7.78
Note: See text for a description of the trade position index and of the classification of countries by size and bydegree of price inflation.
Table 2 shows that minor exports grew faster than major exportsin all groups of countries. The growth of minor exports was larger inthe sub-groups which also had relatively favorable growth ratesfor major exports (e.g. compare row 2 with 3, 4 with 5, and 6 with 7).
The sharpest contrast in the growth of major exports is betweencountry groups classified according to their trade position index (W).The contrast between rows 2 and 3, and between 4 and 5, appearssharper than that between rows 6 and 7. Countries with relativelylarge trade position indices experienced declines in their majorexports. While this is, of course, a reflection of the higher tradelevels during the Korean war boom, it is noteworthy that countries
8 It is recognized that the minimum market size required for efficient steelproduction is subject to considerable variations depending, inter alia, on the cost ofraw materials, transport, and efficiency of organization.
22

with small trade position indices experienced growth averaging 3.4percent per annum beyond the Korean war levels.
Comparison of countries grouped by domestic price behavior sug-gests that minor exports clearly did better in countries with relativeprice stability (compare rows 6 and 7). The contrast is sharper thanthat observed for minor exports in countries grouped by their tradeposition index (rows 2 and 3). Major exports also fared betterwhere there was price stability, but the contrast is not as sharp asthat for minor exports. The countries with above-average priceincreases had trade position indices somewhat below those of coun-tries with greater price stability.
It thus is necessary to disentangle further the effects of tradeposition and domestic price behavior. This has been done throughregression analysis, discussed in the next chapter. It will be shownthere that favorable performance of exports of major commoditiesin the period studied was associated more with the size of the marketshare at the start of the period than with domestic price stability.
Variations Relative to the World Market and Group Averages
It can, of course, be argued that variations in earnings from majorexports are caused, to a large extent, by the movements-both involume and in price-in world markets; because of the differingcompositions of exports, these movements affect countries in dif-ferent ways. A relatively simple way to calculate export growthdifferences other than those caused by market movements is tocompare the difference between a country's actual earnings frommajor exports in 1960-63 and what the earnings would have beenif the country's shares in its principal commodity markets in1960-63 had been the same as in 1950-53. This difference, DC, isshown in Table 3. A cross-country comparison of D. reveals howcountries' exports have fared relative to world market trends inmajor export commodities. The variations in D. are striking: from ashortfall of $232 million for Brazil and $187 million for India to anexcess of $178 million for Peru; or as a percentage of annual averagesin 1960-63 of major exports of each country, from shortfalls of 65
23
percent for Pakistan and 62 percent for Honduras to excesses of41 percent for Nicaragua and 45 percent for Peru.9
To compare the growth of minor exports, a less refined gauge isused: deviations from the group average of the growth rate forminor exports. Thus to supplement Dc is Di,m the difference betweena country's annual earnings from minor exports in 1960-63 andthe earnings that would have been attained if the country's minorexports had grown at the rate achieved by the minor exports of 29countries taken together-5.9 percent p.a. Here again, remarkabledifferences are noted: they vary from shortfalls of $300 million forArgentina (a shortfall of 67 percent from the actual 1960-63 aver-age for Argentina), $124 million for India (-16 percent), and $100million (-80 percent) for Chile, to excesses of $86 million (74 per-cent) for Taiwan, $98 million (61 percent) for Thailand, and $126million (26 percent) for Mexico.
Based on Dc and Di, a yardstick, D (the sum of D, and Di), isobtained for comparing the growth of total exports.
In Table 3, the grouping of countries depends on the directionof change of D, and Di. The strongest category is I: countries whichimproved their market shares of major exports and, at the sametime, had above-average growth in minor exports. Malaysia,Mexico, Peru, and Taiwan are among the countries in this category.The weakest category is III: countries whose shares of majorexports deteriorated and which had below-average growth of minorexports. In this category are Argentina, Chile, India, and Uruguay.In Category II are several countries which, although lagging behindworld markets in their major exports, nevertheless made above-average gains in minor exports. Most of the countries in this cate-gory had a trade position index in 1950-53 that was above average-
' A similar approach has been followed in "A Note on the Export Performance ofLess-developed Countries," International Trade, 1965, and in A. Maizels, "Exportsand Economic Growth in the Overseas Sterling Area," National Institute EconomicReview, (November, 1966). For a comparable analysis of exports of developedcountries see Helen B. Junz and Rudolf R. Rhomberg, "Prices and Export Per-formance."
24
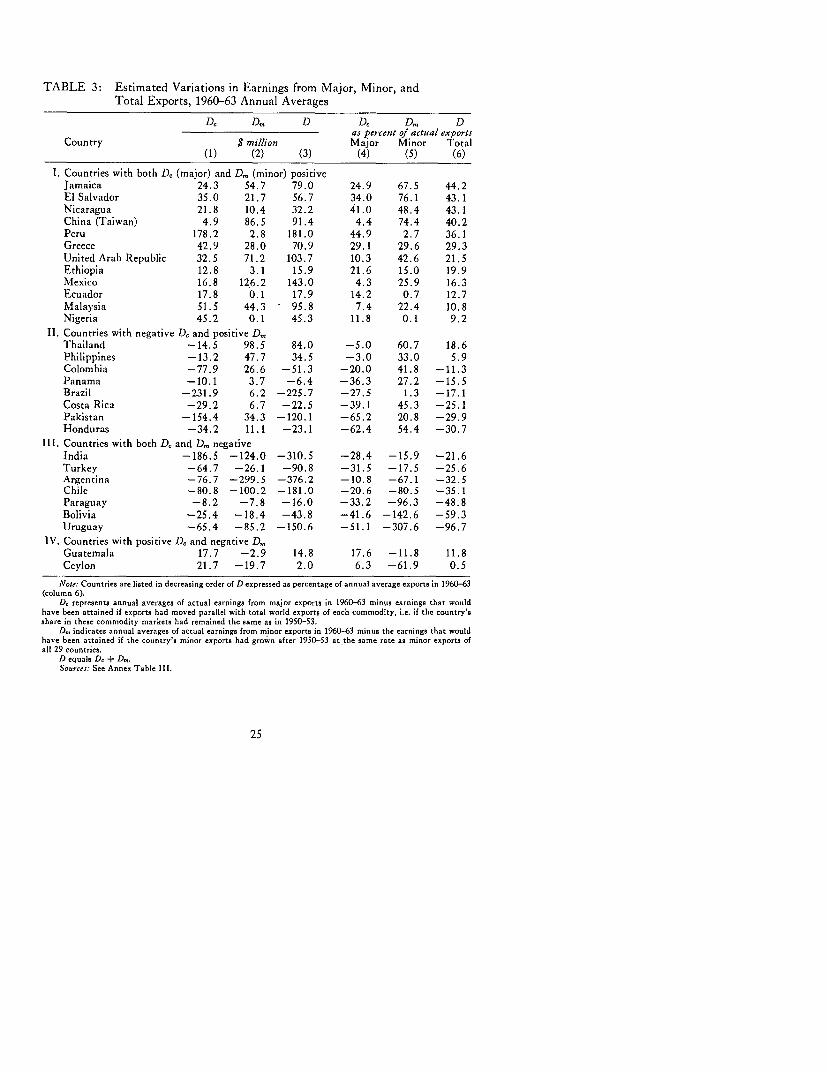
TABLE 3: Estimated Variations in Earnings from Major, Minor, andTotal Exports, 1960-63 Annual Averages
Dc D,, D Dc D. Das percent of actual exports
Country $ million Major Minor Total(1) (2) (3) (4) (5) (6)
1. Countries with both D, (major) and D. (minor) positiveJamaica 24.3 54.7 79.0 24.9 67.5 44.2El Salvador 35.0 21.7 56.7 34.0 76.1 43.1Nicaragua 21.8 10.4 32.2 4i.0 48.4 43.1China (Taiwan) 4.9 86.5 91.4 4.4 74.4 40.2Peru 178.2 2.8 181.0 44.9 2.7 36.1Greece 42.9 28.0 70.9 29.1 29.6 29.3United Arab Republic 32.5 71.2 103.7 10.3 42.6 21.5Ethiopia 12.8 3.1 15.9 21.6 15.0 19.9Mexico 16.8 126.2 143.0 4.3 25.9 16.3Ecuador 17.8 0.1 17.9 14.2 0.7 12.7Malaysia 51.5 44.3 95.8 7.4 22.4 10.8Nigeria 45.2 0.1 45.3 11.8 0.1 9.2
II. Countries with negative Dc and positive D.Thailand -14.5 98.5 84.0 -5.0 60.7 18.6Philippines -13.2 47.7 34.5 -3.0 33.0 5.9Colombia -77.9 26.6 -51.3 -20.0 41.8 -11.3Panama -10.1 3.7 -6.4 -36.3 27.2 -15.5Brazil -231.9 6.2 -225.7 -27.5 1.3 -17.1Costa Rica -29.2 6.7 -22.5 -39.1 45.3 -25.1Pakistan -154.4 34.3 -120.1 -65.2 20.8 -29.9Honduras -34.2 11.1 -23.1 -62.4 54.4 -30.7
III. Countries with both Dc and D. negativeIndia -186.5 -124.0 -310.5 -28.4 -15.9 -21.6Turkey -64.7 -26.1 -90.8 -31.5 -17.5 -25.6Argentina -76.7 -299.5 -376.2 -10.8 -67.1 -32.5Chile -80.8 -100.2 -181.0 -20.6 -80.5 -35.1Paraguay -8.2 -7.8 -16.0 -33.2 -96.3 -48.8Bolivia -25.4 -18.4 -43.8 -41.6 -142.6 -59.3Uruguay -65.4 -85.2 -150.6 -51.1 -307.6 -96.7
IV. Countries with positive Dc and negative D.Guatemala 17.7 -2.9 14.8 17.6 -11.8 11.8Ceylon 21.7 -19.7 2.0 6.3 -61.9 0.5
Note: Countries are listed in decreasing order of D expressed as percentage of annual average exports in 1960-63(column 6).
Dt represents annual averages of actual earnings from major exports in 1960-63 minus earnings that wouldhave been attained if exports had moved parallel with total world exports of each commodity, i.e. if the country'sshare in these commodity markets had remained the same as in 1950-53.
D. indicates annual averages of actual earnings from minor exports in 1960-63 minus the earnings that wouldhave been attained if the country's minor exports had growrn after 1950-53 at the same rate as minor exports ofall 29 countries.
D equals De + D,s.Sources: See Annex Table 111.
25
suggesting an obstacle to expansion of major exports; however, theysucceeded in overcoming at least part of their export problemthrough an expansion of minor exports. Annex Table VIII showsthe Dm calculated for both the "narrow" and "broad" definition ofminor exports (see footnote 2 of this chapter). There is a high rankcorrelation between these two Dm series (0.92).
It has been possible to separate minor exports (Di) into manu-factured (D,) and other (D2) goods. A comparison of these twocategories brings out sharp variations in growth rates, as shown inTable 4. Several countries with growth rates that were aboveaverage for exports of manufactured goods showed below-averagegrowth for non-manufactured goods, and vice versa. The datashow that, for a majority of countries with above-average per-formance in minor exports, growth was concentrated in categoriesother than manufactured goods. For example, of the countrieswhose Dm was more than 40 percent of annual average exports in1962-63, export growth for manufactured goods exceeded that ofnon-manufactures for two (Jamaica and Taiwan), but the reversewas true for six (El Salvador, Honduras, Panama, Colombia, theUnited Arab Republic, and Ecuador).
Changes in Structure of Commodity Trade
The market share for each country may be computed as the aver-age of its quantitative shares in markets for its major exports,weighted by their value in 1950-53. On this basis, Table 5divides countries into those with small (below-average) shares in1950-53 and those with large (above-average) shares. As shownin the table, substantial shifts occurred in the structure of com-modity trade during the period studied. The positions of countrieswith relatively large shares in commodity markets tended todeteriorate and, conversely, the positions of the smaller traderstended to improve.
In this context, it is meaningful to distinguish between commodi-ties exported mostly by the developing countries (A-commodities)and commodities exported by the developing countries in competi-
26

TABLE 4: Estimated Variations in Minor Exports:Total, Manufactured Goods, and Other Goods,(1962-63 Annual Averages)
D. D, D2 D. D, D2($ million) as percent of 1962-63 exports
Manu-Total factures Others
(1) (2) (3) (4) (5) (6)
Countries for which column 5 (manufactures) > column 6 (other)China (Taiwan) 129.5 93.4 35.5 79.5 89.9 60.1Jamaica 51.2 12.6 41.3 60.4 91.6 58.2Costa Rica 3.8 2.0 2.6 26.8 74.1 22.0Philippines 17.7 28.8 -0.0 12.4 94.6 -0.0Brazil -1.6 15.3 18.4 -0.3 38.7 4.3Peru -14.0 26.2 -50.9 -13.0 29.7 -262.3India -151.9 192.4 -290.8 -18.1 64.1 -54.0Nigeria -20.6 21.6 -33.2 -20.4 77.5 -45.4Bolivia -27.1 -9.2 -19.5 -216.4 -156.6 -295.3Uruguay -105.8 -45.1 -73.0 -341.2 -175.5 -1376.8
Countries for which column 5 < column 6El Salvador 26.2 5.4 18.3 75.9 37.4 91.7Honduras 13.5 -7.0 18.0 55.9 -37.4 83.9Panama 11.2 -2.7 13.9 49.0 -910.0 61.8Colombia 28.3 2.7 24.9 41.3 17.8 46.7United Arab Republic 83.0 29.3 47.7 41.0 37.8 38.3Ecuador 11.3 -0.8 12.9 40.3 -55.3 48.4Nicaragua 10.2 -3.8 12.7 38.2 -93.2 56.4Malaysia 76.0 -115.5 146.2 36.9 -245.1 91.9Mexico 169.4 9.9 145.4 30.3 6.5 35.7Greece 20.4 -1.6 19.6 18.9 -5.6 24.6Guatemala -2.5 -2.5 1.0 -8.6 -80.3 3.6Paraguay -3.9 -10.2 3.7 -34.8 -850.8 37.6Argentina -213.4 -143.6 -75.4 -41.6 -227.9 -16.7Turkey -84.8 -28.0 -48.9 -54.0 -218.4 -33.9Chile -141.3 -160.7 -20.0 -114.1 -776.5 -19.4
OtherThailand 93.4 a 90.0 55.3 56.7Pakistan 55.7 a -10.5 33.1 a -11.4Ethiopia -7.3 -4.4 -28.0 a -17.0Ceylon -26.7 a -25.4 -93.3 -_105.0
Notes: Countries are listed in decreasing order of D. expressed as a percentage of actual minor exports in1962-63 (column 4).
D,., represents annual averages of actual earnings from minor exports in 1962-63 minus the earnings that wouldhave been attained if the country's minor exports had grown after 1952-53 at the same rate as minor exports ofall 29 countries, taken together.
Di for manufactured goods, is based on Standard International Trade Classifications 5, 6, 7, and 8. Di representsannual averages of actual earnings from manufactured minor exports in 1962-63, minus the earnings that wouldhave been attained if the country's exports of these manufactures had grown after 1952-53 at the same rate asexports of these manufactures by the first 25 countries above, taken together.
D2 represents differences (as described for D.) for other goods.a For these countries it was not possible to calculate the manufactured goods component.
27

TABLE 5: Countries' Shares in Major Export Commodity Markets,1950-53 and 1960-63
(percent)
AverageCountry Country marketshares shares share ofbelow above individual
average average All countriesin 1950-53 in 1950-53 countries in group
(1) (2) (3) (4)
.11 commoditiesNumber of countries 20 9 29
1950-53 24.9 49.3 53.4 15.51960-63 25.2 45.5 49.8 13.9Percentage change 1.2 -7.7 -6.7 -10.3
A-commodities,Number of countries 15 8 23
1950-53 25.9 56.9 66.6 19.81960-63 26.0 52.6 62.7 18.3Percentage change 0.4 -7.6 -5.9 -7.6
B-commodities,Number of countries 15 9 24
1950-53 9.4 27.4 34.1 8.41960-63 10.3 22.7 31.1 6.8Percentage change 9.6 -17.2 -8.8 -19.0
Note: For each country the market share was computed as the mean of its quantitative shares in commoditymarkets for its major exports, each export weighted by its value in the periods indicated. Countries were classifiedinto two groups depending on whether their market shares were below or above the unweighted average for all 29countries (shown in column 4). For each group (columns 1, 2, 3), the entries show the average share of the group
in the commodity markets concerned, with each commodity being weighted by the value of total exports of thatcommodity in the group.
.A-commodities are exported mostly by the developing countries. B-commodities are exported by both thedeveloping and developed countries.
tion with developed countries (B-commodities); these two groupsare listed below.1° For all 29 countries, the market share declinedbetween 1950-53 and 1960-63 for both A4- and B-commodities.But developing countries' shares declined more in the markets forcommodities where these countries were in competition withdeveloped countries. Countries with relatively large market shares
10 A-commodities, exported mostly by developing countries, are-abaca, bananas,bauxite, cocoa beans, copper, fishmeal, green coffee, jute, jute manufactures,petroleum, rubber, sugar, tea, and tin (14 commodities).
B-commodities, exported by developing countries in competition with developedcountries, are-beef and veal, canned meat, cattle hides, cotton, cotton textiles,currants, grapes and raisins, hazelnuts, iron ore, lead, maize, pulses, rice, shrimp,silver, tropical hardwood, tobacco, vegetable oils (edible and industrial), wheat andflour, wool, and zinc (21 commodities).
28
(column 2 in Table 5) suffered greater deterioration in their positionthan all 29 countries combined. Countries which had small marketshares in 1950-53 managed to improve their positions, especially incommodities exported by both developing and developed countries.
Countries Benefiting Mostfrom Rapidly Expanding Trade
The analysis of variations in major exports is focused on countryperformance relative to world market movements. However, whena country's major markets suffer from stagnation, its export earningswill compare unfavorably with those of others even if it managesto improve its market shares. In the period studied, the most rapidgrowth in export earnings was achieved by those countries whichcaptured a higher share of buoyant markets.
This point is of considerable importance because of the strikingvariations in the growth of world exports of the different commodi-ties studied. In terms of current values, the range was wide-froma net market contraction of 42 percent for lead to an expansion ofmore than 250 percent for timber, bauxite, and fishmeal. In constantprices, the range was from a contraction of 23 percent for abacato an expansion of 360 percent for fishmeal. The current dollarvalue of minor exports of the 29 countries increased, on the average,by 45 percent during the period. For the purpose of this analysis,"buoyant" commodities are defined as those whose world exports(in current dollar values) increased more than "minor" exports.These were hazelnuts, pulses, maize, petroleum, iron ore, beef andveal, tropical hardwood, bauxite, fishmeal, silver, copper, and cur-rants, grapes, and raisins.
Of the 29 countries studied, only six improved their shares inbouyant commodity markets (Table 6). In the case of a seventhcountry, the Philippines, the value of its tropical hardwood exportsincreased considerably faster than the value of world tropicalhardwood exports even though in volume terms its share of the worldmarket declined. Four of these seven countries (Jamaica, Malaysia,Peru, and the Philippines) also had above-average growth in minorexports. These countries tended to have two crucial characteristics
29
operating at the same time. First, for most of the commoditiesconcerned they had very small world market shares at the start(1950-53) of the period. In addition, they followed policies whichencouraged expansion of minor exports; for instance, they hadbetter-than-average price stability, an annual average price increaseof 4.1 percent, compared with 9.3 percent for the 29 countriesduring the period 1950-63.
The three other countries-Argentina, Chile, and Turkey-hadbelow-average growth in minor exports. The market shares at thestart of the period for the major commodities of these countrieswere large for Argentine beef (24 percent) and Turkish hazelnuts(64 percent) and small for Chilean iron ore (4 percent).1 ' In thesesituations, special factors are likely to have accounted for thebetter-than-average growth in buoyant major commodity markets,e.g. unusual natural advantage or marked improvement in supplyof an individual commodity (such as might have resulted from anew mine, or a domestic pricing policy favoring export supply, e.g.Argentine beef).
On balance, it would seem that a combination of small worldmarket shares and the key characteristics of export-minded policyaugur well for a country's chance of cashing in on the potentials ofrapidly growing commodity markets. But there remains, of course,room for special situations-and, it might be added, luck."'
11 Chile's share in the market for iron ore improved only fractionally. Its per-formance in major exports was also below average.
12The problem posed here can also be approached by asking whether countrieswhich had a significant amount of "buoyant" commodity exports in 1950-53tended, on balance, to place less emphasis on export diversification in subsequentyears. Of the 29 countries studied, only five had "buoyant" commodity exportsequal to or exceeding 10 percent of their total exports-Chile (58 percent), Greece(21 percent), Ethiopia (10 percent), Colombia (15 percent), and Paraguay (20percent). In minor exports, performance was substantially below average for Chileand Paraguay and above average for Colombia, Ethiopia, and Greece. Thisevidence is clearly too narrow for generalization, but the problem warrants furtherstudy.
30
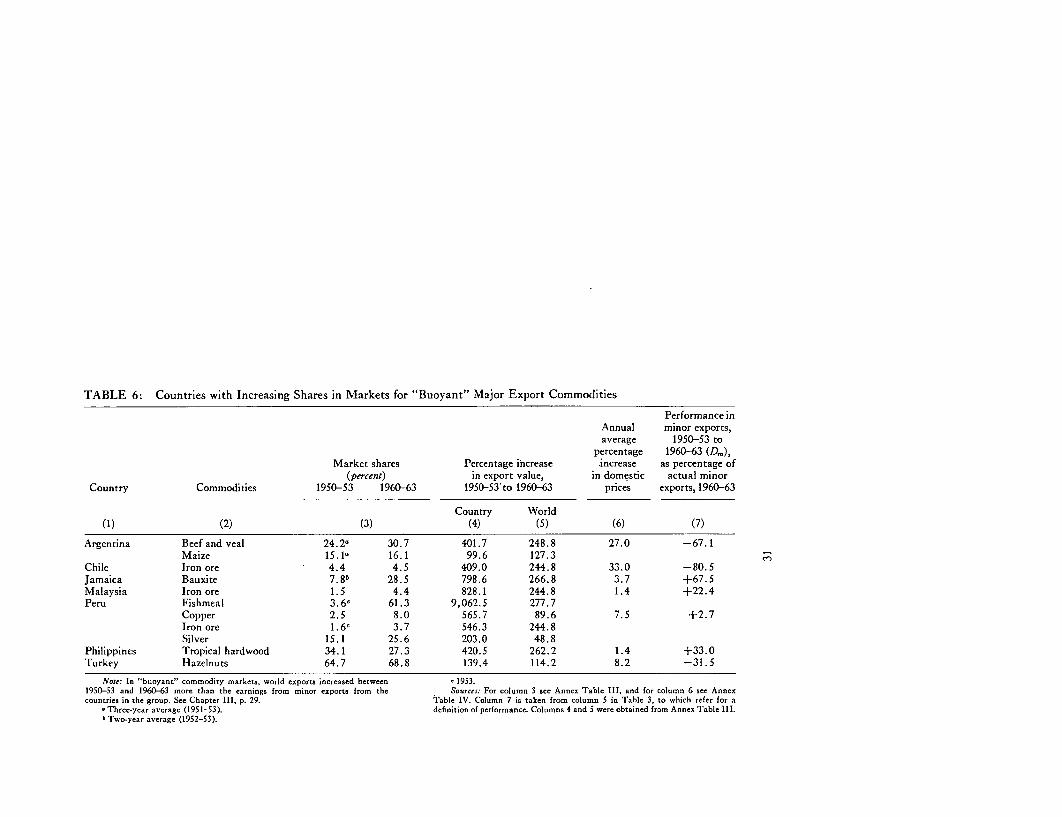
TABLE 6: Countries with Increasing Shares in Markets for "Buoyant" Major Export Commodities
Performance inAnnual minor exports,average 1950-53 to
percentage 1960-63 (Di),Market shares Percentage increase increase as percentage of
(percent) in export value, in domestic actual minorCountry Commodities 1950-53 1960-63 1950-53'to 1960-63 prices exports, 1960-63
Country World(1) (2) (3) (4) (5) (6) (7)
Argentina Beef and veal 24.20 30.7 401.7 248.8 27.0 -67.1Maize 15.1, 16.1 99.6 127.3
Chile Iron ore 4.4 4.5 409.0 244.8 33.0 -80.5Jamaica Bauxite 7.8b 28.5 798.6 266.8 3.7 +67.5Malaysia Iron ore 1.5 4.4 828.1 244.8 1.4 +22.4Peru Fishmeal 3.60 61.3 9,062.5 277.7
Copper 2.5 8.0 565.7 89.6 7.5 +2.7Iron ore 1.6' 3.7 546.3 244.8Silver 15.1 25.6 203.0 48.8
Philippines Tropical hardwood 34.1 27.3 420.5 262.2 1.4 +33.0Turkey Hazelnuts 64.7 68.8 139.4 114.2 8.2 -31.5
Note: In "buoyant" commodity markets, world exports increased between c1953.1950-53 and 1960-63 more than the earnings from minor exports from the Sources: For column 3 see Annex Table 111, and for column 6 see Annexcountries in the group. See Chapter III, p. 29. Table IV. Column 7 is taken from column 5 in Table 3, to which refer for a
aThree-year average (1951-53). definition of performance. Columns 4 and 5 were obtained from Annex Table 111.b Two-year average (1952-53).

IV
STATISTICAL ANALYSIS OF INTERCOUNTRYDIFFERENCES IN EXPORT GROWTH
A more systematic and complete analysis of the relationship be-tween variations in export growth and characteristics of countries'economic positions was obtained by means of linear regressionanalysis. In the analysis, the dependent variables were taken ascountries' deviations from a "norm" defined as export earningswhich would have prevailed if, during the period under study
(1950-53 to 1960-63), each country had maintained a constantshare in major commodity markets and experienced average growthin minor exports. These deviations were calculated for total exports,commodity exports, and minor exports classified by manufacturesand non-manufactures.
The independent variables measure the exporting country's posi-tion in major commodity markets, the variations in the growth ofagricultural and industrial output, and changes in domestic prices
during the period. In measuring industrial growth, use was madeof an index for industry in general and one for heavy industrywhich includes such industries as steel, machinery and equipment,
paper, and chemicals.
33
The price variables measure the average compound rate of changein the cost of living and wholesale price indices during the period.Intercountry variations were taken to reflect the relative degreeof price stability or inflation experienced. (Increases for the cost ofliving index averaged 9.3 percent per annum in the period studied,with a median of 3.75 percent.) In view of their wide variations,the price series may be taken as indicative of the intercountrydifferences in movements in the domestic cost of export production.However, the usefulness of the series for the latter purpose islimited, since changes in the price indices reflect movements incomponents (e.g. services and imports) which may have no directbearing on the cost of export production.
The results of the regressions are shown in Table 7. The equationspresented are those in which one or more coefficients are significant(at 5 percent probability level) and there is no multi-collinearityamong the independent variables (as seen from the simple correla-tion coefficients between any two independent variables).
The regressions with performance in major exports as the de-pendent variable (Table 7, equations 1, 2, and 3) confirm the conclu-sion reached in Chapter III that countries with relatively smallover-all positions in world commodity markets at the start of theperiod performed better during the period than those with largemarket positions. In addition, performance tended to be better forcountries with high growth rates in agriculture. The degree of priceinflation showed no significant relationship with performance inmajor exports. Neither was there a significant relationship betweenperformance and the rate of growth of industrialization (eithergeneral or heavy industrialization).
The results of the regressions with performance of minor exportsas dependent variables are shown in Table 7 for aggregate minorexports (equations 4, 5, 6), for manufactures (equations 7, 8, 9),and for non-manufactures (equations 10 and 11). Manufactures donot include certain "major" commodities, such as jute and cottontextiles, which were included in major exports (equations 1, 2, 3).
34

TABLE 7: Results of Regression Analysis
Dependent variables
D D. D. Di D2X-' X", i- X,l x, the numerator expressed as a percentage of the denominator, where
X = Xc + Xm and Xm = Xl + X2 .
X = total exports (average annual dollar value in 1960-63).Xc = major exports (average annual dollar value in 1960-63).Xm = minor exports (average annual dollar value in 1960-63),
of whichXi = manufactured goodsX2 = non-manufactures.
Dc = 1960-63 major exports (average annual value) minus the value that would have beenattained if the country had maintained its 1950-53 share (measured in quantityterms) in commodity markets.
Dm = 1960-63 minor exports (average annual value in current dollars) minus the earningsthat would have been attained if the country's minor exports had grown after 1950-53at the same rate as minor exports of all 29 countries taken together.
D = Dc + Dm.Dl and D2 similar to Dm for Xi and X2.
Independent variabless = share in 1950-53 commodity markets (measured in quantity terms), average weighted
by value of country's major exports.
Ya = agricultural output annual compound rate of change between 1950-53 andYi = industrial output 1960-63.Ys = output of heavy industry 9Pd = rate of increase (annual compound rate of increase) in domestic price level during
1950-63 (as measured by the cost of living index).Pw = same as Pd, but for wholesale price index.
pw = l EP w w) where (Pw) is the ratio of the domestic wholesale price index andrm W1t rm rm t
the index of the exchange rate applicable to minor exports (measured in terms of local cur-rency per dollar), both indices on 1950 = 100 base (t = 0 for 1950).
Regression resultsMajor exports
D, = Ao + Als + A2Ya + A3Yj + A4pd-Xe
aO Al As2 3 A4 n
1. -31.7 -. 719 7.79 1.49* -. 111* .353 27(.336) (3.05) (1.47) (.542)[.022] [.088]
2. -25.9 -. 662 8.38 .370 29(.309) (2.59)[.085] [.233]
3. -2.89 -. 889 5.01* -. 067* .519 150(.339) (2.73) (1.39)
35
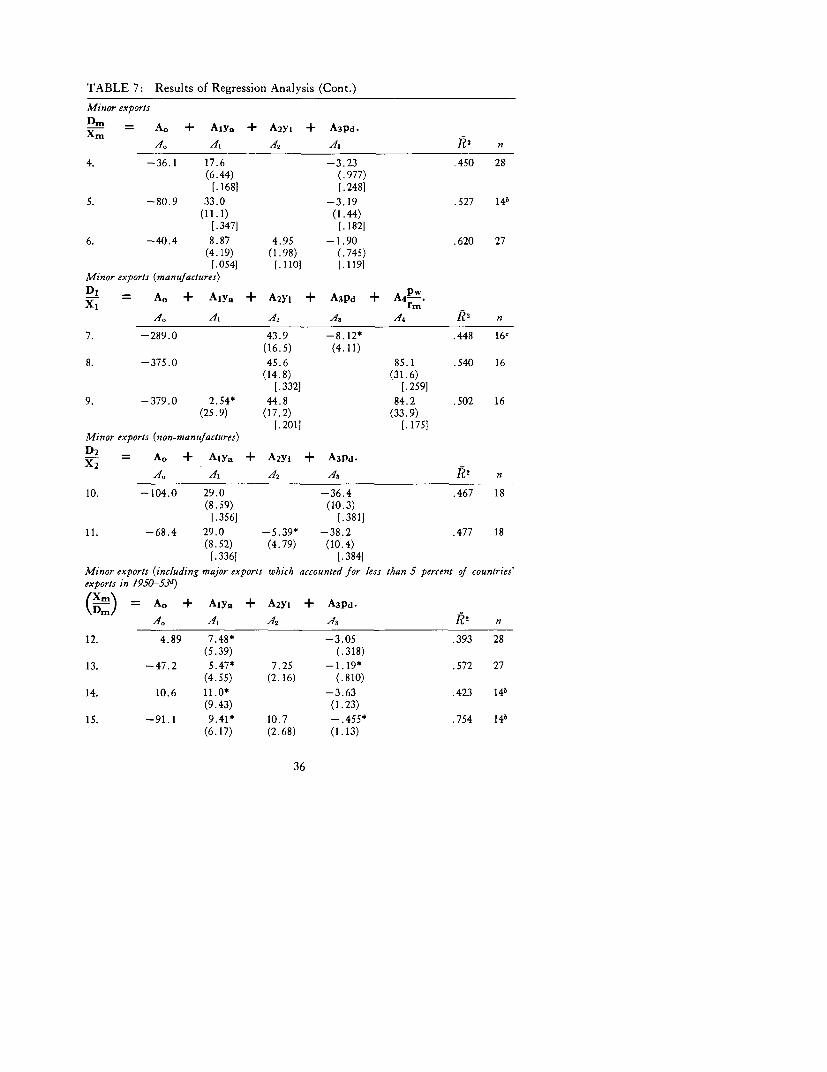
TABLE 7: Results of Regression Analysis (Cont.)
Minor exports
Dm = A. + Alya + A2yI + A3pd.
Xm~~~~4 14 , A42 A3 R2 n
4. -36.1 17.6 -3.23 .450 28(6.44) (.977)
[.1681 [.248]5. -80.9 33.0 -3.19 .527 14b
(11.1) (1.44)[.347] [.182]
6. -40.4 8.87 4.95 -1.90 .620 27(4.19) (1.98) (.745)
[.054] [ 110] [.119Minor exports (manufactures)
DI = A0 + AlYa + A2Yj + A3pd + A4 --XT rm'
Ao. A3 A1422 4f 4 n
7. -289.0 43.9 -8.12* .448 16'(16.5) (4.11)
8. -375.0 45.6 85.1 .540 16(14.8) (31.6)
[.332] [.259]9. -379.0 2.54* 44.8 84.2 .502 16
(25.9) (17.2) (33.9)[.201] [.175]
Minor exports (non-manufactures)
D2 - A. + Alya + A2yi + A3Pd.x~2
Ao~ Al, A42 A3 R2 n
10. -104.0 29.0 -36.4 .467 18(8.59) (10.3)
[.356] [.381]11. - 68.4 29.0 -. 5.39* -38.2 .477 18
(8.52) (4.79) (10.4)[.336] [.384]
Minor exports (including major exports which accounted for less than 5 percent of countries'exports in 1950-53d)
(X-) = A. + Alya + A2yI + A3Pd.
A4 A 412 43 R2 n
12. 4.89 7.48* -3.05 .393 28(5.39) (.318)
13. - 47.2 5.47* 7.25 - 1.19* .572 27(4.55) (2.16) (.810)
14. 10.6 11.0* -3.63 .423 14b
(9.43) (1.23)15. -91.1 9.41* 10.7 - .455* .754 14b
(6.17) (2.68) (1.13)
36

TABLE 7: Results of Regression Analysis (Cont.)
Total exports
D = AO + Als + A2ya + A3yi + A4pd-
AO A1 A2 A13 A44
16. -36.3 - .593 8.45 2.90 -. 432* .624 27(.256) (2.33) (1.12) (.413)[.050] [.261] [.095]
17. -24.6 -. 245* 10.2 -1.19 .567 28(.296) (2.52) (.374)
[.333] [.207]
18. 20.0 -. 576* -1.31 .403 180(.302) (.433)
19. -33.5 -. 741 8.02 2.74 .496 28(.285) (2.53) (.859)[.1231 [.2061 [.2101
20. -35.3 - .728 7.19 2.49* .667 15a(.306) (2.46) (1.25)[.161] [.2841
ys has been used instead of yi; for list of countries for which ys is available, see Annex Table IV, column 5.b Countries for which Pd is above the median (3.75 percent).e Pw has been used instead of Pd-d See Chapter III, footnote 2.Notes: Coefficients starred * are not significant at 5 percent probability level. In equations with more than one
significant coefficient, figures in square brackets below the coefficient are partial R2 (coefficients of determination).
The degree of domestic price inflation shows a significant relation-ship with performance of minor exports (aggregate and non-manu-factures). The performance of countries with relatively stronginflation tends to be poor.' The growth rates of agricultural andmanufacturing production also show significant relationships. Inequation 6, all these factors (degree of price inflation, agriculturaland manufacturing growth rates) have significant coefficients.2
The rate of growth in manufacturing production is significant forthe manufactured goods included in minor exports (Table 7, equa-tions 7, 8, 9). The rate of growth in agricultural production shows asignificant correlation with minor exports other than manufacturedgoods.
' A slightly better fit is obtained when the correlation is confined to countrieswith a degree of price inflation above the median (3.75 percent per annum); seeequation 5.
2 In this equation, the dominant explanation (as judged by the value of partialR2) is provided by variations in the industrial growth rate and degree of priceinflation, compared with the agricultural growth rate.
37
Correlations were also carried out with the dependent variablesbeing performance of minor exports including exports of "major"commodities which accounted for less than 5 percent of the totalexports of the countries concerned. The degree of domestic priceinflation again shows up as a deterrent factor in export performance.However, when in multiple regression, the industrial growth rate(yj) was tested with either the agricultural growth rate (Ya) or thedegree of price inflation (Pd) as the independent variable, yi wasthe only significant variable (e.g. equations 13 and 15). Equation 1Shas the best fit (R2 = .75); it is confined to countries for whichthere are statistics on heavy manufacturing production (AnnexTable IV); the growth rate of heavy manufacturing productionhas the only significant coefficient in this equation.
The results of the regressions with performance of total exportsas the dependent variable are shown in equations 16, 17, 18, 19,and 20. In multiple regression, significant coefficients were obtainedfor three of the independent variables-market share, growth ratein agriculture, and growth rate in manufacturing-but the coefficientfor the degree of price inflation was not significant (equation 16).However, the degree of price inflation was significant in the regres-sions which included as additional independent variables marketposition and agricultural growth.3
The regression analysis was used as an aid in determining whichof the independent variables discussed in the earlier chapters havestatistically significant relationships with "export performance."The coefficients of determination range between .35 (equation 1)and .75 (equation 1S). The coefficients of determination in equationswith total exports and minor exports as dependent variables arehigher than in the equations having major exports as the dependentvariable. No attempt was made to improve the "fit" by searchingfor additional explanatory variables, since this was not regarded asnecessary for the main line of argument of this study.
'In equations 16 and 19, the coefficients for market position (s) had a smallerpartial R2 than those for the rate of agricultural and of industrial growth.
38

In the regression equations, the dependent variables are measuredin terms of percentage deviations of actual exports from a norm.Three of the independent variables also are expressed in terms ofpercentages-annual compound percentage rate of increase indomestic prices, agricultural output, and manufacturing output.The coefficients of these independent variables may be regarded aselasticities of export performance with respect to price inflation,agricultural growth, and manufacturing growth. In the equationsin which there are significant coefficients for both the agriculturaland the manufacturing growth rate, the ratio of the elasticity ofexport performance with respect to agricultural growth and theelasticity with respect to industrial growth is 1.8 for minor exports(equation 6) and even larger, 2.9, for total exports (equations 16and 19). The elasticity of export performance with respect to priceinflation ranges from 1.9 to 3.2 for minor exports (equations 4, 5,and 6), and from 1.2 to 1.3 for total exports (equations 17 and 18);for the non-manufactured component of minor exports, it amountsto 36 and 38 (equations 10 and 11).
One group of possible additional independent explanatory vari-ables are the variations in demand factors which can be observedamong major consuming regions. In the present study, the normagainst which actual exports are measured is based on movementsin world markets for commodities. Deviations from this norm,denoted by the symbol D for various export categories, are takenas reflecting the impact of competitive forces (prices, productionrates, market shares, etc.). An alternative set of deviations (R) canbe computed by basing the norm on a model of regional marketsfor commodities, which takes into account the variations amongregions in the growth of demand. In a careful analysis of the impactof regionalization on export performance, Ooms has computeddeviations from the norm in the world market model (similar to theconcept D) and that in a regional market (R). The "regionaleffect"-the difference between D and R-is shown to be importantfor commodities for which transfer costs are relatively high andwhich are more highly differentiated. In his analysis of aggregate
4Ooms, Regionalization and Export Performance.
39

export performance, Ooms makes allowance for the "regionaleffect" and reaches conclusions on the impact of price stability andthe degree of industrialization on export performance that aresimilar to those presented in this study.5
In short, the results of the regressions suggest that good per-formance of major exports was associated with relatively smallmarket positions and with favorable growth rates in agriculture, butnot with the degree of price stability and industrial growth rates.It would seem to follow from these results that, as far as performanceof major exports is concerned, agricultural production variables aremore important than domestic price variables (leaving aside theinfluence of the country's market position).
On the other hand, performance of minor exports was better forcountries with relative price stability and favorable growth ratesin manufacturing as well as in agriculture.
Good performance of both categories of exports was associatedwith favorable growth rates in agriculture. This result might beexpected a priori in countries where exports account for the bulk ofagricultural production, something which is more likely to be truefor major commodities than for minor exports.
I The data presented in Ooms' study suggest that deviations from norm underthe two models are closely correlated. This is demonstrated, for example, by therelatively high rank correlations between D and R (in Ooms' notation, E -W*and E - E*) for the group of developing regions and countries:
All commodities 0.83Agricultural commodities 0.91Mineral and forest products 0.69All commodities (excluding fuels) 0.93
The last rank correlation was computed from data for regional groupings (i.e.data for individual countries are not shown).
Since Ooms relies more on data of exports from developing regions-as againstindividual countries-the interregional variations in the deviations from normare sialler than in the present study. For example, Ooms' E - W* (based on1953-54 = 100) shows a range of -41 to 26 for developing regions and countries,whereas in the present study D (recomputed on a 1950-53 base) varies from -62to 149 and D. from -60 to 116.
40

The results do not indicate that growth in manufacturing tendsto affect export performance adversely. Any damaging impact ofindustrialization efforts on minor exports appears to have been dueto the adverse effect of inflation. Unfortunately, heavy industrializa-tion efforts have often been accompanied by price inflation. Whilethere is no significant statistical association between manufacturinggrowth and price inflation in the data presented, countries withheavy industrialization-e.g. those with steel production of morethan 400,000 tons (Annex Table VII)-did have a pace of priceinflation well above the median for the whole group.6
The final comment is required on the role of price variables(e.g. in Table 7, equations 7, 8, 9) giving the average percentagechange in U.S. dollar equivalents of domestic prices (measured bythe cost of living or wholesale price index) over the level at the startof the period. If it were assumed that intercountry variations in thedomestic price index approximate changes in export costs, the co-efficients for this price variable in the regression equations would beexpected to have a negative sign since the higher the variable the lesscompetitive would be the country's exports for the period as awhole. However, in all but one of the equations tested the variablehad a positive sign.7 The paradox may have several causes. First,while the performance of both minor exports (equations 4, 5, 6,10, 11) and total exports (equations 16 through 20) was better forcountries with relative price stability, these same countries tendedto experience an increase in the dollar equivalent of their domestic
6 Based on a comparison of 1955 with 1937-38 data, Maizels established thatindustrialization had no significant adverse impact on countries' total exportsrelative to world exports. He reviews the GATT analysis on the relation betweenless developed countries' exports and their industrialization, particularly the"Haberler Report," in International Trade, 1958; see Alfred Maizels, IndustrialGrowth, Chapter 5.
1 The same is true for another price variable (not shown in Table 7), p., measuringthe change between the start (1950-53) and the end (1960-63) of the period in theaverage unit value of major exports, computed in domestic currency equivalents,relative to the domestic price level (Pd). A positive value of px indicates an increasein export unit values relative to domestic prices (Pd) which, if the latter are takento reflect changes in costs, would make export production more attractive thanproduction for the domestic market.
41
prices during the period, as can be seen by comparing columns 6and 7 in Annex Table IV. Also, intercountry variations in the
domestic price indices are far larger than those in the dollar equiv-alent of domestic prices (Annex Table IV, columns 6 and 7 again).While domestic price indices may adequately approximate inter-
country variations in domestic costs of export products, it may beless likely that the dollar equivalent of domestic prices will ade-quately reflect the change in the dollar equivalent of export costs.For this purpose it would be desirable to obtain a more precisemeasurement of export costs and prices (e.g. unit values of sub-categories of minor exports), but this has not been possible for thegroup of countries under study.
42

v
DOMESTIC DIVERSIFICATION VERSUSEXPORT DIVERSIFICATION
The discussion in Chapter II of the differences in trade orientationof development policy pointed out that outward orientation ischaracterized by price competitiveness and emphasis on productionfor export markets. Inward orientation, in contrast, emphasizesheavy industrial production, primarily for the domestic market,and is more often than not accompanied by inflation, relativelyintensive import protection and, consequently, reduced internationalcompetitiveness.
Both policies, if well directed, can result in diversification of thedomestic economy; but domestic diversification achieved under anoutward orientation policy is more likely to be accompanied byexport expansion and diversification. Some of the differences instructural characteristics which are likely to influence a country'schance of success under alternative policies of trade orientation arediscussed in the present chapter.
The success of a policy of outward orientation in any givencountry will depend on whether or not the country's structuralcharacteristics favor a vigorous expansion of exports. The analysisin Chapters III and IV suggests that a small share in the inter-
43

national market was a dynamic element in the expansion of majorexports of developing countries in the period from 1950-53 to1960-63; and secondly, that exports of minor products increasedmore rapidly than exports of most major commodities.' A sizableminor export component reflects, in itself, earlier success in theexpansion of new exports and in overcoming international competi-tion and the difficulties of entering new markets; in addition, itsuggests that the country already has a base for further expansionin the years ahead. Since this component consists of many smallitems, the size of the country's share in international markets isbound to be less for the minor export category than it is for majorexports. Insofar as minor exports are made up of manufacturedproducts, the share of a developing country in the consumingmarkets (mostly those of the developed countries) is almost invari-ably small, and the potential is substantial for further expansionbefore the country will encounter the obstacles associated withincreasing its market share of primary commodities. A possibleexception could be textiles, where some countries (notably India)have large market shares; textile exports from the developing coun-tries can be regarded as a case for testing the attitude of the devel-oped countries toward imports from the developing countries.
Thus a structural condition for success in expanding exports is acombination of a relatively small share in markets for major exportsand the existence of a diversified export package as reflected in arelatively large minor export component. Variations in these twofactors are reflected in the trade position index (discussed in ChapterIII) which can be regarded as a shorthand way of measuring thepotential for export expansion. The smaller the index, the betteris a country's potential for expanding its exports. Clearly, therealization of this potential will depend on the impact of the coun-try's policies on price competitiveness and on whether or not itsresource allocation is conducive to its export advantages (e.g. theextent to which its industrialization efforts are based on comparativeadvantange in labor, management, and raw material supplies).
The averages of the trade position indices computed for the 29
' See Chapter III, Table 2.
44
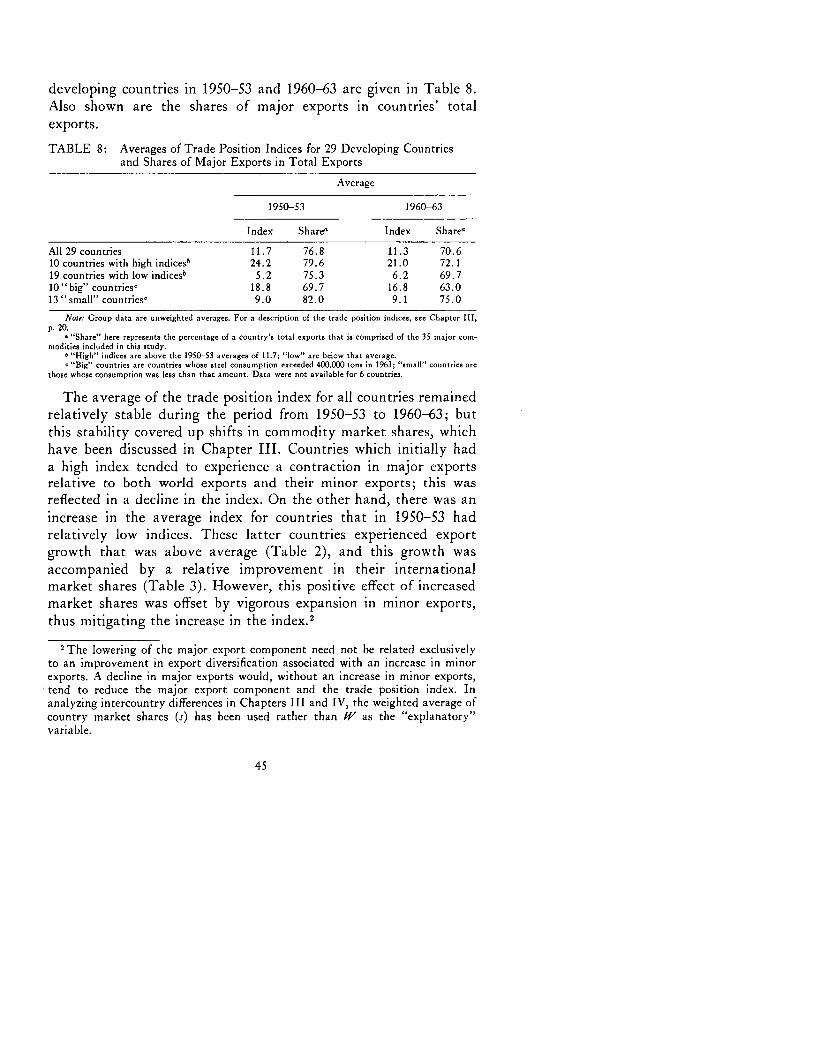
developing countries in 1950-53 and 1960-63 are given in Table 8.Also shown are the shares of major exports in countries' totalexports.
TABLE 8: Averages of Trade P'osition Indices for 29 Developing Countriesand Shares of Major Exports in Total Exports
Average
1950-53 1960-63
Index Share, Index Share,
All 29 countries 11.7 76.8 11.3 70.610 countries with high indices' 24.2 79.6 21.0 72.119 countries with low indicesb 5.2 75.3 6.2 69.7l0"big" countries, 18.8 69.7 16.8 63.013 "small" countries, 9.0 82.0 9.1 75.0
Note: Group data are unweighted averages. For a description of the trade position indices, see Chapter III,p. 20.
' "Share" here represents the percentage of a country's total exports that is comprised of the 35 major com-modities included in this study.
b "High" indices are above the 1950-53 averages of 11.7; "low" are below that average."Big" countries are countries whose steel consumption exceeded 400,000 tons in 1963; "small" countries are
those whose consumption was less than that amount. Data were not available for 6 countries.
The average of the trade position index for all countries remainedrelatively stable during the period from 1950-53 to 1960-63; butthis stability covered up shifts in commodity market shares, whichhave been discussed in Chapter III. Countries which initially hada high index tended to experience a contraction in major exportsrelative to both world exports and their minor exports; this wasreflected in a decline in the index. On the other hand, there was anincrease in the average index for countries that in 1950-53 hadrelatively low indices. These latter countries experienced exportgrowth that was above average (Table 2), and this growth wasaccompanied by a relative improvement in their internationalmarket shares (Table 3). However, this positive effect of increasedmarket shares was offset by vigorous expansion in minor exports,thus mitigating the increase in the index.2
2 The lowering of the major export component need not be related exclusivelyto an improvement in export diversification associated with an increase in minorexports. A decline in major exports would, without an increase in minor exports,tend to reduce the major export component and the trade position index. Inanalyzing intercountry differences in Chapters III and IV, the weighted average ofcountry market shares (s) has been used rather than W as the "explanatory"variable.
45

What are the chances of success of a strategy with inward orienta-tion ? A critical condition for the success of any development strategyis the size of the markets toward which the newly developed activi-ties are oriented, i.e. the markets to which they have access and inwhich they have to compete. With outward orientation, thesemarkets are largely export markets. With inward orientation, theyare confined more to the domestic economy. The larger the domesticeconomy, the greater the chance that a strategy with inward orienta-tion will succeed in increasing production and at the same timecause the country to become more competitive. Since, in all cases,the domestic market is very small compared with the export market,reliance on the domestic market tends to be a "second best."
Programs of domestically oriented industrialization, includingheavy industry, involve the establishment of a broad range of indus-tries, some labor intensive, some capital intensive-on the capitalside with varied intensity of "advanced technology" and automation,and on the labor side with wide variation of skill requirements.While a country may have "competitive advantages" in only someindustries, the process of industrialization requires that others inwhich the country has decidedly less competitive advantage beestablished. This may absorb the greater part of investment re-sources, so that the industrialization effort taken as a whole mayappear to be disappointing when judged by its internationalcompetitiveness.
The success in lowering costs and achieving greater efficiency ofmany industries involved in this process depends on the achievementof economies of scale and the availability of supplementary indus-trial activities and infrastructure ("externalities"). Both of these willtend to be greater, the larger the size of the country's own marketand the more diversified the industrial development effort. The largermarket will, by itself, permit a larger number of firms for someindustries and induce a greater degree of competition for mostindustries, which will enhance the efficiency of resource utilization,both material and human. The "learning" effects of industrializationare increased by the diversity of the industrial structure that isbeing developed and by the degree of competition made possible
46

by the larger market. Countries with larger domestic markets arealso in a better position to devise new techniques for coping with
the special conditions prevailing in developing economies. On theother hand, inward orientation tends to set in motion many forces
which can have an adverse impact on efficiency and growth over
the longer term, e.g. price distortion and discouragement of savingbecause of rapid inflation, discouragement of foreign private invest-
ment and technical know-how caused by controls on imports andpayments. More generally, the guarantee of the domestic marketimplicit in inward policy orientation tends to discourage steps to
improve productivity. However, as has been demonstrated in some
crucial cases-e.g. Brazil during most of the 1950's-these disad-vantages can be overcome by the attractiveness which a large
market has for foreign firms with capital and technical resources.An especially important condition is that the government adopt anenlightened policy toward the use of foreign technical know-how.
The two variables, trade position and domestic market size, whichare crucial in determining appropriate trade and development
strategies, show different patterns of variations among the countriesin the group studied here. To measure market size, gross domesticproduct (GDP) for each country was converted to U.S. dollar
equivalents. Then, to indicate country positions, two-dimensionalcharts were prepared-Chart 1 covering 1950-53, and Chart 2covering 1960-63. Each chart was divided into four quadrants,
with the dividing lines being the average trade position for all 29countries in the period covered by the chart and a GDP of $4 billionequivalent. 3
It might have been expected that most countries would fall inQuadrant I ("small" countries with small trade position indices) or
Quadrant III ("big" countries with indices above average). Thegrounds for this expectation are that the trade position index moveswith the absolute size of exports, and that exports move with thecountry's economic size. Indeed, as shown in Chapter III, the big
I With the exception of Chile, the $4 billion equivalent benchmark for GDPcoincides with a domestic market for steel of 400,000 tons or more in 1963 (AnnexTable VII).
47

CHART I
TRADE POSITION AND DOMESTICMARKET SIZE, 1950-53
60.0 - - -_ _ _ _ _
50.0 LOGARITHMIC SCALES AVERAGE {IN
200 .0- _ _ _ l - _ _
ARC
z 10.0 - - MX---A
8.0I
g 6.0 _ = =_ -= K
450 = = -_ r- _ _ = =4.0-- - CR -- - - - - -
3 .0 TUR--- - CL P
z G~~~ ~~~~~R CR *CH0~~~~~~~~~~~~~~J 5D t1 ~~~~~~~~~~~~1 OX TH
2.0 _ _ __ _ _
Z MIAL
.5 I _ + _ _ ,I _ TAI_1.0- - -- .L CE
.8 ~~~ETH -- ~-
.4 CENT. AMER."
PAR lCR aBOL
.2 ___ __ _ -- - - . _ TLU _____ _ __ . T...
.21.0 2.0 3.0 4.0 6.0 8.0 10.0 20.0 30.0 40.0 60.0
TRADE POSITION INDEX, 1950-1953
Av-rooQ posiion of El Solvodor, Guotenolo. Honduros, Nicaragua, P-nomo ond Jcmic.(R)IBRD -3139
48

CHART 2
TRADE POSITION AND DOMESTICMARKET SIZE, 1960-63
650.0 LOGARITHMIC SCALES
40.0 I_ _.0 _ AVERAAE XIN _ _
30.0- --- -4- - -
20.0 - -----
MEX BR
3N ARGOI *
I 10.0 -J _ _ _ _ _ _ _ _ PAR K
8.0 - jUR---- - -
6.0 = ____-_ _ _ ____ _
, 5.0 _ _ _ R -R C P -C Ho G URJAR COLO
4.0 8 PE C =
o ~ ~ ~ _ 3.0 - N ER _ _ _P _ _ _ - _ _
0 0 .20-0 TAI A
to 2.0 *__A
0 I ~~~~~~~~~~~~~~~~~~~~CEYW) U~~~~~~~R
1.IT0 EIO INDEX, 196 -6C
.8 - ~~~~~~~SNT AIMER. -11
.6- - - - - - - - - -
.4 PAR BOL_. 3E
.2 _ _ __ _ _ _
1.0 2.0 3.0 4.0 6.0 8.0 10.0 20.0 30.0 40.0 60.0
TRADE POSITION INDEX, 1960-63
'Aaerag. position at El Salvador, Guatemala, Honduras, Nicaragua, Panama and Jcmcic(.4R9IRR-3140
49

countries have a trade position index exceeding that of the smallcountries. However, for the countries studied here, no statisticallysignificant association between domestic market size (as measuredby GDP) and the trade position index is evident. There are a numberof big countries with small indices and small countries with largeindices.
In the charts the dividing line for GDP ($4 billion equivalent)was drawn in order to provide a rough classification of countriesby the minimum domestic market size on which a diversified indus-trial complex (including heavy industry) could be based. Any classi-fication of this kind is arbitrary, and that suggested by the quadrantsin the charts should be regarded merely as illustrating groupings ofcountries which tend to have distinctly different problems in attain-ing export growth and domestic diversification. At the end of thischapter, a few qualifications will be made which would followfrom the choice of a dividing line at a substantially higher level ofGDP than $4 billion.4 The diagrams show a number of borderlinecases and several countries that shift from one quadrant to anotherduring the period studied. In interpreting the significance of thesuggested categories, allowance should, of course, be made for themany other factors which influence growth.
Quadrant I contains the countries for which an outward orienta-tion is strongly indicated. There is little dispute among economistsor policymakers about the best strategy for countries in this group.Because of their low trade positions, they have sufficient freedomof manoeuvre and potential in trade expansion. Because of the smallsize of their domestic markets, their industries must either besmall scale or export oriented. As the size of their domestic marketsgrows, they will move into Quadrant IV, which, as will be discussed
4At this point, two qualifications may be made. A more precise measure ofdomestic market size would take into account per capita income as well as theabsolute size of GDP, since, given the size of GDP, a lower per capita figure (as inIndia) would lower the potential of the domestic market size for establishing heavyindustry. A further adjustment would allow for changes in dollar prices during1960-63. If the 1960-63 dividing line were kept at $4 billion, the 1950-53 dividingline would shift to $3.4 billion, leaving country positions in Chart I unaffected.
50

below, contains the "lucky" countries in the group. The potentialsfor further development as countries move from .1 to IV will begreater if, in fact, their industrial development has been guided bycriteria of international competitiveness.
In 1950-53 there were 17 countries in Quadrant I. Six of thesecountries had shifted to other quadrants in 1960-63: Costa Rica,Ecuador, and Peru had increased their foreign trade positions andmoved into II; Greece and the United Arab Republic had increasedtheir GDP and moved into IV. Turkey, very much a borderlinecase, had in 1960-63 both a higher trade position index and a higherGDP and had moved into III.
The countries in Quadrant I experienced relatively favorable ex-port growth and stable domestic prices. For 11 of the 17, D waspositive in 1960-63, and for 13, D. was positive (see Table 3,Chapter III). Of the 17 countries, 10 had an annual domestic priceincrease below the median (3.75) for the group of 29. The growthrates for agriculture and industry were more evenly spread overQuadrant I countries. Seven countries in this subgroup had above-average price stability and agricultural growth. When account istaken of factors not measured by the indicators used here-e.g.mineral production for export and treatment of foreign investors-and of changes occurring during the period,b a majority of countriesin Quadrant I may be described as having followed a policy thatwas predominantly outward oriented. The countries in this quadrantwhich did pursue such a policy also showed the best export per-formance for the entire group (Peru, Taiwan, El Salvador, Nica-ragua, and Jamaica). On the other hand, Uruguay, with a relativelysharp rise in domestic prices (7.5 percent) and below-averageagricultural and industrial growth, showed the poorest export per-formance. Similarly, the export performance of Paraguay, where
I For example, during the period, Taiwan had above-average price increases(12 percent) and above-average agricultural growth (4 percent). Since 1960, how-ever, Taiwan has been among the countries with relatively greater price stability.Its policies have, however, encouraged export diversification, including the exportof manufactured goods.
51

there was little price stability and agricultural production waspoor, ranked third from the bottom.6
Quadrant II countries face what may be regarded as the mostdifficult problems in devising an appropriate trade and developmentpolicy. They have relatively high trade position indices, suggestinginternational market limitations to the growth of their majorexports (or limited success thus far in developing new exportproducts). While the limitations may turn countries "inward,"their domestic markets are as yet too small to provide a basis for thedevelopment of a broadly diversified industrial sector, althoughsome countries may be regarded as borderline cases.' Thus the free-dom of these countries in forming policy is limited by both externaland domestic considerations. As long as they are in the smalldomestic market category, their best strategy is to encourage exportdiversification, including manufactures. Such a strategy may, in somesituations, also succeed in producing further expansion of majorexports as a result, say, of a fortuitous combination of domesticresources (raw materials and management) and lack of vigorousforeign competition. 8
In 1950-53, seven countries were in Quadrant II; of these, three(Ceylon, Chile, and Malaysia) were still there in 1960-63. Of theremaining four, Thailand and Bolivia had moved into I by 1960-63,the Philippines into III, and Colombia into IV. These seven coun-tries had quite different policies and export experiences, suggestingthat they coped with their problems in very different ways. The
6 Only Bolivia, as well as Uruguay, fared worse.For example, Malaysia is considering a small-sized integrated steel plant
(200,000 tons) with private investor sponsorship.8 For example, the figures below show the changes in the shares of Malaysia and
Thailand in the world tin market versus the share of Bolivia:World tin market shares
(percent)Country 1950-53 1960-63
Malaysia 34.6 40.9Thailand 6.1 10.1Bolivia 20.1 15.1
52

export performance (as measured by D) of three of these countries,namely Malaysia, Philippines, and Thailand, was above average.These countries also showed relative price stability (with price in-creases averaging 2.5 percent per annum), and above-average agri-cultural growth (3.5 percent per annum or higher): their policieswere predominantly outward oriented. On the other hand, judgingby their industrialization and domestic price policies, two-Chileand Colombia-had strong inward-oriented tendencies. Ceylon also,for much of the period, placed strong emphasis on import substitu-tion and protection;9 its minor exports made a very poor showing.
Quadrant III contains the larger countries with above-averagetrade position indices. The size of their domestic markets makes itpossible for a diversified industrialized structure, including heavyand complex industry, to become economic over the medium term,provided appropriate policies to encourage greater efficiency arefollowed. Their foreign trade positions make export expansionrelatively more difficult than it is for countries in Quadrants I andIV, and provide a strong inducement to give their domestic diversifi-cation an inward orientation. Where the actual outlook for theirmajor commodities in the external market confirms the less favorablepotential suggested by their trade positions, a case can be made for adevelopment strategy with inward orientation, stressing broad indus-trial diversification with initial production predominantly for thedomestic market.
In 1950-53, only Brazil, India, and Pakistan were in Quadrant III.In 1960-63 these countries were still in III, the Philippines andTurkey had moved in, and Chile was close to doing so. AlthoughColombia had increased its GDP just enough to be over the $4billion benchmark, its trade position put it in IV. All of the countrieswith "large" domestic markets-in both Quadrants III and IV-have undertaken programs of broad industrial diversification or areon the threshold of such programs (see, for example, steel production
'These two aspects of Ceylon's development were not reflected in price andexchange rate statistics. Prices increased by I percent on average. As is well known,the subsidization of certain cost of living items has drained Ceylon's resourcesfor development expenditures.
S3

and expansion plans as summarized in Table VII of the Annex).Most of the countries which in 1950-53 were in Quadrant III orclose to being so had predominantly inward orientation policiesduring most of the entire period 1950-63; exceptions were Pakistanand the Philippines. Insofar as the export of major commodities wasconcerned, however, the performance of all of these countries waspoor; this, it seems, was related to the relatively high market sharesat the start of the period rather than to industrialization efforts(see Chapter IV). The growth of minor exports was average orsubstantially above average, except for India and Chile. The pricepolicies of Pakistan and the Philippines were relatively cautious,and the exchange policies of Colombia were largely successful inoffsetting the ill effects of domestic price increases.10 Brazil, whichenjoyed agricultural growth that was above average, showed aboutaverage growth for minor exports despite substantial price inflation.
Quadrant IV contains what might be called the lucky countries:their international trade positions are low and their domesticmarkets are large enough to allow freedom in deciding on domesti-cally-oriented diversification and export expansion.
In 1950-53, only Argentina and Mexico were in Quadrant IV,but Turkey, Greece, and the UAR were close to being so. The lasttwo actually moved to IV in 1960-63. (Colombia, in IV in 1960-63,has already been discussed as a borderline case under Quadrants IIand III). As has been observed for Quadrant II, the policies andexport performance of countries in this group show great variations.Greece, Mexico, and the UAR did well in both major and minorexports, while the resource and price policies of Argentina andTurkey resulted in export performances which were well belowaverage-even for major exports for which these countries had goodpotential, as seen in their relatively small market shares." Theexport experience of Mexico would suggest that rather intensive
'° See G. Lovasy, "Inflation and Exports."11 A small (say $1 billion) adjustment in the dividing line would place a number
of borderline cases (e.g. Greece, UAR, Colombia, and the Philippines in 1960-63)in the category of "small" countries.
S4

and broad industrialization efforts can be combined with relativeprice stability and above-average growth of agricultural productionand of minor exports (with a growing component of manufactures).It is striking that the growth of minor exports-well above average-for Greece, Mexico, and the UAR, coincided with above-averagegrowth in agricultural output. Conversely, in Argentina and Turkeythe relatively poor growth record of minor exports was accompaniedby below-average agricultural growth and above-average priceincreases.
The discussion thus far has been based on a GDP dividing lineof $4 billion equivalent. It can be argued that the dividing line mark-ing the minimum domestic market size on which to base a heavyindustrial complex should be substantially above $4 billion, viz.,closer to $10 billion (or a domestic steel market which will justifythe construction of an integrated steel plant of an initial capacityof one million tons). If this higher dividing line were adopted, onlyfour countries would be shifted to the category of larger countries:Brazil and India in III and Mexico and Argentina in IV."2 Alter-natively, a category of intermediate countries might be introducedwith GDP between about $4 billion and $10 billion equivalent.Falling in this group in 1960-63 would be-Turkey, Chile, Pakistan,the Philippines, Colombia, Greece, and the UAR; of these, the firstfour had above-average trade positions.
An upward shift in the GDP dividing line would enlarge thenumber of countries in the "difficult category" (II) of countries,i.e. those with relatively high trade positions and internal marketstoo small as a base for inward orientation. Countries in the inter-mediate category would be faced with a difficult policy choice intheir industrialization strategy. Inward orientation, including heavyindustrialization, might turn out to be costly in terms of efficiencyand exports foregone. Outward orientation, with a quicker payoffin terms of productivity and export earnings, would seem the moredesirable strategy. Outward orientation need not exclude indus-
12 On Turkey, see Ann Krueger, "Some Economic Costs of Exchange Control:The Turkish Case," Journal of Political Economy, (November 1966).
55
trialization or expansion of exports of manufactures. The countrieswhich have had success with industrialization under outwardorientation (e.g. Jamaica, Taiwan, and Thailand, as indicated by thedata on "minor" exports of manufactured goods in Annex Table II)have not entered into production of intermediate goods (e.g. steel)but have relied on imports of industrial raw materials and inter-mediate products for the production (and export) of finished goods,including labor-intensive capital goods. Where such a strategy ofindustrialization is induced by the scarcity of natural resources,an initial obstacle to development has been turned into an economicadvantage.
In this study, the discussion of development policy has beenconfined to certain principal aspects of a country's response to itstrade and development problems. Consequently, a distinction hasbeen made between two major policy orientations which can beregarded as contrasting from the viewpoint of export policy. Thekey characteristics in distinguishing these orientations-for example,changes in the domestic price level, relative rates of growth of theagricultural and the industrial sectors-are very broad indicatorswhich themselves are often the result of several measures which canbe classified as "policy." Furthermore, the classification of countriesby size and trade position leaves out many elements of importancein determining growth.
Subject to these reservations, this chapter may properly endwith a general observation. The policy orientations as defined andobserved here seem to be, in a majority of cases, part and parcel of acountry's basic trade and development problems as reflected in itstrade and size position in Charts 1 and 2. The majority of countrieswith small domestic markets and small trade position indices havefollowed an outward orientation policy and the majority of countrieswith relatively large domestic markets and large trade positionindices have tended to pursue inward orientation policies. For acountry in either of these groups, "policy" is an endogenous elementin the country's economic structure and is not as exogenous asoften seems to be assumed in economic analysis. On the other hand,for countries in the remaining groups, especially the small countries
56

with large trade position indices, "policy" seems more exogenousand an even greater factor in determining export growth. For thesecountries the nature of demand for their leading commodities islikely to be a key consideration in the choice of policy orientation.A few countries in this category, notably Malaysia and Thailand,pursued frankly outward orientation policies which, though theymight have seemed inconsistent with export expansion potentials,nevertheless resulted in a favorable export performance.' 3
13 As the "endogenous" element of policy for countries in Quadrants I and III isnot clear-cut, explicit recognition has not been given to this observation in thestatistical analysis in Chapter IV.
57


VI
CONCLUSION
The growth of exports differs considerably among the developingcountries. For 1960-63, the exports of the 29 countries studied hereranged from about $200 million above to $200 million below the levelwhich would have been attained if the countries' shares in worldcommodity markets had remained unchanged since 1950-53. Thedeviations amount to as much as 60 percent of actual exports forsome countries. These differences are of such magnitude that theircauses deserve continued and careful study. They also suggestthat the economic policies and basic economic factors of the export-ing countries may have an impact on the development of theirexports. If they do-and this study presents some evidence to thiseffect-it would seem essential that projections of the exports ofindividual countries, obtained by prorating global projections ofindividual commodity markets, should also allow for the possibleeffects of policies and other factors influencing supply from ex-porting countries.
This study has attempted to relate the differences in export per-formance to certain economic characteristics, such as trade positions,financial management (as reflected in variations in price inflation),
59
and resource allocation policies (as reflected in agricultural andindustrial growth rates). The findings are necessarily tentative. Inapplying the results to specific situations, allowance must be madefor special factors which might have governed country or commoditybehavior during the periods studied. Analysis of export growthshould be supplemented by studies of the growth of earnings fromservices, especially tourism, which have become a major source offoreign exchange earnings for some developing countries.
A distinction has been made in this study between exports of"major" commodities, mostly those traded on well-organized inter-national markets, and "minor" exports, a miscellaneous group of,both agricultural and manufactured goods. The growth of minorexports of an individual country has been measured relative to thegrowth of total earnings from minor exports of the group of 29 coun-tries. The performance of exports of major commodities has beengauged by changes in countries' shares in their principal markets:an improvement in market shares during the period signifies favor-able performance. However, stability of a country's market sharesover time may not signify neutral performance: through their ownpolicies (as to price or quantity supplied), the exporting countriesthemselves may, over the longer term, cause a contraction of themarket. This factor might be of special importance where one or twocountries have a dominant position in the market for a commoditywith easy substitutes or where the policies of individual countries allwork in the same direction (which, however, in view of the strikingintercountry differences, seems less likely in practice).
The study suggests that domestic price inflation tended to deterthe performance of minor exports, but that there was no associationbetween variations in domestic price inflation and the performanceof major exports.
Changes in exports over the period studied-1950-63-appearedto be associated with countries' shares in the markets of major
commodities in the initial years: countries with small market posi-tions tended to fare better than those with large shares. Exportswhich comprised a small share of the world market tended to
60
experience relatively favorable growth and, in this respect, behavedlike minor exports which expanded considerably faster than majorexports.
The adverse effect of the size of countries' market shares on thegrowth of their major exports, observed during the period understudy, may not prevail in as systematic a manner in the future.This effect is symptomatic of the problems which large suppliershave in expanding their markets, especially when demand for theirmajor commodities is sluggish. Over the longer term, this factor willtend to be limited by the production possibilities of the smallerproducers. The influence of market shares on commodity exportsmay be exerted through freely competitive as well as regulatedmarkets. Where the market is stabilized through an internationalagreement, it is to be hoped that market shares will shift in favorof the producers with lower costs. Thus far, in the game of dividingthe market, the countries with smaller shares, not necessarily thecheaper producers, have tended to gain. It would appear desirableto establish guideposts for shifting market shares on a more economicbasis. Indeed, the determination of such guideposts should be oneof the principal objectives of studies of primary commodities, suchas is now under way for coffee under the sponsorship of the IBRD,the International Coffee Organization, and the Food and Agri-culture Organization.
The export performance of both major and minor commoditiesappeared to be positively correlated with the growth of agriculturaloutput. Variations in the growth of manufacturing productionshowed a positive correlation with the performance of total and ofminor exports. The data do not indicate that growth in manu-facturing had an adverse impact on export performance.
Most of the developing countries have a relatively small sharein the markets of major commodities, and they also have relativelysmall domestic markets. For these countries, a policy of encouragingexports seems clearly indicated. Outward orientation need notexclude industrialization or an expansion of exports of manufactures.The countries which have had success with industrialization under
61

outward orientation policies, (e.g. Jamaica, Taiwan, and Thailand),have not attempted to produce intermediate goods (e.g. steel) buthave relied on imports of industrial raw materials and intermediateproducts for the output (and export) of finished goods, includinglabor-intensive capital goods. Where such a strategy of indus-trialization has been induced by the scarcity of natural resources,an initial obstacle to development has been turned into an economicadvantage. For both minor and major exports, the greatest improve-ment was achieved by countries which had small external marketpositions and a policy of outward orientation.
Countries with relatively small domestic markets and sizableshares of certain world markets (such as Ceylon, Colombia, andMalaysia) are faced with what appears to be a serious problem:external factors may make export expansion relatively difficult, anddomestic factors limit the possibilities for industrialization basedon the country's own market. Only a few countries are lucky enoughto have relatively large domestic markets on which to base theirindustrialization and an export package in which no commodityaccounts for a large share. The present study indicates that countriesin these two categories have pursued widely varying policies andexperienced considerable differences in their export growth.
For the few countries whose domestic markets are large enoughto serve as a base for diversified domestic industry and whoseexternal market positions suggest limitations on the expansion ofthe markets for their export commodities, emphasis on indus-trialization oriented toward the domestic market would seem to beappropriate. Most countries in this category have, in fact, embarkedon industrialization programs, but their export experience, especiallyin regard to minor exports, has varied greatly, depending particu-larly on domestic price and agricultural policies.
Broadly diversified industrialization, oriented on the domesticmarket and involving production of intermediate goods (includingsteel), is bound to be costly in terms of efficiency and exportsforegone in the initial years and in terms of the length of timerequired to reach economic levels of production. Countries engaged
62

in such diversification efforts are likely to foster noncompetitiveindustries in addition to those in which they have a comparativeadvantage. However, industries which are initially not competitivemay be regarded as an integral part of a program for achievingbroad diversification-and essential for the introduction of newtechnologies. Countries pursuing this type of industrialization maypass through a transitional period in which their need for outsideassistance will be accentuated by the high requirements for invest-ment and the lag in exports associated with diversified industrializa-tion programs. Of the countries in the group studied, those withheavy industrialization (as measured by steel production of morethan 500,000 tons) had, on average, price inflation well above themedian for the group as a whole. Domestic price inflation generallytended to have an adverse impact on minor exports.
In this study, the characterization of development policy has beenconfined to certain major aspects, and the classification of countriesby size and trade position has omitted many elements of importancein determining growth. Subject to these reservations, it seems that inthe majority of cases studied a country's orientation policy is partand parcel of its basic trade and development problem as reflectedin its economic size and international trade position. The majorityof countries with small domestic markets and small trade positionindices have policies that are predominantly outward. In contrast,those countries characterized by relatively large domestic marketsand large trade positions tend to pursue inward orientation policies.For countries in either of these groups, "policy" seems more endoge-nous than is often assumed in economic analysis; external marketposition and domestic market size are very influential. On the otherhand, for other countries-especially small countries with large tradepositions-"policy" seems more exogenous and perhaps is more of adetermining factor in export growth. In this group are a few coun-tries (notably Malaysia and Thailand) which frankly pursued out-ward orientation policies that brought favorable results, especiallyfor minor exports.
63

STATISTICAL ANNEXTABLES I-VIII
65

ANNEX TABLE I: Trade Position Index and Average World Market Share, 29 Countries (annual averages)
Average world market shares (percent)
Trade position index All commodities A-commodities B-commodities
1950-53 1960-63 1950-53 1960-63 1950-53 1960-63 1950-53 1960-63Countries (1) (2) (3) (4) (5) (6) (7) (8)
Argentina 7.5 10.8 14.7 14.4 .. .. 14.7 14.4Bolivia 13.4 10.8 16.3 12.0 20.1 15.2 3.8 1.6Brazil 33.7 21.2 43.0 33.8 46.8 36.6 5.9 6.3Ceylon 17.9 25.2 20.0 22.0 23.6 26.3 3.8 2.4Chile 17.3 30.8 29.2 24.3 30.2 25.1 4.4 4.5
C China (Taiwan) 3.2 1.5 3.9 3.6 4.3 4.0 1.5 1.3Colombia 13.4 9.6 14.1 11.4 14.1 11.4 ..Costa Rica 8.1 12.4 8.8 4.5 8.8 4.5Ecuador 5.7 14.8 6.5 11.1 7.0 12.1 0.9 0.4El Salvador 3.1 2.1 3.3 3.0 3.5 3.1 0.3 1.6Ethiopia 2.0 1.8 1.6 1.5 1.3 2.2 6.3 3.6Greece 5.4 5.3 7.9 7.8 . . . 7.9 7.8Guatemala 2.6 2.4 3.3 3.2 3.3 3.2 ..Honduras 8.6 4.5 9.6 7.3 10.3 8.0 3.1 2.0India 29.0 22.5 55.6 47.1 72.5 60.6 15.5 11.3Jamaica 2.0 6.8 3.1 5.9 3.1 5.9 .. .Malaysia 28.7 27.3 33.1 36.7 35.6 39.8 5.2 3.7Mexico 7.0 4.0 11.8 10.7 3.6 2.8 15.0 13.7Nicaragua 0.6 0.8 0.8 0.9 0.9 0.8 0.4 1.2

Nigeria 11.4 9.3 14.7 13.6 13.9 15.8 15.1 12.4
Pakistan 46.8 35.9 55.9 44.0 99.5 82.2 9.3 3.2
Panama 4.3 4.3 6.4 6.4 6.4 6.4 .
Paraguay 1.1 1.9 1.7 1.3 1. . .7 1.3
Peru 3.3 15.0 4.8 6.8 3.0 5.5 5.5 7.4Philippines 21.1 15.9 25.6 26.3 36.8 41.3 18.4 16.6Thailand 21.1 10.7 24.4 19.1 5.8 9.2 32.2 23.3
Turkey 7.1 12.1 11.1 10.9 .. .. 11.1 10.9
United Arab Republic 10.7 5.8 12.3 9.0 .. .. 12.3 9.0
Uruguay 4.5 2.9 6.6 3.6 .. .. 6.6 3.6
Not available. Average world market share si of country j is
Notts: The trade position index for country j is /fp = lo0. x x. [ ( X,)s x a ]
where Xij, xi. are value (current dollars) and quantity, respectively, of exports v Xijof commodity i from country j; X.j is total exports (current dollar value) from Z X.06s-53country j; xi. is total world exports (quantity) of commodity i. In computing l'Y f j m s
that = 0 or mnor xpors, .e. apors oter tao tosefor major commodities only.it has been assumed that " = O for minor exports, i.e. exports other than those Average world market share of A-commodities and B-commodities is s
of major commodities listed in Chapter III, p. 28, note 10. computed for these commodity groups. A- and B-commodities are as listed inChapter III, p. 28, note 10.
Sources: See Annex Table 1II.
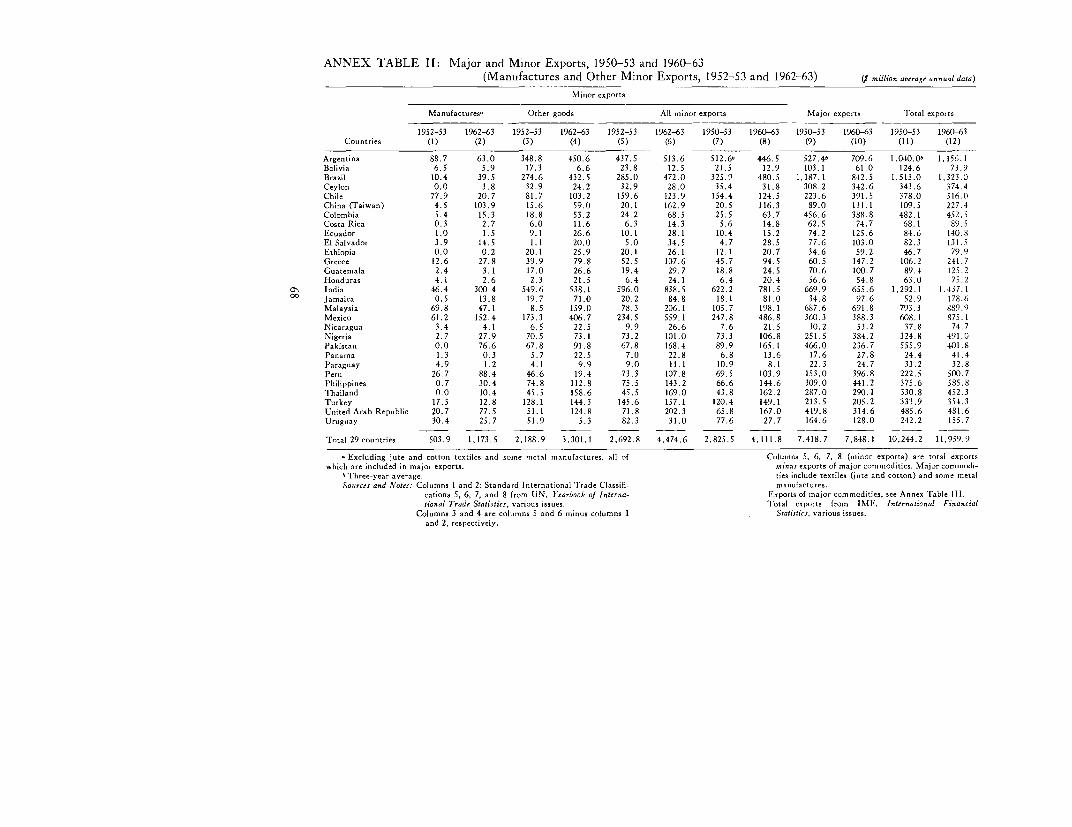
ANNEX TABLE IJ: Major and Minor Exports, 1950-53 and 1960-63(Manufactures and Other Minor Exports, 1952-53 and 1962-63) ( nsilion ara.ge annual data)
Minor exports
Manufacturesr Other goods All minor exports Major exports 'I'otal exports
1952-53 1962-63 1952-53 1962-63 1952-53 1962-63 1950-53 1960-63 1950-53 1960-63 1950-53 1960-63Countries (1) (2) (3) (4) (5) (6) (7) (8) (9) (10) (I1) (12)
Argentina 88. 7 63.0 348.8 450.6 43 7.5 513.6 512.6b 446. 5 527. 4b 709.6 1, 040. Oh 1,156.1Bolivia 6.5 5.9 17.3 6.6 23.8 12.5 21.5 12.9 103.1 61.0 124.6 73.9Brazil 10.4 39.5 274.6 432.5 285.0 472.0 325.9 480.5 1,187.1 842.5 1,513.0 1,323.0Ceylon 0.0 3.8 32.9 24.2 32.9 28.0 35.4 31.8 308.2 342.6 343.6 374.4Chile 77.9 20.7 81.7 103.2 159.6 123.9 154.4 124.5 223.6 391.5 378.0 516.0China C(aiwan) 4.5 103.9 15.6 59.0 20.1 162.9 2(1.5 116.3 89.0 111.1 1()9.5 227.4Colombia 5.4 15.3 18.8 53.2 24.2 68.5 25.5 63.7 456.6 388.8 482.1 452.5Costa Rica 0.3 2.7 6.0 11.6 6.3 14.3 5.6 14.8 62.5 74.7 68.1 89.5Ecuador 1.0 1.5 9.1 26.6 10.1 28.1 10.4 15.2 74.2 125.6 84.6 140.8El Salvador 3.9 14.5 1.1 20.0 5.0 34.5 4.7 28.5 77.6 103.0 82.3 131.5Ethiopia 0.0 0.2 20.1 25.9 20.1 26.1 12.1 20.7 34.6 59.2 46.7 79.9Greece 12.6 27.8 39.9 79.8 52.5 107.6 45.7 94.5 60.5 147.2 106.2 241.7Guatemala 2.4 3.1 17.0 26.6 19.4 29.7 18.8 24.5 70.6 100.7 89.4 125.2Honduras 4.1 2.6 2.3 21.5 6.4 24.1 6.4 20.4 56.6 54.8 63.0 75.2
C'. India 46.4 300.4 549.6 538.1 596.0 838.5 622.2 781.5 669.9 655.6 1,292.1 1,437.100 Jamaica 0.5 13.8 19.7 71.0 20.2 84.8 18.1 81,0 34.8 97.6 52.9 178.6
Malaysia 69.8 47.1 8.5 159.0 78.3 206.1 105.7 198.1 687.6 691.8 793.3 889.9Mexico 61.2 152.4 173.3 406.7 234.5 559.1 247.8 486.8 360.3 388.3 608.1 875.1Nicaragua 3.4 4.1 6.5 22.5 9.9 26.6 7.6 21.5 30.2 53.2 37.8 74.7Nigeria 2.7 27.9 70.5 73.1 73.2 101.0 73.3 106.8 251.5 384.2 324.8 491.0Pakistan 0.0 76.6 67.8 91.8 67.8 168.4 89.9 165.1 466.0 236.7 555.9 401.8Panama 1.3 0.3 5.7 22.5 7.0 22.8 6.8 13.6 17.6 27.8 24.4 41.4Paraguay 4.9 1.2 4.1 9.9 9.0 11.1 10.9 8.1 22.3 24.7 33.2 32.8Peru 26.7 88.4 46.6 19.4 73.3 107.8 69.5 103.9 153.0 396.8 222.5 500.7Philippines 0.7 30.4 74.8 112.8 75.5 143.2 66.6 144.6 309.0 441.2 375.6 585.8Thailand 0.0 10.4 45.5 158.6 45.5 169.0 43.8 162.2 287.0 290.1 330.8 452.3Turkey 17.5 12.8 128.1 144.3 145.6 157.1 120.4 149.1 213.5 205.2 333.9 354.3United Arab Republic 20.7 77.5 51.1 124.8 71.8 202.3 65.8 167.0 419.8 314.6 485.6 481.6Uruguay 30.4 25.7 51.9 5.3 82.3 31.0 77.6 27.7 164.6 128.0 242.2 155.7
Total 29 countries 503.9 1,173.5 2,188.9 3,301.1 2,692.8 4.474.6 2,825.5 4,111.8 7,418.7 7,848.1 10,244.2 11,959.9
a Excluding jute and cotton textiles and some metal manufactures, all of Columns 5, 6, 7, 8 (minor exports) are total exportswhich are included in major exports. ,sinus exports of snajor commodities. Major cornmodi-
b Three-year average. ties include textiles (jute and cotton) and some moetalSosrces and Alotes: Columns I and 2: Standard International Trade Classifi- manufactures.
cations 5, 6, 7, and 8 from UN, Yearhook of Interna- Exports of major cotnmodities, see Annex 'Iable 111.tional Irade Statistics, various issues. Total exports from INIFl, International Financial
Columns 3 and 4 are columns 5 and 6 minus columns I Statistics, various issues.and 2, respectively.
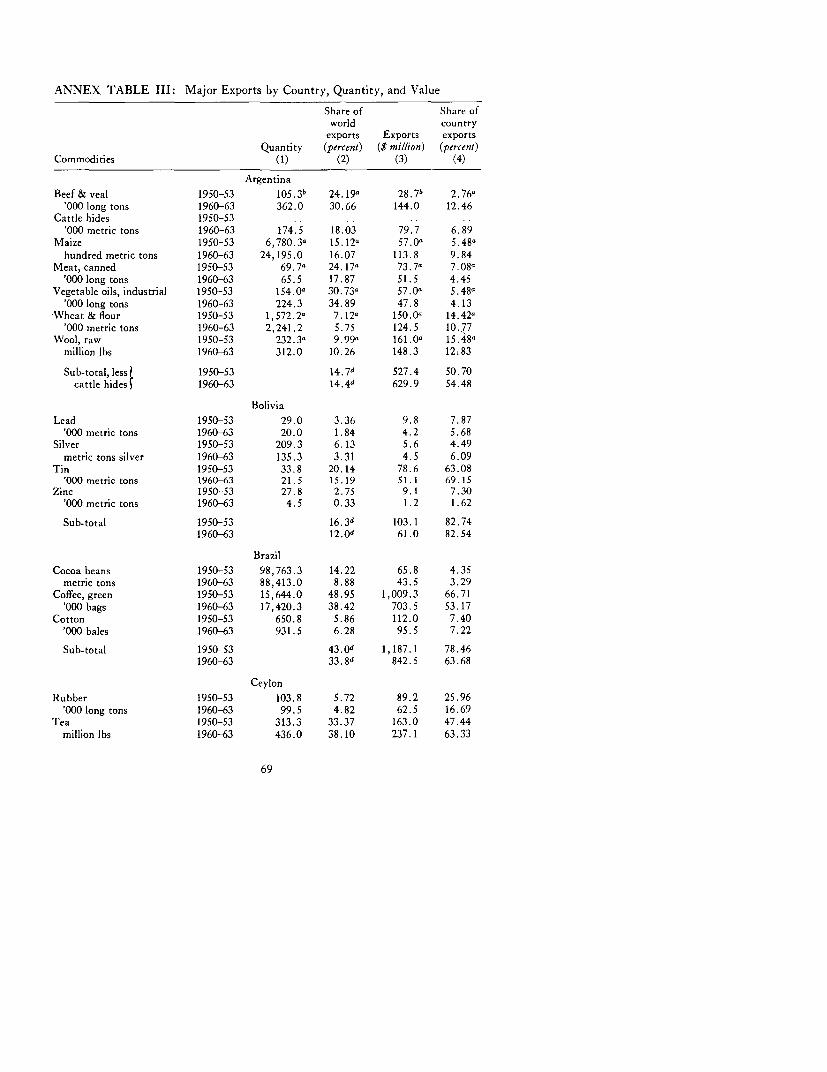
ANNEX TABLE III: Major Exports by Country, Quantity, and Value
Share of Share ofworld country
exports Exports exportsQuantity (percent) ($ million) (percent)
Commodities (1) (2) (3) (4)
ArgentinaBeef & veal 1950-53 105 3b 24.19a 28.7b 2.76"
'000 long tons 1960-63 362.0 30.66 144.0 12.46Cattle hides 1950-53 .
'O00Ometrictons 1960-63 174.5 18.03 79.7 6.89Maize 1950-53 6,780.3" 15.12" 57.0" 5.48a
hundred metric tons 1960-63 24,195.0 16.07 113.8 9.84Meat, canned 1950-53 69.7" 24.17" 73.7" 7.08"
'OOOlong tons 1960-63 65.5 17.87 51.5 4.45Vegetable oils, industrial 1950-53 154.0" 30.73" 57.0" 5.48"
'O00longtons 1960-63 224.3 34.89 47.8 4.13Wheat & flour 1950-53 1,572.2" 7.12" 150.0" 14.42'
'000 metric tons 1960-63 2,241.2 5.75 124.5 10.77Wool, raw 1950-53 232.3" 9.99" 161.0" 15.48"
million lbs 1960-63 312.0 10.26 148.3 12183
Sub-total, less 1950-53 14. 7d 527.4 50.70cattle hides$ 1960-63 14.4d 629.9 54.48
BoliviaLead 1950-53 29.0 3.36 9.8 7.87
'000 metric tons 1960-63 20.0 1.84 4.2 5.68Silver 1950-53 209.3 6.13 5.6 4.49
metric tons silver 1960-63 135.3 3.31 4.5 6.09Tin 1950-53 33.8 20.14 78.6 63.08
'O00Ometrictons 1960-63 21.5 15.19 51.1 69.15Zinc 1950-53 27.8 2.75 9.1 7.30
'000 metric tons 1960-63 4.5 0.33 1.2 1.62
Sub-total 1950-53 16.3d 103.1 82.741960-63 12.0d 61.0 82.54
BrazilCocoa beans 1950-53 98,763.3 14.22 65.8 4.35
metric tons 1960-63 88,413.0 8.88 43.5 3.29Coffee, green 1950-53 15,644.0 48.95 1,009.3 66.71
'000 bags 1960-63 17,420.3 38.42 703.5 53.17Cotton 1950-53 650.8 5.86 112.0 7.40
'000 bales 1960-63 931.5 6.28 95.5 7.22
Sub-total 1950-53 43.0d 1,187.1 78.461960-63 33.8d 842.5 63.68
CeylonRubber 1950-53 103.8 5.72 89.2 25.96
'000 long tons 1960-63 99.5 4.82 62.5 16.69Tea 1950-53 313.3 33.37 163.0 47.44
million lbs 1960-63 436.0 38.10 237.1 63.33
69
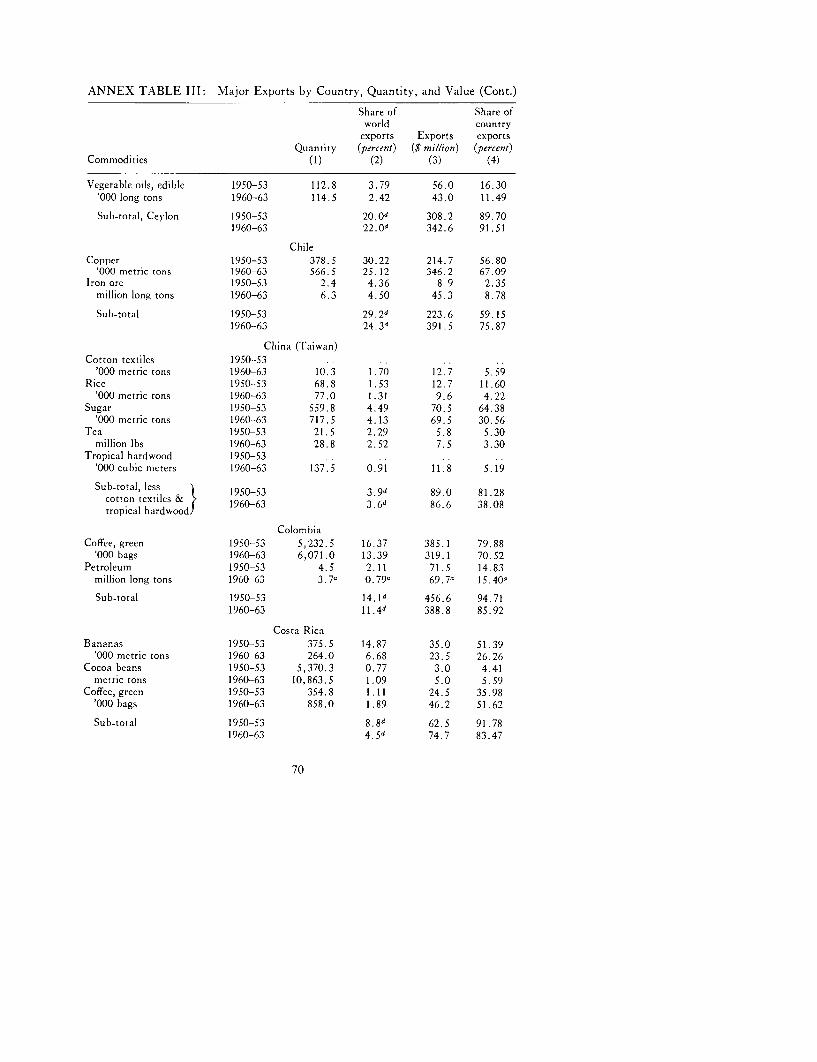
ANNEX TABLE III: Major Exports by Country, Quantity, and Value (Cont.)
Share of Share ofworld country
exports Exports exportsQuantity (percent) ($ million) (percent)
Commodities (1) (2) (3) (4)
Vegetable oils, edible 1950-53 112.8 3.79 56.0 16.30'000 long tons 1960-63 114.5 2.42 43.0 11.49
Sub-total, Ceylon 1950-53 2 0.Od 308.2 89.701960-63 2 2 .0d 342.6 91.51
ChileCopper 1950-53 378.5 30.22 214.7 56.80
'000 metric tons 1960-63 566.5 25.12 346.2 67.09Iron ore 1950-53 2.4 4.36 8.9 2.35
million long tons 1960-63 6.3 4.50 45.3 8.78
Sub-total 1950-53 29.2d 223.6 59.151960-63 24.3 391.5 75.87
China (Taiwan)Cotton textiles 1950-53 . ..
'000 metric tons 1960-63 10.3 1.70 12.7 5.59Rice 1950-53 68.8 1.53 12.7 11.60
'000 metric tons 1960-63 77.0 1.31 9.6 4.22Sugar 1950-53 559.8 4.49 70.5 64.38
'000 metric tons 1960-63 717.5 4.13 69.5 30.56'Tea 1950-53 21.5 2.29 5.8 5.30
million lbs 1960-63 28.8 2.52 7.5 3.30Tropical hardwood 1950-53 . . ..
'000 cubic meters 1960-63 137.5 0.91 11.8 5.19
Sub-total, less 1950-53 3,9d 89.0 81.28cotton textiles & 1960-63 3.6d 86.6 38.08tropical hardwood
ColombiaCoffee, green 1950-53 5,232.5 16.37 385.1 79.88
'000 bags 1960-63 6,071.0 13.39 319.1 70.52Petroleum 1950-53 4.5 2.11 71.5 14.83
million long tons 1960-63 3.7, 0.79a 69.7, 15.40"
Sub-total 1950-53 14.1d 456.6 94.711960-63 11.4d 388.8 85.92
Costa RicaBananas 1950-53 375.5 14.87 35.0 51.39
'000 metric tons 1960-63 264.0 6.68 23.5 26.26Cocoa beans 1950-53 5,370.3 0.77 3.0 4.41
metric tons 1960-63 10,863.5 1.09 5.0 5.59Coffee, green 1950-53 354.8 1.11 24.5 35.98
'000 bags 1960-63 858.0 1.89 46.2 51.62
Sub-total 1950-53 8.8d 62.5 91.781960-63 4.5d 74.7 83.47
70

ANNEX TABLE III: Major Exports by Country, Quantity, and Value (Cont.)
Share of Share ofworld country
exports Exports exportsQuantity (percent) ($ mil/ion) (percent)
Commodities (1) (2) (3) (4)
EcuadorBananas 1950-53 313.3 12.41 31.8 37.59
'000 metric tons 1960-63 920.0 23.27 86.0 61.08Cocoa beans 1950-53 24,175.5 3.48 17.2 20.33
metric tons 1960-63 33,775.8 3.39 18.1 12.86Coffee, green 1950-53 314.8 0.98 18.5 21.87
'000 bags 1960-63 488.3 1.08 18.8 13.35Rice 1950-53 39.5 0.88 6.7 7.92
'000 metric tons 1960-63 22.0 0.37 2.7 1.92
Sub-total 1950-53 6.5d 74.2 87.711960-63 Il.1d 125.6 89.21
El SalvadorCoffee, green 1950-53 1,103.3 3.45 73.0 88.70
'O00bags 1960-63 1,418.3 3.13 76.2 57.95Cotton 1950-53 31.0 0.28 4.6 5.59
'000 bales 1960-63 237.3 1.60 26.8 20.38
Sub-total 1950-53 3.3d 77.6 94.291960-63 3.Qd 103.0 78.33
EthiopiaCattle hides 1950-53 .
'000 metric tons 1960-63 7.7 0.80 3.0 3.75Coffee, green 1950-53 416.0 1.30 24.8 53.10
'000 bags 1960-63 975.5 2.15 40.9 51.19Pulses 1950-53 68.7b 12.31b 4 .8b 10.28b
'000 metric tons 1960-63 71.3 6.59 7.3 9.14Vegetable oils, edible 1950-53 6.4 0.21 3.5 7.49
'000 long tons 1960-63 9.0 0.19 5.5 6.88Vegetable oils, industrial 1950-53 5.9 1.18 1.5 3.21
'O0Olongtons 1960-63 10.9 1.70 2.5 3.13
Sub-total, less 1950-53 1.6d 34.6 74.08cattle hides 1960-63 1 5d 56.2 70.34
Greece
Cotton 1950-53 28.0' 0.25' 5.2' 4.90''000 bales 1960-63 293.3 1.61 28.6 11.83
Currants, grapes, raisins 1950-53 91.9 18.56 18.0 16.95'000 long tons 1960-63 130.9 16.15 32.3 13.36
'robacco 1950-53 36.9 6.33 37.3 35.12'000 metric tons 1960-63 59.1 8.17 86.3 35.71
Sub-total 1950-53 7.9d 60.5 56.971960-63 7.8d 147.2 60.90
71
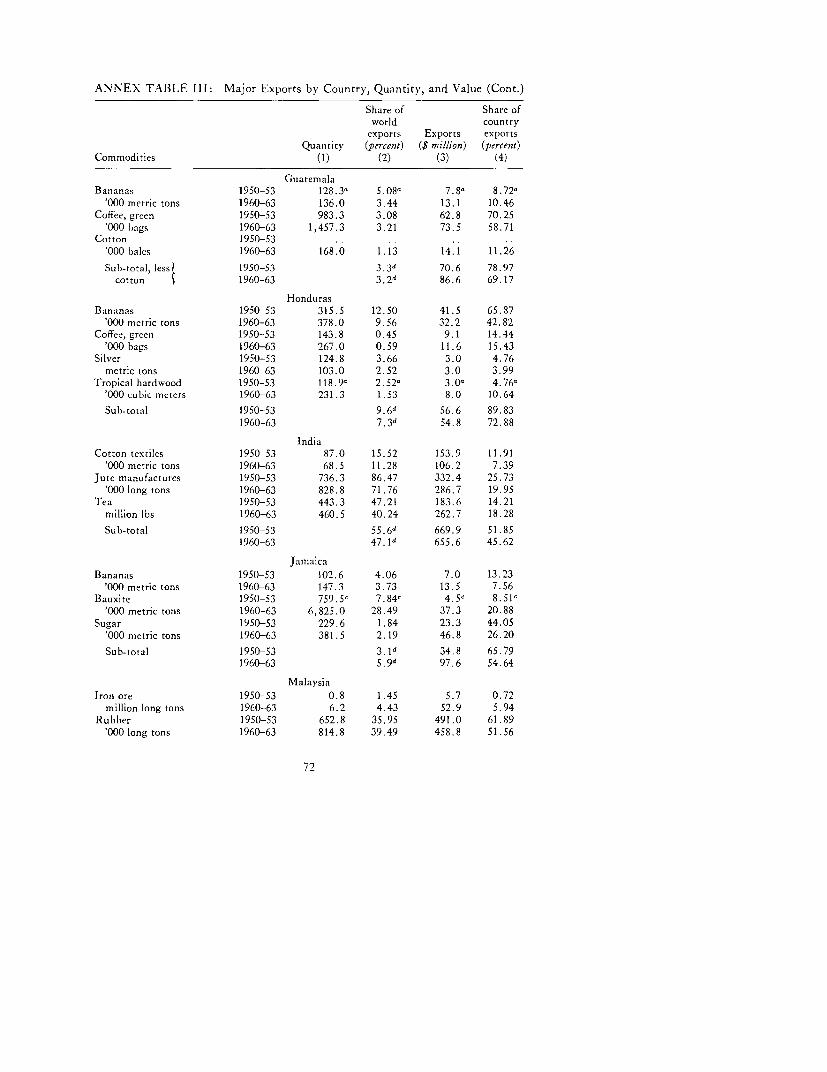
ANNEX TABLE III: Major Exports by Country, Quantity, and Value (Cont.)
Share of Share ofworld country
exports Exports exportsQuantity (percent) ($ million) (percent)
Commodities (1) (2) (3) (4)
GuatemalaBananas 1950-53 128.3a 5.08a 7.8a 8.72a
'000 metric tons 1960-63 136.0 3.44 13.1 10.46Coffee, green 1950-53 983.3 3.08 62.8 70.25
'000 bags 1960-63 1,457.3 3.21 73.5 58.71Cotton 1950-53 .
'000 bales 1960-63 168.0 1.13 14.1 11.26
Sub-total, less 1950-53 3.3d 70.6 78.97cotton 1960-63 3.2d 86.6 69.17
HondurasBananas 1950-53 315.5 12.50 41.5 65.87
'000 metric tons 1960-63 378.0 9.56 32.2 42.82Coffee, green 1950-53 143.8 0.45 9.1 14.44
'000 bags 1960-63 267.0 0.59 11.6 15.43Silver 1950-53 124.8 3.66 3.0 4.76
metric tons 1960-63 103.0 2.52 3.0 3.99Tropical hardwood 1950-53 118.9a 2.52a 3.0a 4.76a
'000 cubic neters 1960-63 231.3 1.53 8.0 10.64
Sub-total 1950-53 9.6d 56.6 89.831960-63 7. 3d 54.8 72.88
IndiaCotton textiles 1950-53 87.0 15.52 153.9 11.91
'000 metric tons 1960-63 68.5 11.28 106.2 7.39Jute manufactures 1950-53 736.3 86.47 332.4 25.73
'000 long tons 1960-63 828.8 71.76 286.7 19.95Tea 1950-53 443.3 47.21 183.6 14.21
million lbs 1960-63 460.5 40.24 262.7 18.28
Sub-total 1950-53 55.6d 669.9 51.851960-63 47. 1d 655.6 45.62
JamaicaBananas 1950-53 102.6 4.06 7.0 13.23
'000 metric tons 1960-63 147.3 3.73 13.5 7.56Bauxite 1950-53 759.5c 7.84' 4.5c 8.51'
'000 metric tons 1960-63 6,825.0 28.49 37.3 20.88Sugar 1950-53 229.6 1.84 23.3 44.05
'000 metric tons 1960-63 381.5 2.19 46.8 26.20
Sub-total 1950-53 3 .1d 34.8 65.791960-63 S.9d 97.6 54.64
MalaysiaIron ore 1950-53 0.8 1.45 5.7 0.72
million long tons 1960-63 6.2 4.43 52.9 5.94Rubber 1950-53 652.8 35.95 491.0 61.89
'000 long tons 1960-63 814.8 39.49 458.8 51.56
72
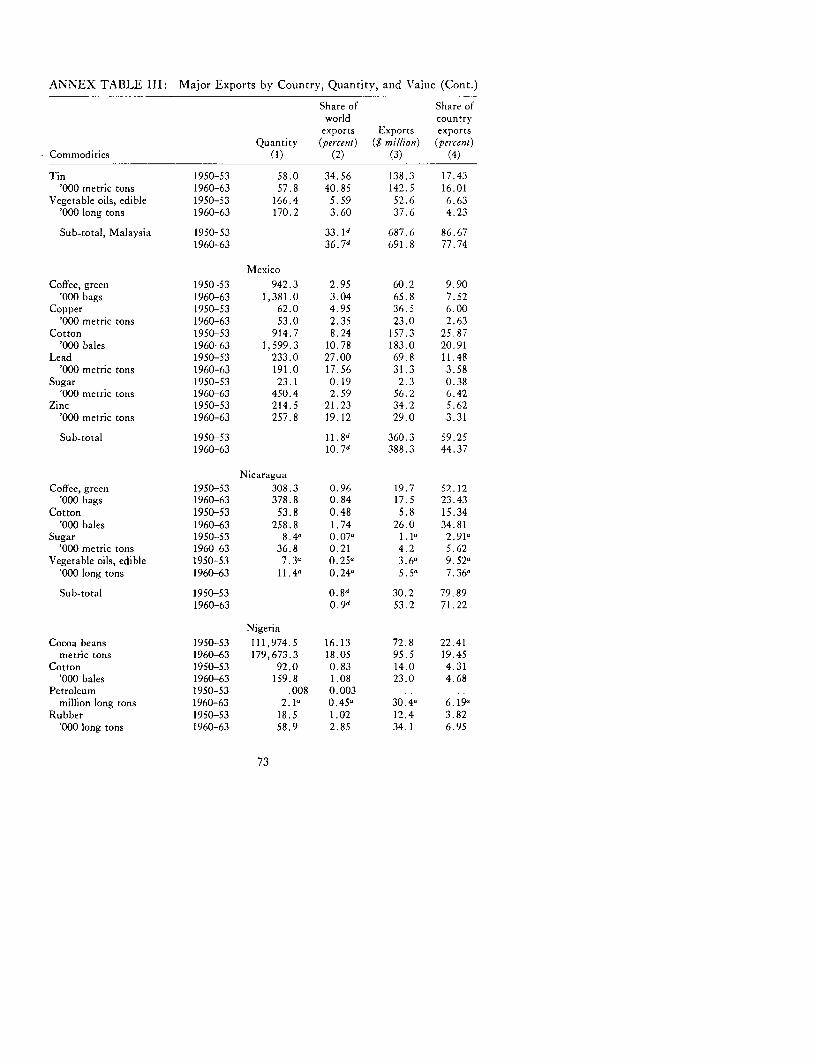
ANNEX TABLE III: Major Exports by Country, Quantity, and Value (Cont.)
Share of Share ofworld countryexports Exports exports
Quantity (percent) ($ million) (percent)Commodities (1) (2) (3) (4)
Tin 1950-53 58.0 34.56 138.3 17.43'000 metric tons 1960-63 57.8 40.85 142.5 16.01
Vegetable oils, edible 1950-53 166.4 5.59 52.6 6.63'000 long tons 1960-63 170.2 3.60 37.6 4.23
Sub-total, Malaysia 1950-53 33. ld 687.6 86.671960-63 36.7d 691.8 77.74
MexicoCoffee, green 1950-53 942.3 2.95 60.2 9.90
'000 bags 1960-63 1,381.0 3.04 65.8 7.52Copper 1950-53 62.0 4.95 36.5 6.00
'000 metric tons 1960-63 53.0 2.35 23.0 2.63Cotton 1950-53 914.7 8.24 157.3 25.87
'000 bales 1960-63 1,599.3 10.78 183.0 20.91Lead 1950-53 233.0 27.00 69.8 11.48
'000 metric tons 1960-63 191.0 17.56 31.3 3.58Sugar 1950-53 23.1 0.19 2.3 0.38
'000 metric tons 1960-63 450.4 2.59 56.2 6.42Zinc 1950-53 214.5 21.23 34.2 5.62
'000 metric tons 1960-63 257.8 19.12 29.0 3.31
Sub-total 1950-53 11.8d 360.3 59.251960-63 10.7d 388.3 44.37
NicaraguaCoffee, green 1950-53 308.3 0.96 19.7 52.12
'000 bags 1960-63 378.8 0.84 17.5 23.43Cotton 1950-53 53.8 0.48 5.8 15.34
'000 bales 1960-63 258.8 1.74 26.0 34.81Sugar 1950-53 8.4a 0.07a 1.1 2.91a
'000 metric tons 1960-63 36.8 0.21 4.2 5.62Vegetable oils, edible 1950-53 7.3a 0.25, 3.6a 9.52a
'000 long tons 1960-63 11.40 0.24a 5.5S 7.36a
Sub-total 1950-53 0.8d 30.2 79.891960-63 0 9d 53.2 71.22
NigeriaCocoa beans 1950-53 111,974.5 16.13 72.8 22.41
metric tons 1960-63 179,673.3 18.05 95.5 19.45Cotton 1950-53 92.0 0.83 14.0 4.31
'000 bales 1960-63 159.8 1.08 23.0 4.68Petroleum 1950-53 .008 0.003 ..
million long tons 1960-63 2.10 0.450 30.40 6.190Rubber 1950-53 18.5 1.02 12.4 3.82
'000 long tons 1960-63 58.9 2.85 34.1 6.95
73
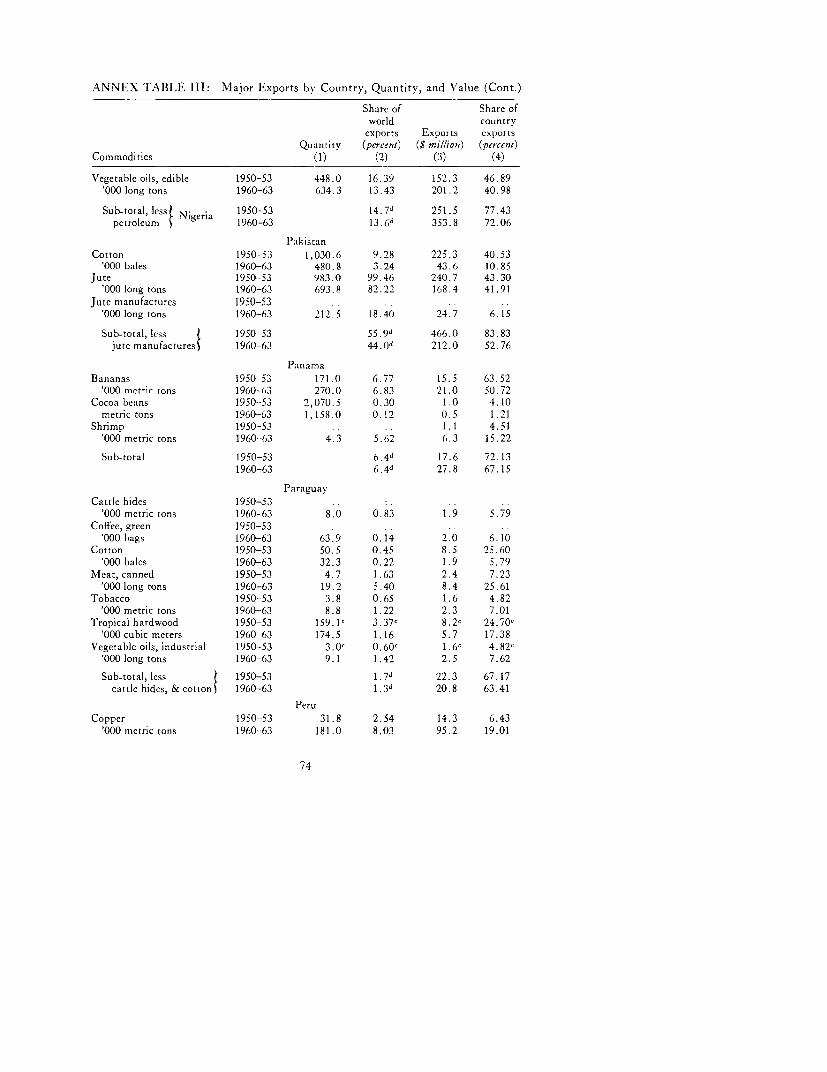
ANNEX TABLE III: Major Exports by Country, Quantity, and Value (Cont.)
Share of Share ofworld countryexports Exports exports
Quantity (percent) (8 mi//ion) (percent)
Commodities (1) (2) (3) (4)
Vegetable oils, edible 1950-53 448.0 16.39 152.3 46.89'000 long tons 1960-63 634.3 13.43 201.2 40.98
Sub-total, less1 N. 1950-53 14.7d 251.5 77.43petroleum geria 1960-63 13.6d 353.8 72.06
PakistanCotton 1950-53 1,030.6 9.28 225.3 40.53
'000 bales 1960-63 480.8 3.24 43.6 10.85Jute 1950-53 983.0 99.46 240.7 43.30
'000 long tons 1960-63 693.8 82.22 168.4 41.91Jute manufactures 1950-53 .. ..
'000 long tons 1960-63 212.5 18.40 24.7 6.15
Sub-total, less 1950-53 55.9d 466.0 83.83jute manufactures 1960-63 44. O 212.0 52.76
PanaimaBananas 1950-53 171.0 6.77 15.5 63.52
'000 metric tons 1960-63 270.0 6.83 21.0 50.72Cocoa beans 1950-53 2,070.5 0.30 1.0 4.10
metric tons 1960-63 1,158.0 0.12 (.5 1.21Shrimp 1950-53 . . . 1.1 4.51
'000 metric tons 1960-63 4.3 5.62 6.3 15.22
Sub-total 1950-53 6.4d 17.6 72.131960-63 6.4d 27.8 67.15
ParaguayCattle hides 1950-53 .
'000 metric tons 1960-63 8.0 0.83 1.9 5.79Coffee, green 1950-53 .. ..
'000 bags 1960-63 63.9 0.14 2.0 6.10Cotton 1950-53 50.5 0.45 8.5 25.60
'000 bales 1960-63 32.3 0.22 1.9 5.79Meat, canned 1950-53 4.7 1.63 2.4 7.23
'OOOlong tons 1960-63 19.2 5.40 8.4 25.61Tobacco 1950-53 3.8 0.65 1.6 4.82
'000 metric tons 1960-63 8.8 1.22 2.3 7.01Tropical hardwood 1950-53 159.1' 3.37, 8.2' 24.70'
'OOOcubicmeters 1960-63 174.5 1.16 5.7 17.38Vegetable oils, industrial 1950-53 3.0' 0.60' 1.6' 4.82'
'000 long tons 1960-63 9.1 1.42 2.5 7.62
Sub-total, less 1950-53 1.7d 22.3 67.17cattle hides, & cotton 1960-63 1.3d 20.8 63.41
PeruCopper 1950-53 31.8 2.54 14.3 6.43
'000 metric tons 1960-63 181.0 8.03 95.2 19.01
74
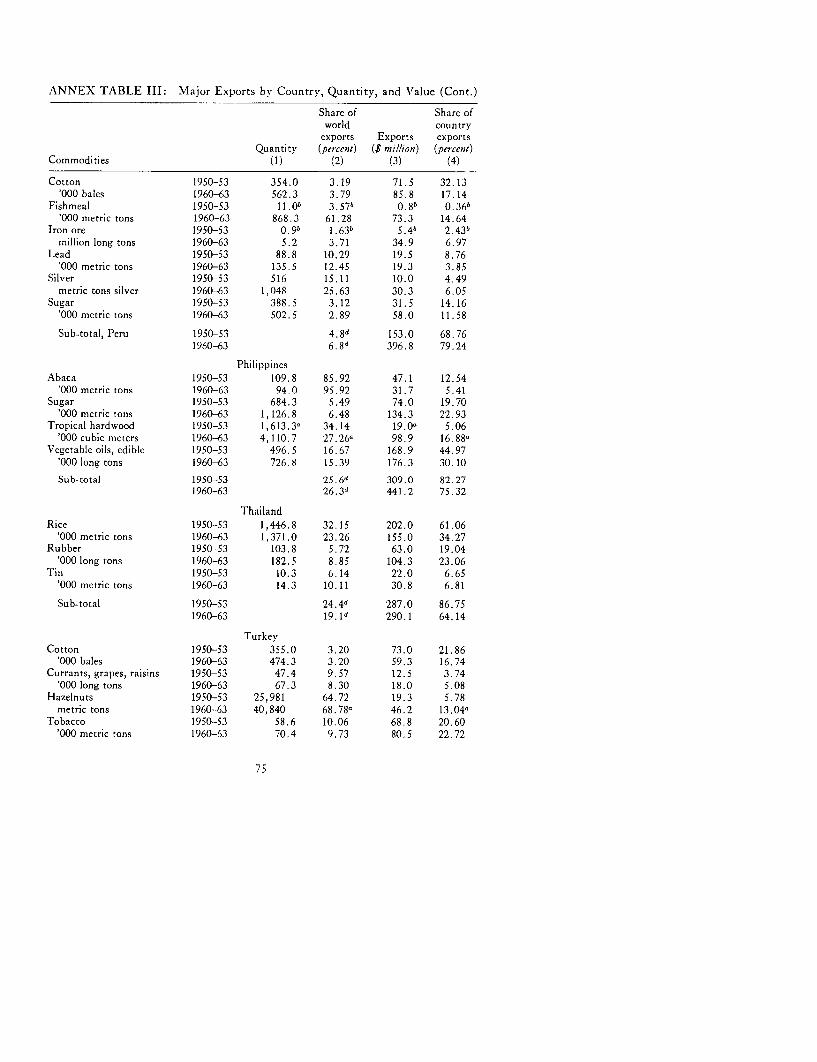
ANNEX TABLE III: Major Exports by Country, Quantity, and Vlalue (Cont.)
Share of Share ofworld country
exports Exports exportsQuantity (percent) ($ million) (percent)
Commodities (1) (2) (3) (4)
Cotton 1950-53 354.0 3.19 71.5 32.13'000 bales 1960-63 562.3 3.79 85.8 17.14
Fishmeal 1950-53 1l.Ob 3 57b 0.8b 0.36b'000 metric tons 1960-63 868.3 61.28 73.3 14.64
Iron ore 1950-53 0.9b 1 .63b 5.4b 2.43bmillion long tons 1960-63 5.2 3.71 34.9 6.97
Lead 1950-53 88.8 10.29 19.5 8.76'000 metric tons 1960-63 135.5 12.45 19.3 3.85
Silver 1950-53 516 15.11 10.0 4.49metric tons silver 1960-63 1,048 25.63 30.3 6.05
Sugar 1950-53 388.5 3.12 31.5 14.16'000 metric tons 1960-63 502.5 2.89 58.0 11.58
Sub-total, Peru 1950-53 4.8d 153.0 68.761960-63 6.8d 396.8 79.24
PhilippinesAbaca 1950-53 109.8 85.92 47.1 12.54
'000 metric tons 1960-63 94.0 95.92 31.7 5.41Sugar 1950-53 684.3 5.49 74.0 19.70
'000 metric tons 1960-63 1,126.8 6.48 134.3 22.93Tropical hardwood 1950-53 1,613.30 34.14 19.0a 5.06
'OOOcubicmeters 1960-63 4,110.7 27.26, 98.9 16.880Vegetable oils, edible 1950-53 496.5 16.67 168.9 44.97
'O00longtons 1960-63 726.8 15.39 176.3 30.10Sub-total 1950-53 25.6d 309.0 82.27
1960-63 26.3d 441.2 75.32
ThailandRice 1950-53 1,446.8 32.15 202.0 61.06
'000 metric tons 1960-63 1,371.0 23.26 155.0 34.27Rubber 1950-53 103.8 5.72 63.0 19.04
'000 long tons 1960-63 182.5 8.85 104.3 23.06Tin 1950-53 10.3 6.14 22.0 6.65
'000 metric tons 1960-63 14.3 10.11 30.8 6.81
Sub-total 1950-53 24.4d 287.0 86.751960-63
1 9.1 d 290.1 64.14
TurkeyCotton 1950-53 355.0 3.20 73.0 21.86
'000 bales 1960-63 474.3 3.20 59.3 16.74Currants, grapes, raisins 1950-53 47.4 9.57 12.5 3.74
'000 long tons 1960-63 67.3 8.30 18.0 5.08Hazelnuts 1950-53 25,981 64.72 19.3 5.78
metric tons 1960-63 40,840 68.780 46.2 13.040Tobacco 1950-53 58.6 10.06 68.8 20.60
'000 metric tons 1960-63 70.4 9.73 80.5 22.72
75
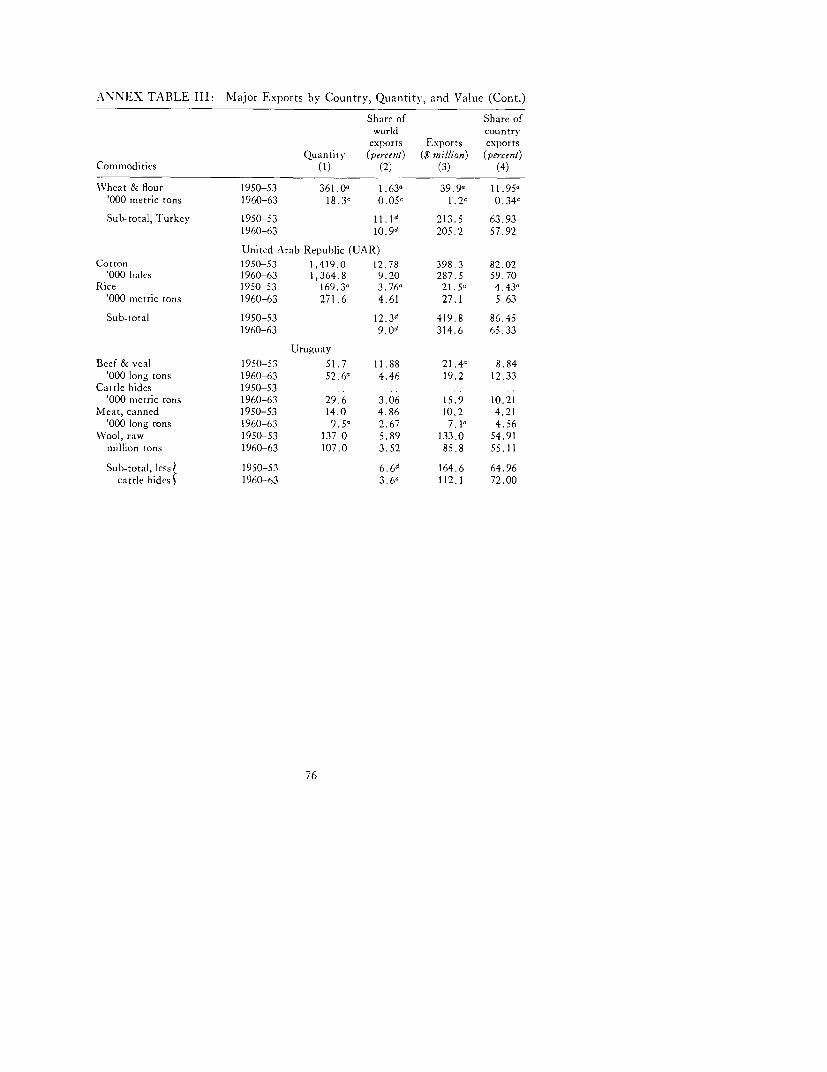
ANNEX TABLE III: Major Exports by Country, Quantity, and Value (Cont.)
Share of Share ofworld country
exports Exports exportsQuantity (percent) ($ mi//ion) (percent)
Commodities (1) (2) (3) (4)
Wheat & flour 1950-53 361.0, 1.63' 39.9n 11.95a'000 metric tons 1960-63 18.3' 0.05' 1.2' 0.34'
Sub-total, lurkey 1950-53 II.Id 213.5 63.931960-63 10.9d 205.2 57.92
United Arab Republic (UAR)Cotton 1950-53 1,419.0 12.78 398.3 82.02
'000 bales 1960-63 1,364.8 9.20 287.5 59.70Rice 1950-53 169.3a 3.76a 21.5 4.43'
'000 metric tons 1960-63 271.6 4.61 27.1 5.63
Sub-total 1950-53 12.3d 419.8 86.451960-63 9,0d 314.6 65.33
UruguayBeef & veal 1950-53 51.7 11.88 21,4a 8.84
'000 long tons 1960-63 52.6' 4.46 19.2 12.33Cattle hides 1950-53 .. .. .
'000 metric tons 1960-63 29.6 3.06 15.9 10.21Meat, canned 1950-53 14.0 4.86 10.2 4.21
'000 long tons 1960-63 9.5' 2.67 7.1' 4.56WVool, raw 1950-53 137.0 5.89 133.0 54.91
million tons 1960-63 107.0 3.52 85.8 55.11
Sub-total, less 1950-53 6.6d 164.6 64.96cattle hides( 1960-63 3.6a 112.1 72.00
76

Major Exports of Free WVorld and 29 Countries
29 countries'Free world share of
free worldExports exports
($ mil/ion) Quantity (percent)Commodities (1) (2) (3)
Abaca 1950-53 53.5 127.8 85.92'000 metric tons 1960-63 32.7 98.0 95.92
Bananas 1950-53 407.0 2,525.0 55.69'000 metric tons 1960-63 538.1 3,953.8 53.51
Bauxite 1950-53 62.0 9,692.5 7.84'000 metric tons 1960-63 227.4 23,958.8 28.49
Beef & veal 1950-53 193.7 435.3 36.07'OOOlongtons 1960-63 675.6 1,180.5 35.12
Cattle hides 1950-53 .
'000 metric tons 1960-63 333.1 967.6 22.72
Cocoa beans 1950-53 454.5 694,400 34.90metric tons 1960-63 449.0 995,375 31.53
Coffee, green 1950-53 2,221.4 31,962 79.60'000 bags 1960-63 1,810.4 45,345 67.88
Copper 1950-53 720.8 1,252.3 37.71'000 metric tons 1960-63 1,366.6 2,255.0 35.50
Cotton 1950-53 2,275.6 11,100.5 44.84'000 bales 1960-63 2,009.4 14,835.8 43.87
Cotton textiles 1950-53 1,125.3 560.7 15.52'000 metric tons 1960-63 1,199.6 607.3 12.98
Currants, grapes, raisins 1950-53 116.7 495.1 28.13'000 long tons 1960-63 221.3 810.6 24.45
Fishmeal 1950-53 36.7 308.0 3.57'000 metric tons 1960-63 138.6 1,417.0 61.28
Hazelnuts 1950-53 30.2 40,142 64.72metric tons 1960-63 64.7 59,378 68.78
Iron ore 1950-53 391.2 55.1 7.44million long tons 1960-63 1,348.9 140.0 12.64
Jute 1950-53 250.3 988.3 99.46'000 long tons 1960-63 205.7 843.8 82.22
Jute manufactures 1950-53 381.1 851.5 86.47'O00longtons 1960-63 424.2 1,155.0 90.16
Lead 1950-53 248.0 863.0 40.65'000 metric tons 1960-63 143.1 1,088.0 31.85
Maize 1950-53 328.70 44,836.70 15.12,hundred metric tons 1960-63 747.1 150,531.3 16.07
Meat, canned 1950-53 248.5 288.3 30.66'000 long tons 1960-63 335.7 355.4 25.94
Petroleum 1950-53 3,280.2 213.0 2.113million long tons 1960-63 8,043.1I 469.1, 1.24
Pulses 1950-53 69.8b 558.0b 12.31'000 metric tons 1960-63 149.9 1,082.1 6.59
Rice 1950-53 689.4 4,500.0 38.32'000 metric tons 1960-63 667.3 5,895.0 29.54
77
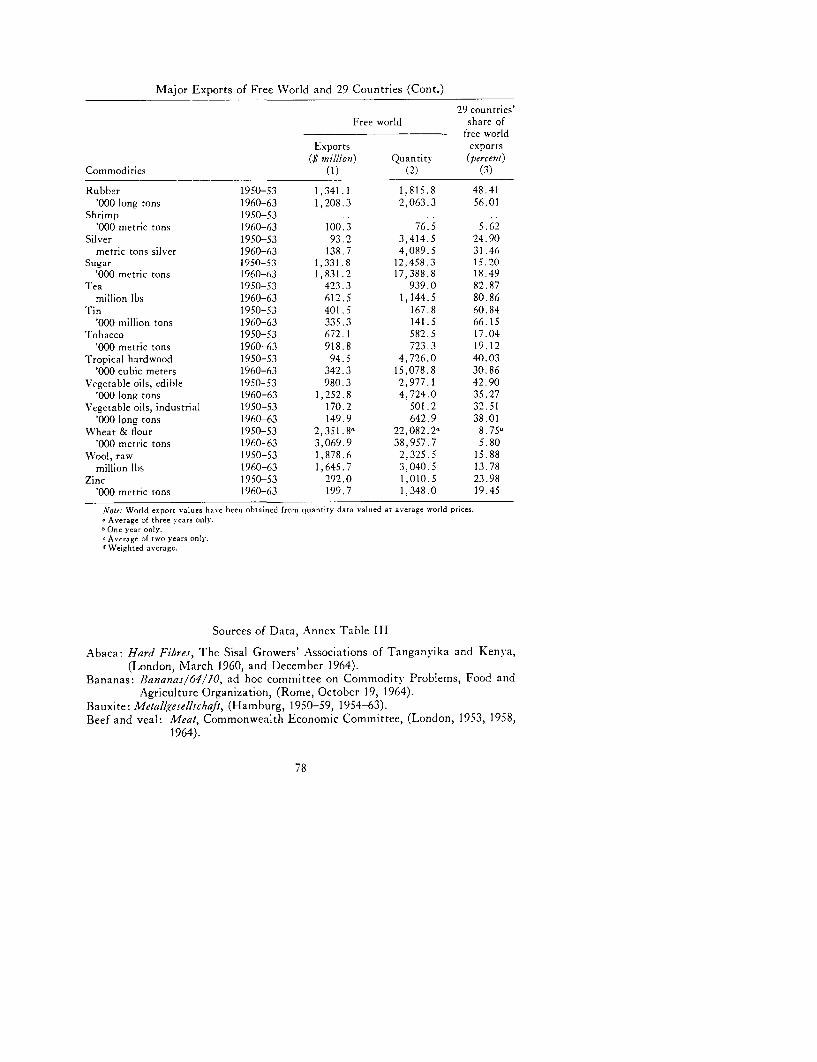
Major Exports of Free World and 29 Countries (Cont.)
29 countries'Free world share Qf
free worldExports exports
($ million) Quantity (percent)Commodities (1) (2) (3)
Rubber 1950-53 1,341.1 1,815.8 48.41'000 long tons 1960-63 1,208.3 2,063.3 56.01
Shrimp 1950-53'000 metric tons 1960-63 100.3 76.5 5.62
Silver 1950-53 93.2 3,414.5 24.90metric tons silver 1960-63 138.7 4,089.5 31.46
Sugar 1950-53 1,331.8 12,458.3 15.20'000 metric tons 1960-63 1,831.2 17,388.8 18.49
Tea 1950-53 423.3 939.0 82.87million lbs 1960-63 612.5 1,144.5 80.86
Tin 1950-53 401.5 167.8 60.84'O00milliontons 1960-63 335.3 141.5 66.15
Tobacco 1950-53 672.1 582.5 17.04'000 metric tons 1960-63 918.8 723.3 19.12
Tropical hardwood 1950-53 94.5 4,726.0 40.03'000 cubic meters 1960-63 342.3 15,078.8 30.86
Vegetable oils, edible 1950-53 980.3 2,977.1 42.90'000 long tons 1960-63 1,252.8 4,724.0 35.27
Vegetable oils, industrial 1950-53 170.2 501.2 32.51'000 long tons 1960-63 149.9 642.9 38.01
Wheat & flour 1950-53 2,35S.8r 22,082.2' 8.75S'000 metric tons 1960-63 3,069.9 38,957.7 5.80
Wool, raw 1950-53 1,878.6 2,325.5 15.88million lbs 1960-63 1,645.7 3,040.5 13.78
Zinc 1950-53 292.0 1,010.5 23.98'000 metric tons 1960-63 199.7 1,348.0 19.45
Note: World export valuies have been obtained from qutantity data valued at average world prices.Average of three years only.One year only.Average of two years only.Weighted average.
Sources of Data, Annex Table III
Abaca: Hard Fibres, The Sisal Growers' Associations of Tanganyika and Kenya,(London, March 1960, and December 1964).
Bananas: Bananas/64/10, ad hoc committee on Commodity Problems, Food andAgriculture Organization, (Rome, October 19, 1964).
Bauxite: Metallesel/lschaft, (Hamburg, 1950-59, 1954-63).Beef and veal: Meat, Commonwealth Economic Committee, (London, 1953, 1958,
1964).
78

Cattle hides: Hides and Skins _2uarterly, various issues, CEC, (London).Cocoa beans: International Financial Statistics, Supplement of 1965-66, Inter-
national Monetary Fund.Coffee, green: Annual Coffee Statistics, Pan American Coffee Bureau, (New York,
1950-64); Coffee Problem Revisited, Statistical Appendix, IBRD,(June 18, 1963); Complete Coffee Coverage, Geo. Gordon Paton & Co.,(New York, 1957-59, 1964), figures for Costa Rica, Nicaragua,Ecuador, and Guatemala.
Copper: Metallgesellschaft, (Hamburg, 1950-59, 1954-63); UN Yearbook of Inter-national Trade Statistics, for Chile.
Cotton: Cotton World Statistics, Special Base Book, International Cotton AdvisoryCommittee, Vol. 16, Nos. 9-10, Part II, (Washington, D.C., April 1963);Cotton, Monthly Review of the World Situation, various issues, ICAC;Extra-Long Staple Cotton, IBRD, (April 16, 1964).
Cotton textiles: UN Yearbook of International Trade Statistics.Currants, grapes, and raisins: Fruit, Commonwealth Economic Committee, (Lon-
don, 1956, 1958, 1964).Fishmeal: Oil World Zuarterly, (Hamburg) April issues.Hazelnuts: Edible Nuts Report, various issues, Gill & Duffus, (London).Iron ore (metal content): Iron and Steel and Alloying Metals, CEC, (London);
UN Yearbook of International Trade Statistics, for Chile.Jute and jute manufactures: Industrial Fibres, various issues, CEC, (London);
Statistical Yearbook of the European Jute Industry,(Paris, 1964).
I.ead: Metallgesellschaft, (Hamburg, 1950-59, 1954-63).Maize (corn): FAQ Trade Yearbook, various issues.Meat, canned: International Financial Statistics, Supplement of 1965-66, IMF.Petroleum, crude: Statistical Summary of the Mineral Industry, various issues,
Overseas Geological Surveys, (London); Statistical Review of theWorld Oil Industry, various issues, B.P. Co., Ltd. (Lonclon).
Pulses: Ethiopian trade statistics; FAQ Trade Yearbook, various issues.Rice (milled equivalent): Table compiled from FA10 Trade Yearbook, FAQ Rice
Report 1961 and worksheets of the FAO Rice Section.Rubber: Rubber Statistical Bulletin, International Rubber Study Group, (London,
October 1959, March 1965).Shrimp: Yearbook of Fishery Statistics, FAO, (1963).Silver: Metallgesellschaft, (Hamburg, 1950-59, 1954-63).Sugar, raw: International Sugar Council Statistical Bulletin, various issues, (Lon-
don); The World Sugar Economy, Structure and Policies, Vol. II, ISC,(London); The World Sugar Economy in Figures, 1880-1950, FAO.
Tea: Bulletin of Statistics, various issues, International Tea Committee, (London).Tin: Metallgesellschaft, (Hamburg, 1950-59, 1954-63).Tobacco: FA0 Trade Yearbook, various issues.Tropical hardwood (including logs, posts, sawnwood, veneer sheets, and plywood):
FAO Yearbook of Forest Product Statistics, various issues.Vegetable oils and oilseeds (oil equivalent), edible and industrial (industrial oils
are linseed oil, tung oil, and castor oil): Vegetable Oils and Oilseeds, CEC, (London,1956, 1959, 1965); International Financial Statistics, Supplement of 1965-66,IMF.
79

Wheat and flour (wheat equivalent): The Wheat Review, Canadian Wheat Board,various issues, (Ottawa, August 1964);FA4O Trade Yearbook, various issues.
W'ool, raw (actual weight): Industrial Fibres, Commonwealth Economic Com-mittee, (London, 1950, 1951); World Wool Trade inWool and Wool Textiles, CEC, (London, 1965); Com-modity Note 48, IBRD, (February 11, 1965).
Zinc: Metallgesellicha/t, (Hamburg, 1950-59, 1954-63).
80
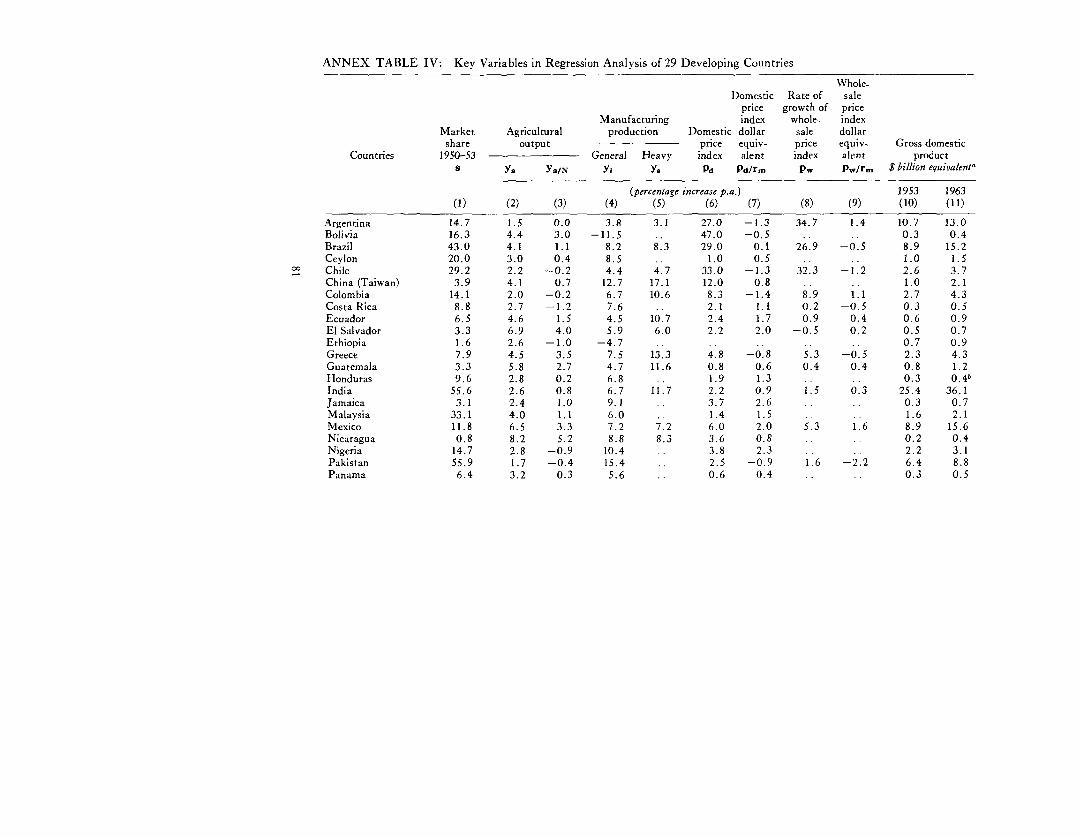
ANNEX TABLE IV: Key Variables in Regression Analysis of 29 Developing Countries
Whole-Domestic Rate of sale
price growth of priceManufacturing index whole- indexMarket Agricultural production Domestic dollar sale dollar
share output price equiv- price equiv- Gross domesticCountries 1950-53 General Heavy index alent index alent products Ye Ya,N Yi Ys Pd Pd/r. Pw Pw/rm $ billion equivalent,
(percentage increase p.a.) 1953 1963(1) (2) (3) (4) (5) (6) (7) (8) (9) (10) (11)Argentina 14.7 1.5 0.0 3.8 3.1 27.0 -1.3 34.7 1.4 10.7 13.0Bolivia 16.3 4.4 3.0 -11.5 .. 47.0 -0.5 .. .. 0.3 0.4Brazil 43.0 4.1 1.1 8.2 8.3 29.0 0.1 26.9 -0.5 8.9 15.2Ceylon 20.0 3.0 0.4 8.5 .. 1.0 0.5 1.0 1.5Chile 29.2 2.2 -0.2 4.4 4.7 33.0 -1.3 32.3 -1.2 2.6 3.7China (Taiwan) 3.9 4.1 0.7 12.7 17.1 12.0 0.8 .. .. 1.0 2.1Colombia 14.1 2.0 -0.2 6.7 10.6 8.3 -1.4 8.9 1.1 2.7 4.3Costa Rica 8.8 2.7 -1.2 7.6 . 2.1 1.1 0.2 -0.5 0.3 0.5Ecuador 6.5 4.6 1.5 4.5 10.7 2.4 1.7 0.9 0.4 0.6 0.9El Salvador 3.3 6.9 4.0 5.9 6.0 2.2 2,0 -0.5 0.2 0.5 0.7Ethiopia 1.6 2.6 -1.0 -4.7 .. .. .. .. .. 0.7 0.9Greece 7.9 4.5 3.5 7.5 13.3 4.8 -0.8 5.3 -0.5 2.3 4.3Guatemala 3.3 5.8 2.7 4.7 11.6 0.8 0.6 0.4 0.4 0.8 1.2Honduras 9.6 2.8 0.2 6.8 .. 1.9 1.3 .. .. 0.3 0.4bIndia 55.6 2.6 0.8 6.7 11.7 2.2 0.9 1.5 0.3 25.4 36.1Jamaica 3.1 2.4 1.0 9.1 .. 3.7 2.6 .. .. 0.3 0.7Malaysia 33.1 4.0 1.1 6.0 .. 1.4 1.5 .. .. 1.6 2.1Mexico 11.8 6.5 3.3 7.2 7.2 6.0 2.0 5.3 1.6 8.9 15.6Nicaragua 0.8 8.2 5.2 8.8 8.3 3.6 0.8 .. .. 0.2 0.4Nigeria 14.7 2.8 -0.9 10.4 .. 3.8 2.3 . . . 2.2 3.1Pakistan 55.9 1.7 -0.4 15.4 .. 2.5 -0.9 1.6 -2.2 6.4 8.8Panama 6.4 3.2 0.3 5.6 . 0.6 0.4 .. .. 0.3 0.5
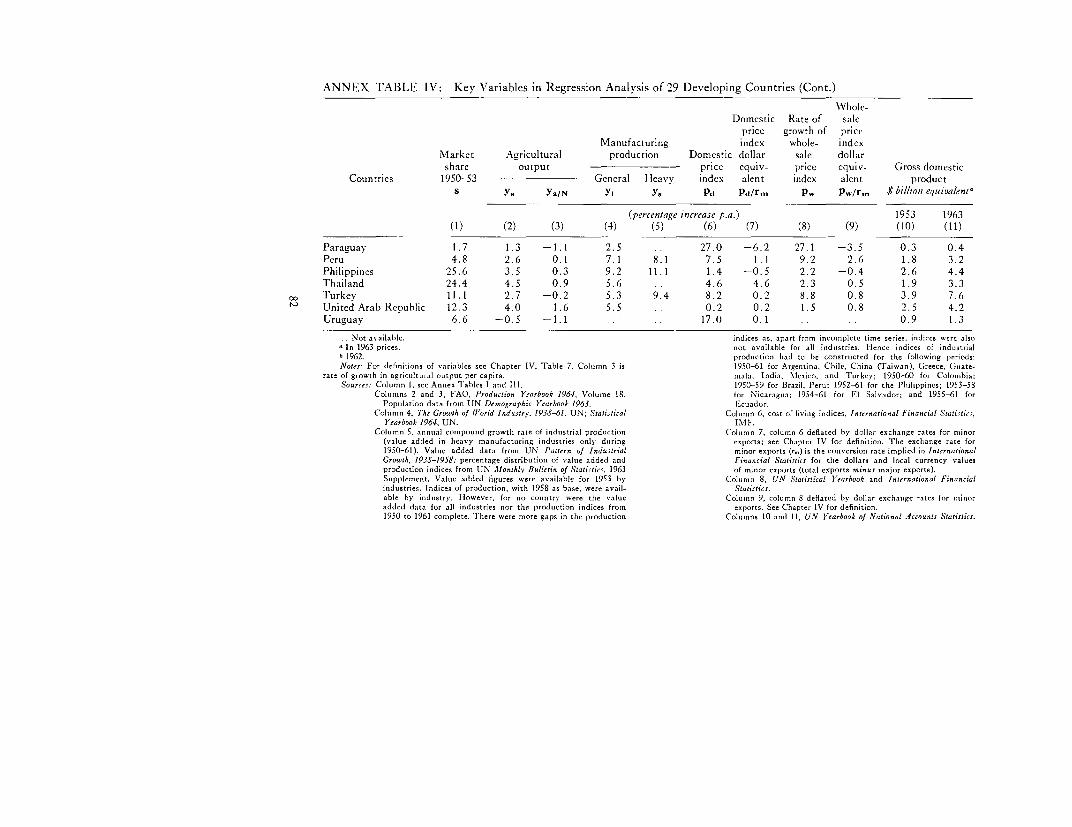
ANNEX TABLE IV: Key Variables in Regression Analysis of 29 Developing Countries (Cont.)
Whole-D)omestic Rate of sale
price growth of priceManufacturing index whole- index
Market Agricultural production Domestic dollar sale dollarshare output - price equiv- price e(juiv- Gross domestic
Countries 1950-53 General Heavy index alent index alent productS Y. Y.lN Yi Ys Pd Pd/rm Pw P,/rm $ billion equivalentn
(percentage increase p.a.) 1953 1963(1) (2) (3) (4) (5) (6) (7) (8) (9) (10) (11)
Paraguay 1.7 1.3 -I .1 2.5 27.0 -6.2 27.1 -3.5 0.3 0.4Peru 4.8 2.6 0.1 7.1 8.1 7.5 1.1 9.2 2.6 1.8 3.2Philippines 25.6 3.5 0.3 9.2 11.1 1.4 -0.5 2.2 -0.4 2.6 4.4Thailand 24.4 4.5 0.9 5.6 4.6 4.6 2.3 0.5 1.9 3.3'I'urkey 11.1 2.7 -0.2 5.3 9.4 8.2 0.2 8.8 0.8 3.9 7.6United Aral) Rcpublic 12.3 4.0 1.6 5.5 .. 0.2 0.2 1.5 0.8 2.5 4.2Uruguay 6.6 -0.5 -1.1 . 17.0 0.1 0.9 1.3
.. Not available. indices as, apart from incomplete tine series, indices were alsoa In 1963 prices. not available for all indlustries. Ifence indices of indulstrialb 1962. production had to be constructed for the folloeing periods:Notse: For definitions of variables see Cfiapter IV, Table 7. Column 3 is 1950-61 for Argentina, Chile. China (Taiwan), Greece, Guate-
rate of growth in agricultural output per capita. mala, India, Mlexico, and Turkey; 1950-60 for Colombia;Sourres: Column 1. sce Annex T'ables I and 111. 1950-59 for Brazil, Peru; 1952-61 for the Philippines; 1953-58
Coluimns 2 and 3, FAO, Podurinio Yearbook /964, Volume 18. for Nicaragua; 1954-61 for El Salvador; and 1955-61 forPopulation data from UN Demographic Yearbook /963. Ecuador.
Column 4. The Growth of Iforld Industrv, 1938-61, UN; Statistical Column 6, cost of living indices, /nternational Financial Statistics,Yearbook 1964, UN. INI F.
Column 5, annual compound growlth rate of industrial production Column 7, column 6 deflated by dollar exchange rates for rninor(value added in heavy manufacturing industries only during exports; see Chapter IV for definition. The exchange rate for1950-61). Valie added data from UN Pattern of Industrial minor exports (r,,,) is the conversion rate implied in InternationalGrousth, 1938-1958: percentage distribution of valie added and Financial Statiitics for the dollars and local currency valuesproduction indices from UN Mo/nnthly Bulletin of Statistics. 1963 of minor cxports (total exports minus major exports).Supplement. Valie added figures were available for 1953 by Column 8. UN Statitical Yearbook and International Financialindustries. Indices of production, with 1958 as base, were avail- Statistics.able by industry. TTowever, for no country were the value Column 9, cohmn 8 deflated by dollar exchangc rates for minoradded data for all industries nor the production indices frotn exports. See Chapter IV for definition.1950 to 1961 complete. 'I'here were more gaps in the production Columns 10 and 11, UN Yearbook of National .Jcco-nts Statistics.

ANNEX TABLE V: Export Growth Rates, Trade Position Indices, and Domestic Price Changes
Growth rates, 1950-53 to 1960-63 (percent p.a.) Domestic -
Number Major commodity priceof lTrade position export shares increase
countries index (percent) 1950 to 1963in l'otal Major Minor Output (percent
group exports exports exports (GDP) 1950-53 1960-63 1950-53 1960-63 p.a.)
1. All 29 countries 29 2.8 2.0 5.9 4.7 11.7 11.3 76.8 70.6 9.3"2. Countries with ahove-average W. 10 0.4 -0.6 4.3 4.2 24.2 21.0 79.6 72.1 13.03. Countries with below-average W. 19 4.1 3.4 6.7 4.9 5.2 6.2 75.3 69.7 7.3a4. "Big" countries 10 1.8 1.0 4.3 4.8 18.8 16.8 69.7 63.0 12.25. "Small" countries 13 3.6 2.6 7.7 4.7 9.0 9.1 82.0 75.0 4.56. (2) and (4) 6 0.6 -0.4 4.7 4.4 26.9 22.6 75.1 67.6 12.77. (3) and (5) 10 4.1 3.3 8.0 4.9 5.0 5.5 80.2 74.2 5.28. (3) and (4) 4 3.5 3.2 3.8 5.3 6.7 8.1 61.6 56.1 11.59. (2) and (5) 3 1.7 0.4 6.5 4.1 22.6 21.1 87.7 77.8 2.3
10. Countries with price inflation 7 0.2 0.2 0.2 4.1 11.5 11.4 69.6 70.0 27.411. Countries with price stability 21 3.6 2.5 7.8 4.9 12.3 11.7 79.3 70.6 3.3"
Line (2): value of iY 1950-53 equal to or greater than the average for all Line (10): annual price increase equal to or greater than average for allcountries (11.7). countries (9.3%).
Line (3): value of II' 1950-53 below 11.7. Line (11): change less than average annual price increase (9.3%).Line (4): 'Big" countries' steel consumption equal to or greater thian 400,000 o Domestic price increases not available for Ethiopia.
tons. Note: Data for each group are unweighted averages.Line (5): "Small" countries' steel consumption less than 400,000 tons. Sossrc,s: Based on Annex Tables 1. 11, and IV. Compare Table 2 of text.Line (6): corresponds with line 4 in Table 2 of text. For list of countries in each category see Annex 'I'able VI.Line (7): corresponds with line 5 in Table 2 of text.

ANNEX TABLE VI: Grouping of 29 Countries by Characteristics Listed inTable V
(2) High index (1) Large size (2) and (4) Price inflation(ten) (ten) (six) (seven)
Bolivia Argentina Brazil ArgentinaBrazil Brazil Chile BoliviaCeylon Chile Colombia BrazilChile Colombia India ChileColombia Greece Pakistan China (Taiwan)
PhilippinesIndia India ParaguayMalaysia Mexico (3) and (5) UruguayNigeria Pakistan (ten)Pakistan Philippines Price stabilityPhilippines Turkey China (Taiwan) (twenty-one)
Costa Rica(3) Low index (5) Small size El Salvador Ceylon
(ninetcen) (thirteen) Guatemala ColombiaHonduras Costa Rica
Argentina Ceylon EcuadorChina (Taiwan) China (Taiwan) Nicaragua El SalvadorCosta Rica Costa Rica PanamaEcuador El Salvador Peru GrececEl Salvador Guatemala 'I'hailand Guatemala
Uruguay HondurasEthiopia Honduras IndiaGuatemala Malaysia (3) and (1) JamiacaGreece Nicaragua (four)Honduras Nigeria MalaysiaJamaica Panama Argentina Mexico
Greece NicaraguaMcxico Peru Mexico NigZeriaNicaragua Thailand Turkey PakistanPanama UruguayParaguay (2) and (5) PanamaPeru (three) Peru
PhilippinesThailand Ceylon 'I'hailand'I'urkey Malaysia TurkeyUnited Arab Republic Nigeria United Arab RepublicUruguay
Notees For descriptions .f characteristics, sec Annex ''able V. Data on size are not available for the following:Bolivia, Ecuador, Ethiopi., Jamaica, Paragoay, and United Arab Repubbc. Data on donestic price increasesare not available for Ethiopia.
84

ANNEX TABLE VII: Consumption and Production of Crude Steel, 1963(per annum)
Total newcapacity planned
or under GrossConsumption' Production construction domestic
productiCountry (thousand tons) ($ billion)
Steel producersIndia . 7,280 5,974' 11,506d 36.1Mexico 2,167 1,974' 2, 596d 15.6Brazil 3,393 2,812' 1,858d 15.2Argentina 1,354 894' 126d 13.0Pakistan 735 12- 348d 8.8Turkey 817 363' 1,137" 7.6Philippines 594 71' 949c 4.4Colombia 465 214d 250" 4.3Greece 666 209' 4.3United Arab Republic .. 200' 200h 4.2Chile 628 489d 375a 3.7Peru 259 72d . 3.1China (Taiwan) 397 215d 2.1Uruguay 67 71 1.3
Average 1,477.8 964.7 1,381.8 8.8Average for countries
with steel productionof 200,000 tons orover 1,562.9 1,334.4 2,418.1 10.6
Non-steel producersThailand 365 - . . 3.3Nigeria 213 - 3.2Malaysia 273 - 200 2.1Ceylon 95 . 1.5Guatemala - 1.2Ecuador .. . . 0.9Ethiopia .. - 0.9Jamaica 0. 0.7El Salvador - 0.7Panama 7e - . . 0.5Costa Rica 7e - . . 0.5Paraguay .. - 0.4Honduras I e - 0.4bNicaragua 1g - .. 0.4Bolivia 0.4
Average 96.2 - 13.3 1.1Average for countries
with steel productionof 200,000 tons orover 283.7 - 200.0 -
Average, all 29 countries 860.2 482.4 674.0 4.9
Note: Countries are listed in descending order of gross domestic product." IBRD estimate. .. Not available.b1962. -Nil or negligible.I Less than 1,000 tons.Sourcts: d UN Statistical Yearbook, 1964, pp. 295, 379, 380.
The Commonwealth Economic Committee, Iron and Steel and Alloying Aletals, (London), p. 63.f Stahl und Eistn, April 22, 1965, No. 8, p. 497.g Secretaria Integraci6n Econ6mica Centro Americana, Cuarto Compendio Estadistico Centroamericano,
(March 1965), I, p. 106-7.h Federation of Industries in the United Arab Republic, Yearbook 1965.
Yearbook of Nationl Accounts Statistics, UN 1964.
85

ANNEX TABLE VIII: Alternative Estimates of V'ariations in M'inor Exports,1960-63
Minor exports D.(alternative D,, (Table 3, Alternativedefinition) (Table 3, D,, column 5) D,n
1950-53 1960-63 column 2) Alternative ------- -- --- (percent of 1960-63
($ milliou) minor exports)Countries (1) (2) (3) (4) (5) (6)
Argentina 672.0 769.5 -299.5 -243.3 -67.1 -31.6Bolivia 36.2 18.6 -18.4 -36.0 -142.6 -193.3Brazil 391.7 524.0 6.2 42.2 1.3 8.0Cevlon 35.4 31.8 -19.7 -21.6 -61.9 -67.8Chile 163.3 169.8 -100.2 -76.3 -80.5 -45.0China (TI'aiwan) 39.0 157.9 86.5 99.1 74.4 62.8Colombia 25.5 63.7 26.6 25.3 41.8 39.7Costa Rica 8.6 19.8 6.7 6.8 45.3 34.6Ecuador 17.1 17.9 0.1 -7.9 0.7 -44.0El Salvador 4.7 28.5 21.7 21.4 76.1 75.2Ethiopia 13.6 26.2 3.1 5.7 15.0 21.8Greece 50.9 123.1 28.0 46.4 29.6 37.7Guatemala 18.8 38.6 -2.9 10.3 -11.8 26.6Honduras 9.4 28.4 11.1 14.2 54.4 50.1India 622.2 781.5 -124.0 -156.3 -15.9 -20.0Jamaica 18.1 81.0 54.7 53.7 67.5 66.3Malaysia 164.0 288.6 44.3 41.4 22.4 14.4Mexico 390.6 626.3 126.2 37.6 25.9 6.0Nicaragua 8.7 25.7 10.4 12.6 48.4 49.0Nigeria 99.7 194.3 0.1 44.0 0.1 22.7Pakistan 89.9 189.8 34.3 54.3 20.8 28.6Panama 8.9 20.4 3.7 7.0 27.2 34.3Paraguav 14.1 16.8 -7.8 -4.5 -96.3 - 26.51Peru 105.2 261.7 2.8 103.1 2.7 39.4Philippines 66.6 144.6 47.7 44.2 33.0 30.6TIhailand 43.8 162.2 ')8.5 96,.2 6ff 07 59.3Trurkey 172.8 168.3 -26.1 -92.1 -17.5 -54.8Unitcd Arab Republic 87.3 194.1 71.2 62.5 42.6 32.2Uruguay 87.8 50.7 -85.2 -81.6 -307.6 -161.0
Not': For definitions of D)m see Tables 3 and 7. Columns 1 and 2 are values computed under the broadeneddefinitions of minor exporcs givent in Chapter 111, n
2. Column 3 is from 'l'able 3, column 2, in the tent, attd col-un 5
is frotn Table 3, colutni S. ClIunmn 4, showing deviations fron, nm,rmn (1960-63). is hased on coilumn 2. ColttIuun 6relates data in colu,mns 3 and 4 as percentages of actuial 1960-63 average ninor exports (Annex 'I'able 11). Forthese series, columns S and 6, there is a higih rank correlation (0.92). Thue difTerenices between the tsv- series areaccounted for by Ecuador (rice), Guatemala (cotton), Mexico (coppc,), Nigeria (rubber and cotton), and Paraguay(industrial oils and tobacco). Ecuador's rice exports and Mexico's coffee exports declined betwcen 1950-53 and1960-63; the exports listed for the other count,ri-c i icreased during that period.
86

World Bank Staff Occasional Papers (editor, Hugh Latimer)
1 .The Economic Choice between Hydroelectric and
Thermal Power Developments, Her-man G. van der Tak $1.00
2.Quantification of Road User Savings,
Jan de Weille $1.00
3.The Export Experience of Developing Countries,
Barend a. de Vries $1.50
4.Sector and Project Planning in Transportation,
Hans a. Adler $1.50
Export Sales RepresentativesTHE UNITED KINGDOM
Oxford University Press, Ely House, 37 Dover Street, London W. i, England
CONTINENTAL EUROPE, AFRICA, THE NEAR AND MIDDLE EAST, PACIFIC ISLANDS,
LATIN AMERICA
International Book Export Group, P. 0. Box 231, Princeton, New Jersey08S40
MEXICO
Centro Interamericano de Libros Academicos (CILA), 31 Sullivan-Bis,Mexico 4, D. F.
SOUTH AFRICA, INDIA, PAKISTAN, MALAYSIA, AUSTRALIA, NEW ZEALAND, HONG
Ko NG
International Book Export Group, P. 0. Box 231, Princeton, New Jerseyo8540, and Oxford University Press, Ely House, 37 Dover Street, LondonW. I, England
JAPANUnited Publishers Services Ltd., Shimura Building, I, 4-chome, Kojimachi,Chiyoda-ku, Tokyo, Japan, and International Book Export Group, P. 0.Box 231, Princeton, New Jersey 08540
CANADAThe Copp Clark Publishing Company, Ltd., 517 Wellington Street West,Toronto 2B, Ontario
1ll prices subject to change without notice.
Distributed by The Johns Hopkins Press
Baltimore, Md. 21218

INTERNATIONAL BANK FOR RECONSTRUCTION AND DEVELOPMENT
[WORLD BANK|
1818 H STREET, N.W., WASHINGTON, D.C. 20433 U.S.A.Telephone number: EXecuiive 3-6360 Cable address: INTBAFRAD