the evolution of the fin sec revised aug 4 2010 financial services ombudsman (ofso) 46 conclusion...
TRANSCRIPT

THE EVOLUTION OF THE FINANCIAL SECTOR
IN TRINIDAD AND TOBAGO
(1996-2007)
Penelope Forde (Editor)
With contributions from
Daryl Cheong Carlene Coker Kevin Finch
Garvin Gilbert Kester Guy

ii
TABLE OF CONTENTS
Page No.
Introduction 1 1. Commercial Banking 4 2. Non-Bank Financial Institutions 14 3. The Insurance Industry 19 4. Mutual Funds 30 5. Credit Unions 32 6. Small Business Credit and Rural Credit 33 7. Agricultural Development Bank (ADB) 43 8. Venture Capital Incentive Programme 44 9. The Financial Services Ombudsman (OFSO) 46 Conclusion and Afterword 47

2
THE EVOLUTION OF THE FINANCIAL SECTOR
IN TRINIDAD AND TOBAGO
(1996-2007)
Introduction
Financial systems in the Caribbean have evolved over an extended period of
time – from the rigid colonial monetary arrangements to post-independence growth
and development. In some economies the 1980’s represented a difficult period of
time as several countries undertook structural adjustment programmes which had
implications for financial systems. Innovation and liberalization, together with
technological change, began to impact financial systems at the start of the 1990’s. It
is against this background that this present paper examines the evolution of the
financial system in Trinidad and Tobago (TT) between 1996 and 2007. The main
emphasis will be on developments in the banking system, the insurance industry and
mutual funds. The paper closes with a few comments on the Financial Services
Ombudsman.
The Economic Setting
Following a period of stabilization and adjustment (1988-1991) and
macroeconomic reform, the economy of Trinidad and Tobago entered an era of
sustained economic growth and development starting in the mid-1990’s. At the
outset, this period of growth was unlike that of the 1970’s which had been driven by
economic rents from the oil sector. Instead additions to existing capacity in oil,
natural gas and petrochemicals contributed in a major way to the current buoyancy of
the domestic economy, which has experienced 14 years of continuous economic
expansion since 1994. Growth has occurred in both the energy sector and the non-

2
energy sector and in the latter case, trends in Construction, Finance, Insurance and
Real Estate and the Distribution sectors have been the main drivers of growth. The
growth has been accompanied by falling levels of unemployment and, except for the
past three years, relatively low levels of inflation. Real GDP growth averaged 3.8 per
cent between 1994 and 1999 and since 2000 has averaged around 8 per cent. The
country has also enjoyed balance of payments surpluses accompanied by a strong
foreign reserve position. While the public finances have improved so that there are
overall budget surpluses, the continued existence of domestic budget deficits which
are structural in nature has created tensions for monetary policy formulation.
Table 1 Selected Economic Indicators 1997-2007
1997 2000 2003 2005 2007
GDP at current market prices (USM) 5,784.0 7,973.0 10,660 12,127 14,266
Real GDP growth rate (%) 7.5 6.9 14.4 6.1 5.5
Inflation Rate (%) 3.7 3.6 3.8 6.9 7.9
Unemployment Rate (%) 15.0 12.5 10.5 8.0 5.5
Fiscal Balance/GDP (%) 0.1 1.6 1.4 5.4 1.8
Current Account/GDP (%) 14.4 13.2 8.7 23.6 25.8
Overall BOP/GDP (%) 3.0 5.9 2.2 9.7 7.3
External Public Debt (US$M) 1,564.8 1,679.8 1,567.6 1,360.6 1,264.7
WTI (US$/barrel) 20.40 30.30 31.70 56.50 72.30
Gross Official Reserves (US$M) 706.2 1,386.2 2,007.5 4,014.9 6,673.5
SOURCE: Annual Economic Survey, Central Bank of Trinidad and Tobago
Alongside the growth and development in the real sector, the financial sector
has also experienced a series of changes: the commercial banking system has been
characterized by mergers and consolidation; in the credit union sector the top three
largest credit unions operate almost as banks; the size of funds under management
with the mutual funds industry grew sharply and funds were almost equivalent to that

3
of bank deposits; the establishment of a credit rating agency (regional) was an
important milestone in the history of the financial sector.
Table 2
Number of Financial Institutions in Existence,
Selected Years
1996 2000 2004 2006 2007
Central Bank 1 1 1 1 1
Commercial Banks 6 6 6 6 8
(Branches) (122) (123) (120) (120) (124)
Finance Companies and Merchant Banks 10 9 11 11 11
Trust and Mortgage Finance Companies 6 5 6 7 7
Development Banks 2 2 2 1 1
Credit Unions 356 356 126 129 131
Insurance Companies 41 40 39 59 59
Thrift Institutions 4 3 3 3 3
National Insurance Board 1 1 1 1 1
Trinidad and Tobago Stock Exchange 1 1 1 1 1
Unit Trusts 1 1 1 1 1
EXCICO/EXIM 1 1 1 1 1
Reinsurance Company 1 - - - -
Deposit Insurance 1 1 1 1 1
Home Mortgage Bank 1 1 1 1 1
Ombudsman Office - - - 1 1
Credit Rating Agency - - - 1 1
SOURCE: Central Bank of Trinidad and Tobago
The structure and composition of the financial system has changed more
dramatically in the last decade (1996-2007) than over the two previous decades as
each segment of the system responded to new developments and challenges within its
own industry. For the commercial banks, mergers and conglomerate activity
dominated the environment; a process of consolidation and the merging of key
business modules occurred as the monetary authorities moved towards a single
reserve requirement for both banks and licensed non-banks; by the end of the decade
the supervision of insurance companies was transferred to the central bank and a
process of consolidation had begun to take place; while at least six new mutual funds

4
domiciled in TT were registered over the decade, the Unit Trust Corporation (UTC)
still maintains a dominant share of the market; the Export Credit Insurance Company
(EXCICO) is now a fully fledged Eximbank; the reinsurance company has been
dissolved into an ordinary insurance company.
1. Commercial Banking: 1996-2007
The banking sector has undergone significant and complex changes since
1996. Commercial banks grew at an unprecedented rate and adopted several
strategies that fundamentally altered the traditional conduct of the business of
banking. Some significant features were the emergence of new corporate structures,
the increased use of technology, the development of new products to service
customers and the formation of associations and task force to address specific and
emerging industry concerns. Commercial banks not only sought to broaden the range
of financial services beyond traditional banking products in the domestic market, but
also established a presence in the English, Spanish and Dutch-speaking Caribbean.
For most of the period under review six commercial banks were licensed to
conduct the business of banking. On October 1, 1997 Republic Bank Limited
acquired Bank of Commerce which led to a reduction in the number of licensed
commercial banks to five. In May 1998 Intercommercial Bank Limited, a newly
established foreign-owned commercial bank entered the industry as the sixth licensee.
Two new institutions, First Caribbean International Bank (FCIB), formerly licensed
under the Financial Institutions Act, 1993 as a non-bank financial institution and Bank
of Baroda were granted commercial bank licenses on May 28, 2007 and October 1,
2007 respectively. While the Bank of Baroda is an entirely new entity, FCIB

5
represents the merger of Barclays Bank and Bank of Commerce throughout the rest of
the Caribbean. Although FCIB had operated in the region for around five years, the
entity did not have a presence in Trinidad and Tobago. The changing composition of
the banking industry had little effect on the market share. In 1996, the four largest
institutions accounted for 95.8 per cent of the total banking assets and by 2007 this
ratio was only marginally lower at 90.1 per cent.
Branch Network
Commercial banks have always maintained an extensive network of branches
and as a result, the domestic population has had good access to banking services with
a bank branch for every 10,510 persons and branch locations concentrated in
predominantly urban areas. Banks however have extended their coverage with the use
of technology to offer a wide range of information and transactional services via the
internet, automated teller machines, point of sale terminals, and other electronic
means. Most banks have websites which offer e-banking and/or telephone-banking to
their customers.
By the end of 2007, five of the eight banks were either majority or fully owned
by foreign entities.1 This is in sharp contrast to 1996 when all but one of the
commercial banks were either fully or majority held by nationals or domestically
owned corporations. Shareholding in the sector has generally not been widely held as
only three commercial banks are listed on the Trinidad and Tobago and other regional
stock exchanges, and once an agreement has been reached on the sale of RBTT the
1 Towards the end of 2007 RBTT announced that preliminary agreement had been reached with the
Royal Bank of Canada (RBC) on the acquisition of the assets of RBTT Financial Holdings Limited for $13.8 billion.

6
stock was to be delisted. Furthermore, institutional investors make up the majority
shareholding in the commercial banks.
The banking sector in Trinidad and Tobago has often been described as
oligopolistic given that the industry is dominated by a small number of firms. At
December 2007, of the eight participants, the top four retail banks account for 90.1
per cent of commercial bank assets. Each firm is aware of the actions of the others as
well as the likely responses of other firms in the industry to any strategic plans on
their part; some analysts argue that the industry is highly susceptible to collusive
activity. On the other hand, competition between such firms to win or retain market
share in an oligopoly can be intense, offering customers a wider range of services at
competitive prices.
An important factor in determining whether an oligopoly structure exists is the
extent to which the market is contestable. This refers to the ease of entry and exit into
the market by new firms. Given the nature of the banking industry, new entrants must
meet prescribed legal criteria and explicit approval from the Central Bank to conduct
the business of banking. Over the review period, only one new commercial bank
entered the market, but with the prevailing levels of profits of the incumbent firms,
economic theory suggests that such ‘super profits’ would attract new entrants into the
industry.
The level of competition among existing market players is another determinant
of oligopoly. During the review period, firms have generally not been able to increase
domestic market share at the expense of other participants. In fact, commercial banks

7
Box I
Measures of Concentration in the Banking Sector
An industry’s structure includes several elements such as buyer and/or seller concentration, product differentiation, and barriers to entry. Common measures of market concentration include the Herfindahl-Hirschman index (HHI) and the n-firm concentration ratio (CRn). The HHI is one way of measuring the concentration of market share held by firms. This index is defined as the sum of squares of the per centages of the market shares held by firms in the market. The index can take on values ranging from 10,000 to 0 – if a firm is a monopoly the index will be 10,000, and if there is perfect competition with near-zero market share by each firm, the index will be approximately zero. The main virtue of the HHI index is that it is easy to calculate and unlike concentration ratios the index uses information on all firms in the industry. A biannual HHI was calculated for the industry based on total bank assets over the period June 1995 to June 2005. Over the period under review the index ranged from 2237 to 2512 which suggests that the industry was highly concentrated. However, the index fell slightly in 1998 following the entry of one new bank. Throughout the period, two banks dominated and maintained an average market share of about 60 per cent. The CRn is used as an indicator of market power or an inverse indicator of the intensity of competition. An industry’s concentration ratio would be the percentage market share of the top firms in the industry. This index approaches zero for an infinite number of equally sized banks and unity if the number of firms included comprise the entire industry.
CRn = ∑=
n
i 1
si
where si is the market share of the ith firm
A commonly used concentration ratio is the four-firm concentration ratio (CR4), which is the percentage of market output generated by the four largest firms in the industry. This ratio is fairly correlated to the HHI. A concentration ratio ranging from 0 per cent to 50 per cent (or a HHI of 0 to 1000) corresponds to low levels of concentration. A ratio of 50 per cent to 80 per cent (or a HHI of 1000 to 1800) reflects medium concentration, and 80 per cent to 100 per cent (or HHI of 1800 to 10,000) shows high concentration. For this study CR2 and CR4 ratios were calculated over the same period as the HHI with the same bi-annual asset data. The results of the CR2 show that two firms account for 60 per cent of total market output, whilst the CR4 results show that 93 per cent of market output is generated by four firms. Overall, these results are consistent with the HHI and indicate that the industry is highly concentrated.

8
have been aggressively involved in advertisement to promote superior service
standards and relationship management, delivery channels, innovative products and
services to woo and retain customers. However while banks tended to be competitive ,
information on the ability of consumers to exercise a rational choice based on the
ability to conduct product and price comparisons, to evaluate long and established
banking relationship and a knowledge of switching costs has not been observed. In
2002 however, there was a public outcry about excessive service charges by
commercial banks.
Service Charges
During the first quarter of 2002, there was a public outcry against the range
and level of bank service fees as well as the relatively high and exorbitant profits of
commercial banks. Consumers sought redress for fees such as those imposed for the
payment of utility bills2. In response, the Bankers Association of Trinidad & Tobago
(BATT)3 in an advertisement in the print media (December 13, 2002) acknowledged
the concerns of customers and indicated that all member banks were committed to an
independent review of their schedule of fees. BATT met with the Central Bank and
the Consumer Affairs Division of Ministry of Legal Affairs and gave a commitment
to review bank charges and interest fees as well as to improve the level of
communication to customers and the general public with respect to the charges. In
2 Since the mid 1990s banks had facilitated bill payments on behalf of the utilities:- Water & Sewerage
Authority (WASA), Telecommunications Services of Trinidad and Tobago (TSTT) and Trinidad and Tobago Electricity Commission (TTEC), on the basis of negotiated transaction fees, ranging from $0.65-$1.00. Since the volume of transactions related to bill payment impacted the cost of providing this service, some fees ranged from $3.50 to $4.00 for non-account holders. This charge was two-fold, partly to defray the cost of providing the service and to encourage customers to pay their bills via ATMs or telephone banking services which were free of charge.
3 In 2002 the member banks of BATT were First Citizens Bank, Intercommercial Bank, Republic Bank
Ltd, RBTT Bank and Scotiabank.

9
January 2003 a consultant was hired by the Ministry of Legal Affairs and the Central
Bank to determine how banking fees impacted on customers, especially the
disincentive fee on payment of utility bills. The consultant found on the question of
utility bills, that “banks have sought to transfer the burden of paying the facility from
the utilities to the main beneficiaries to the consumers.” He also noted that a
significant segment of the population continued to conduct all transactions in cash and
had no access to electronic banking facilities which resulted in a high demand on bank
teller service. The consultant recommended that the banks renegotiate a new
arrangement with the utility companies. In June 2003, BATT entered into agreements
with the utility companies that each utility company would pay a bank fee of $3.00
plus VAT per transaction and as such customers would no longer be required to pay a
service charge for the use of teller services to pay utility bills.
In addition, banks also agreed to remove six other “nuisance” fees. Fees were
waived for third party withdrawals, encashment of cheques at different branches of
the same bank and deposit items returned, photocopying services related to
transactions at the bank, closing accounts and closure of accounts within three
months, withdrawals without a passbook and notification/activation of dormant
accounts.
The public outcry of 2002 had been the latest in a series of complaints and
general dissatisfaction with the level of bank services, nuisance fees, and other
charges and provided some of the impetus towards the establishment of the Banking
Services Ombudsman in May 2003 (and more recently the Office of the Financial

10
Services Ombudsman). The establishment and operations of this institution will be
discussed in Section 9 below.
Legislative and Regulatory Environment
The Central Bank introduced several initiatives over the review period in order
to ensure compliance with international best practices. One major international
standard agreed to was the implementation of the Basel I Capital Adequacy Accord.
In March 1995 the minimum capital charge of eight per cent for credit risk was
implemented as Capital Adequacy Regulations under Section 38 of the Financial
Institutions Act, 1993, (FIA 1993). In September 2000 a minimum capital charge of
ten per cent was implemented for foreign exchange risk. The overarching objective of
these minimum requirements is to ensure that financial institutions have sufficient
capital to support the level of credit and foreign exchange risk exposures involved in
either holding or having obligations on assets such as loans and investments. During
the period commercial banks have been adequately capitalised for both credit and
foreign exchange risk, with the minimum capital charge ratio of 19.07 per cent as at
December 2007. In 2006, the Central Bank developed a model to capture market risk
to be fully compliant with Basel I requirements. All banks would be expected to
implement the market risk methodology in 2008.
A number of important guidelines were developed to provide a standardized
framework for addressing pertinent issues relevant to all institutions licensed and
regulated by the Central Bank. In May 2005, among three guidelines issued was one
which dealt with “fit and proper”. The “Fit and Proper” Guideline applies to persons
who hold key positions in an institution such as directors, trustees and senior
management as well as shareholders who exercise control over 25 per cent or more of

11
the voting power at any general meeting. In May 2006, a Guideline on Corporate
Governance was issued to set accountability standards for the board of directors and
senior management.
On the legislative front, the Central Bank sought to update the Financial
Institutions Act, 1993 and this process was initiated in 2002. As is customary,
industry comments were sought on the proposed amendments. These amendments
were to be presented before Parliament in 2007. However due to the extent of the
amendments, two initiatives were taken. Several key vulnerabilities were identified
and placed on a “fast track agenda” resulting in the Financial Institutions
(Amendment) Act 2006. This Act was proclaimed into law on September 4, 2006.
The FIA (Amendment) sought to:
• Expand the criteria for becoming a controlling shareholder
• Expand the fit and proper criteria to controlling shareholders
• Institute prior approval from the Minister of Finance in consultation with the Governor for mergers and acquisition where the merged entity would control more than 40 per cent market share
• Facilitate sharing of information between and among local and foreign regulatory bodies
The second initiative involved an entire overhaul of the FIA, 1993 which would result
in the repeal of FIA, 1993.4
Financial Overview
Table 3 below contains key balance sheet data for selected years for
commercial banks during the period 1996 - 2007.
4 In December 2008 the FIA 1993 was completely revised and replaced by FIA 2008.

12
Table 3
Commercial Banks: Selected Years
1996 2000 2002 2004 2006 2007
Number of Banks 6 6 6 6 6 8
Branches 122 123 120 120 120 124
Balance Sheet Information TT$ Million
Gross Assets 23,334 33,351 40,713 48,900 68,313 76,191
Loans 8,147 13,205 15,284 21,546 33,604 40,411
Investments 4,957 5,390 7,517 8,529 8,226 10,074
Deposits 12,888 18,517 22,504 27,648 42,283 47,692
Of which:
Time 4,515 5,996 5,585 5,558 12,042 14,540
Demand 3,053 4,959 8,076 10,563 14,563 15,522
Saving 5,321 7,561 8,843 11,526 15,677 17,630
Total Capital 1,755 3,813 4,775 6,474 7,737 9,421
Of which: Retained Earnings 431 1,774 2,493 4,014 5,010 5,859
SOURCE: Central Bank of Trinidad and Tobago
The total assets of commercial banks grew at an average rate of 11.75 per cent
per annum over the decade. However, in absolute terms, assets grew by $52.9 billion
over the period 1996 to 2007. The main areas of asset growth were loans ($32.3
billion), liquid funds ($9.2 billion), investments ($5.1 billion) and equity in
subsidiaries and affiliates ($678.3 million). Asset growth was largely financed by
deposits which increased by $34.8 billion, borrowings ($2.7 billion) and other long
term liabilities ($2.4 billion).
Loans were the most significant component accounting for 53 per cent of the
asset portfolio of commercial banks by 2007, up from 34.9 per cent in 1996. While in
absolute terms all sectors benefited from improved access to funds, the private sector
consisting of both firms (48.6 per cent) and consumers (41.4 per cent) were the major
recipients of credit.

13
With financial liberalisation and the removal of exchange controls in April 1993, there
has been a fairly steady increase in loans denominated in foreign currency. By 2007,
foreign loans ($8.6 billion) represented 21.6 per cent of gross loans compared with
($1.2 billion) or 14.7 per cent in 1996.
Investments grew by $5.1 billion over the decade and represented 13.2 per
cent of total assets in 2007, down from 21.2 per cent in 1996. Government paper was
the investment of choice for commercial banks averaging 58.0 per cent over the
period. At the same time, commercial banks were experiencing excess liquidity and in
the predominantly low interest rate environment of the late 1990s and early 2000s,
held considerable liquid fund balances. On average, investment denominated in
foreign currency accounted for 33.4 per cent of the commercial banks’ portfolio,
allowing for a greater level of diversification.
Deposits were the primary source of funds averaging 64.7 per cent of
commercial bank liabilities over the period 1996 – 2007. Commercial bank deposits
recorded an annual average growth rate of 12.1 per cent. The bulk of deposits
(averaging 98.7 per cent annually) had a maturity profile of less than a year. In 2007,
consumers and businesses provided 45.6 per cent and 25.8 per cent of deposits
respectively, compared to 71.4 per cent and 14.8 per cent in 1996. The structure of
deposits had also changed: in 1996, savings accounted for 41.3 per cent, followed by
time deposits at 35.0 per cent and demand deposits at 23.7 per cent. By 2007,
savings accounts accounted for 37 per cent, while demand deposits stood at 32.5 per
cent of deposit liabilities, closely followed by time deposits (30.5 per cent). Foreign

14
currency deposits as a percentage of total deposits remained fairly stable, averaging
26.1 per cent over the period.
In general, commercial banks have performed creditably in a dynamic
economic, legislative and regulatory environment. As TT seeks to be the financial
centre of the Caribbean, the banks are aggressively pursuing opportunities to remain
competitive both at home and abroad. Nevertheless challenges lie ahead given the
migration towards the New Basel Capital Accord (Basel II), legislative reforms and
increased competitive pressure from other regional players.
2. Non-Bank Financial Institutions
Since 1996 there have been significant developments among the non-bank
financial institutions (NFIs). Tables 4 and 5 outline the details of some of the changes
over the past decade. While there appears to be a marginal increase in the number of
institutions, this masks the dynamics which existed throughout the period.
Table 4
Non-Bank Financial Institutions – Selected Data
1996 1997 1999 2000 2001 2003 2005 2007
NUMBER OF INSTITUTIONS
Finance Houses and Merchant Banks 10 10 10 9 9 11 11 10
Trust and Mortgage Companies 6 6 5 5 5 6 6 7
Total 16 16 15 14 14 17 17 17
NUMBER OF BRANCHES
Finance Houses and Merchant Banks 13 17 17 12 13 17 18 20
Trust and Mortgage Companies 10 11 13 33 33 34 6 7
Total 23 28 30 45 46 51 24 27
PERSONS EMPLOYED
Finance Houses and Merchant Banks 182 171 203 213 225 233 260 297
Trust and Mortgage Companies 316 345 370 379 418 399 298 294
Total 498 516 573 592 643 632 558 591
SOURCE: Central Bank of Trinidad and Tobago

15
Over the decade there were several mergers, takeovers and rationalization of
operations among the NFIs, and the total number of institutions remained at around
17. In 1997, the Bank of Commerce’s operations were absorbed by Republic Bank
Limited. The rationalization of the ANSA group and the revocation of one license led
to a decline in the number of NFIs to 15 at the end of 1998. In 2000 the amalgamation
of the operations of two licensed subsidiaries of First Citizens Bank Limited was
effected, and this led to a further reduction in the number of finance houses. However
as new licenses were issued between 2001 and 2005, by the end of 2007 the number
of NFIs stood at 17 with ten trust and mortgage finance institutions and seven finance
houses and merchant banks.
Over the same period the number of branches rose from 23 to 51 before falling
to 27 in 2007. This reduction was consistent with the merger and rationalization
activity and contributed to the decline in the number of NFI branches. Some of the
consolidation efforts were also linked to the Central Bank policy which aimed at
lowering the reserve requirements of the commercial banks to bring this into line with
that of the non-banks. The first phase of this programme was implemented in October
2003 with the lowering of the statutory reserve requirement for commercial banks
from 18 per cent to 14 per cent of prescribed liabilities, and again a year after from 14
per cent to 11 per cent. The final phase, in which it is intended to equalise the reserve
requirement at nine per cent, is expected to take place at an appropriate time in the
near future. Prior to the implementation of the first phase, some commentators argued
that removing the distortions between banks and non-banks would have detrimental
implications for independent non-banks, that is those which are not subsidiaries of
commercial banks. They contended that commercial banks would be positioned to

16
improve upon their competitive advantage and the narrowing of the reserve ratio gap
would present an unwelcome threat to the long-term survival of the non-banks.
Interestingly, 2005 was a year in which many trust and mortgage companies,
particularly those affiliated with commercial banks, transferred some of their
operations to their parent companies. As a result they closed down just over 75 per
cent of their branch operations.
Table 5
Non Bank Financial Institutions: Selected Data
1996 1997 1999 2000 2001 2003 2005p 2007
AVERAGE TOTAL ASSETS ($Mn)
Finance Houses and Merchant Banks 2,189 2,296 4,392 4,679 5,327 7,560 13,496 17,291
Trust and Mortgage Companies 4,103 4,946 5,648 7,079 9,062 11,121 10,961 9,406
Total 6,292 7,242 10,040 11,758 14,389 18,681 2,4457 26,697
NUMBER OF DEPOSIT ACCOUNTS
Finance Houses and Merchant Banks 30,929 33,618 27,073 28,071 26,807 17,634 9,148 2,937
Trust and Mortgage Companies 6,914 6,940 7,310 7,049 6,790 6,285 6,459 7,887
Total 37,843 40,558 34,383 35,120 33,597 23,919 15,603 10,824
AVERAGE TOTAL DEPOSITS ($Mn)
Finance Houses and Merchant Banks 837 872 2,270 2,598 2,886 3,150 5,394 6,189
Trust and Mortgage Companies 30,929 33,618 27,073 28,071 26,807 17,634 1,151 382
Total 31,766 34,490 29,343 30,669 29,693 20,784 14,542 6,571
SOURCE: Central Bank of Trinidad and Tobago
Table 5 shows that the total assets of the NFIs tripled between 1996 and 2007,
growing at an average annual rate of just under 30 per cent. However, the noticeable
decline in the assets for trust and mortgage companies at the end of 2007 can be
attributed to closure of some of the branch operations of these and the transfer of the
business to the balance sheet of the banks. The fall-off in the number and value of the
deposit accounts is also consistent with these trends.

17
In 1993, with the flotation of the TT dollar and the liberalization of the
financial system, it became possible for citizens to hold foreign currency deposits in
the domestic banking system. As a result the number and value of these accounts rose
sharply. The majority of the deposits were held in the commercial banks although by
2005 NFIs held on average 25 per cent of the foreign currency deposits in the system.
The typical services offered by the NFIs include mortgage lending, merchant
banking, leasing, finance house operations, trust services and trade confirming. Figure
1 presents a snapshot of the different types of businesses provided by NFIs at the end
of 2005, and the number of licensed institutions that provide these services. The data
suggests that 72 per cent of the NFIs provide all the services offered.
Figure 1
Products Offered
0
2
4
6
8
10
12
14
16
Mor
tgag
e Le
nding
Mer
chan
t Ban
king
Leas
ing
Fina
nce
Co.
Trust
Con
firm
ing
Unit T
rust
Finan
cial S
ervice
s
For
ex D
ealer
Con
sorti
um F
inan
cing
Con
sulta
ncy In
v. M
ang
Burea
u de
Cha
nge
Floa
t & U
nder
writ
e Sto
cks & S
hare
s
Project D
evelop
men
t
Reg
istra
r & S
hare
Issu
ing
Accep
tanc
e Cre
dit
Inte
rban
k F
inan
cing
No
. o
f In
sti
tuti
on
s
The assets of NFIs are mainly held in investments, loans and other assets. The
trust and mortgage group held more than 60 per cent of total assets in investments and
loans while finance houses and merchant banks held over 70 per cent in investments

18
and other local assets. In the first half of the decade the assets of finance companies
and merchant banks were dominated by the loan portfolio, but this declined steadily
after 2000 to approximately 14 per cent of total assets. Similarly, interest payments on
loans were the traditional income earner for both categories of NFIs, but fee income
now accounts for one third of total income. These changing trends suggest that NFIs
have transitioned their business operations from traditional loans to other activities.
Table 6
Finance Companies & Merchant Banks: Distribution of Loans (%)
Per cent Of Average Total Loans - (Gross)*
1996 1997 1999 2000 2001 2003 2005 2007
Real Estate Mortgages 5.4 4.8 4.5 3.6 2.6 2.0 2.2 1.5
Public Sector 0.5 0.0 4.6 7.7 4.7 7.3 2.4 7.4
Agriculture 3.2 2.2 2.3 1.1 0.9 0.6 0.6 0.6
Petroleum 2.4 1.3 1.4 1.1 1.1 2.3 9.9 5.0
Manufacturing 27.8 23.8 18 11.6 7.9 4.8 8.0 8.3
Construction 4.5 5.7 7.2 7.1 8.7 8.0 6.5 6.6
Distributive Trades 11.5 9.9 5.6 4.2 4.4 4.7 3.1 2.6
Transport, Communication &
Storage 9.7 8.5 8.2 5.1 7.7 4.2 4.4 4.8
Finance, Insurance & Real Estate 11.0 13.5 15 16.1 17.8 26.2 28.9 35.0
Personal Services 2.9 3.2 1.9 0.9 0.6 0.3 1.3 0.5
Leasing 13.1 16.7 8.5 8.5 9.8 10.2 9.1 5.7
Consumer Loans 7.9 10.3 16.7 16.9 17.4 10.9 10.0 17.6
Miscellaneous 0.6 0.0 6.1 16.1 17.2 18.6 14.9 4.3
SOURCE: Central Bank of Trinidad and Tobago.
The loan portfolio of NFIs represents a wide cross-section of the economy. The
concentration of lending for trust and mortgage companies has been predominantly in
real estate for mortgage lending but for finance companies and merchant banks there
has been a wider mix among business activities. The data in Table 6 show
manufacturing and leasing as the sectors receiving the concentration of loans during
the early years while consumers, finance, insurance and real estate, and miscellaneous
activities received the greatest proportion in the middle years. Though consumer loans

19
declined in the later period, finance, insurance and real estate continued to account for
most of the loans.
3. The Insurance Industry
Structure
The insurance industry in Trinidad and Tobago is vibrant with numerous
market players. There are two main categories of business, long term and general
insurance and the former dominates the industry. However, in addition to these
companies there is also a number of intermediaries such as salesmen, adjusters,
brokers and agents. In 2006, an analysis of the distribution of gross premium income
showed long term insurance business represented just under 70 per cent of total gross
premium income, while motor and property accounted for 10.5 per cent and 10.4 per
cent, respectively. A similar analysis in 1996 and 2000 also shows the dominance of
the long term segment of the industry.
In both the long term and general insurance business there are numerous
market players. The Report on Insurance and Pensions notes that at the end of
2006, while there were 24 companies registered to transact long-term business, ten of
these firms were not writing new business. The domestic industry is also open to
foreign companies, but only one regional company is currently writing new business.
The number of registered life insurance companies and the number of companies
writing new business have been stable over the past ten years. At the end of 2000,
there were 23 companies registered to transact life insurance business, 14 of which
wrote new business, while at the end of 1996 there were 26 registered companies, 14

20
of which wrote new business. In 1996, there were also two registered regional and
three extra-regional companies who wrote new business.
Despite having several active market players, the long term insurance industry
is fairly concentrated as the four largest life insurance companies accounted for 87.5
per cent of the industry’s total assets in 2005. In 1996 and 2000, the four largest
companies accounted for 86.4 per cent and 75 per cent of total assets, respectively. A
look at the net premium incomes of the long-term business also shows a high level of
concentration. In 2006 the four largest companies by asset size accounted for 87.7 per
cent of the net premium income earned by the entire industry. This can be compared
with 2000 and 1996 when the four largest life insurance companies earned 79 per cent
and 69 per cent, respectively, of net premium income. This level of market
concentration suggests an oligopolistic structure, with the industry dominated by three
to four large firms.
The Report on Insurance and Pensions classifies general insurance business
under two main categories: motor insurance and ‘other than motor insurance’, which
includes property insurance, personal accident, group health, marine, pecuniary loss,
general accident and export credit. In 2006 while there were 35 registered general
companies, only 26 of these companies were writing new business. The number of
registered and active general insurance companies has also remained relatively stable
over the past ten years. For instance, in 1996 there were 35 registered and 27 active
general insurers as against 33 and 26 registered and active general insurance
companies, respectively in 2000. With respect to motor insurance, 18 companies
wrote new business during 2006. This represents a falloff from the number of motor

21
insurance companies that existed between 1996 and 2000 (23). Since then there were
several liquidations within the industry while two companies were placed under
judicial management by the Central Bank. In the category ‘other than motor
insurance’, there were 19 active companies in 2005, including five long term
insurance companies transacting personal accident and group health business. Group
health insurance accounted for 41 per cent of the premium income in this category of
business. In 1996 and 2000 there were 28 and 23 companies, respectively, active
under the broad category of ‘other than motor insurance’. In both these years there
were six life insurers responsible for transacting group health business, accounting for
40 per cent and 41 per cent of premiums under this category in 1996 and 2000,
respectively.
Table 7
Participants in the Insurance Industry
1996 2000 2004 2005 2006
Long Term Companies Registered 26 23 24 24 24 Active 14 14 15 13 10
General Insurance Companies Registered 35 33 34 35 35 Active 27 26 24 28 26
Intermediaries
Salesmen 1,021 1,087 1,180 1,617 1,824
Agents 247 292 322 414 466
Brokers 60 71 72 85 87
Adjusters 15 20 21 24 23
SOURCE: Report of the Supervisor of Insurance 1997, and 2001, Report on Insurance and Pensions 2004, and 2006
The motor insurance business is far less concentrated than the long-term
insurance business. In 2006, four motor insurance companies accounted for about 55
per cent of the net premium income of the industry. In previous years the industry
was even less concentrated, with four companies accounting for 42.2 per cent (1996)
and 46.3 per cent (2000) of the net premium income, respectively. However, the

22
‘other than motor insurance’ group is fairly concentrated. In 2005, the top four
companies accounted for 71.9 per cent of net premium income of the industry,
compared with 64.4 per cent and 66.2 per cent in 2000 and 1996, respectively.
Table 7 contains data on the number of insurance intermediaries within the
industry and the list includes salesmen, agents, brokers and adjusters. As the industry
has grown over the years so has the number of intermediaries with the largest increase
in salesmen and agents over the past ten years.
Conduct
Insurance companies are guided by the Insurance Act 1980 as regulation and
supervision of the industry have lagged behind the sector’s dynamism. Recent
evidence suggests that there are balance sheet mismatches due to innovative funding
or cross products that are difficult to recognize. In 2004 supervision of the industry
was transferred to the Central Bank under the Insurance (Amendment) Act, 2004.
This Act allowed for the following: 1) it transferred responsibility from the Supervisor
of Insurance in the Ministry of Finance to the Central Bank; 2) it amended the appeal
provision of Section 205 of the Insurance Act whereby any regulatory action by the
Central Bank will now continue to have effect, unless the appellant is granted an
injunction by the Court; and 3) it re-defined arrangements whereby regulations under
the Act continue to be made by the Minister, but now on recommendations from the
Central Bank. A comprehensive review of the Insurance Act 1980 is currently being
undertaken. The broad areas proposed for amendments are the supervisory system,

23
the supervised entity, on-going supervision, prudential requirements and markets and
consumers.5
As noted above, insurance companies offer a diverse range of products to the
public. Long-term business companies specialize in life insurance, health insurance
and group health insurance, but they also offer non-traditional products such as
annuities, fixed deposits and mutual funds. General insurance companies provide
coverage on most types of property such as motor vehicles, boats, houses, factories
etc. There are some insurance companies that write both long-term and general
insurance, others establish separate companies to handle life insurance and general
insurance businesses and form a holding company to parent both operations.
In Trinidad and Tobago the insurance companies have generally adhered to the
restrictions imposed by the Insurance Act, 1980 and have been prudent in meeting
their statutory obligations. This suggests in part a certain level of conservatism in the
investment activity of the insurance companies. For long term insurance business,
Section 37(4) of the Insurance Act, requires that
“Every company carrying on long term insurance business in Trinidad
and Tobago shall place in trust in Trinidad and Tobago assets equal to
its liability and contingency reserves with respect to its Trinidad and
Tobago policyholders as established by the balance sheet of the
Company as at the end of its last financial year.”
Provisional data indicate that life insurers placed $17.5 billion in the statutory
fund in 2006, compared with $6.3 billion in 2000 and $4 billion in 1996. The
Insurance Act 1980 also requires that life insurance companies maintain a local assets
ratio of at least 80 per cent of its TT dollar liability in the statutory fund. In the ten
5 The complete overhaul of the Insurance Act 1980 is still underway, but some critical amendments
were introduced in February 2009.

24
years to 2006 insurance companies have been able to maintain this ratio, with the
exception of 1996 when the ratio fell to 76.2 per cent.
General insurers are required to hold a statutory deposit, a statutory fund for
motor vehicle insurers and meet a solvency requirement. Section 29 of the Insurance
Act requires that general insurance companies maintain at minimum 40 per cent of
their net premium income in a deposit at the Central Bank. As at the end of 2006,
funds placed in the statutory deposit amounted to $496.5 million compared with
$220.5 million in 2000 and $160.5 million in 2001 and most of the deposits
comprised TT government securities. Motor vehicle business also requires a statutory
fund with assets equal to ‘liability and reserves less the amount held on deposit’ in
accordance with Section 29 of the Act. The value of assets placed in the statutory
fund in 2006 totalled $334.3 million while the required assets amounted to $342.4
million.
General insurers are also required by law to maintain a solvency ratio greater
than 20 per cent. The margin of solvency however is calculated as net admissible
assets less the minimum solvency requirement. In 2005, the margin of solvency of
the industry was $422.2 million compared with $694.1 million in 2006. High and
positive solvency margins indicate a healthy industry. In general the insurance
industry has experienced high and positive solvency margins over 1996-2006
although individual firms have been in deficit at times.
Another characteristic of the insurance industry is the level of reinsurance
ceded by the domestic insurance industry. In Trinidad and Tobago retention ratios are

25
high for the life insurance segment and low for the property segment of the market.
Retention ratios in the life sector averaged well over 90 per cent since 1996. In
contrast, for property insurers the net retention ratio (net premiums divided by gross
premiums) has averaged around 10 per cent. There are several reasons for low
retention ratios in this segment of the market and they include the following:- the
large policy values involved in property business; the occurrence of property damage
tends to be more widespread and catastrophic in nature. In the event of a natural
disaster e.g. a hurricane, earthquake, etc. if the property insurer has a high retention
ratio, the local insurer may well face the possibility of bankruptcy.
Since 1996 there have been several important institutional developments in the
insurance industry, including mergers, acquisitions, consolidations, expansion of
services and re-branding. Some of the more significant developments include the
following:- Clico, a subsidiary of CL Financial Holdings acquiring controlling interest
(53 per cent) of Republic Bank Limited in 2004; the formation of Guardian General
from the merger of Nemwil and Caribbean Home in 2004; the integration of Tatil and
Ansa Finance and Merchant Bank and the re-branding of B&L Company Limited to
Motor One under new ownership. In 2003, the HCU Financial Group of Companies
acquired Bankers’ Insurance Company Limited while Scotia Life was launched and
‘The Mutual’ became Sagicor. The change in ownership and structure reflected in
part competitive forces at work in the industry.
When the Central Bank assumed the role of supervisor and regulator of the
sector the Bank began the process of treating with those companies who were in
contravention of the Insurance Act. As a result, the Bank issued notices of

26
intervention to two general insurers in 2006, and both companies were subsequently
placed under judicial management.
Performance
In assessing the performance of the insurance industry one must take into
account three key factors. First, the format of company financial statements does not
lend itself to traditional financial analysis; second, performance ratios usually capture
underwriting and claims activity but not other important activities such as investing
and reinsurance; thirdly, there is usually a timing mismatch between premium income
earned, claims and settlements. The measurement of the insurance industry’s
performance requires a multifaceted approach, and so performance can be determined
by the financial strength of the institutions in respect of growth in assets, premium
income and profitability. Alternatively, the performance can be assessed by how well
the industry protects the wealth of society, but this is difficult to measure directly.
One possibility is the amount of claims paid, as higher claims suggest greater realized
protection. Some suitable performance measures therefore may be assets growth, net
premium income, profitability, number of policies in existence and the sum of the
value assured by insurance companies. Assets and net premium income measure
performance in terms of financial strength of the industry while the number of policies
and the sum assured measure performance in terms of the level of wealth protection.
The insurance industry generally performed well during the period 1996-2006.
Assets of life insurance companies have shown tremendous growth, increasing from
$4,946 million in 1996 to $29,364 million in 2006 or 12.6 per cent of the financial
27
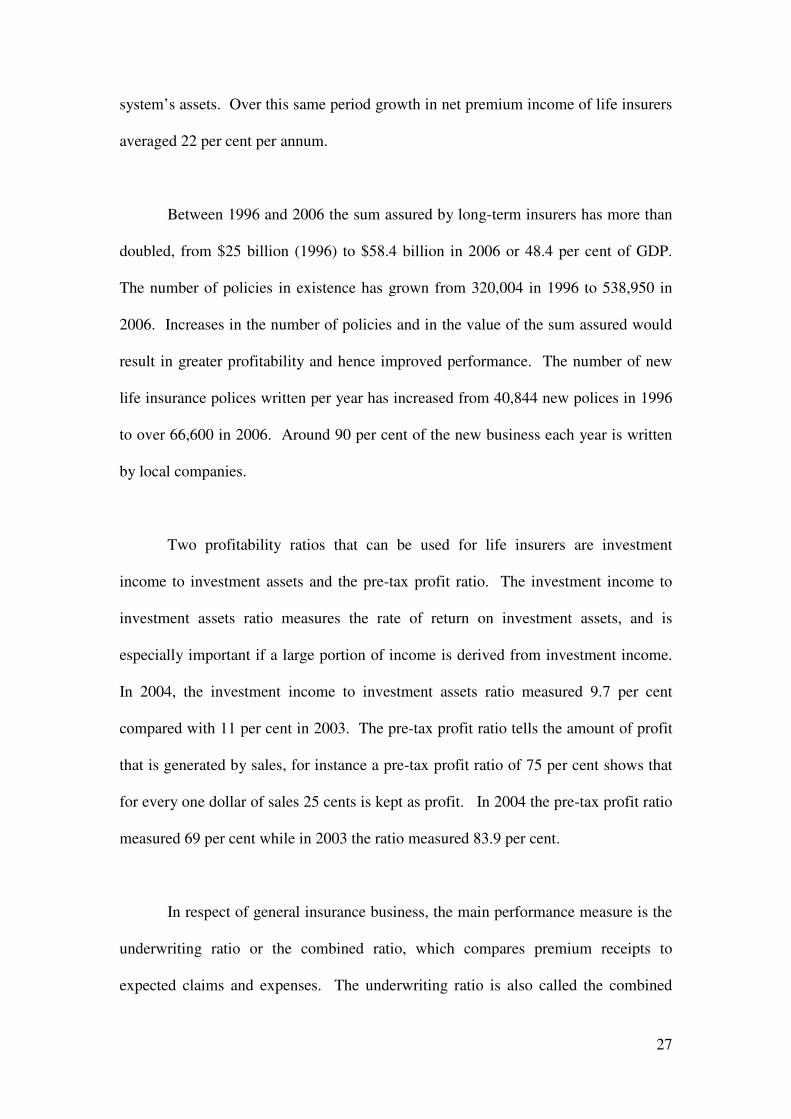
system’s assets. Over this same period growth in net premium income of life insurers
averaged 22 per cent per annum.
Between 1996 and 2006 the sum assured by long-term insurers has more than
doubled, from $25 billion (1996) to $58.4 billion in 2006 or 48.4 per cent of GDP.
The number of policies in existence has grown from 320,004 in 1996 to 538,950 in
2006. Increases in the number of policies and in the value of the sum assured would
result in greater profitability and hence improved performance. The number of new
life insurance polices written per year has increased from 40,844 new polices in 1996
to over 66,600 in 2006. Around 90 per cent of the new business each year is written
by local companies.
Two profitability ratios that can be used for life insurers are investment
income to investment assets and the pre-tax profit ratio. The investment income to
investment assets ratio measures the rate of return on investment assets, and is
especially important if a large portion of income is derived from investment income.
In 2004, the investment income to investment assets ratio measured 9.7 per cent
compared with 11 per cent in 2003. The pre-tax profit ratio tells the amount of profit
that is generated by sales, for instance a pre-tax profit ratio of 75 per cent shows that
for every one dollar of sales 25 cents is kept as profit. In 2004 the pre-tax profit ratio
measured 69 per cent while in 2003 the ratio measured 83.9 per cent.
In respect of general insurance business, the main performance measure is the
underwriting ratio or the combined ratio, which compares premium receipts to
expected claims and expenses. The underwriting ratio is also called the combined

28
ratio because it combines the ratio of policy loss and claims plus related expenses to
earned premiums and the ratio of operating expenses to written premiums. An
underwriting ratio of one indicates that claims and expenses equal premiums received.
A ratio greater than one means that claims and expenses are greater than premiums
received and suggests that the company is making losses. On the other hand a ratio
less than one means that claims and expenses are less than premiums received and
that the company is profitable. For instance, if a company has an underwriting ratio
of 96 per cent it means that the company has made four cents of underwriting profit
per premium dollar.
In 2004, the combined ratio for general insurers measured 71.2 per cent
compared with 75.4 per cent in 2003, that is that general insurers made 28.8 cents of
underwriting profit per premium dollar. Over the period 2000 to 2004 the combined
ratio of general insurers averaged 80.3 per cent, a relatively profitable five-year
period. There are, however, two main criticisms of the combined ratio as a
performance measure; first, the ratio does not take into consideration investment
income and secondly, risk distribution is not factored into the calculation. The
investment income to investment assets ratio can be used as a measure of investment
performance. For general insurers this ratio measured seven per cent in 2004
compared with 11.6 per cent in 2003. The pre-tax profit ratio of the general insurance
business is markedly lower than the pre-tax profit ratio of the life insurers. In 2004
the pre-tax profit ratio measured 8.7 per cent lower than the five-year average of ten
per cent (Table 8).

29
Table 8
Insurance Companies: Performance Ratios
2000 2001 2002 2003 2004
Long Term Business
Net Premiums Written (% change) 26.9 31.6 10.8 69.5 15.9
Investment Income to Investment Assets 11.0 13.8 9.4 11.0 9.7
Underwriting Profit to Net Investment Income 81.9 83.2 79.9 84.0 45.0
Pre-Tax Profit ratio 99.7 127.8 98.4 83.9 69.0
General Insurance Business
Net Premiums Written (% change) 21.9 2.4 22.5 1.7 3.9
Combined Ratio 86.5 84.0 84.3 75.4 71.2
Investment Income to Investment Assets 9.2 6.8 8.2 11.6 7.0
Underwriting Profit to Net Investment Income -23.2 -19.7 -19.4 22.7 36.2
Pre-Tax Profit ratio 8.8 10.0 7.3 15.3 8.7
SOURCE: Central Bank of Trinidad and Tobago
Another aspect of performance is the growth in net premiums over time.
Table 9 shows the growth in net premium incomes for long term business, motor
insurance and another category and suggests some volatility in the growth for all
categories of premium income, with most volatility evident in income from motor
insurance. For example in 2006, net premium income of motor insurers grew by 21.7
per cent compared with 24.4 per cent in 2005.
Table 9
Trends in Net Premium Income /$M/
Long Term Motor Other
2002 2,360 361 293
2003 4,081 374 325
2004 4,590 421 291
2005 3,993 524 418
2006 4,367 638 558
SOURCE: Report on Insurance and Pensions, Central Bank of Trinidad and Tobago

30
4. Mutual Funds
Following its establishment in November 1982 the Unit Trust Corporation
(UTC) operated as a monopoly for eleven years. In 1994 the Minister of Finance
opened the industry to other entrants and this resulted in three financial institutions
launching their own mutual fund products and family of funds. These were the
Roytrin, Republic and Scotia families of mutual funds. The first of the three to be
introduced was the Roytrin family of funds offered by the then RBTT Bank (formerly
the Royal Bank of Trinidad and Tobago). This was launched in March 1994 and was
known as the Roytrin Mutual Income and Growth Fund. RBTT Bank’s money
market fund was introduced to the market shortly thereafter in February 1996. The
First Citizens Bank also launched its money market fund (The Abercrombie Fund) in
September 1998. In 2004 two additional funds were also introduced, the First Energy
Fund and the Paria Fund.
Product Developments
Over the years the industry evolved and provided an alternative to commercial
banks’ deposits. In addition to the funds that are domiciled in Trinidad and Tobago,
there are several other funds which are registered and traded in Trinidad and Tobago.
These funds are traded in six different currencies (Trinidad and Tobago Dollars, U.S.
Dollars, Barbadian Dollars, Pound Sterling, the Euro and Canadian Dollars) and have
their origination in eight jurisdictions (Trinidad and Tobago, United States of
America, Canada, Luxembourg, Isle of Man, Cayman Islands, Barbados and
Guernsey).

31
Despite the existence of approximately thirty foreign funds which are traded in
the domestic market, the industry is dominated by the funds which are domiciled in
the local market and which account for well over 90 per cent of the market. Table 1
contains data on funds under management for the period 1997-2006. In 1997, funds
under management amounted to TT$2.2 billion; by 2000 this had more than tripled to
TT$6.9 billion. Total funds under management in the industry showed remarkable
growth with growth averaging 43.2 per cent over the period. As at the end of 2006,
funds under management stood at $31.8 billion.
Table 10: Funds Under Management 1997-2006 $000
Mutual Fund Investments Year Aggregate Fund Value Money Market Funds Equity-based Funds
1997 2,206.87 998.99 1,207.88
1998 3,374.51 1,539.86 1,834.65
1999 4,387.20 2,894.97 1,492.23
2000 6,928.79 5,023.25 1,905.54
2001 9,095.91 7,615.63 1,480.28
2002 14,155.54 12,092.16 2,063.38
2003 19,510.19 15,822.03 3,688.16
2004 23,962.75 18,334.66 5,628.09
2005 31,281.50 25,004.30 6,277.20
2006 31,834.88 26,145.44 5,689.44
SOURCE: Central Bank of Trinidad and Tobago
This growth has been fuelled mainly by the introduction of new and varying
types of funds such as bond funds, hybrid funds, money market funds and, to a lesser
extent, equity funds and pension plans. The growth in funds under management is a
reflection of the continued economic expansion in the economy in the late nineties
and well into the new millennium. In 2003 funds under management surpassed
commercial bank deposits ($16,884 million) and the trend continued to 2007 when
this was reversed.
To date there is still no clearly defined regulatory structure for the mutual fund
industry although the Central Bank has established prudential guidelines for those

32
funds which are managed by licensed financial institutions. The major player in the
industry is a creature of statute with certain operating guidelines set out by law.
5. Credit Unions
At the end of 2007 the credit union movement in Trinidad and Tobago had an
asset base of approximately $8 billion, some 130 active credit unions with a
membership of around 500,000 persons.6 If one were to classify credit unions by size
then 21 large credit unions (assets greater than $100 million) and 13 medium credit
unions (assets between $50 million and $100 million) account for well over 90 per
cent of the sector.
Over the period 1996 to the present, the asset base of credit unions grew from
just over $2.5 billion to around $8 billion. This growth has been accompanied by a
range of products and services offered by credit unions especially in the area of non-
financial services. Very many credit unions are industrial, community-based or
church-affiliated. While some of the larger credit unions can hire high quality
managers and technically skilled individuals, the costs associated with their hiring
may be beyond the scope of smaller credit unions. There are some concerns that the
non-financial activities may lead to systemic risk and failure.
The White Paper on Reform of the Financial Services Sector identified the
need “to upgrade the legislation that governs the activities of credit unions so as to
…take account of international best practice in the area”. Progress on the new
legislation has been slow. In 2005 the government announced that the supervision of
6 Over the years there has been weakness in the data from the credit union movement. These data
are based on submissions from the credit unions to the Central Bank.

33
the financial activities of credit unions was to be placed under the aegis of the Central
Bank. Since that time a Policy Proposal Document has been prepared and circulated
to the industry for comment. This document is expected to provide the necessary
framework for the new Credit Union Act which is currently being developed. It is
expected that the Central Bank will have supervisory oversight of the sector. Some of
the guidelines to be introduced will focus on risk-based supervision.
6. Small Business Credit and Rural Credit
Trinidad and Tobago, via the Vision 2020 framework, has identified entrepreneurship
and the development of small business as key drivers in the country’s quest to become
a developed nation by 2020. This is clearly evident given a number of policy and
operational decisions taken, such as the restructuring of the Small Business
Development Company and the establishment of the National Entrepreneurship
Development Company (NEDCO) in 2002. The main issues for small business have
always been access to “cheap” finance and, to a lesser extent, appropriate training. 7
Those who provide financial assistance to the micro and small business sector could
be divided into four groups: government and government-funded agencies;
international organisations; private financial institutions and community-based
organisations. Nonetheless if one examines the evolution of policies for the sector, the
state dominates. The state sets the overarching policy framework which guides the
operations of the sector and directly intervenes through a number of agencies and
state-funded programmes. The banking system, the largest provider of business
7 The Government of Trinidad and Tobago (GOTT) classifies a micro enterprise as an entity with not
more than 5 employees and assets or sales of less than $250,000. A business is classified as small if it employs 6-25 persons, has assets (excluding land or building) valued at $250,001-$1.5 million and sales of $250,000-$5,000,000.

34
credit, has not been heavily engaged with the small business sector. Apart from
Development Finance Limited, the private sector lags behind the state in its provision
of support to micro and small businesses.
The vision of the GOTT for the SME sector is one where the sector would serve as the
catalyst for the reduction in unemployment, poverty and the production of sustainable
employment and wealth. This would involve, among other objectives, the widening
of access to microfinance facilities for the neediest, especially women, youth, rural
communities and urban enclaves.
Table 11
Evolution of SME Policies
Period Policy Focus Institution/Agency 1970s - early 1990s
Small business
Industrial Development Corporation (IDC) Management Development Centre (MDC) Tourism Development Authority (TDA) Development Finance Company (DFC)
Mid 1990s – late 1990s
Small and medium –sized business
Small Business Development Company (SBDC) Tourism and Industrial Authority (TIDA) Development Finance Limited
Late 1990s - 2000
Small, medium and micro enterprises. Enterprise Development Policy 2001-2005
(Same as above) Launching of the Advisory Council on Micro, Small and Medium Enterprises
2000 - Present
Small and micro enterprises (Cabinet decisions in April 2002)
Business Development Company (BDC) Policy Unit, Enterprise Development Division TIDCO DFL-CDN, Microfin, NEDCO, CPSL
SOURCE: NEDCO Strategic Plan 2003-2006
The mandate for SME development was initially vested with the Ministry of
Enterprise Development and Foreign Affairs in 1999, but the Ministry of Labour and
SME Development is now charged with policy formulation. The objective of the
Ministry is the establishment of 5,000 new small and micro enterprises annually, an
improvement in the business survival ratio and the stimulation of entrepreneurship
within the economy. Each of the programmes outlined below has several eligibility

35
requirements which must be met by applicants for the loan. In the discussion which
follows the main highlight is on the facility offered and the amounts available.
The Ministry of Social Development administers three programmes geared to micro
enterprises – the Micro-Enterprise Loan Facility, the Regional Micro-Project Fund
(RMPF) and the Micro-Enterprise and Training Grant. All three programmes are
designed to assist underprivileged persons in their communities. The first programme
is managed in conjunction with the United Nations Development Programme (UNDP)
and offers assistance to persons who wish to establish a micro business but are unable
to accomplish this due to limited financial resources. This service is administered by
various community-based organisations (CBOs). Persons applying for this facility are
offered assistance in business plan development as well as training in entrepreneurial
skills. The maximum loan amount is $10,000.00.
The second programme provides grants to non-governmental organisations (NGOs),
CBOs and faith-based organisations (FBOs). These grants can also be used to fund
joint projects between civil society organisations and government organisations.
Grants requested under the RMPF must not exceed $25,000.00. The third grant is
offered to needy persons who are interested in undertaking a small business venture or
skills training. The maximum amount of the grant is $5,000.00. The grant is paid
directly to the supplier or suppliers of the goods or services required to start the
business.

36
In August 2002, the Business Development Company Limited (BDC) was established
as part of government’s continued thrust to encourage entrepreneurship.8 Unlike its
predecessor, the Small Business Development Company (SBDC)9 which concentrated
on start-ups, the mission of the BDC is the enhancement of growth and
competitiveness of existing enterprises. The BDC however is not classified as a
lending institution since financial support services are related to the acquisition of
machinery and equipment and assistance with working capital funding. The former is
facilitated through the Caribbean Leasing Company Ltd. (CLCL) and the latter
through BDC’s Loan Guarantee Programme. The focus of CLCL is the provision of
lease financing for equipment and machinery. During the period October 2002-July
2007, CLCL and its predecessor SBDC Leasing, received 318 applications for lease
financing representing a total value of $155.8 million of which 178 were approved at
a value of $56.5 million.
The Loan Guarantee Programme is specifically designed to assist businesses
(existing/expanding, new or start-up) in securing loans from lending agencies by
providing partial collateral. Guarantees are provided for funding purposes upon
qualification for a loan from the lender and the BDC. The loan repayment period is a
maximum of seven years while the maximum guarantee is set at $500,000.00 or 85
per cent of the loan amount, whichever is greater. For the period October 2002-July
2007, the BDC received 621 applications for loan guarantees of which 533 were
approved. Total loans supported were in the amount of $46 million of which the total
loan guarantee amount was $29.1 million.
8 The Government of Trinidad & Tobago owns 85 per cent of the BDC.
9 The SBDC was designated as the implementing agency in respect of Government’s policy for the
SME sector in 2000.

37
Table 12
Financial Performance of the BDC
Financial Ratios 2004 2005 2006
Liquidity
Current ratio 5.95 4.79 3.66
Efficiency
Income/Average total assets (%) 0.05 0.07 0.08
Profitability
Return on Assets (%) 4.10 5.71 6.40
SOURCE: Business Development Company
Although the ratios in Table 12 do not conform to conventional benchmarks, the data
show that BDC’s financial performance improved between 2004 and 2006. As a state
organization, measurement of financial performance in isolation does not give a true
representation of overall organisational effectiveness. A balanced scorecard approach
which examines internal processes, workforce learning and development and the
customer in addition to finances may be better suited.
The National Entrepreneurship Development Company Limited (NEDCO) was
established in August 2002 and provides funding and training to start or enhance
small and micro enterprises. The lending limit was initially $50,000 for first-time
clients, but this was increased to $100,000 in 2006, while the ceiling for existing
clients was also raised to $250,000. In order to access financing prospective
borrowers must undergo business training. NEDCO has been successful at facilitating
7,600 clients since its launch, with a loan repayment rate of 86 per cent10.
Approximately 13,300 jobs have been created and 4,600 persons have also been
trained. During the period August 2002-September 2004, NEDCO approved 2,981
loans at a value of $52.4 million via ten regional centres. Sixty-eight per cent of the
10
The international benchmark success ratio is 33 per cent.

38
loan portfolio is geared towards non-traditional activity while females accounted for
51.6 per cent of recipients. After receiving $45 million from stakeholders for fiscal
2005, the loan portfolio grew to $82 million which represented 5,000 businesses. Un-
audited figures suggest that the loan portfolio has grown further to $162 million at the
end of June 2007, although the delinquency rate also rose, to almost 25 per cent.
Several international organisations also support the SME sector through grants and
investment, for example, the Inter-American Development Bank (IDB) Multilateral
Investment Fund (MIF) – Small Enterprise Investment Facility. The objective of the
IDB/MIF is to promote private sector growth through grants and investments. While
the IDB is not directly engaged in lending to SMEs, funds are utilised for institutional
strengthening. In 1996, the MIF supported the SME sector through strengthening of
the credit union industry, with a facility valued at US$1.28 million which was closed
in December 2004. The MIF also supported the development of micro, small and
medium-sized businesses through the purchase of Caribbean Microfinance bonds
from DFL. The purchase in the amount of US$2.86 million in September 2001
allowed Caribbean Microfinance to commence operations. The Dynamic Equity
Venture Fund is also financed in part by the MIF. Approved in July 2001 at US$3.372
million, the Fund invests in companies with no more than 100 employees and US$5
million in sales. Although all the beneficiaries do not fall within the strict definitions
of micro and small businesses, the sector stands to reap the majority of the benefits.
As at July 31, 2007 there remained US$773,000 in un-disbursed funds.
There are also three small CBO’s which provide loans to residents of specific districts
who are unlikely to qualify for loans from commercial banks. The loans range in

39
value from as low as $2001-$100,000. The lending programme of one such group is
based on the Grameen Bank model and since its inception in 2001 a total of 3,162
loans ($6.3 million) were granted between 2001 and 2007.
7. Agricultural Development Bank (ADB)
The Agricultural Development Bank was established in 1968 with the objective of
providing credit for the sustained development of the agribusiness sector. Although
the bank’s function is sector specific, the majority of its clients could be classified as
micro and small enterprises using the standard definitions. Since 1968, the ADB has
provided over 40,000 loans or almost $3 billion in credit to the agricultural sector
which encompasses the entire food chain from primary production to agro-processing,
marketing and other support services. The ADB has also facilitated the direct
employment of at least two persons per loan. ADB loans, which are fully insured,
could be utilised for project establishment, project rehabilitation, project expansion,
purchase of equipment, machinery and vehicles, farm house construction, working
capital, operating costs and infrastructural development.
The financing facilities offered by the ADB include the following: Regular loans, as
well as a Same day/Package loan (Loans with no up-front fees and minimal security
granted in one day to specific farmers, for example, dairy farmers requiring cash
urgently). Youth Window (Loans up to $25,000 targeting individuals 18-35 years of
age). The loan size is usually based on the total project cost and repayment is
structured to fit the product cycle. Some features of a typical loan include:
moratorium, flexible repayment terms, and competitive interest rates calculated on
the declining balance (amortized). In the 2007/2008 budget, the ADB’s prime

40
lending rate was reduced to six per cent. The ADB also provides refinancing, loan
rescheduling and life insurance for all loans. With the increased focus on the
agriculture sector, the ADB is poised to become one of the most significant providers
of funding to micro and small business enterprises.
The financial performance of the ADB was affected by high loan loss expenses
because of a high proportion of non-performing loans. This led to the revision of the
Loan Loss Provision Policy in 2004. The data in Table 13 show the ADB as a
profitable enterprise between 2002 and 2004.
Table 13
Financial Performance of the ADB
Financial Ratios 2002 2003 2004
Liquidity
Current ratio 46.07 15.56 12.42
Efficiency(%)
Income/Average total assets 6.15 7.96 9.80
Profitability
Return on Assets (%) 10.73 5.42 5.01
SOURCE: Agricultural Development Bank
8. Venture Capital Incentive Programme
The Venture Capital Incentive Programme (VCIP) was introduced to address the lack
of equity capital available for small business financing as set out in the Venture
Capital Act of 1994 and amended in 1997 and 2005. The VCIP commenced
operations in October 1996. The prime objective of the VCIP is to increase the
supply of risk capital to the entrepreneurial small business sector, thus fostering the
expansion and preservation of small businesses as well as creating new jobs. This

41
objective is achieved by tax credits that are granted to investors in qualifying
companies.
Those companies seeking to make investments in a small or medium business venture
must first be registered as a Venture Capital Company (VCC) in order to receive tax
credits. Those entities seeking to obtain financing from a VCC must first obtain
Qualifying Investee Company (QIC) status. Qualifying Investee Companies have
access to advisory services and pre-investment technical support through the AMU.
This assistance is necessary for QICs to secure funding for their projects. The GOTT
provides investors in registered venture capital companies with an incentive equal to
the highest marginal tax rate for individuals and companies in effect. VCIP
administers a tax credit incentive of 25 per cent to investors of registered venture
capital companies. The venture capital company must subsequently invest in one or
more QIC. Where the amount of the tax credit cannot be wholly set-off against the tax
accessed for that income year, the amount of the unclaimed tax credit may be carried
forward and set off against tax accessed for succeeding years of income until fully
utilised.
The industry is comprised of three venture capital companies under the purview of the
VCIP and two private venture companies registered as issuers under the purview of
the Securities and Exchange Commission. At the end of 2003, the total amount of
funds available for investment was $15.3 million. VCIP has facilitated the raising of
$15 million in equity capital from individual and institutional investors and at the end
of 2005 venture capital companies invested $5.3 million in ten businesses.

42
9. The Financial Services Ombudsman (OFSO)
In May 2003 the Office of the Banking Services Ombudsman was established
to handle the complaints from customers of the commercial banks. The Office was
established by an agreement between the Central Bank and the commercial banking
sector. In April 2005 the office was rebranded the Office of the Financial Services
Ombudsman (OFSO) to include the insurance industry. The main objective of the
OFSO is to receive complaints from individuals and small businesses and to facilitate
the settlement of these complaints. The OFSO investigates complaints with respect to
products and services (deposit and loan accounts; life insurance policies, individual
annuity contracts). However the Office will not handle complaints in respect of
actuarial calculation, insurance premium rates, the general interest rate or the pricing
of products.
Over the four years of operation to 2007 the OFSO experienced a gradual
reduction in the number of complaints from both commercial banks and insurance
companies. Table 14 below contains data on the number of complaints received in
respect of the banking system. With respect to the insurance industry however the
OFSO noted that there continued to be a core group of companies – motor vehicle
insurers – against whom complaints are lodged and who take an inordinate amount of
time to settle claims. For example, April to December 2005 the OFSO received 298
complaints, 86 per cent of the complaints were in respect of motor vehicle insurers
and 13 per cent in respect of life insurers. In 2006, there were 480 complaints, 95 per
cent of which was in respect to motor insurance and four per cent life and health

43
insurance.11 Most of the complaints in respect of banking services relate to
unauthorized transactions in customers’ accounts, excessive fees and credit policies of
banks.
Table 14
Banking Sector: Complaints Received
Complaints Received Total of which Qualifying Non-Qualifying
2003* 154 25 129
2004 156 20 136
2005 73 36 37
2006 40 17 23
2007 26 12 14 SOURCE: OFSO Annual Reports
* For eight months of operation.
Conclusion and Afterword
This paper has examined recent trends in the financial system in Trinidad and
Tobago with special emphasis on developments in commercial banking, insurance
companies, mutual funds, credit unions, and small business. These are important
financial intermediaries as they match funds between deficit and surplus spending
units, mobilize saving and manage wealth accumulation. The period 1996-2007
represented one of continuous growth and expansion in the economy, which was
reflected in the financial sector as well – institutional growth and deepening, portfolio
diversification among savers and some development of the capital market.
The paper does not focus directly on monetary or financial policy; nor does it
address additions to the financial architecture such as the establishment of a real time
11
The 2008 Report of the OFSO points to a decline in the number of complaints from the financial services sector. However the Report notes that there are five insurance companies which continue to account for over 70 per cent of complaints received.

44
gross settlement system and that of an automated clearing house; the introduction of a
regional credit rating agency or developments in pension funds (both public and
private). For the most part each one of these topics belongs to a separate study. In
2005 the Bank introduced a Public Education Pamphlet Series which has addressed
some of these topics.12
While the financial sector developed over the period, the slow pace of
regulatory reform continued to be a challenge. Major revisions to FIA 1993 for
example would take close to five years before they were completed in 2008.
Although the White Paper on Financial Sector Reform outlined a fairly ambitious
agenda for the pace of revision to legislation, there has been some slippage to date.
End 2007 represents a natural cut-off date for the conclusion of the study for
several reasons. As already indicated, major revisions to the Central Bank Act and
the Financial Institutions Act were introduced in 2008 and 2009. In addition the
international financial crisis, which erupted in late 2008 and turned into a global
recession, ushered in a new debate on financial sector reform. The CL Financial
debacle of 2009 has brought into sharp focus the issues of cross border supervision
and financial holding companies. Over the short to medium term, legislative changes
which focus on consolidated supervision as well as crisis management should be in
place to guide the financial services industry in the second decade of the millennium.
The outlook for the sector is still promising despite the adverse developments of
2008-2009.
Revised March 2010. 12
The Public Education Pamphlet Series has three issues devoted to the mortgage market, the government securities market and the payments system in Trinidad and Tobago.