the evolution of mobile telecommunications · 2018-04-25 · the evolution of mobile...
TRANSCRIPT
Authors:Fabricio D’almeidaDiego Margot
Development throughthe Private Sector Series
April 2018
TNNo. 4
The Evolution of Mobile Telecommunicationsin Latin America and the Caribbean
Copyright © 2018 Inter-American Investment Corporation (IIC). This work is licensed under a Creative Commons IGO 3.0 Attribution-NonCommercial-NoDerivatives (CC-IGO BY-NC-ND 3.0 IGO) license (http://creativecommons.org/licenses/by-nc-nd/3.0/igo/legal-code) and may be reproduced with attribution to the IIC and for any non-commercial pur-pose. No derivative work is allowed. Any dispute related to the use of the works of the IIC that cannot be settled amicably shall be submitted to arbitration pursuant to the UNCITRAL rules. The use of the IIC’s name for any purpose other than for attribution, and the use of IIC’s logo shall be subject to a sepa-rate written license agreement between the IIC and the user and is not authorized as part of this CC-IGO license. Following a peer review process, and with previous written consent by the Inter-American Investment Corporation (IIC), a revised version of this work may also be reproduced in any academic journal, including those indexed by the American Economic Association's Econ-Lit, provided that the IIC is credited and that the author(s) receive no income from the pub-lication. Therefore, the restriction to receive income from such publication shall only extend to the publication's author(s). With regard to such restriction, in case of any inconsistency between the Creative Commons IGO 3.0 Attribution-NonCommercial-NoDerivatives license and these statements, the latter shall prevail. Note that link provided above includes additional terms and conditions of the license. The opinions expressed in this publication are those of the authors and do not necessarily reflect the views of the Inter-American Development Bank Group, its respective Boards of Directors, or the countries they represent.
April 2018
The Evolution of Mobile Telecommunicationsin Latin America and the Caribbean

The Evolution of Mobile
Telecommunications
in Latin America and the Caribbean
FABRICIO D’ALMEIDA∗ DIEGO MARGOT†
University of Illinois IDB Invest
April, 2018
In this study, we document and compare the progression of mobile phone penetration for twenty-
six Latin American and Caribbean countries and the capital expenditures associated to this expan-
sion. Using a detailed dataset at the firm level we study coverage expansion, investments, tech-
nology deployment and service quality trends. We explore the cycle of emergence to obsolescence
on each one of the four mobile technology generations and we show that it was under the second-
generation technology that most of the expansion of the access to mobile phone took place. Despite
the consolidation of market penetration at levels above 80% of the population on the richest coun-
tries, there are significant access gaps in some countries and quality gaps in terms of 4G coverage
and connection speed across all the region. These insights are paramount as a first step to a deeper
evaluation of the dynamics of this industry in Latin America.
∗Department of Economics, University of Illinois at Urbana-Champaign, 214 David Kinley Hall, 1407 W.Gregory Drive, Urbana, IL 61801, United States of America. Email: [email protected]. Website:https://sites.google.com/view/fabriciodalmeida.†IDB Invest, 1350 New York Avenue, NW. Washington DC, 20577, USA. Email: [email protected].

1 Introduction
The telecommunication industry is at the core of development. It fosters economic growth and it
helps to improve people’s lives. Telecommunication services play a key role in achieving each one
of the 17 UN Sustainable Development Goals, from promoting access to health services to helping
improving education outcomes. The advance of telecommunication technologies is also at the core
of achieving sustainable infrastructure, cities, and communities. It is not possible to think of smart
meter infrastructure devices, green smart buildings or citywide catastrophe coordination centers
without modern telecommunication services. These services are also critically important to foster
and improve innovation, create new products and services, and tackle climate change.
Telecommunications, and specifically broadband availability, create jobs and business opportuni-
ties, increase firm productivity, and connect people, regions, and markets in ways that were unimag-
inable a few years ago. Quality telecommunication services have the potential to boost opportunities
for the most vulnerable populations, by decreasing the digital gap.
Broadband availability positively affects employment, firm productivity and economic growth.
On employment, broadband availability added 1.0-1.8% to the growth rate of local employment
and 0.5-1.2% to the growth rate of the number of business establishments (Gillet et. al, 2006) and
these effects are larger in rural and isolated areas (Atasoy, 2013). Additionally, the increased use of
broadband services is associated with higher payroll (Van Gaasbeck, 2008).1
Regarding firm productivity, broadband adoption boosts firm productivity by 7–10%. These
effects are consistent across urban and rural locations and across high versus low-knowledge inten-
sive sectors (Grimes et. al, 2012). However, in order for broadband adoption to have a full impact
on productivity, it is necessary that a suitable environment be present. In the first place, the effect
on productivity is not instantaneous. It takes time. There is compelling evidence that the returns
of IT are generally more pronounced over the long term (Devaraj and Kohli 2003, Brynjolfsson and
Hitt 2003, Tambe and Hitt 2012). This is because firms do not simply plug in IT and enjoy its effects
immediately, they have to undertake a challenging transition from their existing business processes
and have to make complementary investments (Brynjolfsson et al. 2002, Brynjolfsson and Hitt 2003).
Secondly, effects are not always equal across firm size. Bigger firms may be better equipped to take
full advantage of broadband services. SMEs are found to benefit from adopting selected advanced
broadband applications depending on complementary factors such as: (i) industry of operations
1These studies refer to the early adoption phase in the US, from 1987 to 2004, and use administrative data and paneldata estimation to find correlations among these variables. Atasoy’s study, however uses IV estimation to establish acausal relationship.
1
(services vs. manufacturing); (ii) the relevance of the specific broadband software applications for
SMEs’ industry of operation; and (iii) the undertaking of complementary strategic and organiza-
tional changes. When these factors are present, productivity gains range between 20% and 70%
(Colombo et. al, 2013).2
Finally, broadband adoption has a positive impact on economic growth. A 10 percentage point
increase in broadband penetration raised annual per capita growth by 0.3 to 1.5 percentage points
(Czernich et. al, 2011). Effects are closer to the upper bound when a critical mass of infrastructure
is present (Koutrompis, 2009).3 For LAC, Garcia Zaballos and Lopez-Rivas (2012) found that a 10%
broadband expansion is associated with a 3.2% increase in GDP, although they could not established
a causal relationship.
Anecdotal evidence also highlights how broadband services can improve people’s lives. In Mali,
residents of Timbuktu can call relatives living in the capital city of Bamako or relatives in France. In
Ghana, farmers in Tamale are able to send a text message to learn corn and tomato prices in Accra,
over 400 kilometers away. In Niger, day laborers are able to call acquaintances in Benin to find out
about job opportunities without making the USD40 trip. In Malawi, those affected by HIV and AIDS
can receive text messages daily, reminding them to take their medicines on schedule (Aker and Mbiti,
2010).
However, the mobile broadband revolution presents a challenge. As with every technological
revolution, there are winners and losers. There are dynamic sectors that take full advantage of the
new possibilities and there are traditional sectors that are relegated. There are skills whose demand
increases, benefiting certain type of workers, and skills, whose demand falls, hurting the workers
that cannot keep up with the changes.
For these reasons, it is critically important that the digital dividend reaches all, and specifically
that it reaches the most vulnerable sectors of the population. Without this, the gap between the
digital haves and the digital have-nots will increase up to the point where the costs and negative
effects of the gap outweighs the gains from the technical advances. This is why it is important to
understand investment in deployment of new technologies, access and adoption trends.
Since the advent of mobile phones in the late 1990’s, the telecommunication’s industry has al-
ready experienced four major leaps in technology. Each new generation of mobile phone technology
(i.e. 2G, 3G, 4G) is associated with a new wave of investments by telecommunication’s companies.
From the late 1990’s to 2017, four new generations required together investments equivalent to 0.15%2These studies use model structural estimation and they cover North America, New Zealand and Europe.3These studies use panel instrumental variable estimation to find a causal relationship between broadband adoption
and GDP growth, using a panel from many countries around the world covering the period 1996-2007.
2
of the world GDP. While in developed countries the ability of companies to access financial markets
to finance such expansions is well-known, in Latin American countries the source of funds to finance
the technological progression of this industry is left to be explored.
In order to fully understand the development of the telecommunication industry is necessary
to consider two dimensions: first, infrastructure deployment and adoption, and second, skill de-
velopment and content creation. Both dimensions are complementary to each other and equally
important. Of course, infrastructure (physical networks, connected devices) is the basic input for
industry advancement, but deployment is not enough by itself. Equally important is the adoption
rate. If the infrastructure is not used, if users do not adopt the technology, investments make no
sense. The question is then, how to incentivize adoption, once the infrastructure is in place? Here,
skills and content play a key role. Consumers will adopt (buy) the services if they find benefits in
doing so, and they will, if they find interesting content they can consume. Interestingly, consumers
prefer local content, content that is in a language they understand and that caters to their interest
and reflects their idiosyncrasies. So, to encourage adoption, a critical mass of local content needs to
be available to consumers, and local content comes from local developers with the necessary skills.
It is then also very important to have available skilled workers and local firms to create local content.
In the present work, we study the first dimension. We document and compare the progression of
technology deployment and consumer adoption, studying mobile phone penetration trends in each
of the 26 Latin American and Caribbean countries that are borrowing members of the Inter-American
Development Bank Group (IDBG) between 2000 and 2017. Access to mobile phone increased from
less than 10% of the population on the year of 2000 to more than 70% in 2017. We also study the
necessary investment (capital expenditures) associated to this expansion. Despite the consolidation
of market penetration at levels above 80% of the population on the richest Latin American countries,
the advent of the third and fourth generations increased investments levels from less than 10% to
more than 20% of the industry’s revenue. On another basis, the investment in capital as a share of
GDP increased from than 0.05% on the year 2000 to almost 0.1% on 2017.
The cycle of emergence to obsolescence on each one of the four mobile phone generations is also
explored. We show that it was under the second-generation technology that most of the expansion
of the access to mobile phone took place. While the third generation technology had a cycle that
lasted 4 years before starting to lose customers to the fourth generation, the second generation had
a 8-year cycle. This is evidence that technology progress and adoption is moving faster over time.
Moreover, we discuss the market structure behind the expansion of the access to mobile phones.
As it was mostly carried by the private sector, the telecommunication’s industry is unique among in-
3
frastructure sectors in Latin America. Historically, infrastructure sectors have been under the control
of the government during periods of heavy investments. However, the private sector has a predomi-
nant role in the telecommunication industry in Latin America, and while monopolies are not present,
the sector should not be considered perfectly competitive as there are a few players in all markets.
These insights are paramount as a first step to a deeper evaluation of the dynamics of this in-
dustry in LAC. Particularly, if we are interested in a future investigation about the financing of the
telecommunication industry it is important to analyze the trends in the access to mobile phones, in
the number of connections by technology generation, the overall investment amounts, the indus-
try’s market structure and its regulatory issues. This work is the first study that analyzes the trends
of mobile penetration and technology adoption over a long period of time for the majority of LAC
countries. Using a novel, detailed dataset from GSMA Intelligence, we are able to identify and com-
pare market penetration rates, investment trends and technological adoption over 17 years, from a
single, homogeneous data source that allows comparisons across countries and periods. This work
produces one of the most complete descriptions of the mobile telecommunication industry for LAC.
This work is related to other sector studies such as ECLAC’s El estado de la banda ancha en America
Latina y el Caribe(2016, 2018) and academic papers, i.e. Barrantes and Galperin (2008). Our study,
however, covers more countries and years than the cited works, offering a more detailed picture of
industry trends for the whole region over a longer period of time.
The study proceeds as follows. Section 2 describes the dataset employed in the empirical analy-
ses. Section 3 provides the evaluation of the trends in access to mobile phone. Section 4 presents the
evolution of connections by technology generation. Section 5 analyzes the evolution of investments
made by the telecommunication industry. Section 6 discusses the relationship between service qual-
ity and development impact. Section 7 describes the market structure and the regulatory framework
of the mobile telecommunication industry in Latin America and the Caribbean. Finally, Section 8
concludes.
2 Data
We use a novel dataset from GSMA Intelligence.4 The dataset contains quarterly information, from
2000 Q1 to 2017 Q3. The period is long enough to study medium to long run trends in the telecom-
munication industry. Unfortunately, it does not go back to the early 1990’s when most of the pri-
4All telecommunication data, graphics and data analyses in this document are based on GSMA’s proprietary data, (c)GSMA Intelligence, 2016, unless otherwise noted.
4
vatization of the telecommunication companies and first deployment of mobile voice services took
place. However, it spans over a long enough period to include many industry-key events. From
mobile internet introduction and deployment with the 1G/2G technologies in the early 2000’s to the
current 4G revolution around 2010. It also covers a period where many mergers and acquisitions
took place, and where new firms entered Latin American markets.
The dataset contains information regarding four important topics: technology deployment dates,
consumer adoption rates, identity of each active operator (and some which have exited the market)
and investment. More specifically, it allow us to observe dates of deployment of different tech-
nologies, from 1G to 4G. It also contains detailed information on number of subscribers and phone
connections per country. This type of information is extremely useful to analyze adoption rates and
trends. That is, we can observe not only technology introductory dates, but also the speed at which
consumers in each country actually adopt these technologies and market penetration rates. Finally,
the dataset has information on investment, defined as the CAPEX made by firms in each country.
GSMA obtains information from different sources, then standardize it so it is comparable across
countries and years. GSMA collects some variables directly from regulatory authorities, such as
information that operators are legally required to submit to the regulator and which the regulator
made publicly available. Among these, number of subscribers (or connections) and technology in-
troductory dates in most countries. Other variables are collected from companies public reports,
such as the ones that Stock Exchanges require listed companies to submit. Among these variables,
financial information such as aggregated CAPEX. Other pieces of information are collected directly
from the operators, such as investments. While GSMA makes an effort to have accurate data, the
information collected from the operators is self-reported.
We combine the GSMA data information with other economic and demographic data, such as
GDP and country populations from the World Bank’s World Development Indicators. This type
of information is originally reported on an annual basis, and standard interpolation techniques are
used to fill in quarterly data. This data allow us to better understand how evolution of the mo-
bile telecommunication expansion and adoption rates might be correlated with social and economic
characteristics of LAC countries. We are going to concentrate the analysis in the 26 LAC countries
that are IDB-borrowing members.
5
3 Market Penetration
We use market penetration, defined as the number of unique subscribers over the total population,
as our main measure to assess the access to this technology from 2000 to 2017. It is important to
distinguish between number of phones, or connections, and unique subscribers. Unique subscribers
refer to the number of people that have a access to a service or technology. However, unique sub-
scribers may have more than one phone. Then, it is possible that there are more connections that
unique subscribers, if some subscribers have more than one line. In this way, using connections
may overestimate the actual penetration rate. In order to accurately determine this rate rate, we
use unique subscribers, or individuals. Individuals with more than one mobile phone count as one
unique subscriber for the purposes of determining penetration and adoption rates.
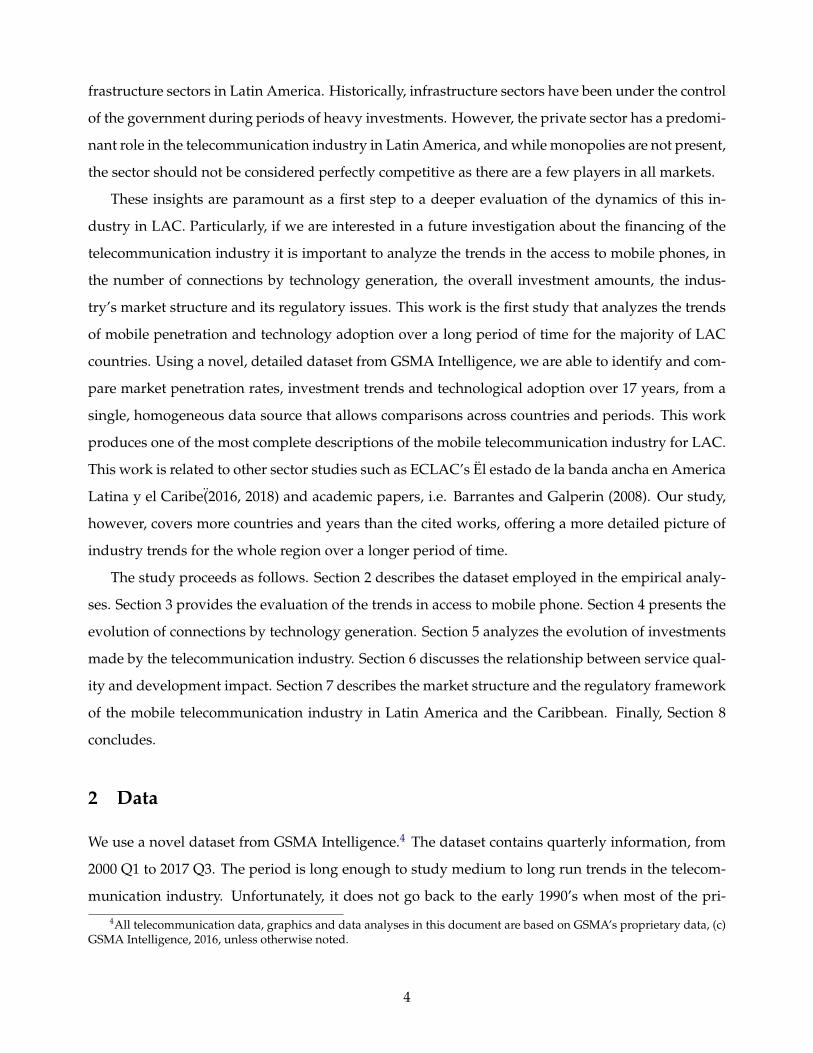
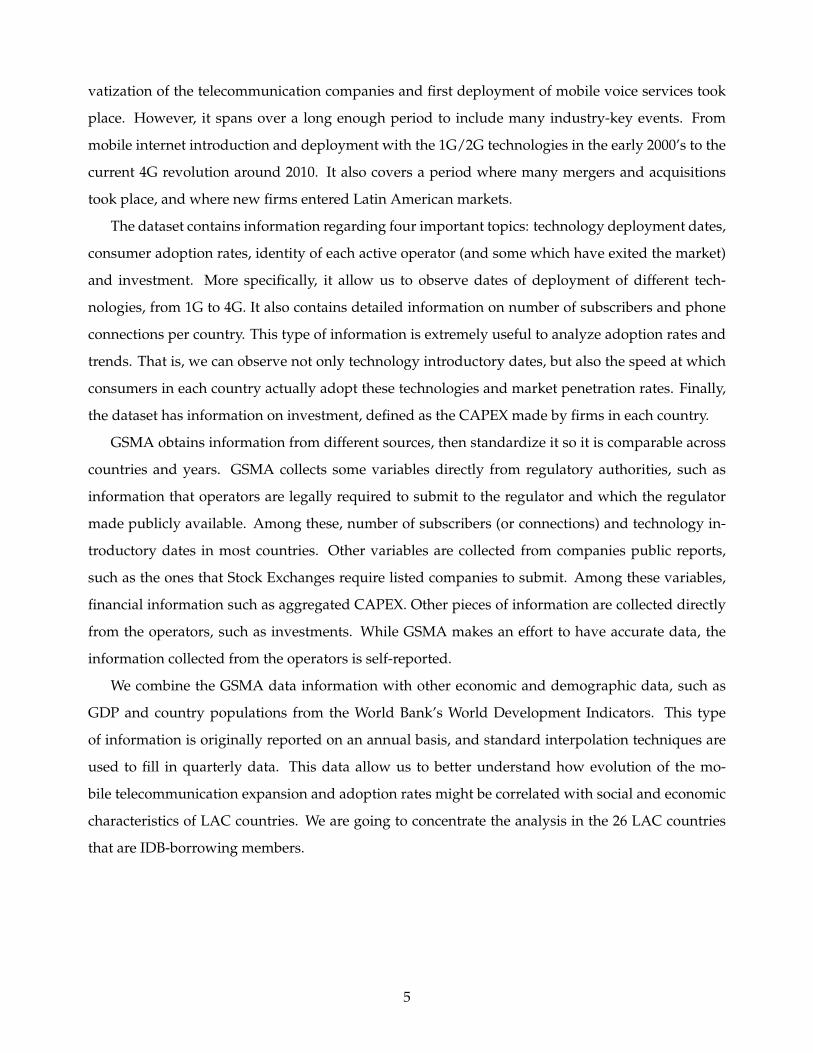
Figure 1 shows that for the year of 2000, less than 10% of the population had a mobile phone.
The high cost of the mobile devices at that time relative to the average income can be attributed as
the main reason for the low market penetration. According to the U.S. Bureau of Labor Statistics,
prices for wireless telephone services were 37.04% lower in 2017 versus 2000 (U.S. Bureau of Labor
Statistics, Consumer Price Index for wireless telephone service). While there is no comprehensive,
standardized data for LAC, evidence from different studies shows the same trend. The monthly cost
of prepaid low-volume mobile basket as a percentage of the minimum monthly wage in 2007 (year
of introduction of the iPhone) ranged from 5% in Argentina and Chile, to about 10% in Colombia
and Uruguay to more than 15% in Brazil and Mexico (Barrantes and Galperin, 2008). The cost of a
similar service basket in 2016 5 is less than 3% in Argentina and Chile (i.e. roughly 40% less with
respect to 2007), less than 4% in Brazil, Colombia, and Uruguay, and about 7% in Mexico (60% less
for these countries and even lower for Brazil).
While the access to mobile phones grew at a rate of 2.5 percentage points (p.p.) on the first four
years of the decade of 2000, on 2004 the telecommunication industry experienced an inflection point.
Growth accelerated to almost 6 p.p. per year and kept at this high pace until late 2012, when almost
70% of the population already had a mobile device. From 2012 to 2017, growth decelerated to less
than 2p.p. per year, indicating that the mobile market may be reaching a saturation point (measured
as access to mobile phone).
5Minimum cost for a prepaid mobile broadband data package. This basket is not directly comparable to the one usedby Barrantes and Galperin (2008) since it includes more services, but it is useful to make our case: first, because it includesmore services at a lower cost, which reinforces our case, and second, because both studies use a standard, basicpackage atthe time they were written. In this fast evolving industry, to compare service cost across years it is reasonable to comparethe same category of services, in this case basicpackages, even though the actual bundles do not include the exact sameitems: the basic package in 2007 is obsolete in 2016.
6
Figure 1. Market Penetration
0
20
40
60
80
Un
iqu
e S
ubs
c. /P
opu
lati
on (
%)
2000
q1
2002
q1
2004
q1
2006
q1
2008
q1
2010
q1
2012
q1
2014
q1
2016
q1
2017
q2
For the region as a whole, we can observe the access to mobile phone has increased considerably
on from 2000 to 2017. On the beginning of the decade of 2000, all countries had a penetration rate less
than 20%, while by the year of 2017, for all countries but Haiti, more than half of their population al-
ready had access to it. The disparity on penetration rates among countries can be partially explained
by their differences in economic development. The correlation between market penetration and eco-
nomic development is 0.56, and it is statistically significantly different from zero at the 1% level.
Figure 2 plots each Latin American country by income, GDP per capita, as of 2016, in U.S. dollars,
and market penetration, as of the fourth quarter of 2016. With the exception of Venezuela and the
Bahamas, represented by the rightmost two dots, all countries whose GDP per capita is above USD
10,000 present a market penetration above 80%. Meanwhile, all countries whose GDP per capita is
below USD 5,000 have a market penetration below 80%.
As observed, the evolution of market penetration differs among countries: the speed with which
countries reached their current state was different, and there are some markets where penetration is
still far from being considered saturated. Countries like Honduras (60% penetration rate), Bahamas,
Venezuela (about 70% penetration rate), Barbados and Trinidad and Tobago (above 90% penetration
rate) achieved their current rates relatively fast: by 2008-10, they had almost achieved their 2017
coverage levels. That is, these countries exhibited a high increase in penetration rate from 2000 to
2010, and stabilized after that. Note that this not mean all these countries achieved market saturation
7

though, as observed in Honduras, Bahamas, and Venezuela. Other countries such as Colombia and
Ecuador (about 65% penetration rate), Brazil, Jamaica, and Paraguay (70%), and Argentina, Chile,
and Uruguay (above 90%) experienced a more steady expansion process, achieving their current
penetration rates between 2011 and 2014. Colombia and Ecuador are worth noting, because they
reached the 50% penetration rate mark very early, by 2006, but after that initial period of high speed
coverage expansion the process stalled. It took them another 6 to 8 years to achieve 60-65% (just
an additional 10-15% from their 2006 coverage level) and they have not grown since. Finally, other
countries like Belize, Bolivia, Dominican Republic, and Guyana (about 60% penetration rate), Mex-
ico, Peru (above 70%), Nicaragua, Panama, and Suriname (above 80%) only achieve their current
rates by 2015-17, and with the exception of Suriname, which may have achieved its saturation rate,
they may continue to expand their coverage rates in the coming years if the present trend continues.
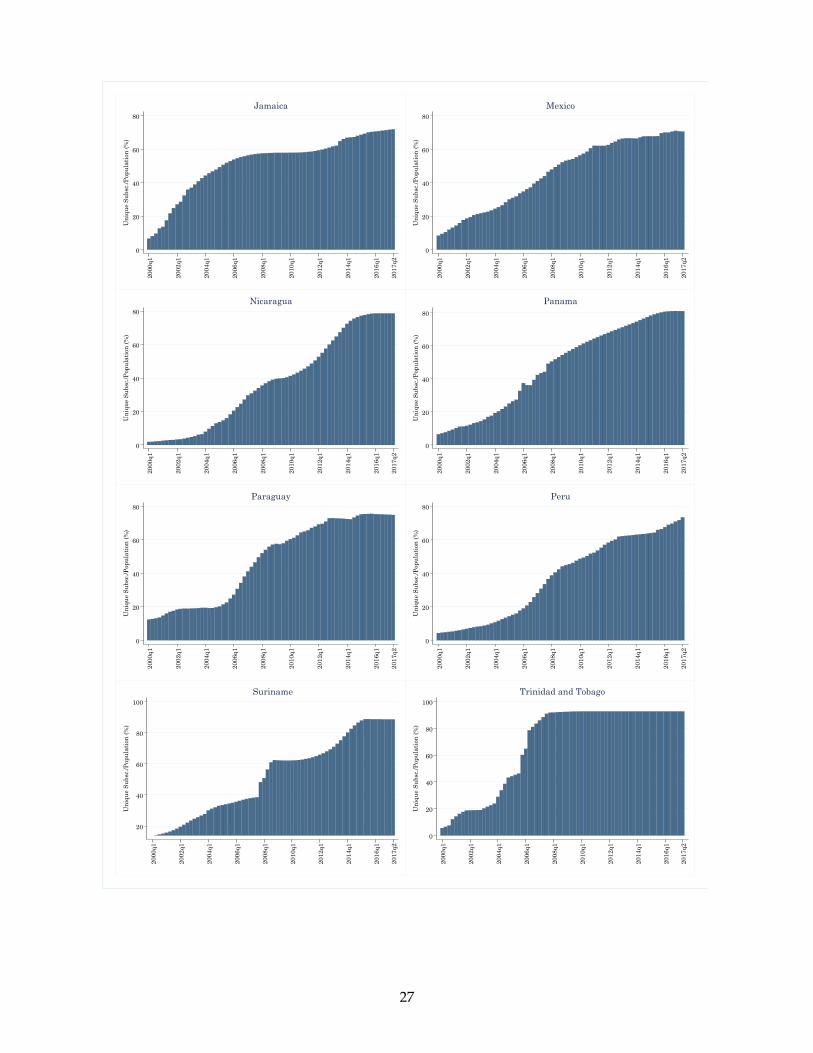
In the Appendix, Figure A1 presents the evolution of market penetration for each of the 26 countries.
Figure 2. GDP Per Capita and Market Penetration (2016)
TTOCHLURYARGSUR BRB
CRIPAN
SLVNICPRY VEN
JAM MEXPER BRA BHSCOLBLZ
BOLGUYHND DOMECU
GTM
HTI
40
50
60
70
80
90
100
Mar
ket
Pen
etra
tion
(%
)
0
5000
1000
0
1500
0
2000
0
2500
0
GDP per capita (USD - 2016)
4 Adoption of New Technologies
Although adoption of mobile phones is already close to 80%, the development of new technologies
that improve the capabilities of mobile devices creates a continuing demand for new investments in
the telecommunication industry. During the period of 2000 to 2017, we witnessed: (i) the demise of
8

the first (analogue) technology generation, (ii) the dawn and dusk of the 2G, (iii) the dawn of 3G and
its current lost appeal to customers, and (iv) the emergence of the latest 4G. Figure 3 presents these
trends by plotting the rate of new connections by technology generation.
It must be noted that the life-cycle of each new technology is getting shorter. This phenomenon,
when newer technologies overcome older technologies at a faster pace, making the latest technology
dominance period shorter and shorter, it is known as leap-frog. We observe this leap-frog pattern in
LAC over our sample-period. The adoption of the second generation (2G) of mobile phone technol-
ogy started to accelerate in the first quarter of 2004, when the rate of new connections reached the
mark of 2% of the population for the first time. This rate remained above the 2% level until the first
quarter of 2009, making the expansion of the 2G the longest of all four, at 5 years on total. In the
first quarter of 2010, the rate of new connections of the third generation surpassed the 2G rate for
the first time. However, it was only one year later that the 3G expansion began to accelerate. The 2%
mark of new connections for the third generation was reached on the fourth quarter of 2011 and it
remained above this level until the third quarter of 2015. Therefore, the 3G expansion period lasted
almost four years. Finally, the demise of the 3G expansion, by falling below the 2% mark on the third
quarter of 2015, was subsequently followed by the adoption of the fourth generation, that reached
the 2% mark no later than the first quarter of 2016.6
Figure 3. Quarterly New Connections by Technology Generation
-4
-2
0
2
4
New
Con
nec
tion
s/ T
otal
Pop
ula
tion
(%
)
2000
q1
2002
q1
2004
q1
2006
q1
2008
q1
2010
q1
2012
q1
2014
q1
2016
q1
2017
q1
1G 2G3G 4G
6 In the Appendix, Figure A3 presents the evolution of total connections by country and technology generation.
9

In 2009, the access to a mobile phone reached more than half of the population of the region
under the 2G technology. It is natural that when the 3G technology became available, it would not
only allure customers that did not had a mobile phone but also the ones that wanted to upgrade
to a better access. Therefore, given the limitation on the size of the market and the dawn of the
new 3G technology, the number of existing 2G connections eventually started to diminish. On the
first quarter of 2012, the rate of (net) connections reached the negative side (net disconnections) for
the first time, indicating that the 2G technology was already being substituted by the then new 3G
generation. The rate of 2G disconnections reached its peak of almost 4% per quarter in the beginning
of 2014 and it has been loosing users since then. From its peak of expansion on 2006Q1 to the peak
of disconnections on 2014Q1, the cycle of 2G technology lasted 8 years. On the other hand, the 3G
technology, from its peak expansion on 2013Q4 to the highest rate of disconnections on 2017Q1, there
were less than 4 years, a cycle that was less than half than the one for 2G. It remains to be seen if when
the unserved customers in LAC (those in rural isolated areas and the urban poor) are reached, they
choose the latest technology (i.e. 4G or future technologies) or something older and more affordable
like 3G, which may extend the life-cycle of this technology.
5 Investments
The expansion of the access to mobile phones and the subsequent evolution of the technology re-
quired massive investments by the telecommunication industry. Figure 4 shows that the sum of the
capital expenditures (CAPEX) on all of the 26 IDB-borrowing member countries increased from less
than one billion dollars per quarter in 2000 to more than 3 billion per quarter from 2012 to 2017,
with peaks above 4 billion. The disaggregation using quarterly frequency allows us to observe that
most of the spikes on capital expenditures happen on the fourth calendar quarter of each year. This
pattern is in line with most of the literature of corporate investments that shows the vast majority
of companies matches their last fiscal quarter with the last calendar quarter. In most countries, a
portion of capital expenditures may be deducted to reduce annual income tax, and as a result firms
have an incentive to increase these expenditures during the final fiscal quarter of the year to mini-
mize tax obligations. According to our data, the telecommunication industry is no exception to this
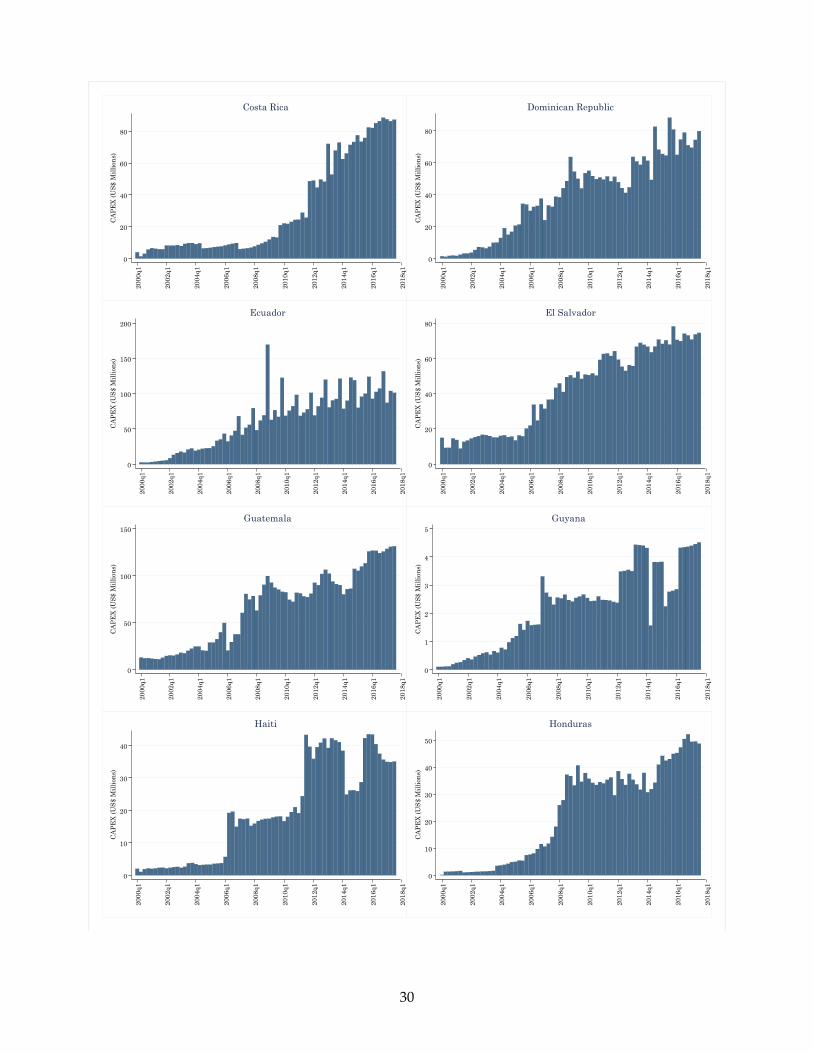
pattern. The analysis at the country level shows heterogeneity across countries. While each coun-
try follows its own trend, three general patterns can be observed. First, countries like Brazil, Chile,
Colombia and Panama reached their highest investment levels before 2006. These countries made
big investments early, deploying most of their networks for the 2G technology. Later investments
10
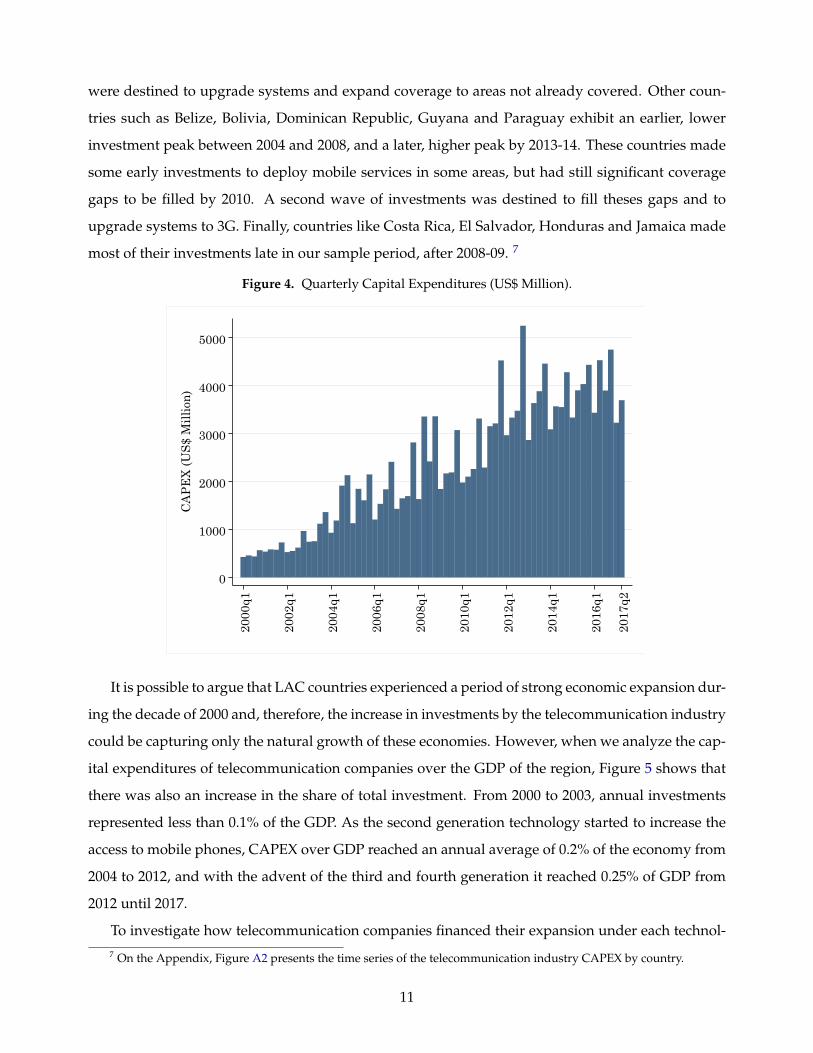
were destined to upgrade systems and expand coverage to areas not already covered. Other coun-
tries such as Belize, Bolivia, Dominican Republic, Guyana and Paraguay exhibit an earlier, lower
investment peak between 2004 and 2008, and a later, higher peak by 2013-14. These countries made
some early investments to deploy mobile services in some areas, but had still significant coverage
gaps to be filled by 2010. A second wave of investments was destined to fill theses gaps and to
upgrade systems to 3G. Finally, countries like Costa Rica, El Salvador, Honduras and Jamaica made
most of their investments late in our sample period, after 2008-09. 7
Figure 4. Quarterly Capital Expenditures (US$ Million).
0
1000
2000
3000
4000
5000
CA
PE
X (
US
$ M
illi
on)
2000
q1
2002
q1
2004
q1
2006
q1
2008
q1
2010
q1
2012
q1
2014
q1
2016
q1
2017
q2
It is possible to argue that LAC countries experienced a period of strong economic expansion dur-
ing the decade of 2000 and, therefore, the increase in investments by the telecommunication industry
could be capturing only the natural growth of these economies. However, when we analyze the cap-
ital expenditures of telecommunication companies over the GDP of the region, Figure 5 shows that
there was also an increase in the share of total investment. From 2000 to 2003, annual investments
represented less than 0.1% of the GDP. As the second generation technology started to increase the
access to mobile phones, CAPEX over GDP reached an annual average of 0.2% of the economy from
2004 to 2012, and with the advent of the third and fourth generation it reached 0.25% of GDP from
2012 until 2017.
To investigate how telecommunication companies financed their expansion under each technol-7 On the Appendix, Figure A2 presents the time series of the telecommunication industry CAPEX by country.
11

Figure 5. Quarterly Capital Expenditures over GDP.
.02
.04
.06
.08
.1
CA
PE
X/G
DP
(%
)
2000
q1
2002
q1
2004
q1
2006
q1
2008
q1
2010
q1
2012
q1
2014
q1
2016
q1
2017
q2
ogy generation we would need to analyze their access to internal and external funding. Although
this issue is outside the scope of this study, a few insights can be made. By the theory of pecking
order (see for example Myers and Majluf 1984, Quan, 2002; Ronconi and Kawamura, 2015, for LAC),
companies should first use internally generated funds to finance their investments. Cash flow from
operating activities have a lower cost compared to external funds, such as debt and new issuance of
equity. On the early 2000’s, as market penetration was low, the ability to generate revenue compared
to the necessity of investment was limited, probably requiring funding from external sources. As a
first step, we analyze the evolution of the CAPEX as a share of the total revenue. Figure 6 shows
that from 2000 to 2003 telecommunication companies invested less than 10% of their revenue. Once
again, matching the period of the expansion of access to mobile phone, in 2004 the average quar-
terly investment reached almost 15% of the revenue. On the subsequent years, CAPEX as share of
revenue was kept on levels around 10% of the revenue. Finally, matching the advent of the fourth
generation, we can observe a spike in this ratio to more than 20% since 2015.8
Indeed, Figure 7 shows that it was on 2004, the year when the number of new subscribers acceler-
ated the most, that investment reached its highest amount at almost USD16 per subscriber.9 Given a
first boom on the subscriber’s base and the consequent increase in their revenue, it is likely telecom-
8 On the Appendix, Figure A5 shows the dynamics of the CAPEX revenue ratio by country.9 On the Appendix, Figure A6 presents the evolution of investments per subscriber by country.
12

munication companies switched from a majorly external funding strategy to investments that were
financed more with internally generated funds. This hypothesis would explain why CAPEX as share
of revenue increased substantially after 2014.
Figure 6. Quarterly Capital Expenditures over Revenue.
5
10
15
20
25
CA
PE
X/ R
even
ue
(%)
2000
q1
2002
q1
2004
q1
2006
q1
2008
q1
2010
q1
2012
q1
2014
q1
2016
q1
2017
q2
Figure 7. New Subscribers and Need for Investments
6
8
10
12
14
16C
AP
EX
/ Su
bscr
iber
(U
S$)
0
5
10
15
New
Su
bscr
iber
s (M
illi
ons)
2000
q1
2002
q1
2004
q1
2006
q1
2008
q1
2010
q1
2012
q1
2014
q1
2016
q1
2018
q1
New Subsc. CAPEX/ Subsc.
13

6 Quality and Development Impact
Access to mobile services does not mean access to mobile quality services. Access to mobile services
is a necessary condition, but is a basic one. It is by no means an end in itself. In a dynamic, fast-
paced changing, innovative industry, basic access does not mean much. The key to enjoy most of the
related services and possibilities lies in having access to a quality service with the latest technology.
While mobile coverage and adoption rates have been growing constantly since 2000, there is still
great room for improvement in the quality dimension. Today, having access to a mobile service is
not enough. In order to take full advantage of the possibilities offered by modern technologies, it is
imperative to have access to a quality service.
As mentioned in section 3, about 70% of LAC population has access to the service. However, less
than 20% has adopted the 4G technology, the one that provides access to the most applications, and
the one that has the biggest potential to have a development impact. The LAC average 4G adoption
rate is 17% (see Figure 8), although the situation varies by country. On the one hand, Uruguay 4G
adoption rate is above 50%, Argentina and Chile are above 40% and Brazil is about to reach 40%. On
the other extreme, many Central American and Caribbean countries have 4G adoption rates below
10%.
Figure 8. 4G Adoption rate (% of Population)
0
10
20
30
40
50
60
Argentina
Bahamas
Belize
Bolivia
Brazil
C.Rica
Chile
Colombia
DominicanRep
Ecuado
rElSalvado
rGu
atem
ala
Guyana
Haiti
Hond
uras
Jamaica
Mexico
Nicaragua
Panama
Paraguay
Peru
Surin
ame
T.Tob
ago
Uruguay
Vene
zuela
%ofP
opulationwith
4Gserviece
About 40% of LAC connections are still working on 2G, and another 40% on 3G. The problem
with these older technologies is that they run on lower speeds and they are not as capable as 4G to
provide access to many value added applications. 4G is up to ten times faster (in download speed)
than 3G. These faster speeds allow users and firms to use more and better services. For example,
14

a download speed of 2Mbps allows emailing and simple web browsing, 4Mbps allows full web
browsing and using online payments applications, 6 to 8 Mbps are required to do video-conferences
and 25Mbps allows HD video streaming. How are these speeds related to the mobile technology?
While the question is difficult to answer, since actual network speed depends on many factors such as
technology, assigned bandwidth and spectrum frequency, on average 4G exhibits download speeds
of 15-18Mbps, 3G achieves download speeds of 3-7Mbps, and 2G speeds of 0.1-0.3Mbps. Since 40%
of LAC customers still use 2G, and a significant portion of the 3G customers are on the lower end of
the speed range, it is clear that the majority of LAC customers do not have access to the broad range
of possibilities offered by a quality service.
The importance of quality and speed have been recognized by the UK regulator, Ofcom, and by
the US regulator, the FCC, when defining what is considered broadband. For the Ofcom, a user has
broadband service if the download speed is at least 24Mbps. A users with access to a download
speed of at least 10Mbps is considered to have decent broadband. In the US, the FCC defines broad-
band service as those that have a download speed of at least 25Mbps. In LAC, we are far away from
those standards. As of 2017 Q3, no LAC country has an average download speed of 10Mbps or more
(Akamai Technologies, 2017), see Figure 9. There is no LAC country where the average user has de-
cent broadband, according to the definition of the Ofcom. Chile, Trinidad and Tobago and Uruguay
have an average speed of a little more than 9Mbps and Bahamas 8Mbps. On the other side, Belize,
Paraguay and Suriname have average download speeds of about 2Mbps.
Of course, the situation is not equal within countries. Some users in many LAC countries (not all
of them, though) do have access to download speeds of 10Mbps or more (see Figure 10). However,
they are the exception rather than the rule. More than 30% of users in Chile, Trinidad and Tobago
and Uruguay have a service with at least 10Mbps, while more than 20% of the users in Bahamas
and Jamaica have decent broadband (Brazil and Mexico are very close to 20%). In Paraguay, Suri-
name and Venezuela no users have access to at least 10Mbps, and in Belize, El Salvador, Guatemala,
Guyana and Nicaragua less than 3% of the customer base have decent broadband.
Clearly, if LAC users are to have access to the latest applications, the ones which have a biggest
development impact, it is imperative to deploy as soon as possible the 4G technology and it is also
critical to improve the quality (download speed) of the service. It is clear that under the current
situation the average user in LAC has no access to some of the best applications. The situation is
even more problematic for firms, which cannot access services that may increase their productivity
and expand the markets for their products.
This lag in technology deployment hurts the region by increasing the digital gap with respect to
15

Figure 9. Average download speed (Mbps)
02468
1012141618
Argentina
Bahamas
Belize
Bolivia
Brazil
C.Rica
Chile
Colombia
DominicanRep
Ecuado
rElSalvado
rGu
atem
ala
Guyana
Haiti
Hond
uras
Jamaica
Mexico
Nicaragua
Panama
Paraguay
Peru
Surin
ame
T.Tob
ago
Uruguay
Vene
zuelaAv
eragedo
wnloadspeed,2016
(Mbp
s)
Source: Akamai Technologies, 2017.
Figure 10. Users with download speed of 10Mbps or more (% of Population)
0
10
20
30
40
50
60
Argentina
Bahamas
Belize
Bolivia
Brazil
C.Rica
Chile
Colombia
DominicanRep
Ecuado
rElSalvado
rGu
atem
ala
Guyana
Haiti
Hond
uras
Jamaica
Mexico
Nicaragua
Panama
Paraguay
Peru
Surin
ame
T.Tob
ago
Uruguay
Vene
zuela
%ofP
opulationwith
dow
nloadspeed
of10M
bpso
rfaster
Source: Akamai Technologies, 2017.
the more advanced economies, where the average user enjoys a download speed of 17.1Mbps, 58%
of users have a download speed of at least 10Mbps and 69% of the population has adopted the 4G
technology.
Additionally, the problem is present within each country. Those without access to higher speeds
and better qualities are at a significant disadvantage with respect to the group with access. It is no
surprise that the group at a disadvantage encompass the most vulnerable segments of the popula-
tion: urban poor, rural small towns in general and rural women in particular. For 9 LAC countries
where disaggregated data is available, the access gap between urban and rural population was 20%
16

in 2011 (ECLAC, 2013). For LAC, the challenge is to achieve digital inclusion as soon as possible.
7 Market Structure and Regulatory Issues
The telecommunication industry is the most deregulated infrastructure sector. Unlike energy trans-
mission and distribution or water and sanitation provision, the telecommunication sector has seen
a great deal of private involvement since the early 1990’s. Prices and service packages offered are
freely determined by the firms in the market in almost all Latin American countries. While the
industry is subject to regulatory oversight, the regulation focuses on technical aspects such as inter-
connection issues, number portability and spectrum allocation rather than on economic regulation
of prices and quantities. Private participation on investment is also the highest among infrastructure
sectors in Latin America and the Caribbean. In the last 9 years, the private sector accounts for almost
80% of the investments in telecommunications, compared to 51% in energy and 3% in water and
sanitation (Infralatam, 2017).
A deregulated environment leads to the absence of monopolies and extensive private participa-
tion across the region. All LAC countries have at least one private operator and at least two firms
in the market. However, the industry is far from perfectly competitive and it remains concentrated.
Few big players dominate the sector in all LAC countries, sometimes mixed with one or two very
small operators that concentrate on a specific market niche or geographical region within a country.
In all LAC countries, there are between 2 and 7 operators offering services at the end of 2017.
Countries with only two operating firms are located in the Caribbean: Bahamas, Barbados, Belize,
Guyana, Haiti, Jamaica, Suriname and Trinidad and Tobago are all in this group. Most of all non-
Caribbean LAC countries have either 3 or 4 firms operating in their domestic markets. Countries in
this group are heterogeneous. Some of them are big markets, like Argentina and Mexico, others are
smaller markets such as Nicaragua and Bolivia. They are located all across South America (Uruguay,
Paraguay, Peru, Venezuela) and across Central America (Costa Rica, Panama). Only four countries
have 5 or more operators present in their markets. Brazil, the biggest market in the region, also has
the most firms operating in a single market: 7. Chile, Colombia and El Salvador have 5 each.
Of course, the number of firms in a concentrated market is an imperfect indicator of competition.
In the first place, firms may have very different sizes and different degree of market power. For
example, in Brazil, Colombia and Paraguay there are very small operators that can be considered
followers that do not have enough power to set prices or determine industry trends. In the case
of Brazil and Colombia, two of the countries with more operators, there are very small firms that
17

operate only in regional markets and account for less than 1% of the market share. While there are
7 and 5 firms present in these countries, the number of firms with actual market power is clearly
smaller than those figures.
A better measure of concentration is the Herfindahl Hirshman Index (HHI). This index sums the
squares of the market shares for each firm in the market, and ranges from 0 (perfect competition,
assuming many very small firms in the market with a negligible share each) to 10,000 (a monopoly,
where one firm has a 100% of the share). Figure 11 depicts the number of operators and the HHI (on
the right axes) for all LAC countries. The least concentrated markets according to the HHI are Brazil,
El Salvador and Chile, all with and HHI lower than 3,000. Panama, Peru and Argentina have also
relatively less concentrated markets (HHI lower than 3,300). The countries in the Caribbean have
the most concentrated markets. Suriname, Trinidad and Tobago, Belize, Guyana, Barbados, Jamaica,
Haiti and Bahamas have all HHI above 5,000. The case of Bahamas represents and extreme for the
region: while there are two operators, the HHI is 9,486, almost at monopoly level, because the main
firm (BTC, the historical operator, a mixed firm 49% controlled by the State, 51% private-controlled)
had a share of 98% at the end of 2015. A new entrant, ALIV, who started operation in late 2016 is
gaining customers, so it is possible that in the near future the level of concentration diminishes.
Figure 11. Number of firms per country and HHI
010002000300040005000600070008000900010000
012345678
Brazil
ElSalvado
rCh
ile
Panama
Peru
Argentina
Paraguay
Colombia
Bolivia
Guatem
ala
Vene
zuela
Uruguay
CostaRica
Ecuado
rDo
minicanRep
.Nicaragua
Mexico
Surin
ame
Trinidad&Tob
.Ho
nduras
Belize
Guyana
Barbados
Jamaica
Haiti
Bahamas
HHI
Num
bero
ffirm
s
#operators HHI
While there is a clear positive association between the number of firms present in the market and
the HHI index (correlation coefficient is 0.73), for individual markets it may not always hold that
more firms means less concentration. For example, Colombia, with 5 firms, has a more concentrated
market than Panama of Peru, which have 4 firms each. The HHI for Colombia is 3,729 while the
HHIs for Panama and Peru are approximately 3,100. This is due to the fact that one of the firms in
the Colombian market is a very small regional operator that have a share of less than 1%. Even in
18

markets with the same number of firms it is possible to find very different levels of concentration.
This is specially true in markets with just two or three firms. Among the markets with three firms,
the HHI ranges from 3,750 in Bolivia to 5,045 in Honduras where Tigo, the historical operator still
holds almost 60% of the market share. Many Caribbean markets have two similar-sized firms. The
cases of Suriname and Trinidad and Tobago are text-book cases of symmetric duopolies: there are
two firms in each market with roughly 50% share each. The HHIs for the two countries are 5,002 and
5,006 respectively, practically equal to the symmetric duopoly 5,000 value. The exception, as noted
above, is Bahamas, where one operator serves almost the entire consumer base.
Even knowing the concentration level as measured by the HHI, it is not possible to determine
in advance how fierce is the competition in the market. In some instances, two firms that provide
a relatively homogeneous service (say, for example, similar price per minute and MB used, and
similar combinations of minutes of voice/GB of data/text messages bundles) competing in price is
enough to obtain an equilibrium similar to the one under perfect competition. On the other hand,
if firms try to differentiate their products, or if they cater to different segments of consumers, it is
likely that even with more than 3 or 4 firms the market equilibrium show some market power by
the incumbent firms. Other factors may also impact the competitive pressure in the market. When
the same established firms compete period after period, or in more than one market (multi-market
competition), or prices are publicly available, it is easier to enforce (tacit) collusion schemes that
generate equilibria closer to a classic duopoly or monopoly level rather than the competitive one.
Entry and exit. As new firms enter the market, it is harder to sustain a collusive-like equilibrium.
As firms exit the market, it is easier to end up closer to the monopoly equilibrium. For the period
under analysis (2000 Q1 to 2017 Q3), similar number of entries and exits have occurred. In almost all
the cases, exits take the form of a merger or acquisition. Out of the 14 telecommunication firms that
disappeared from LAC markets during this period, 13 were merged or acquired by other incumbent
operators. In only one case the operator closed and exit the market: VTR, a Chilean operator that
closed in 2013.
Multi-market competition. Firms in the telecommunication industry are seldom independent op-
erators that have presence in just one country. Often, operators in a country belong to a telecommu-
nication conglomerate or holding with presence in many countries. This holds for all the world and
LAC operators are no exception.
Considering each individual operator in each LAC country as an independent firm, it is possible
to find 85 different operators providing services in 2017. This figure represents active operators, that
is, operators who are currently offering at least voice service in a LAC market. It does not include
19
operators which had presence at some point during the sample period, but which had exited the
market by the end of 2016. Also, it does not include operators that have already installed some
infrastructure but plan to start operations in 2018 or later. According to this figure, there is an average
of 3.3 ”independent” firms per country.
However, considering the parent group / holding of each of these ”independent” operators, it is
observed that most firms belong to one of a few conglomerates with extensive presence across the
whole region. Out of the 85 individual firms in LAC countries, 52 (61%) belong to a telecommu-
nication holding. Other 11 (13%) are State-Owned Enterprises (SOE). The remaining 22 operators
(26%) are actual individual companies. Often, these belong to a media company (cable tv provider
or multimedia conglomerate) that provides telecommunication services in individual countries.
The three biggest holdings are America Movil, Telefonica and Digicel. These three big holdings,
combined, have presence in 23 of the 26 LAC IDB borrowing countries. The only countries where
it is not possible to find an operator belonging to at least one of these conglomerates are Bahamas,
Belize and Bolivia. America Movil, a Mexican conglomerate, is the most extended holding, with
presence in 16 LAC countries. Telefonica’s operators are present in 14 LAC countries and Digicel’s
in 8 countries.
Considering geographical strategies, there are two differentiated groups. America Movil and
Telefonica compete in 13 markets across South and Central America, most notably in all the biggest
LAC markets: Argentina, Brazil, Chile, Colombia, Mexico and Peru. Digicel concentrates its pres-
ence in the Caribbean, plus Panama and El Salvador. The biggest competitor for Digicel operators are
Liberty Group operators. Liberty Group is a conglomerate with presence in only 4 IDB-Caribbean
members (Bahamas, Barbados, Jamaica and Trinidad and Tobago) and Nicaragua, but it has exten-
sive presence in the small non-IDB members Caribbean markets.
Millicom International, another big international conglomerate is present in four Central Amer-
ican countries, plus Colombia and Paraguay. Finally, there are two small local (regional) conglom-
erates: Telecom Argentina, with presence in Argentina and Paraguay, and Entel Chile, in Chile and
Peru.
Public ownership. Since the deregulation of the telecommunication sector in the early 90’s, the
sector is associated with private participation and ownership. Specially the mobile and internet
segments.
However, the private sector is not alone in the industry. The public sector is also present in many
countries of the region. There are SOEs offering mobile and internet services in eleven LAC coun-
tries. In seven countries, the SOE has a significant market share and is one of the biggest operators
20

Figure 12. Operators by Holding
16 148 6 5 3
22
110
5
10
15
20
25
Am.Movil
Telefonica
Digicel
Millicom
Liberty
Telecom
Non-conglomerate
SOE
NUmbe
rofcou
ntrie
s
Ownership
Figure 13. Public Sector Participation
0102030405060708090100
Bahamas
Belize
Uruguay
CostaRica
Suriname
Bolivia
Trinidad&Tob.
Paraguay
Colom
bia
Honduras
BrazilM
arketshareofthe
Pub
licOpe
rator
in the market. In Bahamas (mixed firm), Belize, Bolivia, Costa Rica, Suriname, Trinidad and Tobago
and Uruguay the public firm serves at least 40% of the customer base. In Bahamas, as discussed
above, the mixed firm is the only regional quasi-monopoly, although its status is currently being
challenged by the new entrant ALIV, which has taken over 10% of the market since 2016, and is
expected to continue growing. In spite of this trend, BTC Bahamas will probably remain the largest
operator in the country for the foreseeable future. In Bolivia, the SOE Entel had 40% of the market in
the early 2000’s, being second to Tigo’s 60%. By 2005, Entel had surpassed Tigo and reached 62% of
the market, until settling into the current 50% share. It is still the biggest firm in the market. Figure
13 show the State presence along with its market share in all LAC countries.
In other four countries (Brazil, Colombia, Honduras and Paraguay) the local SOE’s market share
21
is very small: from about 4% in Paraguay to less than 0.1% in Brazil. In the case of Brazil and Colom-
bia, local SOEs are very small because they serve specific local markets, rather than having national
presence. Colombia had a bigger SOE, but it was acquired by Millicom in 2014. For Honduras and
Paraguay, the SOE tries to serve as a reference point for customers in the market. They set prices that
consumers can see as a benchmark when looking for service. These SOEs do not have the capacity
to become bigger players in their respective markets and to compete with the private incumbents. In
this case the role of the SOE is to send a signal and to create awareness of what is a reasonable prices
in the market.
8 Concluding Remarks
In this study we presented major trends in the telecommunication industry for 26 countries that are
IDB-borrowing members. Access to mobile phone increased from less than 10% of the population on
the year of 2000 to more than 70% on 2017. Investments increased from less than 10% to more 20%
of the revenue of telecommunication companies, and most of the expansion of the access to mobile
phone occurred under the 2G technology.
The telecommunication industry is unique among infrastructure sectors in LAC, that were histor-
ically under the control of the government during periods of heavy investments. In mobile telecom-
munications, the majority of the expansion was carried out by the private sector. On the regulatory
side, even as monopolies (public or private) are not strictly present , the telecommunication indus-
try in Latin America should not be considered perfectly competitive as few players have most of the
market.
Based on the analysis, the challenge for the region is double. On the one hand, it has to undertake
investment in technologies to catch-up with the most advanced economies, to close the existing gap
while also closing the internal gap so that the most vulnerable segments of the population are not
left behind. On the other hand, the region needs to keep up with innovative projects if it wants to
be at the frontier in the industry. In this dynamic, fast-changing industry, lack of innovation means
lagging behind.
22

References
Akamai Techonologies. 2017. Available at https://www.akamai.com/us/en/about/our-thinking/state-
of-the-internet-report/state-of-the-internet-connectivity-visualization.jsp
Aker, Jenny C. and Isaac M. Mbiti. 2010. ”Mobile Phones and Economic Development in Africa.”
The Journal of Economic Perspectives, 24(3): 207-232.
Atasoy, Hilal. 2013. ”The Effects of Broadband Internet Expansion on Labor Market Outcomes.”
Industrial and Labor Relations Review, 66(2): 315-345.
Barrantes, Roxana and Hernan Galperin. 2008. ”Can the poor afford mobile telephony? Evidence
from Latin America?” Telecommunications Policy, 32: 521– 530.
Brynjolfsson Erik, Lorin Hitt and Shinkyu Yang. 2002. ”Intangible Assets: How the Interaction
of Computers and Organizational Structure Affects Stock Market Valuations.” Brooking Papers on
Economic Activity: Macroeconomics, 1(2002): 137–199.
Brynjolfsson Erik and Lorin Hitt. 2003. ”Computing productivity: Firm-level evidence.” The
Review of Economics and Statistics, 85(4): 793–808.
Colombo, Massimo G., Annalisa Croce, and Luca Grilli. 2013. ”ICT services and small busi-
nesses’ productivity gains: An analysis of the adoption of broadband Internet technology.” Informa-
tion Economics and Policy, 25(3): 171-189.
Czernich, Nina, Oliver Falk, Tobias Kretschmer and Ludger Woessmann. 2011. ”Broadband
infrastructure and economic growth.” The Economic Journal, 121(552): 505-532.
Devaraj, Sarv and Rajiv Kohli. 2003. ”Performance Impacts of Information Technology: Is Actual
Usage the Missing Link?” Management Science, 49(3): 273-289.
ECLAC. 2016, 2018. ”Estado de la banda ancha en America Latina y el Caribe 2016.” UN, Santi-
ago, Chile.
ECLAC. 2013. ”Broadband in Latin America: Beyond Connectivity.” Valeria Jordan, Hernan
Galperin and Wilson Peres, Editors. Santiago, Chile.
Garcia Zaballos, Antonio and Ruben Lopez-Rivas. 2012. ”Socioeconomic Impact of Broadband in
Latin American and Caribbean Countries.” Inter-American Development Bank Technical Note No.
IDB-TN-471. Washington, DC. Available at: http://publications.iadb.org/handle/11319/5754?locale-
attribute=es
Gillett, Sharon E., William H. Lehr, Carlos A. Osorio and Marvin A. Sirbu. 2006. ”Measuring
the Economic Impact of Broadband Deployment.” U.S. Department of Commerce, Economic Devel-
opment Administration. National Technical Assistance, Training, Research, and Evaluation Project
23

99-07-13829.
Grimes, Arthur, Cleo Ren, and Philip Stevens. 2012. ”The need for speed: impacts of internet
connectivity on firm productivity.” Journal of Productivity Analysis, 37(2): 187-201.
GSMA. 2016. GSMA Intelligence Database (c) 2016. Available at www.gsmaintelligence.com
GSMA Intelligence. 2016. ”The Mobile Economy in Latin America And The Caribbean.” Avail-
able at: https://www.gsmaintelligence.com/research. Accessed March 16, 2018.
IDB, CAF and ECLAC. 2017. Infralatam database. Available at https://infralatam.info
Koutroumpis, Pantelis. 2009. ”The economic impact of broadband on growth: A simultaneous
approach.” Telecommunications policy, 33(9): 471-485.
Myers, Stewart C. and Nicholas S. Majluf. 1984. ”Corporate financing and investment deci-
sions when firms have information that investors do not have.” Journal of Financial Economics. 13 (2):
187–221.
Quan, Vuong. 2002. ”A rational justification of the pecking order hypothesis to the choice of
sources of financing.” Management Research News, 25: 74-90.
Ronconi, Lucas and Enrique Kawamura. 2015. ”Firms’ Investment and Savings in Latin America:
Stylized Facts from the Enterprise Survey.” IDB Working Paper Series No IDB-WP-638.
Tambe, Prasanna and Lorin Hitt. 2012. ”The Productivity of Information Technology Invest-
ments: New Evidence from IT Labor Data.” Information Systems Research, 23(3-1): 599-617.
Van Gaasbeck, Kristin A. (2008). ”A Rising Tide: Measuring the Economic Effects of Broadband
Use in California.” The Social Science Journal, 45(2008): 691-699.
24

Appendix
Figure A1. Market Penetration by Country
0
20
40
60
80
100U
niq
ue
Su
bsc.
/Pop
ula
tion
(%
)
2000
q1
2002
q1
2004
q1
2006
q1
2008
q1
2010
q1
2012
q1
2014
q1
2016
q1
2017
q2
Argentina
0
20
40
60
80
Un
iqu
e S
ubs
c./P
opu
lati
on (
%)
2000
q1
2002
q1
2004
q1
2006
q1
2008
q1
2010
q1
2012
q1
2014
q1
2016
q1
2017
q2
Bahamas
0
20
40
60
80
Un
iqu
e S
ubs
c./P
opu
lati
on (
%)
2000
q1
2002
q1
2004
q1
2006
q1
2008
q1
2010
q1
2012
q1
2014
q1
2016
q1
2017
q2
Barbados
0
20
40
60
80
Un
iqu
e S
ubs
c./P
opu
lati
on (
%)
2000
q1
2002
q1
2004
q1
2006
q1
2008
q1
2010
q1
2012
q1
2014
q1
2016
q1
2017
q2
Belize
0
20
40
60
Un
iqu
e S
ubs
c./P
opu
lati
on (
%)
2000
q1
2002
q1
2004
q1
2006
q1
2008
q1
2010
q1
2012
q1
2014
q1
2016
q1
2017
q2
Bolivia
0
20
40
60
80
Un
iqu
e S
ubs
c./P
opu
lati
on (
%)
2000
q1
2002
q1
2004
q1
2006
q1
2008
q1
2010
q1
2012
q1
2014
q1
2016
q1
2017
q2
Brazil
20
40
60
80
100
Un
iqu
e S
ubs
c./P
opu
lati
on (
%)
2000
q1
2002
q1
2004
q1
2006
q1
2008
q1
2010
q1
2012
q1
2014
q1
2016
q1
2017
q2
Chile
0
20
40
60
80
Un
iqu
e S
ubs
c./P
opu
lati
on (
%)
2000
q1
2002
q1
2004
q1
2006
q1
2008
q1
2010
q1
2012
q1
2014
q1
2016
q1
2017
q2
Colombia
25

0
20
40
60
80U
niq
ue
Su
bsc.
/Pop
ula
tion
(%
)
2000
q1
2002
q1
2004
q1
2006
q1
2008
q1
2010
q1
2012
q1
2014
q1
2016
q1
2017
q2
Costa Rica
0
20
40
60
Un
iqu
e S
ubs
c./P
opu
lati
on (
%)
2000
q1
2002
q1
2004
q1
2006
q1
2008
q1
2010
q1
2012
q1
2014
q1
2016
q1
2017
q2
Dominican Republic
0
20
40
60
Un
iqu
e S
ubs
c./P
opu
lati
on (
%)
2000
q1
2002
q1
2004
q1
2006
q1
2008
q1
2010
q1
2012
q1
2014
q1
2016
q1
2017
q2
Ecuador
0
20
40
60
80
Un
iqu
e S
ubs
c./P
opu
lati
on (
%)
2000
q1
2002
q1
2004
q1
2006
q1
2008
q1
2010
q1
2012
q1
2014
q1
2016
q1
2017
q2
El Salvador
0
20
40
60
Un
iqu
e S
ubs
c./P
opu
lati
on (
%)
2000
q1
2002
q1
2004
q1
2006
q1
2008
q1
2010
q1
2012
q1
2014
q1
2016
q1
2017
q2
Guatemala
0
20
40
60
Un
iqu
e S
ubs
c./P
opu
lati
on (
%)
2000
q1
2002
q1
2004
q1
2006
q1
2008
q1
2010
q1
2012
q1
2014
q1
2016
q1
2017
q2
Guyana
0
10
20
30
40
50
Un
iqu
e S
ubs
c./P
opu
lati
on (
%)
2000
q1
2002
q1
2004
q1
2006
q1
2008
q1
2010
q1
2012
q1
2014
q1
2016
q1
2017
q2
Haiti
0
20
40
60
Un
iqu
e S
ubs
c./P
opu
lati
on (
%)
2000
q1
2002
q1
2004
q1
2006
q1
2008
q1
2010
q1
2012
q1
2014
q1
2016
q1
2017
q2Honduras
26
0
20
40
60
80U
niq
ue
Su
bsc.
/Pop
ula
tion
(%
)
2000
q1
2002
q1
2004
q1
2006
q1
2008
q1
2010
q1
2012
q1
2014
q1
2016
q1
2017
q2
Jamaica
0
20
40
60
80
Un
iqu
e S
ubs
c./P
opu
lati
on (
%)
2000
q1
2002
q1
2004
q1
2006
q1
2008
q1
2010
q1
2012
q1
2014
q1
2016
q1
2017
q2
Mexico
0
20
40
60
80
Un
iqu
e S
ubs
c./P
opu
lati
on (
%)
2000
q1
2002
q1
2004
q1
2006
q1
2008
q1
2010
q1
2012
q1
2014
q1
2016
q1
2017
q2
Nicaragua
0
20
40
60
80
Un
iqu
e S
ubs
c./P
opu
lati
on (
%)
2000
q1
2002
q1
2004
q1
2006
q1
2008
q1
2010
q1
2012
q1
2014
q1
2016
q1
2017
q2
Panama
0
20
40
60
80
Un
iqu
e S
ubs
c./P
opu
lati
on (
%)
2000
q1
2002
q1
2004
q1
2006
q1
2008
q1
2010
q1
2012
q1
2014
q1
2016
q1
2017
q2
Paraguay
0
20
40
60
80
Un
iqu
e S
ubs
c./P
opu
lati
on (
%)
2000
q1
2002
q1
2004
q1
2006
q1
2008
q1
2010
q1
2012
q1
2014
q1
2016
q1
2017
q2
Peru
20
40
60
80
100
Un
iqu
e S
ubs
c./P
opu
lati
on (
%)
2000
q1
2002
q1
2004
q1
2006
q1
2008
q1
2010
q1
2012
q1
2014
q1
2016
q1
2017
q2
Suriname
0
20
40
60
80
100
Un
iqu
e S
ubs
c./P
opu
lati
on (
%)
2000
q1
2002
q1
2004
q1
2006
q1
2008
q1
2010
q1
2012
q1
2014
q1
2016
q1
2017
q2Trinidad and Tobago
27

0
20
40
60
80
100U
niq
ue
Su
bsc.
/Pop
ula
tion
(%
)
2000
q1
2002
q1
2004
q1
2006
q1
2008
q1
2010
q1
2012
q1
2014
q1
2016
q1
2017
q2
Uruguay
20
40
60
80
Un
iqu
e S
ubs
c./P
opu
lati
on (
%)
2000
q1
2002
q1
2004
q1
2006
q1
2008
q1
2010
q1
2012
q1
2014
q1
2016
q1
2017
q2
Venezuela
28

Figure A2. Quarterly Capital Expenditures by Country (US$ Million).
0
100
200
300
400
CA
PE
X (
US
$ M
illi
ons)
2000
q1
2002
q1
2004
q1
2006
q1
2008
q1
2010
q1
2012
q1
2014
q1
2016
q1
2018
q1
Argentina
0
5
10
15
20
25
CA
PE
X (
US
$ M
illi
ons)
2000
q1
2002
q1
2004
q1
2006
q1
2008
q1
2010
q1
2012
q1
2014
q1
2016
q1
2018
q1
Bahamas
0
1
2
3
4
5
CA
PE
X (
US
$ M
illi
ons)
2000
q1
2002
q1
2004
q1
2006
q1
2008
q1
2010
q1
2012
q1
2014
q1
2016
q1
2018
q1
Barbados
.5
1
1.5
2
2.5
3
CA
PE
X (
US
$ M
illi
ons)
2000
q1
2002
q1
2004
q1
2006
q1
2008
q1
2010
q1
2012
q1
2014
q1
2016
q1
2018
q1
Belize
0
20
40
60
80
CA
PE
X (
US
$ M
illi
ons)
2000
q1
2002
q1
2004
q1
2006
q1
2008
q1
2010
q1
2012
q1
2014
q1
2016
q1
2018
q1
Bolivia
0
500
1000
1500
2000
CA
PE
X (
US
$ M
illi
ons)
2000
q1
2002
q1
2004
q1
2006
q1
2008
q1
2010
q1
2012
q1
2014
q1
2016
q1
2018
q1
Brazil
0
100
200
300
400
CA
PE
X (
US
$ M
illi
ons)
2000
q1
2002
q1
2004
q1
2006
q1
2008
q1
2010
q1
2012
q1
2014
q1
2016
q1
2018
q1
Chile
0
100
200
300
400
500
CA
PE
X (
US
$ M
illi
ons)
2000
q1
2002
q1
2004
q1
2006
q1
2008
q1
2010
q1
2012
q1
2014
q1
2016
q1
2018
q1
Colombia
29
0
20
40
60
80
CA
PE
X (
US
$ M
illi
ons)
2000
q1
2002
q1
2004
q1
2006
q1
2008
q1
2010
q1
2012
q1
2014
q1
2016
q1
2018
q1
Costa Rica
0
20
40
60
80
CA
PE
X (
US
$ M
illi
ons)
2000
q1
2002
q1
2004
q1
2006
q1
2008
q1
2010
q1
2012
q1
2014
q1
2016
q1
2018
q1
Dominican Republic
0
50
100
150
200
CA
PE
X (
US
$ M
illi
ons)
2000
q1
2002
q1
2004
q1
2006
q1
2008
q1
2010
q1
2012
q1
2014
q1
2016
q1
2018
q1
Ecuador
0
20
40
60
80
CA
PE
X (
US
$ M
illi
ons)
2000
q1
2002
q1
2004
q1
2006
q1
2008
q1
2010
q1
2012
q1
2014
q1
2016
q1
2018
q1
El Salvador
0
50
100
150
CA
PE
X (
US
$ M
illi
ons)
2000
q1
2002
q1
2004
q1
2006
q1
2008
q1
2010
q1
2012
q1
2014
q1
2016
q1
2018
q1
Guatemala
0
1
2
3
4
5
CA
PE
X (
US
$ M
illi
ons)
2000
q1
2002
q1
2004
q1
2006
q1
2008
q1
2010
q1
2012
q1
2014
q1
2016
q1
2018
q1
Guyana
0
10
20
30
40
CA
PE
X (
US
$ M
illi
ons)
2000
q1
2002
q1
2004
q1
2006
q1
2008
q1
2010
q1
2012
q1
2014
q1
2016
q1
2018
q1
Haiti
0
10
20
30
40
50
CA
PE
X (
US
$ M
illi
ons)
2000
q1
2002
q1
2004
q1
2006
q1
2008
q1
2010
q1
2012
q1
2014
q1
2016
q1
2018
q1
Honduras
30
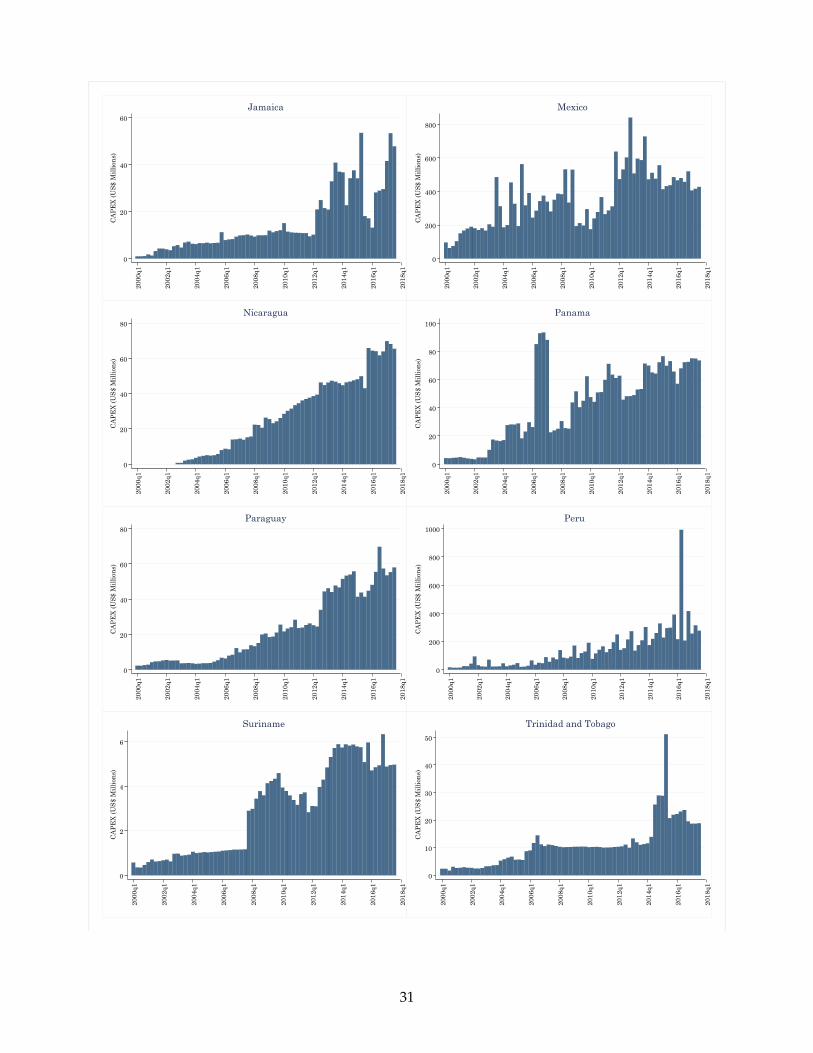
0
20
40
60C
AP
EX
(U
S$
Mil
lion
s)
2000
q1
2002
q1
2004
q1
2006
q1
2008
q1
2010
q1
2012
q1
2014
q1
2016
q1
2018
q1
Jamaica
0
200
400
600
800
CA
PE
X (
US
$ M
illi
ons)
2000
q1
2002
q1
2004
q1
2006
q1
2008
q1
2010
q1
2012
q1
2014
q1
2016
q1
2018
q1
Mexico
0
20
40
60
80
CA
PE
X (
US
$ M
illi
ons)
2000
q1
2002
q1
2004
q1
2006
q1
2008
q1
2010
q1
2012
q1
2014
q1
2016
q1
2018
q1
Nicaragua
0
20
40
60
80
100
CA
PE
X (
US
$ M
illi
ons)
2000
q1
2002
q1
2004
q1
2006
q1
2008
q1
2010
q1
2012
q1
2014
q1
2016
q1
2018
q1
Panama
0
20
40
60
80
CA
PE
X (
US
$ M
illi
ons)
2000
q1
2002
q1
2004
q1
2006
q1
2008
q1
2010
q1
2012
q1
2014
q1
2016
q1
2018
q1
Paraguay
0
200
400
600
800
1000
CA
PE
X (
US
$ M
illi
ons)
2000
q1
2002
q1
2004
q1
2006
q1
2008
q1
2010
q1
2012
q1
2014
q1
2016
q1
2018
q1
Peru
0
2
4
6
CA
PE
X (
US
$ M
illi
ons)
2000
q1
2002
q1
2004
q1
2006
q1
2008
q1
2010
q1
2012
q1
2014
q1
2016
q1
2018
q1
Suriname
0
10
20
30
40
50
CA
PE
X (
US
$ M
illi
ons)
2000
q1
2002
q1
2004
q1
2006
q1
2008
q1
2010
q1
2012
q1
2014
q1
2016
q1
2018
q1
Trinidad and Tobago
31
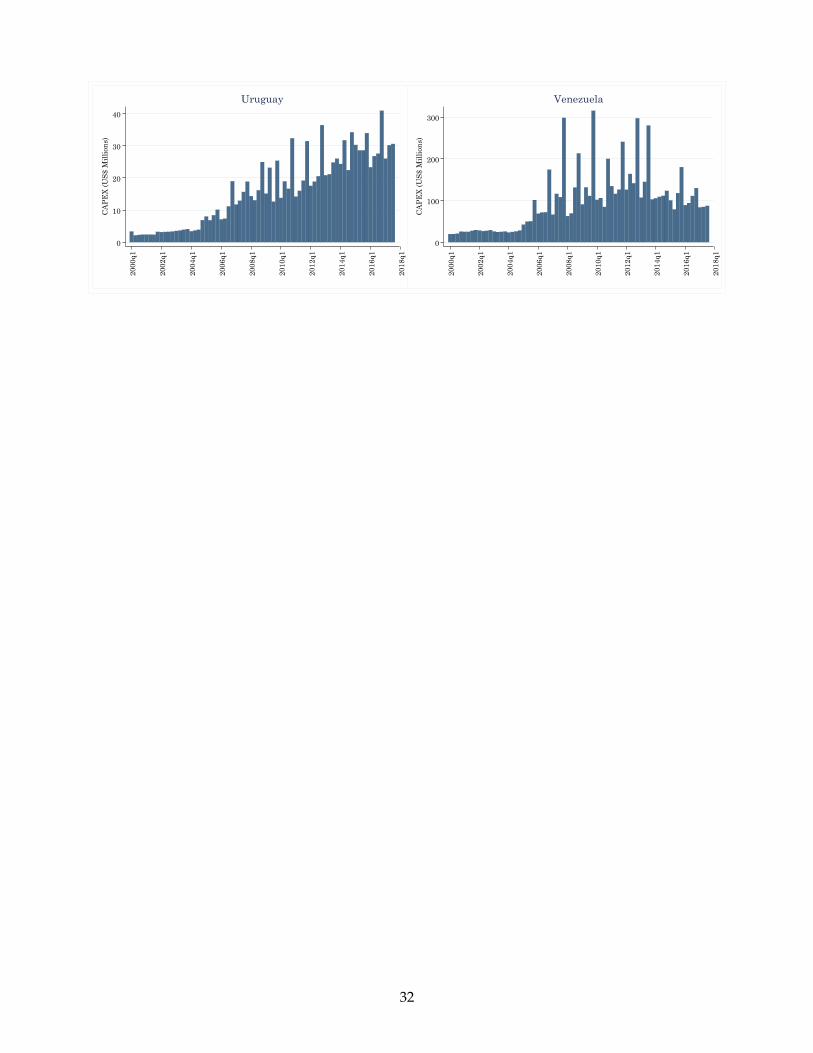
0
10
20
30
40C
AP
EX
(U
S$
Mil
lion
s)
2000
q1
2002
q1
2004
q1
2006
q1
2008
q1
2010
q1
2012
q1
2014
q1
2016
q1
2018
q1
Uruguay
0
100
200
300
CA
PE
X (
US
$ M
illi
ons)
2000
q1
2002
q1
2004
q1
2006
q1
2008
q1
2010
q1
2012
q1
2014
q1
2016
q1
2018
q1
Venezuela
32

Figure A3. Existing Connections by Mobile Technology Generation and Country
0
50
100
150
Con
nec
tion
s/ P
opu
lati
on (
%)
2000
q1
2002
q1
2004
q1
2006
q1
2008
q1
2010
q1
2012
q1
2014
q1
2016
q1
Argentina
0
50
100
Con
nec
tion
s/ P
opu
lati
on (
%)
2000
q1
2002
q1
2004
q1
2006
q1
2008
q1
2010
q1
2012
q1
2014
q1
2016
q1
Bahamas
0
50
100
150
Con
nec
tion
s/ P
opu
lati
on (
%)
2000
q1
2002
q1
2004
q1
2006
q1
2008
q1
2010
q1
2012
q1
2014
q1
2016
q1
Barbados
0
20
40
60
80
Con
nec
tion
s/ P
opu
lati
on (
%)
2000
q1
2002
q1
2004
q1
2006
q1
2008
q1
2010
q1
2012
q1
2014
q1
2016
q1
Belize
0
20
40
60
80
Con
nec
tion
s/ P
opu
lati
on (
%)
2000
q1
2002
q1
2004
q1
2006
q1
2008
q1
2010
q1
2012
q1
2014
q1
2016
q1
Bolivia
0
20
40
60
80
100
Con
nec
tion
s/ P
opu
lati
on (
%)
2000
q1
2002
q1
2004
q1
2006
q1
2008
q1
2010
q1
2012
q1
2014
q1
2016
q1
Brazil
0
50
100
150
Con
nec
tion
s/ P
opu
lati
on (
%)
2000
q1
2002
q1
2004
q1
2006
q1
2008
q1
2010
q1
2012
q1
2014
q1
2016
q1
Chile
0
20
40
60
80
100
Con
nec
tion
s/ P
opu
lati
on (
%)
2000
q1
2002
q1
2004
q1
2006
q1
2008
q1
2010
q1
2012
q1
2014
q1
2016
q1Colombia
1G 2G
3G 4G
33
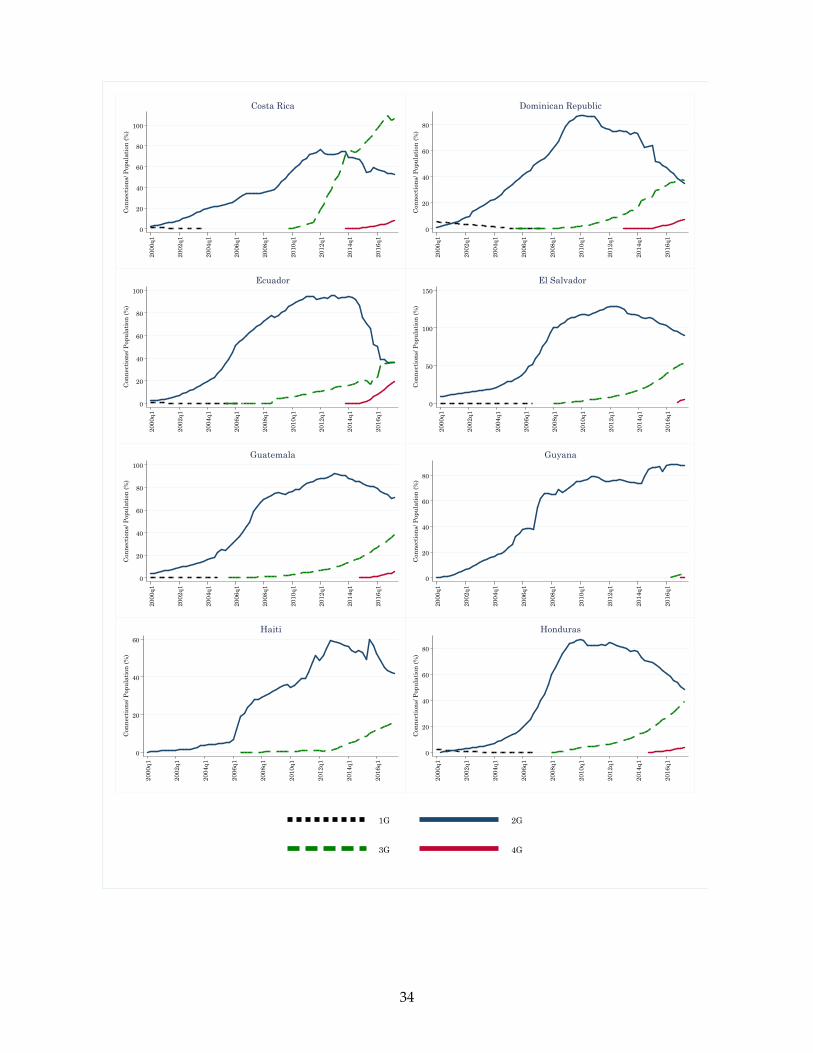
0
20
40
60
80
100C
onn
ecti
ons/
Pop
ula
tion
(%
)
2000
q1
2002
q1
2004
q1
2006
q1
2008
q1
2010
q1
2012
q1
2014
q1
2016
q1
Costa Rica
0
20
40
60
80
Con
nec
tion
s/ P
opu
lati
on (
%)
2000
q1
2002
q1
2004
q1
2006
q1
2008
q1
2010
q1
2012
q1
2014
q1
2016
q1
Dominican Republic
0
20
40
60
80
100
Con
nec
tion
s/ P
opu
lati
on (
%)
2000
q1
2002
q1
2004
q1
2006
q1
2008
q1
2010
q1
2012
q1
2014
q1
2016
q1
Ecuador
0
50
100
150
Con
nec
tion
s/ P
opu
lati
on (
%)
2000
q1
2002
q1
2004
q1
2006
q1
2008
q1
2010
q1
2012
q1
2014
q1
2016
q1
El Salvador
0
20
40
60
80
100
Con
nec
tion
s/ P
opu
lati
on (
%)
2000
q1
2002
q1
2004
q1
2006
q1
2008
q1
2010
q1
2012
q1
2014
q1
2016
q1
Guatemala
0
20
40
60
80
Con
nec
tion
s/ P
opu
lati
on (
%)
2000
q1
2002
q1
2004
q1
2006
q1
2008
q1
2010
q1
2012
q1
2014
q1
2016
q1
Guyana
0
20
40
60
Con
nec
tion
s/ P
opu
lati
on (
%)
2000
q1
2002
q1
2004
q1
2006
q1
2008
q1
2010
q1
2012
q1
2014
q1
2016
q1
Haiti
0
20
40
60
80
Con
nec
tion
s/ P
opu
lati
on (
%)
2000
q1
2002
q1
2004
q1
2006
q1
2008
q1
2010
q1
2012
q1
2014
q1
2016
q1
Honduras
1G 2G
3G 4G
34

0
20
40
60
80
100C
onn
ecti
ons/
Pop
ula
tion
(%
)
2000
q1
2002
q1
2004
q1
2006
q1
2008
q1
2010
q1
2012
q1
2014
q1
2016
q1
Jamaica
0
20
40
60
80
Con
nec
tion
s/ P
opu
lati
on (
%)
2000
q1
2002
q1
2004
q1
2006
q1
2008
q1
2010
q1
2012
q1
2014
q1
2016
q1
Mexico
0
20
40
60
80
100
Con
nec
tion
s/ P
opu
lati
on (
%)
2000
q1
2002
q1
2004
q1
2006
q1
2008
q1
2010
q1
2012
q1
2014
q1
2016
q1
Nicaragua
0
50
100
150
Con
nec
tion
s/ P
opu
lati
on (
%)
2000
q1
2002
q1
2004
q1
2006
q1
2008
q1
2010
q1
2012
q1
2014
q1
2016
q1
Panama
0
20
40
60
80
100
Con
nec
tion
s/ P
opu
lati
on (
%)
2000
q1
2002
q1
2004
q1
2006
q1
2008
q1
2010
q1
2012
q1
2014
q1
2016
q1
Paraguay
0
20
40
60
80
Con
nec
tion
s/ P
opu
lati
on (
%)
2000
q1
2002
q1
2004
q1
2006
q1
2008
q1
2010
q1
2012
q1
2014
q1
2016
q1
Peru
0
50
100
150
Con
nec
tion
s/ P
opu
lati
on (
%)
2000
q1
2002
q1
2004
q1
2006
q1
2008
q1
2010
q1
2012
q1
2014
q1
2016
q1
Suriname
0
50
100
150
Con
nec
tion
s/ P
opu
lati
on (
%)
2000
q1
2002
q1
2004
q1
2006
q1
2008
q1
2010
q1
2012
q1
2014
q1
2016
q1
Trinidad and Tobago
1G 2G
3G 4G
35
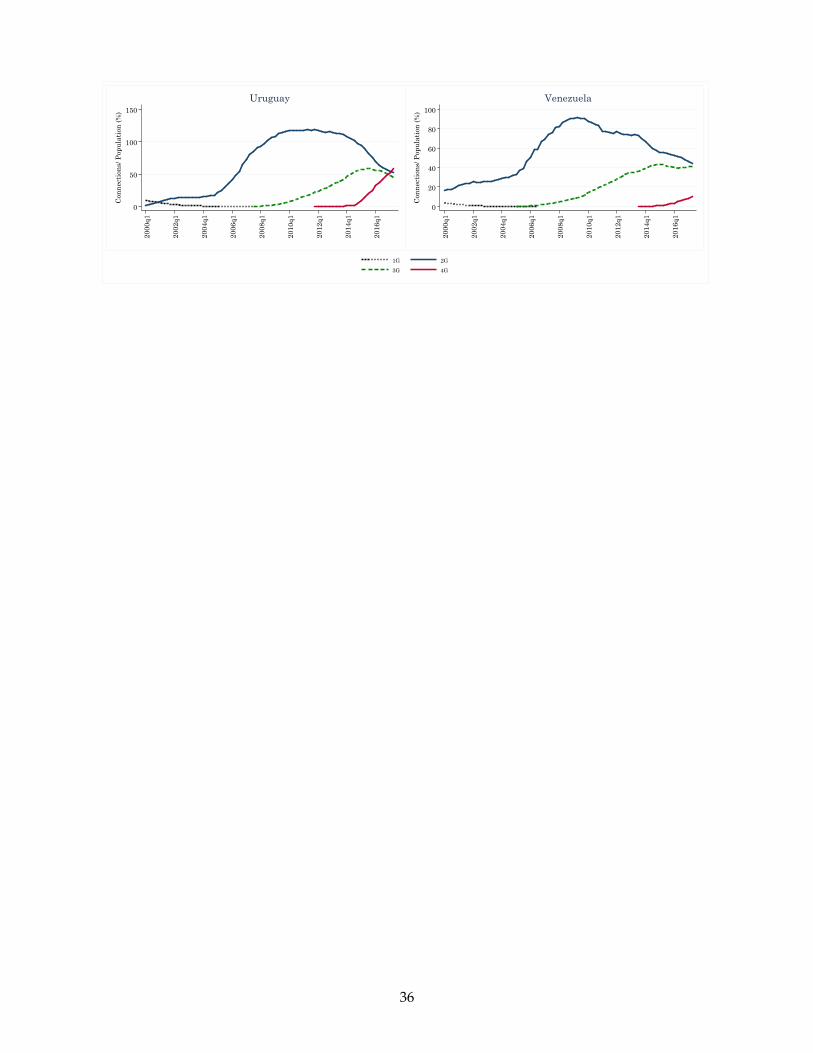
0
50
100
150C
onn
ecti
ons/
Pop
ula
tion
(%
)
2000
q1
2002
q1
2004
q1
2006
q1
2008
q1
2010
q1
2012
q1
2014
q1
2016
q1
Uruguay
0
20
40
60
80
100
Con
nec
tion
s/ P
opu
lati
on (
%)
2000
q1
2002
q1
2004
q1
2006
q1
2008
q1
2010
q1
2012
q1
2014
q1
2016
q1
Venezuela
1G 2G
3G 4G
36

Figure A4. Quarterly Capital Expenditures over GDP by Country
0
.02
.04
.06
CA
PE
X/G
DP
(%
)
2000
q1
2002
q1
2004
q1
2006
q1
2008
q1
2010
q1
2012
q1
2014
q1
2016
q1
2017
q2
Argentina
0
.1
.2
.3
CA
PE
X/G
DP
(%
)
2000
q1
2002
q1
2004
q1
2006
q1
2008
q1
2010
q1
2012
q1
2014
q1
2016
q1
2017
q2
Bahamas
0
.05
.1
.15
CA
PE
X/G
DP
(%
)
2000
q1
2002
q1
2004
q1
2006
q1
2008
q1
2010
q1
2012
q1
2014
q1
2016
q1
2017
q2
Barbados
.05
.1
.15
.2
CA
PE
X/G
DP
(%
)
2000
q1
2002
q1
2004
q1
2006
q1
2008
q1
2010
q1
2012
q1
2014
q1
2016
q1
2017
q2
Belize
0
.05
.1
.15
.2
CA
PE
X/G
DP
(%
)
2000
q1
2002
q1
2004
q1
2006
q1
2008
q1
2010
q1
2012
q1
2014
q1
2016
q1
2017
q2
Bolivia
0
.05
.1
.15
.2
CA
PE
X/G
DP
(%
)
2000
q1
2002
q1
2004
q1
2006
q1
2008
q1
2010
q1
2012
q1
2014
q1
2016
q1
2017
q2
Brazil
0
.05
.1
.15
.2
CA
PE
X/G
DP
(%
)
2000
q1
2002
q1
2004
q1
2006
q1
2008
q1
2010
q1
2012
q1
2014
q1
2016
q1
2017
q2
Chile
0
.05
.1
.15
.2
CA
PE
X/G
DP
(%
)
2000
q1
2002
q1
2004
q1
2006
q1
2008
q1
2010
q1
2012
q1
2014
q1
2016
q1
2017
q2
Colombia
37

0
.05
.1
.15C
AP
EX
/GD
P (
%)
2000
q1
2002
q1
2004
q1
2006
q1
2008
q1
2010
q1
2012
q1
2014
q1
2016
q1
2017
q2
Costa Rica
0
.05
.1
.15
CA
PE
X/G
DP
(%
)
2000
q1
2002
q1
2004
q1
2006
q1
2008
q1
2010
q1
2012
q1
2014
q1
2016
q1
2017
q2
Dominican Republic
0
.1
.2
.3
CA
PE
X/G
DP
(%
)
2000
q1
2002
q1
2004
q1
2006
q1
2008
q1
2010
q1
2012
q1
2014
q1
2016
q1
2017
q2
Ecuador
.05
.1
.15
.2
.25
.3
CA
PE
X/G
DP
(%
)
2000
q1
2002
q1
2004
q1
2006
q1
2008
q1
2010
q1
2012
q1
2014
q1
2016
q1
2017
q2
El Salvador
.05
.1
.15
.2
.25
CA
PE
X/G
DP
(%
)
2000
q1
2002
q1
2004
q1
2006
q1
2008
q1
2010
q1
2012
q1
2014
q1
2016
q1
2017
q2
Guatemala
0
.05
.1
.15
.2
CA
PE
X/G
DP
(%
)
2000
q1
2002
q1
2004
q1
2006
q1
2008
q1
2010
q1
2012
q1
2014
q1
2016
q1
2017
q2
Guyana
0
.2
.4
.6
CA
PE
X/G
DP
(%
)
2000
q1
2002
q1
2004
q1
2006
q1
2008
q1
2010
q1
2012
q1
2014
q1
2016
q1
2017
q2
Haiti
0
.1
.2
.3
CA
PE
X/G
DP
(%
)
2000
q1
2002
q1
2004
q1
2006
q1
2008
q1
2010
q1
2012
q1
2014
q1
2016
q1
2017
q2Honduras
38

0
.1
.2
.3
.4C
AP
EX
/GD
P (
%)
2000
q1
2002
q1
2004
q1
2006
q1
2008
q1
2010
q1
2012
q1
2014
q1
2016
q1
2017
q2
Jamaica
0
.02
.04
.06
.08
CA
PE
X/G
DP
(%
)
2000
q1
2002
q1
2004
q1
2006
q1
2008
q1
2010
q1
2012
q1
2014
q1
2016
q1
2017
q2
Mexico
0
.1
.2
.3
.4
.5
CA
PE
X/G
DP
(%
)
2000
q1
2002
q1
2004
q1
2006
q1
2008
q1
2010
q1
2012
q1
2014
q1
2016
q1
2017
q2
Nicaragua
0
.2
.4
.6
CA
PE
X/G
DP
(%
)
2000
q1
2002
q1
2004
q1
2006
q1
2008
q1
2010
q1
2012
q1
2014
q1
2016
q1
2017
q2
Panama
0
.05
.1
.15
.2
.25
CA
PE
X/G
DP
(%
)
2000
q1
2002
q1
2004
q1
2006
q1
2008
q1
2010
q1
2012
q1
2014
q1
2016
q1
2017
q2
Paraguay
0
.1
.2
.3
.4
.5
CA
PE
X/G
DP
(%
)
2000
q1
2002
q1
2004
q1
2006
q1
2008
q1
2010
q1
2012
q1
2014
q1
2016
q1
2017
q2
Peru
0
.05
.1
.15
.2
CA
PE
X/G
DP
(%
)
2000
q1
2002
q1
2004
q1
2006
q1
2008
q1
2010
q1
2012
q1
2014
q1
2016
q1
2017
q2
Suriname
0
.05
.1
.15
.2
CA
PE
X/G
DP
(%
)
2000
q1
2002
q1
2004
q1
2006
q1
2008
q1
2010
q1
2012
q1
2014
q1
2016
q1
2017
q2Trinidad and Tobago
39

0
.02
.04
.06
.08
.1C
AP
EX
/GD
P (
%)
2000
q1
2002
q1
2004
q1
2006
q1
2008
q1
2010
q1
2012
q1
2014
q1
2016
q1
2017
q2
Uruguay
0
.05
.1
.15
CA
PE
X/G
DP
(%
)
2000
q1
2002
q1
2004
q1
2006
q1
2008
q1
2010
q1
2012
q1
2014
q1
2016
q1
2017
q2
Venezuela
40

Figure A5. Quarterly Capital Expenditures over Revenue by Country (%)
0
5
10
15
20
CA
PE
X/ R
even
ue
(%)
2000
q1
2002
q1
2004
q1
2006
q1
2008
q1
2010
q1
2012
q1
2014
q1
2016
q1
2017
q2
Argentina
20
25
30
35
40
CA
PE
X/ R
even
ue
(%)
2000
q1
2002
q1
2004
q1
2006
q1
2008
q1
2010
q1
2012
q1
2014
q1
2016
q1
2017
q2
Bahamas
5
10
15
20
25
CA
PE
X/ R
even
ue
(%)
2000
q1
2002
q1
2004
q1
2006
q1
2008
q1
2010
q1
2012
q1
2014
q1
2016
q1
2017
q2
Barbados
10
15
20
25
30
CA
PE
X/ R
even
ue
(%)
2000
q1
2002
q1
2004
q1
2006
q1
2008
q1
2010
q1
2012
q1
2014
q1
2016
q1
2017
q2
Belize
5
10
15
20
CA
PE
X/ R
even
ue
(%)
2000
q1
2002
q1
2004
q1
2006
q1
2008
q1
2010
q1
2012
q1
2014
q1
2016
q1
2017
q2
Bolivia
0
10
20
30
40
CA
PE
X/ R
even
ue
(%)
2000
q1
2002
q1
2004
q1
2006
q1
2008
q1
2010
q1
2012
q1
2014
q1
2016
q1
2017
q2
Brazil
10
20
30
40
50
CA
PE
X/ R
even
ue
(%)
2000
q1
2002
q1
2004
q1
2006
q1
2008
q1
2010
q1
2012
q1
2014
q1
2016
q1
2017
q2
Chile
10
20
30
40
CA
PE
X/ R
even
ue
(%)
2000
q1
2002
q1
2004
q1
2006
q1
2008
q1
2010
q1
2012
q1
2014
q1
2016
q1
2017
q2
Colombia
41

0
10
20
30
40C
AP
EX
/ Rev
enu
e (%
)
2000
q1
2002
q1
2004
q1
2006
q1
2008
q1
2010
q1
2012
q1
2014
q1
2016
q1
2017
q2
Costa Rica
0
5
10
15
20
25
CA
PE
X/ R
even
ue
(%)
2000
q1
2002
q1
2004
q1
2006
q1
2008
q1
2010
q1
2012
q1
2014
q1
2016
q1
2017
q2
Dominican Republic
10
20
30
40
CA
PE
X/ R
even
ue
(%)
2000
q1
2002
q1
2004
q1
2006
q1
2008
q1
2010
q1
2012
q1
2014
q1
2016
q1
2017
q2
Ecuador
10
15
20
25
30
CA
PE
X/ R
even
ue
(%)
2000
q1
2002
q1
2004
q1
2006
q1
2008
q1
2010
q1
2012
q1
2014
q1
2016
q1
2017
q2
El Salvador
5
10
15
20
25
30
CA
PE
X/ R
even
ue
(%)
2000
q1
2002
q1
2004
q1
2006
q1
2008
q1
2010
q1
2012
q1
2014
q1
2016
q1
2017
q2
Guatemala
0
20
40
60
80
CA
PE
X/ R
even
ue
(%)
2000
q1
2002
q1
2004
q1
2006
q1
2008
q1
2010
q1
2012
q1
2014
q1
2016
q1
2017
q2
Guyana
0
50
100
150
200
CA
PE
X/ R
even
ue
(%)
2000
q1
2002
q1
2004
q1
2006
q1
2008
q1
2010
q1
2012
q1
2014
q1
2016
q1
2017
q2
Haiti
0
10
20
30
CA
PE
X/ R
even
ue
(%)
2000
q1
2002
q1
2004
q1
2006
q1
2008
q1
2010
q1
2012
q1
2014
q1
2016
q1
2017
q2Honduras
42
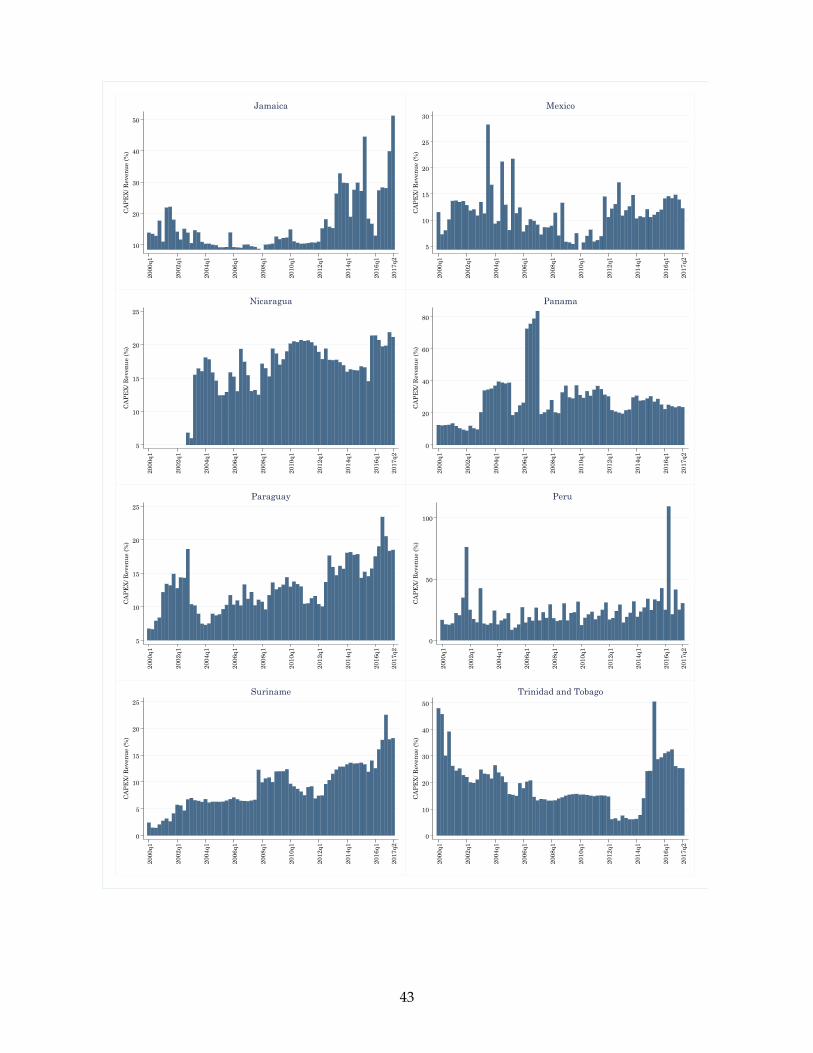
10
20
30
40
50C
AP
EX
/ Rev
enu
e (%
)
2000
q1
2002
q1
2004
q1
2006
q1
2008
q1
2010
q1
2012
q1
2014
q1
2016
q1
2017
q2
Jamaica
5
10
15
20
25
30
CA
PE
X/ R
even
ue
(%)
2000
q1
2002
q1
2004
q1
2006
q1
2008
q1
2010
q1
2012
q1
2014
q1
2016
q1
2017
q2
Mexico
5
10
15
20
25
CA
PE
X/ R
even
ue
(%)
2000
q1
2002
q1
2004
q1
2006
q1
2008
q1
2010
q1
2012
q1
2014
q1
2016
q1
2017
q2
Nicaragua
0
20
40
60
80
CA
PE
X/ R
even
ue
(%)
2000
q1
2002
q1
2004
q1
2006
q1
2008
q1
2010
q1
2012
q1
2014
q1
2016
q1
2017
q2
Panama
5
10
15
20
25
CA
PE
X/ R
even
ue
(%)
2000
q1
2002
q1
2004
q1
2006
q1
2008
q1
2010
q1
2012
q1
2014
q1
2016
q1
2017
q2
Paraguay
0
50
100
CA
PE
X/ R
even
ue
(%)
2000
q1
2002
q1
2004
q1
2006
q1
2008
q1
2010
q1
2012
q1
2014
q1
2016
q1
2017
q2
Peru
0
5
10
15
20
25
CA
PE
X/ R
even
ue
(%)
2000
q1
2002
q1
2004
q1
2006
q1
2008
q1
2010
q1
2012
q1
2014
q1
2016
q1
2017
q2
Suriname
0
10
20
30
40
50
CA
PE
X/ R
even
ue
(%)
2000
q1
2002
q1
2004
q1
2006
q1
2008
q1
2010
q1
2012
q1
2014
q1
2016
q1
2017
q2Trinidad and Tobago
43
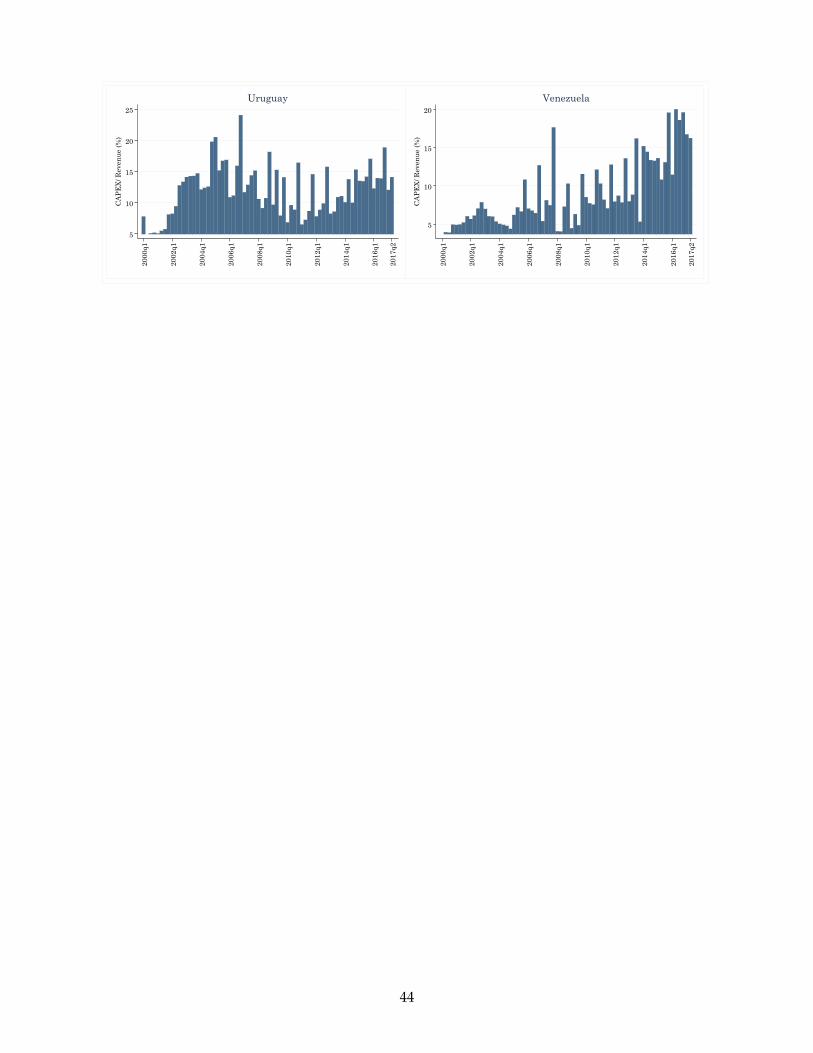
5
10
15
20
25C
AP
EX
/ Rev
enu
e (%
)
2000
q1
2002
q1
2004
q1
2006
q1
2008
q1
2010
q1
2012
q1
2014
q1
2016
q1
2017
q2
Uruguay
5
10
15
20
CA
PE
X/ R
even
ue
(%)
2000
q1
2002
q1
2004
q1
2006
q1
2008
q1
2010
q1
2012
q1
2014
q1
2016
q1
2017
q2
Venezuela
44

Figure A6. Quarterly Capital Expenditures per Existing Subscriber by Country
2
4
6
8
10
CA
PE
X/ S
ubs
crib
er (
US
$)
2000
q1
2002
q1
2004
q1
2006
q1
2008
q1
2010
q1
2012
q1
2014
q1
2016
q1
2018
q1
Argentina
40
60
80
100
120
140
CA
PE
X/ S
ubs
crib
er (
US
$)
2000
q1
2002
q1
2004
q1
2006
q1
2008
q1
2010
q1
2012
q1
2014
q1
2016
q1
2018
q1
Bahamas
5
10
15
20
25
CA
PE
X/ S
ubs
crib
er (
US
$)
2000
q1
2002
q1
2004
q1
2006
q1
2008
q1
2010
q1
2012
q1
2014
q1
2016
q1
2018
q1
Barbados
5
10
15
20
CA
PE
X/ S
ubs
crib
er (
US
$)
2000
q1
2002
q1
2004
q1
2006
q1
2008
q1
2010
q1
2012
q1
2014
q1
2016
q1
2018
q1
Belize
2
4
6
8
10
CA
PE
X/ S
ubs
crib
er (
US
$)
2000
q1
2002
q1
2004
q1
2006
q1
2008
q1
2010
q1
2012
q1
2014
q1
2016
q1
2018
q1
Bolivia
5
10
15
20
25
CA
PE
X/ S
ubs
crib
er (
US
$)
2000
q1
2002
q1
2004
q1
2006
q1
2008
q1
2010
q1
2012
q1
2014
q1
2016
q1
2018
q1
Brazil
10
20
30
40
CA
PE
X/ S
ubs
crib
er (
US
$)
2000
q1
2002
q1
2004
q1
2006
q1
2008
q1
2010
q1
2012
q1
2014
q1
2016
q1
2018
q1
Chile
5
10
15
CA
PE
X/ S
ubs
crib
er (
US
$)
2000
q1
2002
q1
2004
q1
2006
q1
2008
q1
2010
q1
2012
q1
2014
q1
2016
q1
2018
q1
Colombia
45
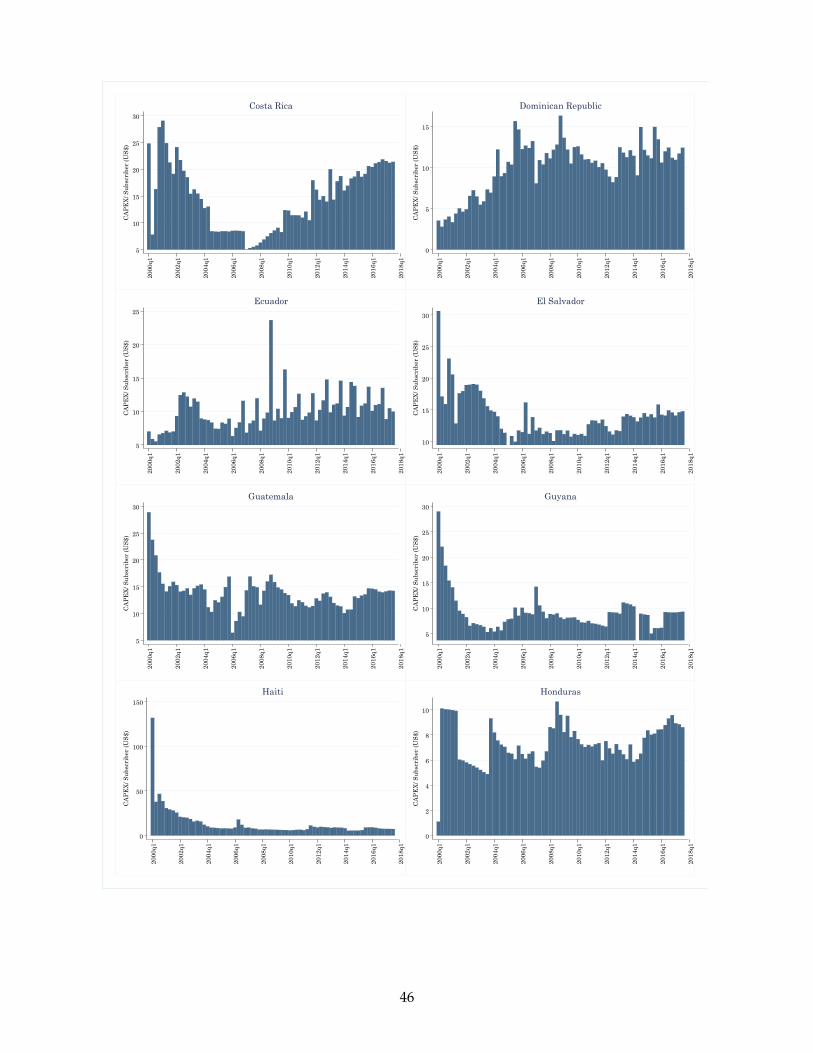
5
10
15
20
25
30C
AP
EX
/ Su
bscr
iber
(U
S$)
2000
q1
2002
q1
2004
q1
2006
q1
2008
q1
2010
q1
2012
q1
2014
q1
2016
q1
2018
q1
Costa Rica
0
5
10
15
CA
PE
X/ S
ubs
crib
er (
US
$)
2000
q1
2002
q1
2004
q1
2006
q1
2008
q1
2010
q1
2012
q1
2014
q1
2016
q1
2018
q1
Dominican Republic
5
10
15
20
25
CA
PE
X/ S
ubs
crib
er (
US
$)
2000
q1
2002
q1
2004
q1
2006
q1
2008
q1
2010
q1
2012
q1
2014
q1
2016
q1
2018
q1
Ecuador
10
15
20
25
30
CA
PE
X/ S
ubs
crib
er (
US
$)
2000
q1
2002
q1
2004
q1
2006
q1
2008
q1
2010
q1
2012
q1
2014
q1
2016
q1
2018
q1
El Salvador
5
10
15
20
25
30
CA
PE
X/ S
ubs
crib
er (
US
$)
2000
q1
2002
q1
2004
q1
2006
q1
2008
q1
2010
q1
2012
q1
2014
q1
2016
q1
2018
q1
Guatemala
5
10
15
20
25
30
CA
PE
X/ S
ubs
crib
er (
US
$)
2000
q1
2002
q1
2004
q1
2006
q1
2008
q1
2010
q1
2012
q1
2014
q1
2016
q1
2018
q1
Guyana
0
50
100
150
CA
PE
X/ S
ubs
crib
er (
US
$)
2000
q1
2002
q1
2004
q1
2006
q1
2008
q1
2010
q1
2012
q1
2014
q1
2016
q1
2018
q1
Haiti
0
2
4
6
8
10
CA
PE
X/ S
ubs
crib
er (
US
$)
2000
q1
2002
q1
2004
q1
2006
q1
2008
q1
2010
q1
2012
q1
2014
q1
2016
q1
2018
q1Honduras
46
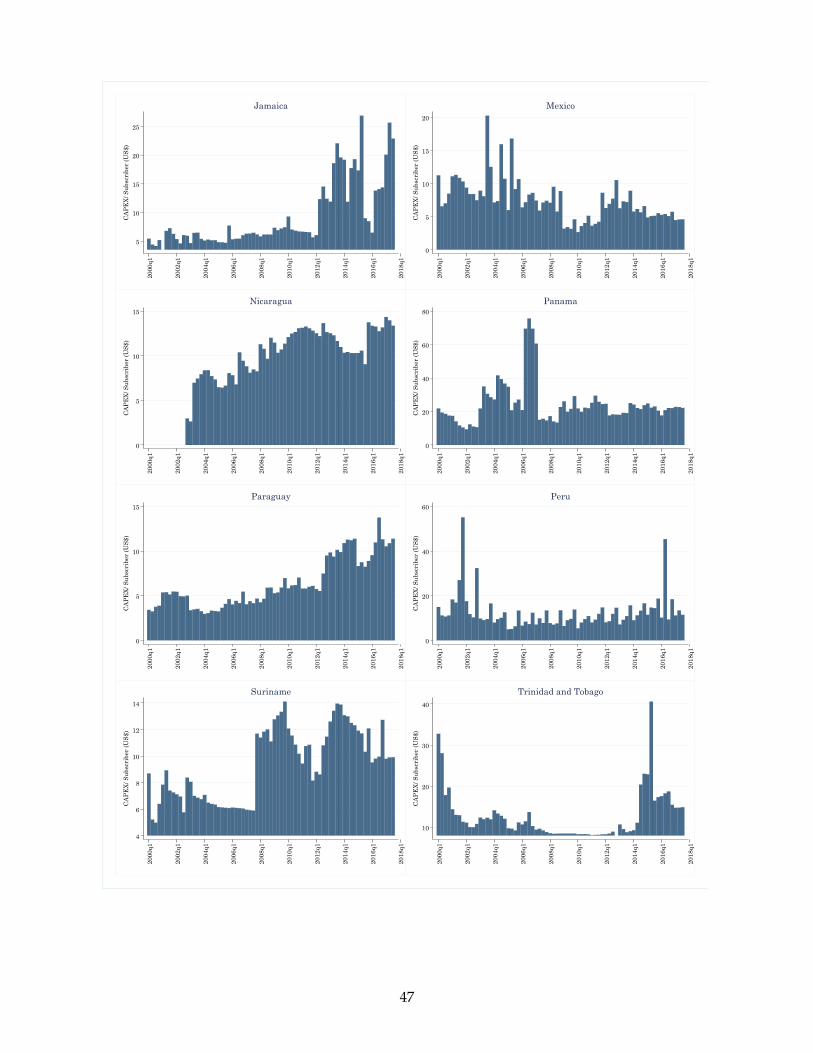
5
10
15
20
25C
AP
EX
/ Su
bscr
iber
(U
S$)
2000
q1
2002
q1
2004
q1
2006
q1
2008
q1
2010
q1
2012
q1
2014
q1
2016
q1
2018
q1
Jamaica
0
5
10
15
20
CA
PE
X/ S
ubs
crib
er (
US
$)
2000
q1
2002
q1
2004
q1
2006
q1
2008
q1
2010
q1
2012
q1
2014
q1
2016
q1
2018
q1
Mexico
0
5
10
15
CA
PE
X/ S
ubs
crib
er (
US
$)
2000
q1
2002
q1
2004
q1
2006
q1
2008
q1
2010
q1
2012
q1
2014
q1
2016
q1
2018
q1
Nicaragua
0
20
40
60
80
CA
PE
X/ S
ubs
crib
er (
US
$)
2000
q1
2002
q1
2004
q1
2006
q1
2008
q1
2010
q1
2012
q1
2014
q1
2016
q1
2018
q1
Panama
0
5
10
15
CA
PE
X/ S
ubs
crib
er (
US
$)
2000
q1
2002
q1
2004
q1
2006
q1
2008
q1
2010
q1
2012
q1
2014
q1
2016
q1
2018
q1
Paraguay
0
20
40
60
CA
PE
X/ S
ubs
crib
er (
US
$)
2000
q1
2002
q1
2004
q1
2006
q1
2008
q1
2010
q1
2012
q1
2014
q1
2016
q1
2018
q1
Peru
4
6
8
10
12
14
CA
PE
X/ S
ubs
crib
er (
US
$)
2000
q1
2002
q1
2004
q1
2006
q1
2008
q1
2010
q1
2012
q1
2014
q1
2016
q1
2018
q1
Suriname
10
20
30
40
CA
PE
X/ S
ubs
crib
er (
US
$)
2000
q1
2002
q1
2004
q1
2006
q1
2008
q1
2010
q1
2012
q1
2014
q1
2016
q1
2018
q1Trinidad and Tobago
47

4
6
8
10
12
14C
AP
EX
/ Su
bscr
iber
(U
S$)
2000
q1
2002
q1
2004
q1
2006
q1
2008
q1
2010
q1
2012
q1
2014
q1
2016
q1
2018
q1
Uruguay
0
5
10
15
20
CA
PE
X/ S
ubs
crib
er (
US
$)
2000
q1
2002
q1
2004
q1
2006
q1
2008
q1
2010
q1
2012
q1
2014
q1
2016
q1
2018
q1
Venezuela
48