the evolution of botanical biofilters: developing
TRANSCRIPT
https://doi.org/10.32438/iCRBE.202012
Manuscript History
Receipt of completed manuscript: 03 March 2020
Receipt of Revised Manuscript: 20 April 2020
Date of Acceptance: 21 April 2020
Online available from: 12 October 2020
Page | 116
Available online at www.weentechpublishers.com
iCRBE Procedia Volume 1: Issue 1 (2020) 116-129
1st International Conference on Climate Resilient Built Environment-iCRBE, 21-23 September 2020, Bali, Indonesia
The evolution of botanical biofilters: developing practical
phytoremediation of air pollution for the built environment
T. Pettit1, *, P.J. Irga
2, F.R. Torpy
1
1Plants and Environmental Quality Research Group, School of Life Sciences, Faculty of Science, University of Technology Sydney, Australia
2Centre for Green Technology, School of Civil and Environmental Engineering, Faculty of Engineering and Information Technology, University of
Technology Sydney, P.O. Box 123, Broadway, NSW, 2007, Australia
*Corresponding author’s mail: [email protected]
Abstract
Indoor air quality is of emerging importance due to the rapid growth of urban populations that spend the majority of their time indoors.
Amongst the public, there is a common perception that potted-plants can clean the air of pollutants. Many laboratory-based studies have
demonstrated air pollution phytoremediation with potted-plants. It has, however, been difficult to extrapolate these removal efficiencies to
the built environment and, contrary to popular belief, it is likely that potted-plants could make a negligible contribution to built
environment air quality. To overcome this problem, active green walls have been developed which use plants aligned vertically and the
addition of active airflow to process a greater volume of air. Although a variety of designs have been devised, this technology is generally
capable of cleaning a variety of air pollutants to the extent where comparisons against conventional air filtration technology can be made.
The current work discusses the history and evolution of air phytoremediation systems from potted-plants through to practical botanical air filtration.
Keywords: Active green wall; Potted-plant; Phytoremediation; Air quality; Sustainability; Green building
Copyright © 2020 Published by WEENTECH Publishers. This is an open-access article under the CC BY License
(http://creativecommons.org/licenses/BY/4.0/). All Peer-review responsibility is on technical committee of 1st International
Conference on Climate Resilient Built Environment-iCRBE2020.
Page | 117
1. Urban and indoor air quality
Urban air quality is becoming an increasingly important issue in both developing and developed
countries [1], where air pollution exposure has become the fifth most significant human health risk
factor around the globe [2]. A greater proportion of the world’s population is becoming urbanised, with
28% of the world’s populations projected to live in cities with populations over 1 million people by
2030 [3]. As the level of exposure to urban air pollution is becoming increasingly significant, the
evidence of negative health effects resulting from air pollution exposure is growing [4, 5].
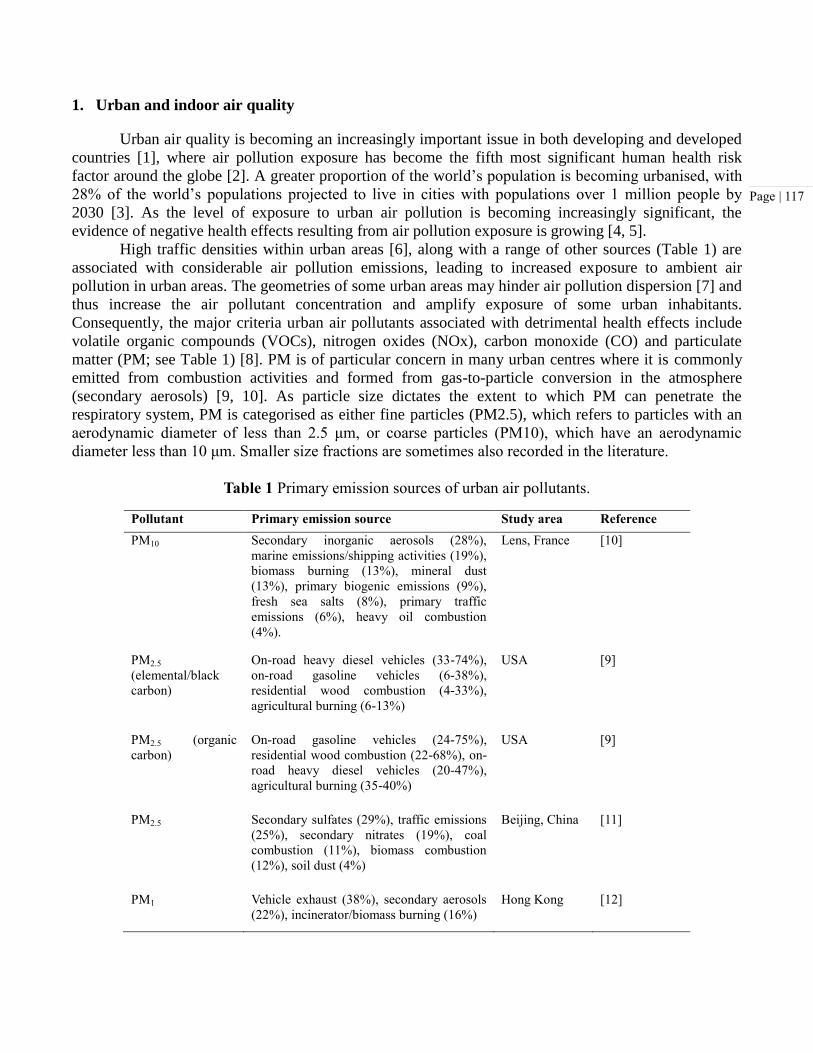
High traffic densities within urban areas [6], along with a range of other sources (Table 1) are
associated with considerable air pollution emissions, leading to increased exposure to ambient air
pollution in urban areas. The geometries of some urban areas may hinder air pollution dispersion [7] and
thus increase the air pollutant concentration and amplify exposure of some urban inhabitants.
Consequently, the major criteria urban air pollutants associated with detrimental health effects include
volatile organic compounds (VOCs), nitrogen oxides (NOx), carbon monoxide (CO) and particulate
matter (PM; see Table 1) [8]. PM is of particular concern in many urban centres where it is commonly
emitted from combustion activities and formed from gas-to-particle conversion in the atmosphere
(secondary aerosols) [9, 10]. As particle size dictates the extent to which PM can penetrate the
respiratory system, PM is categorised as either fine particles (PM2.5), which refers to particles with an
aerodynamic diameter of less than 2.5 μm, or coarse particles (PM10), which have an aerodynamic
diameter less than 10 μm. Smaller size fractions are sometimes also recorded in the literature.
Table 1 Primary emission sources of urban air pollutants.
Pollutant Primary emission source Study area Reference
PM10 Secondary inorganic aerosols (28%),
marine emissions/shipping activities (19%),
biomass burning (13%), mineral dust
(13%), primary biogenic emissions (9%),
fresh sea salts (8%), primary traffic
emissions (6%), heavy oil combustion
(4%).
Lens, France [10]
PM2.5
(elemental/black
carbon)
On-road heavy diesel vehicles (33-74%),
on-road gasoline vehicles (6-38%),
residential wood combustion (4-33%),
agricultural burning (6-13%)
USA [9]
PM2.5 (organic
carbon)
On-road gasoline vehicles (24-75%),
residential wood combustion (22-68%), on-
road heavy diesel vehicles (20-47%),
agricultural burning (35-40%)
USA [9]
PM2.5 Secondary sulfates (29%), traffic emissions
(25%), secondary nitrates (19%), coal
combustion (11%), biomass combustion
(12%), soil dust (4%)
Beijing, China [11]
PM1 Vehicle exhaust (38%), secondary aerosols
(22%), incinerator/biomass burning (16%)
Hong Kong [12]

Page | 118
VOCs Consumer VCPs1 (38±9%), Industrial VCPs
(15±5%), upstream emissions2 (14±4%),
gasoline fuel (13±6%), gasoline exhaust
(19±7%)
Los Angeles,
USA
[13]
NOx Road transport (39%), energy production
and distribution (17%), commercial,
institutional and households (14%), energy
use in industry (11%), non-road transport
(9%), agriculture (6%)
European
Union
[14]
CO Traffic and vehicle emissions (96%) Indianapolis,
USA
[15]
1Volatile chemical products - including pesticides, coatings, printing inks, adhesives, cleaning agents, and personal care
products. 2Upstream emissions are those that occur upstream of end users (i.e., oil and natural gas extraction, oil refineries, and
chemical manufacturing facilities.)
Whilst people within the urban environment spend the majority of their time indoors [16], the
ambient outdoor air quality within urban areas also influences the indoor environment [17]. In many
cases, ambient outdoor pollution levels may make a considerable contribution to the air pollution
concentration and profile in proximal indoor environments [18]. Several studies have focused on
relationships between indoor and outdoor PM [19-21], and have found that outdoor PM concentrations
have a strong influence on indoor air quality, as PM can enter buildings through ventilation and
infiltration [22]. Similarly, gaseous pollutants such as VOCs and NO2 of outdoor origin can also have
considerable influence on the air quality of the indoor environment [18, 23].
In addition to outdoor-sourced air pollutants, air pollutants of indoor origin may also contribute
to the pollution load of indoor environments. Indoor emissions of NO2 and PM are strongly associated
with stove top cooking [18] and a diverse range of VOCs can be emitted from building structural
materials and furniture, particularly when these products are new [24]. Consequently the indoor
concentration of VOCs can be considerably higher than that of the proximal outdoor environment [25].
Heating, ventilation and air conditioning (HVAC) systems are commonly used to control indoor
air quality, however these systems are energy expensive, require regular maintenance [26] and are
incapable of capturing gaseous pollutants: HVAC systems reduce indoor VOC concentrations solely by
dilution with outdoor air. The introduction of “Energy Efficient Buildings” has resulted in buildings with
increased air-tightness and fewer air exchanges with the ambient environment. While this may reduce
the rate at which outdoor air pollutants are transferred to the indoor environment, it simultaneously
reduces the rate at which indoor generated pollutants, such as VOCs, are flushed from the indoor
atmosphere. When this is coupled with the increasingly widespread use of new products and the
rejuvenation of building interiors, indoor generated pollutants can accumulate to the level whereby
occupants are exposed to considerable concentrations for prolonged periods [17].
There thus is a clear need for air cleaning technologies that are capable of cleaning a
comprehensive range of pollutants effectively and in an energy efficient manner. This work explores the
history, efficacy and potential of vegetative systems, known as botanical biofilters, to make functional
differences to ambient air quality.
Page | 119
2. Potted-plants and the phytoremediation of VOCs
The capacity of potted-plants to clean the air of VOCs was first uncovered during the 1980s by
researchers at NASA led by Bill Wolverton. Atmospheric samples collected during NASA’s 1973
SkyLab3 mission revealed that >300 VOCs were present in the SkyLab spacecraft, with 107 VOCs
present in crew compartments during manned missions. Ameliorating this issue was clearly an important
hurdle to overcome for safe space missions [27]. Building on the phytoremediation capacities of aquatic
wetland plants to remove toxic wastes that had accumulated from years of firing rockets, NASA began
exploring whether plants could also remove VOCs from the air. Experiments using a sealed chamber
with a spiked dose of formaldehyde revealed that potted-plants were capable of reducing the
concentration of formaldehyde within the chamber [28, 29]. During the subsequent decades, a range of
experiments were conducted using potted-plants in sealed chambers with spiked VOC doses, with VOC
concentration decay monitored over time [30]. These experiments have tested VOC removal by different
plant species, different growth substrates, and different VOCs, amongst other variables [8]. While these
experiments have all supported the hypothesis that a range of plant species in pots can remove a range of
spiked VOCs from sealed chamber atmospheres, experimental inconsistencies, such as different pot
volumes, plant sizes, chamber sizes, VOC starting concentrations and the way in which VOC removal
rates have been reported, have made comprehensive comparisons amongst studies difficult [8].
Studies exploring VOC removal by potted-plants have led to the generation of the hypothesis
that the plant roots in potted-plants support a specialised microbial community that is capable of VOC
breakdown, however this concept has not been explicitly tested [30]. This idea has resulted from
experiments that have compared VOC removal rates by potted-plants against pots filled only with soil
[31]; potted-plants against potted-plants that have had their above ground parts excised [32]; and potted-
plants in light versus potted-plants in dark conditions [33]. Nonetheless, several experiments that have
tested plant foliage in isolation for VOC removal have still observed VOC remediation [34-38]. It is thus
thought that plant uptake may be an important secondary mechanism of VOC removal by the potted-
plant system.
Although the VOC—sealed chamber experiments have clearly shown potted-plants are capable
of VOC degradation, it is likely that they have limited practical value, as the large volume of spaces
within the built environment relative to the size of even the largest potted-plants and the persistent
emission of VOCs reduces the capacity of potted-plants to provide clean air [39]. Furthermore, it is
unclear how such systems would perform with complex mixtures of VOCs in concentrations much
lower than those commonly used sealed chamber experiments, as is the normal situation in situ.
Nonetheless, amongst the public there is a common perception that potted-plants can clean the air of
pollutants [40].
3. Active green walls and the phytoremediation of VOCs
To overcome the rate limiting step of VOC diffusion from source to potted-plant, the use of mechanical
airflow generated by devices such as fans, in conjunction with planted systems, has been developed.
This idea was first proposed by Wolverton et al. [41] who suggested the installation of an air pump into
the base of the growth substrate of a potted-plant could be used to considerably increase the rate of the
VOC removal process (Fig. 1). This development aimed to increase the volume of polluted air that is
exposed to the plant’s growth substrate, whereby bacteria living in the plant root zone could degrade the
VOCs and/or the VOCs may adsorb to specialised materials within these substrates. Although this
concept was patented (US5433923A) [27], this idea was not studied further. Research led by Darlington
et al. [42], however, incorporated the idea of active airflow into a green wall system. The system trialled

Page | 120
by Darlington et al. [42] used plants aligned in a vertical pane (known as a green wall) to considerably
increase the planting density and increase the ease with which the plant growth substrate could be
exposed to a polluted air stream. Early designs also incorporated a biotrickling mechanism where the
green wall’s irrigation water dripped into an aquarium containing aquatic plants at the base of the green
wall, with a water pump returning the water supply to the top of the green wall for continued irrigation
[43]. Commonly, active green walls use a plenum that is pressurised by fans to pass an air stream
through the growth substrate and plant foliage (Fig. 2). The removal rates of VOCs recorded with active
green wall filtration has indicated that these systems may be able to make worthwhile improvements to
air quality indoors [44]. Darlington et al. [42] further suggested that such systems may be able to
promote the recirculation of air within a building, and potentially reduce HVAC costs (and the
corresponding energy expenditure), by reducing the load on the HVAC required to remove the room’s
air pollutants.
Fig. 1 The incorporation of a fan into the growth substrate of a potted-plant to promote air processing.
Figure source: Irga et al. [30]
Fig. 1 An active green wall design, adapted from Pettit et al. [45]
Fans are used to draw an untreated airstream into a plenum where by a pressure gradient causes the air
to flow through the growth substrate and plant foliage. Treated air exits the active green wall and returns
to the ambient air.

Page | 121
4. Active green walls and VOC removal
The case The use of active airflow allows active green wall pollutant removal rates to be reported
as single pass removal efficiencies (SPREs) and clean air delivery rates (CADRs); metrics used for
assessing the performance of conventional air handling systems. The SPRE refers to the proportion of a
dose of target pollutant that is removed with each pass through the filtration matrix. The CADR is the
SPRE multiplied by the volumetric flow rate through the filtration matrix. The CADR is generally the
most valuable air cleaning metric used to compare air cleaning performance amongst different systems,
as it describes the volume of ‘cleaned’ or pollutant-free air produced by the system per unit time [46].
Importantly, both of these metrics are target pollutant specific where ‘cleaned air’ describes the
elimination of a single specified target pollutant, an important consideration as the chemical properties
of each VOC influences its biofiltration rate differentially [47]. The influence of airflow through active
green walls has been addressed in numerous experiments assessing the rate of airflow through the green
wall and its influence on SPRE and CADR for several VOCs [43, 48-51]. The botanical biofiltration of
several VOCs, including toluene, formaldehyde [50], ethylbenzene, xylene [43], acetone [48], methyl
ethyl ketone and benzene [49, 51] at different airflow rates demonstrated that although smaller
volumetric airflow rates are associated with an increase in the SPRE, the CADR generally increases with
larger volumetric flow rates until a threshold is reached. Although this trend has been consistently
observed across all VOC studies, the optimum airflow rate through the active green wall is likely VOC
dependent. For example Llewellyn et al. [49] found that the removal of methyl ethyl ketone by their
active green wall was most effective at the maximum tested airflow rate of 0.4 m s-1, however the
removal of toluene was most effective at a smaller airflow rate of 0.1 m s-1.
These factors notwithstanding, active green walls have considerably improved the capacity of
planted systems to remove VOCs from the indoor environment. Guieysse et al. [52] modelled a CADR
of 0.075 m3 h−1 from Wolverton et al.’s [41] experiment in which a plant within a sealed chamber
reduced the concentration of benzene from 765 to 78 μg m−3 over a 24 h period. Despite this
considerable benzene reduction within the sealed chamber, when the potted-plant’s benzene CADR is
calculated, it is unlikely to make significant changes to the air quality of a full sized room [52].
Comparatively, Darlington et al.’s [43] experiment assessing the removal of toluene, xylene and ethyl
benzene by their active green wall exhibited CADRs of ~720 m3 h−1, however this was dependent on
airflow rate and temperature [52]. Although such large differences are in part due to different sizes of the
botanical system (amongst other factors), their sizes are reflective of their likely in situ operational
designs.
5. Active green walls and PM and CO2 removal
PM removal by passive vegetated systems, such as potted-plants and passive green walls (green
walls with no active airflow), has been well documented, with the primary removal mechanism of such
systems relying upon PM deposition on foliage surfaces [53-55]. However, it is unlikely that PM
accumulation on leaf surfaces leads to considerably improved ambient air quality, and as such, this effect
is yet to be measured, let alone detected in a study. The use of active airflow through a plant growth
substrate membrane and plant foliage, however, facilitates the filtration of PM, whereby PM is
entrapped within the growth substrate in addition to becoming deposited on foliage surfaces. This new
development has been tested in several recent studies, however experimental inconsistencies make it
difficult to compare PM air cleaning capabilities amongst different studies (Table 2). Irga et al. [56]
trialled this concept by passing a PM contaminated airstream though an active green wall, recording

Page | 122
SPREs of 53.35%, 53.31% and 48.21% for total suspended particles (TSP), PM10 and PM2.5. Irga et al.
[56] found that PM removal varied with airflow rate, and it is clear that individual active green wall
systems will need to have their airflow rate optimised (and potentially prioritised) for effective removal
of both PM and VOCs. PM removal has also been observed to vary depending on the plant species
present within the active green wall [57]. The influence of different plant species on PM SPRE was
correlated with pressure drop (resistance to airflow), and therefore additional studies are needed to
understand the relationship between plant species, PM SPRE and PM CADR. Additionally, substrate
selection is an important influence of the efficiency of PM removal, as this affects the air filled porosity
of the growth substrate matrix [58]. Furthermore, it is unknown how the accumulation of particles
within the substrate matrix over extended periods of time, particularly in environments with high PM,
will influence the airflow through the active green wall.
In sufficient light, plants photosynthesize and thus have the potential to provide CO2 reductions
to the indoor environment. The capacity of potted-plants to provide CO2 reductions has been
demonstrated in several sealed-chamber experiments [59-61], however, as for VOCs, it is likely that
findings from laboratory sealed-chamber pull down experiments will not apply to real-world situations
[39, 40]. For example, Torpy et al. [62] estimated that 249 potted-plants would be needed to completely
remove the respired CO2 from a single occupant in an unventilated, average sized room. While plants in
green walls are subject to the same factors, the vertical alignment of plants allows a greater planting
density per equivalent area of ground footprint [44], and green wall designs commonly feature
supplemented lighting to enhance their visual appeal, which will increase photosynthetic productivity.
Nonetheless, the rate of CO2 removal of green walls appears to be strongly light limited, with Torpy et
al. [63] reporting modest CO2 removal by a green wall in typically brightly lit indoor conditions
(photosynthetic photon flux density of 50 μmol m−2 s−1) in their simulation room. The authors
suggested that a 5 m2 green wall with supplementary lighting (250 μmol m−2 s−1) could offset the CO2
emissions of a full time occupant. These findings suggest that active green walls may be incapable of
completely balancing the CO2 emissions from an occupied indoor environment, however they may be
used in conjunction with other technologies, such as HVAC systems, to reduce the dependence on, and
energy consumption of existing mechanical systems.
Table 2 Studies that have reported PM removal by active green walls. Note: the subscript next to PM
represents that particle diameter in μm.
Green wall
size
in situ or
chamber
based
study
Chamber
or room
volume
PM fraction
sizes
Removal rate and/or
air quality effects Reference
1.5 m2 front
face, substrate
depth of 0.125
m
In situ 22.7 m3
Total
suspended
particles
(TSP)
Decay rate constant of
4.53 × 10⁻⁴
s−1
[45]
9 m2 front
face, substrate
depth of 0.125
m
In situ 120.2 m3
PM5-10, PM2.5-
5, PM1-2.5,
PM0.5-1,
PM0.3-0.5, TSP
Reduction in the indoor
ambient PM
concentrations across
all size fractions. The
room's TSP
concentration was
[45]

Page | 123
reduced by 42.6% in 20
minutes
0.25 m2 front
face, substrate
depth of 0.125
m
Chamber 0.216 m3
TSP, PM10,
PM2.5
SPREs of 53%, 54%
and 48% and CADRs of
28.61, 28.70 and 25.86
m3/h
[56]
0.25 m2 front
face, substrate
depth of 0.125
m
Chamber 0.216 m3
PM5-10, PM2.5-
5, PM1-2.5,
PM0.5-1,
PM0.3-0.5, TSP
Single pass removal
efficiencies of
respective PM sizes of
66-92%, 60-88%, 41-
72%, 15-56%, 13-46%
depending on plant
species
[57]
0.25 m2 front
face, substrate
depth of 0.125
m
Chamber 0.216 m3
PM5-10, PM2.5-
5, PM1-2.5,
PM0.5-1,
PM0.3-0.5
Single pass removal
efficiencies of
respective PM sizes of
52 and 85%, 29 and
72%, 16 and 51%, -8
and 17%, -32 and -11%
depending on substrate
type
[58]
4 m2 front
face, substrate
depth of 0.18
m
In situ 15.9 m3 PM1.0
6.67 and 20.06 μg/m3/h
depending on fan speed [64]
0.25 m2 front
face, substrate
depth of 0.125
m
Chamber 0.216 m3
PM5-10, PM2.5-
5, PM1-2.5,
PM0.5-1,
PM0.3-0.5
Single pass removal
efficiencies of
respective PM sizes of
~50-61%, ~40-51%,
~24-42%, ~18-37%,
~10-41% depending on
plant species
[65]
Page | 124
6. Safety and operational concerns: bioaerosol emissions
While the use of active airflow increases the efficiency of VOC removal by planted systems, it
simultaneously presents the possible production of harmful bioaerosols. Although no studies have found
that active green walls contribute to harmful bioaerosol emissions, a limited number of case studies have
indicated that potted-plants in indoor environments may have contributed to the room’s bioaerosol
loading [66-70]. Nonetheless, bioaerosol assessments of active green walls suggest that such emissions
are unlikely to be of concern. Darlington et al. [42] tested their active green wall comprised of moss with
a rock lava-based substrate for bioaerosol emissions and did not detect any Legionella. Additionally,
Darlington et al. [42] observed an increase in fungal spore counts during the first year of active green
wall operation, however spore counts remained within reported values for other indoor spaces, with the
authors concluding that the green wall did not emit any problematic concentrations or types of
bioaerosols. Irga et al. [71] assessed the airborne culturable fungi from the effluent airflow of an active
green wall using a coconut husk-based substrate, and concluded that well-maintained active green walls
of this type are unlikely to cause hazardous indoor fungi concentrations. Although the limited number of
studies suggest active green walls do not contribute to hazardous bioaerosol compositions within their
corresponding indoor environments, it remains critical to test each type of active green wall design,
under different conditions, and under different maintenance regimes, to understand the composition and
volume of bioaerosol production potential from active green walls.
7. Future directions and conclusion
As was the case with the literature exploring potted-plants and VOC removal, a range of laboratory
studies assessing the phytoremediation of air pollutants by active green walls have helped elucidate air
pollutant removal mechanisms and potential. It is crucial, however, for these systems to be thoroughly
assessed in situ, to uncover the actual likely contribution of active green walls to a room’s air quality.
Due to the extreme variation amongst indoor environments, such as differently sized rooms, different
layouts, different lighting conditions, different ventilation rates, different ambient air quality and
different pollution sources, it is necessary to assess active green wall operation within a range of
environments to truly understand whether these systems can make worthwhile improvements to the air
quality of indoor environments. Nonetheless, the limited number of in situ studies that have been
performed have indicated that active green walls can improve the air quality of at least some indoor
environments [72]. In addition to indoor applications, commercial active green walls are currently being
installed in outdoor environments in select urban centres around the globe and system performance in
such environments and the removal of NOx and O3 remains an area of important future research [73].
At present, variation amongst both active green wall designs and experimental designs make it
difficult to determine which permutation of active green wall, or even which component of an active
green wall, can filter target pollutants most efficiently. A standardised experimental approach is needed
to compare the air cleaning abilities of different active green wall designs and to other air cleaning
technologies. Such comparisons should extend to energy use and maintenance requirements, to
comprehensibly assess the sustainability of this technology.
While the current research on active green walls and the phytoremediation of air pollution indicates
these systems have functional potential to partly reduce the growing problem of air pollution exposure,
several issues, including bioaerosol safety, long term efficiency, cost and energy consumption
comparisons, still require further study before this technology can be widely and safety adopted.
Page | 125
ORCID Id of authors
Pettit, Thomas: https://orcid.org/0000-0003-2707-7764
Irga, Peter: https://orcid.org/0000-0001-5952-0658
Torpy, Fraser: https://orcid.org/0000-0002-9137-6948
References
[1] S. Gulia, S.S. Nagendra, M. Khare, I. Khanna, Urban air quality management-A review, Atmospheric
Pollution Research 6(2) (2015) 286-304.
[2] E. Gakidou, A. Afshin, A.A. Abajobir, K.H. Abate, C. Abbafati, K.M. Abbas, F. Abd-Allah, A.M.
Abdulle, S.F. Abera, V. Aboyans, Global, regional, and national comparative risk assessment of 84
behavioural, environmental and occupational, and metabolic risks or clusters of risks, 1990–2016: a
systematic analysis for the Global Burden of Disease Study 2016, The Lancet 390(10100) (2017) 1345-
1422.
[3] United Nations, The world's cities in 2018, in: U.N.D.o.E.a.S. Affairs (Ed.) World Urbanisation
Propects: The 2018 Revisions, 2018.
[4] R.D. Brook, S. Rajagopalan, C.A. Pope III, J.R. Brook, A. Bhatnagar, A.V. Diez-Roux, F. Holguin, Y.
Hong, R.V. Luepker, M.A. Mittleman, Particulate matter air pollution and cardiovascular disease: an
update to the scientific statement from the American Heart Association, Circulation 121(21) (2010)
2331-2378.
[5] O. Raaschou-Nielsen, Z.J. Andersen, R. Beelen, E. Samoli, M. Stafoggia, G. Weinmayr, B.
Hoffmann, P. Fischer, M.J. Nieuwenhuijsen, B. Brunekreef, Air pollution and lung cancer incidence in
17 European cohorts: prospective analyses from the European Study of Cohorts for Air Pollution Effects
(ESCAPE), The lancet oncology 14(9) (2013) 813-822.
[6] C. Yuan, R. Shan, Y. Zhang, X.-X. Li, T. Yin, J. Hang, L. Norford, Multilayer urban canopy
modelling and mapping for traffic pollutant dispersion at high density urban areas, Science of the total
environment 647 (2019) 255-267.
[7] K. Craig, D. De Kock, J. Snyman, Minimizing the effect of automotive pollution in urban geometry
using mathematical optimization, Atmospheric environment 35(3) (2001) 579-587.
[8] T. Pettit, P.J. Irga, F.R. Torpy, Towards practical indoor air phytoremediation: a review, Chemosphere
208 (2018) 960-974.
[9] J.C. Chow, J.G. Watson, D.H. Lowenthal, L.-W.A. Chen, N. Motallebi, PM2. 5 source profiles for
black and organic carbon emission inventories, Atmospheric Environment 45(31) (2011) 5407-5414.
[10] A. Waked, O. Favez, L. Alleman, C. Piot, J.-E. Petit, T. Delaunay, E. Verlinden, B. Golly, J.-L.
Besombes, J.-L. Jaffrezo, Source apportionment of PM10 in a north-western Europe regional urban
background site (Lens, France) using positive matrix factorization and including primary biogenic
emissions, Atmospheric Chemistry and Physics 14(7) (2014) 3325.
[11] N. Zíková, Y. Wang, F. Yang, X. Li, M. Tian, P.K. Hopke, On the source contribution to Beijing
PM2. 5 concentrations, Atmospheric Environment 134 (2016) 84-95.
[12] Y. Cheng, S. Zou, S. Lee, J. Chow, K. Ho, J. Watson, Y. Han, R. Zhang, F. Zhang, P. Yau,
Characteristics and source apportionment of PM1 emissions at a roadside station, Journal of hazardous
materials 195 (2011) 82-91.

Page | 126
[13] B.C. McDonald, J.A. de Gouw, J.B. Gilman, S.H. Jathar, A. Akherati, C.D. Cappa, J.L. Jimenez, J.
Lee-Taylor, P.L. Hayes, S.A. McKeen, Volatile chemical products emerging as largest petrochemical
source of urban organic emissions, Science 359(6377) (2018) 760-764.
[14] European Environment Agency, European Union emission inventory report 1990-2016 under the
UNECE Convention on Long-range Transboundary Air Pollution (LRTAP). in: P.O.o.t.E. Union (Ed.)
Luxembourg, 2018.
[15] I.J. Vimont, J.C. Turnbull, V.V. Petrenko, P.F. Place, A. Karion, N.L. Miles, S.J. Richardson, K.
Gurney, R. Patarasuk, C. Sweeney, Carbon monoxide isotopic measurements in Indianapolis constrain
urban source isotopic signatures and support mobile fossil fuel emissions as the dominant wintertime
CO source, (2017).
[16] N.E. Klepeis, W.C. Nelson, W.R. Ott, J.P. Robinson, A.M. Tsang, P. Switzer, J.V. Behar, S.C. Hern,
W.H. Engelmann, The National Human Activity Pattern Survey (NHAPS): a resource for assessing
exposure to environmental pollutants, Journal of Exposure Science and Environmental Epidemiology
11(3) (2001) 231.
[17] A. Katsoyiannis, C. Bogdal, Interactions between indoor and outdoor air pollution-trends and
scientific challenges, Environmental Pollution 169 (2012) 149-247.
[18] S.J. Lawson, I.E. Galbally, J.C. Powell, M.D. Keywood, S.B. Molloy, M. Cheng, P.W. Selleck, The
effect of proximity to major roads on indoor air quality in typical Australian dwellings, Atmospheric
environment 45(13) (2011) 2252-2259.
[19] H. Guo, L. Morawska, C. He, Y.L. Zhang, G. Ayoko, M. Cao, Characterization of particle number
concentrations and PM2. 5 in a school: influence of outdoor air pollution on indoor air, Environmental
Science and Pollution Research 17(6) (2010) 1268-1278.
[20] M. Jamriska, L. Morawska, B. Clark, Effect of ventilation and filtration on submicrometer particles
in an indoor environment, Indoor air 10(1) (2000) 19-26.
[21] M. Viana, S. Díez, C. Reche, Indoor and outdoor sources and infiltration processes of PM1 and
black carbon in an urban environment, Atmospheric environment 45(35) (2011) 6359-6367.
[22] C. Chen, B. Zhao, Review of relationship between indoor and outdoor particles: I/O ratio,
infiltration factor and penetration factor, Atmospheric Environment 45(2) (2011) 275-288.
[23] M. de Blas, M. Navazo, L. Alonso, N. Durana, M.C. Gomez, J. Iza, Simultaneous indoor and
outdoor on-line hourly monitoring of atmospheric volatile organic compounds in an urban building. The
role of inside and outside sources, Science of the total environment 426 (2012) 327-335.
[24] J. Kang, J. Liu, J. Pei, The indoor volatile organic compound (VOC) characteristics and source
identification in a new university campus in Tianjin, China, Journal of the Air & Waste Management
Association 67(6) (2017) 725-737.
[25] M.J. Jafari, A.A. Khajevandi, S.A.M. Najarkola, M.S. Yekaninejad, M.A. Pourhoseingholi, L.
Omidi, S. Kalantary, Association of sick building syndrome with indoor air parameters, Tanaffos 14(1)
(2015) 55.
[26] J.F. Montgomery, S.I. Green, S.N. Rogak, K. Bartlett, Predicting the energy use and operation cost
of HVAC air filters, Energy and Buildings 47 (2012) 643-650.
[27] G.W. Stutte, Phytoremediation of indoor air: NASA, Bill Wolverton, and the development of an
industry, (2012).
[28] B. Wolverton, R. McDonald, Foliage plants for removing formaldehyde from contaminated air
inside energy-efficient homes and future space stations, (1982).
[29] B. Wolverton, R.C. McDonald, E. Watkins, Foliage plants for removing indoor air pollutants from
energy-efficient homes, Economic Botany 38(2) (1984) 224-228.

Page | 127
[30] P. Irga, T. Pettit, F. Torpy, The phytoremediation of indoor air pollution: a review on the technology
development from the potted plant through to functional green wall biofilters, Reviews in Environmental
Science and Bio/Technology 17(2) (2019) 395-415.
[31] R.L. Orwell, R.L. Wood, J. Tarran, F. Torpy, M.D. Burchett, Removal of benzene by the indoor
plant/substrate microcosm and implications for air quality, Water, air, and soil pollution 157(1-4) (2004)
193-207.
[32] T. Godish, C. Guindon, An assessment of botanical air purification as a formaldehyde mitigation
measure under dynamic laboratory chamber conditions, Environmental pollution 62(1) (1989) 13-20.
[33] A. Aydogan, L.D. Montoya, Formaldehyde removal by common indoor plant species and various
growing media, Atmospheric environment 45(16) (2011) 2675-2682.
[34] M.W. Lin, L.-Y. Chen, Y.K. Chuah, Investigation of a potted plant (Hedera helix) with photo-
regulation to remove volatile formaldehyde for improving indoor air quality, Aerosol and Air Quality
Research 17(10) (2017) 2543-2554.
[35] A. Tani, C.N. Hewitt, Uptake of aldehydes and ketones at typical indoor concentrations by
houseplants, Environmental science & technology 43(21) (2009) 8338-8343.
[36] A. Tani, S. Kato, Y. Kajii, M. Wilkinson, S. Owen, N. Hewitt, A proton transfer reaction mass
spectrometry based system for determining plant uptake of volatile organic compounds, Atmospheric
Environment 41(8) (2007) 1736-1746.
[37] C. Treesubsuntorn, P. Suksabye, S. Weangjun, F. Pawana, P. Thiravetyan, Benzene adsorption by
plant leaf materials: effect of quantity and composition of wax, Water, Air, & Soil Pollution 224(10)
(2013) 1736.
[38] C. Treesubsuntorn, P. Thiravetyan, Removal of benzene from indoor air by Dracaena sanderiana:
Effect of wax and stomata, Atmospheric Environment 57 (2012) 317-321.
[39] B.E. Cummings, M.S. Waring, Potted plants do not improve indoor air quality: a review and
analysis of reported VOC removal efficiencies, Journal of exposure science & environmental
epidemiology (2019) 1-9.
[40] D. Llewellyn, M. Dixon, 4.26 Can plants really improve indoor air quality, in-Chief: Murray, M.-
Y.(Ed.), Comprehensive Biotechnology (Second Edition). Academic Press, Burlington (2011) 331-338.
[41] B. Wolverton, A. Johnson, K. Bounds, Interior Landscape Plants for Indoor Air Pollution
Abatement: Final Report-September 1989, National Aeronautics and Space Administration, John C.
Stennis Space Centre, 1989.
[42] A.B. Darlington, M. Chan, D. Malloch, C. Pilger, M. Dixon, The biofiltration of indoor air:
implications for air quality, Indoor air 10(1) (2000) 39-46.
[43] A.B. Darlington, J.F. Dat, M.A. Dixon, The biofiltration of indoor air: air flux and temperature
influences the removal of toluene, ethylbenzene, and xylene, Environmental science & technology 35(1)
(2001) 240-246.
[44] F.R. Torpy, P.J. Irga, M.D. Burchett, Reducing indoor air pollutants through biotechnology,
Biotechnologies and Biomimetics for Civil Engineering, Springer2015, pp. 181-210.
[45] T. Pettit, P. Irga, F. Torpy, The in situ pilot-scale phytoremediation of airborne VOCs and
particulate matter with an active green wall, Air Quality, Atmosphere & Health 12(1) (2019) 33-44.
[46]Y. Zhang, J. Mo, Y. Li, J. Sundell, P. Wargocki, J. Zhang, J.C. Little, R. Corsi, Q. Deng, M.H.
Leung, Can commonly-used fan-driven air cleaning technologies improve indoor air quality? A literature
review, Atmospheric Environment 45(26) (2011) 4329-4343.
[47] T. Pettit, Bettes, M., Chapman, A.R., Hoch, L.M., James, N.D., Irga, P.J., Torpy, F.R. and Plants
and Environmental Quality Research Group, The botanical biofiltration of VOCs with active airflow: is
removal efficiency related to chemical properties?. Atmospheric Environment, 214 (2019) p.116839.
Page | 128
[48] A.B. Darlington, Dixon, M.A., Acetone removal kinetics by an indoor biofilter, SAE Technical
Paper 1999-01-2069 (1999).
[49] D.J. Llewellyn, Darlington, A.B., Mallany, J., Dixon, M.A., The influence of airflow onindoor air
biofiltration: elimination of toluene and methyl ethyl ketone, Proc USC-TRG Conf Biofiltration, 2002.
[50] Z. Wang, J.S. Zhang, Characterization and performance evaluation of a full-scale activated carbon-
based dynamic botanical air filtration system for improving indoor air quality, Building and
Environment 46(3) (2011) 758-768.
[51] D.J. LLewellyn, Darlington, A.B., Dixon, M.A., Temperature and airflow influences indoor air
biofiltration, Proceedings of the 9th International Conference on Indoor Air Quality and Climate, 2002.
[52] B. Guieysse, C. Hort, V. Platel, R. Munoz, M. Ondarts, S. Revah, Biological treatment of indoor air
for VOC removal: Potential and challenges, Biotechnology Advances 26(5) (2008) 398-410.
[53] H. Gawrońska, B. Bakera, Phytoremediation of particulate matter from indoor air by Chlorophytum
comosum L. plants, Air Quality, Atmosphere & Health 8(3) (2015) 265-272.
[54] U. Weerakkody, J.W. Dover, P. Mitchell, K. Reiling, Particulate matter pollution capture by leaves
of seventeen living wall species with special reference to rail-traffic at a metropolitan station, Urban
Forestry & Urban Greening 27 (2017) 173-186.
[55] U. Weerakkody, J.W. Dover, P. Mitchell, K. Reiling, Quantification of the traffic-generated
particulate matter capture by plant species in a living wall and evaluation of the important leaf
characteristics, Science of The Total Environment 635 (2018) 1012-1024.
[56] P.J. Irga, N. Paull, P. Abdo, F.R. Torpy, An assessment of the atmospheric particle removal
efficiency of an in-room botanical biofilter system, Building and Environment 115 (2017) 281-290.
[57] T. Pettit, P.J. Irga, P. Abdo, F.R. Torpy, Do the plants in functional green walls contribute to their
ability to filter particulate matter?, Building and Environment 125 (2017) 299-307.
[58] T. Pettit, P.J. Torpy, F.R., Functional green wall development for increasing air pollutant
phytoremediation: substrate development with coconut coir and activated carbon, Journal of Hazardous
Materials 360 (2018) 594-603.
[59] C. Gubb, T. Blanusa, A. Griffiths, C. Pfrang, Can houseplants improve indoor air quality by
removing CO 2 and increasing relative humidity?, Air Quality, Atmosphere & Health 11(10) (2018)
1191-1201.
[60] C. Gubb, T. Blanusa, A. Griffiths, C. Pfrang, Interaction between plant species and substrate type in
the removal of CO 2 indoors, Air Quality, Atmosphere & Health 12(10) (2019) 1197-1206.
[61] P.J. Irga, F.R. Torpy, M. Burchett, Can hydroculture be used to enhance the performance of indoor
plants for the removal of air pollutants?, Atmospheric environment 77 (2013) 267-271.
[62] F. Torpy, P.J. Irga, M. Burchett, Profiling indoor plants for the amelioration of high CO 2
concentrations, Urban forestry & urban greening 13(2) (2014) 227-233.
[63] F. Torpy, M. Zavattaro, P. Irga, Green wall technology for the phytoremediation of indoor air: a
system for the reduction of high CO2 concentrations, Air Quality, Atmosphere & Health 10(5) (2017)
575-585.
[64] A, Bondarevs, Huss, P., Gong, S., Weister, O. and Liljedahl, R., Green walls utilizing Internet of
Things. Sensors & Transducers, 192(9) (2015) 16.
[65] NJ, Paull, Irga, P.J. and Torpy, F.R., Active botanical biofiltration of air pollutants using Australian
native plants. Air Quality, Atmosphere & Health, 12(12) (2019) 1427-1439.
[66] K. Botzenhart, K. Altenhoff, T. Leithold, Molds in the air of greenhouse homes, Indoors air 84
(1984) 277-282.

Page | 129
[67] S. Engelhart, E. Rietschel, M. Exner, L. Lange, Childhood hypersensitivity pneumonitis associated
with fungal contamination of indoor hydroponics, International journal of hygiene and environmental
health 212(1) (2009) 18-20.
[68] M. Hedayati, A. Mohseni-Bandpi, S. Moradi, A survey on the pathogenic fungi in soil samples of
potted plants from Sari hospitals, Iran, Journal of Hospital Infection 58(1) (2004) 59-62.
[69] F. Staib, B. Tompak, D. Thiel, A. Blisse, Aspergillus fumigatus and Aspergillus niger in two potted
ornamental plants, cactus (Epiphyllum truncatum) and clivia (Clivia miniata). Biological and
epidemiological aspects, Mycopathologia 66(1-2) (1978) 27-30.
[70] R.C. Summerbell, S. Krajden, J. Kane, Potted plants in hospitals as reservoirs of pathogenic fungi,
Mycopathologia 106(1) (1989) 13-22.
[71] P. Irga, P. Abdo, M. Zavattaro, F. Torpy, An assessment of the potential fungal bioaerosol
production from an active living wall, Building and Environment 111 (2017) 140-146.
[72] T. Pettit, P. Irga, F. Torpy, The in situ pilot-scale phytoremediation of airborne VOCs and particulate
matter with an active green wall, Air Quality, Atmosphere & Health 12(1) (2019) 33-44.
[73] T. Pettit, P.J. Irga, N.C. Surawski, F.R. Torpy, An Assessment of the Suitability of Active Green
Walls for NO2 Reduction in Green Buildings Using a Closed-Loop Flow Reactor, Atmosphere 10(12)
(2019) 801.