performance of different biofilters in a recirculating ... · 5426 performance of different...
TRANSCRIPT

5426
Performance of different biofilters in a recirculating system for rainbow trout farming
Desempeño de diferentes biofiltros en un sistema de recirculación para cultivo de trucha arcoiris
Iván Sánchez O,* M.Sc, Dolly Revelo R, M.Sc, Álvaro Burbano M, M.Sc, Roberto García C, I.P.A., Camilo Guerrero R, I.P.A., Diana Beltrán T, I.P.A, Luis Benavides M, I.P.A.
Universidad of Nariño, Faculty of Fisheries Sciences, Department of Water Resources, Aquaculture Production Engineering Program. Ciudad Universitaria, Barrio Torobajo Carrera 22 # 18-109. San Juan de Pasto, Nariño, Colombia. *Correspondence: [email protected].
Received: January 2015; Accepted: January 2016.
ABSTRACT
Objective. To evaluate the performance of different biofilters in a recirculating aquaculture system (RAS) for trout farming. Materials and methods. It was used a 1m3 plastic tank for fries farming; fabric bags to solids retention; a submersible pump; a constant water level and flow distribution box; six up flow biofilters in 3” PVC tube; sand of D10=0.45mm as carrier. The reactors were operated at local temperature and with hydraulic retention time (HRT) of 11 min, the biofilters were inoculated in the next way: R1-Control: RAS water; R2-Fish culture farm sludges; R3- Water from aerated lagoon of Antanas landfill (AL); R4-Aquarium sediments; R5- Aerated lagoon of AL sludges; R6-Sludges from sulfidogenic reactor of AL. The weight gain (WG) and the food conversion (FC) were evaluated, some physic-chemical parameters were monitored and the nitrogen and suspended solids removal efficiency were evaluated. Results. The WG of the cultured animals was 1.58 g/d and the FC was 1.41. There were no differences for ammonium and nitrite removal between the reactors; the average removal efficiencies were: ammonium 4.78%, nitrite 27.2%, nitrate 32.3%, suspended solids 37.5%; R4 and R5 reactors presented the best performance on nitrate removal, with average efficiencies of 47.4% and 42.8%. R3 presented the best SS removal with an average of 58.2%. Conclusions. The RAS water treatment system guaranteed appropriated liquid quality conditions for trout farming; the most efficient reactor for removal of the different forms of nitrogen was the inoculated with the aerated lagoon of AL sludges.
Key words. Aquaculture, biological filters, nitrification, RAS, water recycling (Sources DeCS).
RESUMEN
Objetivo. Evaluar el desempeño de diferentes biofiltros en un sistema de recirculación (SRA) para cultivo de trucha arcoiris. Materiales y métodos. Se utilizó: un tanque de 1m3 para cultivo de alevines, bolsas de lienzo para retención de sólidos, bomba sumergible, caja de nivel constante y distribución de flujo, seis biofiltros en tubo de PVC de 3”, arena con D10=0.45mm como medio soporte. Los biofiltros se operaron a temperatura ambiente y con tiempo de retención hidráulica (TRH) de 11 min, se inocularon así: R1-Control: Aguas del SRA; R2-Lodos estación piscícola; R3-Agua Laguna aireada relleno sanitario Antanas (RSA); R4-Sedimentos acuarios; R5-Lodos laguna aireada RSA; R6-Lodos reactor sulfidogénico RSA. Se evaluó la ganancia de peso (GP) y la conversión alimenticia
Rev.MVZ Córdoba 21(2):5426-5440, 2016. ISSN: 0122-0268
ORIGINAL

5427
(CA), se monitorearon parámetros físico-químicos y se evaluó la eficiencia de remoción de nitrógeno y sólidos suspendidos. Resultados. La GP de los animales fue de 1.58 g/d y la CA de 1.41. No hubo diferencias para remoción de amonio ni nitritos entre reactores; las eficiencias medias de remoción fueron: amonio 4.78%, nitrito 27.2%, nitrato 32.3%, sólidos suspendidos 37.5%. Los reactores R4 y R5 presentaron mejor remoción de nitratos, con eficiencias medias de 47.4% y 42.8%. El R3 reportó la mejor remoción de SS con promedio del 58.2%. Conclusiones. El sistema de tratamiento del agua en el SRA garantizó condiciones de calidad del líquido, apropiadas para el cultivo de la trucha; el reactor más eficiente para la remoción de las formas de nitrógeno evaluadas fue el inoculado con lodos de la laguna aireada del RSA.
Palabras clave: Acuicultura, filtros biológicos, nitrificación, reciclaje del agua, SRA (Fuente DeCS).
INTRODUCCIÓN
La trucha arcoiris (Oncorhynchus mykiss) es una de las especies más importantes en la acuicultura de aguas continentales de Colombia, con una producción de 4.617 toneladas en el año 2008 (1). Su cultivo es uno de los que mayor cantidad de agua necesita, pues para producir un kg en raceways regularmente se requieren 210.000 L mientras que para producir tilapia en estanques se requieren solamente 21.000 L (2). Una opción para optimizar el aprovechamiento del agua es su reúso a través de unidades de cultivo dispuestas en serie donde el líquido fluye por gravedad; sin embargo, la calidad del agua se deteriora al pasar de una unidad a la siguiente y los residuos disueltos y particulados se acumulan progresivamente en la columna de agua (3); por otra parte, en los sistemas de reúso parcial se requiere de la incorporación de un cierto flujo de agua fresca para controlar la acumulación de las formas de amonio (4).
La escasez creciente de los recursos hídricos, la gestión de la contaminación del medio ambiente y la seguridad alimentaria, son algunos de los motivos por los cuales la acuicultura de recirculación se está volviendo más y más popular (5). Los sistemas de recirculación para la acuicultura (SRA) permiten la producción intensiva de pescado de alta calidad, en estrecha proximidad a los grandes mercados, mientras reducen la huella hídrica y las preocupaciones ambientales; idealmente los SRA se ubican cerca a áreas urbanas con mercados que presentan alta demanda por proteína producida de manera sostenible (2, 6).
Los SRA se caracterizan por la presencia de biofiltros para tratar el agua contaminada, reducen la cantidad de líquido requerida y las descargas de las operaciones acuícolas (7). En la producción acuícola, el consumo relativo de agua es definido como el volumen de agua tomada relacionada con la producción de biomasa o el alimento usado, así la carga de alimentación, expresada como kg de alimento por m3 de agua
INTRODUCTION
Rainbow trout (Oncorhynchus mykiss) is one of the most important aquaculture species in Colombia’s inland waters, with a production of 4,617 tons in 2008 (1). Trout requires the greatest amount of water, since producing 1 kg in raceways regularly requires 210.000 L while only 21,000 L are required to produce tilapia (2). To optimize water, it can be reused in culture units arranged in series where the water flows by the force of gravity. However, water quality deteriorates as it moves from one unit to the next, and the disolved and particulate residues progressively accumulate in the water (3). Moreover, partial reuse systems require the incorporation of a certain amount of fresh water to control ammonium accumulation (4).
The increasing scarcity of water resources as well as concerns over environmental pollution management and food security are some of the reasons why recirculation aquaculture is becoming more and more popular (5). Recirculation aquaculture systems (RAS) allow intensive production of high quality fish in close proximity to large markets while reducing the water footprint and environmental concerns. Ideally, RAS are located close to urban areas with markets that have a high demand for sustainably produced protein (2, 6).
RAS use biofilters that treat contaminated water and reduce the amount of liquid required as well as discharges from aquaculture operations (7). In aquaculture production, relative water consumption is defined as the volume of water taken related to the production of biomass or feed used, so that the feedstock, expressed as kg of feed per m3 of water, reflects the intensity of recirculation and affects waste accumulation in untreated systems (8) and is directly related to the biofilter’s ability to nitrify (9).
In aquaculture there is a tendency to use fixed biofilm reactors, preferably those in suspension (10). Within these reactors are fixed
Sánchez - Performance of different biofilters recirculating system

5428 REVISTA MVZ CÓRDOBA • Volumen 21(2) Mayo - Agosto 2016
tomada, refleja la intensidad de recirculación e incide sobre la acumulación de desechos en los sistemas sin tratamiento (8) y está relacionada directamente con la capacidad de nitrificación del biofiltro (9).
En acuacultura existe la tendencia a la utilización de reactores de biopelícula fija con preferencia en relación a los de crecimiento en suspensión (10), dentro de este tipo de reactores se encuentran los filtros de medio soporte granular fijo. Bajo condiciones aerobias, la filtración biológica incluye la remoción autotrófica del amonio y del nitrito, así como la degradación heterotrófica de la materia orgánica disuelta y particulada (11). El N disuelto procedente de los peces es excretado principalmente en forma de urea y amonio, el amonio es nitrificado a nitrato con nitrito como un intermediario; en la desnitrificación anóxica, las bacterias heterotróficas facultativas reducen nitrato y nitrito a N gaseoso por la captura de energía y electrones a partir de la MO (12). El NH3 (amonio) y el NH4
+ (ión amonio) cuya suma es llamada nitrógeno amoniacal total (NAT) pueden ser tóxicos para los peces en niveles que dependen entre otros de la especie, el tamaño del animal, la presencia de sólidos finos, de metales y del nitrato (13). La nitrificación como el proceso de oxidación del ión amonio y del nitrito ocurre en la película bacteriana del biofiltro (14). Crab et al (13) afirman que la nitrificación es afectada por parámetros como el sustrato y las concentraciones de oxígeno disuelto, MO, temperatura, pH, alcalinidad, salinidad y nivel de turbulencia.
Los biofiltros se definen como estructuras de biopelículas altamente organizadas, que se desarrollan por la segregación de miembros de comunidades individuales en distintas capas, las cuales cambian de acuerdo a las condiciones nutricionales (14). Las reacciones oxidativas en la nitrificación son catalizadas por dos grupos de microorganismos denominados oxidantes del amonio y oxidantes del nitrito; sin embargo, aún no son bien entendidos los mecanismos de este proceso biológico en una biopelícula (15).
El objetivo de la presente investigación fue evaluar el desempeño de un SRA para cultivo de alevinos de trucha arcoiris en cuanto a la remoción de N y sólidos por biofiltros de medio soporte fijo y flujo ascendente en los que se utilizaron diferentes inóculos.
MATERIALES Y MÉTODOS
Localización. La investigación se ejecutó en el Laboratorio de Recirculación del Programa
granular support filters. Under aerobic conditions, biological filtration includes the autotrophic removal of ammonium and nitrite, as well as the heterotrophic degradation of dissolved and particulate organic matter (11). Dissolved N from the fish is excreted mainly as urea and ammonia, and the ammonium is nitrified to nitrite as an intermediary. In anoxic denitrification, facultative heterotrophic bacteria reduce nitrate and nitrite to gaseous N by capturing energy and electrons from MO (12). NH3 (ammonia) and NH4
+ (ammonium ion), the combination of which is called total ammonia nitrogen (TAN), can be toxic to fish at levels that vary according to the species, fish size, the presence of fine solids, metals and nitrate (13). Nitrification as the oxidation of ammonium ion and nitrite occurs in the bacterial film of the biofilter (14). Crab et al (13) state that nitrification is affected by parameters such as substrate and dissolved oxygen concentrations, MO, temperature, pH, alkalinity, salinity and turbulence level.
Biofilters are defined as highly organized biofilm structures that develop due to segregation of members of individual communities in different layers that change according to nutritional conditions (14). Oxidative reactions in nitrification are catalyzed by two groups of microorganisms called ammonium oxidants and nitrite oxidants. However, the mechanisms of this biological process in biofilms are still not fully understood (15).
The aim of this study was to evaluate the performance of RAS in rainbow trout fingerling cultivation to remove N and biofilter solids in fixed support and upflow in which different inoculum were used.
MATERIALS AND METHODS
Location. The investigation was done at the Recirculation Laboratory of the Aquaculture Production Engineering Program (APEP) of the Universidad de Nariño–Pasto: Latitude 01° 09’ N, Longitude 77° 08’ W, Altitude 2540 meters above sea level.
Components and operation of the recirculation system. The RAS consisted of a fiberglass culture tank – CT – 0.991 m3, 1.28 m diameter and a height of 0.87 m. The tank had a central drain, external overflow in 1-1/2” PVC piping coupled to a level control with two perforated plates for retention of solids. The effluent passed through a canvas bag filter, the filtered liquid accumulated in a 100 L suction tank that a 1 HP pump sent to a reservoir and then to a constant level box with 0.20m hydraulic loading that distributed the water

5429Sánchez - Performance of different biofilters recirculating system
de Ingeniería en Producción Acuícola IPA de la Universidad de Nariño–Pasto: Latitud 01° 09’ N, Longitud 77° 08’ W, Altitud 2540 msnm.
Componentes y funcionamiento del sistema de recirculación. El SRA constó de un tanque de cultivo –TC- en fibra de vidrio de 0.991 m3 con diámetro 1.28 m y altura 0.87 m. El tanque tuvo drenaje central de rebalse externo en tubería PVC de 1-1/2”, acoplado a una caja reguladora de nivel con dos placas perforadas para retención de sólidos, cuyo efluente pasó por un filtro de bolsa en lienzo, el líquido filtrado se acumuló en un tanque de succión de 100 L del que una bomba de 1 HP envió hacia un reservorio y después a una caja de nivel constante con carga hidráulica de 0.20m que distribuyó el agua por gravedad a los 6 biofiltros (reactores) de flujo ascendente con manguera transparente de ½”. Los reactores se construyeron en tubería PVC sanitaria de 3” y altura total de 1.0 m. El afluente ingresó a los biofiltros a través de una base acrílica perforada con 115 agujeros de 3.57 mm de diámetro, el caudal se controló con válvulas tipo bola. El efluente tratado de los reactores salió lateralmente por tubos y manguera flexible de ½” ubicados a 0.95 m de la base, se colectó en un canal en PVC que lo retornó hacia el TC.
by gravity to the 6 upflow biofilters (reactors) with a ½” transparent hose. The reactors were made with 3” PVC sanitary pipe and a total height of 1.0 m. The influent entered the biofilters through an acrylic base perforated with 115 3.57 mm holes and the flow rate was controlled with ball-type valves. The treated effluent left laterally through ½” flexible tubes and hosing located 0.95 m from the base and was collected in a PVC channel that returned it to the CT.
The acrylic false bottom of the biofilters was 0.10 m from the base, the sheet held up sublayer 1, followed by sublayer 2, each with a height of 0.05 m. There was 0.60 m of sand on undercoat 2, and on the static level there was a hydraulic load of 0.15 m and 0.05 m free edge on the output of the effluent.
In the CT, air entered from the blower through a PVC pipe, flexible hose and air stone.
The diagram in figure 1 shows the elements of the evaluated recirculation system.
Transporting and acclimatizing of the trout. The fish were moved from the cages floating at the “Inti Yaco” station on Lake Guamués to
Figure 1. Frontal view of RAS and components. Source: This investigation.

5430 REVISTA MVZ CÓRDOBA • Volumen 21(2) Mayo - Agosto 2016
El falso fondo acrílico de los biofiltros estuvo a 0.10 m de su base, la lámina soportó la subcapa 1, seguida por la subcapa 2, cada una con una altura de 0.05 m. Sobre la subcapa 2 estuvo la capa de arena de 0.60 m, sobre cuyo nivel estático se dejó una carga hidráulica de 0.15 m y 0.05 m de borde libre sobre la salida del efluente.
En el TC el ingreso de aire proveniente del blower se realizó por tubería PVC, manguera flexible y piedra difusora.
La figura 1 presenta un esquema en el que se visualizan los elementos constitutivos del sistema de recirculación evaluado.
Transporte y aclimatación de las truchas. Los animales se trasladaron desde las jaulas flotantes de la estación “Inti Yaco” del Lago Guamués hasta el laboratorio con ayuno previo de 24 horas. Los peces se empacaron en grupos de 10 animales en bolsas plásticas calibre 3 con 1/3 de agua y 2/3 de volumen de oxígeno. Con el fin de homogenizar los parámetros fisicoquímicos del agua de transporte con respecto a la del laboratorio, las bolsas fueron introducidas en un tanque auxiliar de 1.0 m3 durante un período de 15 min. Como tratamiento profiláctico, a cada bolsa se agregó 3 g de NaCl por cada litro de agua. Los animales aclimatados tuvieron un período de adaptación de 7 días, tiempo en que se suministró alimento a saciedad.
Muestreo y alimentación de los animales. Se efectuó un censo inicial de los 34 ejemplares de trucha arcoíris, tranquilizados con eugenol para facilitar su manipulación y registrar su peso para establecer la ración alimenticia diaria y calcular la conversión alimenticia (CA). Se suministró concentrado en una proporción del 3% de la biomasa, distribuyéndose en tres comidas. Durante el experimento se efectuaron cinco muestreos adicionales. La carga inicial del sistema fue de 0.83 kg/m3, el peso promedio de los animales fue 24.11 ± 5.9 g, con valores mínimo y máximo de 14.4 y 35.7 g. El incremento de peso periódico se expresó como la ganancia de peso individual promedio de la población en un periodo de tiempo.
Monitoreo de parámetros de calidad del agua. En la zona central de la caja de nivel constante y en el efluente de cada reactor se tomaron muestras compuestas en horario de la mañana para los análisis físicoquímicos, de acuerdo con los protocolos establecidos por APHA-AWWA-WPCF (16). Los parámetros monitoreados fueron nitritos (NO2
-), nitratos (NO3-), amonio
(NH4+), sólidos suspendidos (SS), dióxido de
carbono (CO2), alcalinidad, temperatura, oxígeno disuelto (OD) y potencial de hidrogeniones
the laboratory after a 24-hour fast. The fish were packed in groups of 10 in caliber 3 plastic bags with 1/3 water and 2/3 oxygen. In order to homogenize the physicochemical parameters of the transport water with respect to the laboratory water, the bags were introduced into a 1.0 m3 auxiliary tank for a period of 15 min. As a prophylactic treatment, 3 g of NaCl per liter of water was added to each bag. Acclimatized animals had an adjustment period of 7 days, with food supplied to satiety.
Sampling and animal feed. An initial census was performed of 34 specimens of rainbow trout, tranquilized with eugenol to facilitate handling, record weight, and to establish daily feed ration and calculate feed conversion (CA). Feed in a ratio of 3% of the biomass was distributed in three meals. During the experiment five additional samples were taken. The initial system load was 0.83 kg/ m3, the average weight of the animals was 24.11 ± 5.9 g, with minimum and maximum values of 14.4 and 35.7 g. Periodic weight increase was expressed as the average individual weight gain of the population over a period of time.
Monitoring of water quality parameters. In the central area of the constant level box and in the effluent of each reactor composite samples were taken every morning for physical-chemical analysis according to protocols established by APHA-AWWA-WPCF (16). The parameters monitored were nitrite (NO2), nitrate (NO3), ammonium (NH4
+), suspended solids (SS), carbon dioxide (CO2), alkalinity, temperature, dissolved oxygen (DO) and the potential of hydrogen ions (pH). Based on the results obtained, removal efficiency of nitrogenous matter and SS were calculated.
Biofilters and growing media. Support media was inoculated as follows: R1-Control, RAS water, sterile distilled water; R2- sterilized sludge from the Guayrapungo station, filtered and sterilized water from the Guayrapungo station; R3-aerated surface lagoon water from the Antanas landfill (AL), culture medium according to Shi et al (17); R4-APEP aquarium sediments, filtered aquarium water; R5- aerated lagoon sludge RAS, culture medium according to Molinuevo et al (18); R6- sludge from sulfidogenic reactor (RAS), sterile distilled water - leachate (1: 1) as modified by Thabet et al (19). The activation period was 2 weeks before starting the system.
Characterization of granular materials in the reactors. The filter consisted of three layers of granular material: torpedo layer one material passed through a 3/8” sieve and held sieve #4; torpedo layer 2 through sieve #4 and retained sieve #8; sand layer through sieve #20 and

5431Sánchez - Performance of different biofilters recirculating system
(pH). Con base en los resultados obtenidos se calcularon las eficiencias de remoción de materia nitrogenada y de SS.
Biofiltros y medios de cultivo. Los medios soporte fueron inoculados así: R1-Control, aguas del SRA, agua destilada esterilizada; R2-Lodos estación Guayrapungo, agua estación Guayrapungo, filtrada y esterilizada; R3-Agua superficial laguna aireada relleno sanitario Antanas (RSA), medio de cultivo según Shi et al (17); R4-Sedimentos acuarios IPA, agua de acuario filtrada; R5-Lodos laguna aireada RSA, medio de cultivo según Molinuevo et al (18); R6-Lodos reactor sulfidogénico (RSA), agua destilada esterilizada – lixiviado (1:1) según modificación de Thabet et al (19). El período de activación fue de 2 semanas antes del arranque del sistema.
Caracterización de los materiales granulares constitutivos de los reactores. El filtro estuvo conformado por tres capas de material granular: capa torpedo 1 con material pasante tamiz 3/8” y retenido tamiz #4; capa torpedo 2 pasante tamiz #4 y retenido tamiz #8; capa de arena pasante tamiz #20 y retenida por el #40, localizadas en ese orden según el sentido del flujo ascendente.
Los materiales se caracterizaron según los procedimientos establecidos por el Instituto Colombiano de Normas Técnicas ICONTEC mediante las Normas Técnicas Colombianas –NTC- de los ensayos: absorción y densidad para agregados gruesos (NTC 176) y finos (NTC 237); tamizado para agregados finos y gruesos (NTC 77); determinación por lavado del material que pasa el tamiz 75µ (NTC 78); determinación por secado de la humedad de agregados (NTC 1776).
Se calcularon los coeficientes de uniformidad (CU=D60/D10) y de curvatura (CC=D30
2/(D60*D10)) del material compuesto (20).
Caudales y manejo hidráulico del SRA. El tiempo de retención hidráulica (TRH) de diseño de los biofiltros fue de 11 minutos, debido a la colmatación del medio granular fue necesario abrir las válvulas reguladoras de caudal para restaurar el TRH deseado.
Por los reactores de 3”, con columna de líquido de 0.80 m y volumen útil de 3.53 L, circularon 21.2 L cada 11 min. Como el volumen del TC fue de 991 L, éste experimentó un recambio de su volumen total cada 8.58 h, tiempo mayor al rango entre 0.5 y 1.67 h recomendado por Lekang (21) y muy superior a las 0.23 h adoptadas por Good et al (22).
retained by #40, located in this order in the direction of upflow.
Materials were characterized according to procedures established by the Colombian Institute of Technical Standards ICONTEC and the Colombian Technical Standards -NTC- according to these tests: absorption and density of coarse (NTC 176) and fine (NTC 237) aggregates; sieved for fine and coarse aggregates (NTC 77); determination by washing the material in a 75μ sieve (NTC 78); determination by drying aggregate moisture (NTC 1776).
Coefficient uniformity (CU=D60/D10) and curvature (CC=D30
2/(D60*D10)) of the composite material (20) were calculated.
RAS flow and hydraulic steering. The hydraulic retention time (HRT) of the biofilter was 11 minutes, and to silt the granular base it was necessary to open the flow control valves to restore the desired HRT.
Through the 3” reactors with 0.80 m liquid column and a useful volume of 3.53 L, 21.2 L circulated every 11 min. Since the CT volume was 991 L, it underwent a replacement of its total volume every 8.58 h, longer than the range between 0.5 and 1.67 h recommended by Lekang (21) and well above the 0.23 h adopted by Good et al (22).
The clogging of the biofilter made it necessary to wash it by interrupting the filter and removing and washing the granular layers to remove any retained solids. Then the sand was separated in a sieve and was returned to the biofilters.
Experimental design and statistical analysis. For daily monitored parameters (pH, CO2, alkalinity, temperature and OD), the Kruskal-Wallis nonparametric test was chosen. For parameters monitored twice a week (ammonium, nitrite, nitrate and SS), an experimental block design with sub-sampling was used because it was expected to need to wash the layers due to clogged filters, considering the time between washing as a blocking factor. The level of significance was considered at α=0.05, so that values of p <0.05 indicated significant differences. The SAS statistical package version 9.0 was used.
RESULTS
Particle size characteristics of compound granular media. With the granulometric curve of the composite material (Figure 2), the following values were determined: D60=0.70mm;

5432 REVISTA MVZ CÓRDOBA • Volumen 21(2) Mayo - Agosto 2016
La colmatación de los biofiltros hizo necesario su lavado mediante la interrupción del filtrado, retiro y lavado de los medios granulares para remoción de los sólidos retenidos. Posteriormente los medios se separaron por tamizado y se reincorporaron a los biofiltros.
Diseño experimental y análisis estadístico. Para los parámetros monitoreados diariamente (pH, CO2, alcalinidad, temperatura y OD), se optó por la prueba no paramétrica de Kruskal-Wallis. Para los parámetros monitoreados dos veces por semana (Amonio, nitrito, nitratos y SS) se empleó un diseño experimental de bloques con submuestreo por cuanto se preveía realizar un lavado del medio soporte por colmatación de los filtros, considerando el tiempo entre el lavado como un factor de bloqueo. El nivel de significancia que se tuvo en cuenta fue α=0.05, de tal manera que valores de p<0.05 indicaron diferencias significativas. Se utilizó el paquete estadístico SAS versión 9.0.
RESULTADOS
Características granulométricas del medio granular compuesto. Con la curva granulométrica del material compuesto (Figura 2) se determinaron los valores de D60=0.70mm; D10=0.45mm y D30=0.52mm. Con base en ellos, los coeficientes CC y CU fueron de 0.858 y 1.55, respectivamente.
Propiedades f ís icas de los medios granulares. Los valores de humedad natural, absorción y densidad de los materiales utilizados en las unidades de biofiltración se presentan en la tabla 1.
Incremento de peso periódico y conversión alimenticia. La carga inicial de biomasa fue de 0.83 kg/m3 y la final de 4.23 kg/m3. Se obtuvo un incremento promedio diario de peso individual
D10=0.45mm and D30=0.52mm. Based on these, the CC and CU coefficients were 0.858 and 1.55, respectively.
Physical properties of granular media. The
Table 1. Physical properties of granular material used.
Material Natural humidity (%)
Nominal density (g/cm3)
Absorption (%)
Arena #20-#40 0.28 2.68 1.38
Material #8-#20 0.34 2.23 21.25
Material #4-#8 0.53 2.67 0.93
values of natural moisture, absorption, and density of materials used in the biofiltration units are presented in table 1.
Periodic weight increase and feed conversion. The initial biomass loading was 0.83 kg/m3 and at the end 4.23 kg/m3. An average daily of individual weight increase during the test was 1.58 g/d and an average FC value of 1.41. Figure 3 shows the values of the CT bioburden during the experiment.
Figure 2. Granulometric curve for composed granular means.
Figure 3. Growth curve for cultivated biological load.
Table 2. Mean values and standard deviation of the parameters measured daily.
Parameter/ Point pH Alc. CO2 Temp. OD
AC 5.5±0.40 4.6±3.89 16.7±8.97 15.7±0.80 4.2±0.33
R1 5.2±0.51 3.3±2.94 16.2±6.41 15.6±0.82 1.7±1.36
R2 5.1±0.45 2.7±1.57 17.2±8.34 15.5±0.85 1.6±1.44
R3 5.0±0.43 2.1±1.33 16.3±7.39 15.6±0.85 1.9±1.54
R4 5.0±0.42 2.1±2.06 17.3±8.17 15.6±0.90 1.4±1.29
R5 5.0±0.47 3.1±3.02 16.2±7.26 15.6±0.98 1.6±1.38
R6 5.0±0.46 2.3±1.59 17.0±7.55 15.6±0.96 1.5±1.29
5433Sánchez - Performance of different biofilters recirculating system
durante todo el ensayo de 1.58 g/d y un valor promedio de CA de 1.41. La figura 3 representa los valores de carga biológica del TC durante el experimento.
Parámetros de calidad del agua medidos diariamente. A continuación, en la tabla 2 se presentan los valores medios, así como las desviaciones estándar calculadas para pH, alcalinidad (Alc.), CO2, temperatura (Temp.) y OD, tanto en la caja de nivel constante, que correspondió a la entrada o afluente crudo (AC), como en la salida de cada uno de los reactores, en los que la letra R, con su respectivo número se refieren al reactor evaluado.
pH. Se encontraron diferencias altamente significativas entre las medianas correspondientes a los reactores 2, 3, 4, 5 y 6 con respecto a la entrada o afluente crudo. Por su parte, el R1 no mostró diferencias con respecto a la entrada. El valor promedio del pH registrado en los reactores fue de 5.1, y los valores mínimo y máximo fueron de 4.3 y 7.0.
Alcalinidad y CO2. Para alcalinidad hubo diferencias significativas de los reactores 2, 3, 4 y 6 con respecto a la entrada pero no entre ellos. Los valores de alcalinidad fueron en general bajos, con promedio en los reactores de 2.9 mg/L de CaCO3, evidenciando picos posteriores a los recambios parciales. La concentración media de CO2 registrada fue de 16 mg/L.
Temperatura. No hubo diferencias significativas entre los valores registrados durante la investigación.
Oxígeno disuelto. No hubo diferencias entre los reactores, pero todos difieren con respecto a la entrada cuya concentración de OD osciló entre 3.8 y 4.8 mg/L. En los efluentes de los reactores se registró un rango medio de valores entre 1.0 y 2.0 mg/L con una concentración promedio de 1.6 mg/L.
Parámetros de calidad del agua medidos 2 veces por semana. La tabla 3 presenta los valores del Análisis de Varianza correspondientes a los efectos producidos por los reactores y sus respectivos P valor.
Los resultados para los parámetros citados en la tabla 3 se presentan a continuación respaldados por una serie de diagramas de cajas y bigotes en los que la letra E hace referencia a los datos correspondientes a la entrada o afluente crudo, la letra R con su respectivo número se refieren al
Daily measurement of water quality parameters. Table 2 presents the mean values as well as standard deviations calculated for pH, alkalinity (Alk.), CO2, temperature (Temp.) and OD, both in the constant level box that corresponded to the crude entrance or influent (CE) and each reactor’s output, where the letter R with the respective number refer to the reactor evaluated.
pH. Highly significant differences between medians corresponding to reactors 2, 3, 4, 5 and 6 with respect to the raw entrance or influent were found. Meanwhile, R1 showed no difference with respect to input. The average pH value recorded in the reactors was 5.1 and the minimum and maximum values were 4.3 and 7.0.
Alkalinity and CO2. For alkalinity there were significant differences in reactors 2, 3, 4 and 6 with respect to entrance but not between them. Alkalinity values were generally low, with an average in the reactors of 2.9 mg/L of CaCO3, showing peaks after partial replacements. The average CO2 concentration recorded was 16 mg/L.
Temperature. No significant differences were found in the recorded values during the investigation.
Dissolved oxygen. There were no differences between the reactors, but they all differ with respect to the input whose OD concentration ranged from 3.8 to 4.8 mg/L. In reactor effluent an average range of values between 1.0 and 2.0 mg/L with an average concentration of 1.6 mg/L was recorded.
Water quality parameters measured 2 times per week. Table 3 shows variance analysis values corresponding to the effects of the reactors and their respective P value.
The results for the parameters listed in table 3 are presented below, supported by a series of diagrams of boxes in which the letter E refers to the corresponding input or raw influent data, the letter R with its respective number to the reactor
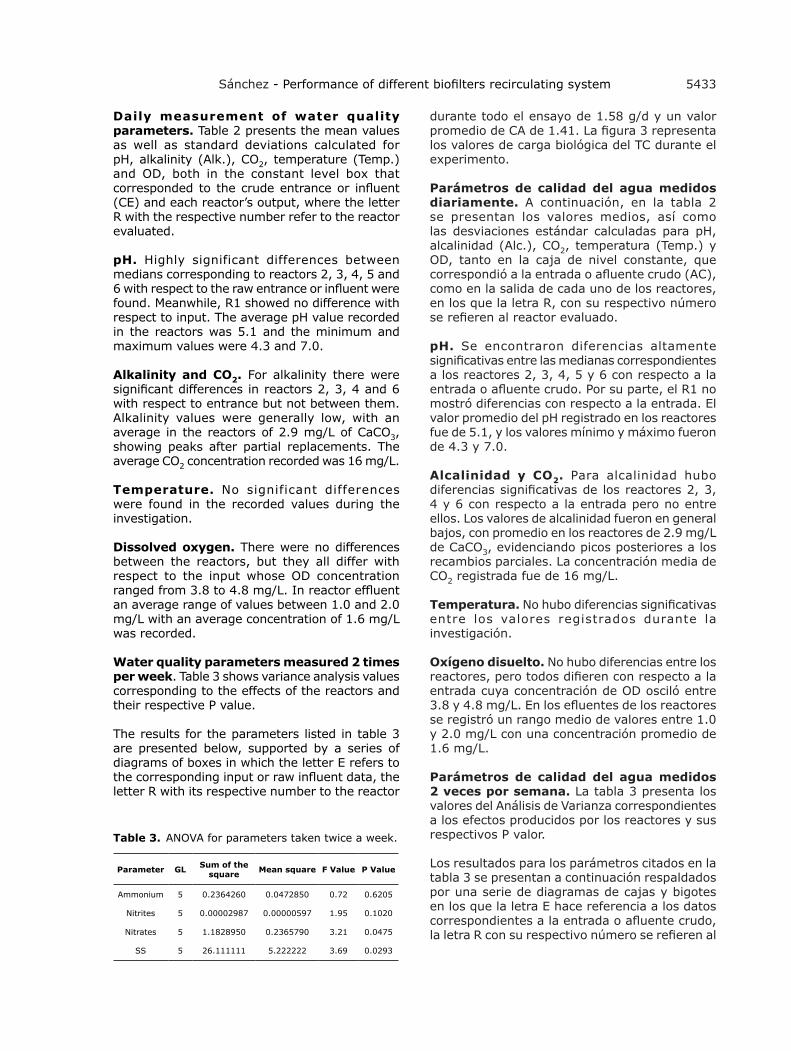
Table 3. ANOVA for parameters taken twice a week.
Parameter GL Sum of the square Mean square F Value P Value
Ammonium 5 0.2364260 0.0472850 0.72 0.6205
Nitrites 5 0.00002987 0.00000597 1.95 0.1020
Nitrates 5 1.1828950 0.2365790 3.21 0.0475
SS 5 26.111111 5.222222 3.69 0.0293

5434 REVISTA MVZ CÓRDOBA • Volumen 21(2) Mayo - Agosto 2016
reactor reportado y la letra B junto al número a ella asociado indican el bloque al que pertenecen los datos.
Amonio. No hubo diferencias significativas (Tabla 3). La figura 4 ilustra las concentraciones de amonio medidas para los dos bloques establecidos por el tiempo.
Nitritos. No se encontraron diferencias significativas (Tabla 3). La figura 5 presenta los valores registrados para este parámetro durante la investigación.
Nitratos. Para este parámetro se encontraron diferencias significativas entre los reactores (Tabla 3). Con base en la prueba de rangos múltiples se conformaron cuatro grupos: el biofiltro R5; el biofiltro R6; los biofiltros R2, R1, y R4, con medias iguales; y el biofiltro R3. La figura 6 ilustra las concentraciones de nitratos registradas para los dos bloques.
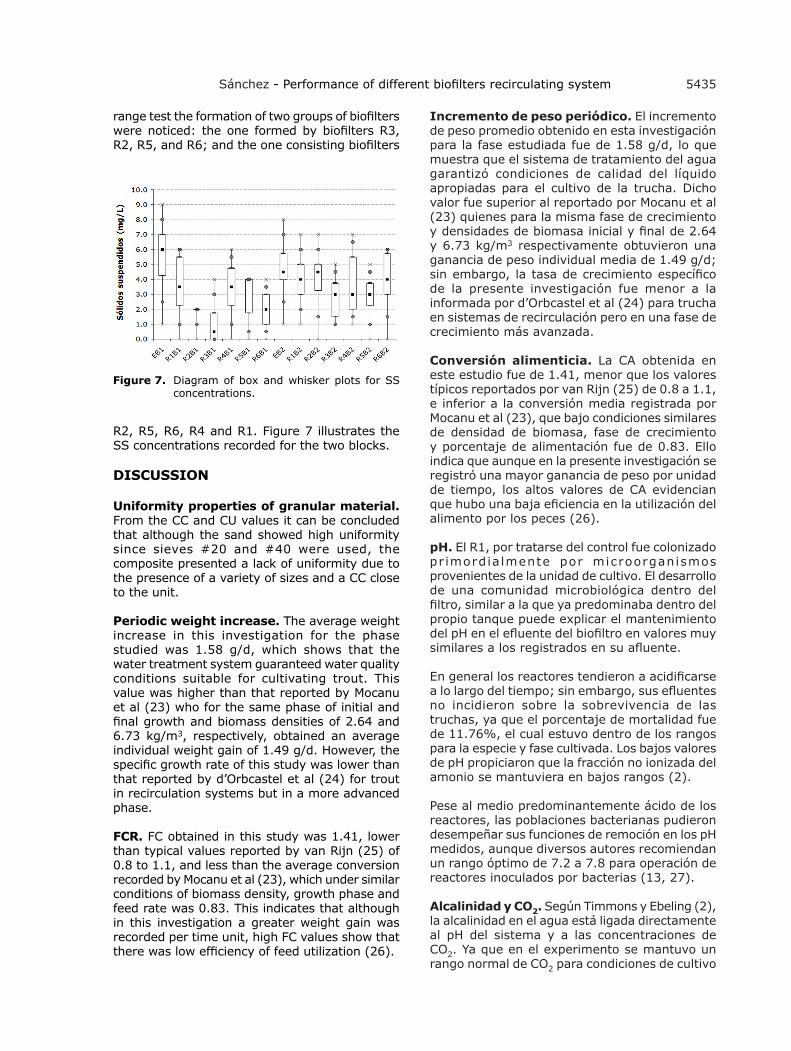
Sólidos suspendidos. Para este parámetro se encontraron diferencias significativas (Tabla 3). A partir de la prueba de rangos múltiples se apreció la formación de dos grupos de biofiltros: el formado por los biofiltros R3, R2, R5, y R6; y el constituido por los biofiltros R2, R5, R6, R4 y R1. La Figura 7 ilustra las concentraciones de SS registradas para los dos bloques.
DISCUSIÓN
Propiedades de uniformidad del material granular. Los valores del CC y del CU permiten concluir que pese a que la arena evidenció alta uniformidad por estar entre los tamices #20 y #40, el material compuesto presentó falta de uniformidad por la presencia de variedad de tamaños y un CC próximo a la unidad.
reported and the letter B next to the number associated with it indicates the block to which the data belongs.
Figure 4. Diagram of box and whisker plots for ammonium concentrations.
Ammonium. There were no significant differences (Table 3). Figure 4 illustrates the concentration of ammonium measured for the two blocks established by time.
Nitrites. No significant differences (Table 3) were found. Figure 5 shows the values registered for this parameter during the study.
Nitrates. For this parameter significant differences between reactors (Table 3) were found. Based on the multiple range test four groups were established: biofilter R5; biofilter R6; biofilters R2, R1 and R4, with equal means, and biofilter R3. Figure 6 illustrates nitrate concentrations recorded for the two blocks.
Suspended solids. Significant difference for this parameter (Table 3) were found. From the multiple
Figure 5. Diagram of box and whisker plots nitrite concentrations.
Figure 6. Diagram of box and whisker plots for nitrate concentrations.
5435Sánchez - Performance of different biofilters recirculating system
Incremento de peso periódico. El incremento de peso promedio obtenido en esta investigación para la fase estudiada fue de 1.58 g/d, lo que muestra que el sistema de tratamiento del agua garantizó condiciones de calidad del líquido apropiadas para el cultivo de la trucha. Dicho valor fue superior al reportado por Mocanu et al (23) quienes para la misma fase de crecimiento y densidades de biomasa inicial y final de 2.64 y 6.73 kg/m3 respectivamente obtuvieron una ganancia de peso individual media de 1.49 g/d; sin embargo, la tasa de crecimiento específico de la presente investigación fue menor a la informada por d’Orbcastel et al (24) para trucha en sistemas de recirculación pero en una fase de crecimiento más avanzada.
Conversión alimenticia. La CA obtenida en este estudio fue de 1.41, menor que los valores típicos reportados por van Rijn (25) de 0.8 a 1.1, e inferior a la conversión media registrada por Mocanu et al (23), que bajo condiciones similares de densidad de biomasa, fase de crecimiento y porcentaje de alimentación fue de 0.83. Ello indica que aunque en la presente investigación se registró una mayor ganancia de peso por unidad de tiempo, los altos valores de CA evidencian que hubo una baja eficiencia en la utilización del alimento por los peces (26).
pH. El R1, por tratarse del control fue colonizado pr imordia lmente por microorganismos provenientes de la unidad de cultivo. El desarrollo de una comunidad microbiológica dentro del filtro, similar a la que ya predominaba dentro del propio tanque puede explicar el mantenimiento del pH en el efluente del biofiltro en valores muy similares a los registrados en su afluente.
En general los reactores tendieron a acidificarse a lo largo del tiempo; sin embargo, sus efluentes no incidieron sobre la sobrevivencia de las truchas, ya que el porcentaje de mortalidad fue de 11.76%, el cual estuvo dentro de los rangos para la especie y fase cultivada. Los bajos valores de pH propiciaron que la fracción no ionizada del amonio se mantuviera en bajos rangos (2).
Pese al medio predominantemente ácido de los reactores, las poblaciones bacterianas pudieron desempeñar sus funciones de remoción en los pH medidos, aunque diversos autores recomiendan un rango óptimo de 7.2 a 7.8 para operación de reactores inoculados por bacterias (13, 27).
Alcalinidad y CO2. Según Timmons y Ebeling (2), la alcalinidad en el agua está ligada directamente al pH del sistema y a las concentraciones de CO2. Ya que en el experimento se mantuvo un rango normal de CO2 para condiciones de cultivo
range test the formation of two groups of biofilters were noticed: the one formed by biofilters R3, R2, R5, and R6; and the one consisting biofilters
Figure 7. Diagram of box and whisker plots for SS concentrations.
R2, R5, R6, R4 and R1. Figure 7 illustrates the SS concentrations recorded for the two blocks.
DISCUSSION
Uniformity properties of granular material. From the CC and CU values it can be concluded that although the sand showed high uniformity since sieves #20 and #40 were used, the composite presented a lack of uniformity due to the presence of a variety of sizes and a CC close to the unit.
Periodic weight increase. The average weight increase in this investigation for the phase studied was 1.58 g/d, which shows that the water treatment system guaranteed water quality conditions suitable for cultivating trout. This value was higher than that reported by Mocanu et al (23) who for the same phase of initial and final growth and biomass densities of 2.64 and 6.73 kg/m3, respectively, obtained an average individual weight gain of 1.49 g/d. However, the specific growth rate of this study was lower than that reported by d’Orbcastel et al (24) for trout in recirculation systems but in a more advanced phase.
FCR. FC obtained in this study was 1.41, lower than typical values reported by van Rijn (25) of 0.8 to 1.1, and less than the average conversion recorded by Mocanu et al (23), which under similar conditions of biomass density, growth phase and feed rate was 0.83. This indicates that although in this investigation a greater weight gain was recorded per time unit, high FC values show that there was low efficiency of feed utilization (26).

5436 REVISTA MVZ CÓRDOBA • Volumen 21(2) Mayo - Agosto 2016
prolongadas y bajos valores de pH, hubo niveles relativamente bajos de alcalinidad, que también estuvieron asociados a los procesos microbianos, especialmente relativos a la nitrificación pues por cada gramo de amonio nitrificado se requieren 4.57 g de oxígeno y 7.14 g de alcalinidad (2). Los mayores valores de alcalinidad registrados en los reactores R1 y R5, en relación a los medidos en las demás unidades de tratamiento, pudieron deberse a incipientes procesos de desnitrificación, pues que de acuerdo con Tsukuda et al (6), la desnitrificación es un proceso que produce alcalinidad.
Temperatura. Los valores registrados se encontraron dentro de los rangos de temperatura recomendados por Magerhans y Hörstgen-Schwark (28) para el cultivo de trucha arco iris en la fase evaluada, ello influyó directamente en los procesos fisiológicos tales como eficiencia de alimentación y crecimiento.
Oxígeno disuelto. El consumo del oxígeno debido a los procesos biológicos del tratamiento del agua residual se puso en evidencia en el efluente de cada uno de los reactores. El oxígeno es demandado en los biofiltros por las bacterias heterotróficas pues por cada gramo de nitrógeno amoniacal oxidado a nitrógeno nítrico se requieren 4.57 g de oxígeno. Timmons y Ebeling (2) afirmaron que niveles de 2 mg/L de OD en el efluente del biofiltro son adecuados para mantener a un máximo la tasa de nitrificación.
Amonio. La similitud en la eficiencia de remoción de amonio pudo deberse a que el tiempo de maduración de los inóculos en los biofiltros no fue suficiente para demostrar los efectos de cada uno. Se observó una disminución de la remoción posterior al lavado; autores como Suhr y Pedersen (29) afirman que las tasas de remoción del nitrógeno amoniacal en biofiltros son altamente dependientes de parámetros ambientales, así como de parámetros operacionales, tales como la distribución del flujo y los regímenes de retrolavado. Los valores promedio de remoción en los reactores oscilaron entre 2.8 y 7.9%, el promedio general fue de 4.7%. La remoción es función principal de las bacterias oxidantes de amonio (BOA) bajo condiciones aeróbicas o anaeróbicas. Malone y Pfeiffer (10) manifiestan que las bacterias heterotróficas contribuyen en la definición del espesor de la biopelícula.
Bajo condiciones anóxicas, la oxidación anaerobia del amonio –anammox - permite que el amonio sea oxidado a nitrito produciendo nitrógeno molecular, requiere del orden de 50% de oxígeno menos comparado con los procesos de nitrificación-desnitrificación (30).
pH. Since the R1 was a control, it was colonized primarily with microorganisms from the culture unit. The microbiological community that developed within the filter was similar to that already prevailing within the tank itself, which can explain why the pH in the effluent of the biofilter was very similar values to what was recorded in the effluent.
Generally, the reactors tended to acidify over time; however, the effluents did not affect trout survival, since mortality rate was 11.76%, which was within the ranges for the species and cultivated phase. The low pH values meant that the non-ionized fraction of ammonium remained in low ranges (2).
In spite of the reactors’ predominantly acid medium, bacterial populations were able to carry out their removal functions in the measured pH, although several authors recommend an optimum range of 7.2 to 7.8 for reactors inoculated with bacteria (13, 27).
Alkalinity and CO2. According to Timmons and Ebeling (2), alkalinity in water is linked directly to the pH of the system and CO2 concentrations. Since in this experiment a normal range of CO2 was maintained for prolonged cultivation and low pH values, relatively low levels of alkalinity were found. These were also associated with microbial processes, especially concerning nitrification, since for every gram of nitrified ammonium 4.57 g and 7.14 g of oxygen alkalinity (2) are required. The highest alkalinity values recorded in R1 and R5 reactors relative to those measured in the other treatment units could be due to incipient denitrification processes, since according to Tsukuda et al (6), denitrification produces alkalinity.
Temperature. Registered values were within the temperature ranges recommended by Magerhans and Hörstgen-Schwark (28) for cultivating rainbow trout in the evaluated phase, which directly influenced the physiological processes such as growth and feed efficiency.
Dissolved oxygen. Oxygen consumption due to the biological processes of wastewater treatment was evident in the effluent from each of the reactors. The biofilters need oxygen for the heterotrophic bacteria, since 4.57 g of oxygen are required for each gram of ammonia nitrogen oxidized to nitrate nitrogen. Timmons and Ebeling (2) stated that levels of 2 mg/L of OD in the effluent biofilter are sufficient to maintain a maximum rate of nitrification.
5437Sánchez - Performance of different biofilters recirculating system
Probablemente las bacterias anammox en SRA están simultáneamente activas por las bacterias nitrificantes, las cuales han sido encontradas en ambientes naturales como artificiales. Esto podría significar que en los sistemas de acuacultura, las BOA o las arqueas oxidantes de amonio (AOA), convierten el amonio excretado por los peces, bajo condiciones óxicas en nitrito; este nitrito y el amonio adicional es luego usado por las bacterias anammox en partes anóxicas del reactor para formar gas nitrógeno, removiendo tanto nitrito como amonio del sistema sin la necesidad de la desnitrificación (31).
Nitritos. El tiempo de maduración de los inóculos en los biofiltros pudo ser un motivo del comportamiento similar de los reactores. Sin embargo, se observó que la remoción de nitrito fue diferente en cada bloque, lo que permite concluir que el lavado afectó la remoción de nitrito (Figura 5). La remoción de nitrito es atribuida a las bacterias oxidantes del nitrito –BON- (14), según Malone y Pfeiffer (10), la tasa de nitrificación puede ser controlada por las BON bajo determinadas condiciones. Se registraron algunos valores de eficiencia negativos, lo que sugiere prevalencia temporal de los procesos de nitrificación con relación a los de remoción del NH2
+. Las eficiencias de remoción promedio en los reactores oscilaron entre 8.9 y 45.2%, reportando un promedio global de eficiencia de 27.2%.
Nitratos. Cada reactor presentó diferente eficiencia en la remoción de nitratos, la cual fue afectada por el lavado de los reactores, principalmente en el R3 y R4. En ambos bloques el R5 presentó la mayor remoción de nitratos con 47.4 y 47.2% respectivamente, seguido en eficiencia del R6 (44.9 y 40.7% respectivamente); el R3 presentó la más baja eficiencia en el segundo bloque con un valor del 1.8%.
La eficiencia promedio global de remoción de nitratos fue de 32.3%. Ésta es una función que puede ser atribuida a las bacterias desnitrificantes, las cuales reducen el nitrato en gas dinitrógeno por las metaloenzimas nitrato reductasa, nitrito reductasa, reductasa del óxido nítrico y reductasa del óxido nitroso (31).
El lavado incidió en la eficiencia de remoción de nitrato pues fue mayor en el bloque 1, la función de las bacterias desnitrificantes se pudo afectar en el segundo bloque pues el lavado permitió mejor circulación de agua, la cual porta OD; esta explicación puede aplicarse al R3, al que se pudo haber realizado un lavado más agresivo propiciando la pérdida de la biopelícula a la que
Ammonium. The similarity in ammonium removal efficiency could be due to the ripening time of inoculum in the biofilters, which was insufficient to demonstrate the effects of each one. After washing, removal decreased; authors like Suhr and Pedersen (29) state that the removal rates of ammonia nitrogen in biofilters are highly dependent on environmental and operational parameters such as flow distribution and backwash regimes. Average removal values in reactors ranged from 2.8 to 7.9%, with an overall average of 4.7%. Removal is a main function of ammonia oxidizing bacteria under aerobic or anaerobic conditions. Malone and Pfeiffer (10) indicate that heterotrophic bacteria contribute to defining biofilm thickness.
Under anoxic conditions, the anaerobic oxidation of ammonium - anammox - allows the ammonium to be oxidized to nitrite, which produces molecular nitrogen and requires about 50% less oxygen compared with nitrification-denitrification processes (30). Anammox bacteria in RAS are probably simultaneously activated by nitrifying bacteria, which have been found in natural and artificial environments. This could mean that in aquaculture systems the BOA or ammonium oxidizing archaea (AOA) convert the ammonia excreted by fish under oxic conditions into nitrite. This nitrite and the additional ammonium is then used by anammox bacteria in anoxic reactor parts to form nitrogen gas, removing both nitrite as well as ammonium from the system without the need for denitrification (31).
Nitrites. The maturation time of inoculum in the biofilters could be a reason why there was similar behavior in the reactors. However, it was observed that nitrite removal was different in each block, which allows the conclusion that washing affected nitrite removal (Figure 5). Nitrite removal is attributed to nitrite oxidizing bacteria – BON (14), and according Malone and Pfeiffer (10) BON can control the nitrification rate under certain conditions. Some negative efficiency values were recorded, suggesting a temporary prevalence of nitrification in relation to removal of NH2
+. Average removal efficiencies in the reactors ranged between 8.9 and 45.2%, reporting an overall average efficiency of 27.2%.
Nitrates. Each reactor had a different nitrate removal efficiency, which was affected by washing the reactors, mainly in R3 and R4. In both blocks R5 had the highest nitrate removal at 47.4 and 47.2% respectively, followed by R6 (44.9 and 40.7% respectively). R3 presented the lowest efficiency in the second block with a value of 1.8%.
The overall average nitrate removal efficiency was 32.3%. This can be attributed to denitrifying
5438 REVISTA MVZ CÓRDOBA • Volumen 21(2) Mayo - Agosto 2016
se encontraba incorporada esta comunidad de bacterias.
Sólidos Suspendidos. Hubo diferencias significativas para remoción de SS entre reactores (Tabla 3). Los resultados obtenidos con la prueba LSD indican que los reactores R1 y R4 se comportaron de manera similar pero difirieron con respecto a R3 (Figura 7). Los SS fueron eficientemente removidos, por su retención en los filtros y por la descomposición de la MO propiciada por los microorganismos; el reactor R3 presentó el mejor desempeño con una eficiencia media de 58.2%. En términos generales, las eficiencias de remoción en los bloques oscilaron entre el 1.9 y el 81.9% con remoción media total del 37.5%, dichos valores se encuentran dentro de los rangos reportados tanto para filtros percoladores (32) como para biofiltros aireados sumergidos (33).
Los biofiltros evaluados fueron sensibles a la colmatación del medio filtrante, pues el taponamiento de los intersticios alteró el funcionamiento hidráulico, principalmente en el control de los TRH. El lavado de los filtros es un mecanismo de remoción válido de los sólidos que taponan los reactores; sin embargo, es un factor perturbador de su desempeño pues afecta la eficiencia del tratamiento del agua desde el punto de vista biológico.
No hubo diferencias entre los reactores en cuanto a la remoción del amonio y de los nitritos; el lavado de los biofiltros afectó el desempeño de los tratamientos.
Se presentaron diferencias estadísticamente significativas en la remoción de nitratos, demostrando un mejor desempeño los reactores R5 y R6, con eficiencias medias que superaron al 42%.
Finalmente, se puede concluir que el mejor reactor en términos de la remoción de las diversas formas de nitrógeno fue el reactor inoculado con lodos de la laguna aireada del Relleno Sanitario Antanas.
Agradecimientos
Al Departamento de Recursos Hidrobiológicos de la Universidad de Nariño, Empresa Municipal de Aseo de Pasto EMAS, Profesor Marco Antonio Imuez Figueroa, Estudiantes del Programa Ingeniería en Producción Acuícola: María Fernanda Montenegro, Jessica Hernández y Danilo Duarte.
bacteria that reduce nitrate to dinitrogen gas, metalloenzymes nitrate reductase, nitrite reductase, nitric oxide reductase and nitrous oxide reductase (31).
Washing affected nitrate removal efficiency since it higher in Block 1, the function of denitrifying bacteria might have affected the second block since washing improved water circulation, which carries OD. This explanation can be applied to R3, which could have been more aggressively washed and caused a loss of biofilm where this community of bacteria was found.
Suspended solids. There were significant SS removal differences between reactors (Table 3). The results obtained with the LSD test indicate that R1 and R4 reactors behaved similarly but differ from R3 (Figure 7). SS were efficiently removed, retained by the filters and due to MO decomposition due to microorganisms. Reactor R3 had the best performance with an average efficiency of 58.2%. Overall, removal efficiencies in the blocks ranged between 1.9 and 81.9% with average total removal of 37.5%. These values are within the ranges reported for both trickling filters (32) and submerged aerated biofilters (33).
The filters of the evaluated biofilters clogged often, since plugging interstices altered hydraulic operation, mainly in TRH control. Filter washing is a valid solid removal mechanism that clogs the reactor; however, it is a disturbing factor because it affects the performance efficiency of water treatment from a biological point of view.
There were no differences between the reactors concerning the removal of ammonia and nitrites; washing the biofilter affected the performance of treatments.
Statistically significant differences in nitrate removal were presented, with reactors R5 and R6 showing a better performance, with average efficiency exceeding 42%.
Finally, it can be concluded that the best reactor in terms of removal of various forms of nitrogen was the reactor inoculated with sludge from the aerated Antanas Landfill lagoon.
Acknowledgments
To the Department of Hydrobiological Resources of the Universidad de Nariño, Empresa Municipal de Aseo de Pasto EMAS, Professor Marco Antonio Imuez Figueroa, and students of the Aquaculture Production Engineering Program: María Fernanda Montenegro, Jessica Hernández and Danilo Duarte.

5439Sánchez - Performance of different biofilters recirculating system
REFERENCES
1. Ministerio de Agricultura y Desarrollo Rural. Agenda prospectiva de investigación y desarrollo tecnológico para la cadena productiva de la trucha arcoíris en el departamento de Antioquia. Bogotá, D.C., Colombia: Giro Editores Ltda; 2010.
2. Timmons MB, Ebeling JM. Recirculating Aquacul ture. 2nd ed. I thaca, NY: Northeastern Regional Aquaculture Center; 2010.
3. Summerfelt S, Davidson J, Waldrop T, Tsukuda S, Bebak-Williams J. A partial-reuse system for coldwater aquaculture. Aquacult Eng 2004; 31:157-181.
4. Summerfelt S, Sharrer M, Gearheart M, Gillette K, Vinci B. Evaluation of partial water reuse systems used for Atlantic salmon smolt production at the White River National Fish Hatchery. Aquacult Eng 2009; 41:78-84.
5. Liu Y, Huang Z, Song X, Lei J, Peng L, Liu B. Structure optimization of CycloBio fluidized sand biofilters based on numerical simulation. Aquacult Eng 2015; 69:18–22.
6. Tsukuda S, Christianson L, Kolb A, Saito K, Summerfelt S. Heterotrophic denitrification of aquaculture effluent using fluidized sand biofilters. Aquacult Eng 2015; 64:49–59.
7. Gutierrez-Wing MT, Malone RF. Biological filters in aquaculture: Trends and research directions for freshwater and marine applications. Aquacult Eng 2006; 34:163-171.
8. Pedersen L-F, Suhr KI, Dalsgaard J, Pedersen PB, Arvin E. Effects of feed loading on nitrogen balances and fish performance in replicated recirculating aquaculture systems. Aquaculture 2012; 338-341: 237-245.
9. Davidson J, Good C, Welsh C, Summerfelt S. The effects of ozone and water Exchange rates on water quality and rainbow trout Oncorhynchus mykiss performance in replicated water reuse systems. Aquacult Eng 2011; 44: 80-96.
10. Malone RF, Pfeiffer TJ. Rating fixed film nitrifying biofilters used in recirculating aquaculture systems. Aquacult Eng 2006; 34(3):389–402.
11. Pedersen L, Oosterveld R, Pedersen P. Nitrification performance and robustness of fixed and moving bed biofilters having identical carrier elements. Aquacult Eng 2015; 65:37–45.
12. Wik TEI, Lindén BT, Wramner PI. Integrated dynamic aquaculture and wastewater treatment modelling for recirculating aquaculture systems. Aquaculture 2009; 287:361-370.
13. Crab R, Avnimelech Y, Defoirdt T, Bossier P, Verstraete W. Nitrogen removal techniques in aquaculture for a sustainable production. Aquaculture 2007; 270(1-4):1-14.
14. Schreier HJ, Mirzoyan N, Saito K. Microbial diversity of biological filters in recirculating aquaculture systems. Curr Opin Biotech 2010; 21:318-325.
15. Brockmann D, Morgenroth E. Evaluating operating conditions for outcompeting nitrite oxidizers and maintaining partial nitrification in biofilm systems using biofilm modeling and Monte Carlo filtering. Water Res 2010; 44:1995-2009.
16. American Public Health Association (APHA), American Water Works Association (AWWA), Water Environment Federation (WEF). Standard Methods for the Examination of Water and Wastewater. 20 ed. Washington, D.C.; American Public Health Association: 1998.
17. Shi XY, Yu HQ, Sun YJ, Huang X. Characteristics of aerobic granules rich in autotrophic ammonium-oxidizing bacteria in a sequencing batch reactor. Chem Eng J 2009; 147:102-109.
18. Molinuevo B, García MC, Karakashev D, Angelidaki I. Anammox for ammonia removal from pig manure effluents: Effect of organic matter content on process performance. Bioresource Technol 2009; 100:2171-2175.
19. Thabet OBD, Bouallagui H, Cayol J-L, Ollivier B, Fardeau M-L, Hamdi M. Anaerobic degradation of landfill leachate using an upflow anaerobic fixed-bed reactor with microbial sulfate reduction. J Hazard Mater 2009; 167:1133-1140.

5440 REVISTA MVZ CÓRDOBA • Volumen 21(2) Mayo - Agosto 2016
28. Magerhans A, Hörstgen-Schwark G. Selection experiments to alter the sex ratio in rainbow trout (Oncorhynchus mykiss) by means of temperature treatment. Aquaculture 2010; 306:63–67.
29. Suhr K, Pedersen P. Nitrification in moving bed and fixed bed biofilters treating effluent water from a large commercial outdoor rainbow trout RAS. Aquacult Eng 2010; 42:31–37
30. Van Kessel MAHJ, Harhangi HR, Van de Pas-Schoonen K, Van De Vossenberg J, Flik G, Jetten MSM, Klaren PHM, Op Den Camp HJM. Biodiversity of N-cycle bacteria in nitrogen removing moving bed bifilters for freshwater recirculating aquaculture systems. Aquaculture 2010; 306: 177-184.
31. Krishnani KK. Detection and diversity of nitrifying and denitrifying functional genes in coastal aquaculture. Aquaculture 2010; 302: 57-70.
32. Spellman FR. Handbook of water and wastewater treatment plant operators. Second edition. Boca Raton, USA: CRC Press; 2009.
33. Von Sperling M. Introducción a la calidad del agua y al tratamiento de aguas residuales - Principios del tratamiento biológico de aguas residuales, Vol. 1. 1ª edición en español. Pasto, Colombia: Editorial Universitaria Universidad de Nariño; 2012.
20. Das BM. Fundamentos de engenharia geotécnica. São Paulo, Brasil: Cengage Learning; 2011.
21. Lekang OI. Aquaculture Engineering. Oxford: Blackwell Publishing; 2007.
22. Good C, Davidson J, Welsh C, Brazil B, Snekvik K, Summerfelt S. The impact of water exchange rate on the health and performance of rainbow trout Oncorhynchus mykiss in water recirculation aquaculture systems. Aquaculture 2009; 294:80-85.
23. Mocanu M, Cristea V, Dediu L, Desimira D, Docan A, Ionescu T. The influence of different stocking densities on growth performances of oncorhynchus mykiss (Walbaum, 1792) in a recirculating aquaculture system. Lucrări Ştiinţifice - Seria Zootehnie 2011; 56:326-331.
24. d’Orbcastel ER, Person-Le Ruyet J, Le Bayon N, Blancheton JP. Comparative growth and welfare in rainbow trout reared in recirculating and flow through rearing systems. Aquacult Eng 2009; 40:79–86.
25. van Rijn J. Waste treatment in recirculating aquaculture systems. Aquacult Eng 2013; 53:49–56.
26. Fracalossi DM, Cyrino JE. Nutriaqua: Nutrição e alimentação de espécies de interesse para a aquicultura Brasileira. Florianópolis, Brasil: Sociedade Brasileira de Aquicultura e Biologia Aquática; 2013.
27. Rusten B, Eikebrokk B, Ulgenes Y, Lygren E. Design and operations of the kaldnes moving bed biofilm reactors. Aquacult Eng 2006; 34:322-331.