the evaluation of fourier transform infrared spectroscopy
TRANSCRIPT

The evaluation of Fourier transform infrared spectroscopy (FT-IR) for the determination of
total phenolics and total anthocyanins concentrations of
grapes
by
Elana Lochner
Thesis presented for the degree of Master of Science in Agriculture at Stellenbosch University.
April 2006
Supervisor: Prof M.G. Lambrechts
Co-supervisor:
Dr H.H. Nieuwoudt

DECLARATION
I, the undersigned, hereby declare that the work contained in this thesis is my own original work and that I have not previously in its entirety or in part submitted it at any university for a degree.
____________________ ________________
Elana Lochner Date

SUMMARY The assessments of grape and wine quality are complex issues and the wine industry needs more objective analysis of grape and wine quality. The standard quality assessment protocol for grading grapes at most wine cellars in South Africa is based on viticultural practices and the determination of chemical parameters such as ºBrix, pH and titratable acidity (TA). Grape juice indices calculated by formulae such as ºBrix/pH, TA/pH, ºBrix/TA, ºBrix x (pH)2 have been used in the past but these approaches have had limited success. It was shown that the total anthocyanins and total phenolics of red grapes correlate with wine quality and provide additional objective measures of grape quality. Most methods for the quantification of total anthocyanins and total phenolics are complex and time consuming and therefore not easily implemented in the routine laboratory environment. Fourier transform infrared spectroscopy (FT-IR) is widely used in South African laboratories for the routine quantification of wine and grape parameters but the commercial calibration models supplied for the quantification of grape total anthocyanins and phenolics are not satisfactory. The focus of this study was to develop new FT-IR calibration models for the quantification of total anthocyanins and phenolics of grapes and to use the generated data during a preliminary evaluation of the implementation of these parameters as part of the grape quality control protocol at a commercial winery in South Africa. The potential of Fourier transform infrared spectroscopy (FT-IR) for the rapid quantification of total anthocyanins and total phenolics in red grapes was investigated and evaluated for prediction accuracy with independent validation sets. The design of calibration sets aimed at capturing most of the variation due to vintage (2004 and 2005), cultivar (Cabernet Sauvignon, Merlot, Pinotage, and Shiraz) and sugar concentration. Best prediction accuracies were obtained for calibration sets using grapes from a single vintage or cultivar or approximately the same sugar concentration. The highest prediction accuracies were obtained for total anthocyanins calibration sets of grapes with sugar concentrations ≥ 23.5ºBrix (SEP = 0.13 mg/g; R2 validation set = 0.77) and for total phenolics calibration sets of grapes with sugar concentrations < 23.5ºBrix (SEP = 0.13 OD280/g; R2 validation set = 0.74). Strong correlations were found between the spectral data and the total anthocyanins (SEP = 0.12 mg/g; R2 validation set = 0.84) and total phenolics concentration data (SEP = 0.10 OD280/g; R2 validation set = 0.76) for 2005 Merlot calibration sets indicating that the FT-IR spectra captured most of the variation. Overall the RPD (ratio of the standard deviation of the reference data to the standard error of prediction) values of all calibration models were below 3 indicating that calibration models are fit for screening purposes. Spectroscopic absorbance at 280 nm is not specific enough for the quantification of total phenolics and the use of an alternative reference method such as high performance liquid chromatography (HPLC) will be considered in the future. Principal component analysis (PCA) revealed that the major sources of variation in the FT-IR spectra of grapes could be ascribed to vintage and grape sugar concentration

and this had an effect on the accuracy of the analytical data generated when using FT-IR spectroscopy. This report is the first to our knowledge where FT-IR has been used for the quantification of total anthocyanins and phenolics of grapes. The evaluation of the reference laboratory protocol for the quantification of total anthocyanins and total phenolics in grapes were evaluated in Chapter 4 and emphasized the importance of meticulous laboratory practices to obtain reliable reference data for calibration purposes. This large scale investigation of the total anthocyanins and phenolics concentrations in grapes is the first of its kind in South Africa and a quantitative database containing analytical data of the anthocyanins and total phenolics concentrations of 692 grape samples representing a wide range of grape maturities of Vitis vinifera cultivars Cabernet Sauvignon, Merlot, Pinotage and Shiraz from the 2004 and 2005 vintages was established based on the reference values. The data were used in a preliminary investigation of the implementation of total anthocyanins and total phenolics concentrations as part of grape quality classification at a commercial South African winery (Chapter 5). The results showed that the total anthocyanins and total phenolics concentration in grapes increased with increasing grape maturity (measured as sugar concentration). ANOVA and post-hoc analysis (Bonferroni testing) revealed significant differences between the total anthocyanins and total phenolics concentrations of the four Vitis vinifera cultivars investigated. Grapes harvested earlier in the season had significantly higher (p≤0.05) total anthocyanins and total phenolics concentrations than grapes harvested later in the season. This implies that grapes harvested earlier in the harvest season could produce wines with higher quality. Grapes from regularly irrigated vineyards had lower total anthocyanins and total phenolics concentrations compared to dryland vineyards. The current grape grading system in use at the industrial cellar did not correlate well with the total anthocyanins and total phenolics concentrations of grapes which highlighted the need for the inclusion of more objective measures during grape grading. The information captured in the database can be used as a starting point to establish profiles of the typical anthocyanins and total phenolics of South African grapes and data from more vintages should be included and continually updated. These findings highlight the important contribution of the results obtained in this preliminary study for the incorporation of total anthocyanins and phenolics concentrations as objective parameters of grape quality. Finally multivariate data analysis of the FT-IR spectra revealed important information regarding factors (both physical and chemical) that contribute to the variation of the spectra. The main variation between the 2004 and 2005 samples can probably be interpreted in terms of the water content of the samples.

OPSOMMING Die bepaling van druif en wynkwaliteit is kompleks en die wynindustrie benodig meer objektiewe analysis om druif en wynkwaliteit te bepaal. Die standaard druifkwaliteit graderings protokol by meeste wynkelders in Suid-Afrika is gebasseer op wingerdkundige praktyke en die bepaling van chemise parameters soos ºBrix, pH en titreerbare suur (TS). Druifsap indekse bereken deur formules soos ºBrix/pH, TS/pH, ºBrix/TS en ºBrix x (pH)2 is al in die verlede gebruik, maar hierdie metodes het beperkte sukses getoon. Dit is bewys dat die totale antosianiene en totale fenole konsentrasies van rooi druiwe korreleer met wynkwaliteit en dat dit twee addisionele objektiewe meetings van druifkwaliteit is. Meeste metodes vir die kwantifisering van totale antosianiene en totale fenole is egter kompleks en tydrowend en kan daarom nie maklik implementer word in die roetine laboratorium omgewing nie. Fourier transform infrarooi spektroskopie (FT-IR) word redelik algemeen gebruik in Suid-Afrikaanse laboratoriums vir die kwantifisering van wyn en druif parameters. Die kommersiële kalibrasie modelle vir die kwantifisering van totale antosianiene en totale fenole van druiwe is nie bevredigend nie. Die fokus van hierdie studie was om nuwe FT-IR kalibrasie modelle te ontwikkel vir die kwantifisering van totale antosianiene en totale fenole van druiwe en om die gegenereerde data te gebruik tydens ‘n voorlopige evaluasie van die implementering van hierdie parameters as deel van die druifkwaliteits kontrole protokol by ‘n kommersiële wynkelder in Suid-Afrika. Die potensiaal van Fourier transform infrarooi spektroskopie (FT-IR) as ‘n vinnige metode vir die kwantifisering van totale antosianiene en totale fenole in rooi druiwe is ondersoek. Die prediksie akkuraatheid van kalibrasie modelle is bepaal met onafhanklike validasie stelle. Kalibrasie stelle is ontwerp om die meeste variasie toegeskryf aan oesjaar (2004 en 2005), kultivar (Cabernet Sauvignon, Merlot, Pinotage, en Shiraz) en suikerkonsentrasie in te sluit. Die beste prediksie akkuraatheid is verkry vir kalibrasiestelle wat druiwe ingesluit het van ‘n enkele oesjaar of kultivar of druiwe van ongeveer dieselfde suikerkonsentrasie. Die hoogste prediksie akkuraatheid is verkry vir totale antosianiene kalibrasiestelle wat druiwe ingesluit het met totale suikerkonsentrasies ≥ 23.5ºBrix (SEP = 0.13 mg/g; R2 validasiestel = 0.77) en vir totale fenole kalibrasiestelle wat druiwe ingesluit het met suikerkonsentrasies <23.5ºBrix (SEP = 0.13 OD280/g; R2 validasiestel = 0.74). Goeie korrelasies is gevind tussen die spektrale data en die totale antosianiene (SEP = 0.12 mg/g; R2 validasiestel = 0.84) en totale fenole konsentrasies data (SEP = 0.10 OD280/g; R2 validasiestel = 0.76) vir 2005 Merlot kalibrasiestelle wat aandui dat die FT-IR spektra meeste van die variasie ingesluit het. Oor die algemeen was die ratios van die standaard afwykings van die verwysingsdata tot die standaard foute van prediksies (RPD) waardes van al die kalibrasiestelle minder as 3 wat aandui dat die kalibrasiemodelle geskik is vir sifting. Spektroskopiese absorbansie by 280 nm is nie spesifiek genoeg vir die kwantifisering van totale fenole nie en die gebruik van ‘n alternatiewe verwysingsmetode soos hoë druk vloeistof chromatografie sal oorweeg word in die toekoms. Hoofkomponent

analise het getoon dat die belangrikste bron van variasie binne FT-IR spektra van druiwe die oesjaar en suikerkonsentrasies van druiwe was en dat dit moontlik ‘n effek kon hê op die akkuraatheid van die analitiese data gegenereer toe FT-IR spektroskopie gebruik is. Hierdie verslag is die eerste waarvan ons weet waar FT-IR gebruik is vir die kwantifisering van totale antosianiene en totale fenole konsentrasies van druiwe. Die evaluasie van die verwysingsmetode laboratorium protokol vir die kwantifisering van die totale antosianiene en totale fenole konsentrasies in druiwe is geevalueer soos beskryf in Hoofstuk 4 en het die belangrikheid van akkurate laboratorium praktyke benadruk om sodoende betroubare data vir kalibrasie doeleindes te verkry. Hierdie grootskaalse ondersoek van die totale antosianiene en totale fenole konsentrasies in druiwe is die eerste van sy soort in Suid-Afrika. ‘n Kwantitatiewe databasis is geskep wat die analitiese data van die totale antosianiene en totale fenole konsentrasies van 692 monsters van die Vitis vinifera kultivars Cabernet Sauvignon, Merlot, Pinotage en Shiraz bevat van ‘n wye reeks rypheidsvlakke van die 2004 en 2005 oesjare. Die data is gebruik in ‘n voorlopige ondersoek van die implementering van totale antosianiene en totale fenole konsentrasies as deel van druifkwaliteits klassifikasie by ‘n kommersiële wynkelder in Suid-Afrika (Hoofstuk 5). Die resultate het getoon dat die totale antosianiene en totale fenole konsentrasies in druiwe toegeneem het met toenemende rypheid van druiwe (gemeet as suikerkonsentrasie). ANOVA en post-hoc toetse (Bonferroni toetsing) het getoon dat daar beduidende verskille tussen die totale antosianiene en totale fenole konsentrasies van die vier Vitis vinifera kultivars ondersoek is. Druiwe wat vroeër in die parsseisoen geoes is het beduidend hoër (p≤0.05) totale antosianiene en totale fenole konsentrasies gehad as druiwe wat later in die parsseisoen geoes is. Dit impliseer dat druiwe wat vroeër in die parsseisoen geoes word wyne van hoër kwaliteit kan lewer. Druiwe van wingerde wat gereeld besproei is het laer totale antosianiene en totale fenole konsentrasies in vergelyking met druiwe vanaf droëland wingerde gehad. Die huidige druifgraderingsisteem in gebruik by ‘n industriële kelder het nie gekorreleer met die totale antosianiene en totale fenole konsentrasies van druiwe nie. Dit het die behoefte beklemtoon vir die insluiting van meer objektiewe meetings gedurende druifgradering. Die informasie ingesluit in die databasis kan gebruik word as ‘n vertrekpunt om die tipiese totale antosianiene en totale fenole profiele van Suid-Afrikaanse druiwe te bepaal en data van meer oesjare moet ingesluit word en deurlopend opdateer word. Hierdie bevindinge het die belang beklemtoon vir die insluiting van totale antosianiene en totale fenole konsentrasies as objektiewe parameters van druifkwaliteit. Uiteindelik het meervariate data analise van die FT-IR spektra belangrike inligting getoon aangaande faktore (beide fisies en chemise) wat bygedra het tot die variasie van die spektra. Die belangrikste variasie tussen die 2004 en 2005 monsters kan moontlik toegeskryf word aan die waterinhoud van die monsters.

ACKNOWLEDGEMENTS I wish to express my sincere gratitude and appreciation to the following persons and institutions: Prof Marius Lambrechts, my study leader and senior research manager at Distell, South Africa, who provided the opportunity for this research project and changed the course of my future. Thank you for the belief in my abilities, immeasurable support, guidance, suggestions and input throughout this study. Dr Hélène Nieuwoudt, Institute for Wine Biotechnology, Department of Viticulture and Enology, Stellenbosch University, my co-study leader for her guidance, encouragement, suggestions and positive criticism. A special word of thanks for introducing me to the field of Fourier transform infrared spectroscopy and the generous sharing of expertise. Distell, South Africa for financial support, the supplying of samples and unrestricted use of laboratory facilities, especially the use of the Foss WineScan FT 120 instrument. Riël Tredoux, research oenologist, needs special mentioning for his interest in the project, help with the solving of logistical problems and the sharing of data and information. Dr Martin Kidd, Centre of Statistical Consultation, Stellenbosch University for his help with statistical analyses of data throughout the course of this study. Mark van der Walt, Rhine Ruhr Pty (Ltd) Johannesburg, South Africa for assistance with the Foss WineScan FT120 instrument and software. Foss Analytical Hillerød, Denmark, particularly in the person of Max Egebo for support regarding multivariate analysis and software applications. The National Research Foundation as well as Winetech, for financial support. My husband Hein, who supported me unconditionally and made countless selfless sacrifices. Thank you. You raise me up to more than I can be. My parents, sister and in-laws for their unwavering support and encouragement. I am blessed to celebrate life with you. My friend, Fanie Serfontein, who flew halfway around the world to support me. The Almighty, who renders the significant insignificant and the insignificant significant.

This thesis is dedicated to my husband and family for their love and continuous support. You bless my life in countless ways.
Hierdie tesis word opgedra aan my man en familie vir hul liefde en volgehoue
ondersteuning. Julle seën my lewe op ontelbare wyses.

PREFACE This thesis is presented as a compilation of six chapters. Each chapter is introduced separately and Chapter 3 will be submitted for publication. Chapter 1 GENERAL INTRODUCTION AND PROJECT AIMS Chapter 2 LITERATURE REVIEW The importance of phenolic compounds associated with the colour of red
grapes and wine Chapter 3 RESEARCH RESULTS The evaluation of Fourier transform infrared spectroscopy (FT-IR) for the
quantification of total anthocyanins and total phenolics in grapes Chapter 4 RESEARCH RESULTS The evaluation of the reference analysis method protocol for the
determination of total anthocyanins and total phenolics in grapes Chapter 5 RESEARCH RESULTS The evaluation of the possibility to implement grape total anthocyanins and
total phenolics analyses at a commercial South African winery – a preliminary study
Chapter 6 GENERAL DISCUSSION AND CONCLUSIONS Appendix 1 CHEMICAL COMPONENT DATA

CONTENTS
CHAPTER 1. GENERAL INTRODUCTION AND PROJECT AIMS 1
1.1 INTRODUCTION 2 1.2 PROJECT AIMS AND RESEARCH STRATEGIES 2 1.2.1 The evaluation of the reference analysis method protocol for the determination
of total anthocyanins and total phenolics in grapes 1.2.2 The evaluation of Fourier transform infrared spectroscopy (FT-IR) for the routine
analysis of total anthocyanins and total phenolics concentrations in grapes 4 1.2.3 The establishment of a database 4 1.2.4 The evaluation of the possibility to implement total anthocyanins and total
phenolics concentrations analyses as part of grape quality classification at a commercial winery 4
1.3 LITERATURE CITED 5
CHAPTER 2. LITERATURE REVIEW 7
2.1 INTRODUCTION 8 2.2 PHENOLIC COMPOUNDS IN RED GRAPES AND WINE 8 2.2.1 Flavonoids 10 2.2.1.1 Anthocyanins 10 2.2.1.2 Flavanols 10 2.2.1.3 Flavonols 12 2.2.1.4 Tannins 12 2.2.2 Non-flavonoids 13 2.2.2.1 Phenolic acids 13 2.2.2.2 Stilbenes 13 2.3 FACTORS INFLUENCING THE COLOUR OF ANTHOCYANINS 14 2.3.1 pH dependent anthocyanin colour equilibrium 14 2.3.2 Copigmentation reactions 14 2.3.2.1 Intermolecular copigmentation 16 2.3.2.2 Intramolecular copigmentation 16 2.3.3 Self-association of anthocyanins 16 2.3.4 Acetaldehyde mediated polymerisation reactions 17 2.3.5 Oxidative degradation of phenolic compounds 18 2.4 THE DEVELOPMENT OF ANTHOCYANINS AND TANNINS DURING RIPENING 19 2.4.1 Anthocyanins 20 2.4.2 Tannins 20 2.5 THE ANTHOCYANIN BIOSYNTHETIC PATHWAY 20

2.5.1 Phenylalanine ammonia lyase (PAL) 21 2.5.2 UDP glucose-flavonoid 3-o-glucosyl transferase (UFGT) 22 2.6 VITICULTURAL FACTORS INFLUENCING THE PHENOLIC COMPOSITION OF GRAPES AND WINES 22 2.6.1 Irrigation 22 2.6.2 Light exposure 23 2.6.3 Berry temperature 24 2.6.4 Berry volume 25 2.6.5 Sanitary state 25 2.7. WINEMAKING PRACTICES INFLUENCING THE PHENOLIC COMPOSITION OF WINES 25 2.7.1 Grape processing 27 2.7.2 Maceration time 27 2.7.3 Fermentation temperature 27 2.7.4 Pump-over operation and pressing 28 2.7.5 Enzymes 28 2.7.6 Sulphur dioxide 29 2.7.7 Fining treatments 29 2.8 ANALYTICAL TECHNIQUES FOR THE QUANTIFICATION OF PHENOLIC COMPOUNDS (RELATED TO COLOUR) IN GRAPE JUICE, MUST AND WINE 30 2.8.1 Absorbance measurements 30 2.8.1.1 Spectrophotometric indices 30 2.8.1.2 Folin-Ciocalteu value 31 2.8.1.3 OD280 value 31 2.8.1.4 The Iland method for total anthocyanins and total phenolics in wine 31 2.8.1.5 The Iland method for total anthocyanins and total phenolics of grapes 31 2.8.1.6 Glories method for measuring phenolic maturity of grapes 32 2.8.2 Chromatographic methods 32 2.8.3 XYZ tristimulus values 33 2.8.4 CIELAB colour space 33 2.8.5 Infrared spectroscopy 34 2.8.5.1 Theory 34 2.8.5.2 Instrumentation 35 2.8.5.3 Chemometrics 36 2.8.5.4 Applications of infrared spectroscopy for grape and wine analyses 36 2.9 CONCLUSIONS 37 2.10 LITERATURE CITED 37

CHAPTER 3. THE EVALUATION OF FOURIER TRANSFORM INFRARED (FT-IR) SPECTROSCOPY FOR THE QUANTIFICATION OF TOTAL ANTHOCYANINS AND TOTAL PHENOLICS OF GRAPES 48
3.1 INTRODUCTION 49 3.2 MATERIALS AND METHODS 51 3.2.1 Grape sampling, storage and sample preparation 51 3.2.2 Laboratory analyses 52 3.2.2.1 Total anthocyanins and total phenolics analyses 52
3.2.2.2 The evaluation of the effects of the use of filterpapers with different cross-sections on Fourier transform infrared (FT-IR) spectral measurements 52
3.2.2.3 Fourier transform infrared (FT-IR) spectral measurements 53 3.2.2.4 Determination of °Brix, pH and titratable acidity 53 3.2.3 Statistical analyses 54 3.2.3.1 Statistical equations used for the processing of analytical data 54 3.2.3.2 One-way analysis of variance (ANOVA) and post-hoc analysis 55 3.2.3.3 Principal component analysis (PCA) 55 3.2.3.4 Identification and classification of spectral outlier samples 55 3.2.4 Calibration procedures 55 3.2.4.1 Calibration set design 55 3.2.4.2 Partial Least Squares Regression (PLS) 56 3.2.4.3 Wavenumber selection 56 3.2.4.4 Assessment of the performance of calibration sets 58 3.3 RESULTS AND DISCUSSION 58 3.3.1 Grape samples and reference laboratory analysis 58 3.3.1.1 The evaluation of the effects of sample storage temperature on total anthocyanins and total phenolics concentrations 58 3.3.1.2 Repeatability of the reference laboratory method 59 3.3.1.3 Standard error of laboratory (SEL) 59 3.3.1.4 The evaluation of the effects of the use of filterpapers with different cross-sections on FT-IR analysis results 60 3.3.1.5 Descriptive statistics of all samples 60 3.3.2 Analysis of Fourier transform infrared (FT-IR) spectra 61 3.3.3 PCA modelling 61 3.3.4 The evaluation of the effects of calibration set design for prediction of total anthocyanins in grape homogenates 67 3.3.5 The evaluation of the influence of cultivars on calibration set design for total anthocyanins in grape homogenates 71 3.3.6 The evaluation of the effects of calibration set design for prediction of total phenolics in grape homogenates 74

3.3.7 The evaluation of the influence of cultivars on calibration set design for total phenolics in grape homogenates 78 3.4 CONCLUSIONS 80 3.5 LITERATURE CITED 81
CHAPTER 4. THE EVALUATION OF THE REFERENCE PROTOCOL FOR THE DETERMINATION OF TOTAL ANTHOCYANINS AND TOTAL PHENOLICS IN GRAPES 83
4.1 INTRODUCTION 84 7.2 EVALUATION OF REFERENCE PROTOCOL EXTRACTIONS 84 4.3 DETERMINATION OF THE REPEATABILITY OF REFERENCE LABORATORY ANALYSIS 85 4.4 EXCLUSION OF SAMPLES WITH POOR REPEATABILITY FROM DATA SETS 87 4.5 DETERMINATION OF THE STANDARD ERROR OF LABORATORY (SEL) 88 4.6 CONCLUSIONS 89 4.7 LITERATURE CITED 89
CHAPTER 5. THE IMPLEMENTATION OF GRAPE ANTHOCYANINS AND TOTAL PHENOLICS ANALYSES AT A COMMERCIAL WINERY IN SOUTH AFRICA – A PRELIMINARY STUDY 90
5.1 INTRODUCTION 91 5.2 MATERIALS AND METHODS 93 5.2.1 Grape samples and homogenate preparation 93 5.2.2 Quantification of total anthocyanins and total phenolics 93 5.2.3 Determination of sugar, pH, titratable acidity, tartaric acid, malic acid and potassium 93 5.2.4 Statistical analysis 94 5.2.4.1 Statistical equations 95 5.2.4.2 One-way analysis of variance (ANOVA) and post-hoc analysis 94 5.2.4.3 Multivariate data analysis 94 5.3 RESULTS AND DISCUSSION 95 5.3.1 Origin of grape samples 95 5.3.2 Relationships between total anthocyanins, total phenolics and conventional grape chemical parameters 95 5.3.3 Grape analysis results 100 5.3.3.1 Distribution of grape chemical parameters in relation to sugar concentration 100 5.3.3.2 Distribution of grape chemical parameters in Vitis vinifera cultivars 102 5.3.3.3 The effects of time of maturity and harvest on grape chemical

parameters 103 5.3.3.4 The effects of irrigation on the total anthocyanins and total phenolics concentrations of grapes 107 5.3.3.5 Evaluation of the relationships between total anthocyanins, total phenolics and current viticultural block grading 108 5.3.3.6 A comparison of grape chemical parameters of areas within the Stellenbosch region 109 5.4 CONCLUSIONS 112 5.5 LITERATURE CITED 113
CHAPTER 6. GENERAL DISCUSSION AND CONCLUSIONS 114
6.1 CONCLUDING REMARKS AND PERSPECTIVES 115 6.2 LITERATURE CITED 117
APPENDIX 1. CHEMICAL COMPONENT DATA 118

CHAPTER 1
GENERAL INTRODUCTION AND PROJECT AIMS

2
GENERAL INTRODUCTION AND PROJECT AIMS
1.1 INTRODUCTION
The opening of the international markets to the South African economy in 1994 placed pressure on the local wine industry to change from a production driven to a market orientated industry. In such an environment consumers demand different wine styles of consistent quality. To fulfil this consumer requirement objective measurements of grape quality in order to produce wines of consistent quality are of utmost importance. There are a number of possibilities available to the producer to assess the quality of grapes. An assessment of vineyard characteristics on standardised scorecards might include: fruit yield to pruning weight, balance between crop load and canopy capacity, uniformity of ripening, vine vigour, grape sunburn, sanitary state and observable berry characteristics (size, seeds, colour, taste) (Dry et al., 2004; Francis et al., 2004). Chemical measurements, such as total soluble solids, pH and titratable acidity are also used to assess grape quality. Grape juice indices such as ºBrix/pH, TA/pH, ºBrix/TA, ºBrix x (pH)2 (Du Plessis and Van Rooyen, 1982) have been developed but has had limited success. Due to the need for improved grape quality indicators research has focussed on the phenolic compounds in the case of red grapes. Phenolic compounds are associated with sensory sensations such as colour, flavour, astringency, bitterness and hardness of grapes and wine (Somers, 1971; Noble, 1994; Gawel, 1998). Phenolic compounds are located primarily in the skins and seeds of grape berries. Grape and wine phenolic composition is influenced by numerous factors including grape cultivar, vineyard location, viticultural practices and winemaking techniques. Phenolic compounds are divided into flavonoid and non-flavonoid phenols based on their chemical structure. Tannins, types of flavonoid species, are associated with the astringency and mouth-feel sensory sensation of red wine (Herderich and Smith, 2005). It is widely speculated that wine tannins are correlated to red wine quality (Herderich et al., 2004). Anthocyanins, another group of flavonoids, are associated with the red colour of grapes and wine (Singleton and Esau, 1969). Wine colour is a very important aspect of its perceived quality. Research has shown that red wine colour intensity is related to the colour intensity of the grapes used for its production. Deeper coloured red grapes normally produce deeper coloured red wines (Iland, 1987; Francis et al., 1999) with more intense aroma and better wine quality (Marais and October, 2005). Therefore the anthocyanin concentration of grapes is an important determining factor of the final wine quality. Anthocyanins are localised primarily in grape berry skins and the reported average anthocyanin content of Vitis vinifera grapes range from 0.30 mg/g to 7.50 mg/g berry (Bridle and Timberlake, 1997).

3
The addition of total anthocyanins and total phenolics concentrations analyses as part of grape quality classification is important for several reasons. Most viticulturists and winemakers assess the phenolic development of grapes only by means of tasting. The inclusion of more objective chemical analyses as part of grape quality classification protocols will result in more reliable and consistent grape quality classification and ensure better streaming of grape musts inside the cellar to ensure that grape musts of more or less the same quality are grouped together (Dambergs et al., 2003). Ultimately compensation schemes will be based on more objective and accurate grape quality classification parameters (Dambergs et al., 2003). Phenolic compounds have complex chemical structures and recent advances in analytical techniques have made it possible to detect and measure individual phenolic compounds accurately and precisely (Waterhouse et al., 1999; Waterhouse and Kennedy, 2004). Several chromatographic and spectroscopic techniques exist for the identification and quantification of grape and wine phenolics. Due to the relatively low concentrations and structural diversity of grape and wine phenolics most of these methods require sophisticated instrumentation and generate large quantities of chemical waste that are expensive and hazardous to the environment. However, the results obtained using these techniques provide valuable information regarding grape and wine phenolic compounds. Many of the techniques are time consuming, limiting the number of analyses that can be carried out on a daily basis for routine laboratory analyses. To be able to implement total anthocyanins and total phenolics concentrations measurements within vineyard and winery quality control procedures, there is a need for robust and selective analytical techniques. Near infrared spectroscopy (NIR) has proven to be a rapid, accurate and robust analytical technique for the quantification of grape and wine phenolic compounds (Dambergs et al., 2003; Cozzolino et al., 2004). With a reduction in analyses time more time will be available to analyse higher amounts of sample numbers. Fourier transform infrared spectroscopy (FT-IR) is an analytical technique that requires minimum sample preparation, minimises analytical time and saves costs related to chemicals. The development of purpose built FT-IR spectrometers enabled the development of an array of applications fit for routine analyses in the wine industry including analyses for parameters such as sugar, pH, alcohol, total acidity, glucose/fructose, malic acid, lactic acid, acetic acid, tartaric acid, CO2, glycerol, gluconic acid, sucrose, free amino nitrogen and ethyl carbamate (Gishen and Holdstock, 2000; Kupina and Shrikhande, 2003; Patz et al., 2004). However, the total anthocyanins and total phenolics commercial calibration models supplied by manufacturers are not satisfactory.
1.2 PROJECT AIMS AND RESEARCH STRATEGIES
No published information exists about either the determination of the total anthocyanins or the total phenolics concentrations of grapes as part of routine analyses at South African wineries. This study forms part of a larger survey to study the total anthocyanins and total

4
phenolics profile and concentration of South African grapes and to evaluate their inclusion as part of grape quality control. The first phase of the project involved the evaluation of Fourier transform infrared spectroscopy (FT-IR) for the routine analysis of total anthocyanins and total phenolics concentrations in grapes. The second part of this project was to establish a database containing information about the total anthocyanins and total phenolics concentration of grapes produced in South Africa. The last phase of the project involved an evaluation of the possibility to implement total anthocyanins and total phenolics concentrations analyses as part of the grape quality classification system of a commercial South African winery. The individual aims of all these phases are outlined below.
1.2.1 THE EVALUATION OF THE REFERENCE ANALYSIS METHOD PROTOCOL FOR THE DETERMINATION OF TOTAL ANTHOCYANINS AND TOTAL PHENOLICS IN GRAPES
The aims of this phase were to: 1) Evaluate the length of the extraction steps described in the reference analysis
method protocol 2) Determine the repeatability of the reference analysis method 3) Determine the standard error of laboratory (SEL)
1.2.2 THE EVALUATION OF FOURIER TRANSFORM INFRARED SPECTROSCOPY (FT-IR) FOR THE ROUTINE ANALYSIS OF TOTAL ANTHOCYANINS AND TOTAL PHENOLICS CONCENTRATIONS IN GRAPES
The aims of this phase were to: 4) Evaluate Fourier transform infrared spectroscopy (FT-IR) as a technique for the
routine quantification of total anthocyanins and total phenolics concentrations in red grapes.
5) Develop total anthocyanins and total phenolics calibration models for the Foss WineScan FT 120 spectrometer (Foss Analytical, Denmark).
6) Determine the influences of calibration set design on the prediction accuracy of calibration models.
1.2.3 THE ESTABLISHMENT OF A DATABASE
The aims of this phase were to establish a database containing: 1) Analytical data including the total anthocyanins and total phenolics concentrations
of South African grapes. 2) FT-IR spectra of South African grapes. 3) Additional information regarding the vintage, origin, irrigation treatment and
viticultural grape grading.

5
1.2.4 THE EVALUATION OF THE POSSIBILITY TO IMPLEMENT TOTAL ANTHOCYANINS AND TOTAL PHENOLICS CONCENTRATIONS ANALYSES AS PART OF GRAPE QUALITY CLASSIFICATION AT A COMMERCIAL WINERY
The aims of this phase were to investigate: 1) The distribution of total anthocyanins and total phenolics concentrations in grapes
from different maturity levels. 2) The distribution of total anthocyanins and total phenolics concentrations in different
grape cultivars. 3) The influence of irrigation treatments on total anthocyanins and total phenolics
concentrations in grapes. 4) The influence of geographic origin on total anthocyanins and total phenolics
concentrations in grapes. 5) The relationships between the total anthocyanins and total phenolics concentrations
of grapes and grape chemical parameters such as sugar, pH and titratable acidity. 6) The current grape grading according to viticultural practices with the total
anthocyanins and total phenolics concentrations of the grapes.
1.3 LITERATURE CITED
Bridle, P. and Timberlake, C.F. (1997). Anthocyanins as natural food colours – selected aspects. Food Chem. 58, 103-109.
Cozzolino, D., Kwiatkowski, M.J., Parker, M., Cynkar, W.U., Dambergs, R.G., Gishen, M. and Herderich, M.J. (2004). Prediction of phenolic compounds in red wine fermentations by visible and near infrared spectroscopy. Anal. Chim. Acta. 513, 73-80.
Dambergs, R.G., Cozzolino, D., Esler, M.B., Cynkar, W.U., Kambouris, A., Francis, I.L., Høj, P.B. and Gishen, M. (2003). The use of near infrared spectroscopy for grape quality measurement. Aust. & New Zea. Grapegrower Winemaker Ann. Tech. Issue. pp. 69-76.
Dry, P.R., Iland, P.G. and Ristic, R. (eds). 2004. What is vine balance? Eds. Blair, R., Williams, P. and Pretorius, S. In Proceedings of the twelfth Australian wine industry technical conference; 19-24 July 2004; Melbourne, Victoria. pp. 68-74.
Du Plessis, C.S. and Van Rooyen, P.C. (1982). Grape maturity and wine quality. S. Afr. J. Enol. Vitic. 3, 41-45.
Foss Analytical, Denmark. http://www.foss.dkFrancis, I.L., Iland, P.G., Cynkar, W.U., Kwiatkowski, M., Williams, P.J., Armstrong, H., Botting, D.G., Gawel,
R. and Ryan, C. (eds.). 1999. Assessing wine quality with the G-G assay. Eds. Blair, R.J., Sas, A.N., Hayes, P.F. and Høj, P.B. In Proceedings of the tenth Australian wine industry technical conference; 2-5 August 1998; Adelaide, South Australia. pp. 104-108.
Francis, I.L., Høj, P.B., Dambergs, R.G., Gishen, M., de Barros Lopes, M.A., Pretorius, I.S., Godden, P.W., Henschke, P.A., Herderich, M.J. and Waters, E.J. (eds.). 2004. Objective measures of grape quality – are they achievable. Eds. Blair, R., Williams, P. and Pretorius, S. In Proceedings of the twelfth Australian wine industry technical conference; 19-24 July 2004; Melbourne, Victoria. pp. 85-89.
Gawel, R. (1998). Red wine astringency: a review. Aust. J. Grape Wine Res. 4, 74-95. Gishen, M. and Holdstock, M. (2000). Preliminary evaluation of the performance of the Foss WineScan FT
120 instrument for the simultaneous determination of several wine analyses. Aust. Grapegrower Winemaker Ann. Tech. Issue. pp 75-81.

6
Herderich, M.J., Bell, S.-J., Holt, H., Ristic, R., Birchmore, W., Thompson, K. and Iland, P.G. (eds.). 2004. Grape maturity and tannins: the impact of viticultural treatments on grape and wine tannins. Eds. Blair, R., Williams, P. and Pretorius, S. In Proceedings of the twelfth Australian wine industry technical conference; 19-24 July 2004; Melbourne, Victoria. pp. 79-84.
Herderich, M.J. and Smith, P.A. (2005). Analysis of grape and wine tannins: methods, applications and challenges. Aust. J. Grape Wine Res. 11, 205-214.
Iland, P.G. (1987). Predicting red wine colour from grape analysis. Aust. Grapegrower Winemaker. 285, 29. Kupina, S.A. and Shrikhande, A.J. (2003). Evaluation of a Fourier transform infrared instrument for rapid
quality-control wine analyses. Am. J. Enol. Vitic. 54, 131-134. Marais, J. and October, F. (2005). Relationships between grape colour and wine quality. Wineland (July
2005), 85-87. Noble, A.C. (1994). Bitterness in wine. Physiol. Behav. 56, 1251-1255. Patz, C.-D., Blieke, R., Ristow, H. and Dietrich, H. (2004). Application of FT-MIR spectrometry in wine
analysis. Anal. Chim. Acta. 513, 81-89. Singleton, V.L. and Esau, P. (1969). Phenolic substances in grapes and wine, and their significance. Eds.
Chichester, C.O., Mrak, E.M. and Stewart, G.F. In Advances in Food Research. Supplement 1. 1st Ed. Academic Press Inc., New York, USA. pp. 31-38.
Somers, T.C. (1971). The polymeric nature of wine pigments. Phytochemistry. 10, 2175-2186. Waterhouse, A.L. and Kennedy, J.A. (2004). Preface. Eds. Waterhouse, A.L. and Kennedy, J.A. In Red wine
color: revealing the mysteries. 1st Ed. A.C.S. Symposium Series, Washington DC. 886, pp. 9-11. Waterhouse, A.L., Price, S.F. and McCord, J.D. (1999). Reversed-phase high-performance liquid
chromatography methods for analysis of wine polyphenols. Methods Enzymol. 299, 113-121.

CHAPTER 2
LITERATURE REVIEW
Phenolic compounds and their relevance to the colour of red grapes and wine

8
LITERATURE REVIEW
2.1 INTRODUCTION
Wine colour is the first sensory impression perceived in the glass during tasting (Bakker and Arnold, 1993; Almela et al., 1995). The depth of red wine colour is accepted as being correlated to quality; deeper coloured red wines are normally considered of higher quality than their lighter coloured counterparts (Gishen et al., 2002). As a result, chemical compounds related to wine colour are of great importance and are continually investigated. Anthocyanins, a group of phenolic compounds, are primarily responsible for the red colour of grapes and wines (Singleton and Esau, 1969a). The anthocyanin concentrations of grapes, musts and young red wines are highly correlated with wine colour intensity (Somers and Evans, 1974; Jackson et al., 1978; Iland, 1987; Francis et al., 1999; Marais et al., 2001; Marais and October, 2005). The anthocyanin concentrations of grapes can be used to predict subsequent red wine colour (Iland, 1987). Due to the search for more objective measurements of grape quality, the combination of grape colour with established indicators of grape quality (such as ºBrix, pH and titratable acidity) to grade grapes has recently gained interest (Gishen et al., 2002; Dambergs et al., 2003). The use of analytical methods instead of organoleptic methods for quality control is essential due to their performance and objectivity (Berente et al., 2000). Recently many advances have been made regarding analytical instrumentation for the identification and quantification of chemical compounds related to grape and wine colour. These advances will aid in the quest to unravel the basic chemistry of red wine colour, one of the major challenges for wine chemists (Waterhouse and Kennedy, 2004). Grape and wine phenolics are extensively reviewed subjects. This review presents a brief overview of the basic properties of phenolic compounds with the focus on anthocyanins, the phenolic compounds responsible for the red colour of grapes and wines. Viticultural and winemaking factors that influence anthocyanin concentrations in grapes and wines are summarized. Given the interest of the wine industry in evaluating rapid measurements of anthocyanin quantification, a summary of the available analytical techniques for the quantification of anthocyanins is provided.
2.2 PHENOLIC COMPOUNDS IN RED GRAPES AND WINE
Phenolic compounds are chemical constituents of grapes and wine that contribute to sensorial properties such as colour, flavour, astringency and bitterness (Somers, 1971; Noble, 1994; Gawel, 1998). In Vitis vinifera grapes approximately 40% of the phenolic compounds are located in the skins and 60% in the seeds of grape berries (Table 1) (Singleton and Esau, 1969b). Many factors influence the phenolic concentration of grapes

9
and wines including grape variety, terroir, ripening conditions, viticultural practices and winemaking techniques.
Table 1. The distribution of total phenolics concentrations in Vitis vinifera grapes (adapted from Singleton and Esau, 1969b).
Berry tissue Total phenolics concentration (GAE)a
Skin 1.86 Pulp 0.04 Juice 0.21 Seeds 3.53 Total 5.64
aExpressed as mg/g gallic acid equivalents
Phenolic compounds are cyclic benzene compounds with a minimum of one hydroxyl group associated directly with the ring structure. Based on their structure two groups namely flavonoid and non-flavonoid phenols are distinguished (Figure 1) (Bowyer, 2002). Flavonoid phenols are subdivided into anthocyanins, flavanols, flavonols and tannins (Allen, 1998; Kennedy et al., 2002). Non-flavonoid phenols consist primarily of phenolic acids and their esters (Singleton and Noble, 1976). The differences between the two groups are the number and orientation of phenolic sub-units within the molecules (Bowyer, 2002).
Phenolic compounds
FlavonoidsNon-flavonoids
Phenolic acids Anthocyanins
Flavonols
Flavanols
Tannins
Figure 1. The division of phenolic compounds based on their structure.

10
2.2.1 FLAVONOIDS
2.2.1.1 Anthocyanins
Anthocyanins, pigments responsible for the red colour of grapes and wines, are located primarily in the lower epidermis (Asen, 1975) of grape skins (Singleton and Esau, 1969a). Anthocyanins are glycosylated derivatives of the 3,5,7,3’-tetrahydroxyflavylium cation also known as anthocyanidin (Figure 2a) (Košir et al., 2004). The sugar compound increases the chemical stability of the anthocyanidin, therefore anthocyanins are the chemical form most prevalent in grapes and wine (Allen, 1998). Individual anthocyanins differ with respect to the number of hydroxyl groups, the type and number of sugars attached to the molecule, the position of this attachment, and the nature and number of aliphatic or aromatic acids attached to the sugars in the molecule (Favretto and Flamini, 2000; Kong et al., 2003). Anthocyanins of Vitis vinifera grapes are fundamentally 3-monoglucosides of the five aglycones malvidin, peonidin, petunidin, cyanidin and delphinidin (Figure 2b) (Wulf and Nagel, 1978). Malvidin-3-glucoside quantitatively is the most important anthocyanin of red grapes and wine (Mazza and Miniati, 1993b). The anthocyanin concentration of Vitis vinifera red grapes ranges from 0.30 to 7.50 mg/g berry (Table 2) and varies greatly between cultivar, season, and environment (Bridle and Timberlake, 1997). The average anthocyanins concentration in a Vitis vinifera red wine is approximately 150 mg/L (Singleton and Noble, 1976).
R’3 R’5 Aglycones OH H Cyanidin
OCH3 H Peonidin
OH OH Delphinidin
OH OCH3 Petunidin
OCH3 OCH3 Malvidin
O O
O
OH
OHOH
CH2OH
HO
OH
OH
R'5
OH
+8
7
65 4
3
2
2'4'
5'
3'
R'3
HO
OH
O
R'5
OH
+8
7
65 4
3
2
2'4'
5'
3'
R'3(b) (a)
Figure 2. The structure of (a) anthocyanidins and (b) anthocyanin 3-monoglucosides in grapes and wine (adapted from Ribéreau-Gayon et al., 2000).
2.2.1.2 Flavanols
Monomeric flavan-3-ols contribute significantly to the sensory sensation of bitterness occasionally perceived in red wines (Singleton and Trousdale, 1992). Flavan-3-ols are located in the seeds and skins of grape berries (Thorngate and Singleton, 1994) but are absent in the grape pulp (Ricardo da Silva et al., 1992). Their concentration in white wines ranges from 10 to 50 mg/L and may reach 200 mg/L in red wines (Table 2) (Singleton and Esau, 1969b). Flavan-3-ols form dimers, trimers, oligomers and larger polymeric groups through numerous interflavan (C4-C6/C4-C8) linkages. The procyanidins (R=H) (2-8 units),

11
prodelphinidins (R=OH) (2-8 units) or condensed tannins (>8 units) are the products formed during these polymerization reactions (Haslam, 1998a; Zoecklein et al., 1995a). The structures of procyanidins include (+)-catechin (Figure 3a) and its diastereoimer (-)-epicatechin (Figure 3b) and the structures of prodelphinidins include (-)-epigallocatechin and (-)-gallocatechin. A single esterified derivative (-)-epicatechin-3-O-gallate has also been reported in grapes (Prieur et al., 1994; Souquet et al., 1996). Flavan-3,4-diols or leucoanthocyanidins differ from flavan-3-ols by an additional hydroxyl attached at carbon 4. Flavan-3,4-diols are subject to the same chemical reactions as the flavan-3-ols. Leucoanthocyanins are glycosylated leucoanthocyanidins (Zoecklein et al., 1995a).
OHO
OH
OH
OH
8
7
65 4
3
2
2' 4'
5'
3'
OH
6'1'
S
R
OHO
OH
OH
OH
8
7
65 4
3
2
2' 4'
5'
3'
OH
6'1'
R
R
Catechin series Epicatechin series (+)-Catechin = 2R,3S (+)-Epicatechin = 2S,3S
(-)-Catechin = 2S,3R (-)-Epicatechin = 2R,3R
(b)(a)
Figure 3. Structure of (a) catechin and (b) epicatechin flavan-3-ol precursors of procyanidins and tannins (adapted from Ribéreau-Gayon et al., 2000).
Table 2. Concentrations of various phenolic compounds in Vitis vinifera red grapes and wine.
Phenolic
compounds
Group Grapes
or wine
Concentration Reference
Flavonoids Anthocyanins Grapes 0.30 to 7.50 mg/ g berry Bridle and Timberlake (1997)
Wine 150 mg/L Singleton and Noble (1969)
Flavanols Wine 200 mg/L Singleton and Esau (1969b)
Flavonols Grapes 0.02 to 0.9 mg/ g berry Macheix et al. (1990)
Wine 30 mg/L Singleton (1988)
Tannins (condensed) Wine 750 mg GAE/L Singleton and Noble (1976)
Non-flavonoids Phenolic acids Grapes 190 mg/L Singleton et al. (1986)
Wine 100-200 mg/L Ribéreau-Gayon et al. (2000)
Stilbenes Wine 2.0-13.7 mg/L Lamuela-Raventós et al. (1995)
2.3-53.5 mg/L Ribero de Lima et al. (1999)
3.0-8.1 mg/L Baptista et al. (2001)
9.6-27.9 mg/L Netzel et al. (2003)

12
2.2.1.3 Flavonols
Flavonols are light yellow pigments (De Freitas and Glories, 1999) synthesized in the upper epidermis of plant organs (Beggs et al., 1987). Flavonols are primarily present in grape berry skins (Moskowitz and Hrazdina, 1981) but low concentrations are also present in the leaves (Hmamouchi et al., 1996) and stems of grapevines (Souquet et al., 2000). Kaempferol, quercetin and myricetin are the most important flavonols present in grapes (Figure 4) (Cheynier and Rigaud, 1986; Price et al., 1995). The majority of flavonols are quercetins and their concentrations in grape skins range from 0.01 to 0.1 mg/g berry (Table 2) (Macheix et al., 1990). Quercetins elicit a bitter taste with weak astringency (Dadic and Belleau, 1973). Quercetin glycosides act as UV screening compounds, helping to protect the plant tissue from damage (Smith and Markham, 1998). The concentration of flavonol glycosides and aglycones in red wines is approximately 30 mg/L (Singleton, 1988).
OHO
OH
R'5
OH
R'3
O
OH
R’3 R’5 Name of aglycones
H H Kaempferol OH H Quercetin
OH OH Myricetin
Figure 4. The structure of flavonols present in grapes and wine (adapted from Ribéreau-Gayon et al., 2000).
2.2.1.4 Tannins
Tannins or proanthocyanidins are polymeric flavonoid compounds present in grape skins (Souquet et al., 1996), grape seeds (Prieur et al., 1994), and the stems (Souquet et al., 2000) of Vitis vinifera grapevines. Proanthocyanidins are extracted during red winemaking and affect the colour, astringency, stability, and ageing characteristics of wines (Haslam and Lilley, 1988; Sun et al., 1999). The structure of a proanthocyanidin polymer is characterized by the nature of its constitutive extension and terminal flavan-3-ol units and its degree of polymerisation (DP). The DP refers to the average number of units in the polymer (Prieur et al., 1994). The three-dimensional shape of tannins determines it’s reactivity as well as the way in which tannins interact with wine proteins (protein precipitation), salivary proteins (astringency), or proteins added during fining (Allen, 1998). Both grape skin and seed proanthocyanidins have epicatechins as the major compounds in the extended chains and catechins as the major terminal units. In addition grape skins contain two prodelphinidins that do not occur in grape seeds namely (+)-gallocatechin and (-)-epigallocatechin (Prieur et al., 1994; Souquet et al., 1996). Skin proanthocyanidins have a higher degree of polymerisation compared to seed proanthocyanidins (Prieur et al., 1994; Souquet et al., 1996). Despite the higher

13
concentration of tannins in grape seeds, skin tannins are expected to be extracted with less effort during winemaking because of their position (in vacuolar liquid, bound to vacuolar membrane and to the cell wall) and higher polarity (due to the prodelphinidins present) (Souquet et al., 1996).
2.2.2 NON-FLAVONOIDS
2.2.2.1 Phenolic acids
Benzoic and cinnamic acids are phenolic acids present in grape skins and grape pulp (Figure 5a and 5b) (Ribéreau-Gayon, 1965). Although concentrations of most non-flavonoids are below their individual sensory threshold values, collectively some of these compounds may contribute to the sensory sensations of bitterness and harshness (Gawel, 1998; Nagel et al., 1987; Vérette et al., 1988). Cinnamic acids are predominantly esterified with tartaric acid to form caftaric and coutaric acid (Figure 5c) (Ribéreau-Gayon, 1965; Baranowski and Nagel, 1981; Lee and Jaworski, 1989). For Vitis vinifera grapes the respective concentrations of caftaric and coutaric acid are 124 mg/L and 17 mg/L in white cultivars (Ong and Nagel, 1978) and 167 mg/L and 22 mg/L in red cultivars (Table 2) (Singleton et al., 1986). During vinification caftaric and coutaric acid hydrolyse to their free forms of caffeic and coumaric acid (Figure 5b) (Somers et al., 1987). The caffeic and coumaric acid concentrations in wines are 125 mg/L and 30 mg/L respectively (Vérette et al., 1988).
H
OH
R3
H
COOH
H
OH
R3
H
COOH
OH
OH
H O
OHH
H
COOH
COOH
R1
Benzoic acids R3 Cinnamic acids R3
p-Hydroxybenzoic acids H p-Coumaric acid H Protocatechuis acid OH Caffeic acid OH
(a) (b) (c)
Figure 5. (a) Benzoic acids in grapes and wine. (b) Cinnamic acids in grapes and wine. (c) Derivatives of cinnamic acids and tartaric acid. R1 = H, coutaric acid; R1 = OH, caftaric acid (adapted from Ribéreau-Gayon et al., 2000).
2.2.2.2 Stilbenes
Stilbenes are non-flavonoid compounds located in grape berry skins (Jeandet et al., 1991; Lamuela-Raventós et al., 1995). A particular stilbene, resveratrol or trihydroxy-3.5,4’-stilbene, has attracted widespread attention due to its healthful properties (Figure 6). Resveratrol compounds have anticarcinogenic and antitumor properties which reduce the risk of cardiovascular diseases and some types of cancer (Jang et al., 1997; Falchetti et al., 2001). Resveratrols are extracted during fermentation and reported concentrations in

14
wine range between 1 to 50 mg/L (Table 2) (Lamuela-Raventós et al., 1995; Ribero de Lima et al., 1999; Baptista et al., 2001; Netzel et al., 2003).
CH CH OH
OH
HO
3
5
4'
Figure 6. Trihydroxy-3.5,4’-stilbene or resveratrol (adapted from Ribéreau-Gayon et al., 2000).
2.3 FACTORS INFLUENCING THE COLOUR OF ANTHOCYANINS
2.3.1 pH DEPENDENT ANTHOCYANIN COLOUR EQUILIBRIUMVarying pH levels induce structural transformations of anthocyanins which affect the colour of anthocyanins. Anthocyanins exist in four different forms in solution: the red flavylium cation, the violet quinonoidal base, the colourless carbinol base and the pale yellow chalcone (Brouillard and Lang, 1990). Anthocyanins in the flavylium form are responsible for the orange or red colour of a particular medium (Brouillard, 1983). In relatively strong acidic aqueous solutions (pH lower than 3), anthocyanins display intense reddish colours and exists as flavylium cations (Figure 7). In the pH range 3.0-5.5, the flavylium cations and the neutral carbinol bases co-exist. Anthocyanin stability and colour intensity decreases towards pH neutrality (pH 5.5-6.5) and the quinonoidal bases largely predominate. At a pH of higher than 6.5, kinetic and thermodynamic competition occurs between the hydration reaction of the flavylium cation and the proton transfer reactions related to its acidic hydroxyl groups. The hydration reactions produce colourless carbinol pseudo-bases which equilibrate to the open yellow chalcones (Brouillard, 1982; Brouillard, 1988). The pK value for equilibrium between the red flavylium ion and its colourless pseudobase is 2.6, which favours the colourless form. This implies that at the average wine pH of 3.0, less than 50% of anthocyanins are in the red coloured forms. A decrease in red wine colour is often observed during malolactic fermentation, probably due to the increase in pH (Zoecklein et al., 1995a).
2.3.2 COPIGMENTATION REACTIONS
Copigmentation reactions of anthocyanins were first reported by Robinson and Robinson (1931) and refer to the hydrophobic association of an anthocyanin chromophore with the planar electronically unsaturated part of a cofactor (Brouillard and Dangles, 1994). It is possible to distinguish between intramolecular copigmentation (the copigment is part of the anthocyanin molecule) and intermolecular copigmentation (the copigment is not covalently bound to the anthocyanin molecule) (Brouillard, 1983). Copigmentation causes (a) associated anthocyanins to display far greater colour than would be expected from the

15
O
O
O
O
OH
HO
OH
R'5
OH
+8
7
65 4
3
2
4
R'3
OH
R'5
OH
R'3
HO
OH
O-Glucose
R'5
OH
R'3
HO
OH
O-Glucose
R'5
OH
R'3
HO
OH
O-Glucose
R'5
OH
R'3
HO
OH
O-Glucose
1
A+ flavylium cation form(red)
O-Glucose
O
OH
OH
HO O
O
O-Glc
R'3
R'5
OH
AO quinonodel base form(blue)
AOH4 carbinol base form(colourless)
AOH2 carbinol base form(colourless)
Chalcone trans (C)Chalcone cis (C)Light yellow
-H+
+H+
H2O
H+H2O
H+
H2OH2O
H+H+
Tautomeric reaction
Isomeric state
pH<3.0Flavylium ions predominates
pH 3.0-5.5Mixture of flavylium cations
and carbinol bases
pH>6.5Chalcones predominate
pH 5.5-6.5Quinonoidal bases
predominate
Figure 7. The anthocyanin equilibrium (adapted from Ribéreau-Gayon et al., 2000).
anthocyanin concentrations (a hyperchromic shift) and (b) a change in the wavelength at which maximum absorbance is observed (a bathochromic shift), typically 5 to 20 nm higher, causing a transformation from the reddish to bluish hues (Boulton, 2001). Most research of copigmentation has focused on monomeric compounds as cofactors because there is no evidence of polymeric phenols (tannins) being cofactors (Boulton, 2001). Potential cofactors include flavonoids, non-flavonoids, amino acids, and organic acids (Brouillard et al., 1989; Boulton, 2001). The most stable copigment associations form

16
between the flavonols quercetin and quercetin-3-o-glucoside, and malvidin-3-o-glucoside (Baranac et al., 1997). The observed red wine colour depends on a number of factors: anthocyanin and cofactor type, anthocyanin and cofactor concentration, molar ratio of anthocyanin to cofactor, pH, temperature, and the anions in solution (Brouillard and Dangles, 1994; Boulton, 2001; Darias-Martin et al., 2001). There seems to be a minimum requirement of anthocyanins, approximately 18.5 mg/L, before significant copigmentation is traceable (Boulton, 2001). During wine ageing, copigmentation complexes disappear because of the conversion of monomeric anthocyanins into polymeric pigments. This transformation leads to an increase in colour stability against pH changes and bisulphite bleaching (Hermosín Gutiérrez et al., 2005).
2.3.2.1 Intermolecular copigmentation
Red flavylium cations are susceptible to hydration reactions which change the coloured flavylium cations to colourless pseudobases. Intermolecular copigmentation of anthocyanins with other flavonoids and cofactors inhibits hydration reactions and protects the flavylium cations against water attack and subsequent colour loss (Brouillard, 1982). Intermolecular copigmentation also leads to enhancement of colour due to increased absorbance in the visible range of light and involves change from red to purple or blue colours (Asen et al., 1972; Brouillard, 1982).
2.3.2.2 Intramolecular copigmentation
Intramolecular copigmentation is responsible for the colour stability of anthocyanins containing two or more aromatic acyl groups. Brouillard (1981) described intramolecular copigmentation as the formation of an intramolecular “sandwich” with aromatic acyl groups of two anthocyanin acyl groups on the outsides and the pyrylium ring of the flavylium in between, protecting it against nucleophilic addition of water at C2 and C4 positions. Figure 8 shows the hypothetical stacking mechanism protecting the pyrylium ring from water attack. Hydrophobic interactions between the two electron rich phenolic nuclei of the acyl groups and the electron deficient anthocyanidin (flavylium ion or quinonoidal anhydro-base) are responsible for this intramolecular π-π stacking. Intramolecular copigmentation protects the flavilium cation more efficiently against hydration reactions than intermolecular copigmentation (Brouillard et al., 2003). Some important factors that affect intramolecular copigmentation are the structure of the acyl group, its position of attachment to the sugar, the structure of the sugar, and its location (Brouillard, 1988).
2.3.3 SELF-ASSOCIATION OF ANTHOCYANINS
Self-association occurs when the colour intensity of a solution increases more than linearly with an increase in anthocyanin concentration (Mazza and Miniati, 1993a) and is affected by the type and concentration of anthocyanins (Hoshino et al., 1981; Hoshino et al., 1982; Hoshino, 1991). Asen et al. (1972) was the first to suggest that this deviation from Beer-

17
Lamber’s law was the result of anthocyanins in the flavylium ion form that underwent self-association (or vertical chiral stacking) in aqueous media (Figure 9). The principal driving force for this self-aggregation is the hydrophobic interactions between the various aromatic nuclei rather than hydrogen bonding. In contrast to copigmentation, self-association is characterized by a shift towards shorter wavelengths of maximum absorbance, that is, a hypsochromic shift (Hoshino et al., 1981).
O
O
OO
OO
OO
OO
O
O
O
O
OO
O+
Figure 8. Model for the stacking of two acyl groups above and below the flavylium nucleus. The acyl residues were arbitrarily attached to the 3 and 6 positions of the 3-sugar and, for the sake of clarity, only the carbon skeleton and the oxygen atoms are represented (Brouillard, 1983).
OOO
Figure 9. A model for the self-association (chiral stacking) of anthocyanin molecules (adapted from Haslam, 1998b).
2.3.4 ACETALDEHYDE MEDIATED POLYMERISATION REACTIONS
During red wine ageing, monomeric grape anthocyanins are progressively and irreversibly displaced by more stable polymeric pigments. In the presence of acetaldehyde, rapid reactions may occur between anthocyanins in the carbinol base form and flavanols resulting in stable complexes that are more coloured than the colourless anthocyanin forms (Figure 10) (Zoecklein et al., 1995a). Acetaldehyde is a natural compound occurring in wines, produced either by yeast metabolism during fermentation or by ethanol oxidation (Atanasova et al., 2002). The acetaldehyde mediated polymerisation reactions between anthocyanins and flavanols was first described by Timberlake and Bridle (1976a). In an

18
acid medium the acetaldehyde forms a carbocation that reacts with the active positions (C6 and C8) of a flavanol, leading to a carbocation intermediate, which in turn reacts with either another flavanol molecule or the hydrated form of an anthocyanin to form a violet coloured pigment (Timberlake and Bridle, 1976a; Fulcrand et al., 1996). In wine acetaldehyde polymerisation reactions occurs as a result of the controlled oxidation during barrel ageing, when traces of acetaldehyde are produced by the oxidation of ethanol. The colour of the wine becomes more intense and changes tone, becoming darker after a few months of barrel ageing (Ribéreau-Gayon et al., 2000).
O O
O
O
HO
OH
O-Glc
OCH3
OH
+
OCH3
HO
OH
OH
OH
OH
HO
OH
OH
OH
OHOH
OH
Glc-O
CH3O
HO
+
CH3O
HC-CH3
+Malvidin-3-glucoside Catechin
CH3CHO
Figure 10. The acetaldehyde mediated polymerisation reaction between malvidin-3-glucoside and catechin (a flavanol) in an acid medium (adapted from Ribéreau-Gayon et al., 2000).
2.3.5 OXIDATIVE DEGRADATION OF PHENOLIC COMPOUNDS
Enzymatic oxidation of phenolic compounds is primarily responsible for browning of grape must and wine. Besides the alteration of wine colour, browning also affects the sensory qualities of wine (reviewed in Mayer and Harel, 1979; Macheix et al., 1991). In the presence of oxygen the enzyme group polyphenoloxidases catalyses enzymatic oxidation of phenolic compounds in grape must and wine (Macheix et al., 1991) to form highly active quinones (Mayer and Harel, 1979). The quinones rapidly condense and may combine with amino sulfhydryl groups of proteins, as well as with anthocyanins, to form relatively insoluble brown polymers (Mayer and Harel, 1979). In grape juice the three most important parameters that determine browning intensity and the rate at which it appears are the phenolic concentration susceptible to oxidation, activity of polyphenoloxidases, and available oxygen. The two types of polyphenoloxidases responsible for oxidative browning are: o-diphenol oxygen oxidoreductase (o-DPO) and laccase (Macheix et al., 1991). A natural “defence” mechanism exists against browning in must and wine involving caftaric

19
acid, the major phenol present in grape must prepared with limited oxidation and minimum extraction from skins and seeds. Caftaric acid is oxidised to its quinone which in turn reacts with the tripeptide glutathione to produce S-glutathionyl caftaric acid or the grape reaction product (GRP). The GRP is colourless and is not involved in further chemical reactions. Therefore, the caftaric acid quinones are no longer free to change to brown polymers and thereby browning is prevented (Margalit, 1997). Oxydative degradations of anthocyanins are catalysed by oxygen and light. This reaction is primarily influenced by the type and concentration of alcohol. Controlled oxydative degradation of anthocyanins occurs during the barrel ageing of red wines. It is reported that malvidin is more resistant to oxidation than cyanidin (Ribéreau-Gayon et al., 2000).
2.4 THE DEVELOPMENT OF ANTHOCYANINS AND TANNINS DURING RIPENING
Berry growth follows a double-sigmoid pattern corresponding to three growth periods with each growth period differing considerably in biochemical activity and subsequent grape composition (Figure 11) (Coombe, 1973; Coombe and Bishop, 1980; Brady, 1987). The most important developmental stages of Vitis vinifera grapevines are budburst, flowering, véraison (colour change and start of maturation) and harvest (grape maturity) (Jones and Davis, 2000). Véraison signals the end of the development period of grapes and the onset of the ripening process (Hrazdina et al., 1984). This is marked by the initiation of anthocyanin formation in red varieties, the start of rapid sugar accumulation, a decrease in acidity and chlorophyll, and the onset of grape softening (Singleton and Esau, 1969c). Physiological maturity refers to the optimal levels of sugars, pH and titratable acidity for a specific wine style. Industrial maturity is the ripeness level which yield maximum weights of grapes and sugar concentrations. Technological maturity is associated with the optimum phenolic composition for achieving a specific wine style (Robredo et al., 1991).
I II III
Time
Berry weight
anthesis véraison
Figure 11. The double-sigmoid growth pattern of grape berries (Kennedy et al., 2000a). I. First period of berry growth. II. Little change in berry size. III. Véraison followed by second period of berry growth.

20
2.4.1 ANTHOCYANINS
A number of studies have investigated the accumulation of anthocyanins and other phenolic compounds in grape berries during ripening (Hrazdina et al., 1984; Fernández-López et al., 1998; Yokotsuka et al., 1999; Jordão et al., 2001; Ryan and Revilla, 2003). Soon after the beginning of fruit formation, coinciding with, or just after véraison, there is a visible and measurable formation of anthocyanins (Pirie and Mullins, 1980; Hrazdina et al., 1984; Yokotsuka et al., 1999). Development of anthocyanins from véraison to full maturity follows a sigmoid curve that coincides to a considerable extent with the accumulation of soluble sugars (Hrazdina et al., 1984; Pirie and Mullins, 1977; Pirie and Mullins, 1980). Anthocyanin formation during the early stages of berry development is limited to small areas, in contrast with mature berries where the subepidermal layer uniformly contains anthocyanins (Hrazdina et al., 1984).
2.4.2 TANNINS
The maximum concentration of phenolic compounds in grapes does not normally coincide with the maximum accumulation of sugars (Maujean et al., 1983). During grape maturation, phenolic compounds bind together or polymerise to form tannins (Zoecklein, 2001). Both grape seed (Romeyer et al., 1986) and skin tannins (Fernández de Simon et al., 1992; Kennedy et al., 2001; Kennedy et al., 2002) have a relatively low degree of polymerisation at véraison which increases during ripening, resulting in decreased astringency. As grapes mature sensory changes are observed from “hard” and bitter to astringent and finally to soft and supple during grape tasting. These sensory changes are the result of tannins polymerization together with products formed via the polymerization of phenolic compounds with other molecules (e.g. sugars and proteins). As seeds mature they change colour from green to dark brown (Zoecklein, 2001). During berry development there is an increase in the concentrations of anthocyanins associated with the tannin fraction (Kennedy et al., 2001).
2.5 THE ANTHOCYANIN BIOSYNTHETIC PATHWAY
Grape anthocyanins are synthesized through the phenylpropanoid and flavonoid pathways (Figure 12) (Boss et al., 1996c; Holton and Cornish, 1995). These pathways are regulated by enzyme activities (Hrazdina et al., 1984) and gene expression (Boss et al., 1996a). Both malonyl-CoA and 4-coumaroyl-CoA, the two types of direct flavonoid precursors, are derived from carbohydrates. Malonyl-CoA is synthesised from the glycolysis intermediate acetyl-CoA and carbon dioxide, the reaction being catalysed by acetyl-CoA carboxylase. The supply of 4-coumaroyl-CoA is more complex and involves the shikimate pathway, the main biosynthetic pathway to the aromatic amino acids phenylalanine and tyrosine in higher plants (Heller and Forkmann, 1988). Transformation of phenylalanine to cinnamic acid is catalysed by phenylalanine ammonia lyase (PAL) (Figure 12). Aromatic

21
hydroxylation of cinnamic acid by cinnamate 4-hydroxylase (C4H) leads to 4-coumarate which is further transformed to 4-coumaric acid which forms 4-coumaroyl-CoA by action of 4-coumarate:CoA ligase (4CL) (Heller and Forkmann, 1988). Chalcone synthase (CHS) catalyses the formation of chalcone through the condensation of three molecules of malonyl-CoA and 4-coumaroyl-CoA (Figure 12) (Mazza and Miniati, 1993a). The formed C15 chalcone is isomerised by a chalcone isomerase (CHI) into flavanone. Flavanone 3-hydroxylase (F3H) hydroxylates flavanones to form dihydroflavonols. Dihydroflavonol 4-reductase (DFR) catalyses the conversion of dihydroflavonols to leucoanthocyanidins. This is followed by the production of anthocyanidin from leucoanthocyanidins, which involves leucoanthocyanidin dioxygenase (LDOX). The final step involves the addition of a glucose residue to anthocyanidin catalyzed by UDP glucose-flavonoid 3-o-glucosyl transferase (UFGT) to form anthocyanin (Mazza and Miniati, 1993a; Mori et al., 2005). Sections 2.5.1 and 2.5.2 highlight the importance of PAL and UFGT, two of the enzymes involved during anthocyanin biosynthesis.
PAL
C4H
CHI
Phenylalanine
Cinnamic acid
4-Coumaric acid
4-Coumaroyl-CoA
Chalcone
Flavanone
Dihydroflavonols
Leucoanthocyanidins
Anthocyanidins
Anthocyanins
3 Malonyl-CoA4CL
CHS
F3H
DFR
LDOX
UFGT
Phenylpropanoids
Flavonoids
Figure 12. The major intermediates in the anthocyanin biosynthetic pathway (adapted from Jeong et al., 2004). Abbreviations used: PAL, phenylalanine ammonia lyase; C4H, cinnamate 4-hydroxylase; 4CL, 4-coumarate:CoA ligase; CHS, chalcone synthase; CHI, chalcone isomerase; F3H, flavanone 3-hydroxylase; DFR, dihydroflavonol 4-reductase; LDOX, leucoanthocyanidin dioxygenase; UFGT, UDP glucose-flavonoid 3-o-glucosyl transferase.
2.5.1 PHENYLALANINE AMMONIA LYASE (PAL)
PAL is the key enzyme in the shikimate pathway that channels phenylalanine away from protein synthesis towards that of phenylpropanoid, flavonoids and anthocyanins (Hrazdina et al., 1984; Roubelakis-Angelakis and Kliewer, 1985; Roubelakis-Angelakis and Kliewer,

22
1986). During berry development there is significant activity of PAL in skins and seeds, but this is followed by a swift decline in the enzyme activity towards véraison (Hrazdina et al., 1984). There is no synthesis of anthocyanins during this period. In red grapes PAL increases again after véraison and there is a correlation between activity and colour intensity (Kataoka et al., 1983; Hrazdina et al., 1984). Apparently light is indispensable for PAL activity and therefore it has a major effect on anthocyanin biosynthesis and accumulation (Roubelakis-Angelakis and Kliewer, 1986). Even though PAL has been proposed to be the key enzyme in the phenylpropanoid pathway in many plants, it is likely that various other enzymes also regulate anthocyanin biosynthesis (Mori et al., 2005).
2.5.2 UDP GLUCOSE-FLAVONOID 3-O-GLYCOSYL TRANSFERASE (UGFT)
The mRNA of all anthocyanin biosynthetic enzyme genes except that of UDP glucose-flavonoid 3-o-glucosyl transferase (UFGT) accumulate in the early berry development stage but decrease until véraison, thereafter the mRNA levels of all genes including that of UFGT increase in red cultivars (Boss et al., 1996a; Kobayashi et al., 2001). The mRNA of UFGT is only present in the grape skins of red cultivars which indicate that UFGT is critical for anthocyanin biosynthesis in grape skins (Boss et al., 1996b; Boss et al., 1996c; Kobayashi et al., 2001).
2.6 VITICULTURAL FACTORS INFLUENCING THE PHENOLIC COMPOSITION OF GRAPES AND WINES
Many environmental factors and vineyard management practices influence grape phenolic composition and subsequent wine quality (reviewed in Du Plessis, 1984; Jackson and Lombard, 1993). Among the most important factors are solar radiation, temperature and irrigation. While these factors may not contribute to the rapid physiological or biochemical changes that occur during the development and maturation of grapes, their effects on shortening or lengthening these processes have to be recognized (Hrazdina et al., 1984). This section gives a brief overview of the major viticultural factors that influence grape colouration.
2.6.1 IRRIGATION
Numerous studies have investigated the effects of vine water deficit on berry growth and ripening and as a factor determining the anthocyanin composition of grapes and wine quality (Matthews et al., 1990; Ginestar et al., 1998; Roby et al., 2004). Vine water deficits generally lead to smaller berries (Bravdo, 1985; Matthews et al., 1990; Kennedy et al., 2002). Smaller berries have higher anthocyanin concentrations due to a concentrating effect of chemical compounds. Roby et al. (2004) found that grapes from low vine irrigation had a 45% increased anthocyanins concentration over grapes from highly irrigated vines. The corresponding loss in yield mass due to reduced berry growth was less than 20%.

23
Depending on the stage of berry development, water deficit has different effects. Pre-véraison water deficit results in the greatest reduction in berry weight compared with that of well-watered vines (Ginestar et al., 1998). Post-véraison water deficit has an ignorable effect on berry weight (McCarthy, 1999). Partial root zone drying (PRD) is a type of irrigation method where water is applied to one side of the vine for 10 to 15 days and then water is applied to the other side. If, during irrigation cycles, the “wet” side is sufficiently watered the “dry” roots are maintained in a healthy condition by water supplied to them from the wet roots. Dry et al. (2000) found no significant reduction in yields or berry size using PRD even though the total amount of irrigation was halved. The application of PRD increased berry anthocyanins and total phenolics (Dry et al., 2000). Partial root zone drying can induce stress to vines if not applied with caution.
2.6.2 LIGHT EXPOSURE
Smart et al. (1985) adopted the term “microclimate” to define the environmental conditions within the immediate vicinity of the leaves and fruit of a grapevine. Depending on the grapevine canopy, leaves and bunches can develop in conditions varying from heavily shaded (shaded canopies) through to fully exposed (open canopies) (Haselgrove et al., 2000). Both pre-véraison and post-véraison growth periods can be prolonged under heavily shaded conditions (Rojas-Lara and Morrison, 1989). This means that berry ripening, anthocyanin accumulation and berry growth in general are delayed. In most cases where grapes that developed in open canopies were compared to grapes that developed in shaded canopies, the exposed grapes had higher sugar concentrations, improved acid balance (lower juice pH and higher titratable acidity), and less unripe herbaceous fruit characters (Haselgrove et al., 2000). Most research has focused on cluster microclimate, but the influence of shaded shoots and leaves have also been investigated (Crippen and Morrison, 1986). Unless otherwise stated this section of the review refers to the effects of the degree of bunch exposure to sunlight. Researchers do not agree about the effect of sunlight on anthocyanin accumulation and concentrations. The opinion of some researchers has been that low light reduces anthocyanins and other flavonoids in grapes, while increased light increases flavonoid concentrations (Kliewer, 1970; Wicks and Kliewer, 1983; Morrison and Noble, 1990; Dokoozlian and Kliewer, 1996; Keller and Hrazdina; 1998). There have also been reports that different light treatments have either no effect on anthocyanin concentrations (Hunter et al., 1995; Price et al. 1995) or even that high light causes decreased anthocyanin concentrations in grapes (Bergqvist et al., 2001). Even when researchers agree that light stimulates the synthesis of anthocyanins, there are still different opinions about the precise time during berry development or ripening when sunlight is essential for maximum anthocyanin accumulation. Dokoozlian and Kliewer (1996) concluded that light exposure before véraison is critical for berry tissues to perceive environmental stimulation and

24
trigger anthocyanin biosynthesis. Keller and Hrazdina (1998) found that exposure of the grapevine canopy to better light conditions at véraison and Hunter et al. (1991) just after véraison resulted in the highest anthocyanin concentration in grape skins. Many investigations were limited to ripe fruit. Substantial proof exist that the accumulation of phenolic compounds in grape berries occurs prior to the onset of ripening (Kennedy et al., 2000a; Kennedy et al., 2000b; Downey et al., 2003a). Both Haselgrove et al. (2000) and Downey et al. (2003b) have reported high concentrations of flavonols in the fruit at véraison as well as early in berry development and at flowering, emphasizing the importance of extending research of flavonoids to the earliest developmental stages. Comprehensive studies of the influence of light on flavonoid synthesis in developing berries were conducted by Downey et al. (2004a and 2004b) who investigated flavonoid biosynthesis in Shiraz over three successive seasons. During two seasons bunch exposure had no effect on anthocyanin concentration. They suggested that there may be two systems regulating anthocyanin accumulation in grapes: an initial constitutive system that generates a base level of anthocyanins and an inducible system that is light-requiring. This study showed that grapes grown in the absence of light did accumulate anthocyanins, which indicates that light is not an absolute requirement for anthocyanin biosynthesis. Downey et al. (2004b) also published data about the effects of different levels of bunch exposure to different levels of sun exposure on anthocyanin accumulation and wine colour of Cabernet Sauvignon. Anthocyanin concentrations were generally higher in exposed fruit and as exposure to light was increased, the anthocyanin concentrations also increased. Wine colour was also higher in wines made from more exposed fruit. It was concluded that light alone might not be the greatest influence on anthocyanin biosynthesis, but that the regional influence (most likely temperature) has a greater effect on anthocyanin concentration and composition than light. To achieve maximum colour development in warm regions, prolonged exposure of clusters to sunlight should be avoided because of the reducing effect that excessive fruit temperatures have on anthocyanin formation and subsequent concentrations (Haselgrove et al., 2000; Bergqvist et al., 2001; Spayd et al., 2002). Complete fruit shading should also be avoided because some sunlight is needed for maximum anthocyanin synthesis and for balancing the composition of other fruit compounds (Spayd et al., 2002).
2.6.3 BERRY TEMPERATURE
In addition to regulating photosynthesis and photo-morphogenesis, sunlight provides radiant energy that heats plant surfaces (Bergqvist et al., 2001). The anthocyanin biochemical pathway is both light and temperature sensitive (Kliewer, 1970; Pirie and Mullins, 1980; Hrazdina et al., 1984; Crippen and Morrison, 1986; Haselgrove et al., 2000). The optimum temperatures for enzymes involved in the anthocyanin biosynthetic pathway are between 17º to 26ºC (Pirie and Mullins, 1977). Anthocyanin biosynthesis and stability in grapes are favoured by warm daytime temperatures (15º to 25ºC) and cool nights (10º

25
to 20ºC) (Kliewer, 1970; Kliewer and Torres, 1972; Crippen and Morrison, 1986; Mori et al., 2005). During experimental procedures the separation of the effects of temperature and sunlight on grape colour composition is extremely difficult.
2.6.4 BERRY VOLUME
Wine quality, colour density, total anthocyanins, and phenolics are negatively correlated with bunch and berry weight (Somers and Pocock, 1986). It is generally accepted that larger berries have greater solvent to solute ratios because of smaller skin:pulp ratios (Hardie et al., 1996). Therefore berries with a smaller diameter are a desirable feature which increases the skin:pulp ratio and more potential extraction of anthocyanins from the grape skins.
2.6.5 SANITARY STATE
The health or sanitary state of grapes is known to affect the phenolic composition of red grapes and the subsequent colour and sensorial properties of red wines. The anthocyanin concentration of grapes infected with Oidium tuckeri or powdery mildew is lower than healthy grapes. Therefore wines made from healthy grapes have more colour than wines made from infected grapes because of the lower total anthocyanins and total phenolics concentrations of the infected berries (Amati et al., 1996; Piermattei et al., 1999). Any factor that leads to a reduction in red wine colour reduces the wine quality; therefore sound viticultural practices are essential to ensure a healthy harvest.
2.7 WINEMAKING PRACTICES INFLUENCING THE PHENOLIC COMPOSITION OF WINE
Numerous investigations and reviews evaluated the effects of winemaking practices and conditions on anthocyanins and other phenolic compounds (Dallas and Laureano, 1994; Bakker et al., 1998; Kwiatkowski et al., 2002; Sacchi et al., 2005). Following grape harvest the first step of vinification involves the removal of stems, leaves, and other unwanted material (Figure 13). The next procedure entails crushing of the grapes to release the juice. The fresh must is treated with sulphur dioxide to inhibit both oxidative browning and the growth of unwanted microorganisms. In red wines, prolonged maceration enables the extraction of compounds from the pomace (skins and seeds). The extraction process occurs simultaneously with alcoholic fermentation. Fermentation may start spontaneously due to indigenous yeasts derived form grapes, or yeasts present on the surface of contaminated equipment. To prevent a sluggish or “stuck” fermentation and to obtain a wine with desirable bouquet and flavour, grape must is generally inoculated with a pure culture of a selected yeast strain (Jackson, 1994). An average red wine ferments 5 to 7 days. During fermentation most of the sugars are converted to alcohol by wine yeasts. In the presence of alcohol anthocyanins leach into the grape must after release from the

26
skins (Boulton et al., 1996a). After partial or complete fermentation, the free-run grape must is allowed to flow away under gravity. Pressing of the pomace extracts most of the remaining grape must (press fraction) but the general quality is lower than that of the free-run grape must. After completion of alcoholic fermentation, the wine may be encouraged to undergo malolactic fermentation, a fermentation resulting in the degradation of malic acid to lactic acid. Malolactic fermentation is particularly beneficial in cool climate regions, where the reduction of acidity of wines improves their taste. After several weeks or months the wine is separated form the sediment - which settles out during spontaneous or induced clarification - through a process called racking. The sediment consists primarily of yeast and bacterial cells, grape cell debris, precipitated tannins, proteins, and potassium tartrate crystals. Prior to bottling, the wine may be fined to remove excess tannins and/or dissolved proteins and other materials that can lead to the development of haziness. Wines are chilled and filtered to further enhance clarification and stability. The final step in the production chain is bottling of the wine (Jackson, 1994).
Harvest
Destemming and crushing
Fermentation and maceration
Seperation and maceration
Pressing
Completion of fermentation
Malolactic fermentation (if desired)
Maturation and natural clarification
Filtration
Blending
Bottling
Figure 13. A flow diagram of red wine making (adapted from Jackson, 1994).

27
2.7.1 GRAPE PROCESSING
Vigorous crushing enhances the extraction and diffusion of anthocyanins and other phenolic compounds by increasing the skin surfaces in contact with the juice. However, excessive crushing of grape berries often leads to the extraction of astringent and bitter tannins that affect the final quality of the wine (Macheix et al., 1991). Polymerisation of anthocyanins starts at grape crushing and reaches considerable proportions during fermentation on skins (Bakker et al., 1986). Crushing also enhances enzymatic oxidation of phenolic compounds which may lead to browning of the must and the development of undesirable sensory characteristics of wines. The addition of sulphur dioxide (SO2) as an antioxidant and antiseptic during crushing is widely accepted, but when added in access may lead to stuck fermentations and bleached colour (Mazza and Miniati, 1993b). Gil-Muñoz et al. (1999) found that low temperatures of grapes at the moment of crushing increased the rate of polyphenol extraction during the first three to four days of alcoholic fermentation. However, as the fermentation progressed the temperature of the must increased, and the differences diminished. They concluded that night-time harvesting of grapes does not improve the quality of young red wines.
2.7.2 MACERATION TIME
The optimum length of skin fermentation time depends on cultivar, desired wine style and other factors (Auw et al., 1996). Researchers report maximum colour extraction with skin contact times varying between 4 to 16 days (Auw et al., 1996; Bakker et al., 1998; Yokotsuka et al., 2000; Gómez-Plaza et al., 2002). Carbonic maceration produces fruity red wines ready for immediate consumption, but not suitable for ageing (Gómez-Míguez and Heredia, 2004). Intact whole grapes are surrounded with CO2 which triggers the anaerobic metabolism of the grapes. The cell walls in the skin become permeable allowing the phenolic compounds to diffuse from the skin into the pulp. The phenolic diffusion is accelerated by the temperature (Gómez-Míguez and Heredia, 2004). Carbonic maceration produces wines with lower colour and overall quality when compared to wines made with traditional fermentation or thermovinification techniques (Rizzon et al., 1999; Carnacini et al., 1991; Pelligrini et al., 2000; Gómez-Míguez and Heredia, 2004; Castillo-Sánchez et al., 2005).
2.7.3 FERMENTATION TEMPERATURE
Cold soaking or cold maceration is a prefermentation technique that increases complexity, colour, and colour stability in red wines by enhancing phenol polymerisation (Zoecklein et al., 1995a; Gómez-Plaza et al., 2000). During cold maceration skins and seeds are permitted to soak for a period of 1 to 2 days at a temperature between 15º and 20ºC prior to the initiation of fermentation. Colour extraction without the effects of ethanol on the grape cells is obtained. The must is usually pumped over once or twice daily to enhance the extraction (Boulton et al., 1996b).

28
Another pre-fermentation technique is thermovinification that exploits heat to enhance colour extraction from skins. Thermovininification also destroys oxidases and ensures the oxidative stability of the wines. Grapes are crushed and generally destemmed. The mash is heated very rapidly (3 minutes) to approximately 70ºC and kept at the temperature for 30 to 60 minutes. Thermally vinified wines are generally deeper in colour than wines fermented traditionally but it contains less anthocyanins and more polymeric compounds (Timberlake and Bridle, 1976b). It is important not to overextract and obtain wines with unacceptable bitter and astringent phenols (Boulton et al., 1996b; Zoecklein et al., 1995a). Fermentation temperatures influence the type of winestyle. Winemakers generally use low fermentation temperatures (20ºC to 25ºC) to produce fresh, fruity, red aromatic wines (Zoecklein et al., 1995a). Fermentation temperatures of approximately 30ºC are optimal for the extraction and polymerisation of anthocyanins to obtain darker coloured wines (Gao et al., 1997; Girard et al., 2001).
2.7.4 PUMP-OVER OPERATION AND PRESSING
Enhanced colour and flavour extraction are obtained with the application of regular pump-over operations during red wine fermentation. These procedures involve the mixing of the skin cap formed with the juice once or twice a day by pushing the skins below the juice surface (punch-down) or by pumping the juice out and spraying it over the top of the skins (pump-over). Studies focussed on comparing different mixing methods have mostly found that the results depend on the grape variety. Generally in comparison with manual punch down treatments, mechanical punch down and pump over treatments significantly enhance the extraction and polymerisation of all phenolic compounds and produce wines with higher quality. Traditional pump over treatments tend to cause juice to infiltrate through gaps in the cap, leading to insufficient skin contact. To overcome this problem many wineries use sprinklers or splash plates (reviewed in Oberholster 2003; Sacchi et al., 2005). The timing of the separation of the pomace from the juice, as well as pressing, is a crucial step to ensure wines with an optimal phenolic balance. Anthocyanin extraction reaches a plateau after a few days but the extraction of phenols from skins and seeds can continue until separation takes place. An optimum balance between colour extraction and desirable phenol concentration must be obtained. Most winemakers base their timing of the separation and pressing on the sugar concentration or juice density (Boulton et al., 1996b).
2.7.5 ENZYMES
The addition of enzymes during grape juice and wine processing is to increase juice yield and shorten maceration, clarification and filtration times (Muñoz et al., 2004). Many trials have evaluated the potential of various enzymes to facilitate improved extraction of phenolic compounds, but contradictory results were reported. Some researchers reported

29
improved colour extraction with the use of commercial pectolytic and macerating enzyme preparations during vinification (Ough and Berg, 1974; Ough et al., 1975; Shoseyov et al., 1990; Zent and Inama, 1992). During another trial, after initial increased colour extraction, colour loss during storage occurred (Pardo et al., 1999). Other researchers reported no significant colour differences between wines produced with or without the use of pectolytic enzymes (Haight and Gump, 1994). Enzyme manufacturers addressed these problems and nowadays manufacture more substrate specific enzymes. Improved wine colour, tannic structure, and quality of wines prepared with enzymes have since been reported (Guerrand and Gervais, 2002). However, the use of enzyme preparations still needs to be carefully considered since they can potentially alter wine composition, sensory properties and quality.
2.7.6 SULPHUR DIOXIDE
During vinification sulphur dioxide (SO2) is primarily used for its antiseptic and antioxidative properties (Amerine et al., 1980). The addition of SO2 can result in temporary colour reduction. This is the result of a reversible reaction between the red flavylium ion and sulphite (HSO3
-) which forms a colourless sulphite-anthocyanin complex. SO2 decreases anthocyanin polymerization in wines (Dallas and Laureano, 1994; Bakker et al., 1998). Once formed polymerized anthocyanins or tannin-anthocyanin polymers are resistant to decolourization by SO2 because the physical site of sulphite binding is the same site at which polymerization reactions occur (Zoecklein et al., 1995a). To obtain young red wines with good colour characteristics which will last during storage, addition of SO2 at the moment of crushing is recommended (Gómez-Plaza et al., 2002). SO2 protects wines against excessive browning during maturation (Bakker et al., 1998).
2.7.7 FINING TREATMENTS
Fining refers to the addition of adsorptive compounds to wine followed by the settling or precipitation of partially soluble compounds to remove or reduce the concentration of one or more undesirable compound (Zoecklein et al., 1995b; Boulton et al., 1996c). Reports exist that fining agents such as polyvinylpyrrolidone (PVPP), gelatin, or bentonite reduces anthocyanin and total phenolics concentrations and therefore alter the colour and sensory characteristics of wines (Sims et al., 1995; Sarni-Manchado et al., 1999; Gómez-Plaza et al., 2000; Maury et al., 2001). The sensory ratings of fined wines are very similar to those of unfined wines, but fined wines score better at taste than unfined wines (Castillo-Sánchez et al., 2005). In general PVPP binds and removes smaller molecular weight phenolic compounds while gelatin removes larger molecular weight phenolics (Sims et al., 1995). Bentonite is used to reduce the protein concentration of wines but it also absorbs polyphenoloxidase, phenols, and other positively charged molecules (Main and Morris, 1991). Addition of bentonite and gelatin produces wines with lower colour, ionised anthocyanin and polymeric

30
compounds compared with PVPP-treated and untreated wines (Gil-Muñoz et al., 1997; Gómez-Plaza et al., 2000; Gómez-Plaza et al., 2002). Presumably PVPP prevents the fixation and precipitation of anthocyanins with yeasts and solid parts that are removed following fermentation. The most suitable fining agent for young red wines which results in low reduction in colour seems to be PVPP (Gómez-Plaza et al., 2002).
2.8 ANALYTICAL TECHNIQUES FOR THE QUANTIFICATION OF PHENOLIC COMPOUNDS (RELATED TO COLOUR) IN GRAPE JUICE, MUST AND WINE
Experimental procedures for the isolation and identification of individual red wine phenolic compounds are mostly complicated, time consuming and costly. The relatively low concentrations of these compounds in complex wine mediums and their structural diversity are both hindering factors (Håkansson et al., 2003). The next sections present a brief overview of the theories behind different analytical methods for phenolics analyses. Detailed descriptions of the procedures are not discussed.
2.8.1 ABSORBANCE MEASUREMENTS
2.8.1.1 Spectrophotometric indices
Absorbance measurements are simple techniques to measure the colour of grape extracts and wine. Several forms of absorbance indexes exist. Sudraud (1958) described methods which use optical absorbancies at 420 and 520 nm for the calculation of colour density and hue of wine. The Office Internationale de la Vigne et du Vin (OIV) described a colour index where a wine’s colour strength is the summation of the absorbancies measured at 420, 520 and 620 nm respectively (OIV, 1978). Along with the measures of Sudraud (1958), Somers and Evans (1977) also published other measures defining wine colour in natural conditions:
• Wine colour density (Absorbance units) = Absorbance420nm* + Absorbance520nm**
• Wine colour hue = Absorbance420nm / Absorbance520nm
• Total red pigments (Absorbance units) = Absorbance520nm
• Total phenolics (Absorbance units) = Absorbance280nm*** - 4
*Absorbance measurement at 420 nm provides an estimate of the concentration of yellow brown pigments present in wine. **Absorbance measurement at 520 nm provides an estimate of the concentration of anthocyanins and other red coloured compounds present at natural wine pH conditions. ***Absorbance measurement at 280 nm provides an estimate of the phenolic concentration of wine. Different pH and SO2 levels influence the anthocyanin colour equilibrium (Dallas and Laureano, 1994; Bakker et al., 1998). Comparison of absorbance measurements of different wines should be made under conditions of uniform pH and SO2 to eliminate the

31
effects of these variables. Descriptions of these adjusted measurements are given by Iland et al. (2000b).
2.8.1.2 Folin-Ciocalteu value
The Folin-Ciocalteu value gives an estimation of the total phenolics present in wine. This method depends on an oxidation-reduction reaction and is based on the reactivity and reductive properties of the phenolic functional group. The number of –OH groups present in a sample are measured, assuming that light absorption increases when more –OH groups are present. This assessment uses oxidising agents, potassium permanganate and Folin-Ciocalteu reagent (a mixture of molybdenum and tungsten salts). The first reaction produces a yellow solution in the presence of indigo blue. The second reaction is characterized by a blue colouring, the absorption measured with a spectrophotometer at 760 nm (Ribéreau-Gayon et al., 2000). Folin-Ciocalteu value or IFC
* = (Absorbance760nm x dilution) x 20 * The value is between 10 and 100
2.8.1.3 OD280 value
The advantages of measuring the absorbance at 280 nm rather than doing the Folin-Ciocalteu test include time and repeatability. There are however certain molecules, such as cinnamic acids and chalcones, which have no absorption maximum at this wavelength. This does not pose a problem because these molecules are present in wine at very low concentrations and any error in the value will be very small and can be ignored. Red wine is diluted 1/100 and white wine 1/10 with distilled water. The absorbance is measured at 280 nm in a 10 mm optical path (Ribéreau-Gayon et al., 2000). OD280 value or I280
* = Absorbance280nm x dilution *The value is between 6 and 120
2.8.1.4 The Iland method for total anthocyanins and total phenolics in wine
A combined method for the determination of total anthocyanins and total phenolics in wine is described by Iland et al. (2000b). A wine sample is diluted 1:100 with 1 M HCl. Three hours after the dilution step spectral measures at 520 nm and 280 nm are recorded and if necessary readings converted to what it would be if measured in a 10 mm cell. The dilution factor is also taken into account during the calculations. Total red anthocyanins are expressed as absorbance units at 520 nm, whereas total phenolics are expressed as absorbance units at 280 nm.
2.8.1.5 The Iland method for total anthocyanins and total phenolics of grapes
Iland et al. (1996 and 2000a) also describe a method for the estimation of red anthocyanins and total phenolics of grapes. These parameters have been used by Australian and South African researchers in particular (Marais et al., 2001; Dambergs et

32
al., 2003; Cozzolino et al., 2004a; Cynkar et al., 2004; Marais and October, 2005). A 1 g fraction of homogenised grapes are extracted with 50% ethanol (pH 2) for one hour. The extract is centrifuged and diluted 1:10 with 1 M HCl. After three hours the absorbance values of the diluted HCl extract solution are recorded at 700 nm, 520 nm and 280 nm in a 10 mm cell. Red anthocyanins (expressed as mg anthocyanins per g berry) are calculated from the absorbance measurement at 520 nm. Total phenolics (expressed as absorbance units per g berry weight) are calculated from the measurement of absorbance at 280 nm. The measure of absorbance at 700 nm is a check for sample turbidity.
2.8.1.6 Glories method for measuring phenolic maturity of grapes
Glories described a method for measuring phenolic maturity in grapes (Glories and Augustin, 1993). The basic theory behind this method is the rapid extraction of anthocyanins from grape skins under first moderate acidic (pH 3.2 where the degree of extraction is comparable to that occurring during wine fermentation) and eventually extreme acidic conditions (pH 1 where all the anthocyanins are extracted and dissolved). In the extreme acidic medium the protein bonds of the proteophospholipid membrane are broken and the contents of the vacuoles released. The difference between the absorbance measures at 280 nm and 520 nm of the two different pH solutions reflects the tannin and anthocyanin extraction potential. This extractibiliy indicates the grape maturity level.
2.8.2 CHROMATOGRAPHIC METHODS
High performance liquid chromatography (HPLC) is a very sensitive chromatographic technique used in many research projects for the classification and quantification of phenolic compounds (Bakker et al., 1986; Prieur et al., 1994; Souquet et al., 1996; Richey and Waterhouse, 1999). HPLC combined with a photo diode-array detector (DAD) allows for the simultaneous separation, identification and quantification of different anthocyanins in grapes and wines on the basis of their elution orders and spectral characteristics. The DAD permits the recording of the chromatographic analysis at several wavelengths and the visible-ultraviolet spectra of the different anthocyanins separated by HPLC at the same time (Hebrero et al., 1988). Anthocyanins can be characterised according to their spectral properties (Table 3) (Hebrero et al., 1988). Absorbance data collected at 313 nm and 365 nm are indicative of hydroxycinnamic acid derivatives and flavonols respectively. Although procedures can easily be automated the running time per sample is long, ranging from approximately 30 – 60 minutes or longer (Lamuela-Raventós and Waterhouse, 1994). Reversed-phase HPLC (RP-HPLC) separates small phenolic compounds and individual anthocyanins can be quantified (Waterhouse et al., 1999). RP-HPLC utilises a nonpolar stationary phase and a relatively polar mobile phase. More polar molecules elude before less polar molecules (Skoog et al., 1998b). Normal-phase HPLC (NP-HPLC) is used to quantify the polymeric phenolics of wine and is adequate when only a total measure of monomeric anthocyanins is needed (Rigaud et al., 1993). Proanthocyanidins

33
up to oligomers can be separated (Rigaud et al., 1993). NP-HPLC employs a highly polar stationary phase and a relatively nonpolar solvent. Less polar molecules elute first while more polar molecules elute last (Skoog et al., 1998b).
Table 3. Spectral characteristics of isolated anthocyanins from Vitis vinifera grapes in methanol, 0.01% HCl (adapted from Wulf and Nagel, 1978; Piergiovanni and Volonterio, 1980; Hebrero et al., 1988).
Anthocyanin λmax visible (nm) λmax ultraviolet (nm)
Delphinidin-3-monoglucoside 541-542 278-279
Cyanidin-3-monoglucoside 530 282
Petunidin-3-monoglucoside 540 277-280
Peonidin-3-monoglucoside 528 280-281
Malvidin-3-monoglucoside 537-538 278-279
2.8.3 XYZ TRISTIMULUS VALUES
The Commission International de l’Eclairage (CIE) is an international organisation that develops and furthers methods and standards concerning light and colour (Datacolor, 2004a). In 1931 the CIE developed a colour space (CIE tristimulus system) based on data from colorimeters, instruments that can accurately measure the wavelengths of light (Computerworld, 2002). Since 1962 the official method of the Office Internationale de la Vigne et du Vin (OIV) has been based upon these concepts, which have been applied in attempts to standardise wine colour (Somers and Evans, 1977). CIE tristimulus values X, Y, and Z, are coordinates of colour sensation, and form the foundation of the CIE colour space. The CIE XYZ tristimulus values is based on the three-component theory of colour vision, which states that the human eye/brain processes sensors (cones) for three primar colours: red, green and blue. All colours are seen as combinations of these primary colours (Datacolor, 2004a). These XYZ tristimulus values are calculated from transmittance values measured at wavelengths over the whole visible spectrum in specific conditions, using a spectrophotometer (Pérez-Magariño and González-Sanjosé, 2003). The XYZ tristimulus values are useful for defining colour, but the results are not easily visualised. This is because the XYZ colour space does not match perceived colour differences, nor does it describe brightness, the perceived amount of white in a colour (Computerworld, 2002).
2.8.4 CIELAB COLOUR SPACE
In 1976 the CIE adopted a new colour space, the CIELAB space. The CIELAB space is a mathematical transformation of the 1931 CIE tristimulus system. The 1976 CIELAB system organises colours so that numeric differences between colours agrees consistently well with visual perceptions (Datacolor, 2004b). The new colour space also includes brightness

34
measurements (Computerworld, 2002). The CIELAB space is a uniform three dimensional colour space defined by the colorimetric coordinates L*, a* and b* (CIE, 1986). The vertical axis L* is a measure of lightness, from totally opaque (0) to totally transparent (100). On the hue-circle, a* is a measure of redness (or -a* of greenness) and b* of yellowness (or -b* of blueness). The values of a* and b* vary between -60 and +60 (Carreño et al., 1995; Gil-Muñoz et al., 1997). Hue angle (H) and chroma (C) values are calculated from L*, a* and b* coordinates as H = arctan b*/a* (degrees) and C = [(a*)2 + (b*)2]0.5 (Carreño et al., 1995). The CIELAB colour system is widely used to evaluate food colours. Several researchers have used this system during research on grape and wine colour (Almela et al., 1995; Carreño et al., 1995; Carreño et al., 1997; Negueruela, et al., 1995; Ayala et al., 1999). CIELAB measurements normally require advanced, costly spectrophotometers. Simplified methods to calculate tristimulus values for wines and brandies from absorbance measures at only a few wavelengths have been proposed (Ayala et al., 1999; Pérez-Magariño and González-Sanjosé, 2003). Predicting CIELAB parameters from simple absorbance measures is more cost effective because inexpensive spectrophotometers can be used.
2.8.5 INFRARED SPECTROSCOPY
Infrared spectrometry is a resourceful tool for the qualitative and quantitative determination of molecular compounds. None to minimal sample preparation is required, which makes it a fast and environmentally friendly analytical technique to use in the laboratory environment (Skoog et al., 1998a; Dambergs et al., 2003; Palma and Barroso, 2002; Patz et al., 2004).
2.8.5.1 Theory
The infrared region of the light spectrum ranges from 12 800 cm-1 to 10 cm-1 wavenumbers or 0.78 µm to 1000 µm wavelengths. For the convenience of both application and instrumentation the infrared spectrum is divided into near-, mid-, and far-infrared radiation (Skoog et al., 1998a) (Table 4). These margins are not clearly defined and differ between references. Infrared spectroscopy involves the observation of absorption in the mid-infrared region of the light spectrum (Williams and Norris, 2001).
Table 4. The infrared spectral regions (adapted from Skoog et al., 1998a).
Region Wavelength range (μm) Wavenumber range (cm-1) Frequency range (Hz)
Near 0.78 to 2.5 12 800 to 4000 3.8 x 10¹⁴ to 1.2 x 10¹⁴
Middle 2.5 to 50 4000 to 200 1.2 x 10¹⁴ to 6.0 x 10¹²
Far 50 to 1000 200 to 10 6.0 x 10¹² to 3.0 x 10¹¹
Most used 2.5 to 15 4000 to 670 1.2 x 10¹⁴ to 2.0 x 10¹³

35
Organic compounds have chemical bonds which vibrate or rotate when exposed to characteristic wavelengths of infrared radiation. These vibrations are the outcome of energy absorption at specific wavelengths in the IR region. The forms of vibration include stretching, bending, twisting and rotating (Skoog et al., 1998a). For different chemical groups the absorbent wavelengths and natural frequency of vibration are unique and depend on the bond itself (C-C, C-O, O-H, etc) and on the molecular matrix. According to the Beer-Lambert law during absorption of infrared radiation the amplitude of the vibrational frequencies increases and is directly proportional to the concentration of the molecule in question (Skoog et al., 1998a). The basic measurement obtained in infrared spectroscopy is an infrared spectrum. This is a plot of absorbance (or transmittance) vs. wavenumber calculated with the aid of complex mathematical procedures from the intensities of measured frequencies of vibration (Smith, 1999). The infrared spectrum of an organic matrix therefore contains valuable information regarding the structure and concentration of chemical functional groups within a sample.
2.8.5.2 Instrumentation
During the last decade more sophisticated and relatively inexpensive instruments for the mid-infrared region have been developed. The three types of commercially available instruments are: (1) dispersive grating spectrophotometers; (2) multiplex instruments; and (3) nondispersive photometers. More traditional infrared instruments have filters that restrict absorption measurements to a limited number of wavelengths which limit applications (Skoog et al., 1998a). All infrared instruments need a source of uninterrupted infrared radiation and a sensitive infrared transducer. Sources of infrared radiation include Nernst Glowers, Globars, incandescent wires, mercury arcs, tungsten filament lamps and carbon dioxide lasers (Skoog et al., 1998a). Infrared transducers include thermal transducers, pyroelectric transducers and photoconducting transducers. In the most recent infrared instruments Michelson interferometers are used to modulate all the typical frequencies of the infrared electromagnetic region (Skoog et al., 1998a). Infrared spectrometers are based on the principle of interferometry. Interferometry exploits the wave nature of light and involves the splitting of a beam of light into two and then passing both through the sample being analysed before impressing them on an infrared detector creating a pattern called an inferogram (Skoog et al., 1998a). The Fourier Transform Infrared Spectrometer (FT-IR) is a type of multiplex instrument that collects every component of the full electromagnetic spectrum simultaneously at a detector (Skoog et al., 1998a). This wave-like pattern is collected in less than one second and contains all the frequencies that make up the infrared spectrum (Pavia et al., 2001). To extract information regarding the concentration of each component in the original spectrum produced on a multiplex instrument, the information must be decoded into its individual components. An infrared spectrum is established through decoding that predominantly utilises the classic mathematical tool known as Fourier transformation. The

36
total analysis time from spectrum collection to spectrum processing with Fourier transformation takes about 30 seconds (Foss Analytical, Denmark; Skoog et al., 1998a).
2.8.5.3 Chemometrics
Infrared spectroscopy (IR) does not involve a direct measurement of chemical compounds. Absorbance measured by an IR-instrument must be transformed into a mathematical equation or a calibration model in order to predict the concentration of an analyte of interest. A calibration or training set of samples is analysed by standard laboratory methods to obtain reference values and the samples are also scanned by an infrared spectrometer. During the calibration process the information in the spectrum created by the IR instrument is correlated to the absolute values of the compounds measured with the standard laboratory method (Williams and Norris, 2001). Multivariate statistical procedures are used for developing calibration models from spectroscopic data. Principal component analyses (PCA) and partial least squares analyses (PLS) are specialized techniques often used during multivariate statistical procedures. Principal component analysis (PCA) is a data reduction or compression tool which allows the visualisation of interrelationships between different variables, the detection and interpretation of sample patterns, groupings, similarities or differences (Esbensen, 2002; Naes et al., 2002). PLS is a bilinear regression modelling method where original x variables are projected onto a smaller number of factors or PLS components. Bilinear modelling methods are used for situations where collinearity exists among the original variables. The PLS algorithm is used to correlate IR spectra and analytical reference results obtained (Esbensen, 2002).
2.8.5.4 Applications of infrared spectroscopy for grape and wine analyses
In recent years applications of infrared spectroscopy in various chemical fields including the pharmaceutical, food and textile industries have escalated at a staggering rate. Applications in viticulture and oenology include analyses for parameters such as sugar, pH, alcohol, total acidity, glucose/fructose, malic acid, lactic acid, total phenols, acetic acid, tartaric acid, CO2, glycerol, gluconic acid, sucrose, free amino nitrogen and ethyl carbamate (Gishen and Holdstock, 2000; Manley et al., 2001; Kupina and Shrikhande, 2003; Patz et al., 2004; Urbano-Cuadrado et al., 2005). In general the technique has shown good prediction and repeatability for most of the parameters. Near infrared spectroscopy (NIR) has been used for grape colour analyses (measured as total anthocyanins) (Gishen et al., 2002; Dambergs et al., 2003). Researchers also report positive results for the determination of phenolic concentrations in red wines with infrared spectroscopy (Cozzolino et al., 2004b; Versari et al., 2004; Grandjean et al., 2005). An automated flow injection system with FT-IR spectroscopic detection has successfully been utilized to study the interaction of polyphenols (tannins) with proline-rich proteins (gelatine) (Edelmann and Lendl, 2002). Schneider et al. (2004) showed that FT-IR is a potential tool for the quantification of glycosidic precursors, the non-volatile, non-odorant compounds partly responsible for the varietal aroma of most wines from non-

37
aromatic grapes. Infrared spectroscopy together with chemometrics is also a potential technique for the discrimination of cultivars and origin of wines (Cozzolino et al., 2003; Edelmann et al., 2001; Roussel et al., 2003) and distilled drinks (Palma and Barroso, 2002). There is a field of organic chemistry specifically interested in both the identification of organic compounds and structure clarification of unknown compounds by their IR spectra selected from IR spectral libraries or databases (Derendyaev et al., 2004). For the successful application and implementation of this analytical tool knowledge about the theoretical principles of infrared spectroscopy is essensial.
2.9 CONCLUSIONS
Researchers, viticulturists and winemakers are continually searching for accurate measures of grape and wine quality. It has been established that the anthocyanins and total phenolics concentrations in grapes are positively linked to final wine quality. The inclusion of these two parameters as part of grape quality control could provide important information regarding the quality and colour of grapes and wine. Analytical measures for the identification and quantification of anthocyanins and total phenolics concentrations in grapes and wines are mostly complex, time consuming and costly. Infrared spectroscopy is a simple, rapid, and accurate analytical technique fit for routine grapes and wine analysis. Improvements in infrared instrumentation such as the development of the WineScan FT 120 spectrometer have made this sophisticated technology accessible to the wine industry.
2.10 LITERATURE CITED
Allen, M. (1998). Phenolics demystified. Proceedings: Australian Society of Viticulture and Oenology (ASVO) Oenology Seminar (Phenolics and Extraction). Adelaide, Australia. pp. 4-11.
Almela, L., Javaloy, S., Fernández-López, J.A. and López-Roca, J.M. (1995). Comparison between the tristimulus measurements Yxy and L* a* b* to evaluate the colour of young red wines. Food Chem. 53, 321-327.
Amati, A., Piva, A., Castellari, M. and Arfelli, G. (1996). Preliminary studies on the effect of Oidium tuckeri on the phenolic composition of grapes and wines. Vitis. 35, 149-150.
Amerine, M.A., Berg, H.W., Kunkee, R.E., Ough, C.S., Singleton, V.L. and Webb, A.D. (eds.). 1980. The technology of wine making. 4th Ed. The AVI publishing company , Inc., Westport, Connecticut, pp. 186-254.
Asen, S. (1975). Factors affecting flower colour. Acta Hortic. 41, 57-68. Asen, S., Stewart, R.N. and Norris, K.H. (1972). Co-pigmentation of anthocyanins in plant tissues and its
effect on color. Phytochem. 11, 1139-1145. Atanasova, V., Fulcrand, H., Cheynier, V. and Moutounet, M. (2002). Effect of oxygenation on polyphenols
changes occurring in the course of wine-making. Anal. Chim. Acta. 458, 15-27. Auw, J.M., Blanco, V., O’Keefe, S.F. and Sims, C.A. (1996). Effect of processing on the phenolics and color
of Cabernet Sauvignon, Chambourcian, and Noble wines and juices. Am. J. Enol. Vitic. 47, 279-286. Ayala, F., Echávarri, J.F. and Negueruela, A.I. (1999). A new simplified method for measuring the color of
wines. III. All wines and brandies. Am. J. Enol. Vitic. 50, 359-363. Bakker, J. and Arnold, G.M. (1993). Analysis of sensory and chemical data for color evaluation of a range of
red port wines. Am. J. Enol. Vitic. 44, 27-34.

38
Bakker, J., Bridle, P., Bellworthy, S.J., Garcia-Viguera, C., Reader, H.P. and Watkins, S.J. (1998). Effect of sulphur dioxide and must extraction on colour, phenolic composition and sensory quality of red table wine. J. Sci. Food Agric. 78, 297-307.
Bakker, J., Preston, N.W. and Timberlake, C.F. (1986). The determination of anthocyanins in aging red wines: Comparison of HPLC and spectral methods. Am. J. Enol. Vitic. 37, 121-126.
Baptista, J.A.B., Tavares, J.F.P. and Carvalho, R.C.B. (2001). Comparison of polyphenols and aroma in red wines from Portugese mainland versus Azores Islands. Food Res. Int. 34, 345-355.
Baranac, J.M., Petranovič, N.A. and Dimitrič-Markovič, J.M. (1997). Spectroscopic study of anthocyanin copigmentation reactions. 2. Malvin and the nonglycosidized flavone quercitin. J. Agric. Food Chem. 45, 1694-1697.
Baranowski, J.D. and Nagel, C.W. (1981). Isolation and identification of the hydroxycinnamic acid derivatives in white Riesling wine. Am. J. Enol. Vitic. 32, 5-13.
Beggs, C.J., Kuhn, K., Böcker, R. and Wellmann, E. (1987). Phytochrome-induced flavonoid biosynthesis in mustard (Sinapis alba L.) cotyledons. Enzymic control and differential regulation of anthocyanin and quercetin formation. Planta. 172, 121-126.
Berente, B., De la Calle García, D., Reichenbächer, M. and Danzer, K. (2000). Method development for the determination of anthocyanins in red wines by high-performance liquid chromatography and classification of German red wines by means of multivariate statistical methods. J. Chromatogr. 871, 95-103.
Bergqvist, J., Dokoozlian, N.K. and Ebisuda, N. (2001). Sunlight exposure and temperature effects on berry growth and composition of Cabernet Sauvignon and Grenache in the Central San Joaquin Valley of California. Am. J. Enol. Vitic. 52, 1-7.
Boss, P.K., Davies, C. and Robinson, S.P. (1996a). Analysis of the expression of anthocyanin pathway genes in developing Vitis vinifera L. cv. Shiraz grape berries and the implications for pathway regulation. Plant Physiol. 111, 1059-1066.
Boss, P.K., Davies, C. and Robinson, S.P. (1996b). Anthocyanin composition and anthocyanin pathway gene expression in grapevine sports differing in berry skin colour. Aust. J. Grape Wine Res. 2, 163-170.
Boss, P.K., Davies, C. and Robinson, S.P. (1996c). Expression of anthocyanin biosynthesis pathway genes in red and white grapes. Plant Mol. Biol. 32, 565-569.
Boulton, R.B. (2001). The copigmentation of anthocyanins and its role in the color of red wine: A critical review. Am. J. Enol. Vitic. 52, 67-87.
Boulton, R.B., Singleton, V.L., Bisson, L.F. and Kunkee, R.E. (eds.). 1996a. Principles and Practices of Winemaking. 1st Ed. Chapman & Hall, New York, USA. pp. 13-65.
Boulton, R.B., Singleton, V.L., Bisson, L.F. and Kunkee, R.E. (eds.). 1996b. Principles and Practices of Winemaking. 1st Ed. Chapman & Hall, New York, USA. pp. 193-244.
Boulton, R.B., Singleton, V.L., Bisson, L.F. and Kunkee, R.E. (eds.). 1996c. Principles and Practices of Winemaking. 1st Ed. Chapman & Hall, New York, USA. pp. 279-320.
Bowyer, P.K. (2002). Phenolics: a peek inside the Pandora’s box of organic chemistry. Aust. & New Zea. Grapegrower Winemaker Ann. Tech. Issue. pp. 67-70.
Brady, C.J. (1987). Fruit ripening. Ann. Rev. Plant Phys. 38, 155-178. Bravdo, B., Hepner, Y., Loinger, C., Cohen, S. and Tabacman, H. (1985). Effect of irrigation and crop level
on growth, yield and wine quality of cv. Cabernet Sauvignon. Am. J. Enol. Vitic. 36, 132-139. Bridle, P. and Timberlake, C.F. (1997). Anthocyanins as natural food colours – selected aspects. Food
Chem. 58, 103-109. Brouillard, R. (1982). Chemical structure of anthocyanins. Ed. Markakis, P. In Anthocyanins as Food Colors,
1st Ed. Academic Press, New York. pp. 1-40. Brouillard, R. (1988). Flavonoids and flower colour. Ed. Harborne, J.B. In The Flavonoids – Advances in
Research since 1980. 1st Ed. Chapman & Hall, London. pp. 525-538. Brouillard, R. (1981). Origin of the exceptional colour stability of the Zebrina anthocyanin. Phytochem. 20,
143-145. Brouillard, R. (1983). The in vivo expression of anthocyanins. Phytochem. 22, 1311-1323. Brouillard, R. and Lang, J. (1990). The hemiacetal-cis-chalcone equilibrium of malvin, a natural anthocyanin.
Canad. J. Chem. 68, 755-761. Brouillard, R. and Dangles, O. (1994). Anthocyanin molecular interactions: the first step in the formation of
new pigments during wine aging? Food Chem. 51, 365-371.

39
Brouillard, R., Chassaing, S. and Fougerousse, A. (2003). Why are grape/fresh wine anthocyanins so simple and why is it that red wine color lasts so long? Phytochem. 64, 1179-1186.
Brouillard, R., Mazza, G., Saad, Z., Albrecht-Gary, A.M. and Cheminat, A. (1989). The copigmentation reaction of anthocyanins: a microprobe for structural study of aqueous solutions. J. Am. Chem. Soc. 111, 2604-2610.
Carnacini, A., Zironi, R., Potentini, G., Antonelli, A., Palotta, U. and Amati, A. (1991). Influence of the conservation conditions and aging on composition of wines obtained by carbonic maceration from grapes cv. Montepulciano. Vitic. Enol. Sci. 46, 93-99.
Carreño, J., Almela, L., Martínez, A. and Fernández-López, J.A. (1997). Chemotaxonomical classification of red table grapes based on anthocyanin profile and external colour. Lebensm.-Wiss. U.-Technol. 30, 259-265.
Carreño, J., Martínez, A., Almela, L. and Fernández-López, J.A. (1995). Proposal of an index for the objective evaluation of the colour of red table grapes. Food Res. Int. 28, 373-377.
Castillo-Sánchez, J.J., Mejuto, J.C., Garrido, J. and García-Falcón, S. (2005). Influence of wine-making protocol and fining agents on the evolution of the anthocyanin content, colour and general organoleptic quality of Vinhão wines. Food Chem. In press, corrected proof. Available online 8 June 2005
Cheynier, V. and Rigaud, J. (1986). HPLC separation and characterization of flavonols in the skins of Vitis vinifera var. Cinsaut. Am. J. Enol. Vitic. 37, 348-252.
CIE (1986). Colorimetry. 2nd Ed. Publication C.I.E. No. 15.2, Central Bureau of the Commission Internationale de L’Eclairage, Vienna.
Computerworld, 2002. www.computerworld.com/softwaretopics/software/story/0,10801,67718,00.htmlCoombe, B.G. (1973). The regulation of set and development of the grape berry. Acta Hortic. 34, 261-273. Coombe, B.G. and Bishop, G.R. (1980). Development of the grape berry. II. Changes in the diameter and
deformability during véraison. Aust. J. Agric. Res. 31, 499-509. Cozzolino, D., Esler, M.B., Dambergs, R.G., Cynkar, W.U., Boehm, D.R., Francis, I.L. and Gishen, M.
(2004a). Prediction of colour and pH in grapes using a diode array spectrophotometer (400-1100nm). J. Near Infrared Spectrosc. 12, 105-111.
Cozzolino, D., Kwiatkowski, M.J., Parker, M., Cynkar, W.U., Dambergs, R.G., Gishen, M. and Herderich, M.J. (2004b). Prediction of phenolic compounds in red wine fermentations by visible and near infrared spectroscopy. Anal. Chim. Acta. 513, 73-80.
Cozzolino, D., Smyth, H.E. and Gishen, M. (2003). Feasibility study on the use of visible and near-infrared spectroscopy together with chemometrics to discriminate between commercial white wines of different variatal origins. J. Agric. Food Chem. 51, 7703-7708.
Crippen, D.D. and Morrison, J.C. (1986). The effects of sun exposure on the compositional development of Cabernet Sauvignon berries. Am. J. Enol. Vitic. 37, 235-242.
Cynkar, W.U., Cozzolino, D., Dambergs, R.G., Janik, L. and Gishen, M. (2004). The effects of homogenization method and freezing on the determination of quality parameters in red grape berries of Vitis vinifera. Aust. J. Grape Wine Res. 10, 236-242.
Dadic, M. and Belleau, G. (1973). Polyphenols and beer flavor. Proc. Am. Soc. Brew. Chem. 4, 107-114. Dallas, C. and Laureano, O. (1994). Effects of pH, sulphur dioxide, alcohol content, temperature and storage
time on colour composition of a young Portuguese red table wine. J. Sci. Food Agric. 65, 477-485. Dambergs, R.G., Cozzolino, D., Esler, M.B., Cynkar, W.U., Kambouris, A., Francis, I.L., Høj, P.B. and
Gishen, M. (2003). The use of near infrared spectroscopy for grape quality measurement. Aust. & New Zea. Grapegrower Winemaker Ann. Tech. Issue. pp. 69-76.
Darias-Martín, J., Carrillo, M., Díaz, E. and Boulton, R.B. (2001). Enhancement of red wine colour by pre-fermentation addition of copigments. Food Chem. 73, 217-220.
Datacolor, 2004a. http://www.datacolor.com/color_experts_003.shtmlDatacolor. 2004b. http://www.datacolor.com/color_experts_004.shtmlDe Freitas, V.A.P. and Glories, Y. (1999). Concentration and compositional changes of procyanidins in grape
seeds and skin of white Vitis vinifera varieties. J. Sci. Food Agric. 79, 1601-1606. Derendyaev, B.G., Bogdanova, T.F., Piottukh-Peletsky, V.N. and Makarov, L.I. (2004). Fast taxonomy of
chemical structures selected from IR spectral database. Anal. Chim. Acta. 509, 209-216. Dokoozlian, N.K. and Kliewer, W.M. (1996). Influence of light on grape berry growth and composition varies
during fruit development. J. Am. Soc. Hort. Sci. 121, 869-874.

40
Downey, M.O., Harvey, J.S. and Robinson, S.P. (2003a). Analysis of tannins in seeds and skins of Shiraz grapes throughout berry development. Aust. J. Grape Wine Res. 9, 15-27.
Downey, M.O., Harvey, J.S. and Robinson, S.P. (2003b). Synthesis of flavonols and expression of flavonols synthase genes in the developing grape berries of Shiraz and Chardonnay (Vitis vinifera L.). Aust. J. Grape Wine Res. 9, 110-121.
Downey, M.O., Harvey, J.S. and Robinson, S.P. (2004a).The effect of bunch shading on berry development and flavonoid accumulation in Shiraz grapes. Aust. J. Grape Wine Res. 10, 55-73.
Downey, M.O., Hogg, A.S., Krstic, M.P. and Robinson, S.P. (eds.). 2004b. The effect of bunch exposure on anthocyanin accumulation in Shiraz and Cabernet Sauvignon (Vitis vinifera L.) grapes and wine. Eds. Blair, R., Williams, P. and Pretorius, S. In Proceedings of the twelfth Australian wine industry technical conference; 19-24 July 2004; Melbourne, Victoria. pp. 75-78.
Dry, P.R., Loveys, B.R., Stoll, M., Steward, D. and McCarthy, M.G. (2000). Partial rootzone drying – an update. Aust. Grapegrower Winemaker. Ann. Tech. Issue. pp. 35-39.
Du Plessis, C.S. (1984). Optimum maturity and quality parameters in grapes: A review. S. Afr. J. Enol. Vitic. 5, 35-42.
Edelmann, A., Diewok, J., Schuster, K.C. and Lendl, B. (2001). Rapid method for the discrimination of red wine cultivars based on mid-infrared spectroscopy of phenolic wine extracts. J. Agric. Food Chem. 49, 1139-1145.
Edelmann, A. and Lendl, B. (2002). Toward the optical tongue: Flow-through sensing of tannin-protein interactions based on FTIR spectroscopy. J. Am. Chem. Soc. 124, 741-747.
Esbensen, K.H. (ed.). 2002. Multivariate Data Analysis – In Practise. 5th Ed. Camo Process AS, Oslo, Norway.
Falchetti, R., Fuggetta, M.P., Lanzilli, G., Tricarico, M. and Ravagnan, G. (2001). Effects of resveratrol on human immune cell function. Life Sci. 70, 81-96.
Favretto, D. and Flamini, R. (2000). Application of electrospray ionization mass spectrometry to the study of grape anthocyanins. Am. J. Enol. Vitic. 51, 55-64.
Fernández de Simon, M.B., Hidalgo, V. and Almela, J.M.L. (1992). Variation in phenol content in grapes during ripening: Low-molecular-weight phenols. Z. Lebensm.-Unters.-Forsch. 194, 351-354.
Fernández-López, J.A., Almela, L., Muñoz, J.A., Hidalgo, V. and Carreño, J. (1998). Dependence between colour and individual anthocyanin content in ripening grapes. Food Res. Int. 31, 667-672.
Foss Analytical, Denmark. http://www.foss.dkFrancis, I.L., Iland, P.G., Cynkar, W.U., Kwiatkowski, M., Williams, P.J., Armstrong, H., Botting, D.G., Gawel,
R. and Ryan, C. (eds.). 1999. Assessing wine quality with the G-G assay. Eds. Blair, R.J., Sas, A.N., Hayes, P.F. and Høj, P.B. In Proceedings of the tenth Australian wine industry technical conference; 2-5 August 1998; Adelaide, South Australia. pp. 104-108.
Fulcrand, H., Doco, T., Es-Safi, N.-E., Cheynier, V. and Moutounet, M. (1996). Study of the acetaldehyde induced polymerization of flavan-3-ols by liquid chromatography-ion spray mass spectrometry. J. Chromatogr. 752, 85-91.
Gao, L., Girard, B., Mazza, G. and Reynolds, A.G. (1997). Changes in anthocyanins and color characteristics of Pinot Noir wines during different vinification processes. J. Agric. Food Chem. 45, 2003-2008.
Gawel, R. (1998). Red wine astringency: a review. Aust. J. Grape Wine Res. 4, 74-95. Gil-Muñoz, R., Gómez-Plaza, E., Martínez, A. and López-Roca, J.M. (1997). Evolution of the CIELAB and
other spectrophotometric parameters during wine fermentation. Influence of some pre and postfermentative factors. Food Res. Int. 30, 699-705.
Gil-Muñoz, R., Gómez-Plaza, E., Martínez, A. and López-Roca, J.M. (1999). Evolution of phenolic compounds during wine fermentation and post-fermentation: Influence of grape temperature. J. Food Comp. and Anal. 12, 259-272.
Ginestar, C., Eastham, J., Gray, S. and Iland, P. (1998). Use of sap-flow sensors to schedule vineyard irrigation. II. Effects of post-veraison water deficits on composition of Shiraz grapes. Am. J. Enol. Vitic. 49, 421-428.
Girard, B., Yuksel, D., Cliff, M.A., Delaquis, P. and Reynolds, A.G. (2001). Vinification effects on the sensory, colour and GC profiles of Pinot noir wines from British Columbia. Food Res. Int. 34, 483-499.
Gishen, M. and Holdstock, M. (2000). Preliminary evaluation of the performance of the Foss WineScan FT 120 instrument for the simultaneous determination of several wine analyses. Aust. Grapegrower Winemaker Ann. Tech. Issue. pp. 75-81.

41
Gishen, M., Iland, P.G., Dambergs, R.G., Esler, M.B., Francis, I.L., Kambouris, A., Johnstone, R.S. and Høj, P.B. (eds.). 2002. Objective measures of grape and wine quality. Eds. Blair, R.J., Williams, R.J. and Høj, P.B. In Proceedings of the eleventh Australian wine industry technical conference; 7-11 October 2001; Adelaide, South Australia. pp. 188-194.
Glories, Y. and Augustine, M. (1993). Maturité phénolique du raisin, consequences technologiques: application aux millésimes 1991 et 1992. Acta Colloque J. Tech.; 21 Janvier 1993; Bordeaux. pp. 56-61.
Gómez-Míguez, M. and Heredia, F.J. (2004). Effect of the maceration technique on the relationships between anthocyanin composition and objective color of Syrah wines. J. Agric. Food Chem. 52, 5117-5123.
Gómez-Plaza, E., Gil-Muñoz, R., López-Roca, J.M. and Martínez, A. (2000). Color and phenolic compounds of a young red wine. Influence of wine-making techniques, storage temperature, and length of storage time. J. Agric. Food Chem. 48, 736-741.
Gómez-Plaza, E., Gil-Muñoz, R., López-Roca, J.M., Martínez-Cutillas, A. and Fernández-Fernández, J.I. (2002). Maintenance of colour composition of a red wine during storage. Influence of prefermentative practices, maceration time and storage. Lebensm.-Wiss. U.-Technol. 35, 46-53.
Grandjean, E., Monamy, C., Masse, L. and Girard, F. (2005). Development of a rapid method for the assessment of phenolic maturity in Burgundy Pinot Noir. http://www.vinidea.net, wine internet technical journal, Nº8.
Guerrand, D. and Gervais, J.-P. (2002). Extraction of red wine phenolics during fermentation: a new pectinase preparation. Aust. & New Zea. Grapegrower Winemaker (November). pp. 60-64.
Haight, K.G. and Gump, B.H. (1994). The use of macerating enzymes in grape juice processing. Am. J. Enol. Vitic. 45, 113-116.
Håkansson, A.E., Pardon, K., Hayasaka, Y., De Sa, M. and Herderich, M. (2003). Structures and colour properties of new red wine pigments. Tetrahedron Lett. 44, 4887-4891.
Hardie, W.J., O’Brien, T.P. and Jaudzems, V.G. (eds.). 1996. Cell biology of grape secondary metabolism - a viticultural perspective. Eds. Stockley, C.S., Sas, A.N., Johnstone, R.S. and Lee, T.H. In Proceedings of the ninth Australian wine industry technical conference; 16-19 October 1995; Adelaide, South Australia. pp. 78-82.
Haselgrove, L., Botting, D., Van Heeswijck, R., Høj, P.B., Dry, P.R., Ford, C. and Iland, P.G. (2000). Canopy microclimate and berry composition: The effect of bunch exposure on the phenolic composition of Vitis vinifera L. cv. Shiraz grape berries. Austr. J. Grape Wine Res. 6, 141-149.
Haslam, E. (ed.). 1998a. Practical Polyphenolics: From Structure to Molecular Recognition and Physiological Action. 1st Ed. Cambridge University Press, UK. pp. 10-83.
Haslam, E. (ed.). 1998b. Practical Polyphenolics: From Structure to Molecular Recognition and Physiological Action. 1st Ed. Cambridge University Press, UK. pp. 270-274.
Haslam, E. and Lilley, T.H. (1988). Natural astringency in foodstuffs – a molecular interpretation. Crit. Rev. Food Sci. Nutr. 27, 1-40.
Hebrero, E., Santos-Buelga, C. and Rivas-Gonzalo, J.C. (1988). High performance liquid chromatography-diode array spectroscopy identification of anthocyanins of Vitis vinifera variety Tempranillo. Am. J. Enol. Vitic. 39, 227-233.
Heller, W. and Forkman, G. (1988). Biosynthesis. Ed. Harborne, J.B. In The Flavonoids – Advances in Research since 1980, Chapman & Hall, London. pp. 399-425.
Hermosín Gutiérrez, I., Sánchez-Palomo Lorenzo, E. and Vicario Espinosa, A. (2005). Phenolic composition and magnitude of copigmentation in young and shortly aged red wines made from the cultivars, Cabernet Sauvignon, Cencibel, and Syrah. Food Chem. 92, 269-283.
Hmamouchi, M., Es-Safi, N., Lahrichi, M., Fruchier, A. and Essassi, E.M. (1996). Flavones and flavonols in leaves of some Moroccan Vitis vinifera cultivars. Am. J. Enol. Vitic. 47, 186-192.
Holton, T.A. and Cornish, E.C. (1995). Genetics and biochemistry of anthocyanin biosynthesis. Plant Cell. 7, 1071-1083.
Hoshino, T. (1991). An approximate estimate of self-association constants and the self-stacking conformation of malvin quinonoidal boxes studied by HNMR. Phytochem. 30, 2049-2055.
Hoshino, T., Matsumoto, U. and Goto, T. (1981). Self-association of some anthocyanins in neutral aqueous solution. Phytochem. 20, 1971-1976.

42
Hoshino, T., Matsumoto, U., Goto, T. and Harada, N. (1982). Evidence for the self-association of anthocyanins. IV. PMR spectroscopic evidence for the vertical stacking of anthocyanin molecules. Tetrahedron Lett. 23, 433-436.
Hrazdina, G., Parsons, G.F. and Mattick, L.R. (1984). Physiological and biochemical events during development and maturation of grape berries. Am. J. Enol. Vitic. 35, 220-227.
Hunter, J.J., De Villiers, O.T. and Watts, J.E. (1991). The effect of partial defoliation on quality characteristics of Vitis vinifera L. cv. Cabernet Sauvignon grapes II. Skin color, skin sugar, and wine quality. Am. J. Enol. Vitic. 42, 13-18.
Hunter, J.J., Ruffner, H.P., Volschenk, C.G. and Le Roux, D.J. (1995). Partial defoliation of Vitis vinifera cv. Cabernet Sauvignon/99 Richter: Effect on root growth, canopy efficiency, grape composition, and wine quality. Am. J. Enol. Vitic. 46, 306-314.
Iland, P.G. (1987). Predicting red wine colour from grape analysis. Aust. Grapegrower Winemaker. 285, 29. Iland, P.G., Cynkar, W., Francis, I.L., Williams, P.J. and Coombe, B.G. (1996). Optimisation of methods for
the determination of total and red-free glycosyl glucose in black grape berries of Vitis vinifera. Aust. J. Grape Wine Res. 2, 171-178.
Iland, P., Ewart, A., Sitters, J., Markides, A. and Bruer, N. (eds.). 2000a. Techniques for chemical analysis and quality monitoring during winemaking. 1st Ed. Patrick Iland Wine Promotions, Campbelltown, Australia. pp. 78-79.
Iland, P., Ewart, A., Sitters, J., Markides, A. and Bruer, N. (eds.). 2000b. Techniques for chemical analysis and quality monitoring during winemaking. 1st Ed. Patrick Iland Wine Promotions, Campbelltown, Australia. pp. 98-99.
Jackson, R.S. (ed.). 1994. Wine Science. Principles and Applications. 1st Ed. Academic Press, Inc. San Diego, California. pp. 220-276.
Jackson, D.I. and Lombard, P.B. (1993). Environmental and management practices affecting grape composition and wine quality – A review. Am. J. Enol. Vitic. 44, 409-430.
Jackson, M.G., Timberlake, C.F., Bridle, P. and Vallis, L. (1978). Red wine quality: Correlations between colour, aroma, and flavour and pigment and other parameters of young Beaujolais. J. Sci. Food Agric. 29, 715-727.
Jang, M., Cai, L., Udeani, G.O., Slowing, K.V., Thomas, C.F., Beecher, C.W.W., Fong, H.H.S., Farnsworth, N.R., Kinghorn, A.D., Mehta, R.G., Moon, R.C. and Pezzuto, J.M. (1997). Cancer chemoprotective activity of resveratrol, a natural product derived from grapes. Science. 275, 218-220.
Jeandet, P., Bessis, R. and Gautheron, B. (1991). The production of resveratrol (3,5,4-trihydroxylstilbene) by grape berries in different development stages. Am. J. Enol. Vitic. 42, 41-46.
Jeong, S.T., Goto-Yamamoto, N., Kobayashi, S. and Esaka, M. (2004). Effects of plant hormones and shading on the accumulation of anthocyanins and the expression of anthocyanin biosynthetic genes in grape berry skins. Plant Sci. 167, 247-252.
Jones, G.V. and Davis, R.E. (2000). Climate influences on grapevine phenology, grape composition, and wine production and quality for Bordeaux, France. Am. J. Enol. Vitic. 51, 249-261.
Jordão, A.M., Ricardo-da-Silva, J.M. and Laureano, O. (2001). Evolution of catechins and oligomeric procyanidins during grape maturation of Castelão Francês and Touriga Francesa. Am. J. Enol. Vitic. 52, 230-234.
Kataoka, I., Yasutaka, K., Sugiura, A. and Tomana, T. (1983). Changes in L-phenylalanine ammonia-lyase activity and anthocyanin synthesis during berry ripening of three grape cultivars. J. Jap. Soc. Hort. Sci. 52, 273-279.
Keller, M. and Hrazdina, G. (1998). Interaction of nitrogen availability during bloom and light intensity during veraison. II. Effect on anthocyanin and phenolic development during grape ripening. Am. J. Enol. Vitic. 49, 341-349.
Kennedy, J.A., Hayasaka, Y., Vidal, S., Waters, E.J. and Jones, G.P. (2001). Composition of grape skin proanthocyanidins at different stages of berry development. J. Agric. Food Chem. 49, 5348-5355.
Kennedy, J.A., Matthews, M.A. and Waterhouse, A.L. (2000a). Changes in grape seed polyphenols during ripening. Phytochem. 55, 77-85.
Kennedy, J.A., Matthews, M.A. and Waterhouse, A.L. (2002). Effect of maturity and vine water status on grape skin and wine flavonoids. Am. J. Enol. Vitic. 53, 268-274.

43
Kennedy, J.A., Troup, G.J., Pilbrow, J.R., Hutton, D.R., Hewitt, D., Hunter, C.R., Ristic, R., Iland, P.G. and Jones, G.P. (2000b). Development of seed polyphenols in berries from Vitis vinifera L. cv. Shiraz. . Aust. J. Grape Wine Res. 6, 244-254.
Kliewer, W.M. (1970). Effect of day temperature and light intensity on coloration of Vitis vinifera L. grapes. J. Am. Soc. Hort. Sci. 95, 693-697.
Kliewer, W.M. and Torres, R.E. (1972). Effect of controlled day and night temperatures on grape coloration. Am. J. Enol. Vitic. 23, 71-77.
Kobayashi, S., Ishimaru, M., Ding, C.K., Yakushiji, H. and Goto, N. (2001). Comparison of UDP-glucose-flavonoid 3-o -glucosyltransferase (UFGT) gene sequences between white grapes (Vitis vinifera) and their sports with red skins. Plant Sci. 160, 543-550.
Kong, J.-M., Chia, L.-S., Goh, N.-K., Chia, T.-F. and Brouillard, R. (2003). Analysis and biological activities of anthocyanins. Phytochem. 64, 923-933.
Košir, I.J., Lapornik, B., Andrenšek, S., Wondra, A.G., Vrhovšek, U. and Kidrič, J. (2004). Identification of anthocyanins in wines by liquid chromatography, liquid chromatography-mass spectrometry and nuclear magnetic resonance. Anal. Chim. Acta. 513, 277-282.
Kupina, S.A. and Shrikhande, A.J. (2003). Evaluation of a Fourier transform infrared instrument for rapid quality-control wine analyses. Am. J. Enol. Vitic. 54, 131-134.
Kwiatkowski, M.J., Peng, Z.K., Waters, E.J., Godden, P.W., Day, C.J., Clarke, S.J. and Herderich, M.J. (eds.). 2002. Polyphenols, pigmented polymers and red wine colour: results of the 2001 large scale winemaking trial. Eds. Blair, R.J., Williams, R.J. and Høj, P.B. In Proceedings of the eleventh Australian wine industry technical conference; 7-11 October 2001; Adelaide, South Australia. pp. 150-151.
Lamuela-Raventós, R.M., Romero-Perez, A.I., Waterhouse, A.L. and De la Torre-Boronat, M.C. (1995). Direct HPLC analysis of cis- and trans-resveratrol and picied isomers in spanish red Vitis vinifera wines. J. Agric. Food Chem. 43, 281-283.
Lamuela-Raventós, R.M. and Waterhouse, A.L. (1994). A direct HPLC separation of wine phenolics. Am. J. Enol. Vitic. 45, 1-5.
Lee, C.Y. and Jaworski, A. (1989). Major phenolic compounds in ripening white grapes. Am. J. Enol. Vitic. 40, 43-46.
Macheix, J.J., Fleuriet, A. and Billot, J. (eds.). 1990. Fruit Phenolics. 1st Ed. CRC Press, Boca Raton. Macheix, J.-J., Sapis, J.-C. and Fleuriet, A. (1991). Phenolic compounds and polyphenoloxidase in relation to
browning in grapes and wines. Crit. Rev. Food Sci. Nutr. 30, 441-486. Main, G. and Morris, J. (1991). Color of Riesling and Vidal wines as affected by bentonite, cufex and sulfur
dioxide juice treatments. Am. J. Enol. Vitic. 46, 255-261. Manley, M., Van Zyl, A. and Wolf, E.E.H. (2001). The evaluation of the applicability of Fourier transform near-
infrared (FT-NIR) spectroscopy in the measurement of analytical parameters in must and wine. S. Afr. J. Enol. Vitic. 22, 93-100.
Marais, J., Iland, P. and Swart, E. (2001). Exploring the relationships between Pinotage grape colour and wine quality – Prelimimary results. Wineland (February 2001), 76-78.
Marais, J. and October, F. (2005). Relationships between grape colour and wine quality. Wineland (July 2005), 85-87.
Margalit, Y. (ed.). 1997. Concepts in wine chemistry. 1st Ed. The wine appreciation guild Ltd., San Francisco, USA. pp. 186-207.
Matthews, M.A., Ishii, R., Anderson, M.M. and O’Mahony, M. (1990). Dependence of wine sensory attributes on vine water status. J. Sci. Food Agric. 51, 321-335.
Maujean, A., Brun, O., Vesselle, G., Bureau, G., Boucher, J.M. and Cousin, M. (1983). Investigations on grapevine maturation in the Champagne region: method of forecasting the harvesting date. Vitis. 22, 137-150.
Maury, C., Sarni-Manchado, P., Lefebvre, S., Cheynier, V. and Moutounet, M. (2001). Influence of fining with different molecular weight gelatins on proanthocyanidin composition and perception of wines. Am. J. Enol. Vitic. 52, 140-145.
Mayer, A.M. and Harel, E. (1979). Review: polyphenols oxidase in plants. Phytochem. 18, 193-225. Mazza, G. and Miniati, E. (eds.). 1993a. Anthocyanins in Fruits, Vegetables, and Grains. 1st Ed. CRC Press,
Inc., Boca Raton, USA. pp. 1-28.

44
Mazza, G. and Miniati, E. (eds.). 1993b. Anthocyanins in Fruits, Vegetables, and Grains. 1st Ed. CRC Press, Inc., Boca Raton, USA. pp. 149-199.
McCarthy, M.G. (1999). Weight loss from ripening berries of Shiraz grapevines (Vitis vinifera L. cv. Shiraz). Aust. J. Grape Wine Res. 5, 10-16.
Mori, K., Sugaya, S. and Gemma, H. (2005). Decreased anthocyanin biosynthesis in grape berries grown under elevated night temperature condition. Sci. Hortic. 105, 319-330.
Morrison, J.C. and Noble, A.C. (1990). The effects of leaf and cluster shading on the composition of Cabernet Sauvignon grapes and on fruit and wine sensory properties. Am. J. Enol. Vitic. 41, 193-200.
Moskowitz, A.H. and Hrazdina, G. (1981). Vacuolar contents of fruit subepidermal cells from Vitis species. Plant Physiol. 68, 686-692.
Muñoz, O., Sepúlveda, M. and Schwartz, M. (2004). Effects of enzymatic treatment on anthocyanic pigments from grapes skin from Chilean wine. Food Chem. 87, 487-490.
Naes, T., Isaksson, T. Fearn, T. and Davies, T. (eds). 2002. A user-friendly guide to multivariate calibration an classification. NIR Publications, Chichester, UK.
Nagel, C.W., Herrick, I.W. and Graber, W.R. (1987). Is chlorogenic acid bitter? Am. J. Enol. Vitic. 52, 213. Negueruela, A.I., Echávarri, J.F. and Pérez, M.M. (1995). A study of correlation between enological
colorimetric indexes and CIE colorimetric parameters in red wines. Am. J. Enol. Vitic. 46, 353-356. Netzel, M., Strass, G., Bitsch, I., Könitz, R., Christmann, M. and Bitsch, R. (2003). Effect of grape processing
on selected antioxidant phenolics in red wine. J. Food Eng. 56, 223-228. Noble, A.C. (1994). Bitterness in wine. Physiol. Behav. 56, 1251-1255. Oberholster, A. (2003). Effect of viticultural and winemaking practices on the phenolic composition of grapes
and wines. Part II. Wineland (April 2003), 64-68. OIV (1978). Recueil des methods internationals d’analyse des vins. Caractéristiques chromatiques. Paris:
OIV. pp. 16-30. Ong, B.Y. and Nagel, C.W. (1978). Hydroxycinnamic acid-tartaric acid ester content in mature grapes and
during the maturation of White Riesling grapes. Am. J. Enol. Vitic. 29, 277-281. Ough, C.S. and Berg, H.W. (1974). The effect of two commercial pectic enzymes on grape musts and wines.
Am. J. Enol. Vitic. 25, 208-211. Ough, C.S., Noble, A.C. and Temple, D. (1975). Pectic enzyme effects on red grapes. Am. J. Enol. Vitic. 26,
195-200. Palma, M. and Barroso, C.G. (2002). Application of FT-IR spectroscopy to the characterization and
classification of wines, brandies and other distilled drinks. Talanta. 58, 265-271. Pardo, F., Salinas, M.R., Alonso, G.L., Navarro, G. and Huerta, M.D. (1999). Effect of diverse enzyme
preparations on the extraction and evolution of phenolic compounds in red wines. Food Chem. 67, 135-142.
Patz, C.-D., Blieke, R., Ristow, H. and Dietrich, H. (2004). Application of FT-MIR spectrometry in wine analysis. Anal. Chim. Acta. 513, 81-89.
Pavia, D.L., Lampman, G.M. and Kriz, G.S. (eds.). 2001. Introduction to Spectroscopy. 3rd Ed. Harcourt College Publishers, Philadelphia, USA. pp. 13-84.
Pellegrini, N., Simonetti, P., Gardana, C., Brenna, O., Brighenti, F and Pietta, P. (2000). Polyphenol content and total antioxidant activity of vini novella (young red wines). J. Agric. Food. Chem. 48, 732-735.
Pérez-Magariño, S. and González-Sanjosé, M.L. (2003). Application of absorbance values used in wineries for estimation CIELAB parameters in red wines. Food Chem. 81, 301-306.
Piergiovanni, L. and Volonterio, G. (1980). Techniche cromatografiche nello studio della frazione antocianica delle uve. Riv. Vitic. Enol. 33, 289-308.
Piermattei, B., Piva, A., Castellari, M., Arfelli, G. and Amati, A. (1999). The phenolic composition of red grapes and wines as influenced by Oidium tuckeri development. Vitis. 38, 85-86.
Pirie, A. and Mullins, M.G. (1977). Interrelationships of sugars, anthocyanins, total phenols and dry weight in the skin of grape berries during ripening. Am. J. Enol. Vitic. 28, 204-209.
Pirie, A.J.G. and Mullins, M.G. (1980). Concentration of phenolics in the skin of grape berries during fruit development and ripening. Am. J. Enol. Vitic. 31, 34-36.
Price, S.F., Breen, P.J., Valladao, M. and Watson, B.T. (1995). Cluster sun exposure and quercetin in Pinot noir grapes and wine. Am. J. Enol. Vitic. 46, 187-194.

45
Prieur, C., Rigaud, J., Cheynier, V. and Moutounet, M. (1994). Oligomeric and polymeric procyanidins from grape seeds. Phytochem. 36, 781-784.
Ribéreau-Gayon, P. (1965). Les acides-phénols de Vitis vinifera. Comptes Rendus de l’ Académie des Sciences de Paris, 260, 341-343.
Ribéreau-Gayon, P., Dubourdieu, D., Donèche, B. and Lonvaud, A. (eds.). 2000. Handbook of Enology. Volume 2. The Chemistry of Wine and Stabilization and Treatments. 1st Ed. John Wiley & Sons, Ltd., West Sussex, England. pp. 129-185.
Ribero de Lima, M.T., Waffo-Teguo, P., Teissedre, P.L., Pujolas, A., Vercauteren, J., Cabanis, J.C. and Merillon, J.M. (1999). Determination of stilbenes (trans-astringin, cis- and trans-piceid, and cis- and trans-resveratrol) in Portuguese wines. J. Agric. Food Chem. 47, 2666-2670.
Ricardo da Silva, J.M., Rosec, J.P., Bourzeix, M., Mourgues, J. and Moutounet, M. (1992). Dimer and trimer procyanidins in Carignan and Mourvédre grapes and red wines. Vitis. 31, 55-63.
Richey, J.G. and Waterhouse, A.L. (1999). A standard red wine: Monomeric phenolic analysis of commercial Cabernet Sauvignon wines. Am. J. Enol. Vitic. 50, 91-100.
Rigaud, J., Escribano-Bailon, M.T., Prieur, C., Souquet, J.-M. and Cheynier, V. (1993). Normal-phase high performance liquid chromatographic separation of procyanidins from cacao beans and grape seeds. J. Chromatogr. 654, 255-260.
Rizzon, L.A., Miele, A., Meneguzzo, J. and Zanuz, M.C. (1999). Effect of three processes of vinification on chemical composition and quality of Cabernet Franc wine. Pesquisa Agro. Brasil. 34, 1285-1293.
Robinson, G.M. and Robinson, R. (1931). A survey of anthocyanins. Biochem. J. 25, 1687-1705. Robredo, L.M., Junquera, B., González-Sanjosé, M.L. and Barrón, L.J. (1991). Biochemical events during
ripening of grape berries. It. J. Food Sci. 3, 173-180. Roby, G., Harbertson, J.F., Adams, D.A. and Matthews, M.A. (2004). Berry size and vine water deficits as
factors in winegrape composition: Anthocyanins and tannins. Aust. J. Grape Wine Res. 10, 100-107. Rojas-Lara, B.A. and Morrison, J.C. (1989). Differential effects of shading fruit or foliage on the development
and composition of grape berries. Vitis. 28, 199-208. Romeyer, F.M., Macheix, J.J. and Sapis, J.C. (1986). Changes and importance of oligomeric procyanidins
during maturation of grape seeds. Phytochem. 25, 219-221. Roubelakis-Angelakis, K.A. and Kliewer, W.M. (1986). Effects of exogenous factors on phenylalanine
ammonia-lyase activity and accumulation of anthocyanins and total phenolics in grape berries. Am. J. Enol. Vitic. 37, 275-280.
Roubelakis-Angelakis, K.A. and Kliewer, W.M. (1985). Phenylalanine ammonia-lyase in Vitis vinifera L.: Enzyme extraction and possible sources of error during assaying. Am. J. Enol. Vitic. 36, 314-315.
Roussel, S., Bellon-Maurel, V., Roger, J.-M. and Grenier, P. (2003). Authenticating white grape must variety with classification models based on aroma sensors, FT-IR and UV spectrometry. J. Food Eng. 60, 407-419.
Ryan, J.-M. and Revilla, E. (2003). Anthocyanin composition of Cabernet Sauvignon and Tempranillo grapes at different stages of ripening. J. Agric. Food Chem. 51, 3372-3378.
Sacchi, K.L., Bisson, L.F. and Adams, D.O. (2005). A review of the effect of winemaking techniques on phenolic extraction in red wines. Am. J. Enol. Vitic. 56, 197-206.
Sarni-Manchado, P., Deleris, A., Avallone, S., Cheynier, V. and Moutounet, M. (1999). Analysis and characterization of wine condensed tannins precipitated by proteins used as fining agent in enology. Am. J. Enol. Vitic. 50, 81-86.
Schneider, R., Charrier, F., Moutounet, M. and Baumes, R. (2004). Rapid analysis of grape aroma glycoconjugates using Fourier-transform infrared spectrometry and chemometric techniques. Anal. Chim. Acta. 513, 91-96.
Shoseyov, O., Bravdo, B.A., Siegel, D., Goldman, A., Cohen, S., Shoseyov, L. and Ikan, R. (1990). Immobilized endo-beta-glucosidase enriches flavor of wine and passion fruit juice. J. Agric. Food Chem. 38, 1387-1390.
Sims, C.A., Eastridge, J.S. and Bates, T.P. (1995). Changes in phenols, color, and sensory characteristics of muscadine wines by pre- and post-fermentation additions of PVPP, casein, and gelatin. Am. J. Enol. Vitic. 46, 155-158.
Singleton, V.L. (1988). Wine phenols. Eds. Linskens, H.F. and Jackson, J.F. In Wine Analysis, 1st Ed. Springer-Verlag, Berlin. pp. 171-218.

46
Singleton, V.L. and Esau, P. (1969a). Phenolic substances in grapes and wine, and their significance. Eds. Chichester, C.O., Mrak, E.M. and Stewart, G.F. In Advances in Food Research. Supplement 1. 1st Ed. Academic Press Inc., New York, USA. pp. 31-38.
Singleton, V.L. and Esau, P. (1969b). Phenolic substances in grapes and wine, and their significance. Eds. Chichester, C.O., Mrak, E.M. and Stewart, G.F. In Advances in Food Research. Supplement 1. 1st Ed. Academic Press Inc., New York, USA. pp. 81-85.
Singleton, V.L. and Esau, P. (1969c). Phenolic substances in grapes and wine, and their significance. Eds. Chichester, C.O., Mrak, E.M. and Stewart, G.F. In Advances in Food Research. Supplement 1. 1st Ed. Academic Press Inc., New York, USA. pp. 116-122.
Singleton, V.L. and Noble, A.C. (1976). Wine flavor and phenolic substances. Eds. Charalambous, G. and Katz, I. In Phenolic, Sulfur and Nitrogen Compounds in Food Flavors. 1st Ed. A.C.S. Symposium Series, Washington DC. 26, pp. 47-70.
Singleton, V.L. and Trousdale, E.K. (1992). Anthocyanin-tannin interactions explaining differences in polymeric phenols between white and red wines. Am. J. Enol. Vitic. 43, 63-70.
Singleton, V.L., Zaya, J. and Trousdale, E.K. (1986). Caftaric and coutaric acids in fruit of Vitis. Phytochem. 25, 2127-2133.
Skoog, D.A., Holler, F.J. and Nieman, T.A. (eds.). 1998a. Principles of Instrumental Analysis. 5th Ed. Harcourt Brace College Publishers, USA. pp. 380-403.
Skoog, D.A., Holler, F.J. and Nieman, T.A. (eds.). 1998b. Principles of Instrumental Analysis. 5th Ed. Harcourt Brace College Publishers, USA. pp. 725-767.
Smart. R.E., Robinson, J.B., Due, G.R. and Brien, C.J. (1985). Canopy microclimate modification for the cultivar Shiraz I. Definition of canopy microclimate. Vitis. 24, 17-31.
Smith, B. (ed.). 1999. Infrared Spectral Interpretation: A Systematic Approach. 1st Ed. CRC Press LLC, Florida, USA. pp. 1.
Smith, G.J. and Markham, K.R. (1998). Tautomerism of flavonol glucosides: relevance to plant UV protection and flower colour. J. Photochem. Photobiol. 118, 99-105.
Somers, T.C. (1971). The polymeric nature of wine pigments. Phytochem. 10, 2175-2186. Somers, T.C. and Evans, M.E. (1977). Spectral evaluation of young red wines: Anthocyanin equilibria, total
phenolics, free and molecular SO2, “chemical age”. J. Sci. Food Agric. 28, 279-287. Somers, T.C. and Evans, M.E. (1974). Wine quality: Correlations with colour density and anthocyanin
equilibria in a group of young red wines. J. Sci. Food Agric. 25, 1369-1379. Somers, T.C. and Pocock, K.F. (1986). Phenolic harvest criteria for red vinification. Austral. Grapegrow. 4,
24-30. Somers, T.C., Vérette, E. and Pocock, K.F. (1987). Hydroxy-cinnamate esters of Vitis vinifera: Changes
during white vinification and effects exogenous enzymic hydrolysis. J. Sci. Food Agric. 40, 67-78. Souquet, J-.M., Cheynier, V., Brossaud, F. and Moutounet, M. (1996). Polymeric proanthocyanidins from
grape skins. Phytochem. 43, 509-512. Souquet, J.-M., Labarbe, B., le Guernevé, C., Cheynier, V. and Moutounet, M. (2000). Phenolic composition
of grape stems. J. Agric. Food Chem. 48, 1076-1080. Spayd, S.E., Tarara, J.M., Mee, D.L. and Ferguson, J.C. (2002). Seperation of sunlight and temperature
effects on the composition of Vitis Vinifera cv. Merlot berries. Am. J. Enol. Vitic. 53, 171-182. Sudraud, P. (1958). Interpretation de courbes d’absortion des vins rouges. An. Technol. Agric. 7, 203-208. Sun, B.S., Pinto, T., Leandro, M.C., Ricardo da Silva, J.M. and Spranger, M.I. (1999). Transfer of catechins
and proanthocyanidins from solid parts of the grape cluster into wine. Am. J. Enol. Vitic. 50, 179-184. Thorngate, J. H. and Singleton, V.L. (1994). Localization of procyanidins in grape seeds. Am. J. Enol. Vitic.
45, 259-262. Timberlake, C.F. and Bridle, P. (1976a). Interactions between anthocyanins, phenolic compounds, and
acetaldehyde and their significance in red wines. Am. J. Enol. Vitic. 27, 97-105. Timberlake, C.F. and Bridle, P. (1976b). The effect of processing and other factors on the color
characteristics of some red wines. Vitis. 15, 37-49. Urbano-Cuadrado, M., Luque de Castro, M.D., Pérèz Juan, P.M. and Gómez-Nieto, M.A. (2005).
Comparison and joint use of near infrared spectroscopy and Fourier transform mid infrared spectroscopy for the determination of wine parameters. Talanta. 66, 218-224.

47
Vérette, E., Noble, A.C. and Somers, T.C. (1988). Hydroxycinnamates of Vitis vinifera: Sensory assessment in relation to bitterness in white wines. J. Sci. Food Agric. 45, 267-272.
Versari, A., Boulton, R. and Thorngate, J. (2004). The prediction of the color components of red wines using FTIR, wine analyses, and the method of partial least squares. Eds. Waterhouse, A.L. and Kennedy. J.A. In Red Wine Color: revealing the mysteries. 1st Ed. A.C.S. Symposium Series, Washington DC. 886, pp. 53-67.
Waterhouse, A.L. and Kennedy, J.A. (2004). Preface. Eds. Waterhouse, A.L. and Kennedy, J.A. In Red wine color: revealing the mysteries. 1st Ed. A.C.S. Symposium Series, Washington DC. 886, pp. 9-11.
Waterhouse, A.L., Price, S.F. and McCord, J.D. (1999). Reversed-phase high-performance liquid chromatography methods for analysis of wine polyphenols. Methods Enzymol. 299, 113-121.
Wicks, A.S. and Kliewer, W.M. (1983). Further investigations into the relationship between anthocyanins, phenolics, and soluble carbohydrates in grape berry skins. Am. J. Enol. Vitic. 34, 114-116.
Williams, P.C. and Norris, K. (eds.). 2001. Near-Infrared Technology in the Agricultural and Food Industries. 2nd Ed. American Association of Cereal Chemists, Inc., Minnesota, USA. pp. 19-58.
Wulf, L.W. and Nagel, C.W. (1978). High-pressure liquid chromatographic separation of anthocyanins of Vitis vinifera. Am. J. Enol. Vitic. 29, 42-49.
Yokotsuka, K., Akitoshi, N., Nakazawa, K. and Sato, M. (1999). Changes in anthocyanins in berry skins of Merlot and Cabernet Sauvignon grapes grown in two soils modified with limestone or oyster shell versus a native soil over two years. Am. J. Enol. Vitic. 50, 1-12.
Yokotsuka, K., Sato, M., Ueno, N. and Singleton, V.L. (2000). Colour and sensory characteristics of Merlot red wines caused by prolonged pomace contact. J. Wine Res. 11, 7-18.
Zent, J.B. and Inama, S. (1992). Influence of macerating enzymes on the quality and composition of wines obtained from Red Valpolicella wine grapes. Am. J. Enol. Vitic. 43, 311.
Zoecklein, B.W. (2001). Grape sampling and maturity evaluation for growers. Vintner’s Corner. 16, January – February, 2001. www.fst.vt.edu/zoecklein/jan-feb01.html
Zoecklein, B.W., Fugelsang, K.C., Gump, B.H. and Nury, F.S. (eds.). 1995a. Wine Analysis and Production. 1st Ed. Chapman and Hall, New York, USA. pp. 115-151.
Zoecklein, B.W., Fugelsang, K.C., Gump, B.H. and Nury, F.S. (eds.). 1995b. Wine Analysis and Production. 1st Ed. Chapman and Hall, New York, USA. pp. 242-271.

CHAPTER 3
RESEARCH RESULTS
The evaluation of Fourier transform infrared spectroscopy (FT-IR) for the quantification of
total anthocyanins and total phenolics of grapes
This manuscript will be submitted for publication in Journal of Agricultural and Food Chemistry

49
RESEARCH RESULTS
ABSTRACT
Fourier transform infrared spectroscopy (FT-IR) was evaluated as a rapid analytical method to measure the total anthocyanins and total phenolics concentration of red grapes. The large-scale investigation of 827 grape samples from 2004 and 2005 vintages was aimed at developing calibration models for the prediction of total anthocyanins and phenolics concentrations using the WineScan FT 120 instrument. The calibration set design aimed at evaluating the influence of vintage, sugar concentrations and Vitis vinifera cultivar (Cabernet Sauvignon, Merlot, Pinotage, Shiraz) on the prediction accuracy of calibration models. The calibration statistics obtained for the 2004 and 2005 (15.5-31.5ºBrix) anthocyanin calibration set were SEP = 0.17 mg/g and R2 = 0.71 and for the 2005 (15.5-31.5ºBrix) calibration set SEP = 0.15 mg/g and R2 = 0.77. Improved calibration statistics were obtained by using only samples with sugar concentrations equal to or higher than 23.5ºBrix (SEP = 0.13 mg/g; R2 validation set = 0.77). The calibration statistics obtained for the 2004 and 2005 total phenolics 2004 and 2005 (15.5-31.5ºBrix) calibration set were SEP = 0.12 OD280/g and R2 = 0.68 and for the 2005 (15.5-31.5ºBrix) calibration set SEP = 0.12 OD280/g and R2 = 0.71. More satisfactory prediction accuracy was obtained for a calibration set including 2005 vintage grapes with sugar concentrations lower than 23.5ºBrix (SEP = 0.13 OD280/g; R2 validation set = 0.74). For the cultivar calibration sets the best calibration statistics were obtained for 2005 Merlot grapes for the prediction of both anthocyanins (SEP = 0.12 mg/g; R2 validation set = 0.84) and total phenolics (SEP = 0.10 OD280/g; R2 validation set = 0.76). Principal component analysis (PCA) of grape homogenate spectra revealed clustering according to vintage (2004 and 2005), sugar concentration and pH. Inter-vintage (2004 and 2005) and intra- vintage (2005) cluster patterns were observed. The main variation between 2004 and 2005 grape samples could be ascribed to water content. Clustering within the 2005 vintage could not be interpreted on the basis of cultivar differences and must be investigated in future studies. PCA also lead to the identification of both outlier samples (samples with atypical spectra) and samples with unacceptable high errors of prediction.
3.1 INTRODUCTION
Grape quality assessment is a complex issue. The objective evaluation of grape quality and identification of characteristics that closely correlate with the perceived quality of the grapes and eventually the wine are focus areas for major wine producing countries worldwide (Gishen et al., 2002; Francis et al., 2004). Broad indicators of grape quality assessed in vineyards include balance between crop load and canopy capacity, evenness of ripening, vigour/no growing tips after véraison, exposure/sunburn, disease, and observable berry characteristics (size, seeds, colour, taste). Specific indicators of grape quality include chemical analyses of total soluble solids (mostly sugars, measured as

50
ºBrix), pH and titratable acidity (Francis et al., 2004). Phenolic compounds are associated with sensorial characteristics such as colour, flavour, astringency, bitterness, and hardness of red wines (Somers, 1971; Noble, 1994; Gawel, 1998). Wine colour intensity is considered an important indicator of wine quality and is highly correlated with the anthocyanin content of grapes and young wines (Somers and Evans, 1974; Jackson et al., 1978; Iland, 1987; Marais et al., 2001; Marais and October, 2005). Anthocyanins are the phenolic compounds responsible for the red colour of grapes and wines (Singleton and Esau, 1969). The determination of the total phenolic and anthocyanin concentration of grapes could allow better evaluation of vineyard management practices and support decisions regarding optimum harvest dates, grape quality classification, the identification of grape suitability for particular wine styles, streaming of grape juice inside the cellar and, more exact grape payment schemes (Dambergs et al., 2003). Analytical techniques for the quantification of anthocyanins and total phenolics of grapes and wine include spectrophotometric methods (Somers and Evans, 1977; Iland et al., 2000), Glories’ method (Glories and Augustine, 1993), the Folin Ciocalteu method (Singleton and Rossi, 1965), and high performance liquid chromatography (HPLC) (Bakker et al., 1986; Rigaud et al., 1993). These reference methods can be time consuming, laborious, costly and generate large quantities of chemical waste. There is clearly a need for simple, rapid and cost effective analytical techniques at commercial wineries for the determination of anthocyanins and total phenolics in grapes and wine. Infrared spectroscopy is an indirect analytical technique that requires minimum sample preparation and measures multiple compounds simultaneously within a few seconds (Skoog et al., 1998). The technology is based on the measurement of frequencies of molecular vibrations upon the absorption of radiation in the infrared (IR) region of the electromagnetic spectrum. The near infrared region is defined by some sources as ranging from 12 800 to 4000 cm-1 and mid infrared region as ranging from 4000 to 200 cm-1 (Skoog et al., 1998). Many of the vibrations can be assigned to specific bonds or groupings, such as the C-C, C-H, C=O, O-H and N-H groups (Williams and Norris, 2001a). In order to predict the concentration of a compound of interest a calibration model must first be developed. A calibration or training set of samples is analysed by standard laboratory methods to obtain reference values and the same samples are scanned by an infrared spectrometer. Spectral data are correlated with reference data using multivariate data analysis techniques and the constructed calibration equation is used to predict analytical results from the infrared spectra of new samples (Esbensen et al., 2002). Purpose built infrared spectrometers and the development of ready to use commercially available calibrations enabled the development of many applications for grape and wine analysis. These applications include the quantification of ethanol, reducing sugars, pH, titratable acidity, tartaric acid, malic acid, lactic acid, volatile acidity, acetic acid, gluconic acid, glucose, fructose, glycerol, sorbic acid and Folin C index (Gishen and Holdstock, 2000; Kupina and Shrikhande, 2003; Patz et al., 2004). Near infrared spectroscopy (NIRS) calibration models have been developed for the prediction of anthocyanins in grape homogenates (Dambergs et al., 2003) as well as for the prediction

51
of phenolic compounds in red wines (Cozzolino et al., 2004). During a small-scale investigation using 20 samples Fourier transform infrared spectroscopy (FT-IR) calibration models have been developed for the quantification of anthocyanins in red wines (Versari et al., 2004). The aim of this study was to develop FT-IR calibration models for the quantification of total anthocyanins and total phenolics in grapes using a WineScan FT 120 instrument. In South Africa the Foss WineScan FT 120 spectrometer (Foss Analytical, Denmark) is widely used in routine wine analytical laboratories and it would be beneficial for the South African wine industry if the instrument could be calibrated for the quantification of anthocyanins and total phenolics concentrations of grapes. The ease of calibration model transfer between instruments for future widescale implementation in the South African wine industry was an important consideration for using of this technology and in particular the instrument, for this study. This project was the first large scale investigation of the distribution of anthocyanins and total phenolics in South African grapes and forms part of a larger program on establishing an objective system for grape quality assessment and control.
3.2 MATERIALS AND METHODS
3.2.1 GRAPE SAMPLING, STORAGE AND SAMPLE PREPARATION
Whole bunch samples of Vitis vinifera grape cultivars Cabernet Sauvignon, Merlot, Pinotage and Shiraz were collected at Distell (Distell Group (Pty) Ltd) during the 2004 (n = 120) and 2005 (n = 727) harvest seasons. The number of samples analysed during the 2004 vintage are lower than that analysed during 2005 due to the time required to optimise the laboratory methods during the 2004 vintage (see sections 3.3.1.1 to 3.3.1.4 and Chapter 4). All grape samples originated from the Western Cape region in South Africa. Cultivar sample numbers are not evenly distributed. No Pinotage grapes were analysed during the 2004 harvest season. In 2004 grapes (mean ± SD ºBrix = 24.3±1.5) were sampled from loads delivered at the respective weighbridges of the Adam Tas and Bergkelder production facilities of Distell, Stellenbosch. In 2005 grapes were sampled in the vineyards as well as from loads delivered at the respective weighbridges. Vineyards samples were collected from the early stages of grape maturity until harvest (15-31ºBrix). Each sample consisted of approximately 5 to 10 bunches of grapes. Depending on available storage space whole bunch samples were stored overnight at 0 or 4ºC. On the day of analysis grape berries were picked from the various bunches within a sample and the weight of 100 berries from each sample was recorded. A colloid mill designed for homogenising soil samples was used to homogenise grape berries into a uniformly smooth textured paste within approximately 5 seconds.

52
3.2.2 LABORATORY ANALYSES
3.2.2.1 Total anthocyanins and total phenolics analyses
Total anthocyanins and total phenolic concentrations of grape homogenates were determined in duplicate according to the method described by Iland et al. (2000). After thorough mixing approximately 2 g of homogenate was transferred into a pre-tared test tube and the mass recorded. Aqueous ethanol (20 mL, 50% v/v) was added to the homogenate and the contents mixed on a rotating wheel for 1 hour at room temperature (22ºC). After one hour the contents of the test tube was transferred to a centrifuge tube and centrifuged at 10 000 rpm for 10 minutes. A 1 mL volume of extract (supernatant) was acidified with 1 M HCl. Absorbance at 520 nm (A520) and 280 nm (A280) was measured after 3 hours, using a UV/visible spectrophotometer (Heλios, Thermo Spectronic, England). The spectrophotometer was zeroed with distilled water prior to analysis. The total anthocyanin (expressed as mg of malvidin-3-glucoside per g berry) and total phenolic concentrations (expressed as absorbance units per g berry) were calculated as described by Iland et al. (2000). The calculation of total anthocyanins concentration from A520 utilizes a generic extinction coefficient for malvidin-3-glucoside (Somers and Evans, 1977; Iland et al., 2000). The concentrations of total anthocyanins and total phenolics for a specific grape sample were calculated as the mean of duplicate grape homogenates analysed (see section 3.2.3.1, equation 1).
3.2.2.2 The evaluation of the effects of the use of filterpapers with different cross-sections on Fourier transform infrared (FT-IR) spectral measurements
The possible influence of the use of filterpapers with different cross-sections on grape homogenate analyses results obtained with the Foss WineScan FT 120 instrument were evaluated. In the Distell routine laboratory there are many filter-units which have cross-sections of 50 mm. The filter units prescribed by Foss have cross-sections of 185 and 240 mm but the Distell routine laboratory has only one of these filter units each. This means that a lot of time will be wasted cleaning these bigger filter units in between filtering samples. It is more practical to use the 50 mm cross-section filter-units because no cleaning of filter-units is necessary because there are enough filter-units in the laboratory. During the evaluation six grape homogenate samples were each split into three volumes and then filtered with the 50, 185 and 240 mm filter-units respectively. The sugar (ºBrix), pH and titratable acidity (TA) for each sample were determined with the Foss WineScan FT 120 instrument (Foss Analytical, Denmark). Analyses results for each of the three treatments for the six samples were statistically analysed.
3.2.2.3 Fourier transform infrared (FT-IR) spectral measurements
Directly after homogenisation grape samples were centrifuged and filtered using filter paper circles graded at 20-25 μm with a diameter of 50 mm (Schleicher & Schuell, reference number 10312706). A WineScan FT 120 spectrometer (Foss Analytical, Denmark) fitted with a Michelson interferometer was used to generate Fourier transform

53
infrared (FT-IR) spectra. The number of scans generated per sample and the processing of the spectra are predetermined by the manufacturer and can not be changed by the user. Samples are pumped through a CaF2-lined cuvette (37 μm path length) which is located in the heater unit of the instrument. The temperature of the samples is brought to 40ºC before analysis. Samples are scanned from 5011–929 cm-1 and transmittance recorded at the detector at 4 cm-1 intervals, thereby collecting 1056 data points per spectrum. An interferogram is generated from 20 scans before being processed by Fourier transformation and corrected for background absorbance to generate a single beam transmittance spectrum. The ratio between the single beam transmittance spectrum of Zero liquid (Product number S-6060, Foss WineScan FT 120 Type 77110 and 77310 Operator’s Manual, Foss Analytical, Denmark, 2001) and that of the sample, at each recorded data point, is used to generate the final transmittance spectrum for each sample. Two transmittance spectra are generated for each sample in order to monitor the absolute repeatability of the spectral measurements. Finally the transmittance spectra are converted into linearised absorbance spectra through a series of mathematical procedures (Foss WineScan FT 120 Type 77110 and 77310 Reference Manual, Foss Analytical, Denmark, 2001). The WineScan instrument was cleaned prior to and between every sample using the S-470 Cleaning Agent Solution (Foss WineScan FT 120 Type 77110 and 77310 Operator’s Manual, Foss Analytical, Denmark, 2001). Zero Liquid was scanned prior to filtered grape homogenates as well as at regular intervals during sample scanning to correct for background absorbance.
3.2.2.4 Determination of ºBrix, pH and titratable acidity
The commercial calibration models provided with the WineScan were used to predict the ºBrix, pH and total acid (in this study referred to as titratable acidity) of filtered grape homogenates scanned (Foss Analytical, Denmark, 2001). Table 1 shows the component ranges of samples used to establish the commercial calibrations.
3.2.3 STATISTICAL ANALYSES
The notation used for calibration statistics is described by Naes et al. (2002).
3.2.3.1 Statistical equations used for the processing of analytical data
Mean values and standard deviations for ºBrix, pH and titratable acidity for grape homogenate sample sets were calculated according to equations 1 and 2, respectively. The standard error of laboratory (SEL) of the reference method was calculated according to equation 3.

54
Table 1. Component ranges of samples used to develop commercial calibrations supplied with the WineScan (adapted from Foss application notes, Grapescan Calibrations: Must – Brix; Must – pH; Must – Total acid).
Commercial calibration
Must – Brix*1 Must – pH*2 Must - Total acid*3
Component
Range*4 Range*4 Range*4
ºBrix 8.34 - 23.10 8.41 - 23.70 13.32 - 23.70
pH 2.62 - 3.70 2.64 - 4.07 2.62 - 4.19
Titratable aciditye 2.40 - 17.60 1.60 - 13.58 1.60 - 12.99
Tartaric acid (g/L) 3.09 - 11.00 2.10 - 12.02 2.00 - 11.70
Malic acid (g/L) 0.19 - 4.17 0.50 - 12.40 0.50 - 10.80 *1 Application note GrapeScan Calibrations, Must-Brix *2 Application note GrapeScan Calibrations, Must-pH *3 Application note GrapeScan Calibrations, Must-Total acid *4 As determined by the reference method *5 Expressed as g/L tartaric acid
Mean
The mean is the average value of a variable in a specific sample set. The mean ( x ) is calculated as the sum of the variable values ( ), divided by the number of samples ( ) (Snedecor and Cochran, 1980).
xi n
n
xx
n
ii∑
== 1 .....1
Standard deviation (SD)
The standard deviation (SD) is a measure of how widely values are spread around the mean. This corresponds to the range covered by the measured samples in the sample set (Snedecor and Cochran, 1980).
n
SD = ( )
11
2
−
∑ −=
n
xxn
ii
…..2
Standard error of laboratory (SEL)
The standard error of laboratory (SEL) gives an indication of the accuracy of the reference method (Snedecor and Cochran, 1980).
SEL = n
xxn
iii
21
21
2)(∑ −= …..3

55
Where and are the results of duplicate determinations and is the number of samples.
ix1 ix2 n
3.2.3.2 One-way analysis of variance (ANOVA) and post-hoc analysis
One-way analysis of variance (ANOVA) and post-hoc analyses (Bonferroni tests) were performed to statistically interpret differences in result means (Statistica version 7.0, Tulsa, OK. U.S.A.). When multiple comparisons are done (as in this study) the reported probability levels can overestimate the statistical significance of mean differences and the Bonferroni test was used to make the necessary adjustments. Results were reported at the 5% significance level.
3.2.3.3 Principal component analysis (PCA)
Principal component analysis (PCA) is a data reduction method that allows visualisation of the information in a data set in a space defined by orthogonal principal components (PC’s) which are therefore uncorrelated to each other (Naes et al., 2002). PCA score plots allow the visualisation of interrelationships between different variables, the detection and interpretation of sample patterns, groupings, similarities or differences. Loadings plots are useful to understand how much each variable contributes to the meaningful variation in the data, and to interpret variable relationships (Esbensen, 2002; Naes et al., 2002). For PCA FT-IR spectra were exported from the WineScan instrument to Microsoft Office Excel software (Microsoft Office Excel 2003) and subsequently to The Unscrambler Software (version 9.2, Camo AS, Norway). Duplicate FT-IR spectra were averaged. In this way a 2-dimensional data table was constructed where columns are defined by variables and rows defined by samples. The variables were scaled by multiplying each original absorbance value by the factor 1/SD (SD, standard deviation). The data set was mean centered which refers to the process where the origin of the PCA model is chosen as the average point in the data swarm. This process involves subtracting the mean of each variable from the original measurements (Esbensen, 2002; Naes et al., 2002).
3.2.3.4 Identification and classification of spectral outlier samples
Visual inspection of duplicate scans of the same samples revealed five samples with uncharacteristic spectral properties. The duplicate scans for these five samples were visibly different and these five samples were removed from the data set. Additional outliers were identified as samples that had a large influence on the PCA models and six samples were removed from the data set according to this principle.
3.2.4 CALIBRATION PROCEDURES
3.2.4.1 Calibration set design
Two strategies were used to design calibration sets for quantification of total anthocyanins and total phenolics, respectively. The first design involved the random division of filtered grape homogenate spectra into three sets: 50% of spectra for a calibration set and two
56
validation sets, each containing 25% of spectra (Figure 1). Due to the large number of samples in the data set, two validation sets were used (Esbensen, 2002; Naes et al., 2002). Samples were equally distributed between the calibration and validation sets on the basis of vintage, cultivar and sugar concentration. The second strategy involved the random division of filtered grape homogenate spectra from the 2005 vintage into sets based on Vitis vinifera cultivar: 67% of spectra for a calibration set and 33% of spectra for a single validation set (Figure 2). For all four separate cultivar calibration models developed there was equal distribution between the calibration and validation sets regarding the sugar concentrations of samples.
3.2.4.2 Partial Least Squares Regression (PLS)
Partial least squares regression (PLS) was used to develop calibration models using the Advanced Performance Software Module version 2.1.0 of the WineScan instrument (Foss WineScan FT 120 Type 77110 and 77310 Reference Manual, Foss Analytical, Denmark, 2001). PLS is a bilinear regression modelling method where the original X variables are projected onto a smaller number of factors or PLS components. Bilinear modelling methods are used for situations where co-linearity exists among the original variables. PLS components are calculated according to the same statistical procedures as PC’s but PLS uses the Y-data structure or Y-variance, directly as a guide in decomposing the X-matrix (Esbensen, 2002). In terms of this study PLS can be described as a projection of the total anthocyanins and phenolics concentrations data ( -variables) and the wavenumbers (x-variables) onto a number of PLS components that explain the most important information in both spectral and chemical data. The relationship between and x variables can be described by the following equation
y
y
nnxbxbxbby +++= 2211 …..4 where is the dependent variable, y nbb −0 are the regression coefficients ( is the intercept), and represent the absorbance at the selected wavenumbers.
0bnxx −0
3.2.4.3 Wavenumber selection
Wavenumber selection was performed on calibration sets and used to establish calibration models. The Advanced Performance Software Module version 2.1.0 of the WineScan instrument was used for wavenumber selection (Foss WineScan FT 120 Type 77110 and 77310 Reference Manual, Foss Analytical, Denmark, 2001) and 15 filters (wavenumbers or groups of wavenumbers) per chemical compound are selected. These filters correspond to the wavenumbers at which the correlation between measured absorbance and the corresponding reference values for total anthocyanins and total phenolics respectively was highest. Only three regions are available for wavenumber selection (2970-2434 cm-1, 2272-1716 cm-1 and 1542-965 cm-1) to exclude noise from the spectral data.

57
Figure 1. Diagram of the calibration set design involving all samples from the 2004 and 2005 vintages: 50% of sample numbers for calibration and two validation sets of 25% each.
Reference method
measurements
FT-IR spectral
Experimental data
67%Calibration data
set
33%Validation data
set
Develop PLS calibration model Test PLS model
Calibration model
Analytical results
Reference method
measurements
FT-IR spectra
Experimental data
25%Validation data
set
50% Calibration data
set
25%Validation data
set
Develop PLS calibration model
Test PLS model Test PLS model
Calibration model
Analytical results
Figure 2. Diagram of calibration set design involving samples from the 2005 vintage: 67% of sample numbers for calibration and 33% for validation.
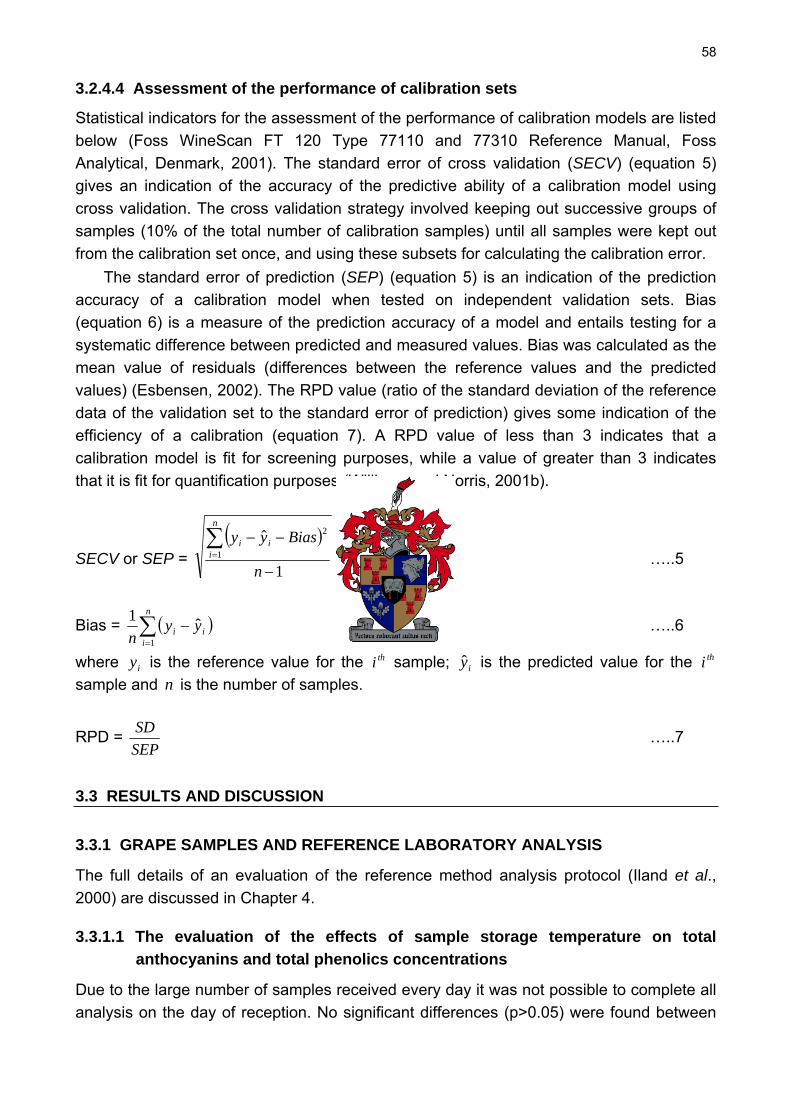
58
3.2.4.4 Assessment of the performance of calibration sets
Statistical indicators for the assessment of the performance of calibration models are listed below (Foss WineScan FT 120 Type 77110 and 77310 Reference Manual, Foss Analytical, Denmark, 2001). The standard error of cross validation (SECV) (equation 5) gives an indication of the accuracy of the predictive ability of a calibration model using cross validation. The cross validation strategy involved keeping out successive groups of samples (10% of the total number of calibration samples) until all samples were kept out from the calibration set once, and using these subsets for calculating the calibration error. The standard error of prediction (SEP) (equation 5) is an indication of the prediction accuracy of a calibration model when tested on independent validation sets. Bias (equation 6) is a measure of the prediction accuracy of a model and entails testing for a systematic difference between predicted and measured values. Bias was calculated as the mean value of residuals (differences between the reference values and the predicted values) (Esbensen, 2002). The RPD value (ratio of the standard deviation of the reference data of the validation set to the standard error of prediction) gives some indication of the efficiency of a calibration (equation 7). A RPD value of less than 3 indicates that a calibration model is fit for screening purposes, while a value of greater than 3 indicates that it is fit for quantification purposes (Williams and Norris, 2001b).
SECV or SEP = )(
1
ˆ1
2
−
−−∑=
n
Biasyyn
iii
…..5
Bias = )(∑=
−n
iii yy
n 1
ˆ1 …..6
where is the reference value for the sample; is the predicted value for the sample and n is the number of samples.
iy thi iy thi
RPD = SEPSD …..7
3.3 RESULTS AND DISCUSSION
3.3.1 GRAPE SAMPLES AND REFERENCE LABORATORY ANALYSIS
The full details of an evaluation of the reference method analysis protocol (Iland et al., 2000) are discussed in Chapter 4.
3.3.1.1 The evaluation of the effects of sample storage temperature on total anthocyanins and total phenolics concentrations
Due to the large number of samples received every day it was not possible to complete all analysis on the day of reception. No significant differences (p>0.05) were found between

59
the total anthocyanins and total phenolics concentrations for samples analysed immediately or samples stored overnight at room-temperature (22ºC), 0ºC or 4ºC (Table 2). Cynkar et al. (2004) reported no significant effects (p≤0.05) of overnight freezing (at -18ºC) or storage at 4ºC on the determination of total anthocyanins and total phenolics concentrations as well as total soluble solids using the reference method described by Iland et al. (2000). However, in the same study overnight freezing of the grapes did result in a significant (p>0.05) raise in the pH values. Thus it is possible that sample storage at low temperatures (0ºC) and homogenisation could have had significant effects on the pH and titratable acidity values obtained in this study. However, the effects of storage temperatures on pH and titratable acidity were not investigated in this study.
Table 2. The effects of sample storage temperatures on the total anthocyanins and total phenolics concentrations of grapes.
Total anthocyanins
(mg/g)*3
Total phenolics
(OD280/g)*4
Storage treatment n*1
Mean*2 ± SD*1 Mean*2 ± SD*1
Immediate, 22ºC 5 1.62a ± 0.65 1.57a ± 0.40
Overnight, 22ºC 5 1.67a ± 0.66 1.65a ± 0.38
Overnight, 4ºC 5 1.55a ± 0.84 1.61a ± 0.50
Overnight, 0ºC 5 1.57a ± 0.67 1.64a ± 0.43
Significance of least significant difference (LSD) test of treatment means at p≤0.05 and standard deviation. Means with different superscripts in the same column indicate statistically significant differences among treatments. *1 Abbreviations used: n, number of samples; SD, standard deviation *2 As determined by the reference method *3 Expressed as mg anthocyanins per gram fresh berry *4 Expressed as OD280 per gram fresh berry
3.3.1.2 Repeatability of the reference laboratory method
The determination of the repeatability of the reference laboratory method is fully described in section 4.2, Chapter 4. The exclusion of samples from original data sets based on poor reference repeatability is described in section 4.3, Chapter 4. Poorly repeated samples were removed from the original data sets and n = 89 samples of the 2004 vintage and n = 603 samples from the 2005 vintage were included in the final total anthocyanins data sets (total n = 792). For the final total phenolics concentrations data sets n = 95 samples of the 2004 vintage and n = 553 samples from the 2005 vintage were included (total n = 648).
3.3.1.3 Standard error of laboratory (SEL)
A detailed description of the calculation of the standard error of laboratory (SEL) values is provided in section 4.4, Chapter 4. The SEL values for samples included in the final anthocyanin data sets were 0.04 mg/g for samples from the 2004 vintage (n = 89) and

60
0.03 mg/g berry for samples from the 2005 vintage (n = 603). The SEL values for samples included in the total phenolics data sets were 0.05 OD280/g berry for samples from the 2004 vintage (n = 95) and 0.07 OD280/g berry for the samples from the 2005 vintage (n = 553).
3.3.1.4 The evaluation of the effects of the use of filterpapers with different cross-sections on FT-IR analysis results
The investigation results (Table 3) indicated no significant differences between filterpapers with cross-sections of 50, 185 or 240 mm. For this study filterpapers with cross-sections of 50 mm were used.
Table 3. The effects of the use of filterpapers with different cross-sections on FT-IR analysis results.
Sugar (ºBrix) pH TA*3Filterpaper cross-section (mm) n*1
Mean*2 ± SD*1 Mean*2 ± SD*1 Mean*2 ± SD*1
50 6 20.3a ± 1.1 3.67a ± 0.23 6.9a ± 0.5
185 6 20.5a ± 1.0 3.69a ± 0.17 3.9a ± 0.2
240 6 20.3a ± 1.2 3.67a ± 0.23 6.9a ± 0.4
*Significance of least significant difference (LSD) test of treatment means at p≤0.05 and standard deviation. Means with different superscripts in the same column indicate statistically significant differences among treatments. *1 Abbreviations used: n, number of samples; SD, standard deviation; TA, titratable
acidity *2 As determined with the Foss WineScan FT 120 spectrometer *3 Expressed as g/L tartaric acid
3.3.1.5 Descriptive statistics of all samples
Table 4 contains statistics regarding the sample numbers, sugar, pH, titratable acidity, total anthocyanins and total phenolics of grape homogenates from both the 2004 and 2005 vintages. The mean sugar concentration of 2005 samples is lower than that of the 2004 samples (see section 3.2.1). As expected (due to the inclusion of grapes of lower maturity in the 2005 sample set) the mean pH values of 2005 samples were lower than that of the 2004 samples. The lower mean pH value of 2005 vintage grape homogenates is also reflected in the higher TA concentration of the same set. The mean total anthocyanins concentration of the 2005 vintage grape homogenates was slightly higher than that of the 2004 vintage grape homogenates. Interestingly, the mean total phenolics concentrations for both vintages were similar. The wider range of maturities of grapes in the 2005 vintage sample sets is reflected in the slightly higher SD values for most of the chemical parameters when compared to that of the 2004 vintage sample sets.

61
3.3.2 ANALYSIS OF FOURIER TRANSFORM INFRARED (FT-IR) SPECTRA
Figure 3 displays the FT-IR spectrum of a filtered grape homogenate and reflects the combined absorbance of all IR-active components in the sample. The wavenumber regions of significant importance to this study include the wavenumbers 1542 to 965 cm-1, sometimes referred to as the “fingerprint” area and various IR-bands, including those corresponding to the vibrations of the C-O, C-C, C-H, and C-N bonds occur in this region (Smith, 1999a). This area provides important information regarding organic compounds such as sugars, alcohols and organic acids present in a sample. Little variation in absorbance could be observed in the 5011-3627 cm-1 wavenumber region (Figure 3), but this area is known to contribute to significant noise in the spectra. The distinct absorbance peaks in the wavenumber regions 3626-2970 cm-1 and 1716-1543 cm-1, are the result of the absorbance of water (Smith, 1999b). For calibration purposes the water and “noise” regions were excluded. Figure 4 shows the distinct variation between the spectra of filtered grape homogenates from the same vineyard block sampled approximately weekly during the 2005 harvest season.
3.3.3 PCA MODELING
In the explorative stages of PCA modeling all samples from the 2004 and 2005 vintages (n = 827) and all wavenumbers were used. The PCA score plot of PC1 versus PC2 showed two major clusters (Figure 5a) while the 2004 samples grouped together. Grape cultivars were not responsible for the clustering (Figure 5d). Samples from the 2004 vintage are located more towards the positive end of PC2. Both positive and negative loadings on PC1 explains the separation of the samples along PC1 (Figure 5c). Significant loadings are seen in the fingerprint (1542 to 965 cm-1), water (3626-2970 cm-1 and 1716-1543 cm-1) and “noise” (5011-3627 cm-1) areas (Figure 5c). In order to compare the effect of the water regions on the separation of samples, subsequent PCA was done using only the 3626-2970 cm-1 and 1716-1543 cm-1 water regions (Figure 6a) and, alternatively modeling by using all wavenumbers, except the two water regions (Figure 6b). The clear separation between the 2004 and 2005 samples based on the influence of water became very evident in this approach. It is interesting to speculate that this pattern could be related to the very low winter rainfall experienced in fresh berry2004 causing lower soil water reserves and subsequent lower water concentrations in the 2005 vintage grapes. In order to evaluate the contribution of other important chemical compounds to the variation between grape homogenates, the dominating effect of water absorbance was eliminated and further analysis was done with water and “noise” variables deselected (Figure 7a and 7b). PC1 seemed to distinguish between samples based on the level of ripeness (measured as sugar concentration and pH value). Samples in groups 1, 2 and 3 had low (y<23.5ºBrix), medium (23.5ºBrix≤y<26.0ºBrix) and high (y≥26.0ºBrix) sugar concentrations respectively (Figure 7a). The three groups based on arbitrary chosen sugar concentrations clearly separated along PC1. Samples in group 1 (low sugar concentrations) located towards the negative end of PC1 and were slightly more scattered

62
Table 4. Descriptive statistics of all samples.
Sugar (ºBrix) pH TA*1
(g/L)*4
Total anthocyanins
(mg/g)*5
Total phenolics
(OD280/g)*6
Sample set n*1
Range*2 Mean*2 ± SD*1 Range*2 Mean*2 ± SD*1 Range*2 Mean*2 ± SD*1 Range*3 Mean*3 ± SD*1 Range*3 Mean*3 ± SD*1
Cabernet Sauvignon 2004 37 20.4 - 26.3 24.4 ± 1.4 3.67 - 4.09 3.91 ± 0.11 3.2 - 5.1 4.1 ± 0.5 0.69 - 1.97 1.15 ± 0.23 0.76 - 1.64 1.31 ± 0.18
Cabernet Sauvignon 2005 239 17.6 - 29.3 23.5 ± 2.6 3.41 - 4.35 3.90 ± 0.18 3.0 - 8.9 4.5 ± 1.0 0.32 - 1.98 1.10 ± 0.34 0.57 - 1.78 1.22 ± 0.22
Merlot 2004 25 20.2 - 26.3 24.3 ± 1.7 3.63 - 4.04 3.84 ± 0.10 3.3 - 5.0 4.1 ± 0.4 0.69 - 1.40 1.07 ± 0.20 1.05 - 1.64 1.34 ± 0.15
Merlot 2005 155 17.7 - 29.4 24.0 ± 2.2 3.50 - 4.06 3.81 ± 0.13 3.0 - 7.4 4.2 ± 0.8 0.48 - 2.03 1.16 ± 0.28 0.61 - 1.96 1.37 ± 0.22
Pinotage 2005 64 18.2 - 28.9 24.5 ± 2.5 3.49 - 4.29 3.89 ± 0.16 4.0 - 6.6 5.1 ± 0.6 0.66 - 1.84 1.23 ± 0.25 1.01 - 2.08 1.53 ± 0.23
Shiraz 2004 37 21.4 - 27.4 24.3 ± 1.3 3.69 - 4.17 3.87 ± 0.13 2.6 - 10.0 4.3 ± 1.2 0.66 - 1.69 1.23 ± 0.23 0.95 - 1.74 1.37 ± 0.19
Shiraz 2005 145 15.5 - 31.5 24.1 ± 3.6 3.35 - 4.49 3.80 ± 0.21 2.6 - 10.0 4.3 ± 1.2 0.65 - 2.08 1.35 ± 0.32 0.78 - 1.93 1.41 ± 0.22
All cultivars 2004 89 20.2 - 27.4 24.3 ± 1.5 3.63 - 4.17 3.88 ± 0.12 2.8 - 5.1 3.9 ± 0.5 0.66 - 1.97 1.15 ± 0.23 0.76 - 1.74 1.34 ± 0.17
All cultivars 2005 603 15.5 - 31.5 23.9 ± 2.8 3.35 - 4.49 3.85 ± 0.18 2.6 - 10.0 4.5 ± 1.0 0.32 - 2.08 1.19 ± 0.33 0.58 - 2.08 1.34 ± 0.24 *1 Abbreviations used: n, number of samples; TA, titratable acidity; SD, standard deviation
*2 As determined with the Foss WineScan FT 120 spectrometer
*5 Expressed as mg anthocyanins per gram fresh berry *6 Expressed as OD280 per gram fresh berry
*3 As determined with the reference method *4 Expressed as g/L tartaric acid

63
0
0.2
0.4
0.6
0.8
1
1.2
1.4
1.6
1.8
2
5011 4333 3654 2975 2296 1617 929
Wavenumer (cm-1)
Figure 3. FT-IR spectrum of a filtered grape homogenate sample in the region 5011 – 929 cm-1.
0.0
0.2
0.4
0.6
0.8
1.0
1.2
1.4
1542 1447 1350 1254 1157 1061 965
Week 1Week 2Week 3Week 4Week 5Week 6Week 7Week 8Week 9
Wavenumber (cm-1)
1542-965 cm-1
1716-1543 cm-13626-2970 cm-1
Abso
rban
ce
Abso
rban
ce
Figure 4. Spectral variation in the “fingerprint” area (1542-965 cm-1) of FT-IR spectra of the same block sampled weekly during the 2005 vintage. Weekly sample dates: 1, 2 February 2005; 2, 9 February 2005; 3, 15 February 2005; 4, 22 February 2005; 5, 2 March 2005; 6, 9 March 2005; 7, 15 March 2005; 8, 23 March 2005; 9, 29 March 2005.

64
Figure 5. Modelling with all wavenumbers. PCA of grape homogenate samples (n = 827) of the 2004 and 2005 vintage. a) Score plot of PC1 (63% X-variance explained) and PC2 (13% X-variance explained). 4:2004 (blue markers), 4:2005 (red markers). b) Residual calibration variance plot showing that 12 PC’s describe more than 95% of the X-variance. c) Loadings plot of PC1. d) Score plot of PC2 (12% X-variance explained) and PC3 (6% X-variance explained). C:Cabernet Sauvignon (blue markers), M:Merlot (black markers), P:Pinotage (yellow markers), S:Shiraz (pink markers).
Figure 6. PCA score plot of PC1 versus PC2 of the FT-IR spectra of the total set of grape homogenates (n = 827) (a) including the two wavenumber regions 3626-2970 cm-1 and 1716-1543 cm-
1, where water absorbs strongly, and (b) excluding the two wavenumber regions 3626-2970 cm-1 and 1716-1543 cm-1. 4:2004 (blue markers), 5:2005 (red markers).
-20
-15
-10
-5
0
5
10
15
20
-80 -60 -40 -20 0 20 40 60 80 100 RESULT2, X-expl: 63%,13%
44 444 4
44
4444
4
4 4
4
45
555 55
5 555 5 5
55
55
55
55
555 5 5
5 5
5
55
5555
55
55
5
5
5
5 55 5
55 5
555
5
5
5
5
5
5
55
5 55 5
555
5 555
55
55
55
5
5 55
5
55
55
55
5
5
5
5
5
5
5
5555
5
55
55 5
5 555
5
55
5
5
5
55
5 55 5
5
55
55 5555
5
555
55
55
5
55
5
5
5
5
5
5
5
5
5
5
55
5
55 55
555
55
5555
55
55
5
5
5
55
5
555
5
5
55
55
5
5
555 55
55
55
555 55 5
5
5
5
5
5
55
5
55
5 5
5
5
5
5
5
5
5
55
55
5
5
5
55
5
55
55
5
5 555
555
5
5
55 55
5
55
5
55
5 5
5 55
555
555
5
5
55
5555
5
55
4
44
4
44
4
44 44
4
4444 44
44
4444
4444
44
444 44
4444 5
555
555
5
5
5
5
555
5
55
5
5
5
5
5
5555
55
5
5 5
5
5555
5
5
5
55
5
55
555
5
5
55
55
5
555
5
5
5 5
55
555 55
5
5
5
55
55
5
55
5
5
5
55
5
5555
5
55 55
55
5
55
555
5555
5
55
5
5
555
55
555
5 55 5555
5
5 555 5
555
555 55
5 55
55
5
5
55
5
55 55 5
5
55
5
55
5
5
5
55
5
55
5
5 55
55
5
5
5
5
55
5
5
5
5
5
55
5
5
55
5
5
5
4 444 4
444 4444
44 444 44 4
4
4444 4
5
55
5
5
5
5
5
55 5
555
55
5 5
55 55
55
55
5 5
55 5
5
55
55 55 5
5 5
55
55
55
5
55
5
5
555 5
5 5
5
5
5
55
5
5
55
5
55
5
5555
5
55
544 4
44
4
44
4 4555
55
5
55
55
55
55
55
5
5
55
5 55
5
5
5
5
5
55
5
5
5
5
5
5
555
5
55
5
55 5
5
55
5
55
55
555
555
5
55
5
5
5
55
5
5 55
55
5 555
55
5
55
555
555 5
5
5
5
55
555 5
5 55
5 55
555
5
55 55
555 5
5
5
5
5
5
5
555 55
55
55 5
555
5 55
5
5
5
5
55
5
5
55 55
555
555
5
55
55
555
55
555
55
5
5555
5
5 555 5
4
4
44
4
4
4 44
4
44
4
4
44
4
4 4
4 444
4
4 44
PC1
PC2 Scores
0
0.
0.
0.
0.
2
4
6
8
1.0
PC_00 PC_02 PC_04 PC_06 PC_08 PC_10 PC_12 PC_14 RESULT1, Variable: c.Total
PCs
X-variance Residual Calibration Variance
(a)
-0.04
-0.03
-0.02
-0.
0.
01
0
01
02
0.03
0.
0.04
5011.54 4556.3 4101.05 3645.81 3190.57 2735.32 2280.08 1824.83 1369.59 RESULT2, PC(X-expl): 1(63%)
X-variables
X-loadings
(d)(c)
(b)
X-loadings
Scores Residual calibration variance
(a) (b) Scores
-10
-5
0
5
10
15
-20 -15 -10 -5 0 5 10 15 20 RESULT5, X-expl: 12%,6%
4
444
44
4 4
4
44
4
44
4
4
4
5 5
5 55 5
55
55
5
55 5
55
5
555 5 5
5
55
55
5
5
55
55
5
55
5
5
5 555
555 555
5
55
5 55
55
55
5
5
55 5
5
55
5 55
55 55 55 55
55
55
55
555
55
5
5
55 5 5
55
5
5
5
55
555 5
5
55
5
555
5
5
5
5 5
5
5
5
5
5
5
555
55
5
55
55
55 5
55
55
5
55
5
5
5
55
5
5
5
5
55
555
55
55 55
555
555
55
55
5 5
5
5
55 55
55
5
5
55
55
555
5
55
55
555
555
5 55
55
5 5555 5
5
555
55
55
5
5 5
55
55
55
5 555555
5
5
5
5
5
5
5
555 5
55
5
55
5 55
55 5555
5555 55
55
55
5
555
444
44
44
44
4
4
4
444
44
4
44
4
4
4
4
4
4
4
4
4
4
444
4
4
4
4
4
4
5 555
5
5 5
5
55
55
55
5555
555 55 555
5
55
55
5
5
5
5
5
55
55 5 55
5
555
5
5 55
555
55 5
5
5555
55 55
55
5
5
5
55
55
5
5 5
5
5
5
55
55 55
5
55
5
5 5
55
55
5
55
5
55 55
55
55
5
5
5
5
5 55
55
55
5
5
5 5
5
5
55
5
55
55
55
555 5
5
5
5
55
5
55
5
555
55
5
5
55
5
5
5 5
555 5
5
5
5
55 55
55
55
5 5
5
555
5
5
5
5
5
55 5 5555
44
4 4
4
4
4
4
44
44
44
4
4
4
4
44
4
4 4
44
4
5
55
55
5
5
5
5 5555
5
5
5 5
5
5 55
5
55
5
55
55
5
55
55
555
55
5
55
55
55
55
5
55
55
5 55 5
5
5
55
555
5
5
5
5
5
5
5
555
5
5
5 5
5
4 4 4444
4
4
4
4
5
55
5
55
5
5
5
5
5
55
5
55
555
55
5
5
5
55 5
555 55
5
55
5
5 5555
5
5
5
5 555
55 5
55 555 5
55
5 55
55
5
555
5
5
5555
55 5
5
5 55
55
55
5
5
55
5
55
5
555 5
5
55
5
5
5555
55
5
5 555
55
555
5
5
5
5
5
55 55
5
5
5 5 5
55
5 5
5
5 55
55
5
55
5
55
555 5555
5555
55
5
55
555
5
55
5
5
5
55
5
55
5555
5
4
44
4 4
4
4
4
44 4
444
4
44
44
4
4
4
4
44
44
PC2
PC3 ScoresScores
-20
-15
-10
-5
0
5
10
15
20
-80 -60 -40 -20 0 20 40 60 80 100 all variables, X-expl: 63%,13%
CC CCC C
CC
CCCC
C
C C
C
CC
CCC CC
C CCC C C
CC
CC
CC
CC
CCCC C
C C
C
CC
CCCCC
C
CC
C
C
C
C CC C
CC C
CCC
C
C
C
C
CC
CC
C CC C
CCC
C CCC
CC
CC
CC
C
C CC
C
CC
CC
CC
C
C
CC
C
C
C
CCCC
C
CC
CC C
C CCC
C
CC
C
C
C
CC
C CC C
C
CC
CC CCCC
C
CCC
CC
CC
C
CC
C
C
C
C
C
C
C
C
C
C
CC
C
CC CC
CCC
CC
CCCC
CC
CC
C
C
C
CC
C
CCC
C
C
CC
CC
C
C
CCC CC
CC
CC
CCC CC C
C
CC
C
C
CC
C
CC
C C
C
C
C
C
C
C
C
CC
CC
C
C
C
CC
C
CC
CC
C
C CCC
CCC
C
C
CC CC
C
CC
C
CC
C C
C CC
CCC
CCC
C
C
CC
CCCC
C
CC
C
CC
C
CC
C
CC CC
C
CCCC CC
CC
CCCC
CCCM
MM
MMMMM
MMMM M
MMM
MMM
M
M
M
M
MMM
M
MM
M
M
M
M
M
MMMM
MM
M
M M
M
MMMM
M
M
M
MM
M
MM
MMM
M
M
MMM
M
M
MMM
M
M
M M
MM
MMM MM
M
M
M
MM
MM
M
MM
M
M
M
MM
M
MMMM
M
MMMM
MM
M
MM
MMM
MMMM
M
MM
M
M
MMM
MM
MMM
M MM MMMM
M
M MMM M
MMM
MMM MM
M MM
MM
M
M
MM
M
MM MMM
MMM
M
MM
M
M
M
MM
M
MM
M
M MM
MM
M
M
M
M
MM
M
M
M
M
M
MM
M
M
MM
M
M
M
M MMM M
MMMMMMM
MM MMM MMM
M
MMPP P
P
PP
P
P
P
P
P
PP P
PPP
PP
P P
PP PP
PP
PP
P PP
P PP
PP
PP PP P
P P
PP
PP
PP
P
PP
P
P
PPP P
P P
P
P
P
PP
P
P
PP
P
PP
P
PPPP
P
PP
PPP S
SS
S
SS
S SSSS
SS
S
SS
SS
SS
SS
SS
S
S
SS
S SS
S
S
S
S
S
SS
S
S
S
S
S
S
SSS
S
SS
S
SS S
S
SS
S
SS
SS
SSS
SSS
S
SS
S
S
S
SS
S
S SS
SS
SSSS
SS
S
SS
SSS
SSS S
S
S
S
SS
SSSS S S
S
S SS
SSS
S
SS SS
SSSS
S
S
S
S
S
S
SSS SS
SS
SS S
SSS
S SS
S
S
S
S
SS
S
S
SS SS
SSS
SSS
S
S S
SS
SSS
SS
SSS
SS
S
SSSS
S
S SSS S
S
S
SS
S
S
S SS
S
SS
S
S
SS
S
S SS SS
S
S
S SS
PC1
PC2 Scores
Principal component (PC)
Exp
lain
ed X
-var
ianc
e
Scores
Wavenumber (cm-1)
Load
ings

65
(a) (b)Scores Scores
Figure 7. (a) PCA score plot of PC1 versus PC2 of the FT-IR spectra of grape homogenates from the 2005 vintage (n = 603) based on sugar concentrations. The 3626-2970 cm-1 and 1716-1543 cm-1
wavenumber regions, where water absorbs strongly, were excluded. 1: x<23.5ºBrix (blue markers), 2: 23.5ºBrix≤x<26.0ºBrix (red markers), 3: x≥26.0ºBrix (green markers), and (b) PCA score plot of PC1 versus PC2 of the FT-IR spectra of grape homogenates from the 2005 vintage (n = 603) based on pH values. The 3626-2970 cm-1 and 1716-1543 cm-1 wavenumber regions where water absorbs strongly were excluded. 1: x<3.6 (blue markers), 2: 3.6≤x≤3.9 (red markers), 3: x>3.9 (green markers).
than samples of the other two groups. The samples in groups 2 and 3 with medium and high sugar concentrations respectively, located towards the positive end of PC1. Figure 7b illustrates the PCA results based on pH values. Samples in groups 1, 2 and 3 had pH values of x<3.6, 3.6≤x≤3.9 and x>3.9 respectively. Although not as clear a separation as with the sugar concentrations, samples with lower pH values (Group 1) were located more towards the negative end of PC1 and samples with higher pH values (Group 3) more towards the positive end. These results suggested that the grape homogenates from diverse sugar concentrations would possibly have to be treated as separate groups in the design of sample sets for anthocyanin and total phenolics calibration. Other possible sources of variation between spectra of the grape homogenates that were investigated during PCA were type of Vitis vinifera cultivar, length of storage time before homogenisation as well as storage temperature. No variation could be attributed to any of these factors (data not shown). Figures 8a and 8b show PCA score plots modelling the nine grape homogenates of which the “fingerprint” area spectra were graphically illustrated in section 3.3.2, Figure 4. These grape samples originated from the same vineyard block and were harvested approximately every week as the 2005 harvest season progressed. The PCA score plot where all wavenumbers were used (Figure 8a) showed that samples distributed according to grape maturity along PC1. PCA modelling excluding the 3626-2970 cm-1 and 1716-1543 cm-1 wavenumber regions was also done (Figure 8b). The PCA score plot of PC1 versus PC2 shows a distribution pattern of samples along PC1 related to grape maturity level. The sample harvested in week one (least mature sample) is located to the positive end of PC1. Grape samples harvested during weeks two to five are also located towards the positive side of PC1. On the negative side of PC1 are samples harvested during weeks six to nine (samples of highest maturity). These PCA results confirm that grape maturity is the major source of variation between the grape homogenates.

66
(a)
(b) Scores
Scores
Figure 8. (a) PCA score plot of PC1 versus PC2 of the FT-IR spectra of grape homogenates from the same block sampled weekly during the 2005 vintage (n = 9). All wavenumbers were used, and (b) PCA score plot of PC1 versus PC2 of the FT-IR spectra of grape homogenates from the same block sampled weekly during the 2005 vintage (n = 9). The 3626-2970 cm-1 and 1716-1543 cm-1 wavenumber regions where water absorbs strongly were excluded.

67
3.3.4 THE EVALUATION OF THE EFFECTS OF CALIBRATION SET DESIGN FOR PREDICTION OF TOTAL ANTHOCYANINS IN GRAPE HOMOGENATES
Since the PCA score plots of filtered grape homogenate spectra revealed sample groupings according to vintage and sugar concentration, six calibration sets were designed to evaluate the effects of these factors on calibration models for total anthocyanins (Table 5). Three calibration sets involved samples from both the 2004 and 2005 vintages and respectively contained samples from all sugar levels, higher sugar levels (x≥23.5ºBrix) and lower sugar levels (x<23.5ºBrix). The “cut-off” value of 23.5ºBrix was arbitrarily chosen. The three remaining calibration sets only involved samples from the 2005 vintage and the before mentioned sugar concentrations were again used as differentiation criteria. No calibration sets were evaluated for samples from the 2004 vintage individually due to restricted sample numbers (n = 89). Also note that in the three calibration sets containing samples from both vintages a mere 10-15% of the sample numbers are from the 2004 vintage. Therefore, valid comparisons of vintage effects could not be made. The aim of the different calibration sets was to evaluate the effect of calibration set design on calibration accuracy. Two individual independent validation sets were used to test the predictive accuracy of each calibration model. Table 6 contains calibration statistics for the six calibration sets. The three 2005 vintage calibration sets had slightly better predictive abilities than the three 2004&2005 vintage calibration sets. This might be explained by the fact that the three 2004&2005 calibration sets were not balanced with regard to sample numbers from the 2004 and 2005 vintages. Prediction errors for total anthocyanins in grape homogenates using near-infrared spectroscopy (NIR) calibration models range from 0.09 to 0.16 mg/g. (Dambergs et al., 2003). The SEP values obtained in this study are in good agreement with these results. Of all six calibration sets the least accurate prediction results were obtained with the 2004&2005 All sugar, calibration model (SECV = 0.15 mg/g; SEP Val1 = 0.17 mg/g; SEP Val2 = 0.17 mg/g). In comparison with the five other calibration sets the best calibration statistics were obtained for the 2005 High sugar set (SEP Val1 and Val2 = 0.13 mg/g). Even though the SECV of the 2005 Low sugar set was lower than that of any of the other calibration sets (0.11 mg/g berry) the predictive ability of the model was not that accurate (SEP Val1 = 0.15 mg/g; SEP Val2 = 0.16 mg/g). Of the three 2004&2005 vintage calibration sets the 2004&2005 High sugar set had the best calibration statistics (SECV = 0.13 mg/g; SEP Val1 = 0.15 mg/g; SEP Val2 = 0.14 mg/g). Even though the SECV of the 2004&2005 Low sugar set was slightly lower (0.12 mg/g) than that of the 2004&2005 High sugar set, the SEP values of the two independent validation sets were slightly higher (SEP Val1 = 0.15 mg/g; SEP Val2 = 0.17 mg/g). The SEL for the determination of total anthocyanins in the Distell laboratory were calculated as 0.03-0.04 mg/g berry and is in good agreement with the SEL of the AWRI laboratory (mentioned in section 3.3.1.5). The SEP values obtained for all six calibration sets were approximately three times higher than the SEL values for the sets. This is in good agreement with other published results (Dambergs et al., 2003). The RPD values of all six calibration models are well below 5. Table 7 illustrates the significance of some RPD values (Williams and Norris, 2001b). The RPD values of all six calibration models are well

68below 5 indicating that all six calibration models are only fit for screening purposes and not for quantification purposes (Williams and Norris, 2001b). The coefficient of determination (R2) values for calibration sets ranged between 0.77 and 0.90. However these values provide an over optimistic view and must be interpreted along with the SEP and R2 values for validation sets. For the validation sets of the six calibration models the R2 values ranged from 0.68 to 0.81 which are considerable lower than the R2 values of the calibration sets. Dambergs et al. (2003) reported R2 values for NIR validation sets ranging between 0.86 and 0.96. The highest R2 value was that of the 2005 Low sugar set (R2 = 0.81). It is considered that the calibration model that gives the highest RPD value, together with the highest coefficient of determination, is the best (Williams and Norris, 2001b). According to this definition the 2005 Low sugar set is considered to be the best of all six calibration sets (RPD Val2 = 2.3). When considering the SEP, R2 and RPD values of validations sets the 2005 High sugar set is considered to be the best of all six sets. Figure 9 shows the correlations between the total anthocyanins concentrations that were determined by the reference method and the estimated values predicted by the six calibration models.
Table 5. General statistics for total anthocyanins (mg anthocyanins/g berry) for calibration and validation sets as indicated.
Calibration set Set n*1 n*1 2004 n*1 2005 Range*2 Mean*2 ± SD*1
2004&2005 All sugar Cal*1 344 43 301 0.32 – 2.08 1.18±0.32
Val*11 171 21 150 0.51 – 2.07 1.16±0.29
Val*12 170 22 148 0.48 – 2.03 1.21±0.31
2004&2005 High sugar Cal*1 211 31 180 0.60 – 2.08 1.24±0.28
Val*11 104 15 104 0.73 – 2.03 1.26±0.28
Val*12 105 14 91 0.69 – 2.07 1.26±0.26
2004&2005 Low sugar Cal*1 130 13 117 0.32 – 1.80 1.07±0.34
Val*11 63 6 57 0.51 – 1.70 1.03±0.30
Val*12 64 6 58 0.51 – 2.03 1.11±0.37
2005 All sugar Cal*1 282 - 282 0.32 – 2.08 1.19±0.33
Val*11 142 - 142 0.53 – 2.07 1.18±0.30
Val*12 144 - 144 0.48 – 2.03 1.26±0.31
2005 High sugar Cal*1 179 - 179 0.60 – 2.08 1.25±0.28
Val*11 88 - 88 0.73 – 2.03 1.26±0.27
Val*12 89 - 89 0.69 – 2.07 1.29±0.27
2005 Low sugar Cal*1 118 - 118 0.32 – 1.80 1.06±0.36 Val*11 58 - 58 0.51 – 2.03 1.03±0.30
Val*12 57 - 57 0.51 – 2.03 1.07±0.36 *1 Abbreviations used: n, number of samples; SD, standard deviation; Cal, calibration set;
Val, validation set *2 As determined by the reference method

69
Table 6. Calibration statistics for FT-IR measurement of anthocyanins (mg anthocyanins/g berry).
R2 *1
Cal*1SEL*1 SEP*1 R2 *1 Val*1 Bias RPD*1Calibration set PLS*1
factors
SECV*1
Val1*1 Val2*1 Val1*1 Val2*1 Val1*1 Val2*1 Val1*1 Val2*1
2004 & 2005 All sugar 12 0.15 0.77 0.03 0.17 0.17 0.68 0.71 0.011 -0.019 1.7 1.8
2004 & 2005 High sugar 11 0.13 0.77 0.03 0.15 0.14 0.69 0.70 -0.029 -0.042 1.9 1.9
2004 & 2005 Low sugar 12 0.12 0.87 0.04 0.15 0.17 0.75 0.77 0.039 -0.002 2.0 2.2
2005 All sugar 12 0.13 0.85 0.03 0.15 0.15 0.77 0.77 -0.001 -0.007 2.0 2.1
2005 High sugar 11 0.13 0.78 0.03 0.13 0.13 0.77 0.76 -0.023 -0.041 2.1 2.1
2005 Low sugar 11 0.11 0.90 0.03 0.15 0.16 0.76 0.81 0.031 0.0095 2.0 2.3 *1 Abbreviations used: PLS, partial least squares; SECV, standard error of cross validation; R2, coefficient of determination; SEL,
standard error of laboratory; SEP, standard error of prediction; Cal, calibration; Val, validation; RPD, ratio of the standard deviation of the data to the standard error of prediction
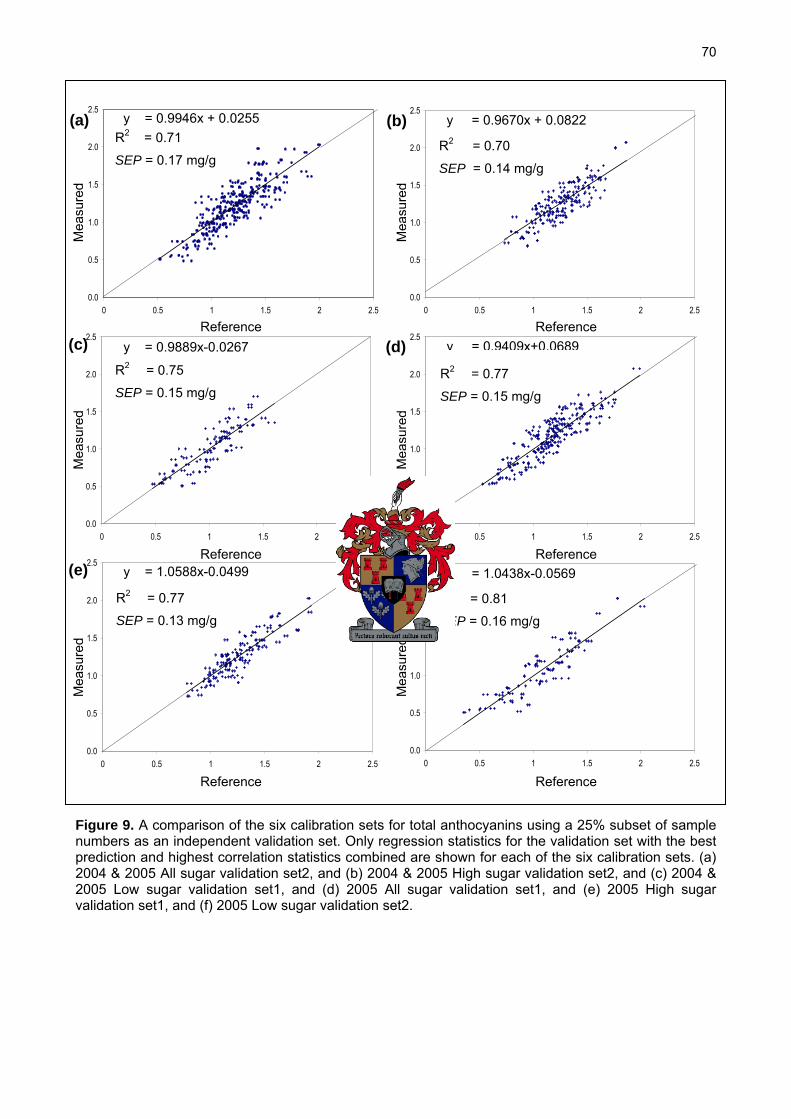
70
2.5
0.0
0.5
1.0
1.5
2.0
0 0.5 1 1.5 2 2.5 0.0
0.5
2.0
2.5
0 0.5 1 1.5 2 2.5
y = 0.9946x + 0.0255 R2 = 0.71
SEP = 0.17 mg/g
y = 0.9670x + 0.0822
R2 = 0.70
SEP = 0.14 mg/g
1.0
1.5
0.0
0.5
2.5
1.0
1.5
2.0
0 0.5 1 1.5 2 2.50.0
0.5
2.0
2.5
0 0.5 1 1.5 2 2.5
y = 0.9409x+0.0689
1.0
1.5
0.0
0.5
2.0
0 0.5 1 1.5 2 2.5
1.0
1.5
2.5
0.0
0.5
2.0
2.5
0 0.5 1 1.5 2 2.5
R2 = 0.77
SEP = 0.15 mg/g
y = 1.0588x-0.0499
R2 = 0.77
SEP = 0.13 mg/g
y = 1.0438x-0.0569
R2 = 0.81
SEP = 0.16 mg/g
1.0
1.5
y = 0.9889x-0.0267
R2 = 0.75
SEP = 0.15 mg/g
(a) (b)
(c) (d)
(e) (f)
Mea
sure
d
Mea
sure
d
Mea
sure
d
Mea
sure
d
Reference Reference
Reference Reference
Reference
Mea
sure
d
Mea
sure
d
Reference
Figure 9. A comparison of the six calibration sets for total anthocyanins using a 25% subset of sample numbers as an independent validation set. Only regression statistics for the validation set with the best prediction and highest correlation statistics combined are shown for each of the six calibration sets. (a) 2004 & 2005 All sugar validation set2, and (b) 2004 & 2005 High sugar validation set2, and (c) 2004 & 2005 Low sugar validation set1, and (d) 2005 All sugar validation set1, and (e) 2005 High sugar validation set1, and (f) 2005 Low sugar validation set2.

71
Table 7. The significance of some RPD statistics (adapted from Williams and Norris, 2001b).
RPD*1 Value Classification Application
0.0-2.3 Very poor Not recommended
2.4-3.0 Poor Very rough screening
3.1-4.9 Fair Screening
5.0-6.4 Good Quality control
6.5-8.0 Very good Process control
8.1+ Excellent Any application *1 Abbreviation used: RPD, ratio of the standard deviation of the reference data of the
validation set to the standard error of prediction
3.3.5 THE EVALUATION OF THE INFLUENCE OF CULTIVARS ON CALIBRATION SET DESIGN FOR TOTAL ANTHOCYANINS IN GRAPE HOMOGENATES
Grape homogenates from the 2005 vintage were divided into four sets according to Vitis vinifera cultivar. Separate calibration models were developed for the prediction of total anthocyanins for Vitis vinifera cultivars Cabernet Sauvignon, Merlot, Pinotage and Shiraz. Samples from all sugar concentrations were included in calibration sets because of the low sample numbers for each individual cultivar. Future efforts will aim to increase the sample numbers in each of the cultivar calibration models, especially that of Pinotage (n = 42). The prediction ability of all cultivar calibration sets were tested with independent validation sets. Table 8 shows the regression statistics for the calibration and validation sets of each cultivar. The SECV values of the four cultivar calibration sets ranged from 0.10-0.12 mg/g and were generally lower than the SECV values for the six calibration sets including all cultivars ranging from 0.11-0.15 mg/g (section 3.3.4, Table 6). There was no significant gain in terms of the prediction accuracy for calibration models consisting of individual grape cultivars (SEP range, 0.13-0.18 mg/g) when compared to calibration models which included all cultivars (SEP range, 0.13-0.17 mg/g) (Table 8). The numbers of PLS factors for the cultivar calibration models were also slightly higher (12 and 13 factors) than that of the calibration models which included all cultivars (11 and 12 factors). It is important to select the optimum number of PLS factors when using PLS. Using too many components will cause “overfitting”. “Overfitting” means the developed calibration model will be very dependent on the calibration dataset and will give poor prediction results. Using too few components will cause “underfitting” and the calibration model will not be large enough to secure the variability in the data. To eliminate the “fitting” effect and achieve more accurate predictions, one solution is to use more samples to develop the calibration model (Naes et al., 2002). The prediction results obtained with the Merlot calibration model were satisfactory. Despite the low SECV value (SECV = 0.12 mg/g) the SEP value for Shiraz was

72
unsatisfactory (SEP = 0.18 mg/g). The contrast between statistics of the calibration and validation set for Shiraz are also reflected in the R2 values (R2 Cal = 0.84; R2 Val = 0.72) The mean anthocyanin content of both the calibration and validation sets for Shiraz was the highest. The lower SEP and R2 values for Shiraz are contradictory to earlier results where the best predictions were obtained for calibration sets with higher anthocyanin means (section 3.3.4, Table 6). Reported NIR calibration results for the total anthocyanins concentrations of Shiraz grape homogenates are: n = 218; SECV = 0.10 mg/g; R2 = 0.95. NIR calibration results reported for Cabernet Sauvignon in the same study are: n = 190; SECV = 0.10 mg/g; R2 = 0.95 (Dambergs et al., 2003). The results for the calibration set of Cabernet Sauvignon was in good agreement with the results obtained in the before mentioned study (n = 158; SECV = 0.12 mg/g; R2 = 0.89). Despite good calibration set results (SECV = 0.10 mg/g; R2 = 0.86) testing with an independent validation set showed that the Pinotage calibration model was unsatisfactory (SEP = 0.13 mg/g; R2 = 0.62). A possible explanation is that due to the low number of samples in the calibration set all possible sources of spectral variation are not included in the calibration set. The standard error of laboratory values (SEL) for the cultivar calibration models ranged from 0.03 mg/g to 0.04 mg/g. The RPD values of the four calibration models range between 1.5 and 2.6. Therefore, the RPD values are well below the limit of 5 indicating that all four models are only fit for screening purposes (Williams and Norris, 2001b). The SD values of all four calibration sets ranged between 0.26 to 0.35 mg/g. The calibration model for Merlot is considered to be the best model because it has the lowest SEP value (SEP = 0.12 mg/g), highest RPD value (RPD = 2.6) together with the highest R2 value (R2 = 0.84).

73
Table 8. General statistics for anthocyanins (mg anthocyanins/g berry) for individual cultivar sets as indicated.
Calibration
Set
2005
Cabernet
Sauvignon
2005
Merlot
2005
Pinotage
2005
Shiraz
Validation
Set
2005
Cabernet
Sauvignon
2005
Merlot
2005
Pinotage
2005
Shiraz
n*1 158 102 42 94 n*1 77 48 18 45
Range*2 0.32 – 1.93 0.49 – 1.69 0.66 – 1.84 0.65 – 2.07 Range*2 0.39 – 1.70 0.54 – 2.03 0.86 – 1.66 0.80 – 2.08
Mean*2 1.10 1.14 1.18 1.32 Mean*2 1.06 1.23 1.27 1.37
SD*1 0.35 0.27 0.26 0.30 SD*1 0.30 0.31 0.20 0.34
SECV*1 0.12 0.10 0.10 0.12 SEP*1 0.13 0.12 0.13 0.18
R2 *1 0.89 0.87 0.86 0.84 R2 *1 0.82 0.84 0.62 0.72
PLS*1 factors 13 13 12 12 Bias -0.019 -0.027 0.007 -0.016
SEL*1 0.03 0.04 0.04 0.03 RPD *1 2.3 2.6 1.5 1.9 *1 Abbreviations used: n, number of samples; SD, standard deviation; SECV, standard error of cross validation; SEP, standard
error of prediction; R2, coefficient of determination; PLS, partial least squares; SEL, standard error of laboratory; RPD, ratio of the standard deviation of the reference data to the standard error of prediction (SEP)
*2 As determined by the reference method

74
3.3.6 THE EVALUATION OF THE EFFECTS OF CALIBRATION SET DESIGN FOR PREDICTION OF TOTAL PHENOLICS IN GRAPE HOMOGENATES
Similar to the calibration sets discussed in section 3.3.2 grape homogenates were divided into six sets to assess the effects of vintage and sugar concentration on the performance of calibration models for the prediction of total phenolics in grapes (Table 9). Grape homogenates from the 2004 vintage were by far outnumbered by 2005 samples. Grape homogenates from both vintages were divided into three sets according to the sugar concentrations: all sugar levels, higher sugar levels (y≥23.5ºBrix) and lower sugar levels (y<23.5ºBrix). Three calibration sets were designed that only contained samples from the 2005 vintage. The described sugar concentrations were again used as differentiation criteria. No calibration sets were evaluated for samples from the 2004 vintage individually.
Table 9. General statistics for total phenolics (OD280/g berry) for calibration and validation sets as indicated.
Calibration set Set n*1 n*1 2004 n*1 2005 Range*2 Mean*2 ± SD*1
2004 & 2005 All sugar Cal*1 325 48 277 0.61 – 1.96 1.34±0.23
Val*11 159 23 135 0.71 – 1.84 1.33±0.21
Val*12 156 23 133 0.58 – 2.01 1.34±0.25
2004 and 2005 High sugar Cal*1 193 34 159 0.90 – 2.01 1.38±0.20
Val*11 94 17 77 0.93 – 1.89 1.38±0.20
Val*12 16 76 92 0.83 – 1.93 1.38±0.22
2004 and 2005 Low sugar Cal*1 129 14 115 0.61 – 2.08 1.27±0.26
Val*11 63 7 56 0.71 – 1.87 1.31±0.24
Val*12 3 56 59 0.58 – 1.90 1.27±0.27
2005 All sugar Cal*1 276 - 276 0.61 – 1.96 1.34±0.25
Val*11 135 - 135 0.71 – 1.88 1.34±0.22
Val*12 133 - 133 0.58 – 2.08 1.34±0.27
2005 High sugar Cal*1 159 - 159 0.90 – 2.01 1.39±0.20
Val*11 77 - 77 0.93 – 1.89 1.40±0.20
Val*12 75 - 75 0.83 – 1.89 1.38±0.22
2005 Low sugar Cal*1 115 - 115 0.61 – 2.08 1.25±0.27 Val*11 55 - 55 0.71 – 1.87 1.30±0.25
Val*12 55 - 55 0.58 – 1.90 1.26±0.27 *1 Abbreviations used: n, number of samples; SD, standard deviation; Cal, calibration;
Val, validation *2 As determined by the reference method

75
Table 10 contains calibration statistics for the six calibration sets. It was difficult to evaluate calibration statistics because diverse prediction results were obtained for the two independent validation sets of five of the six calibration sets. The calibration statistics of the 2005 vintage calibration sets are slightly better than that of the three 2004&2005 vintage calibration sets. Similar results were obtained for the anthocyanin calibration models using the same calibration set design. The standard error laboratory values (SEL’s) for the determination of total phenolics of grape homogenates ranged between 0.06 and 0.07 OD280/g. Overall the coefficients of determination (R2) for the calibration sets ranged from 0.66 to 0.82. Similarly the R2 values for the validation sets ranged between 0.58 and 0.78. The 2005 Low sugar calibration model were judged to be the best of all six calibration models because of the low SECV value (SECV = 0.11 OD280/g), high R2 values for validation sets (R2 Val1 = 0.74 and R2 = Val2 = 0.78) and consistency regarding the prediction of two independent validation sets (SEP Val1 and Val2 = 0.13 OD280/g). The 2005 Low sugar calibration model also had the highest RPD value (RPD = 2.1) of all six calibration sets but it was still much lower than a RPD value of 5. Any RPD value higher than 5 indicates that a calibration model is suitable for quantitative purposes. Note that the number of PLS factors for this model was lower than that used for the other two 2005 vintage calibration models. No improvement of calibration statistics was obtained for the two 2005 All sugars and High sugar calibration sets with the use of less PLS factors (data not shown). There was no significant difference (p>0.05) between the SEP values obtained for the validation sets of the 2004&2005 vintage calibration sets. Based on the lower number of PLS factors used for the 2004&2005 Low sugar calibration model it appears to be the best model of the three 2004&2005 vintage calibration sets. Correlation between the total phenolics concentrations that were determined by the reference method and the estimated values predicted by the six calibration models are graphically represented in Figure 10.

76
Table 10. Calibration statistics for FT-IR measurement of total phenolics (OD280/g).
R2 *1
CalaSEL*1 SEP*1 R2 *1
Val*1
Bias RPD*1Calibration set PLS*1
factors
SECV*1
Val1*1 Val2*1 Val1*1 Val2*1 Val1*1 Val2*1 Val1*1 Val2*1
2004 & 2005 All sugar 12 0.14 0.66 0.07 0.12 0.14 0.67 0.68 0.001 0.008 1.8 1.8
2004 & 2005 High sugar 12 0.11 0.69 0.07 0.12 0.15 0.63 0.55 0.003 0.029 1.7 1.5
2004 & 2005 Low sugar 11 0.13 0.76 0.06 0.12 0.15 0.74 0.70 -0.027 0.016 2.0 1.8
2005 All sugar 13 0.14 0.70 0.07 0.12 0.14 0.70 0.71 -0.007 0.011 1.8 1.9
2005 High sugar 13 0.11 0.70 0.07 0.12 0.15 0.61 0.58 -0.005 0.041 1.7 1.5
2005 Low sugar 11 0.11 0.82 0.06 0.13 0.13 0.74 0.78 -0.041 -0.012 1.9 2.1 *1 Abbreviations used: PLS, partial least squares; SECV, standard error of cross validation; R2, coefficient of determination; SEL,
standard error of laboratory; SEP, standard error of prediction; Cal, calibration; Val, validation; RPD, ratio of the standard deviation of the data to the standard error of prediction

77
0.0
0.5
1.0
1.5
2.0
2.5
0.0 0.5 1.0 1.5 2.0 2.5 0.0
0.5
1.0
1.5
2.0
2.5
0.0 0.5 1.0 1.5 2.0 2.5
0.0
0.5
1.0
1.5
2.0
2.5
0 0.5 1 1.5 2 2.5 0.0
0.5
1.0
1.5
2.0
2.5
0 0.5 1 1.5 2 2.5
0.0
0.5
1.0
1.5
2.0
2.5
0 0.5 1 1.5 2 2.5 0.0
0.5
1.0
1.5
2.0
2.5
0 0.5 1 1.5 2 2.5
y = 1.0352x-0.0513
R2 = 0.63
SEP = 0.12 OD280/g
y = 1.0184x+0.0032
R2 = 0.74
SEP = 0.12 OD280/g
y = 0.9531x+0.0612
R2 = 0.67
SEP = 0.12 OD280/g
y = 0.9221x+0.1105
R2 = 0.70
SEP = 0.12 OD280/g
y = 1.0004x-0.0415
R2 = 0.58
SEP = 0.15 OD280/g
y = 0.8688x+0.2062
R2 = 0.74
SEP = 0.13 OD280/g
(a) (b)
(c) (d)
(e) (f)
Mea
sure
dM
easu
red
Mea
sure
dM
easu
red
Mea
sure
d
Reference Reference
Reference Reference
Reference
Mea
sure
d
Reference
Figure 10. A comparison of the six calibration sets for total phenolics using a 25% subset of sample numbers as an independent validation set. Only regression statistics for the validation set with the best prediction and highest correlation statistics combined are shown for each of the six calibration sets. (a) 2004 & 2005 All sugar validation set1, and (b) 2004 & 2005 High sugar validation set1, and (c) 2004 & 2005 Low sugar validation set1, and (d) 2005 All sugar validation set1, and (e) 2005 High sugar validation set2, and (f) 2005 Low sugar validation set2.

78
3.3.7 THE EVALUATION OF THE INFLUENCE OF CULTIVARS ON CALIBRATION SET DESIGN FOR TOTAL PHENOLICS IN GRAPE HOMOGENATES
Four individual calibration models were established for the prediction of total phenolics of grape homogenates for the four Vitis vinifera cultivars from the 2005 vintage. The developed models included grape homogenates from all sugar concentrations. Table 11 contains the statistics for all four cultivar calibration models. The SEP values obtained by the cultivar calibration models were approximately two times higher than the SEL’s of the calibration sets. The prediction accuracy of the individual cultivar calibration models (SEP range, 0.10-0.14 OD280/g) was similar to that of the calibration models which included all four cultivars (SEP range, 0.12-0.15 OD280/g) (see section 3.3.4). The R2 values of the validation sets for Cabernet Sauvignon, Pinotage and Shiraz were much lower than the R2 values of the calibration sets. The highest calibration R2 value was obtained for Pinotage (R2 = 0.91) which was also the highest calibration R2 value obtained in this study. However this calibration model delivered the lowest R2 value of all the validation sets in this study (R2 = 0.54). It seems as if the model is “overfitting” the calibration samples and therefore it gives poor prediction results. This may be because of the high number of PLS factors (15) used and the low number of samples in the calibration set (n = 40) (Naes et al., 2002). Even lower prediction accuracy was obtained when the use of a lower number of PLS factors was investigated (results not shown). The Merlot calibration model were judged to be the best of all four cultivar calibration sets based on the low SECV (SECV = 0.11 OD280/g), low SEP (SEP = 0.10 OD280/g) and high R2 values for both calibration (R2 = 0.77) and validation (R2 = 0.76). The Merlot calibration model also delivered the highest RPD value (RPD = 2).

79
Table 11. General statistics for total phenolics (OD280/g) for individual cultivar sets as indicated.
Calibration
Set
2005
Cabernet
Sauvignon
2005
Merlot
2005
Pinotage
2005
Shiraz
Validation
set
2005
Cabernet
Sauvignon
2005
Merlot
2005
Pinotage
2005
Shiraz
n*1 141 88 40 94 n*1 69 42 19 46
Range*2 0.58 – 1.78 0.61 – 1.86 1.14 – 2.01 0.78 – 1.89 Range*2 0.76 – 1.73 0.81 – 1.74 1.18 – 1.90 0.92 – 1.93
Mean*2 1.22 1.37 1.53 1.40 Mean*2 1.22 1.37 1.55 1.40
SD*1 0.22 0.23 0.22 0.23 SD*1 0.22 0.20 0.20 0.22
SECV*1 0.09 0.11 0.07 0.11 SEP*1 0.13 0.10 0.14 0.14
R2 *1 0.82 0.77 0.91 0.78 R2 *1 0.65 0.76 0.54 0.61
PLS*1 factors 11 11 15 14 Bias -0.004 -0.036 -0.047 0.044
SEL*1 0.07 0.06 0.05 0.07 RPD*1 1.7 2 1.4 1.6 *1 Abbreviations used: n, number of samples; SD, standard deviation; SECV, standard error of cross validation; SEP, standard
error of prediction; R2, coefficient of determination; PLS, partial least squares; SEL, standard error of laboratory *2 As determined by the reference method

80
3.4 CONCLUSIONS
This study was a large-scale investigation of the application of Fourier transform infrared spectroscopy (FT-IR) for the prediction of total anthocyanins and total phenolics concentrations of grapes. The commercial calibration models provided with the WineScan instrument have low prediction accuracies for the before mentioned parameters and new calibration models were developed. Principal component analysis (PCA) of FT-IR spectra enabled the early detection and interpretation of outlier samples. With the aid of PCA, grape sugar concentration and pH were identified as some of the major sources of variation between grape homogenates. The effects of calibration set design on calibration model performance were extensively investigated for both total anthocyanins and total phenolics. The influences of vintage, sugar concentration and Vitis vinifera cultivar on calibration set design and subsequent prediction accuracy were evaluated. Slightly better accuracy was obtained for restricted, defined data sets (grapes from a single vintage and cultivar). Overall the calibration models obtained for both anthocyanins and total phenolics were satisfactory and can be used for screening purposes. The calibration statistics for anthocyanin calibrations were slightly better than that of the calibrations for total phenolics. This was expected because the absorbance at 280 nm is not specific enough to robustly quantify grape phenolics (Herderich et al., 2004). The use of an alternative reference method such as HPLC to quantify total phenolics will be considered in the future (Cozzolino et al., 2004). It is clear that calibration models must be refined regarding robustness through continued research. More samples from all four Vitis vinifera cultivars from a wider calibration range are imperative to obtain calibration models with higher prediction accuracies and lower prediction errors. The results in this study show that FT-IR spectroscopy shows promise as an analytical technique for the rapid prediction of total anthocyanins and total phenolics of grapes. This suggests that FT-IR can contribute to improved grape quality measurements. For the wine industry SEP’s for calibration models for the determination of total anthocyanins and total phenolics concentrations of grapes of 0.10 mg anthocyanins/g berry and 0.10 OD280/g berry will be acceptable. To successfully implement these measures as part of grape quality control data must be gained over several seasons. This will allow viticulturists and winemakers to develop sufficient experience with the interpretation of results of the two parameters. The goal for the South African wine industry is the industrial use of total anthocyanins and total phenolics of grapes as pre-harvest and at-weighbridge indicators of wine quality.
ABBREVIATIONS USED
ANOVA, analysis of variance; AWRI, Australian wine research institute;FT-IR, Cal, calibration; Fourier transform infrared; HPLC, high performance liquid chromatography; IR, infrared; LSD, least significant difference; n, number of samples; NIR, near-infrared; PC,

81
principal component; PCA, principal component analysis; PLS, partial least squares; R2, coefficient of determination; RPD, ratio of the standard deviation of the reference data to the standard error of prediction; SD, standard deviation; SECV, standard error of cross validation; SEL, standard error of laboratory; SEP, standard error of prediction; TA, titratable acidity; Val, validation.
3.5 LITERATURE CITED
Bakker, J., Preston, N.W. and Timberlake, C.F. (1986). The determination of anthocyanins in aging red wines: Comparison of HPLC and spectral methods. Am. J. Enol. Vitic. 37, 121-126.
Camo Process AS, Oslo, Norway. http://www.camo.noCozzolino, D., Kwiatkowski, M.J., Parker, M., Cynkar, W.U., Dambergs, R.G., Gishen, M. and Herderich,
M.J. (2004). Prediction of phenolic compounds in red wine fermentations by visible and near infrared spectroscopy. Anal. Chim. Acta. 513, 73-80.
Cynkar, W.U., Cozzolino, D., Dambergs, R.G., Janik, L. and Gishen, M. (2004). The effects of homogenization method and freezing on the determination of quality parameters in red grape berries of Vitis vinifera. Aust. J. Grape Wine Res. 10, 236-242.
Dambergs, R.G., Cozzolino, D., Esler, M.B., Cynkar, W.U., Kambouris, A., Francis, I.L., Høj, P.B. and Gishen, M. (2003). The use of near infrared spectroscopy for grape quality measurement. Aust. & New Zea. Grapegrower Winemaker Ann. Tech. Issue. pp. 69-76.
Esbensen, K.H. (ed.). 2002. Multivariate Data Analysis – In Practise. 5th Ed. Camo Process AS, Oslo, Norway.
Foss Analytical, Denmark. http://www.foss.dkFrancis, I.L., Høj, P.B., Dambergs, R.G., Gishen, M., de Barros Lopes, M.A., Pretorius, I.S., Godden, P.W.,
Henschke, P.A., Herderich, M.J. and Waters, E.J. (eds.). 2004. Objective measures of grape quality – are they achievable. Eds. Blair, R., Williams, P. and Pretorius, S. In Proceedings of the twelfth Australian wine industry technical conference; 19-24 July 2004; Melbourne, Victoria. pp. 85-89.
Gawel, R. (1998). Red wine astringency: a review. Aust. J. Grape Wine Res. 4, 74-95. Gishen, M. and Holdstock, M. (2000). Preliminary evaluation of the performance of the Foss WineScan FT
120 instrument for the simultaneous determination of several wine analyses. Aust. Grapegrower Winemaker Ann. Tech. Issue. pp 75-81.
Gishen, M., Iland, P.G., Dambergs, R.G., Esler, M.B., Francis, I.L., Kambouris, A., Johnstone, R.S. and Høj, P.B. (eds.). 2002. Objective measures of grape and wine quality. Eds. Blair, R.J., Williams, R.J. and Høj, P.B. In Proceedings of the eleventh Australian wine industry technical conference; 7-11 October 2001; Adelaide, South Australia. pp. 188-194.
Glories, Y. and Augustine, M. (1993). Maturité phénolique du raisin, consequences technologiques: application aux millésimes 1991 et 1992. Acta Colloque J. Tech.; 21 Janvier 1993; Bordeaux. pp. 56-61.
Herderich, M.J., Bell, S.-J., Holt, H., Ristic, R., Birchmore, W., Thompson, K. and Iland, P.G. (eds.). 2004. Grape maturity and tannins: the impact of viticultural treatments on grape and wine tannins. Eds. Blair, R., Williams, P. and Pretorius, S. In Proceedings of the twelfth Australian wine industry technical conference; 19-24 July 2004; Melbourne, Victoria. pp. 79-84.
Iland, P.G. (1987). Predicting red wine colour from grape analysis. Aust. Grapegrower Winamaker. 285, 29. Iland, P., Ewart, A., Sitters, J., Markides, A., Bruer, N. (eds). 2000. 1st Ed. Techniques for chemical analysis
and quality monitoring during winemaking. Patrick Iland Wine Promotions, Campbelltown, Australia, pp. 78-79.
Jackson, M.G., Timberlake, C.F., Bridle, P. and Vallis, L. (1978). Red wine quality: Correlations between colour, aroma, and flavour and pigment and other parameters of young Beaujolais. J. Sci. Food Agric. 29, 715-727.
Kupina, S.A. and Shrikhande, A.J. (2003). Evaluation of a Fourier transform infrared instrument for rapid quality-control wine analyses. Am. J. Enol. Vitic. 54, 131-134.
Marais, J., Iland, P. and Swart, E. (2001). Exploring the relationships between Pinotage grape colour and wine quality – Prelimimary results. Wineland (February 2001), 76-78.

82
Marais, J. and October, F. (2005). Relationships between grape colour and wine quality. Wineland (July 2005), 85-87.
Naes, T., Isaksson, T. Fearn, T. and Davies, T. (eds). 2002. A user-friendly guide to multivariate calibration an classification. NIR Publications, Chichester, UK.
Noble, A.C. (1994). Bitterness in wine. Physiol. Behav. 56, 1251-1255. Patz, C.-D., Blieke, R., Ristow, H. and Dietrich, H. (2004). Application of FT-MIR spectrometry in wine
analysis. Anal. Chim. Acta. 513, 81-89. Rigaud, J., Escribano-Bailon, M.T., Prieur, C., Souquet, J.-M. and Cheynier, V. (1993). Normal-phase high
performance liquid chromatographic separation of procyanidins from cacao beans and grape seeds. J. Chromatogr. 654, 255-260.
Singleton, V.L. and Esau, P. (1969). Phenolic substances in grapes and wine, and their significance. Eds. Chichester, C.O., Mrak, E.M. and Stewart, G.F. In Advances in Food Research. Supplement 1. 1st Ed. Academic Press Inc., New York, USA. pp. 31-38.
Singleton, V.L and Rossi, J.A. Jr. (1965). Colorimetry of total phenolics with phosphomolybdic-phosphotungstic acid reagents. Am. J. Enol. Vitic. 16, 144-158.
Skoog, D.A., Holler, F.J. and Nieman, T.A. (eds.). 1998. Principles of Instrumental Analysis. 5th Ed. Harcourt Brace College Publishers, USA. pp. 380-403.
Smith, B. (ed.). 1999a. Infrared Spectral Interpretation: A Systematic Approach. 1st Ed. CRC Press LLC, Florida, USA. pp. 1-29.
Smith, B. (ed.). 1999b. Infrared Spectral Interpretation: A Systematic Approach. 1st Ed. CRC Press LLC, Florida, USA. pp. 67-90.
Snedecor, G.W. and Cochran, W.G. (eds). 1980. Statistical methods. 7th Ed. The Iowa State University Press, USA.
Somers, T.C. (1971). The polymeric nature of wine pigments. Phytochemistry. 10, 2175-2186. Somers, T.C. and Evans, M.E. (1974). Wine quality: correlations with colour density and anthocyanin
equilibria in a group of young red wines. J. Sci. Food. Agric. 25, 1369-1379. Somers, T.C. and Evans, M.E. (1977). Spectral evaluation of young red wines: Anthocyanin equilibria, total
phenolics, free and molecular SO2, “chemical age”. J. Sci. Food Agric. 28, 279-287. Versari, A., Boulton, R. and Thorngate, J. (2004). The prediction of the color components of red wines using
FTIR, wine analyses, and the method of partial least squares. Eds. Waterhouse, A.L. and Kennedy. J.A. In Red Wine Color: revealing the mysteries. 1st Ed. A.C.S. Symposium Series, Washington DC. 886, pp. 53-67.
Williams, P.C. and Norris, K. (eds.). 2001a. Near-Infrared Technology in the Agricultural and Food Industries. 2nd Ed. American Association of Cereal Chemists, Inc., Minnesota, USA. pp. 19-37.
Williams, P.C. and Norris, K. (eds.). 2001b. Near-Infrared Technology in the Agricultural and Food Industries. 2nd Ed. American Association of Cereal Chemists, Inc., Minnesota, USA. pp. 145-169.

CHAPTER 4
RESEARCH RESULTS
The evaluation of the reference analysis method protocol for the determination of total
anthocyanins and total phenolics in grapes
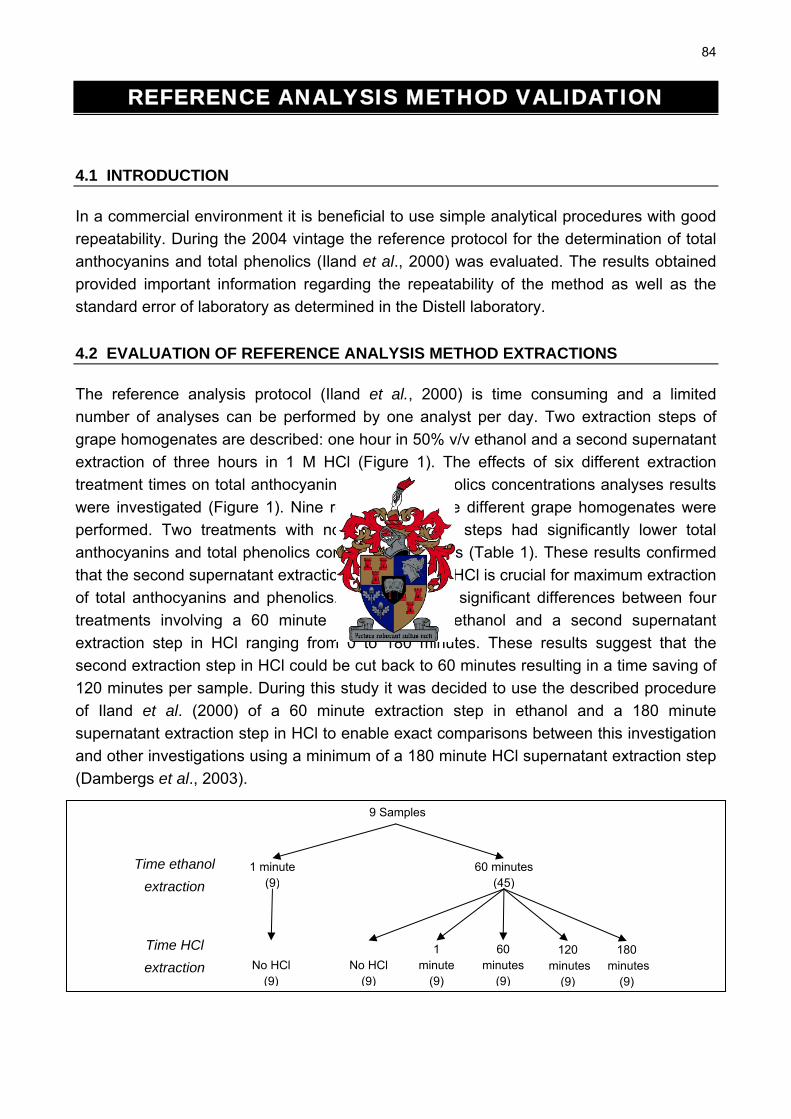
84
REFERENCE ANALYSIS METHOD VALIDATION
4.1 INTRODUCTION
In a commercial environment it is beneficial to use simple analytical procedures with good repeatability. During the 2004 vintage the reference protocol for the determination of total anthocyanins and total phenolics (Iland et al., 2000) was evaluated. The results obtained provided important information regarding the repeatability of the method as well as the standard error of laboratory as determined in the Distell laboratory.
4.2 EVALUATION OF REFERENCE ANALYSIS METHOD EXTRACTIONS
The reference analysis protocol (Iland et al., 2000) is time consuming and a limited number of analyses can be performed by one analyst per day. Two extraction steps of grape homogenates are described: one hour in 50% v/v ethanol and a second supernatant extraction of three hours in 1 M HCl (Figure 1). The effects of six different extraction treatment times on total anthocyanins and total phenolics concentrations analyses results were investigated (Figure 1). Nine repetitions of nine different grape homogenates were performed. Two treatments with no HCl extraction steps had significantly lower total anthocyanins and total phenolics concentration values (Table 1). These results confirmed that the second supernatant extraction step involving HCl is crucial for maximum extraction of total anthocyanins and phenolics. There were no significant differences between four treatments involving a 60 minute extraction with ethanol and a second supernatant extraction step in HCl ranging from 0 to 180 minutes. These results suggest that the second extraction step in HCl could be cut back to 60 minutes resulting in a time saving of 120 minutes per sample. During this study it was decided to use the described procedure of Iland et al. (2000) of a 60 minute extraction step in ethanol and a 180 minute supernatant extraction step in HCl to enable exact comparisons between this investigation and other investigations using a minimum of a 180 minute HCl supernatant extraction step (Dambergs et al., 2003).
9 Samples
1 minute (9)
60 minutes (45)
Time ethanol extraction
Time HCl extraction
1 minute
(9)
60 minutes
(9)
180 minutes
(9)
120 minutes
(9)
No HCl
(9)
No HCl
(9)

85
Figure 1. The experimental design to investigate the effects of different extraction steps on the total anthocyanin and total phenolic concentrations of grapes. Numbers in brackets represent numbers of replicates.
Table 1. The effects of different extraction times on the total anthocyanins and total phenolics concentrations of grapes.
Extraction time (minutes)
n*1 Total anthocyanins (mg/g)*3
Total phenolics (OD280/g)*4
50% v/v Ethanol 1 M HCl Mean*2 ± SD*1 Mean*2 ± SD*1
1 No HCl 9 0.49b ± 0.11 0.30b ± 0.01
60 No HCl 9 0.52b ± 0.08 0.30b ± 0.01
60 1 9 0.95a ± 0.19 1.32a ± 0.24
60 60 9 0.94a ± 0.22 1.28a ± 0.22
60 120 9 0.95a ± 0.23 1.29a ± 0.24
60 180 9 0.95a ± 0.23 1.28a ± 0.23
Significance of least significant difference (LSD) test of treatment means at p≤0.05 and standard deviation. Means with different symbol superscripts in the same column indicate statistically significant differences among treatments. *1 Abbreviations used: n, number of samples; SD, standard deviation *2 As determined by the reference method *3 Expressed as mg anthocyanins per gram fresh berry *4 Expressed as OD280 per gram fresh berry
4.3 DETERMINATION OF THE REPEATABILITY OF REFERENCE ANALYSIS METHOD
Figures 2 and 3 show the box and whisker plots for eight repetitions of the reference protocol for total anthocyanins and total phenolics (Iland et al., 2000) as determined on four grape homogenates of Vitis vinifera cultivars Cabernet Sauvignon, Merlot, Pinotage and Shiraz. The reference method showed good repeatability. Analyses of Merlot and Shiraz grape homogenates respectively delivered one repetition (outlier) with a total anthocyanins value which differed significantly from the 7 other repetitions (Figure 2). During laboratory analysis of the two identified outlier samples a small volume of the ethanol extracts were spilled which lead to subsequent inaccurate dilutions with HCl. According to the total phenolics results in Figure 3 the spillages had no obvious influence on the total phenolics results of the same Merlot and Shiraz grape homogenates. This investigation highlighted the importance of meticulous laboratory practices to ensure accurate analysis results.

86
Median 25%-75% Non-Outlier Range Outliers Extremes
Cabernet SauvignonMerlot
PinotageShiraz
Cultivar
0.9
1.0
1.1
1.2
1.3
1.4
1.5
1.6
1.7
1.8
1.9
mg
anth
ocya
nins
per
g b
erry
Figure 2. Box and whisker plot showing the repeatability of 8 total anthocyanins reference laboratory repetitions on grape homogenates of the Vitis vinifera cultivars Cabernet Sauvignon, Merlot, Pinotage and Shiraz.
Median 25%-75% Non-Outlier Range Outliers Extremes
Cabernet SauvignonMerlot
PinotageShiraz
Cultivar
0.9
1.0
1.1
1.2
1.3
1.4
1.5
1.6
OD
280
per g
ber
ry
Figure 3. Box and whisker plot showing the repeatability of 8 total phenolics reference laboratory measurements on grape homogenates of the Vitis vinifera cultivars Cabernet Sauvignon, Merlot, Pinotage and Shiraz.

87
4.4 EXCLUSION OF SAMPLES WITH POOR REPEATABILITY FROM DATA SETS
Tables 2 and 3 contain respective 75th and 25th percentile values of eight reference repetitions for total anthocyanins and total phenolics of Cabernet Sauvignon, Merlot, Pinotage and Shiraz Vitis vinifera grape homogenates (see section 4.2). The differences between the 75th and 25th percentile values for each cultivar were calculated for both total anthocyanins and total phenolics (Tables 2 and 3). The difference between the 75th and 25th percentile values of Pinotage was the highest for both total anthocyanins (0.10 mg/g) and total phenolics (0.15 OD280/g) concentrations. It was decided to use these two values as criteria to decide which samples to exclude from sample sets based on poor repeatability. Therefore samples with duplicate determinations of grape homogenates with a total anthocyanins difference ( ) greater than 0.10 mg/g berry were excluded from anthocyanins data sets. For total phenolics data sets samples with a difference (
21 yy −
21 yy − ) of greater than 0.15 OD280/g berry were excluded from total phenolics data sets. According to these criteria 31 of the 120 2004 vintage samples were excluded for total anthocyanins data sets (n included 2004 = 89) and 25 of the 120 2004 vintage samples were excluded from total phenolics data sets (n included 2004 = 95). 124 Samples of the 727 2005 vintage samples were excluded from anthocyanins data sets (n included 2005 = 603) and 153 samples for total phenolics data sets (n included 2005 = 553). Therefore, many samples were excluded from data sets to eliminate the effects of poorly repeated reference analysis on calibration models and subsequent prediction statistics.
Table 2. Statistics of 8 total anthocyanins reference repetitions on grape homogenates of Vitis vinifera cultivars, Cabernet Sauvignon, Merlot, Pinotage and Shiraz.
Cultivar n*1 Mean*2,3 ± SD*1 75th
Percentile*325th
Percentile*3Difference between 75th Percentile and
25th Percentile*3
Cabernet Sauvignon 8 1.54 ± 0.07 1.59 1.50 0.09
Merlot 8 1.08 ± 0.04 1.11 1.07 0.04
Pinotage 8 1.12 ± 0.07 1.17 1.07 0.10
Shiraz 8 1.60 ± 0.08 1.62 1.55 0.07
*1 Abbreviations used: n, number of samples; SD, standard deviation *2 As determined by the reference method *3 Expressed as mg anthocyanins per gram berry

88
Table 3. Statistics of 8 total phenolics reference repetitions on grape homogenates of Vitis vinifera cultivars, Cabernet Sauvignon, Merlot, Pinotage and Shiraz.
Cultivar n*1 Mean*2,3 ± SD*1 75th
Percentile*325th
Percentile*3Difference between 75th Percentile and
25th Percentile*3
Cabernet Sauvignon 8 1.09 ± 0.08 1.16 1.01 0.15
Merlot 8 1.29 ± 0.08 1.37 1.22 0.15
Pinotage 8 1.06 ± 0.09 1.13 0.98 0.15
Shiraz 8 1.33 ± 0.09 1.39 1.24 0.15 *1 Abbreviations used: n, number of samples; SD, standard deviation *2 As determined by the reference method *3 Expressed as OD280 per gram berry
4.5 DETERMINATION OF THE STANDARD ERROR OF LABORATORY (SEL)
The standard error of laboratory (SEL) values for the determination of total anthocyanins and total phenolics concentrations were calculated on the original vintage data sets and after samples were removed based on poor repeatability (final data sets) (Table 4). The SEL values for the original and final 2005 anthocyanin data sets were slightly lower than that of the two 2004 anthocyanin data sets. This was expected due to more repetitions and practice of the laboratory method resulting in increased reference method accuracy. The SEL for the determination of anthocyanins concentrations in the Australian Wine Research (AWRI) laboratory was reported as approximately 0.05 mg/g berry (Gishen et al., 2002). All four SEL values for anthocyanin data sets were in good agreement with this value. Both the 2004 and 2005 final anthocyanin data sets had lower SEL values than the 2004 and 2005 original data sets. The lower SEL values of the final data sets indicate higher reference method accuracy that will be beneficial for calibration model development. Contrary to the total anthocyanins data sets the total phenolics SEL values for the original 2004 and 2005 data sets were exactly the same (0.09 OD280/g) and the SEL for the 2005 final total phenolics data set was even slightly higher than that of the 2004 final data set. A possible explanation for the contradictory SEL values for total anthocyanins and total phenolics is that the total phenolics reference might be more sensitive due to the absorption of components other than phenolic compounds at 280 nm.

89
Table 4. Standard error of laboratory values (SEL) for total anthocyanins and total phenolics data sets.
Vintage n*1 Total
anthocyanins data sets
SEL*1 Total anthocyanins
data sets (mg/g)*2
n*1 Total
phenolics data sets
SEL*1 Total phenolics
data sets (OD280/g)*3
2004 Original data set 120 0.08 120 0.09
2004 Final data set 89 0.04 95 0.05
2005 Original data set 727 0.06 727 0.09
2005 Final data set 603 0.03 553 0.07 *1 Abbreviations used: n, number of samples; SEL, standard error of laboratory *2 Expressed as mg anthocyanins per gram berry *3 Expressed as OD280 per gram berry
4.6 CONCLUSIONS
The results obtained during the evaluation of reference analysis method protocol suggest that the second extraction step in HCL could be cut back from 180 to 60 minutes. This implies a big time saving during reference method analyses. However, these experiments must be repeated and thoroughly evaluated before such an adjustment to the reference analysis method can be made. An experiment showed that the reference analysis method has good repeatability. For calibration purposes a number of samples were removed from data sets based on poor repeatability of duplicate determinations to ensure that the optimal calibrations models could be obtained (Chapter 3). The standard error of laboratory values (SEL) for both total anthocyanins and total phenolics data sets were satisfactory low. For future analyses the aim is to keep the SEL for both total anthocyanins and total phenolics concentrations analyses at these low levels or to improve reference analysis method accuracy even further.
4.7 LITERATURE CITED
Dambergs, R.G., Cozzolino, D., Esler, M.B., Cynkar, W.U., Kambouris, A., Francis, I.L., Høj, P.B. and Gishen, M. (2003). The use of near infrared spectroscopy for grape quality measurement. Aust. & New Zea. Grapegrower Winemaker Ann. Tech. Issue. pp. 69-76.
Gishen, M., Iland, P.G., Dambergs, R.G., Esler, M.B., Francis, I.L., Kambouris, A., Johnstone, R.S. and Høj, P.B. (eds.). 2002. Objective measures of grape and wine quality. Eds. Blair, R.J., Williams, R.J. and Høj, P.B. In Proceedings of the eleventh Australian wine industry technical conference; 7-11 October 2001; Adelaide, South Australia. pp. 188-194.
Iland, P., Ewart, A., Sitters, J., Markides, A., Bruer, N. (eds). 2000. 1st Ed. Techniques for chemical analysis and quality monitoring during winemaking. Patrick Iland Wine Promotions, Campbelltown, Australia, pp. 78-79.

CHAPTER 5
RESEARCH RESULTS
The evaluation of the possibility to implement grape total anthocyanins and total phenolics
concentrations analyses at a commercial winery in South Africa – a preliminary study

91
RESEARCH RESULTS
ABSTRACT
In the quest for more objective measures of grape quality, the total anthocyanins and total phenolics concentrations analyses of grapes were evaluated as two additional parameters to include as part of grape quality control at a commercial winery in South Africa for the cultivars Cabernet Sauvignon, Merlot, Pinotage and Shiraz. During this investigation 603 grape samples from the 2005 vintage were analysed for these two components. Principal component analysis (PCA) emphasized the importance of measuring many chemical components for the purpose of capturing enough information to discriminate between samples. It was established that as the sugar concentrations of grapes increase both the total anthocyanins and total phenolics concentrations increase. For the 2005 vintage the mean total anthocyanins concentration for Shiraz grapes was the highest (1.44 mg/g) followed by Pinotage (1.28 mg/g), Cabernet Sauvignon (1.22 mg/g) and Merlot (1.18 mg/g). Pinotage grapes had the highest mean total phenolics concentration (1.53 OD280/g) followed by Shiraz (1.47 OD280/g), Merlot (1.38 OD280/g) and Cabernet Sauvignon (1.26 mg/g). For all investigated Vitis vinifera cultivars a general trend was observed that earlier harvested grapes had significantly higher (p≤0.05) total anthocyanins and total phenolics concentrations than grapes harvested later in the season. Cabernet Sauvignon and Merlot grapes contained approximately 33% less anthocyanins in the later harvested grapes. Results showed that grape samples from regularly irrigated vineyards had lower total anthocyanins and total phenolics concentrations compared to dryland vineyards. An investigation involving the viticultural block grading revealed that the total anthocyanins and total phenolics concentrations of A graded grapes (higher grape quality) was not significantly higher (p.0.05) than that of C graded grapes (lower grape quality). Consequently the addition of the total anthocyanins and total phenolics concentrations analyses of grapes as part of viticultural block classification protocol is recommended. The results of this study showed that the addition of the two parameters total anthocyanins and total phenolics concentrations as part of grape quality control will supply additional data according to which grapes can be more accurately classified.
5.1 INTRODUCTION
Increased grape production in certain parts of the globe causes large volumes of wines to flood wine markets. Wine consumers are spoilt for choice and offered high-quality wines at low prices. In these challenging conditions for wine producers one solution to remain economically viable is to improve wine quality and sell wines at higher price points. Presumably consumers will pay more money for wines of higher quality that offers more pleasure. To aid in the quest to improve the quality of wines it is important to identify grape components and winemaking practices that contribute most to final wine quality and to develop objective measures of these.

92
More information about the chemical composition of grapes is to the advantage of both grape producers and winemakers. The standard quality assessment protocol of grapes at most wine cellars in South Africa involves the pre-assessment of viticultural practices and the determination of chemical parameters such as total soluble solids (TSS), pH value and titratable acidity (TA). These measurements, without doubt, are important indicators of grape quality but there is a need for additional objective analyses that correlate with grape quality. Phenolic compounds such as tannins are associated with sensory sensations such as astringency and mouth-feel of wine (Herderich and Smith, 2005) and it is widely speculated that wine tannins are correlated to red wine quality (Herderich et al., 2004). Wine colour intensity is an important indicator of wine quality. The anthocyanin concentration of grapes is highly correlated with wine colour intensity (Somers and Evans, 1974; Jackson et al., 1978; Iland, 1987; Francis et al., 1999; Marais et al., 2001; Marais and October, 2005). In a study investigating the relationship between grape colour and wine quality in South Africa, Marais and October (2005) found that Shiraz showed the most potential to predict wine quality based on grape colour to a 66-71% level of accuracy. On the other hand Pinotage and Cabernet Sauvignon did not show such a positive correlation. These correlations were valid for grape anthocyanin concentrations of up to 1.7 mg anthocyanins/g berry weight. Therefore the determination of the total phenolics and anthocyanin concentration of grapes provide additional objective measures of grape quality. The measurement of the total phenolic and anthocyanin concentration of grapes could allow better evaluation of different vineyard management practices and provide additional information to make more informed decisions regarding optimum harvest dates of grapes. The addition of total phenolics and anthocyanin concentration of grapes as quality classification parameters could lead to more accurate classification of grapes, the refinement of payment schemes, better streaming of grape must inside the cellar to fit particular wine styles and achieve maximum phenolic composition and wine colour within different wine quality categories instead of having one average blend (Dambergs et al., 2003). This study was a preliminary evaluation of the implementation of the two chemical parameters total anthocyanins and total phenolics concentrations as part of routine quality monitoring of grapes at Distell (Distell Group (Pty) Ltd), a commercial winery in South Africa. The objectives of this study were to draw statistically significant conclusions about (1) the distribution of total anthocyanins and total phenolics concentrations in grapes from different maturity levels, cultivars, irrigation treatments and origin delivered to Distell; and (2) establish whether the total anthocyanins and phenolics concentrations of grapes correlates with conventional chemical parameters used for the classification of grape quality as well as grape grading according to current viticultural practices.

93
5.2 MATERIALS AND METHODS
5.2.1 GRAPE SAMPLES AND HOMOGENATE PREPARATION
During the 2005 vintage 603 whole bunch grape samples were collected from Distell (Distell Group (Pty) Ltd), South Africa. Grape bunches were either picked in the vineyards or sampled from loads delivered at the respective weighbridges of the Adam Tas and Bergkelder wine production facilities. Distell viticulturists did pre-harvest grape quality assessments. Vineyard blocks were classified taking into account factors such as the vineyard location, the standard of vineyard management practices and the sensory evaluation of grapes. Block history with regards to vineyard management practices and wine quality from previous vintages had also been taken into account during block grading. Vineyard blocks were classified as A, B or C with grapes from A and C blocks expected to be of the highest and lowest quality, respectively. Samples consisted of 5 to 10 bunches of grapes each and were of Vitis vinifera cultivars Cabernet Sauvignon, Merlot, Pinotage and Shiraz. All grape samples originated from the Western Cape region in South Africa (Figure 1) and were received on the day of picking. Due to limited storage space samples were stored overnight at 0 or 4ºC. Grape berries were hand picked from bunches and kept in containers until analysed. For each sampled block a randomly picked sub sample of 100 berries was weighed and the mean berry weight recorded. Subsequently grape berries were homogenised for approximately 5 seconds in a colloid mill designed for homogenising soil samples and the resulting uniformly smooth pastes were analysed on the same day of homogenisation.
5.2.2 QUANTIFICATION OF TOTAL ANTHOCYANINS AND TOTAL PHENOLICS
The total anthocyanins and total phenolics concentrations of grape samples were determined in duplicate on grape homogenates according to the method described by Iland et al. (2000). Results were reported as mean values (section 4.2.4.1, equation 1). See Chapter 4 for full details of an evaluation of the reference protocol.
5.2.3 DETERMINATION OF SUGAR, pH, TITRATABLE ACIDITY, TARTARIC ACID, MALIC ACID AND POTASSIUM AND OTHER CHEMICAL COMPONENTS
Grape homogenates were centrifuged and supernatants filtered using filter paper circles graded at 20-25 µm with a diameter of 50 mm (Schleicher & Schuell, reference number 10312706). The sugar (ºBrix), titratable acidity (TA), tartaric acid, malic acid, potassium concentrations and pH as well as other chemical components were determined with a WineScan FT 120 spectrometer (Foss Analytical, Denmark). Due to clogging of the cuvette the instrument was cleaned between every sample using the S-470 Cleaning Agent Solution and zeroed at regular intervals using Zero Liquid S-6060 (Foss WineScan FT 120 Type 77110 and 77310 Operator’s Manual, Foss Analytical, Denmark, 2001). The commercial calibration models available with the WineScan were used to quantify the mentioned chemical components (Foss Analytical, Denmark). During

94
this study no validation of the commercial calibration models was made but the commercial calibration models were validated previously (personal communication Distell) and all FT-IR analyses were performed on the same instrument.
5.2.4 STATISTICAL ANALYSIS
5.2.4.1 Statistical equations
Standard statistical equations were used to calculate the means and standard deviations values for sugar, pH, titratable acidity (TA), tartaric acid, malic acid and potassium (equations 1 and 2) (Snedecor and Cochran, 1980). Correlations between chemical components were calculated according to equation 3 (Snedecor and Cochran, 1980).
Mean or x = n
xn
ii∑
=1 …..1
Standard deviation or SD = 1
)(1
2
−
−∑=
n
xxn
ii
…..2
Correlation or r =yx
iii
SS
yyxxn∑ −− ))((1
…..3
where Sx and Sy are the standard deviation of x and y respectively.
5.2.4.2 One-way analysis of variance (ANOVA) and post-hoc analysis
Result means data were subjected to one-way analysis of variance (ANOVA) and post-hoc analysis (Bonferroni tests). When multiple comparisons are done the reported probability levels overestimate the statistical significance of mean differences. The Bonferroni adjustment is used to make it more difficult for any one test to be significant. Results were reported at the 5% significance level. The Statistica version 7.0 software (Tulsa, OK. U.S.A.) was used for all statistical analyses.
5.2.4.3 Multivariate data analysis
Principal component analysis (PCA) of the chemical data obtained with the WineScan was done with The Unscrambler Software (version 9.2, Camo AS, Norway). For this purpose data were organised in one two-dimensional matrix table where the columns were defined by X-variables (in this study the various chemical components quantified by the WineScan), while the rows were defined by the grape homogenate samples. PCA models the interrelationships between the different variables and facilitates the detection and interpretation of sample patterns, similarities and differences (Esbensen, 2002, Naes et al., 2002). Each principal component (PC)

95
is a linear function of the original variables and collectively they describe in descending order the main structured information in the data. Every PC can be interpreted individually, as they are calculated orthogonal to one another. X-variables were scaled by multiplying each of the original values by 1/SD (SD, standard deviation).
5.3 RESULTS AND DISCUSSION
5.3.1 ORIGIN OF GRAPE SAMPLES
Grape samples of the 2005 vintage used in this study originated from diverse terroir units in the Western Cape, South Africa which differ amongst others with regard to altitude above sea-level, soil types, rainfall, wind or sea breezes and temperatures (Figure 1). More than half of the number of samples (±62%) originated from Stellenbosch (n = 373). A large number of samples also originated from the nearby Paarl region (n = 104). The three areas Darling (n = 28), Malmesbury (n = 46) and Philadelphia (n = 6) are collectively referred to as the Swartland area (n = 80). Fewer samples (15 or less) were analysed for the following areas: Durbanville (n = 14), Walker Bay (n = 10), Overberg (n = 9), Somerset West (n = 8), Philadelphia (n = 6), Piketberg (n = 2) and Robertson (n = 1). Information regarding the origin of two samples was not available.
5.3.2 RELATIONSHIPS BETWEEN TOTAL ANTHOCYANINS CONCENTRATIONS, TOTAL PHENOLICS CONCENTRATIONS AND GRAPE CHEMICAL PARAMETERS
In order to model the relationships between the samples on the basis of chemical composition, the chemical components quantified by the commercial calibrations on the WineScan instrument were used. At the time of this study, only the commercial calibrations for Brix, pH, titratable acidity, tartaric acid, malic acid and potassium had been validated and were used for modelling (See Appendix 1). Relationships between grape homogenate samples showed no obvious clustering in PCA analysis (Figure 2). On PC1 positive X-loadings for Brix, pH, tartaric acid and potassium and negative X-loadings for titratable acidity and malic acid explain the most important variance between the samples. Positive X-loadings for mg anthocyanin/g berry and OD280/g berry explained the separation of samples towards the positive end of PC2.

96
Figure 1. A map of the Western Cape region of South Africa illustrating the different areas where the samples used in this study originated from.
In subsequent analysis all the chemical components available on the WineScan were used (Figure 3). The components are included in the WineScan commercial calibration Must-Sanitary state (Foss application notes, GrapeScan Calibration: Must – Sanitary State). Only the commercial calibrations for ºBrix, pH, titratable acidity, tartaric acid, malic acid and potassium have been validated. With all the additional X-variables included in modelling the Pinotage samples located primarily along the positive ends of PC1 and PC2 and clearly had higher loadings for some variables (Figure 3a). On PC1 positive X-loadings for Brix, density, glucose-fructose, pH, potassium, tartaric acid, ethyl acetate and colour intensity and negative X-loadings for titratable acidity, malic acid and lactic acid explained the most important variance between the samples. On PC2 positive X-loadings for isoamylacetate and gluconic acid contributed considerably to the separation of samples on the positive end of PC2 (Figure 3b). Gluconic acid is correlated with acetic acid bacteria or with the fungal grapevine pathogen Botrytis cinerea. On most of the grapes no infection was observed but these results indicate that trace levels of these pathogens did occur. Isoamylacetate is an ester aroma compound associated with the distinct aroma of Pinotage wines. This result was highlighted further by the 3-dimensional score plot (Figure 4) and showed that the Pinotage samples separated primarily on PC2, while the

97
Cabernet Sauvignon, Shiraz and Merlot samples showed similar patterns of separation along PC1.
Figure 2. PCA of grape homogenate samples (n = 603) of the 2005 vintage. a) Score plot of PC1 (40% X-variance explained) and PC2 (23% X-variance explained). C:Carbernet Sauvignon (blue markers), M:Merlot (red markers), P:Pinotage (dark green markers), S:Shiraz (light green markers). b) Loadings plot of PC1 and PC2. c) Residual calibration variance plot showing that 5 PC’s describe more than 95% of the X-variance. d) Scores and loadings from the PCA model showing relationships between samples and X-variables in the data set. X-variables (red markers), cultivars (blue markers.
On PC1 (Figure 5) positive X-loadings for ethylacetate, mesoinositol, butanediol, FolinC Index, color intensity, tartaric acid and negative X-loadings for lactic acid explained important variation in the samples. On PC2 positive X-loadings for titratable acidity, lactic acid and negative X-loadings for mannitol and volatile acidity explained variation along PC2. These results highlight the importance of measuring many chemical components for the purpose of capturing enough information to discriminate between samples. This result was of particular interest for the purposes of identifying which parameters to include in the assessment of grape
-4
-2
0
2
4
6
-6 -4 -2 0 2 4 6 RESULT4, X-expl: 40%,23%
CC
CC
C
C
CC CC
CCC
C
C
C
CC
C
C
C
C
C
C
CCC
C
CC
C
C
C
CC
C
CC
C
C
C
C
CC
C
C
CC
CC
C
CCC
C
C
C
C
C
CC CC
C
C
C CC
CCC
C
CC
CC
CC
CC C
C
C
CC CC
CC
C
C
C
C
C
C
CC
CC
C
C
C
C
C
C
CC
C
C
C CC
CC
C
C
C
CC
C
C
CC
C
C
C
C
CC
CC
CC
CC
C
C
C
C
C
C
C
C
C
C
CCC
C
C
C C
C
C
CCCC
C C
C
CC
C
C CC C
C
CC
C
CC
CC
C
CC C
CC
CC
C
C
C
C
CC
C
C
C
C
CC
C
CCC C
CC
CC
CCC CC
CC
C
C CC C
C
CC
C
C
C CC
C C
C
CC
C
CC
C
C
CC
CC
C
CCC
C
C
C
C
C
CC
C
C
C C C
C
CC
C CC
C
C
C C
CC
C
CC
CCC
CC
C
C
M
M
M
MM
M
MM
M
M
M
M
M
MM
M
M
MM
MMM
M M
MM
M
M
M
M
M
MM
M MM
M
M
M
MM
MM
MMM
M
M
M
M
MM M
M
M
MMM
M
MMM
MM
M
MM
MM
M
M
MMM
MM
MM
M
M
M
M
MMMM
M
M
M
M MM
M
MM
M
M
M
MM
M
MMM
M
M
M
MM
M
M
M
MM
M
M
MM
M
MMMMM
MM
MM
M
M
MM
M
MM
MM
M
M MMMM
M
M
MM
MM
M
M
M
M
MM
M
M
M
M
M
MM
MM
M
M
M
M
MM
M
M M
M
MM MMMM
M
M
M
MM
M
M
MM
M
M
MMM
P
PP
PP
PP
P PP
P
P
P
P
P
P
P
P
PP
P
P
P P
PPP P P
PP
P
PP
P PP
PP
PP
P
PPP
PP
P
P
PP
PP PPP
P
PP
PPP P
P
P
PP PPP P
P
PPP
P
P
P
P
S
S S
S
S
S
S
S
S
S
SS
SS
S
SS
SS
SS
SS
S S
S
S S
SS
SS
S
S
S
S
SS
S
SS
S
SS
SSS
S
S
S
S
S
S
S
S
SSS
SS
S
S
S
SSS
SS
S
S
S
S
S
S
S
S
SS
SS
S
S
SS
S
SSS
SS
SS
S
S
S SSS
SS
S
S
S
S
S
S
SSS
S S S
S
SS
S
SS
SS
S
S
S
S
S
S
S
S
S S
S
S S SSS
S
SS
S SS SS
SSS
S
S
S
S
S
S
S S
S
SS
S
S
SS
SSS
S
S
S
S
SSS S
SS
PC1
PC2 Scores
-0.2
0.2
0.4
0.6
0
-0.4 -0.3 -0.2 -0.1 0 0.1 0.2 0.3 0.4 0.5 RESULT3, X-expl: 41%,23%
mg ant*/g berry
OD280/g berry
Brix
Titratable acid
pH
TartaricAcidMalicAcid
Potassium
PC1
PC2 X-loadings
0
1.0
0.2
0.4
0.6
0.8
PC_00 PC_01 PC_02 PC_03 PC_04 PC_05 PC_06 PC_07 PC_08 RESULT2, Variable: c.Total
PCs
X-variance Residual Calibration Variance
-1.0
-0.5
0
0.5
1.0
-1.0 -0.8 -0.6 -0.4 -0.2 0 0.2 0.4 0.6 0.8 RESULT4, X-expl: 40%,23%
CC
CC
C
C
CC CC
CCC
C
C
C
CC
C
C
C
C
C
C
CCC
C
CC
C
C
C
CC
C
CC
C
C
C
C
CC
C
C
CC
CC
C
C
CC
C
C
C
C
C
CC CC
C
C
C CC
CCSC
C
C
C
CC
CC
CC C
C
C
CC CC
CC
C
C
C
C
C
C
C
CCC
C
C
C
C
C
C
C
C
C
C
C CC
CC
C
C
C
CC
C
C
CC
C
C
C
C
CC
CC
CC
CC
C
C
C
C
C
C
C
C
C
C
CCC
C
C
C C
C
C
CCCC
C C
C
CC
C
C CCC
C
CC
C
CC
C
C
C
CC C
CC
CC
C
C
C
C
CC
C
C
C
C
CC
C
CCC C
CC
CC
CCC CC
CC
C
C CC C
C
CC
C
C
C CC
C C
C
CC
C
CC
C
C
CC
CC
C
CCC
C
C
C
C
C
CC
C
C
C C C
C
C
C
C CC
C
C
C C
CC
C
CC
CC
CC
C
C
C
M
M
M
MM
M
MM
M
M
M
M
M
MM
M
M
MM
MM
M
M M
MM
M
M
M
M
M
MM
M MM
M
M
M
MM
MM
MMM
M
M
M
M
MM M
M
M
MMM
M
MMM
MM
M
MM
MM
M
M
MMM
MM
MM
M
M
M
M
MMMM
M
M
M
M MM
M
M
M
M
M
M
MM
M
MMM
M
M
M
MM
M
M
M
M
M
M
M
MM
M
MMMM
MM
M
MM
M
M
MM
M
MM
MM
M
M MMMM
M
M
MM
MM
M
M
M
M
MM
M
M
M
M
M
MM
MM
M
M
M
M
M
MM
M M
M
MM MMMM
M
M
M
MM
M
M
MM
M
M
MMM
P
PP
PP
PP
P PP
P
P
P
P
P
P
P
P
P
P
P
P
P P
PPP
PP
PP
P
PP
P PP
PP
PP
P
PPP
PP
P
P
PP
PP PPP
P
PP
PP
P P
P
P
PP PPP P
P
PPP
P
P
P
P
S
S S
S
S
S
S
S
S
S
SS
SS
S
SS
SS
SS
SS
S S
S
S S
SS
SS
S
S
S
S
SS
S
SS
S
SS
SSS
S
S
S
S
S
S
S
S
SS
S
SS
S
S
S
SSS
SS
S
S
S
S
S
S
S
S
S
S
SS
S
S
SS
S
SSS
SS
SS
S
S
S SSS
SS
S
S
S
S
S
S
SSS
S S S
S
SS
S
SS
SS
S
S
S
S
S
S
S
S
S S
S
S S SSS
S
SS
S SS SS
SSS
S
S
S
S
S
S
S S
S
SS
S
S
SS
SSS
S
S
S
S
SSS S
SS
mg ant*/g berry
OD280/g berry
Brix
Titratable acid
pH
TartaricAcidMalicAcid
Potassium
PC1
PC2 Bi-plot
(a) (b)
(c) (d)
Scores X-loadings
Residual Calibration Variance Bi-plot
Exp
lain
ed X
-var
ianc
e
Principal component (PC)

98
quality and could point to differential scales required by the various grape cultivars Cabernet Sauvignon, Merlot and Shiraz and the variance between the Pinotage samples. Linear regressions were done to establish the extent of the relationships between chemical components of grapes (WineScan results) and the total anthocyanins and total phenolics concentrations respectively. Positive correlations were obtained between the sugar concentrations of grapes and the respective total anthocyanins (r = 0.36) and total phenolics (r = 0.30) concentrations. Slightly stronger correlations were established between the tartaric acid concentrations of grapes and the respective total anthocyanins (r = 0.43) and total phenolics (r = 0.40) concentrations. However, none of the before mentioned correlations were strong. Regression analysis revealed no correlations between the respective total anthocyanins and total phenolics concentrations and the pH values, malic acid and potassium concentrations of grapes.
Figure 3. PCA of grape homogenate samples (n=603) of the 2005 vintage. a) Score plot of PC1 (40% X-variance explained) and PC2 (23% X-variance explained). C:Cabernet Sauvignon (blue markers), M:Merlot (red markers), P:Pinotage (green markers), S:Shiraz (pink markers). b) Loadings plot of PC1 and PC2. c) Residual calibration variance plot showing that 12 PC’s described more than 95% of the X-variance. d) Scores and loadings from the PCA model showing relationships between samples and X-variables in the data set.
(a) (b)
(d)
-6
-4
-2
0
2
4
6
8
10
-10 -8 -6 -4 -2 0 2 4 6 8 Total grapemust…, X-expl: 31%,22%
CC
C
CC
C
CC
C
C
CC
C
C
C
C
CC
C
C
C
C C
C
C CC
CC
CC
CC
C
C
C
CC
C
C
C
C
C
C
C
C
C
CCC
C
C CC
C
C
C
C
C
CC CC
C
C
CC
C
CCC
CCC
C
CC
CCC C
C
C
C
CC
C
CCC
CC
C
C
C
C
CC
C
CC
C
C
C
CC
C
C
CC
CC
C
C
C
C
C
CCC
C
CC
C
C
C
C
C
CC
CC
C
CC
C C
C C
C
C
C CC
C
C CC
CC
CCC C
CCCC CCC
C
CCCC
C C
C
CC
CC
C
C
C
C
CC
C
CC
CC
C
CC
C
C
C
C
C
C
C
C C
C
C
CC C
C
CC
C
C
C
CC
C
CC
C
CCC C
C
CC
C
C C
C
C
CCCC
C
C
C
C CCC
C
CC
C
C
C CC
C
CC
C
C
CC
CC
C CC
C
CC
C
C
C
C
C
C CC
C
C
C
CC
C
CC
C
C
MM
M
MM
M
M
MMMM
MMM M
M
M
MM
MM
MM
M
M
M
MM
M
MM
MM
MM M
M
M
M
MM M
MMM
M
MM M
M
MM
MM
MMM
MM
M
MMM
M M
M
MM
MM
M
MM
MMM
MMM
M
M
MM
M
MM
MM
M
M MM
M
M
M
MM
M
MMM
MM
MM
M
MM M
M
MM
MM
M
M
MM
MM M
MM
M
M
MM M
M
M
MM
M
M
M
MM
M
M
MM
M
M
M
M
M
M
M
M
MMM
M MM
M
M
M
M
M M
M
M
M
M
M
M
MM M
M
M M
MM
M M
MM
M
M
M
M
M
M
M
M
M
M
M
MM
MM
P
PP
PPP
P
P
PP
P
P
P
P
P
P
P
P
P
P
P
P
P
P
P P
P
P
P
P
P P
P
P
P PP
P
P
PPP P
PP
PP
P
P
PP
PP
PPP
P
P
P P
P
PP P
P
P
PP
P
P
P
P
PPP
P
P
PPS
SS
SS
S
S
S
S
S S
SS
S
SS
SS
S
SSS S
SSS S
SS
SS
SS
S
S
S S
S
S
SSS
S
SSSS
S
S
S
SS
S
S
S
SS
SS
S
SS
S
S
S
SSSS
S
S S
S
SS
S
S
S
SS
SS
S
S
S S
S
SSS
SSSS
S
S
SS
SS S
S
S
SS
S
S
SS SS
SS S
SSS
S
SS
S
S
S
S
SS
SS
S
S
SS
S
S SS
SS
S
SS
SSSS
S
SSS
SS
S
SS
SSS
S
S
SS
S
S
S
SS
S
SS
SS
S
S
S
S
SS
SSS
SS
S
PC1
PC2 Scores
-0.3
-0.2
-0.1
0
0.1
0.2
0.3
0.4
-0.2 -0.1 0 0.1 0.2 0.3 0.4 RESULT1, X-expl: 31%,22%
mg ant*/g berry
OD280/g berry
Gluc-FructoseBrixDensity
TitratableAcid
pH
TartaricAcid
MalicAcid
VolatileAcid
FolinCindex
ColorIntensity
AmmoniaAlphaAminoN
Potassium
GluconicAcid
Ethanol
Glycerol
EthylAcetate
LacticAcid
MannitolMethyl3Butanol
Butanediol
ArabitolMesoinositol
IsoamyleAcetate
PC1
PC2 X-loadings
0
1.0
0.2
0.4
0.6
0.8
PC_00 PC_02 PC_04 PC_06 PC_08 PC_10 PC_12 PC_14 RESULT2, Variable: c.Total
PCs
X-variance Residual Calibration Variance(c) Residual Calibration Variance
Scores X-loadings
-1.0
-0.5
0
0.5
1.0
-1.0 -0.5 0 0.5 1.0 RESULT1, X-expl: 31%,22%
CC
C
CC
C
CC
C
C
CC
C
CC
C
CCC
C
C
C C
C
C CC
CC
CCC
C
C
CC
CC
C
C
C
C
C
C
C
CC
CCC
C
C CC
C
C
C
C
C
CC CC
C
C
C C
C
CCSCC
CCC
C CCCCC
CC
C
CC
C
CCCC
C
C
C
C
CC
C
C
CC
CC
CC
C C
CC
C CCC
C
C
C
C
CCC
C
C C
C
C
C
C
CC
CC
C
C
CC
C C
C C
CC
C CCC
C CC
CC
CCC C
CCCC CCC
CCC
CC
C C
C
CC
CC
C
C
C
CCC C
CC
CC
C
CCC
C
C
C
C
CC
C CC
CCC C
CC C
C
C
C
CCC
CC CC
CC CC
CC
C
C C
CC
C CCCC
C
CC CC
CCC
CC
C
C CC
C
CC
C
C
CC
CC
C CC
C
CC C
C
C
C
CC C
CC
C
C
CC
CCC
C
C
MMM
MM
M
MMM
MM
MMM M
M
M
MM
MM
MM
M
MM
MM
M
MM
MM
MM M
MM
M
MM M
MMM
MMM M
M
MM M
MMMM
M M
MMMM
M M
MM
MM
M
MMM
MMM
MMM M
M
MM
MM
M
MM
MM MM
M
MM
MM
MMM
MM
MMM
M
MM M
M
MM
MM
M
MM
MMMM
MMM
M
MM M
M
MM
M
M
M
M
M M
M
M
MM
M
M
M
M
M
M
MM
MMM
M MM
M
M
M
M
M M
M
M
M
M
M
M
MM MM
M M
M MM M
MM
MM
M
M
M
M
M
M
MM
M
MMMM
P
PP
P PP
P
PPP
P
P
P
P
P
P
P
P
P
P
P
PP
P
P P
P
P
P
P
P P
PP
P PP
PP
PPP P
PPPP
P
P
PPP
P
PPP
P
P
P P
P
PP P
PP
PP
PP
P
PP
PP
P
P
PPS
S S
SS
S
S
SS
S S
SS
S
SS
SS
S
SSS S
SS S S
S SS
S
SSS
S
S S
SS
SSS
S
SSSS
S
S
S
SS
S
S
S
S S
SSS
SS
S
SS
SSSS
SS S
SSS
S
S
S
SS
SS
S
SS S
S
SSS
SS SS S
S
SS
SS S S
SS S
S
S
SS SS
S S S
SSS
S
SSS
S
S
S
SS
SS
S
S
SS
SS S SSS
S
SS
SSS SS
SSS
SS
S
SS SSS
S
SS
SS
S
SS
S
S
S SSS
S
S
S
S
SS
SSSSS
S
mg ant*/g berry
OD280/g berry
Glucose-Fructos BrixDensity
Titratable acid
pH
TartaricAcid
MalicAcid
VolatileAcid
FolinCindex
ColorIntensity
AmmoniaAlphaAminoN
Potassium
GluconicA
Ethanol
Glycerol
EthylAcetate
LacticAcid
MannitolMethyl3Butanol
Butanediol
ArabitolMesoinositol
IsoamyleAcetate
PC1
PC2 Bi-plotBi-plot
Principal component (PC)
Exp
lain
ed X
-var
ianc
e

99
RESULT7, X-expl: 31%,22%,13%
Scores
-5
0
5
10
-10-5
05
10 -6
-4
-2
0
2
46
810
X
-Y
CC
CC
CC
CC
C
C
CCC C
C
C CC
C
CC C C
C
CCC
C
C
CC
CC CCC
CC
CCC
CCC
C CCCCCC
CCCC
C
CC
C
CC
CC
C
C
C CC
CCC C
CCCC CC
CCC C
CC CCCC
C
C
C
C
CCC
CCC
CC CC CC CC CCCC
CC
C
CC
C CCCC
C
C CCCCC
CC
CCCC C CC
CC
CC
C
CC
CCC
CC
C
C
CCC
C CCCCCCC CCCCCC C
C
C
C
CCC C
C
C
CCC
CCCC C
C
CCCC
CC
CC
CC
C CCC CCC CC
CC
CCC
CC CC CC CC
CC
CC C
CC
CC
CCC
CC
CC
C
CCCCC C
CCC
CC C
C
C
CCC
CC
CCC C
CCC
C
CC C C
C CC
C
C
C
C
CCCCM
MM
MM
M
M
M
MMM
M MM
MM
M
M
MMM M
M
M MM
MM MMMM
M
M
MMM MM M
M MMMM
MM
MM
M MM
M
MMMMM
M MMM
M
M M
MM M
MM
M
MM
MMM MMM
MMMM MMMMM
MM
MM MM M
MM M
MM
MM
MMMM MM MM M
MM MM M
MMMMM
M
MMMM
MM M
MMMM
M
MM MM M
MM
M
M
M
MM
MMMM M
MM
MMM
MMM
MM
MM M
MM
M
MMMM
MM MM
M MM
MMM
MMMM
M MM MM M
MMM
P
PP
P
P
P
P
P
PP
P
PPP
PP P
P
PP
P
PP
P
PP
P
P P
P
PP
P P P PP
PP
PPP
P PPP
PP
P
PP
P
P
PPPPP P P
PP P PP
P
PP
PP
P
PP
PP
PP
PPS
S SSS
SSSS
SS
SSS
SS S
S
SS SS S
SSS
S
SS
S
S
SS
S
SS
SS
S
SS SSSSSS
S
S
SS
S
S
S
S
S
SS
SSS
SS SS
SSS S
S
S SSS
S
S
S
S
SSSS
SSS SS
S
SS SSS
S S
S SS
SS
S
SS
S
S SS SS
SSS
SS S
SSS SS
SS
S
SSSS S SS SS
SS S SS
S
SSSSS
S
SSSS
SS SSSS SSSS
SSS
SS S
SSS
SS
S
S
S
S
S
S
SS
SSS SSS
Figure 4. PCA of grape homogenates (n = 603, of the 2005 vintage. Three-dimensional score plot of PC1 (31% X-variance explained), PC2 (33% X-variance explained) and PC3 (13% X-variance explained). C:Cabernet Sauvignon (blue markers), M:Merlot (red markers), P:Pinotage (green markers), S:Shiraz (pink markers). Positive loadings for X-variables on PC2 explain most of the variation in the Pinotage samples.
Figure 5. PCA of Pinotage homogenates (n = 64, vintage 2005. a) Score plot of PC 1 (37% X-variance explained) and PC2 (23% X-variance explained). b) Residual calibration variance plot showing that 12 PC’s described more than 95% of the X-variance. c) Loadings plot of PC1 and PC2. Variables highlighted in the square were butanediol, FolinC index, Tartaric acid.
Scores
-6
-4
-2
0
2
4
6
-8 -6 -4 -2 0 2 4 6 8 10 RESULT6, X-expl: 37%,23%
P
P
P
P
PP
PP
P
P PP P
P
P
P
P
PP
P
P
P
PP
PP
P
P
PP
P
PP
PP
P
P
P
P
P
P
P
P
P
P
P
P
P
P
P
PP
PPPP
P
P
PP P
P
P
P
PP
P
P
P
P
P
P
P
P
P
P
PC1
PC2 Scores
0
0.2
0.4
0.6
0.8
1.0
PC_00 PC_02 PC_04 PC_06 PC_08 PC_10 PC_12 PC_14 RESULT5, Variable: c.Total
PCs
X-variance Residual Calibration Variance
Exp
lain
ed X
-var
ianc
e
Principal component (PC)
X-loadings (c)
(b) Residual calibration variance Scores (a)
PC1PC2
PC3

100
5.3.3 GRAPE ANALYSIS RESULTS
Sample statistics for sugar, pH, TA, tartaric acid, malic acid, potassium, berry weight, total anthocyanins and total phenolics concentrations are summarized in Table 2. Samples were grouped according to grape maturity (sugar or ºBrix), grape cultivar, irrigation treatment and viticultural block grading. The results of post-hoc analysis (Bonferroni tests) of the result means, obtained from one-way ANOVA, are summarized using superscripts (Table 2). The high pH levels and potassium concentration as well as very low TA levels are expected due to the fact that the analyses were done on homogenised grapes. This would have released potassium from the grape skins which would cause the precipitation of potassium bitartrate and the subsequent increase in pH. Grape homogenisation might have influenced the results of grape chemical components, for example the mean titratable acidity values were lower and the mean pH values higher than expected. As a result of homogenisation potassium from grape skins were released and might have caused the precipitation of acids and caused the subsequent increased pH values of homogenates.
5.3.3.1 Distribution of grape chemical parameters in relation to sugar concentration
Data of all grape homogenates (n = 603) were divided into three sets using the sugar concentration (ºBrix) of each sample as variation criterion (Table 2). The separation according to the arbitrary chosen ºBrix intervals divided grape homogenates into three samples sets: low sugar (y<23.5ºBrix), medium sugar (23.5ºBrix≤y<26ºBrix) and high sugar (y≥26ºBrix) (Table 2). Most grape homogenates were categorized as low sugar (n = 240) or medium sugar (n = 241). The ANOVA results (Table 2) revealed that the parameters sugar, pH, potassium and tartaric acid among all three grape maturity levels differed significantly (p≤0.05). Grape homogenates from low sugar grapes had the lowest and samples from high sugar grapes the highest respective potassium and tartaric acid concentrations and pH values. Therefore, with increasing grape maturity potassium concentrations increase which leads to an increase in pH values. The TA and malic acid concentration of grape homogenates from low sugar grapes were significantly higher (p≤0.05) than that of both sample sets with higher sugar concentrations. The berry weights of low and medium sugar grapes were significantly higher (p≤0.05) than the berry weights of high sugar samples. The lower berry weights of high sugar berry samples could be due to prolonged exposure of the berries to sunlight, subsequent moisture loss and berry shrinking probably indicating over ripe grapes. Total anthocyanins and phenolics concentrations differed significantly between the three sets of sugar concentrations (p≤0.05) (Figures 4a and 4b). Concentrations of both total anthocyanins and total phenolics increased with increasing sugar concentrations or grape maturity level. Non-overlap of error-bars indicates statistical significance at level 0.05.
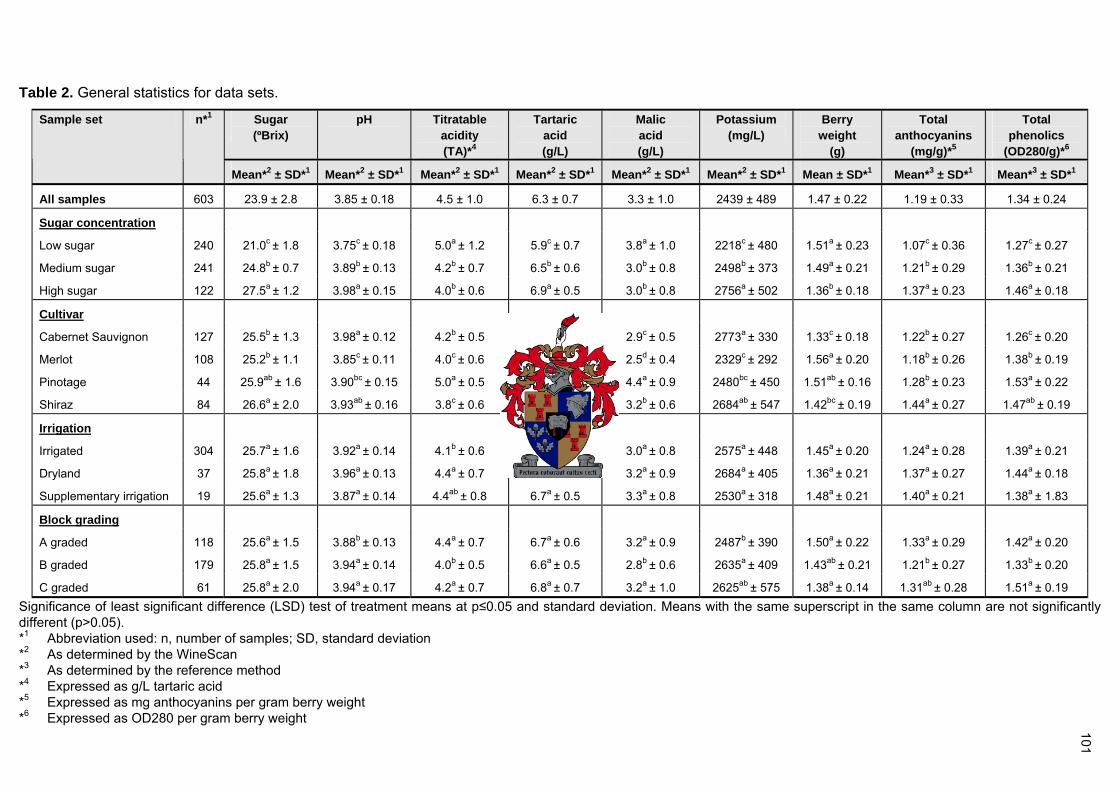
101
Table 2. General statistics for data sets.
Sugar (ºBrix)
pH
Titratable acidity (TA)*4
Tartaric acid (g/L)
Malic acid (g/L)
Potassium (mg/L)
Berry weight
(g)
Total anthocyanins
(mg/g)*5
Total phenolics
(OD280/g)*6
Sample set n*1
Mean*2 ± SD*1 Mean*2 ± SD*1 Mean*2 ± SD*1 Mean*2 ± SD*1 Mean*2 ± SD*1 Mean*2 ± SD*1 Mean ± SD*1 Mean*3 ± SD*1 Mean*3 ± SD*1
All samples 603 23.9 ± 2.8 3.85 ± 0.18 4.5 ± 1.0 6.3 ± 0.7 3.3 ± 1.0 2439 ± 489 1.47 ± 0.22 1.19 ± 0.33 1.34 ± 0.24
Sugar concentration
Low sugar 240 21.0c ± 1.8 3.75c ± 0.18 5.0a ± 1.2 5.9c ± 0.7 3.8a ± 1.0 2218c ± 480 1.51a ± 0.23 1.07c ± 0.36 1.27c ± 0.27
Medium sugar 241 24.8b ± 0.7 3.89b ± 0.13 4.2b ± 0.7 6.5b ± 0.6 3.0b ± 0.8 2498b ± 373 1.49a ± 0.21 1.21b ± 0.29 1.36b ± 0.21
High sugar 122 27.5a ± 1.2 3.98a ± 0.15 4.0b ± 0.6 6.9a ± 0.5 3.0b ± 0.8 2756a ± 502 1.36b ± 0.18 1.37a ± 0.23 1.46a ± 0.18
Cultivar
Cabernet Sauvignon 127 25.5b ± 1.3 3.98a ± 0.12 4.2b ± 0.5 6.7ab ± 0.4 2.9c ± 0.5 2773a ± 330 1.33c ± 0.18 1.22b ± 0.27 1.26c ± 0.20
Merlot 108 25.2b ± 1.1 3.85c ± 0.11 4.0c ± 0.6 6.6bc ± 0.6 2.5d ± 0.4 2329c ± 292 1.56a ± 0.20 1.18b ± 0.26 1.38b ± 0.19
Pinotage 44 25.9ab ± 1.6 3.90bc ± 0.15 5.0a ± 0.5 7.0a ± 0.6 4.4a ± 0.9 2480bc ± 450 1.51ab ± 0.16 1.28b ± 0.23 1.53a ± 0.22
Shiraz 84 26.6a ± 2.0 3.93ab ± 0.16 3.8c ± 0.6 6.4c ± 0.6 3.2b ± 0.6 2684ab ± 547 1.42bc ± 0.19 1.44a ± 0.27 1.47ab ± 0.19
Irrigation
Irrigated 304 25.7a ± 1.6 3.92a ± 0.14 4.1b ± 0.6 6.6a ± 0.6 3.0a ± 0.8 2575a ± 448 1.45a ± 0.20 1.24a ± 0.28 1.39a ± 0.21
Dryland 37 25.8a ± 1.8 3.96a ± 0.13 4.4a ± 0.7 6.7a ± 0.6 3.2a ± 0.9 2684a ± 405 1.36a ± 0.21 1.37a ± 0.27 1.44a ± 0.18
Supplementary irrigation 19 25.6a ± 1.3 3.87a ± 0.14 4.4ab ± 0.8 6.7a ± 0.5 3.3a ± 0.8 2530a ± 318 1.48a ± 0.21 1.40a ± 0.21 1.38a ± 1.83
Block grading
A graded 118 25.6a ± 1.5 3.88b ± 0.13 4.4a ± 0.7 6.7a ± 0.6 3.2a ± 0.9 2487b ± 390 1.50a ± 0.22 1.33a ± 0.29 1.42a ± 0.20
B graded 179 25.8a ± 1.5 3.94a ± 0.14 4.0b ± 0.5 6.6a ± 0.5 2.8b ± 0.6 2635a ± 409 1.43ab ± 0.21 1.21b ± 0.27 1.33b ± 0.20
C graded 61 25.8a ± 2.0 3.94a ± 0.17 4.2a ± 0.7 6.8a ± 0.7 3.2a ± 1.0 2625ab ± 575 1.38a ± 0.14 1.31ab ± 0.28 1.51a ± 0.19 Significance of least significant difference (LSD) test of treatment means at p≤0.05 and standard deviation. Means with the same superscript in the same column are not significantly different (p>0.05). *1 Abbreviation used: n, number of samples; SD, standard deviation *2 As determined by the WineScan *3 As determined by the reference method *4 Expressed as g/L tartaric acid *5 Expressed as mg anthocyanins per gram berry weight *6 Expressed as OD280 per gram berry weight

102
Low Medium HighSugar level
0.9
1.0
1.1
1.2
1.3
1.4
1.5
mg
anth
ocya
nins
per
g b
erry
Low Medium High
Sugar levels
0.9
1.0
1.1
1.2
1.3
1.4
1.5
OD
280
per g
ber
ry
(a) (b)
Figure 4. Significance of the relationship between the sugar concentration and (a) total anthocyanins, and (b) total phenolics concentrations.
5.3.3.2 Distribution of grape chemical parameters in Vitis vinifera cultivars
Data were compared of four sample sets consisting of homogenate samples of Vitis vinifera cultivars Cabernet Sauvignon (n = 127), Merlot (n = 108), Pinotage (n = 44) and Shiraz (n = 84) (Table 2). To compare grape samples at more or less the same physiological maturity level only samples with sugar concentrations y≥23.5ºBrix were included in the sample sets. Due to the fact that samples were collected in a commercial environment there was an uneven distribution of the number of samples per cultivar. Note that more data from more vintages are needed before final conclusions can be made regarding the total anthocyanins and total phenolics concentrations of the four Vitis vinifera cultivars investigated during this study. The sugar concentration of Shiraz was the highest and was significantly higher (p≤0.05) than that of Cabernet Sauvignon and Merlot. Merlot had the lowest sugar concentration (Table 2). No significant association between the sugar concentration of Pinotage and that of the other three cultivars could be established (p>0.05). However, it was slightly lower than the sugar concentration of Shiraz but higher than that of Cabernet Sauvignon and Merlot. The pH value of Merlot was the lowest and differed significantly (p≤0.05) from the pH values for Cabernet Sauvignon and Shiraz. The pH value of Cabernet Sauvignon was the highest and differed significantly (p≤0.05) from that of Merlot and Pinotage. Shiraz and Pinotage had intermediate pH values and did not differ significantly from each other (p>0.05). The TA, tartaric acid and malic acid concentrations of Pinotage was significantly higher than that of all the other cultivars (p≤0.05). The cultivar with the lowest TA, tartaric acid and malic acid content was Merlot. Cabernet Sauvignon had the highest potassium concentrations, followed by Shiraz and Pinotage. The potassium concentration of Merlot was significantly lower (p≤0.05) than the potassium concentrations of Cabernet Sauvignon and Shiraz. The berry weight of Merlot was the heaviest and was significantly higher

103
(p≤0.05) than that of Shiraz and Cabernet Sauvignon. Neither the berry weights of Merlot nor Shiraz was significantly different from that of Pinotage (p>0.05). Shiraz had a significantly higher total anthocyanin concentration (p≤0.05) than any other cultivar (Figure 5a). Pinotage had the highest total phenolics content and differed significantly (p≤0.05) from that of Merlot and Cabernet Sauvignon (Figure 5b). Cabernet Sauvignon had a significantly lower total phenolics concentration than that of any other cultivar (p≤0.05). The ANOVA results together with the PCA results discussed in section 5.3.2 indicate that the phenolic composition of Pinotage differs from the other cultivars investigated in this study. This was also found by Rossouw and Marais (2004).
Cabernet SauvignonMerlot
PinotageShiraz
Cultivar
1.0
1.1
1.2
1.3
1.4
1.5
1.6
1.7
mg
anth
ocya
nins
per
g b
erry
Cabernet SauvignonMerlot
PinotageShiraz
Cultivar
1.0
1.1
1.2
1.3
1.4
1.5
1.6
1.7
OD
280
per g
ber
ry
(a) (b)
Figure 5. Significance of the relationship between the Vitis vinifera cultivar, and (a) total anthocyanins concentrations, and (b) total phenolics concentrations.
5.3.3.3 The effects of time of maturity and harvest on grape chemical parameters
Botting et al. (1996) reported that the greater the delay in maturity (measured as time to reach a sugar concentration of 22.5-23.5ºBrix) the lower the concentration of berry anthocyanins. There are reports that the first grapes to reach maturity for a given variety within a particular climatic zone will produce the best wine (Coombe and Iland, 1987; Howell, 2001). In this study the effects of the time of maturity and harvest on total anthocyanins concentrations of grapes were investigated individually for each of the four Vitis vinifera cultivars (Table 3). Grape samples with a sugar concentration of y≥23.5ºBrix were divided into three groups: early, intermediate and late according to days elapsed from the first day of harvest. The number of harvest days for Merlot was the highest (n = 50) and for Pinotage the lowest (n = 35). One way ANOVA results for all the data sets regarding the sugar and total anthocyanins concentrations are summarized in Table 3. For both Cabernet Sauvignon and Merlot there were significant differences between the early, intermediate and late harvested groups (p≤0.05) (Figures 6a and 6b). There was also a significant difference between the early and late harvested groups for Shiraz (p≤0.05) (Figure 6d). However, for Pinotage there was no significant differences between the mean total anthocyanins concentrations of the early, intermediate and late harvested groups

104
(p>0.05) (Figure 6c). Normally Pinotage is the first red grape cultivar harvested in South Africa and the earlier harvest dates of Pinotage (data not shown) as well as the shorter harvest day period (n = 35) may be reasons why the mean total anthocyanins concentrations of Pinotage did not decrease over time. Overall the mean total anthocyanins concentrations for all four Vitis vinifera cultivars decreased as the harvest season progressed. In the case of Cabernet Sauvignon and Shiraz most of the grapes were harvested in the intermediate and late periods of the season. The possible effects of chemical compostion variation between early and late harvested grapes on wine quality should also be evaluated. The results indicate that viticultural practices should be further investigated to decrease the time of grapes to reach maturity.
Table 3. The effects of time of maturity and harvest on the total anthocyanins concentrations of Vitis vinifera cultivars.
Block grading n*1
Sugar (ºBrix)
Total anthocyanins
(mg/g)*4
Cultivar Harvest season period
Days from the
1st day of harvest
Total n*1
A B C Mean*2 ± SD*1 Mean*3 ± SD*1
Cabernet Sauvignon Early 1-16 16 3 11 2 24.4b ± 0.8 1.58a ± 0.19
Intermediate 17-32 49 13 28 8 25.7a ± 1.1 1.27b ± 0.21
Late 33-48 62 10 43 9 25.7a ± 1.5 1.08c ± 0.22
Merlot Early 1-16 29 12 14 3 25.1a ± 1.0 1.43a ± 0.22
Intermediate 17-32 54 20 29 5 25.0a ± 1.1 1.16b ± 0.18
Late 32-50 25 5 16 4 25.7a ± 1.2 0.93c ± 0.18
Pinotage Early 1-11 12 4 - 8 24.9b ± 1.2 1.35a ± 0.37
Intermediate 10-19 20 10 6 4 26.7a ± 1.3 1.31a ± 0.14
Late 20-35 12 10 - 2 25.3ab ± 1.5 1.17a ± 0.12
Shiraz Early 1-16 14 7 2 5 25.5b ± 2.2 1.64a ± 0.22
Intermediate 17-32 40 20 14 6 25.9b ± 1.5 1.44ab± 0.29
Late 32-49 30 4 16 10 27.9a ± 1.8 1.34b ± 0.22
Significance of least significant difference (LSD) test of treatment means at p≤0.05 and standard deviation. Means with the same superscript in the same column are not significantly different (p>0.05). *1 Abbreviation used: n, number of samples; SD, standard deviation *2 As determined by the WineScan *3 As determined by the reference method *4 Expressed as mg anthocyanins per gram berry weight

105
Subsequently the effects of the time of harvest on the total phenolics concentrations of grapes were investigated. Grape homogenate data were divided according to the same criteria as that used during the total anthocyanins investigation (Table 4). There were significant differences between the mean total phenolics concentrations of the early and late harvested groups for both Cabernet Sauvignon and Merlot (p≤0.05) (Figures 7a and 7b). However there were no significant differences between the early, intermediate or late harvested groups for both Pinotage and Shiraz (p>0.05) (Figures 7c and 7d). There was a decrease in the mean total phenolics concentrations of grapes as the harvest season progressed but it does not seem to be as marked as the decrease in the mean total anthocyanins concentrations. It seems as if delayed maturity has a more pronounced effect on decreasing anthocyanin than phenolic concentration of grapes.
Early Intermediate Late
Time of harvest
0.8
0.9
1.0
1.1
1.2
1.3
1.4
1.5
1.6
1.7
1.8
mg
anth
ocya
nins
per
g b
erry
Early Intermediate Late
Time of harvest
0.8
0.9
1.0
1.1
1.2
1.3
1.4
1.5
1.6
1.7
1.8
mg
anth
ocya
nins
per
g b
erry
Early Intermediate Late
Time of harvest
0.8
0.9
1.0
1.1
1.2
1.3
1.4
1.5
1.6
1.7
1.8
mg
anth
ocya
nins
per
g b
erry
Early Intermediate Late
Time of harvest
0.8
0.9
1.0
1.1
1.2
1.3
1.4
1.5
1.6
1.7
1.8
mg
anth
ocya
nins
per
g b
erry
(d)
(b)(a)
(c)
Figure 6. Significance of the relationship between time of maturity and harvest on total anthocyanins concentrations of four Vitis vinifera cultivars (a) Cabernet, (b) Merlot, (c) Pinotage, and (d) Shiraz.

106
Table 4. The effects of time of maturity and harvest on the total phenolics concentrations of Vitis vinifera cultivars.
Block grading n*1
Sugar (ºBrix)
Total phenolics
(OD280/g)*4
Cultivar Harvest Season period
Days from the 1st day of harvest
Total n*1
A B C Mean*2 ± SD*1 Mean*3 ± SD*1
Cabernet Sauvignon Early 1-16 15 3 10 2 24.2b ± 0.8 1.42a ± 0.20
Intermediate 17-32 39 10 23 10 25.7a ± 1.0 1.29ab ± 0.17
Late 33-48 54 12 38 4 26.0a ± 1.5 1.24b ± 0.17
Merlot Early 1-16 28 11 14 3 25.0b ± 1.0 1.54a ± 0.16
Intermediate 17-32 39 13 22 4 24.9b ± 0.9 1.34b ± 0.14
Late 32-50 22 3 16 3 25.8a ± 1.0 1.26b ± 0.15
Pinotage Early 1-11 13 4 - 9 25.0b ± 1.3 1.57a ± 0.29
Intermediate 10-19 20 11 6 3 26.7a ± 1.3 1.54a ± 0.17
Late 20-35 7 6 - 1 25.5ab ± 1.5 1.41a ± 0.20
Shiraz Early 1-16 13 6 2 5 25.7ab ± 2.3 1.55a ± 0.18
Intermediate 17-32 39 18 14 7 25.7b ± 1.5 1.46a ± 0.21
Late 32-49 31 5 15 11 27.4a ± 1.8 1.45a ± 0.15
Significance of least significant difference (LSD) test of treatment means at p≤0.05 and standard deviation. Means with the same superscript in the same column are not significantly different (p>0.05). *1 Abbreviation used: n, number of samples; SD, standard deviation *2 As determined by the WineScan *3 As determined by the reference method *4 Expressed as OD280 per gram berry weight

107
Early Intermediate Late
Time of harvest
1.0
1.1
1.2
1.3
1.4
1.5
1.6
1.7
1.8O
D28
0 pe
r g b
erry
Early Intermediate Late
Time of harvest
1.0
1.1
1.2
1.3
1.4
1.5
1.6
1.7
1.8
OD
280
per g
ber
ry
Early Intermediate Late
Time of harvest
1.0
1.1
1.2
1.3
1.4
1.5
1.6
1.7
Early Intermediate Late
Time of harvest
1.0
1.1
1.2
1.3
1.4
1.5
1.6
1.7
1.8
OD
280
per g
ber
ry
1.8
OD
280
per g
ber
ry(a) (b)
(d)(c)
Figure 7. Significance of the relationship between time of maturity and harvest on total phenolics concentrations of four Vitis vinifera cultivars. (a) Cabernet, (b) Merlot, (c) Pinotage, and (d) Shiraz.
5.3.3.4 The effects of irrigation on the total anthocyanins and total phenolics concentrations of grapes
The division of sample sets according to irrigation was broadly based on grape homogenates originating from blocks irrigated on a regular basis (irrigated), blocks irrigated only when grapevines are showing signs of water stress (supplementary irrigation) and blocks with no irrigation system which obtain water via rain showers (dryland) (Table 2). Samples with sugar concentrations of y<23.5ºBrix were excluded from sample sets. This was done to eliminate the effects of grapes with low sugar concentrations on statistical analyses. In the Western Cape region of South Africa the climate is characterized by relatively warm, dry summers and annual winter rainfall. In recent years average summer day temperatures have increased. This might have been the reason why the most sampled blocks were irrigated (n = 304) or received supplementary irrigation (n = 19). Within the two sample sets of irrigated blocks irrigation systems, irrigation schedules as well as the amount of water supplied to different blocks differed but were not taken into account for this study. Only 10% of homogenate samples (n = 37) came from non-irrigated or dryland blocks.

108
No significant differences (p>0.05) between the sugar concentrations and pH values of samples for different irrigation treatments were established. The TA of dryland samples was significantly higher (p≤0.05) than that of irrigated samples. There was no significant differences (p>0.05) between the TA of supplementary irrigated and irrigated samples. There was also no significant association (p>0.05) between the TA of supplementary irrigated and dryland samples. The tartaric acid and malic acid concentrations did not differ significantly (p>0.05) between the three irrigation treatments but the mean values for irrigated samples were the lowest. Even though it was not statistically significant (p>0.05), the mean potassium concentration of dryland samples was higher than the means for the other two treatments. There was statistically no significant differences (p>0.05) between the average berry weight, anthocyanin concentration (Figure 8a) or total phenolics (Figure 8b) concentration of the three sets. Berry weights of dryland samples were lower than the berry weights of the two irrigated sets. Berries from supplementary irrigated blocks had the highest anthocyanin content but the lowest total phenolics. The mean total anthocyanin concentration of dryland samples was close to that of supplementary irrigated blocks. Dryland samples had the highest total phenolics concentration. Due to the uneven sample number distribution definite conclusions can not be made. However, samples receiving less water (dryland or supplementary irrigation) have slightly higher total anthocyanin and total phenolics concentrations which should result in wines of higher quality.
Irrigated Dryland Supplementary irrigation
Irrigation
1.1
1.2
1.3
1.4
1.5
1.6
mg
anth
ocya
nins
per
g b
erry
Irrigated Dryland Supplementary irrigation
Irrigation
1.1
1.2
1.3
1.4
1.5
1.6
OD
280
per g
ber
ry
(a) (b)
Figure 8. Significance of the relationship between irrigation treatment and (a) total anthocyanins concentrations, and (b) total phenolics concentrations.
5.3.3.5 Evaluation of the relationships between total anthocyanins, total phenolics and current viticultural block grading
Grape homogenates with sugar concentrations of y≥23.5ºBrix were divided into 3 sets according to the viticultural quality grading (Table 2). Most samples were graded as A (n = 118) or B (n = 179) with only 17% of samples graded as C (n = 61). There were no significant differences (p>0.05) between the sugar concentrations of the three sets. The mean sugar concentration of A graded samples was lower than that of the other two sets.

109
The mean pH value of A graded samples was significantly (p≤0.05) lower than that of B and C graded samples. The TA concentration for block grading B was significantly lower (p>0.05) than that of the A and C graded sample sets. There were no significant differences (p>0.05) between the tartaric acid concentrations of the three sets. The mean tartaric acid concentrations of C and B graded blocks was the highest and lowest respectively. The malic acid content of B graded samples was significantly lower (p≤0.05) than that of the other two sets. The potassium concentration of B graded samples was significantly higher (p≤0.05) than that of A graded samples. The potassium content of C graded samples did not differ significantly (p>0.05) from that of the A or B graded samples. However, the mean potassium concentration of C graded samples was closer to the mean concentration of B graded samples. The berry weight of A graded samples was significantly higher (p≤0.05) than that of C graded samples. B graded samples did not differ significantly (p>0.05) from neither A nor C graded samples regarding berry weight. The anthocyanin content of A graded samples was significantly higher (p≤0.05) than that of B graded samples (Figure 9a). C graded samples anthocyanin concentration did not differ significantly (p>0.05) from that of A or B graded samples. The total phenolics concentration of B graded samples was significantly lower (p≤0.05) than that of A and C graded samples (Figure 9b). C graded samples had the highest mean total phenolics concentration. The total anthocyanins and total phenolics concentrations of grapes clearly did not correspond with the current viticultural block grading and the inclusion of these parameters could result in more accurate viticultural block grading.
A B C
Block grading
1.1
1.2
1.3
1.4
1.5
1.6
mg
anth
ocya
nins
per
g b
erry
A B C
Block grading
1.1
1.2
1.3
1.4
1.5
1.6
OD
280
per g
ber
ry
(b)(a)
Figure 9. Significance of the relationship between the block grading and (a) total anthocyanins concentrations, and (b) total phenolics concentrations.
5.3.3.6 A comparison of grape chemical parameters of areas within the Stellenbosch region
The Stellenbosch district is an area well known for producing grapes and wines of high quality. Grape homogenates with sugar concentrations of y≥23.5ºBrix from wards within the Stellenbosch district were divided into sample sets (Table 5). There were no significant

110
differences between the sugar concentrations, pH values, tartaric acid, malic acid, potassium content and berry weights of samples from different wards (p>0.05). The TA of the Jonkershoek ward was significantly higher (p≤0.05) than that of the Helderberg ward. However, there were no significant differences (p>0.05) between the TA values of these two wards individually and those from the other wards. The anthocyanin concentration of Vlottenburg differed significantly from all wards (p≤0.05) except Jonkershoek (p>0.05) and Simonsberg (p>0.05). The anthocyanin content of samples originating from Stellenbosch Kloof differed significantly from that of Jonkershoek (p≤0.05) and Vlottenburg (p≤0.05) but not from the other wards (p>0.05). There were no significant differences (p>0.05) between the anthocyanin concentrations of Bottelary, Devon valley, Firgrove, Helderberg, Koelenhof, and Simonsberg. There were no significant differences (p>0.05) between the total phenolics content of Firgrove, Helderberg, Jonkershoek, Koelenhof, Simonsberg, and Stellenbosch Kloof. There were significant differences between the total phenolics concentrations of Bottelary and Devon valley from that of Vlottenburg (p≤0.05), but no significant differences between the total phenolics content of these two wards and the rest of the wards (p>0.05). The total phenolics content of Vlottenburg did not differ significantly from any of the wards (p>0.05) except from Bottelary (p≤0.05) and Devon valley (p≤0.05) as mentioned before. These results confirm that even within a geographic region such as Stellenbosch diverse terroir units can be distinguished that produce grapes with different chemical compositions.

111
Table 5. A comparison of the grape chemical parameters of areas within the Stellenbosch region.
Sugar (ºBrix)
pH Titratable acidity (TA)*4
Tartaric acid (g/l)
Malic acid (g/l)
Potassium (mg/l)
Berry weight
(g)
Total anthocyanins
(mg/g)*5
Total phenolics
(OD280/g)*6
Sample set n*1
Mean*2 ± SD*1 Mean*2 ± SD*1 Mean*2 ± SD*1 Mean*2 ± SD*1 Mean*2 ± SD*1 Mean*2 ± SD*1 Mean*2 ± SD*1 Mean*3 ± SD*1 Mean*3 ± SD*1
Bottelary 24 26.3a ± 1.6 3.88a ± 0.09 4.3ab ± 0.5 6.7a ± 0.5 3.3a ± 0.7 2458a ± 309 1.54a ± 0.12 1.24ab ± 0.19 1.44a ± 0.20
Devon Valley 70 26.0a ± 1.8 3.92a ± 0.15 4.1ab ± 0.5 6.6a ± 0.6 2.9a ± 0.7 2592a ± 449 1.45a ± 0.19 1.28ab ± 0.26 1.41a ± 0.18
Firgrove 8 25.8a ± 1.4 3.92a ± 0.09 3.9ab ± 0.3 6.8a ± 0.5 2.7a ± 0.7 2663a ± 276 1.45a ± 0.13 1.28ab ± 0.15 1.43ab ± 0.10
Helderberg 37 25.9a ± 1.3 3.97a ± 0.12 3.8b ±. 04 6.6a ± 0.5 2.8a ± 0.6 2687a ± 361 1.45a ± 0.18 1.25ab ± 0.18 1.32ab ± 0.16
Jonkershoek 13 25.1a ± 1.0 3.92a ± 0.19 4.5a ± 0.6 6.7a ± 0.4 3.2a ± 0.6 2630a ± 486 1.35a ± 0.19 1.07bc ± 0.24 1.27ab ± 0.18
Koelenhof 11 24.8a ± 1.1 3.96a ± 0.11 4.4ab ± 0.9 6.6a ± 0.7 3.7a ± 1.4 2685a ± 363 1.48a ± 0.24 1.23ab ± 0.32 1.42ab ± 0.24
Simonsberg 8 25.7a ± 1.7 3.94a ± 0.13 3.7ab ± 0.5 6.5a ± 0.3 2.8a ± 0.3 2705a ± 324 1.36a ± 0.36 1.09abd ± 0.18 1.35ab ± 0.13
Stellenbosch Kloof 36 25.7a ± 1.4 3.86a ± 0.14 4.2ab ± 0.7 6.6a ± 0.5 3.0a ± 0.8 2511a ± 385 1.50a ± 1.75 1.38a ± 0.26 1.37ab ± 0.23
Vlottenburg 9 25.4a ± 1.1 3.91a ± 0.06 3.7ab ± 0.3 6.0a ± 0.6 2.5a ± 0.4 2274a ± 288 1.64a ± 0.26 0.79cd ± 0.17 1.14b ± 0.12 Significance of least significant difference (LSD) test of treatment means at p≤0.05 and standard deviation. Means with the same superscript in the same column are not significantly different (p>0.05). *1 Abbreviation used: n, number of samples; SD, standard deviation *2 As determined by the WineScan *3 As determined by the reference method *4 Expressed as g/L tartaric acid *5 Expressed as mg anthocyanins per gram berry weight *6 Expressed as OD280 per gram berry weight

112
5.4 CONCLUSIONS
This study was a preliminary investigation of the implementation of total anthocyanins and total phenolics analyses at a commercial winery in South Africa. The investigation involved statistical analysis of the total anthocyanins and total phenolics concentrations present in a large number of grape homogenates from the 2005 vintage and from different areas within the Western Cape region of South Africa. All conclusions are preliminary due to the fact that the investigation only involved the information of one vintage. Several more seasons’ information will be needed before definite conclusions can be made. Principal component analysis results highlighted the importance of measuring many chemical components for the purpose of capturing enough information to discriminate between samples. The analyses results confirmed that both the total anthocyanins and total phenolics concentrations of grapes increased with increasing sugar concentration (ºBrix). There were significant differences between the total anthocyanins and total phenolics concentrations of the four Vitis vinifera cultivars investigated. More investigations are needed to establish the concentration ranges of the parameters for grapes produced in South Africa. For all Vitis vinifera cultivars investigated grapes harvested earlier in the season had significantly higher total anthocyanins and total phenolics concentrations than grapes harvested later in the season. These results imply that earlier harvested grapes will produce wines with deeper colour intensities and more tannins than wines from grapes harvested later in the harvest season. Ignoring irrigation volumes and schedules it does seem as if regularly irrigated vineyards have lower total anthocyanins and total phenolics concentrations than dryland vineyards. The total anthocyanins and total phenolics concentrations of grapes did not correlate with the viticultural block grading. These results highlight the need to include more objective measures of grape quality as part of grape quality control to ensure that grapes are “correctly” classified. Future aims include the analyses of more grape samples from various areas of South Africa. These results will be incorporated in the established data base to ensure the successful implementation of the two parameters total anthocyanins and total phenolics as part of routine grape quality control at South African wineries.
ABBREVIATIONS USED
PCA, principal component analysis; total soluble solids (TSS); TA, titratable acidity; SD, standard deviation; r, correlation; AVOVA, analysis of variance; PC, principal component; LSD, least significant difference; n, number of samples; SD, standard deviation; r, correlation coefficient.

113
5.5 LITERATURE CITED
Botting, D.G., Dry, P.R. and Iland, P.G. (1996). Canopy architecture – implications for Shiraz grown in a hot, arid climate. Aust. Grapegrower Winemaker. 414, 53-57.
Camo Process AS, Oslo, Norway. http://www.camo.noCoombe, B.G. and Iland, P.G. (eds.). 1987. Grape berry development. Ed. Lee, T.H. In Proceedings of the
sixth Australian wine industry technical conference; 14-17 July 1986; Adelaide, South Australia. pp. 105-108.
Dambergs, R.G., Cozzolino, D., Esler, M.B., Cynkar, W.U., Kambouris, A., Francis, I.L., Høj, P.B. and Gishen, M. (2003). The use of near infrared spectroscopy for grape quality measurement. Aust. & New Zea. Grapegrower Winemaker Ann. Tech. Issue. pp. 69-76.
Esbensen, K.H. (ed.). 2002. Multivariate Data Analysis – In Practise. 5th Ed. Camo Process AS, Oslo, Norway. pp. 35, 137.
Foss Analytical, Denmark. http://www.foss.dk Francis, I.L., Iland, P.G., Cynkar, W.U., Kwiatkowski, M., Williams, P.J., Armstrong, H., Botting, D.G., Gawel,
R. and Ryan, C. (eds.). 1999. Assessing wine quality with the G-G assay. Eds. Blair, R.J., Sas, A.N., Hayes, P.F. and Høj, P.B. In Proceedings of the tenth Australian wine industry technical conference; 2-5 August 1998; Adelaide, South Australia. pp. 104-108.
Herderich, M.J., Bell, S.-J., Holt, H., Ristic, R., Birchmore, W., Thompson, K. and Iland, P.G. (eds.). 2004. Grape maturity and tannins: the impact of viticultural treatments on grape and wine tannins. Eds. Blair, R., Williams, P. and Pretorius, S. In Proceedings of the twelfth Australian wine industry technical conference; 19-24 July 2004; Melbourne, Victoria. pp. 79-84.
Herderich, M.J. and Smith, P.A. (2005). Analysis of grape and wine tannins: methods, applications and challenges. Aust. J. Grape Wine Res. 11, 205-214.
Howell, G.S. (2001). Sustainable grape productivity and the growth-yield relationship: a review. Am. J. Enol. Vitic. 52, 165-174.
Iland, P.G. (1987). Predicting red wine colour from grape analysis. Aust. Grapegrower Winamaker. 285, 29. Iland, P., Ewart, A., Sitters, J., Markides, A., Bruer, N. (eds). 2000. 1st Ed. Techniques for chemical analysis
and quality monitoring during winemaking. Patrick Iland Wine Promotions, Campbelltown, Australia, pp. 78-79.
Jackson, M.G., Timberlake, C.F., Bridle, P. and Vallis, L. (1978). Red wine quality: Correlations between colour, aroma, and flavour and pigment and other parameters of young Beaujolais. J. Sci. Food Agric. 29, 715-727.
Marais, J., Iland, P. and Swart, E. (2001). Exploring the relationships between Pinotage grape colour and wine quality – Prelimimary results. Wineland (February 2001), 76-78.
Marais, J. and October, F. (2005). Relationships between grape colour and wine quality. Wineland (July 2005), 85-87.
Naes, T., Isaksson, T., Fearn, T. and Davies, T. (eds). 2002. A user-friendly guide to multivariate calibration and classification. NIR Publications, Chichester, UK. pp. 420.
Rossouw, M. and Marais, J. (2004). The phenolic composition of South African Pinotage, Shiraz and Cabernet Sauvignon wines. S. Afr. J. Enol. Vitic. 25, 94-104.
Snedecor, G.W. and Cochran, W.G. (eds). 1980. Statistical methods. 7th Ed. The Iowa State University Press, USA.
Somers, T.C. and Evans, M.E. (1974). Wine quality: correlations with colour density and anthocyanin equilibria in a group of young red wines. J. Sci. Food. Agric. 25, 1369-1379.

CHAPTER 6
GENERAL DISCUSSION AND CONCLUSIONS

115
GENERAL DISCUSSION AND CONCLUSIONS
6.1 CONCLUDING REMARKS AND PERSPECTIVES
Modern-day winemaking is a profit driven business. Wineries invest large sums of money, by employing well trained personnel, the use of sophisticated technology and costly marketing campaigns to ensure maximum wine sales and subsequent economic viability. Presumably consumers are willing to pay more money for a wine of better and consistent quality. Wine quality fundamentally refers to the pleasure a wine provides to the consumer. In this context objective analytical measures that correlate strongly with wine quality are of utmost importance. Apart from wine aroma and taste, wine colour is an important indication of red wine quality. Deeper coloured red wines are perceived to be of higher quality than lighter coloured red wines. It has been established that the anthocyanin concentration of grapes is strongly correlated to wine colour intensity (Somers and Evans, 1974; Iland, 1987) and therefore to wine quality. Anthocyanins are classified as phenolic compounds. Phenolic compounds cause sensory sensations such as colour, flavour, astringency, bitterness and hardness of wines (Somers, 1971; Noble, 1994; Gawel, 1998). Therefore the inclusion of total anthocyanins and total phenolics analyses as part of red grape quality control will provide important information regarding critical sensory aspects related to red wine quality. The aims of this study were firstly to develop an analytical method that is fast and accurate for the quantification of total anthocyanins and total phenolics of grapes and, secondly to use the generated reference analysis method data to do an evaluation of the possibility to implement total anthocyanins and total phenolics analyses as part of the grape quality control protocol at a commercial winery in South Africa. Existing analyses for total anthocyanins and total phenolics concentrations in grapes are complex and time consuming. A major challenge for researchers today is to find simple and practical solutions for complex problems. Infrared spectroscopy is an attractive analytical tool because of its speed, reliability and simplicity of performance. Another important benefit of infrared spectroscopy is the reduction of chemical waste. The measurement of total anthocyanins concentrations in grapes using near infrared spectroscopy (NIR) has already been evaluated successfully (Dambergs et al., 2003). In South Africa the use of the Foss WineScan FT120 spectrometer (Foss Analytical, Denmark) is well established. Due to the availability of instrumentation the application of Fourier transform infrared spectroscopy (FT-IR) as an analytical tool for the quantification of total anthocyanins and total phenolics present in grapes was evaluated in this study since the commercial calibration models provided with the WineScan instrument have unsatisfactory prediction accuracy. New calibration models were developed and satisfactory results were obtained for both the prediction of total anthocyanins and total

116
phenolics concentrations of grapes. The South African wine industry strives to obtain calibration models with prediction accuracies of 0.10 mg/g for total anthocyanins and 0.10 OD280/g for total phenolics concentrations of grapes respectively. Prediction results for the total phenolics concentrations of grapes were slightly less accurate than that obtained for total anthocyanins concentrations of grapes. This could suggest that absorbance at 280 nm is not specific enough for the quantification of total phenolics of grapes. The calibration results obtained in this study show that FT-IR can be used as an analytical tool for screening grapes for total anthocyanins and total phenolics concentrations. Further research and development of FT-IR calibration models will be aimed at lowering prediction errors by including more samples from a broad range of grape maturities and from several more vintages. To use the obtained FT-IR calibration models during grape quality control, the calibration model accuracy and robustness must be improved. Although the reference method accuracy was satisfactory, efforts must still be made to work even more accurately to ensure optimal FT-IR results. There is some concern about the large number of samples that had to be removed from sample sets based on poor repeatability of the reference method. The use of principal component analysis (PCA), a multivariate statistical analysis tool, captured important FT-IR spectral information of grape homogenates. Clear differences between grape homogenates related to vintage and grape maturity were revealed during PCA investigations. A PCA investigation revealed that the water content of the samples was a major source of variation between the grape homogenates of the 2004 and 2005 vintages. It was also established that Pinotage has a spectral profile quite different opposed to Cabernet Sauvignon, Merlot and Shiraz. These findings highlighted the importance of detailed exploratory investigations of FT-IR spectra before eliminating wavenumbers “supposedly” only contributing to noise. Results also emphasize the need for the establishment of a FT-IR spectral library in conjunction with the chemical analyses results database. All future grape homogenates scanned will be included in the established FT-IR spectral database to evaluate spectral trends over several seasons. In the process to develop the calibration models a database was established containing both spectral data and analytical results regarding the total anthocyanins and total phenolics concentrations of grapes delivered to Distell (Distell Group (Pty) Ltd). The generation of the reference data enabled a preliminary evaluation of the possibilities to implement total anthocyanins and phenolics values as additional grape quality control parameters. There were significant differences between the total anthocyanins and total phenolics concentrations of the four Vitis vinifera grape cultivars investigated in this study. Results showed that earlier harvested grapes had higher total anthocyanins and total phenolics concentrations than grapes harvested later in the season. The current grape grading system at Distell did not reflect the total anthocyanins and total phenolics concentrations of grapes emphasizing the need to include more objective measures during grape grading.

117
More data from several seasons must be included in the database to establish the concentration ranges of total anthocyanins and total phenolics concentrations of Vitis vinifera red cultivars produced in South Africa. It is important to obtain grape analyses results for each vineyard including grapes from all stages of maturity to build up a comprehensive vineyard history database. The inclusion of larger numbers of samples, from all areas of grape production, will provide important statistics to identify production areas with higher average total anthocyanins and total phenolics concentrations of grapes. These results will add great value to terroir studies. A comprehensive database will also provide valuable information to assist during decisionmaking regarding the optimum harvest dates of vineyards and could equip producers, viticulturists and winemakers with concrete analyses values for phenomena previously unaccounted for in South African vineyards. In conclusion, further development of the calibration models developed during this study will enable the application of FT-IR analyses for the prediction of total anthocyanins and total phenolics during routine grape quality control which will be beneficial to the South African wine industry.
6.2 LITERATURE CITED
Dambergs, R.G., Cozzolino, D., Esler, M.B., Cynkar, W.U., Kambouris, A., Francis, I.L., Høj, P.B. and Gishen, M. (2003). The use of near infrared spectroscopy for grape quality measurement. Aust. & New Zea. Grapegrower Winemaker Ann. Tech. Issue. pp. 69-76.
Foss Analytical, Denmark. http://www.foss.dkGawel, R. (1998). Red wine astringency: a review. Aust. J. Grape Wine Res. 4, 74-95. Iland, P.G. (1987). Predicting red wine colour from grape analysis. Aust. Grapegrower Winamaker. 285, 29. Noble, A.C. (1994). Bitterness in wine. Physiol. Behav. 56, 1251-1255. Somers, T.C. (1971). The polymeric nature of wine pigments. Phytochemistry. 10, 2175-2186. Somers, T.C. and Evans, M.E. (1974). Wine quality: correlations with colour density and anthocyanin
equilibria in a group of young red wines. J. Sci. Food. Agric. 25, 1369-1379.

APPENDIX 1
CHEMICAL COMPONENT DATA

119
Table 1. Chemical component range of 2005 vintage samples (n = 603). Conditions of analysis are described in Chapter 5, sections 5.2.2 and 5.2.3.
Cabernet Sauvignon n*1 = 239
Merlot n*1 = 155
Pinotage n*1 = 64
Shiraz n*1 = 145
Chemical component
Mean*2 ± SD Mean*2 ± SD Mean*2 ± SD Mean*2 ± SD
Total anthocyanins (mg/g berry) 1.1 ± 0.3 1.2 ± 0.3 1.2 ± 0.3 1.3 ± 0.3
Total phenolics (OD280/g berry) 1.2 ± 0.3 1.3 ± 0.3 1.4 ± 0.5 1.4 ± 0.3
Sugar (ºBrix) 23.5 ± 2.6 24 ± 2.2 24.5 ± 2.5 24.1 ± 3.6
Titratable Acidity (g/L) 4.5 ± 1 4.2 ± 0.8 5.1 ± 0.6 4.3 ± 1.2
pH 3.9 ± 0.2 3.8 ± 0.1 3.9 ± 0.2 3.8 ± 0.2
Tartaric Acid (mg/L) 6.3 ± 0.7 6.5 ± 0.6 6.8 ± 0.7 6.1 ± 0.8
Malic Acid (mg/L) 3.3 ± 0.8 2.7 ± 0.6 4.6 ± 0.9 3.4 ± 0.9
Potassium (mg/L) 2594.7 ± 451.8 2245.7 ± 331.8 2475.7 ± 463.7 2371.7 ± 602.5
*1Abbreviations used: n, number of samples; SD, standard deviation
*2As determined by the reference method or by the WineScan

LYSOZYMEThe solution for Bacterial
problems in Red Wine
Marius Lambrechts
Distell

CONTENTS• Occurrence of LAB from grapes to wine.
• Why do we have pH problems?
• pH and SO2
• How does pH influence LAB?
• Metabolism of LAB
• Lyzozyme
• Application of lysozyme
• Other options

• Why do we have bacteriological problems?
• Occurrence on grapes
alcoholic fermentation
spontaneous, inoculated MLF
ageing

GRAPES
• Grapes - 102 105 cells/ml
- seasonal variation
- cold soaking

Must composition of samples during the 1999 harvest season
Year & AreaYear & Area CultivarCultivarSugar conc. (°B)
Sugar conc. (°B)
T.A.(g L-1)T.A.
(g L-1) pHpH
Stellenbosch (SI)
Stellenbosch (SII)
Stellenbosch (SIII)
Stellenbosch (IV)
Paarl (PI)
Paarl (PII)
Franschoek (FI)
Durbanville (DI)
SO2 dosage(mg kg-1)
SO2 dosage(mg kg-1)
Pinotage
Merlot
Merlot
Pinotage
Cabernet franc
Pinotage
Merlot
Merlot
24.3
24.6
25.2
24
24
23
25.2
23.4
5.7
6.8
5.35
6.5
4.0
5.7
5.8
6.2
3.5
3.41
3.75
3.4
3.75
3.5
3.71
3.4
50
50
40
30
30
30
40
50

0.00
1.00
2.00
3.00
4.00
5.00
Log
of n
umbe
r of
colo
nies
/ml m
ust
SIV FI PI
Cellar
22 - 25 ºB
12 -15 ºB
2 - 5 ºB

0.00
1.00
2.00
3.00
4.00
5.00
Log
of n
umbe
r of
colo
nies
/ml m
ust
SI PII SII DI
Cellar
22 - 25 ºB
15 ºB
2 - 5 ºB

MALOLACTIC FERMENTATION
• Spontaneous
- 102 - 105 cells/ml 106 - 108 cells/ml
• Inoculated
- 106 - 108 cells/ml
Ageing
• SO2 and pH
• Low pH - short survival time of LAB
• High pH - long survival, even years

WHY DO WE HAVE HIGH pH?• What is pH?
- measurement of free proton (H+)
• Role of potassium in pH
- protons get replaced by potassium
- potassiumbitrate
• Why do we have high potassium concentration?- high potassium concentration in our soil
- incorrect viticultural practices
- harvest at higher sugar levels

Effect of pH on LAB
- Oenococcus < pH 3.5
- Lactobacillus > pH 3.5
- Pediococci >> pH 3.5
• pH and SO2 relationship

The percentage of sulfur dioxide forms in solution at various pH values. Solution conditions are 14% v/v
ethanol and 80 mM ion strength
pHpH Molecular SO2Molecular SO2 Bisulfite ionBisulfite ion Sulfite ionSulfite ionFree SO2 for0.825 mg/Lmolecular
Free SO2 for0.825 mg/Lmolecular
2.72.82.93.03.13.23.33.43.53.63.73.83.94.0
10.58.546.905.564.473.582.872.291.831.461.160.9240.7360.535
89.591.593.194.495.596.497.197.798.298.598.899.099.299.4
0.002830.003640.004670.005960.007590.009640.01220.01550.01960.02480.03120.03940.04970.0627
7.859.6612.014.818.523.128.836.045.156.671.189.3112.0141.0

WHAT IS IMPORTANT TO REMEMBER ABOUT LAB?
• Several genera– Oenococci oeni, Lactobacillus, Pediococcus,
Leuconostoc mesenteriodes
• Spontaneous versus inoculated• pH
– 3.5 growth speed– 3.4 sugar → acetic acid– ease of MLF
• Need low substrate• Off-flavours• Biogenic amines
O. oeni Lactobacillus,Pediococcus
3.5

AC
ID F
OR
MA
TIO
NG lu c o se
G lu c o s e -6 -p h o s p h a te
F ru c to se -6 -p h o sp h a te
F ru c to se 1 ,6 -b ip h o sp h a te
G ly c e ra ld e h y d e -3 -p h o sp h a te
D ih y d ro x y a c e to n e -p h o sp h a te
A T P
A D P
2 N A D +
2 N A D H + H +
A ld o la s e
2 1 ,3 -D ip h o s p h o g ly c e r ic a c id2 A D P
2 A T P
2 3 -P h o sp h o g ly c e r ic a c id
2 P h o sp h o e n o lp y ru v ic a c id
2 P y ru v ic a c id
2 L a c t ic a c id
2 A D P
2 A T P
2 N A D H + H +
2 N A D +
-H 2 O
2 P i
G lu c o se
G lu c o s e -6 -p h o sp h a te
6 -P h o sp h o -g lu c o n a te
P e n to se -5 -p h o sp h a te + C O 2
G ly c e ra ld e h y d e -3 -p h o sp h a te
A T P
A D P
N A D +
N A D H + H +
P h o sp h o k e to la s e
A D P
A T P
L a c tic a c id
A D P
A T P
N A D H + H +
N A D +
-H 2 O
P i
N A D +
N A D H + H +
N A D +
N A D H + H +
1 ,3 -D ip h o s p h o g ly c e r ic a c id
3 -P h o sp h o g ly c e r ic a c id
P h o s p h o e n o lp y ru v ic a c id
P y ru v ic a c id
A c e ty l p h o s p h a te
N A D H + H +
N A D +
A c e ta ld e h y d e
E th a n o l
N A D H + H +
N A D +
A D P
A T P
A c e ta te
(a ) (b )

citrate oxaloacetate pyruvate
pyruvate
pyruvate
pyruvate
α-acetolactate
diacetyl acetoin
2,3 butanediol
acetyl CoA
acetate
CO2
CO2
TPP-active acetaldehyde
CO2
NADH+H+
NAD+
CO2
O2
TPP-activeacetaldehyde
CO2
TPP-activeacetaldehyde
CO2
CoASH
NADH+H+ NAD+
Citratelyase
Oxaloacetatedecarboxylase
TPP
α-Acetolactatedecarboxylase
acetaldehyde ethanol
NADH+H+
NAD+
lactate
Diacetylreductase
Acetoinreductase
NADH+H+ NAD+
Lactatedehydrogenase
α-Acetolactatesynthase
CoASH
Pi
acetyl~P
acetate
ADP
ATP
CITRIC ACID DEGRADATION

LYSOZYME
• Lysozyme is an enzyme with bactericidal properties
• Approved for use as biopreservative in the food industry
• Non-toxic and has GRAS status
• Widely distributed in nature– Animals, plants, insects, phages
• Commercial source of lysozyme is hen egg white
• Toothpaste, cheese etc.

LYSOZYME
• OIV approved use of lysozyme in winemaking
• Mainly used in winemaking for– inhibition of MLF– control of MLF– microbial stabilisation after MLF

FUNCTION• Lysozyme is defined as 1,4-β-N-
acetylmuramidase– cleaves β-1,4-glycosidic bonds in the peptidoglycan
layer of cell walls
• Lysozyme has muramidase and chitinolyticactivity
• Effective only against Gram-positive bacteria– Gram-(+) have a thick peptidoglycan layer– Gram-(-) thin peptidoglycan layer
• Outer cell membrane
• Gram-(-) can be sensitised– addition of EDTA

Gram negative
Gram positive

ACTIVITY• Action limited to Gram(+) bacteria
• Lysozyme is not effective against yeast
• Active in wine pH and not affected by alcohol
• Winemaking compounds affecting lysozymeactivity– tannins, meta tartaric acid– pigments, oak chips, carbon– bentonite, silica
• No permanent preservation
• No antioxidant activity
• Effect of LAB cell numbers (→ 105 cfu/mL ←)

APPLICATIONS
• Delay MLF
• Maceration
• Carbonic maceration (100 mg/L →200 mg/L) inhibits spontaneous MLF– presence of high [sugar] – volatile
acidity

APPLICATIONS (continue)
• Prevention of MLF• Prevention of MLF
00
2020
4040
6060
8080
100100
120120
140140
160160
180180
200200
ControlControl Lyso/2x250Lyso/2x250
Chardonnay 2Chardonnay 2Sauvignon 1Sauvignon 1Sauvignon 2Sauvignon 2GewürtraminerGewürtraminer
Day
sD
ays
THE EFFECT OF LYSOZYME ON MLFTHE EFFECT OF LYSOZYME ON MLF
No MLF after 6 mthNo MLF after 6 mth

MICROBIOLOGICAL STABILIZATION OF PINOT NOIR WINES IN BARRELS AFTER MLF
00
22
44
66
88
00 11 22 33 44 55 66
ControlControlSO2: 50 mg/LSO2: 50 mg/LLYS: 125 mg/LLYS: 125 mg/LLYS: 250 mg/LLYS: 250 mg/LLYS: 500 mg/LLYS: 500 mg/L
LAB
PO
PULA
TIO
NLA
B P
OPU
LATI
ON
TIME (mth)TIME (mth)

ACETIC ACID PRODUCTION
LYS: 500 mg/LLYS: 500 mg/LLYS: 250 mg/LLYS: 250 mg/LLYS: 125 mg/LLYS: 125 mg/LSO2: 50 mg/LSO2: 50 mg/LControlControl
400400
450450
500500
550550
600600
00 11 22 33 44 55 66
AC
ETIC
AC
IDA
CET
IC A
CID
TIME (mth)TIME (mth)

FORMATION OF BIOGENIC AMINES IN BARRELS AFTER MLF
00
1010
2020
3030
4040
5050
End MLFEnd MLF ControlControl SO2 50SO2 50 LYS 125LYS 125 LYS 250LYS 250 LYS 500LYS 500
HystamineHystamineTyramineTyraminePutrescinePutrescine
(mg/
L)(m
g/L)
6 mths after MLF6 mths after MLF

STUCK / SLUGGISH FERMENTATIONS
• Sometimes caused by LAB– sugar → VA– eliminate LAB (500 mg/L)
• LAB not the cause– prevent VA formation– preventative dose (200-300 mg/L)

STUCK / SLUGGISH FERMENTATIONS (continue)
• SO2 treatment– can influence yeast– total SO2
• MLF already started– monitor VA carefully– high dosage to eliminate

APPLICATION IN SA WINE INDUSTRY
• Maceration/delayed alcoholic fermentation
• Vineyard with a history of problems
• High pH grapes– add after crush– SO2 addition (< 10-20%, if any)– prevent growth of spontaneous LAB– lysozyme denatured during alcoholic fermentation– will have to inoculate for MLF
• VA during ageing

CONCLUSION
• Additional aid
• Does not replace SO2
• No antioxidant activity
• LAB differ in sensitivity
• Short term effect
• Experiment

OTHER OPTIONS
• Viticultural practices
• Acid additions before alcoholic fermentation
- tartaric, malic, potassium
- homogenation of grapes