fourier transform infrared spectroscopy applied to artwork
DESCRIPTION
Fourier Transform Infrared (FT-IR) spectroscopy is one analytical technique that its use has been increased to analyze artwork. FT-IR spectroscopy is a non-destructive method, which is essential for analyzing artwork because it is important to conserve artwork, since artwork is damaged by the amount of time that ages it and other environmental. By using the FT-IR spectroscopy it is possible to identify of the compounds that were used, and it is important to decide how much restoration is needed and how the restoration has to be done.TRANSCRIPT

Fourier Transform Infrared Spectroscopy Applied to Artwork
Abstract
Fourier Transform Infrared (FT-IR) spectroscopy is one analytical technique that its use has
been increased to analyze artwork. FT-IR spectroscopy is a non-destructive method, which is essential
for analyzing artwork because it is important to conserve artwork, since artwork is damaged by the
amount of time that ages it and other environmental. By using the FT-IR spectroscopy it is possible to
identify of the compounds that were used, and it is important to decide how much restoration is needed
and how the restoration has to be done.
Introduction
The use of analytical techniques to study artwork has increased with the technological
advancement of these techniques and instruments. Many reasons have led to this increased use of
1

analytical techniques. A very common reason is to understand what materials and techniques that
artists used to create their artwork. Another reason the works are analyzed, is to understand the
degradation, condition and also conservation of artwork. The data collected by the instruments can be
used to check if the artwork is authentic or not. This can be done by comparing when the artwork was
made, the period that the artist could have create the piece of art, the technique used to make the
artwork, and the materials that were used at that time. 1
The degradation of artwork can happen for many reasons, and it requires advanced analytical
methods to help understand this process and the conservation as well. These degradation processes can
be through natural courses of decay, the effects of public exposition, environmental disasters and even
conservation or preservation procedures can cause degradation over a long period of time. Getting
information from artwork can be difficult, since it usually a complicated process to analyze the
sample. Removing a sample from the object can harm the artwork, and for this reason, it is necessary
to use non-destructive techniques (These are techniques that do not need to remove a sample from the
object, and allow conservators to study the artwork without harming the painting), and micro-
destructive techniques (which are techniques that remove just a small amount material to analyze). 2
Many analytical methods are used to explore and to analyze artworks. These methods include
Infrared (IR), Fourier Transform Infrared (FT-IR), X-Ray Diffraction (XRD), X-Ray Analysis (PIXE),
X-Ray Fluorescence (XRF), Raman and Static Secondary Ion Mass Spectrometry (SSIMS). All these
methods are non-destructive or micro-destructive techniques, and as stated earlier non-destructive
techniques are essential, because in many cases it is unacceptable to remove samples from the artwork.
Overview of FT-IR spectroscopy
Of all non-destructive techniques available for use in analyzing artwork, this paper the focuses
on the Fourier Transform Infrared (FT-IR) spectroscopy, including how this instrument works, as well
as some examples of artwork that were analyzed using FT-IR spectroscopy. FT-IR spectroscopy was
developed 20 years after the dispersive infrared method that emerged in the 1940’s 3, and was
developed to overcome the dispersive instruments’ limitations. 4 Instrumentation for both dispersive
2

infrared and FT-IR spectroscopy are similar because both have a source of energy and mirrors, but at
the same time these instruments are also unique in how they operate. This difference comes from the
fact that FT-IR instrument has an interferometer, while dispersive infrared does not. 3
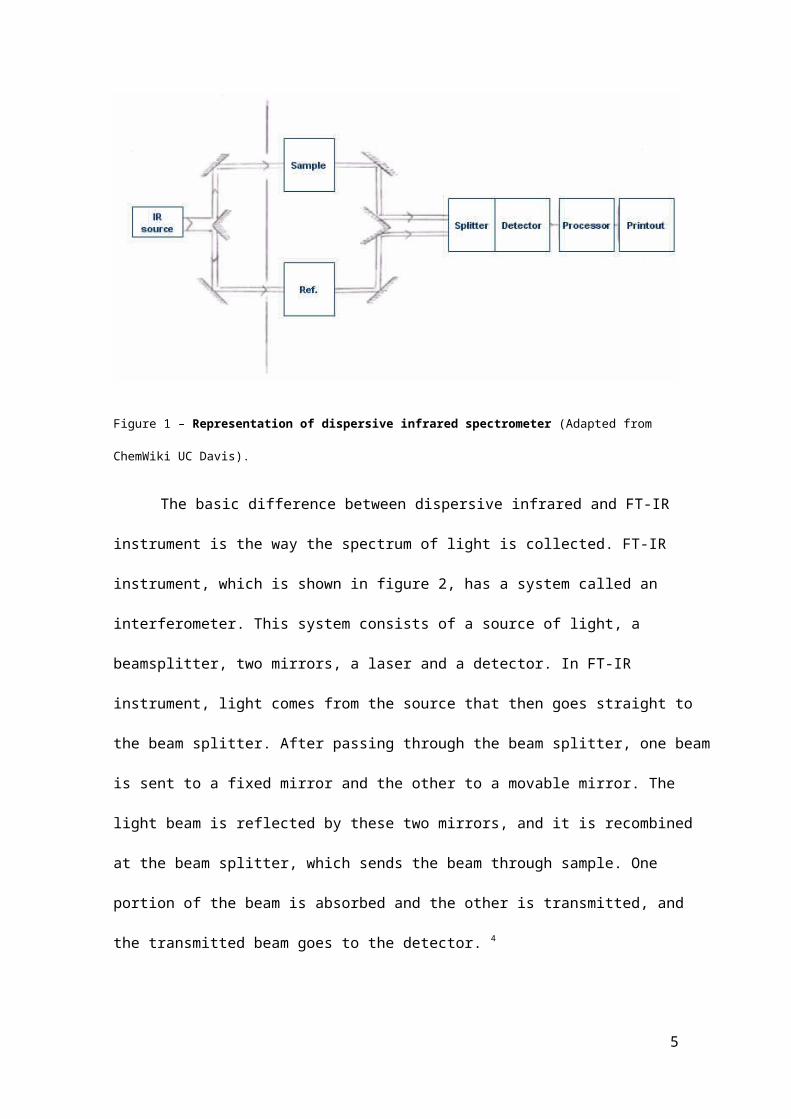
In a dispersive infrared instrument, which is shown in figure 1, the energy is sent by the
source, and the light passes through the sample and a reference path. The two lights meet in the
chopper, and the chopper subtracts the two lights, which is the light from the reference path and the
light that passes through the sample. This light is sent to the diffraction grating, which functions as a
prism and separates the beam into various wavelengths. The wavelengths are separately measured, due
to the fact that it is possible to control the wavelength that will be measured by moving the diffraction
grating. 3
Figure 1 – Representation of dispersive infrared spectrometer (Adapted from ChemWiki UC Davis).
The basic difference between dispersive infrared and FT-IR instrument is the way the
spectrum of light is collected. FT-IR instrument, which is shown in figure 2, has a system called an
interferometer. This system consists of a source of light, a beamsplitter, two mirrors, a laser and a
detector. In FT-IR instrument, light comes from the source that then goes straight to the beam splitter.
After passing through the beam splitter, one beam is sent to a fixed mirror and the other to a movable
mirror. The light beam is reflected by these two mirrors, and it is recombined at the beam splitter,
3

which sends the beam through sample. One portion of the beam is absorbed and the other is
transmitted, and the transmitted beam goes to the detector. 4
Figure 2 – Fourier Transform Infrared
The moving mirror is an important part of the interferometer, because the mirror has a
constant velocity as it moves in back and forth motion. The beam that comes from the moving mirror
travels a different distance than the beam from the fixed mirror, and this difference when the beams
are recombined, can cause interference. This interference can be either constructive or destructive.
Because the interferometer, detector can read all the wavelengths in the infrared range at the same
time, and it is not necessary to read one at a time like dispersive infrared. 5
FT-IR instrument has some performance advantages when compared with the dispersive
infrared instrument, and when considering these advantages, there are three that are important enough
to makes FT-IR instrument a better option than the dispersive infrared instrument. These three
advantages are the multiplex advantage, throughput advantage and precision advantage. In FT-IR
4
instrument, the interferometer does not split the light from the source into individual frequencies,
because of that each point in the interferogram has all the information of the wavelength that is going
to be measured. Every movement of the moving mirror is equals to one scan in FT-IR instrument, and
each scan can combine with the others to give a better representation of the real absorbance of the
sample. Only one wavelength can be scanned at time in a dispersive infrared machine, and it can be
extremely time consuming. FT-IR instrument is much faster than the dispersive infrared because of
this. 5
Another advantage is that in FT-IR spectroscopy there is no slit to limit the individual
frequency and total energy that will reach the sample and the detector. There are fewer mirrors in the
interferometer of FT-IR instrument than dispersive infrared. Fewer mirrors equate to less reflection
loss, and as a result there will be more energy to reach the sample and the detector. If more energy
reaches the detector, it will give a better signal and the signal-to-noise ratio will be higher than the
ratio from the dispersive method. With a higher signal-to-noise ratio, the sensitivity for small peaks
will be greater, and the spectrum will be more distinguishable. 4
FT-IR instrument has a laser that controls the velocity of the moving mirror, and the amount
of time that the data is collected. This laser is also the source of wavelength calibration that comes
with the instrument. The x-axis data points of the spectrum are automatically referenced as a known
value, because the laser wavelength has a constant value. For this reason, the laser maintains the
internal precision and accuracy of the wavelength. In dispersive instruments, it is necessary to perform
an internal calibration with a standard in order to control the accuracy. Accuracy and precision are
higher in FT-IR instrument than in the dispersive instrument for this reason. 4
Infrared spectroscopy usually is recognized as a fingerprinting method, because it is extremely
reliable for the characterization and identification of compounds. Infrared spectroscopy is useful
because it is possible to obtain spectra from a wide range of samples, which can include solids, liquids
and gases. However, sample preparation is crucial to obtain a good quality of spectra. Normally, the
IR spectrometers analyze solids, liquids, and gases by transmitting infrared radiation through the
5

sample directly. If the sample is solid or liquid, the intensity of the spectra will be determined by the
thickness of the sample. Attenuated Total Reflectance (ATR) is a technique that revolutionized
Infrared analysis, because ATR does not require sample preparation. 6
The most common method of preparing a solid sample for infrared analysis is by using
potassium bromide (KBr). The sample is mixed with KBr in excess of the sample. This mix needs a
special tool kit including a hydraulic press, and it also requires a specific skillset for the person
handling this tool. Not all the sample material in the pallet will absorb the infrared radiation, and this
method also requires more time to prepare the sample. 7 Usually, liquids are analyzed traditionally as
films, specifically as thin film in cells. The cell consists of two IR transparent windows. In general, a
liquid sample is easier to prepare in comparison to a solid sample, but for both cases there are
reproducibility issues because of the sample preparation. 8
Overview of ATR-FT-IR
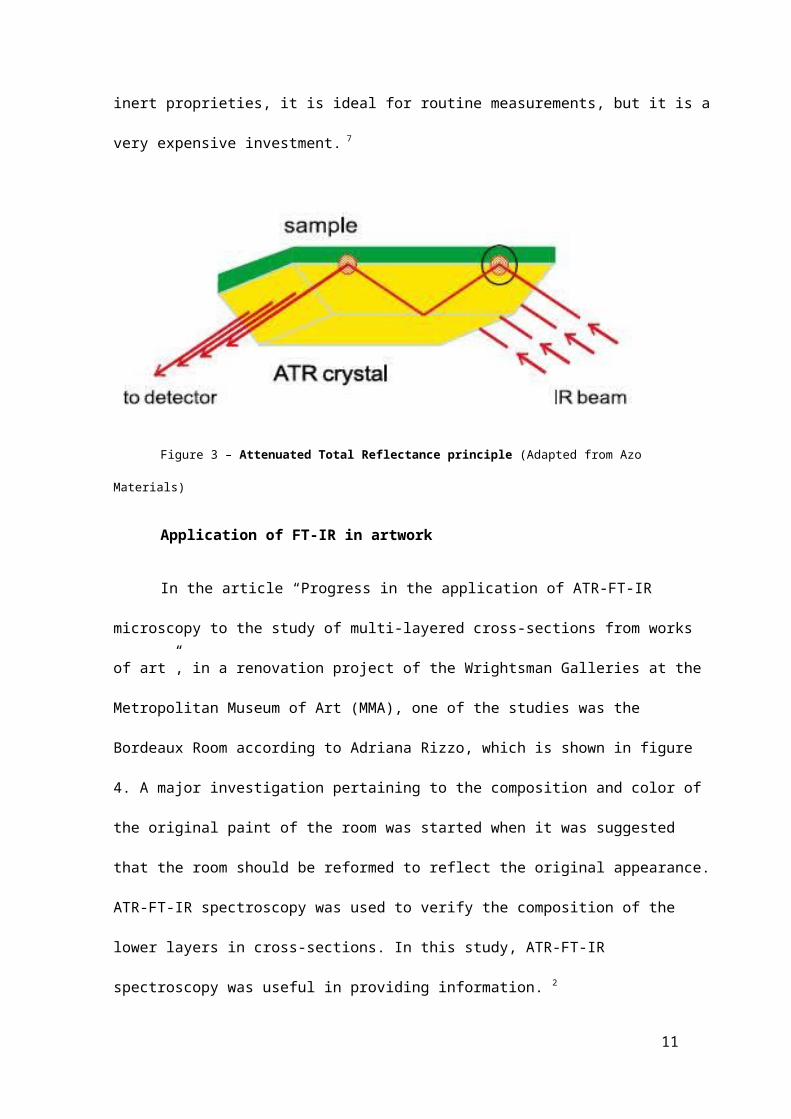
Attenuated Total Reflectance (ATR) accessory has the ability to measure a wide variety of
samples, which can be liquid or solid, but the major benefit is that it does not need a complex sample
preparation for the infrared analysis. The ATR, which is shown in figure 3, measures the changes that
happen in an internal reflection of the infrared beam when this beam comes in contact with the sample.
9 This infrared beam goes direct to an optically dense crystal that at a certain angle has a high
refractive index. In the ATR the sample has to be in contact with the crystal, because the internal
reflectance creates an evanescent wave that goes beyond the crystal surface. The sample can absorb
energy from the infrared spectrum, and this can cause an attenuation or alteration in the evanescent
wave. The evanescent wave exits from the opposite side of the crystal and goes through the detector
that will generate an infrared spectrum. 6
Most ATRs are designed with a type of pressuring that guarantees enough pressure to analyze
solids and the crystals usually are horizontal. Just one drop of liquid and paste in the crystal is enough
to start the measurement. The crystal used in the measurement is very important in obtaining good
6

results. Of all the crystals available, the most common are zinc selenide (ZnSe), germanium and
diamond. 6
ZnSe is the least expensive of these options, and is good for analyzing liquids. On the other
hand, ZnSe is prone to scratches, and can only be used between pH 5 and pH 9. Germanium is useful
when it is necessary to have a high surface sensitivity, as for thin layers, because germanium has a
high refractive index. Diamond is useful for a wide range of measurements, because of its chemical
inert proprieties, it is ideal for routine measurements, but it is a very expensive investment. 7
Figure 3 – Attenuated Total Reflectance principle (Adapted from Azo Materials)
Application of FT-IR in artwork
In the article “Progress in the application of ATR-FT-IR microscopy to the study of multi-
layered cross-sections from works of art”, in a renovation project of the Wrightsman Galleries at the
Metropolitan Museum of Art (MMA), one of the studies was the Bordeaux Room according to
Adriana Rizzo, which is shown in figure 4. A major investigation pertaining to the composition and
color of the original paint of the room was started when it was suggested that the room should be
reformed to reflect the original appearance. ATR-FT-IR spectroscopy was used to verify the
composition of the lower layers in cross-sections. In this study, ATR-FT-IR spectroscopy was useful
in providing information. 2
7

Figure 4 – Bordeaux room - French ca. 1785 (Adapted from Metropolitan Museum of Art)
An armchair made in Philadelphia in 1795, which is shown in figure 5, is an interpretation of a
Louis XVI fauteuil. This armchair is now in the MMA, and it was also an object of restoration study
by Adriana Rizzo, that was used the ATR-FT-IR spectroscopy to analyze. This armchair has five paint
layers that are barely distinguishable under visible illumination. ATR-FT-IR spectroscopy analysis for
this armchair, it was used to address issues related to finding the materials that were used to create the
original appearance, and how to restore the armchair for future presentations. By using ATR-FT-IR
spectroscopy it was possible to characterize the original binder, and that binder revealed that the chair
was made according to a contemporary 18t century French trend for finishes. The oil used traditionally
is used to achieve a glossy surface finish, but it was not common in France at that time. For this
reason, it is possible to figure out that the contemporary French trends were imitated in America,
which is the case of this armchair that was made in Philadelphia and not in France. With all the
information about the materials that were used in the armchair, it was helpful to guide the treatment of
the chair. 2
8

Figure 5 – Armchair - Philadelphia 1795 (Adapted from Metropolitan Museum of Art)
In the article “Non-destructive micro-analytical differentiation of copper pigments in paint
layers of works of art using laboratory-based techniques” author Silvie Svarcova described the
identification and distinguishing of copper in artwork. In this study, they analyzed twenty one pieces
of art, which were created in Europe from the mediaeval times until the 18th century. These works
include polychromes on wood, panel paintings and easel paintings. 10
The group of copper pigments has a wide use in historic paintings. This is mainly because
copper substances have a huge diversity, but at the same time share some similarities. Analyzing
copper substances can be a challenging task, because of the similarity of the substances. Of all the
mineral copper pigments, many of them are similar, with the difference often being only one carbonate
group, which is the case of the blue azurite (Cu3(CO3)2(OH)2) and the green malachite (Cu2(CO3)
(OH)2), their identification and differentiation is a difficult task. 10
Copper chlorides are another group that is difficult to differentiate, because of the structural
polymorphs that have the same chemical composition. Atacamite, bottalackite, clinoatacamite and
paratacamite are copper substances with chloride that has the same chemical composition, which is
9

Cu2Cl(OH)3, Between these substances, only structure is different. Though copper sulfates are often
similar in structure to copper chloride composts, they often differ by the number of hydroxyl and
water molecules. In the copper sulphates some examples there are: antlerite (Cu3SO4(OH)4)
brochantite (Cu4SO4(OH)6), langite (Cu4SO4(OH)6.2H2O), and ponsjakite (Cu4SO4(OH)6.H2O.
In analyses these paintings it was necessary to use a non-destructive method to minimize the
damage to the artwork, because of this, FT-IR spectroscopy was selected, along with Raman
Spectroscopy, X-Ray Micro Diffraction, and Electron Microscopy as supplemental techniques to help
in analyzing the artwork. The amount of analyte and number of samples that were used was the
minimum extent that could give a satisfactory result from these analyzes. The FT-IR spectroscopy was
effective for the identification of the mineral copper pigments, and also provides some information
about the binders that used in the art. Working with the other methods, it was possible to identify a
wide range of copper molecules. 10
Discussion
The use of FT-IR spectroscopy has increased considerably in recent years due to advances that
this technique has compared to the dispersive spectroscopy infrared. The FT-IR spectroscopy is faster
and more efficient technique than the dispersive spectroscopy infrared, and it is important in the
artwork analyze field because it is a non-destructive technic. The FT-IR spectroscopy with ATR is
very useful for analysis of works of art due to the fact that a sample preparation is not necessary, the
sample can be used in various physical states of matter, is a quick analysis due to the fact that it is
possible to analyze various lengths of where simultaneously. The FT-IR spectroscopy has contributed
to analyze pieces of art, identification of materials used, check when it was done the work. As
mentioned above, the FT-IR spectroscopy was also important for the creation of works of art
restoration project, which helped identify the reagents used, and this provided sufficient information
for the restore to proceed with the initial characteristics of the work of art. The abilities of FT-IR
spectroscopy have increased and the contributions that have been done are important in the art field for
restauration and identification.
10
References
1. Adriaens A., “Non-destructive analysis and testing of museum objects: an overview of 5 years of research”. Spec Act Part B: Atom Spect (2005) 1503 – 1516
2. Rizzo, A.; “Progress in the application of ATR-FTIR microscopy to the study of multi-layered cross-sections from works of art”, Anal Bional Chem (2008) 47 - 55.
3. Thermo Nicolet, FT-IR vs. Dispersive Infrared, Theory of Infrared Spectroscopy Instrumentation. Retrieved from http://www.thermo.com.cn/
4. Thermo Nicolet, Introduction to Fourier Transform Infrared Spectrometry, 2001, 1 – 7. Retrieved from http://mmrc.caltech.edu/FTIR/FTIRintro.pdf
5. UC Davis ChemWiki, How an FTIR Spectrometer Operates, Retrieved Fromhttp://chemwiki.ucdavis.edu/
6. PerkinElmer Life and Analytical Sciences, “FT-IR Spectroscopy Attenuated Total Reflectance (ART), Retrieved from http://www.utsc.utoronto.ca
7. Shaikh T.N & Agrawal S. A., Qualitative and Quantitative Characterization of Textile Material by Fourier Transform Infra-Red, Int Journ Inno Res Sci Eng Tech (2014) 3, 8497 – 8499. Web.
8. D. W. Ball, Field Guide to Spectroscopy, SPIE Publication, Bellingham, 2006, 89 – 90
9. Bueno, J.; Sikizhytski, V.; Lednev, I.K.; “Attenuated Total Reflectance – FT-IR Spectroscopy for Gunshot Residue Analysis: Potential for Ammunition Determination” Anal. Chem. (2013) 7287 – 7294.
10. Svarcova, A.; Cermakova, Z.; Hradiolova, J.; Bezdicka, P.; Hradil, P. “Non-destructive micro analytical differentiation of copper pigments in paint layers of Works of art using laboratory-based techniques” Spec Act Part A: Mol and Biom Spec (2014) 514 – 525
11