the euro crisis - education bureau. poor incentives design ... rating agency moody’s downgraded...
TRANSCRIPT

The Great Recession:
European Sovereign Debt
Crisis
Michael Fung
cuhk Business School
Hamton Wong
Maastricht graduate school of governance
maastricht university

Overview
Background
Origins of the crisis
Greece
Spain
Why the crisis seems never end?
Policy responses
What have been done?
Recent proposals
2

The European Union
Though with a significant economic dimension, … On the road to the EU Treaty of Paris (1951)
European Coal and Steel Community (ECSC)
Treaty of Rome (1957) European Economic Community (EEC)
Maastricht Treaty (1992) The treaty created the European Union (EU) and the euro (€).
3

The European Union
… the European Union is a political project.
“The European Union is set up with the aim of ending
the frequent and bloody wars between neighbours,
which culminated in the Second World War, […] to
unite European countries economically and politically
in order to secure lasting peace. ”
Source: European Union (2012) http://europa.eu/about-eu/eu-history/index_en.htm
4

The Euro
EU
≠ Euro area
Source: European Central Bank (2012) http://www.ecb.int/euro/intro/html/map.en.html
5

The Euro
27 EU member states
17 euro area member states
Austria, Belgium, Cyprus, Estonia, Finland, France, Germany, Greece, Ireland, Italy, Luxembourg, Malta, the Netherlands, Portugal, Slovakia, Slovenia, and Spain
6
The Euro
Reasons / advantages for a single currency
Complement to the single market to improve efficiency
Eliminate currency exchange costs and facilitate
international trade
Source: European Union (2012) http://ec.europa.eu/economy_finance/euro/index_en.htm
7

The Euro
Reasons / advantages for a single currency
Protect the euro area from external economic shocks
given the size and strength of the euro area
Source: European Union (2012) http://ec.europa.eu/economy_finance/euro/index_en.htm
8

The Euro
Reasons / advantages for a single currency
Create a mechanism for a low inflation and low
interest rates and encourage sound public finances
Source: European Union (2012) http://ec.europa.eu/economy_finance/euro/index_en.htm
9

The Euro
Reasons / advantages for a single currency
Give the EU a more powerful voice in the world
Give a tangible symbol of their European identity
Source: European Union (2012) http://ec.europa.eu/economy_finance/euro/index_en.htm
10

The Euro
Shortcomings
One monetary policy for economies with dissimilar
structures
National governments lost the monetary instruments
11

The Euro
Convergence Criteria in the EU Treaty (Details in Appendix)
Economic convergence The ratio of government deficit to GDP must not exceed 3%
The ratio of government debt to GDP must not exceed 60%
Source: Scheller, H.K. (2006) The European Central Bank: History, Role and Functions. Revised 2nd ed.
Frankfurt: European Central Bank.
12

The Case of Greece
Origins 13

Sovereign Debt Crisis
Sovereign Debt
Debt of the government
Debt (stock) vs. Deficit (flow)
Deficit = Revenue – Expenditure
Debt = cumulative sum of deficits
Source: Reinhart, C.M. & Rogoff, K. (2009) This Time Is Different: Eight Centuries of Financial Folly.
Princeton, NJ: Princeton University Press.
14

Sovereign Debt Crisis
Crisis
Alerting signal
Rising doubt on the ability to repay
Increased risk of default
Confidence crisis
Shredding market confidence
Decrease in demand for bond
Bond price decreases
Yield increase to cover the risk
Debt perceived to be even more unsustainable
Source: Reinhart, C.M. & Rogoff, K. (2009) This Time Is Different: Eight Centuries of Financial Folly.
Princeton, NJ: Princeton University Press.
15

Trigger
1. High debt level
Source: The Economist (12 Nov 2011) A very short history of the crisis
(http://www.economist.com/node/21536871).
16

Trigger
2. Bad signal from the Greek government
On 23 April 2010, the prime minister formally
requested about $53 billion in financial aid from the
EU and the IMF to repay its maturing debt obligations
Source: Smith, Aaron (23 Apr 2010) Greek debt fears ease after EU aid request. CNN Money.
17

Prospects - Overview
Structural deficit swelling debt
Expenditures (Long term burden)
Wage burden
Public investment
Pension
Revenue
Shadow economy (tax evasion)
Economic health generate income to repay
Economic structure
Labor market
18

Prospects – Structural Deficits
Wage burden of the Greek
government
Many people work in the
public sector
Relatively high wage in the
public sector
Country Employee
Share (%)
Wage
Ratio
Austria 21 1.12
Belgium 38 0.95
France 31 1.05
Germany 19 1.18
Greece 29 1.27
Ireland 29 1.17
Italy 27 1.22
Spain 23 1.26
Portugal 25 1.46
Source: Giordano, R. (2011) The Public Sector Pay Gap in a Selection of Euro Area Countries. ECB
Working Paper No. 1406. Frankfurt: ECB.
19

Prospects – Structural Deficits
Relatively high public
investment
For example, the 2004
Athens Olympics
€3 bn on construction of
sporting facilities
€4.2 bn on transportation
€1.2 bn on communication
€1.1 bn on security
€0.7 bn on other
infrastructure
Country % of GDP
Greece 3.28
Germany 1.58
Italy 2.30
Spain 4.01
United Kingdom 2.24
South Korea 5.23
Sources: IMF (2012) World Economic Outlook: Growth Resuming, Dangers Remain. Washington, DC: IMF.
Kasimati, E. & Dawson, P. (2009) Assessing the impact of the 2004 Olympic Games on the Greek
economy: A small macroeconometric model. Economic Modelling 26(1): 139-146.
OECD (2012) OECD.StatExtracts. http://stats.oecd.org/Index.aspx?DatasetCode=SNA_TABLE1
Public Investment to GDP Ratio
2006-2010 (Period Average)
20

Prospects – Structural Deficits
Pension system in Greece
a. Pension expenditures = 11.5% of GDP
Highest in the OCED (average 7.2%)
b. Rapid ageing
29.1% aged over 65 (vs 23.6% in OECD)
c. Poor incentives design
Contribution period for full pension: 35 years
40 years (Canada, France); 44 years (Japan)
Reference period for benefits: last 5 years
Canada (best 34 years)
France (best 25 years)
Japan (whole career)
Sources: OECD (2010) Greece at a Glance: Policies for a Sustainable Recovery. Paris: OECD.
OECD (2011) Pensions at a Glance. Paris: OCED, Chapter 2.
21
Prospects – Structural Deficits
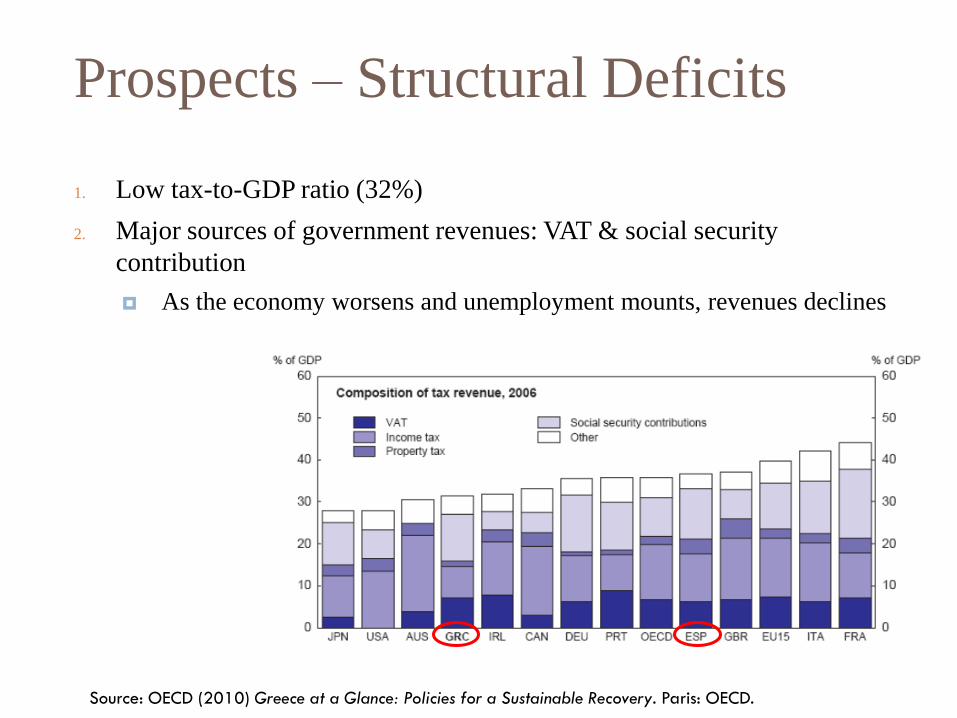
1. Low tax-to-GDP ratio (32%)
2. Major sources of government revenues: VAT & social security
contribution
As the economy worsens and unemployment mounts, revenues declines
Source: OECD (2010) Greece at a Glance: Policies for a Sustainable Recovery. Paris: OECD.
22

Prospects – Structural Deficits
3. Low tax collection efficiency
Source: OECD (2010) Greece at a Glance: Policies for a Sustainable Recovery. Paris: OECD.
23

Prospects – Structural Deficits
4. Tax evasion
Large size of informal economy
Source: OECD (2010) Greece at a Glance: Policies for a Sustainable Recovery. Paris: OECD.
24

Prospects – Economic Health
1. Economic structure
Public sector: 40% of GDP
Provision of public goods: 23% of GDP (2009)
Tourism: 15% of GDP
Sensitive to external demand
R&D expenditures: 0.59% of GDP (2007)
Low growth potential
Ability to repay: doubtful
Sources: CIA (2012) The World Factbook: Greece.
OECD (2012) Country statistical profile: Greece 2011-2012. Paris: OECD.
OECD (2011) Government at a Glance 2011. Paris: OECD.
25

Prospects – Economic Health
2. Labor market
Unemployment rate
23.1% (May, 2012); 12.6% (2010); 9.5% (2009)
Long term unemployment
45% (2010); 40.8% (2009)
Youth (15-24) unemployment rate
25.3% (2009 Q3)
Youths 15-19 not in education nor employment
18.2% (2010)
Youths 20-24 not in education nor employment
7.9% (2010)
Sources: OECD (2012) Country statistical profile: Greece 2011-2012. Paris: OECD.
OECD (2010) Greece at a Glance: Policies for a Sustainable Recovery. Paris: OECD.
26

Confidence
Diminished confidence & reinforced fear
One day before Greece’s request, Eurostat, the EU’s
statistical authority, reported that Greece’s 2009 deficit
is equal to 13.6% of its GDP, a figure higher than what
Greece claimed (12.7%)
Rating agency Moody’s downgraded Greece’s rating to
A3 and citing it “significant risk”; Standard and Poor’s
downgraded Greece's credit rating to junk status
Sources: Smith, Aaron (23 Apr 2010) Greek debt fears ease after EU aid request. CNN Money.
Reuters (20 May 2010) Timeline- Greece debt’s crisis.
27

Confidence
Greece Government Bond Yield (10 Years)
Source: Bloomberg (30 Jul 2012) http://www.bloomberg.com/quote/GGGB10YR:IND/chart
28
The Case of Spain
Origins 29

Overview
A different crisis in Spain
Burst of housing bubbles following the global financial
crisis
The burst of bubble hurts the households, affects
consumption and investment
30

Overview
The bubbles also hurts the banking sector and
affects business
After the clash, banks became the owners of the newly
built houses
But the worth of those houses decreased following the
crisis
Banks can’t meet the capital requirement, hence
stringent credits to business
Source: The Economist (3 Feb 2011) Roll up, roll up.
31

Trigger
Single currency
Low borrowing costs for all
Over-investment
Benchmark: German 10-year benchmark bonds
Source: Pagano, M. & E. von Thadden (2004)
The European Bond Markets under EMU.
Oxford Review of Economic Policy
20(4): 531-554.
32

Trigger
Spain Ireland
Greece
Portugal
Germany
Source: L.B. Smaghi (2011) Eurozone, European crisis and policy response. Speech at Global Macro
Conference – Asia 2011, Hong Kong.
Real residential property prices in selected euro area countries
Index
33

Prospects – Fiscal Health
Fiscal health now deteriorates Government bailouts to and nationalizaion of banks would
increase sovereign debts
Cajas (savings banks that accounted for 50% market share in credits and in deposits in Spain), in 2011 received €15 billion injection from the government. An extra €20 billion would be required according to some estimates
Bankia, the third largest bank of Spain, was nationalized by the government in May 2012
Later, additional €19 billion was pumped into the bank
Sources:
1. Bjork, C. et. al. (25 May 2012) Spain Pours Billions Into Bank. Wall Street Journal.
2. The Economist (3 Feb 2011) Roll up, roll up.
3. Cristóbal, F.H. (2008) The role of the “cajas” in Spanish regions economic development.
Paper presented at the 10th European Conference on Savings Banks History. Brussels: 11 October 2008.
34

Prospects – Banking System
Bank bailed-out or nationalised by the central
government, another debt crisis?
Structural problems similar to Greece’s
Unemployment (21.7% in 2011)
Pension system, large informal economy
But better on the revenue side
Sources:
1. BBC News (18 Nov 2011) “Eurozone debt web: Who owes what to whom?”
2. CIA World Factbook (2012) Spain.
35

Prospects – Banking System
Bank bailed-out or nationalised by the central
government, another debt crisis?
On top of that
Economy of larger size
Spain owes large amounts to Germany (€132 bn) and
France (€112 bn)
Sources:
1. BBC News (18 Nov 2011) “Eurozone debt web: Who owes what to whom?”
2. CIA World Factbook (2012) Spain.
36

Confidence
Another sovereign debt crisis?
Spain Government Bond Yield (10 Years)
Source: Bloomberg (31 Jul 2012) http://www.bloomberg.com/quote/GSPG10YR:IND/chart
37

What’s Next?
Liquidity problem resolved?
A regional debt problem (cf. China)?
Devil in the details: government expenditures are highly
decentralised
Source: OECD (2011) Government at a Glance 2011. OECD: Paris.
38

Europe and US Compared 39

Debt Level
Like Greece, high debt level in the US 0
50
10
015
0
Perc
ent o
f G
DP
2000 2005 2010Year
Germany Greece
Ireland Portugal
Spain United Kingdom
United States
Source: IMF World Economic Outlook Database: April 2012 Edition
General Government Gross Debt
Greece
Spain
US
Germany
Ireland
40

Real Estate Bubbles
Like Spain, housing bubbles in the US
50
10
015
020
0
Inde
x
1985q1 1990q1 1995q1 2000q1 2005q1 2010q1Time
Base Value: January 2000 = 100
S&P/Case-Shiller Home Price Index
Source: Standard and Poor’s (June 2012) S&P/Case-Shiller Home Price Indices
http://www.standardandpoors.com/indices/sp-case-shiller-home-price-indices/en/us/?indexId=spusa-cashpidff--p-us----
41

Europe and US Compared
Similar problems
High public debt
Housing bubbles
Hit by 2007 financial crisis
Two questions
Does the US manage the crisis better?
Why no sovereign debt crisis in the US?
42

Any Differences?
Asking the right question?
Situations is more asymmetric in the euro area (Germany,
the Netherlands vs Greece, Spain).
A public-private sector crisis in the euro area versus a
private sector “crisis” in the US.
Crisis situation started earlier (but deeper) in the US
Source: IMF (2012) World Economic Outlook: Growth Resuming, Dangers Remain. Washington, DC: IMF.
43

Any Differences?
When making a comparison based on growth
performance, US used to perform better
Eurosclerosis
Technically, 2 blows in Europe (1 in the US)
No sovereign debt crisis in the US as it didn’t say “help”.
-4-2
02
4
Perc
ent
2000 2005 2010 2015 2020Year
Euro Area US
Note: Estimates Start After 2010Source: IMF World Economic Outlook Database: April 2012
Real GDP Growth Rates
44
Why the Differences?
Why the differences?
1. Different nature, different policy responses
2. Institutional constraints
a. Problem of the many
b. No-bailout clause and different monetary tools
c. Mandate of the ECB and the first response to crisis
45
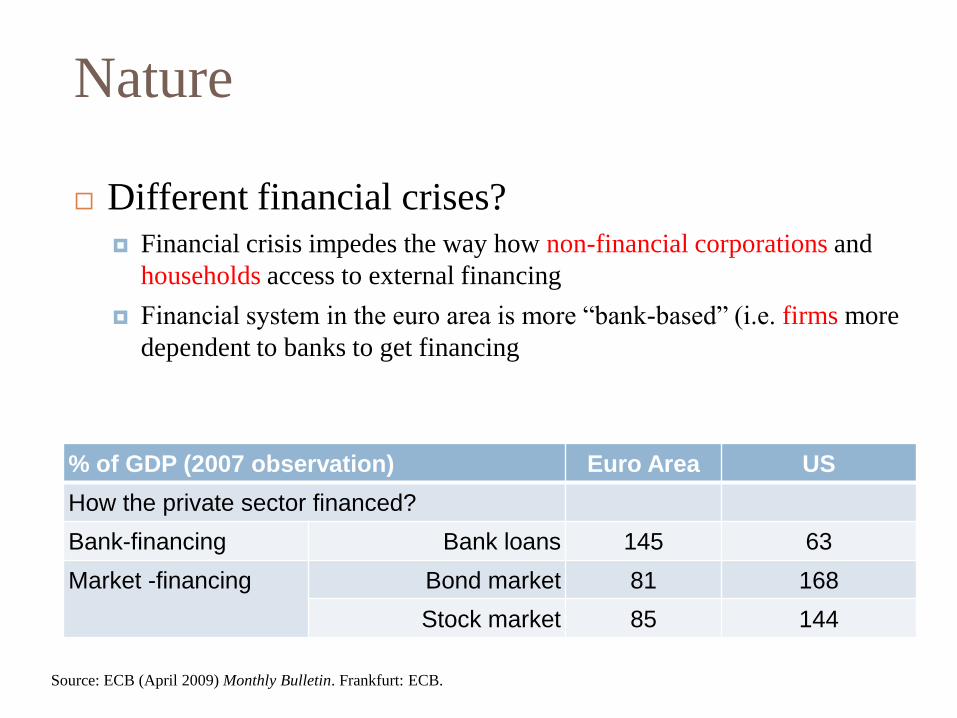
Nature
Different financial crises? Financial crisis impedes the way how non-financial corporations and
households access to external financing
Financial system in the euro area is more “bank-based” (i.e. firms more
dependent to banks to get financing
% of GDP (2007 observation) Euro Area US
How the private sector financed?
Bank-financing Bank loans 145 63
Market -financing Bond market 81 168
Stock market 85 144
Source: ECB (April 2009) Monthly Bulletin. Frankfurt: ECB.
46

Policy Responses
ECB: A bolder central bank?
Target
Scale
Timing
Source: IMF (2012) World Economic Outlook: Growth Resuming, Dangers Remain. Washington, DC: IMF.
47

Responses – Target & Scale
Target and Scale
US: all market participants
Euro area: mainly banks (through OMOs)
Source: Gros, D. et al (2012) Central Banks in Times of Crisis: The FED versus the ECB. Brussels: European Union.
48

Responses – Scale
Euro Area US
GDP (2007) € 8,372 billion
($11,477 billion)
$ 13,206 billion
The size of capital markets
related to the private
sector (2007)
311% of GDP
$ 35,693 billion
375% of GDP
$ 49,522 billion
Central bank balance sheet
(total assets)
€ 1,253 (Aug 07)
€ 3,080 (Jul 12)
$ 869 billion (Aug 07)
$ 2,849 billion (Jul 12)
Difference € 1,827 billion
($ 2,505 billion)
$1,980 billion
Scale wrt. market size 5% 4%
Expansion (2007 / 2012) 146% 228%
Sources:
Bloomberg (2012) ECB Balance Sheet All Assets. http://www.bloomberg.com/quote/EBBSTOTA:IND
IMF (2012) World Economic Outlook Database April 2012.
ECB (April 2009) Monthly Bulletin. Frankfurt: ECB.
Fed Reserve Bank of St. Louis. (2012) U.S. / Euro Foreign Exchange Rate. http://research.stlouisfed.org/fred2/data/EXUSEU.txt
49
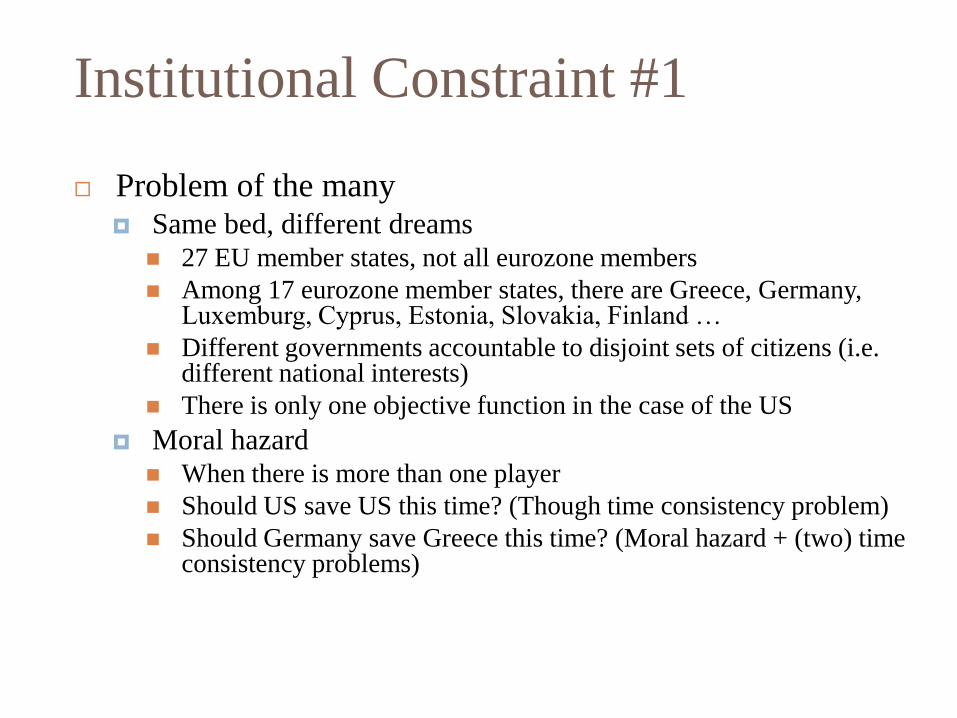
Institutional Constraint #1
Problem of the many Same bed, different dreams
27 EU member states, not all eurozone members
Among 17 eurozone member states, there are Greece, Germany, Luxemburg, Cyprus, Estonia, Slovakia, Finland …
Different governments accountable to disjoint sets of citizens (i.e. different national interests)
There is only one objective function in the case of the US
Moral hazard When there is more than one player
Should US save US this time? (Though time consistency problem)
Should Germany save Greece this time? (Moral hazard + (two) time consistency problems)
50

Institutional Constraint #2
ECB can’t bailout the member state governments, … EU (Article 125(1) of the Treaty) “The Union shall not be liable for or assume the commitments of
central governments… A Member State shall not be liable for or assume the commitments of central governments … of another Member State.”
ECB (Article 123 of the Treaty) “Overdrafts or any other type of credit facility with the ECB or
with the national central banks in favour of … central governments … shall be prohibited, as shall the purchase directly from them by the ECB or national central banks of debt instruments.”
51

Institutional Constraint #2
… but it is part of the monetary policy in the States
Fed may suppress bond yield through the open market operations. ECB has no such option
Sources: Cecchetti, S.G., & O’Sullivan R. (2003) The European Central Bank and the Federal Reserve. Oxford Review of Economic Policy
19(1): 30-43.
52

Institutional Constraint #3
Different first response to the crisis
US: policy interest rates adjusted downward
Europe: policy interest rates adjusted upward or
unchanged. Only adjusted downward in the
Spanish crisis
53

Institutional Constraint #3
Historical Changes of
the Target Federal
funds rate
(Jan 07 – Jul 12)
Housing bubble: Sep
07
Lehman Bro: 15 Sep
08
Date Change Level (%)
18 Sep 07 - 0.50 4.75
31 Oct 07 - 0.25 4.50
11 Dec 07 - 0.25 4.25
22 Jan 08 - 0.75 3.50
30 Jan 08 - 0.50 3.00
18 Mar 08 - 0.75 2.25
30 Apr 08 - 0.25 2.00
8 Oct 08 - 0.50 1.50
29 Oct 08 - 0.50 1.00
16 Dec 08 -1.00 to
- 0.75
0.00 – 0.25
Source: Federal Reserve Bank of New York (2012) Historical Changes of the Target Federal Funds and Discount Rates.
http://www.newyorkfed.org/markets/statistics/dlyrates/fedrate.html
54

Institutional Constraint #3
Key interest rates: MRO
rates
Fixed rate for fixed rate
tenders
Minimum bid rate for
variable rate tenders
Historical change of
MRO rates
GR: 23 Apr 10
ES: 11 Jul 11
Date Fixed Variable
14 Mar 07 3.75
13 Jun 07 4.00
9 Jul 08 4.25
15 Oct 08 3.75
12 Nov 08 3.25
10 Dec 08 2.50
21 Jan 09 2.00
11 Mar 09 1.50
8 Apr 09 1.25
13 May 09 1.00
13 Apr 11 1.25
13 Jul 11 1.50
9 Nov 11 1.25
14 Dec 11 1.00
11 Jul 12 0.75
Source: ECB (2012) Key ECB interest rates. http://www.ecb.int/stats/monetary/rates/html/index.en.html
Fixed rate down
from 4.25
Greece
Spain
Stock market clash
Sep 07
55

Institutional Constraint #3
Why the “strategy”?
Different mandates
ECB Federal Reserve Bank of Japan Bank of England
Mandate Price stability Price stability
Growth
Employment
Price stability
Development
Price stability
Growth
Employment
Financial stability
Source: Richter, F. & Wahl, P. (2011) The Role of the European Central Bank in the Financial Crash and the Crisis of the Euro-Zone.
56

Bad Neighbours
Systemic Risk
Domino effect
Inter- and Intra-country
Bank A Bank B Country 1 Government 1
Bank A Bank J Country 2 Government 2
Bank X Bank Y Country 3 Government 3
credit bail out
bail out
sovereign bond
credit sovereign bond
common market
57

Bad Neighbours
Intra-regional trade plays a significant role in the
EU
The exit of exports-led recovery is blocked
Source: IMF (2012) World Economic Outlook: Growth Resuming, Dangers Remain. Washington, DC: IMF.
58

Bad Neighbours
Foreign
Germany France Portugal Ireland Italy Greece Spain
Home
Germany 0.811 0.061 -0.426 0.641 0.155 0.631
France -1.092 -0.026 -0.206 -0.160 0.110 0.269
Portugal -0.895 0.285 -0.151 -1.015 0.011 -4.683
Ireland 6.801 2.363 0.149 1.868 0.216 1.433
Italy -1.025 0.192 0.109 -0.195 0.249 0.341
Greece -1.942 -1.012 -0.009 -0.177 -1.915 -0.565
Spain -1.701 -0.543 0.849 -0.255 -0.558 0.122
Bilateral Trade Balance of Selected European Countries
(% of GDP of the Home Country)
Source: Barbieri, K. & O. Keshk (2012) Correlates of War Project Trade Data Set, Version 3.0. http://correlatesofwar.org.
Notes: Period average (2000 – 2007), except for Germany (2000 – 2006); trade deficit in red.
59
Attempts
Do the policies work?
Upcoming
Policy Responses 60

Attempts – Overview
Start of the debt crisis: May 2010
Local level
Fiscal consolidation
The EU
Greek Loan Facility (May 2010)
EFSM (Jan 2011)
EFSF (May 2010)
ESM, to succeed EFSF and EFSM (expected in force July 2013)
Fiscal Compact (Treaty signed in 2012; expected in force Jan 2013)
The ECB
“Special” LTRO (May 2010; June 2010; Dec 2011; Feb 2012)
OMT (Sept 2012)
61

General Strategy
Debt Problem (Greece)
EU level solution
Liquidity Problem (Spain, may become a debt problem)
ECB level solution
Mandate of ECB disallows ECB to bailout government
Politically difficult to use taxpayers’ money to bailout private enterprises
Key is to quench the cycle by sending market a positive signal
Short-term measures
Ease liquidity
Long-term measures (i.e. new commitment devices)
Contain debt (e.g. austerity measures, Fiscal Compact)
Improve economic health (e.g. Euro Plus Pact – a series of economic reforms in pension systems, labor market, product market to enhance competitiveness of the EU. Won’t be discussed here)
62

Attempts by Local Government
Fiscal consolidation to put deficit under control
In Greece
Salary freeze of public employees
Public employee bonus and allowance cut
Trimming administration structure
Cutting minimum wage
Spending cut in health and defence
Pension reform (e.g. rise in retirement age, pension cuts)
Rise in VAT (and other taxes)
Privatization of the gas companies
Also, to reduce tax evasion
Informal economy in Greece: about 25% of GDP in 2011 (Schneider 2011)
Tax evasion: €41 billion in Greece (Artavanis et al. 2012)
Controversial
Massive strikes
Austerity is a form of contractionary fiscal policy
Sources: Artavanis, N., Morse, A. & Tsoutsoura, M. (2012) Tax Evasion Across Industries: Soft Credit Evidence from Greece. Working
Paper. University of Chicago.
Schneider, F. (2011) Estimates of the Shadow Economy in OECD Countries 2003–2011. CESifo DICE Report 3/2011, p.89.
63

European Financial Stability Facility
(EFSF) Background
created by the euro area member states
EFSF is a Luxembourg-registered company owned by the euro area member states
Rating: Aaa (Moody’s); AA+ (Standard & Poor’s)
With a tenure of 3 years
Objective
to safeguard financial stability in Europe by providing financial assistance to euro area member states
Instruments
Provide loans to country in financial difficulties
Intervene in the debt markets in the time of exceptional financial market circumstances and risks to financial stability
Finance recapitalisations of financial institutions through loans to governments
Scale
€780 billion from the euro area member states, lending capacity of €440 billion
Beneficiary (as at 17 July 2012)
Ireland: €17.7 billion
Portugal: €26 billion
Greece: €179.6 billion
Source: European Financial Stability Facility (2012) http://www.efsf.europa.eu/about/index.htm
64

European Financial Stabilisation
Mechanism (EFSM)
Background
created by the EU member states
European Commission is allowed to borrow up to a total of € 60 billion in financial markets on behalf of the EU to the beneficiary member state. The EU budget guarantees the repayment of the bonds.
Rating: EU enjoys an AAA credit rating from major rating agencies
Objective
provides financial assistance to EU Member States in financial difficulties.
Instruments
Provide loans or credit to country in financial difficulties
Request by the member state has to include (i) an assessment of financial needs and (ii) an economic and financial adjustment programme describing the various measures to be taken to restore financial stability
Scale
€60 billion
The cap (by far) for Ireland is € 22.5 billion; for Protugal is €26 billion.
Beneficiary (as at 3 July 2012)
Ireland (totaling to € 20.7 billion over 1.5 year)
Portugal (totaling to € 20.1 billion over 1 year)
Sources: European Commission (2012) http://ec.europa.eu/economy_finance/eu_borrower/efsm/index_en.htm
European Central Bank (Jul 2011) “The European Stability Mechanism”, Monthly Bulletin. Frankfurt: ECB, pp.71-84
65

European Stability Mechanism (ESM)
Background
It is an amendment of the “no bailout to government” clause in the ECB mandate (Article 125)
ESM Treaty was signed in 2 Feb 2012, yet to be ratified by individual euro area member states
A permanent fund to succeed EFSF and EFSM, starting from 1 July 2013 (expected)
ESM will be an intergovernmental organisation. It could invest in financial market, borrow on the capital markets from banks, financial institutions or other institutions. (Article 21 and 22)
Objective
To safeguard the financial stability of the euro area as a whole and of its Member States
Instruments
Loan to ESM member, purchase of bond of an ESM member from the primary and secondary market
Support from ESM is subjected to strict conditionality (incl. macro-economic adjustment programme)
Scale
Capital: €700 billion from euro area member states
Lending Capacity: €500 billion (subjected to revision)
Eligibility (request for assistance)
ESM Member (i.e. governments of the euro area member states)
Beneficiary
“The Board of Governors may decide to grant financial assistance through loans to an ESM Member for the specific purpose of re-capitalising the financial institutions of that ESM Member.” (Article 15(1))
Sources: European Commission (2012) http://ec.europa.eu/economy_finance/eu_borrower/efsm/index_en.htm
European Central Bank (Jul 2011) “The European Stability Mechanism”, Monthly Bulletin. Frankfurt: ECB, pp.71-84
66
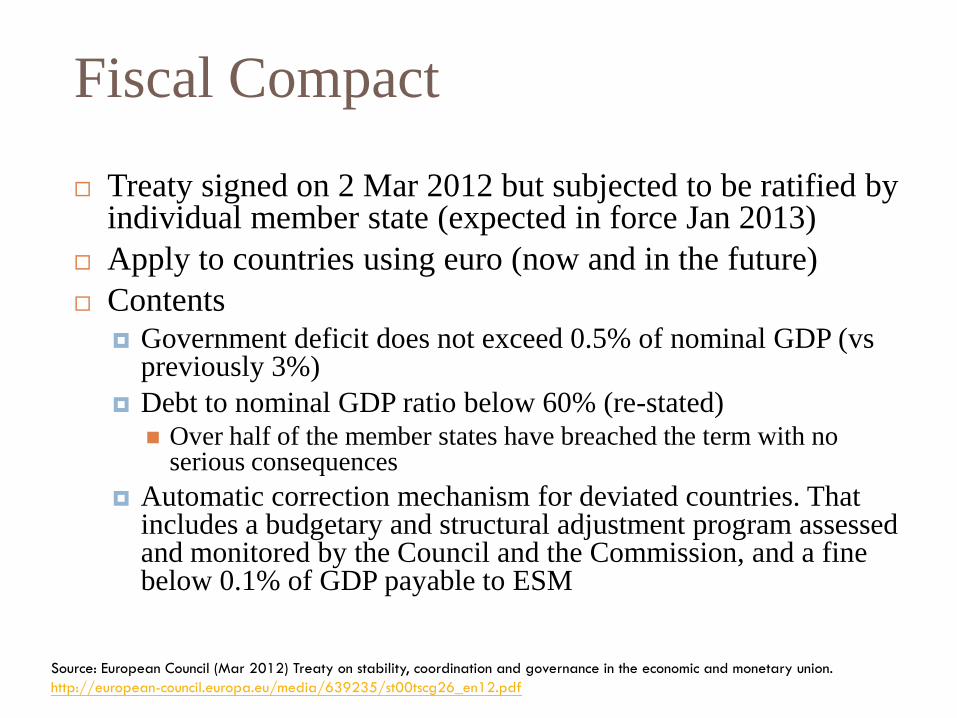
Fiscal Compact
Treaty signed on 2 Mar 2012 but subjected to be ratified by individual member state (expected in force Jan 2013)
Apply to countries using euro (now and in the future)
Contents Government deficit does not exceed 0.5% of nominal GDP (vs
previously 3%)
Debt to nominal GDP ratio below 60% (re-stated) Over half of the member states have breached the term with no
serious consequences
Automatic correction mechanism for deviated countries. That includes a budgetary and structural adjustment program assessed and monitored by the Council and the Commission, and a fine below 0.1% of GDP payable to ESM
Source: European Council (Mar 2012) Treaty on stability, coordination and governance in the economic and monetary union.
http://european-council.europa.eu/media/639235/st00tscg26_en12.pdf
67

Attempts by the ECB
Aim at the liquidity problem - Longer Term
Refinancing Operations (LTROs)
Aim at the sovereign debt problem – Outright
Monetary Transactions (OMTs)
68

Longer Term Refinancing Operations
(LTROs)
Repo auctions
Provide liquidity to the banking sector to fulfill capital requirements
Long been a monetary policy instrument in euro area
Weekly auction (MROs)
Maturity – 1 or 2 week(s)
Monthly auction (LTROs)
Maturity – 3 months
Accounted for 20% of overall liquidity by ECB in 2003
During the crisis
LTRO with 6-month and 36-month maturity (vs 3-month)
Announced 10 May 2010 - 1 round: May 2010 (6-month maturity)
Announced 8 Dec 2011 - 2 rounds: Dec 2011 & Feb 2012 (36-month maturity)
Fixed rate tender with full allotment (vs. variable rate or fixed rate without full allotment)
Sources:
1. Linzert, T., D. Nautz & U. Bindseil (2004) The Longer Term Refinancing Operations of the ECB. ECB Working Paper Series No.
359.
2. ECB (10 May 2010) ECB decides on measures to address severe tensions in financial markets. Press Release
3. ECB (8 Dec 2011) ECB announces measures to support bank lending and money market activity. Press Release
69

Outright Monetary Transactions
(OMTs)
Transactions in secondary sovereign bond markets that aim at safeguarding an appropriate monetary policy transmission and the singleness of the monetary policy.
A necessary condition for Outright Monetary Transactions is strict and effective conditionality attached to an appropriate European Financial Stability Facility/European Stability Mechanism (EFSF/ESM) programme.
Transactions will be focused on the shorter part of the yield curve, and in
particular on sovereign bonds with a maturity of between one and three
years.
No ex ante quantitative limits are set on the size of Outright Monetary
Transactions.
The liquidity created through Outright Monetary Transactions will be fully sterilised.
Sources:
1. ECB Press Release: Technical Features of Outright Monetary Transactions
70

Do the policies work? 71

Debt Level and Rescue Packages
Compared
Overall debt level in the banking sector is still high relative to
the package
Greece Ireland Portugal Spain Italy
As at 2012 Q1 2011 Q4 2012 Q1 2012 Q1 2012 Q1
Gross External Debt 429 1804 420 1970 2074
Of which
Banks (Total) 97 397 138 725 619
Banks (Short-term) 80 255 61 421 212
SMP (Eurozone wide)
CBPP (Eurozone wide)
LTRO (Eurozone wide)
in € billion (USD 1 = EUR 0.829)
~1000
211
40
Debt Level and Rescue Packages Compared
Source: World Bank Quarterly External Debt Statistics (2012)
72

Add-on for ESM
Proposed in the Euro Area Summit in June 2012
ESM may recapitalise banks directly
This is not possible under current EU law as the ECB would need to take additional role on euro-zone wide bank supervision
Implications
Banks rescued
Impact on public debt would be released
Progress
Expected end of 2012 or early 2013
Sources: European Union (29 Jun 2012) Euro Area Summit Statement. http://www.consilium.europa.eu/uedocs/cms_Data/docs/pressdata/en/ec/131359.pdf
Reuters (29 Jun 2012) Spain to switch to direct bank recapitalization when ESM has that capability-official.
73

Euro Exit?
Currently no legal mechanism to leave the euro area, though legally a country could leave the EU according to the Article 50 of the Lisbon Treaty.
To exit euro zone, Greece has to leave the EU first. That involves negotiation of terms agreed by the majority of the EU member states.
Costs of Greece leaving the euro
Economic disaster and chaos for the “new” economy with the “new” currency (e.g. redenomination of assets, devaluation, capital flight, inflation, etc.)
Political cost: future relationship with the EU
Costs of Germany leaving the euro
Lost of its advantages in international trade
Costs of EU kicking Greece out
Outside the euro zone: investor’s confidence to euro and peripheral countries (who’s the next?)
Inside the euro zone: capital flight, bank run
Sources:
1. Chibber, Kabir (9 May 2012) How would Greece leave the euro? BBC News.
2. Taylor, Paul (23 Jul 2012) Analysis: Euro exit talk risks self-fulfilling prophecy. Reuters.
3. Jahncke, Red (10 Jun 2012) Germany, Not Greece, Should Exit the Euro. Bloomberg.
74

Sovereign
Debt Crisis
Banking
Crisis
Growth
Crisis
Policy Dilemma 75

Thank You 76

Convergence Criteria
Convergence Criteria in the EU Treaty Economic and legal preconditions necessary for the adoption of
the euro
Economic convergence Price developments
Fiscal developments
Exchange rate developments
Long term interest rate developments
Legal convergence Independence of the national central bank (NCB)
Legal integration of the NCB into the European System of Central Banks (ESCB)
Source: Scheller, H.K. (2006) The European Central Bank: History, Role and Functions. Revised 2nd ed.
Frankfurt: European Central Bank.
77

Economic Convergence
Price developments
Average rate of inflation does not exceed by more than
1.5 percentage points that of the three best performing
member states in terms of price stability
Fiscal developments
The ratio of government deficit to GDP must not
exceed 3%
The ratio of government debt to GDP must not exceed
60%
78

Economic Convergence
Exchange rate developments
Respected the normal fluctuation margins provided for by the Exchange Rate Mechanism (ERM) of the European Monetary System (EMS) for at least the last two years before the examination without devaluing against the euro
Long-term interest rate developments
An average nominal long-term interest rate (of long-term government bonds) does not exceed by more than 2 percentage points that of the three best performing member states in terms of price stability
79
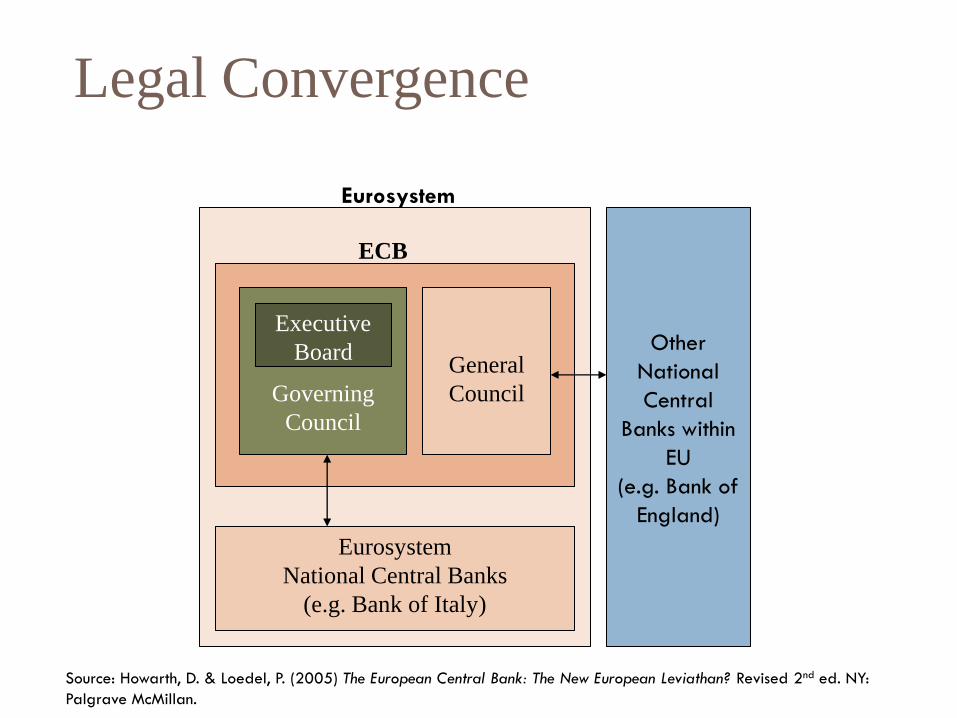
Legal Convergence
Other
National
Central
Banks within
EU
(e.g. Bank of
England)
Eurosystem
National Central Banks
(e.g. Bank of Italy)
General
Council
Eurosystem
ECB
Source: Howarth, D. & Loedel, P. (2005) The European Central Bank: The New European Leviathan? Revised 2nd ed. NY:
Palgrave McMillan.
Governing
Council
Executive
Board
80
Legal Convergence
ECB has 2 core units
Governing Council (similar to the FOMC in the Fed)
Governors from NCBs in euro area
General Council (can’t vote on monetary policy)
Governors from other NCBs in EU
Eliminated when all member states adopt euro
Executive Board is part of the Governing Council
Eurosystem = ECB + NCBs in euro area
ESCB = Eurosystem + Other NCBs in EU
81

Monetary Policy Tools
Standing Facilities ECB Fed
Loan Name Marginal lending facility Discount window
Period Overnight Overnight
Reference
interest rate
MRO rate Fed funds rate
Name of the
Interest rate
Marginal lending rate Discount rate
Operations 100 basis points above the
reference rate
25 to 50 basis points below the
reference rate
Deposit Name Deposit facility None
Operations Overnight facility at rate
100 basis points below the
reference rate
Source: Cecchetti, S.G., & O’Sullivan R. (2003) The European Central Bank and the Federal Reserve. Oxford
Review of Economic Policy 19(1): 30-43.
82

Monetary Policy Tools
Reserve Requirements ECB Fed
Reserve ratio Ratio 0 to 2 per cent 0 to 10 per cent
Type of
account
Checking accounts and
some other short-term
deposits
Accounts with unlimited
checking privileges
Deposit
balances
of …
One-month average Two-week average
Remuneration Average of the refinancing
rate over the period
None
Sources: Cecchetti, S.G., & O’Sullivan R. (2003) The European Central Bank and the Federal Reserve. Oxford
Review of Economic Policy 19(1): 30-43.
ECB (2012) Minimum Reserves. http://www.ecb.int/mopo/implement/mr/html/index.en.html
83