the est{e lauder companies inc. 2013 annual report
TRANSCRIPT
THE EST{E LAUDER COMPANIES INC.
DEF INING p r e s t i g e
B E A U T Y 2013 ANNUAL REPORT


CONTENTS 3 Executive Chairman
7 President and Chief Executive Officer
11 Defining Prestige Beauty
17 The Power of Our Brands
21 Our Commitment to Quality
25 Evolving High-Touch Service
33 Telling Our Story
43 The Diversity of Our Distribution
51 Driving Growth Through Innovation
64 Bringing Prestige Beauty to Consumers Worldwide
72 Traveling With Our Consumer
81 Preserving Our Family Heritage and Values
89 Outlook
94 Portfolio of Brands
104 Board of Directors
106 Executive Officers
107 Financial Highlights
111 Financial Section
181 Management’s Report on Internal Control Over Financial Reporting
182 Report of Independent Registered Public Accounting Firm on Internal Control Over Financial Reporting
183 Report of Independent Registered Public Accounting Firm
184 Stockholder Information

2
3
Dear Fellow Stockholders,
The Estée Lauder Companies had another record year in fiscal 2013,
reaching $10 billion in net sales and achieving a 15 percent operating
margin. Nearly half a billion consumers around the world placed their
trust in the quality of our products and our people, and we expect that
number to grow in the future.
Our Company’s ongoing strong performance proves that our founding
principles — a dedication to quality, a passion for excellence and a deep
respect for our diverse global consumers — resonate strongly in the more
than 150 countries and territories where our products are sold. I want to
express my deepest appreciation for the outstanding leadership of our
President and Chief Executive Officer, Fabrizio Freda, the guidance of
our Board, and the dedication of our incredibly talented global workforce,
all of whom have made our success possible.
EXECUTIVE CHAIRMAN WILLIAM P. LAUDER

4
As our business continues to prosper, it is critical that we continue to
understand and serve the needs of our consumers, engage with the
communities where we live and work, and leverage our collective
talents in every brand, region and function to ensure our sustainable,
profitable future.
In October 2012, we released our fourth Corporate Responsibility report.
We have made meaningful strides in improving the energy efficiency of
our operations and switching to renewable energy when economically
feasible. Between fiscal 2008 and fiscal 2013, we increased the recycling
rate at our manufacturing and distribution sites and we are closer than
ever to our goal of Zero Waste by 2020.
OUR COMPANY’S ONGOING STRONG PERFORMANCE PROVES
THAT OUR FOUNDING PRINCIPLES — A DEDICATION TO QUALITY,
A PASSION FOR EXCELLENCE AND A DEEP RESPECT FOR OUR
DIVERSE GLOBAL CONSUMERS — RESONATE STRONGLY IN THE
MORE THAN 150 COUNTRIES AND TERRITORIES WHERE OUR
PRODUCTS ARE SOLD.
In fiscal 2013, we implemented several global initiatives to enhance
inclusion and diversity awareness. This culture of respect for
our employees and our communities has fueled our long history of
corporate philanthropy.

5
The Breast Cancer Awareness Campaign, founded by my mother,
Mrs. Evelyn H. Lauder, celebrated its 20th anniversary in 2012, recognizing
total contributions of more than $37 million and awareness programs
in more than 70 countries and territories worldwide. Our brands also
play a powerful role in our Corporate Responsibility efforts, and the far-
reaching work of M.A.C AIDS Fund is one of the largest philanthropic
programs in our history. Those efforts are reinforced by our thriving
employee volunteerism.
I am honored to carry the torch of our family’s heritage and values,
and I believe that the power of our brands and people will continue to
drive our strong momentum into 2014.
Sincerely,
William P. Lauder
Executive Chairman

6

7
Dear Fellow Stockholders,
As a high-growth company focused exclusively on Prestige Beauty,
The Estée Lauder Companies is well-positioned for continued global
success. Through our distinctive portfolio of 30 aspirational brands, we
serve the world’s most discerning consumers and retailers, delivering
breakthrough products and High-Touch services through carefully
selected, diverse distribution channels.
Our innovative products and services, combined with impactful, locally
relevant marketing and advertising, drew consumers across the world to
our brand counters, freestanding stores, Travel Retail locations and fast-
growing digital platforms. We continued to focus on innovating and
delivering breakthrough products and services to our consumers around
the world. And thanks to the tremendous leadership and focus of our
40,000 employees, we have executed our strategy with excellence while
staying true to our values.
We have achieved remarkable growth in the four years since we
implemented our transformative strategy. Last year was particularly
exciting as we reached $10 billion in net sales — a historic milestone for
our Company. At the same time, we achieved a 15 percent operating
margin and established new records for net earnings, stock price and
market capitalization, creating exceptional value for our stockholders.
PRESIDENT AND CHIEF EXECUTIVE OFFICER
FABRIZIO FREDA
8
Guided by the wise direction of our Board and the Lauder family, together
with the energy of our talented management team, we believe we
continued to gain share in Prestige Beauty. Our sales climbed five percent
in fiscal 2013, driven by strong performance in local markets and Travel
Retail. We grew sales in both of our heritage markets, the United States
and the United Kingdom, as well as Southern Europe, despite economic
challenges in the region. Our growth also continued to be strong in
China and Latin America, and expansion in other emerging markets drew
in new consumers.
Our strong performance was based, in part, on our creativity-driven,
consumer-inspired innovations such as Estée Lauder Advanced Night
Repair Eye Serum Infusion, Clinique Even Better Eyes Dark Circle Corrector
and La Mer The Moisturizing Soft Cream. We focused our creativity on
bigger launches in all categories, re-energized select “best-sellers,” and
leveraged new technologies and innovations across many of our brands.
In addition, we continued to play to our strengths by evolving our High-
Touch services and formats, and by engaging with consumers worldwide
in new ways.
In addition to our continued success in skin care and makeup, we trust we
are ready to accelerate growth in fragrance. In fiscal 2013, our leading
luxury fragrance brands, Jo Malone London, Tom Ford, as well as our new
Ermenegildo Zegna brand, introduced exciting new products, contributing
to their robust growth and our Company’s overall performance.
I strongly believe that our success is a result of our commitment to product
quality and to creativity and innovation, which is reflected in the quality of
our people, our outstanding brands, and the unique High-Touch services
and experiences we bring to our consumers around the world. We will
continue to enhance and refine our select and diverse distribution

9
strategy, maximize our direct access to consumers through our
e-commerce and m-commerce platforms and invest in new marketing
strategies. Our integrated and disciplined approach to financial matters
also enables us to eliminate non-value-added costs and reinvest in our
growth. In this way, we are poised to continue our sustainable, profitable
growth and set the pace for the industry as a whole.
One of the many advantages to being a truly global company is
the perspective and insight we gain from our international presence.
Our 10-year Strategic Compass provides us with a roadmap to what we
believe will be the biggest and fastest-growing opportunities in the
evolving global Prestige Beauty landscape. We will continue to leverage
the strengths of our exceptional brands and seek inspiration from the
cultures and people we touch around the world, while pursuing growth
opportunities in our heritage markets. We are reaching a larger and more
diverse population by creating products for consumers of all races and
cultures. As affluence increases in emerging markets, we will attract new
consumers worldwide, particularly those in China, the Middle East, Brazil
and Africa.
We will continue to follow the words of our Chairman Emeritus, Leonard A.
Lauder, who says, “Quality always wins.” As I reflect on our excellent
performance in fiscal 2013, I am extremely grateful for the ongoing
support of Leonard Lauder and William P. Lauder. All that we have
achieved in the past four years is rooted in our Company’s rich heritage.
Our values and our success gives me confidence in our future.
Sincerely,
Fabrizio Freda
President and Chief Executive Officer


“EVERY WOMAN CAN BE BEAUTIFUL.” — MRS. EST{E LAUDER
A visionary entrepreneur, Mrs. Estée Lauder knew that Prestige Beauty
is an experience — a chance to enjoy precious moments of “me time,” the
luxurious texture of a hydrating crème, the satisfying “snap” of a well-made
compact as it closes, the elegance of a box tied with grosgrain ribbon.
11
DEF INING p r e s t i g e
B E A U T Y
Estée Lauder The Metallics New Pure Color Collection.
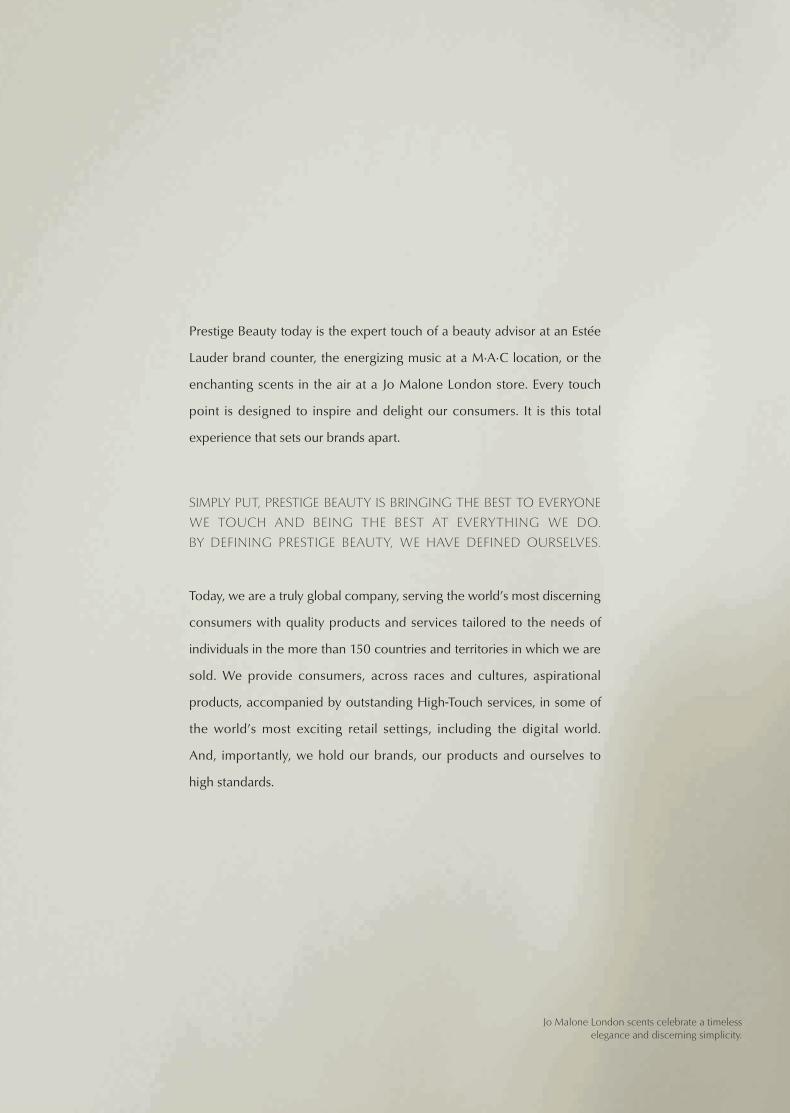
Prestige Beauty today is the expert touch of a beauty advisor at an Estée
Lauder brand counter, the energizing music at a M·A·C location, or the
enchanting scents in the air at a Jo Malone London store. Every touch
point is designed to inspire and delight our consumers. It is this total
experience that sets our brands apart.
SIMPLY PUT, PRESTIGE BEAUTY IS BRINGING THE BEST TO EVERYONE
WE TOUCH AND BEING THE BEST AT EVERYTHING WE DO.
BY DEFINING PRESTIGE BEAUTY, WE HAVE DEFINED OURSELVES.
Today, we are a truly global company, serving the world’s most discerning
consumers with quality products and services tailored to the needs of
individuals in the more than 150 countries and territories in which we are
sold. We provide consumers, across races and cultures, aspirational
products, accompanied by outstanding High-Touch services, in some of
the world’s most exciting retail settings, including the digital world.
And, importantly, we hold our brands, our products and ourselves to
high standards.
Jo Malone London scents celebrate a timeless elegance and discerning simplicity.


14

15
These principles have guided us to become the
largest global company with a core focus on
Prestige Beauty. By creating a complete Prestige
Beauty experience for our diverse consumers,
we enhance the value of our brands and drive
global growth across our Company. Through
our purposeful focus, we maintain a distinct
competitive advantage in the global beauty
industry while staying true to our rich heritage.
Once again, we achieved double-digit per share
earnings growth. Our high-performing products
and services, backed by our effective marketing
and communications, helped us succeed across
brands, regions and product categories. We
increased our presence in emerging markets,
e-commerce and m-commerce, and Travel
Retail. Our commitment to sustainable, profitable
growth is unwavering.
OUR DEDICATION TO PRESTIGE BEAUTY RESULTED IN ANOTHER
RECORD YEAR IN FISCAL 2013. FOR THE FIRST TIME IN OUR HISTORY,
WE EXCEEDED $10 BILLION IN NET SALES.
M·A·C Fashion Sets are perfectly coordinated trios of Lipstick, Lipglass and Nail Lacquer.


17
the power of our brandsThe Estée Lauder Companies has long been recognized in the industry for
its world-class portfolio of diverse Prestige Beauty brands.
Each of our brands possesses a distinct identity and unique method
of connecting with consumers. The Estée Lauder brand’s iconic, high-
performance products embody innovation, sophistication, glamour and
superior quality that appeal to the high-end consumer. Clinique’s
customized approach and quality products — all carefully tested and
formulated with the latest science — attract individuals seeking allergy-
tested, fragrance-free skin care rooted in dermatological heritage. M.A.C
is a go-to brand for consumers and beauty industry professionals alike, a
favorite of makeup artists, models, photographers and journalists around
the world. Driven by insight, creativity and innovation, each of our 30
brands is meticulously cultivated to create a sustainable business.
We are the leading company exclusively dedicated to Prestige Beauty.
In the Americas, our top-tier prestige brands performed especially well in
fiscal 2013, as affluent consumers continued to demonstrate their
commitment to our products.
Clinique Chubby Stick Shadow Tint for Eyes.

18
Sales growth in the United Kingdom, China,
Brazil and the Middle East underscored the
global strength of our brands. M.A.C, Jo Malone
London, La Mer and Tom Ford performed
strongly around the world. As the spending
power of women worldwide increases, our
prestige brands help define a woman’s
aspirations and meet her desires for beautiful,
locally relevant products and experiences.
Guided by our long-term strategy, we are
pursuing an array of high-growth channels and
deepening our relationships with prestige travel
retailers such as DFS Galleria Stores, specialty
multi-brand retailers like Sephora, and department
stores such as Macy’s and Selfridges. We will
continue to develop freestanding stores to
further enhance the equity of our brands and
build our brands in new and exciting markets
such as China and Brazil, by leveraging our
creativity, consumer insights and innovation to
create locally relevant products and services that
our consumers desire.
Smashbox Be Legendary Lipstick is a favorite of studio artists.

19


21
our commitment to qualityOur focus on quality has been at the heart of our brands, our Company
and our definition of Prestige Beauty since our founding in 1946. From the
selection and sourcing of our ingredients, to packaging, advertising and
distribution, we aim for flawless execution at all points of the prestige
journey, an achievement we believe is possible because of the high caliber
and dedication of our people.
Before launching the new Ermenegildo Zegna Essenze fragrance
collection in fiscal 2013, we purchased the harvest of an Italian bergamot
orchard to protect the integrity of the key ingredient that serves as the
basis of the collection. Each year, Origins reviews more than 100 new
ingredients from all over the world. Darphin prides itself on using botanical
ingredients, and designing innovative formulas and regimens based on
professional expertise.
The Italian bergamot orchard that yields the star ingredient of a signature scent in the Ermenegildo Zegna Essenze fragrance collection.

22
We seek to delight our consumers with high-
quality offerings at every touch point of the
prestige experience — from the training of our
beauty advisors to the brushes and tools they
use to apply products. Importantly, we never
allow ourselves to be complacent; we diligently
seek methods to improve the quality of our
products and the prestige experience for
our consumers.
We strongly believe that our high-quality
products and experiences provide us with the
foundation for sustainable profitable growth
and allow us to consistently meet and exceed
the expectations of our consumers. Our ability
to deliver quality results consistently is the basis
of our consumers’ trust in us.
OUR FOCUS ON QUALITY HAS BEEN AT THE HEART OF OUR
BRANDS, OUR COMPANY AND OUR DEFINITION OF PRESTIGE
BEAUTY SINCE OUR FOUNDING IN 1946.
Darphin IDEAL RESOURCE addresses aging skin with botanical-derived ingredients.

23

25
evolving High-Touch serviceInspired by Mrs. Estée Lauder, our outstanding High-Touch services are
central to our mission and set the industry standard for global Prestige
Beauty. Our goal is to provide each consumer with a personalized beauty
experience. We take every opportunity to empower consumers through
product education, provide innovative tools and services tailored to the
individual, and foster a unique bond that goes beyond the simple purchase
of a product.
One of the underlying tenets of our High-Touch philosophy is to provide
consumers with valuable “me time,” a brief respite from their daily routines
that allows them to indulge in a pleasurable environment. “Me time” can
mean discovering the proper skin care regimen at a Clinique counter or
experiencing a luxurious crème for the first time at a La Mer counter.
It might include stopping by an Origins store for a complimentary
mini-facial or creating a custom fragrance gift box with a Jo Malone
London Stylist. Pampering consumers with our unique High-Touch
services draws them to our brands and distinguishes us from competitors.
Renowned makeup artist and founder of her namesake brand, Bobbi Brown embodies the High-Touch philosophy.
26
Our commitment to empower consumers through education fosters a
connection that can last a lifetime. The educational experiences our
brands provide allow consumers to appreciate the depth of our products.
At a Tom Ford counter, consumers can be color-matched for foundation,
learn the proper tools and application techniques of a Tom Ford Bronzer
to enhance their natural glow, or achieve a spectrum of high-definition
effects with a Tom Ford Color Collection. To launch the fragrance Marni,
counter displays featured glass bells over scented fabric. Lifting each bell
allowed consumers to experience the individual scent notes that come
together in the finished fragrance.
CLINIQUE’S EXPERIENCE BAR, A MODERN EVOLUTION IN
PRODUCT SAMPLING AVAILABLE AT SELECT COUNTERS, USES
A VARIETY OF SENSORIAL TRIGGERS TO CAPTIVATE AND ENGAGE
CONSUMERS WHILE SIMULTANEOUSLY EDUCATING THEM ON
TREATMENT OFFERINGS.
Bobbi Brown has crystallized this philosophy in “Bobbi’s Makeup
Lessons,” where consumers can choose from a menu of up to eight
lessons and schedule one-on-one sessions with professional Makeup
Artists to create new looks. Lessons range from a five-minute “Instant
Pretty” touch up to a 45-minute “Pretty Powerful” session. In the United
Kingdom, where the service was launched, nearly 60 percent of Bobbi
Brown makeup sales are linked to these lessons.
Origins Smarty Plants CC Cream is an antioxidant infused color corrector.


The Aveda mobile app is a personal style advisor, community bulletin board and trend tracker all in one.
29
Recognizing that in today’s world, the
High-Touch experience must go beyond the
beauty counter, we innovate ways to strengthen
our connection with consumers. Many of our
brands, including Estée Lauder, Bumble and
bumble, and M.A.C, engage consumers through
Pinterest, Instagram, Weibo and other fast-
growing digital and mobile platforms.
Aveda’s global network of beauty professionals
uses social networking to build awareness
around the brand’s core mission to care for the
environment. In April 2013, Aveda organized
a Global Cut-A-Thon, with the aim to set a
Guinness World Record for most funds raised by
haircuts in a 24-hour period, to further support
its Earth Month activities. In fiscal 2013, the
brand also launched a blog, Living Aveda,
inviting guests and hair professionals to
“experience the brand from the inside out.”
Living Aveda offers readers a unique glimpse
behind the scenes with expert advice from
Aveda’s team of Global Artists, insider stories
and facts about botanical-derived ingredients for
products like Damage Remedy Intensive
Restructuring Treatment.
The Estée Lauder brand introduced Shade
Finder on its website, to help consumers choose
the proper foundation online. This interactive
tool walks consumers through a four-step
process of choosing the right shade of
foundation, ultimately suggesting several
“perfect match” products.
30
To connect even further with consumers in a non-traditional, creative way,
Bobbi Brown launched a dedicated brand page on Pinterest, where many
of the brand’s fans spend time. The page launched with colorful photos —
many taken by Bobbi herself — inspired by the brand’s new Neons &
Nudes color collection. Pinned photos included items that inspired Bobbi
to create the collection, different looks to achieve, face charts, and quotes
from Bobbi that offer brand devotees fresh, engaging, educational and
personalized content.
FROM ITS ICONIC CRÈME AND BLACK BOX, TO ITS UNIQUELY
LUXURIOUS SCENTS, JO MALONE LONDON UNDERSTANDS THAT
FRAGRANCE IS A PERSONAL STATEMENT. CONSUMERS COLLABORATE
WITH JO MALONE LONDON STYLISTS TO PERSONALIZE THEIR
SCENT EXPERIENCE — TO BE WORN SOLO OR LAYERED FOR TRULY
INDIVIDUALIZED EFFECTS.
Consumers can create a custom fragrance gift box with a Jo Malone London Stylist.


EFFORTLESS BEAUTY
INTRODUCING
© A
ERIN
Bea
uty,
DIS
T.

33
From the moment a consumer engages with one
of our brands — by visiting a counter, viewing an
advertisement, sampling a product or interacting
with us on social media — a connection is born.
We nurture this connection and stay with her
through the length of her prestige journey,
ultimately fostering her long-term loyalty to
our brands.
What makes our brands desirable and distinctive
are the details surrounding our craftsmanship,
our heritage and our innovation. We devote
extensive resources to communicating what
goes into our aspirational brands and products.
Over the past three years, we have increased
our ad spend by more than 50 percent. Every
brand possesses a unique story, and we are
master storytellers.
telling our story
AERIN Beauty draws on Aerin Lauder’s life, design point of view and beauty philosophy.
Today’s consumer craves information more than ever before. She wants to
know our brand ambassadors and the stories behind them. Fans of AERIN
Beauty want to learn more about the brand’s iconic namesake and how to
master her signature look of effortless beauty. AERIN Beauty draws
directly from Aerin Lauder’s life, her design point of view and philosophy
on beauty that taps into a woman’s desire to feel beautiful, chic, confident
and relaxed. To foster the bond with consumers, AERIN Beauty posts
videos and content of Aerin at home and at work, managing her life and
her brand. Information on how to achieve modern yet classic looks
through the use of her products such as the AERIN ESSENTIALS
COLLECTION, which launched in Fall 2012, is also communicated
through a variety of platforms like Facebook, the brand website and
at counter.
THE ICONIC BEAUTIFUL FRAGRANCE BY EST{E LAUDER IS A TENDER
BOUQUET OF L IL IES , ROSES, MARIGOLDS AND ORANGE
BLOSSOMS, ALL WARMED WITH A RICH, WOODY BASE AND
BRIGHTENED WITH A TOUCH OF CITRUS TO EVOKE ROMANCE,
TENDERNESS AND MEMORIES.
While effective storytelling has always been a key part of our heritage
and strategy, how we communicate with our consumers has evolved.
Today, we connect with them across many diverse and dynamic touch
points as part of a 360° marketing strategy. In order to garner maximum
visibility, the launch of Bobbi Brown Long-Wear Even Finish Compact
Foundation simultaneously engaged consumers across print and digital
34
Jo Malone London Blackberry & Bay Cologne conjures up childhood memories of blackberry picking with a vibrant and verdant fragrance.


Jew
elry
by
Fred
Lei
ghto
n e
stee
laud
er.c
om ©
201
2 Es
tée
Laud
er In
c.
The iconic Beautiful fragrance by Estée Lauder evokes romance, tenderness and memories.


39
OUR EFFECTIVE STORYTELLING NOT ONLY INCREASES LOYALTY
AMONG CURRENT DEVOTEES, BUT ALSO FACILITATES SPREADING
THE WORD TO OTHERS AND DRAWING NEW CONSUMERS TO
OUR BRANDS.
media platforms. The launch itself was a triple
initiative: unveiling a new product, introducing
Katie Holmes as the brand’s first celebrity
spokesperson, and revealing a new tagline:
“Confidence is Everything, But a Little Makeup
Can’t Hurt.”
When Smashbox launched its new “Love Me”
collection, its consumers told the story. The
brand introduced a Facebook app during the
entertainment industry awards season in Los
Angeles. The app allowed users to create their
own digital “Love Me” billboard, which would
then go live at a specified time at the iconic
Roosevelt Hotel on Hollywood Boulevard.
In addition, consumers’ billboards were live-
streamed on the brand’s webpage. Bumble and
bumble launched a mobile app that allows users
to play games involving products and hairstyles,
winning reward points to be used toward
purchases on the brand’s website.
Katie Holmes is named the first celebrity spokesperson for Bobbi Brown.
40
Our effective storytelling not only increases loyalty among current
devotees, but also facilitates spreading the word to others and drawing
new consumers to our brands. M.A.C is currently the number one prestige
makeup brand on Facebook, with approximately six million “Likes.”
On Twitter, 52 M.A.C Makeup Artists tweet in 10 languages. Origins uses
its Facebook page as an education tool, raising awareness of its brand,
products, promotions and services by offering information and linking
back to the brand’s website for deeper storytelling. The Estée Lauder
brand is very proud to have been recognized in the L2 Genius Rankings
for China and globally in Fall 2012, highlighting its sophisticated digital
influencer partnerships and best-in-class website.
M·A·C Punk Couture is an online-exclusive collection of intense, deep colors that capture Punk’s
rebel spirit and revolutionary impact on fashion.


43
the diversity of our distributionThe strength and diversity of our selective
distribution stands as a pillar of our success,
allowing us to build a unique presence in the
marketplace. A compelling shopping experience
is an important element in communicating the
essence of our Prestige Beauty brands — and for
motivating consumers to purchase our products.
Thanks largely to the vision and boldness of our
Chairman Emeritus, Leonard A. Lauder, we
continue to pursue a selective distribution
strategy that defines us.
On a global basis, about half of our sales are to
department stores, such as Harvey Nichols and
Lane Crawford. We understand how to navigate
this vibrant and important channel to grow our
business, enhancing brand equity and forging
lasting relationships with our consumers.
PRESTIGE DEPARTMENT STORES REMAIN A CORNERSTONE OF
OUR DISTRIBUTION.
The M.A.C flagship store in Lagos, Nigeria.

44
To cater to our global, multi-ethnic and traveling
consumers, in fiscal 2013 Clinique expanded its
signature “Service As You Like It” experience
offered at counter by increasing the number
of languages available on its innovative iPad
Skin Care Diagnostic Tool to 28 languages —
a 27 percent increase compared to the prior
fiscal year. Clinique also launched this High-
Touch, multi-layer service tool at leading
counters in Australia, Canada, Chile, Korea
and Spain.
At the same time, changing consumer behavior
and the growth of our brands have presented us
with new and exciting opportunities. In fiscal
2013, we strengthened our distribution in the
United States and around the world through
specialty multi-brand retailers. Global powerhouse
Sephora is a valuable partner for a number of
our brands, including Estée Lauder, Clinique,
Origins, Smashbox, Bumble and bumble and
Bobbi Brown.
THE STRENGTH AND DIVERSITY OF OUR SELECTIVE DISTRIBUTION
STANDS AS A PILLAR OF OUR SUCCESS, ALLOWING US TO BUILD
A UNIQUE PRESENCE IN THE MARKETPLACE.
The Aveda Experience Center in the Minneapolis-St. Paul International Airport connects consumers with holistic beauty,
wellness, education and environmental awareness.


47
Freestanding stores also create important opportunities for expansion in
markets like Brazil, India and Africa, where there is currently a lack of
established prestige distribution channels. Freestanding stores present a
unique opportunity to bring a brand to life through their location,
atmosphere, energy, music, merchandising and services. M.A.C stores, for
example, provide an energetic “backstage” atmosphere for M.A.C
Makeup Artists to interact with consumers. The brand opened two
flagship stores in fiscal 2013, on Fifth Avenue in New York City and on the
Champs-Élysées in Paris. The Fifth Avenue store creates an atmosphere
of understated and chic refinement through its interior design and
architecture. The environment is purposefully light, reflecting the elegance
of its Fifth Avenue surroundings, and provides an on-brand counterpoint
to the drama of its Times Square location. The Paris store features
a futuristic store design with cascades of black mirrors and color-saturated
LED animation, a complement to M.A.C’s fashion-forward, theatrical
brand identity.
As we explore opportunities to open freestanding stores, we consider
both the character of the region and the personality of the brand. For
example, part of Aveda’s expansion in Japan was through innovative
“microstores,” which are approximately 400-450 square feet. These
microstores allowed Aveda to select prestigious, high-traffic locations
Backstage with Bumble and bumble stylist, J. Houle, at the Hervé Léger show.

48
where space is constrained. While more than
30 Bobbi Brown stores maintain a consistent
design theme, each one is subtly tailored to the
local market. In the United Arab Emirates, Bobbi
Brown store windows are customized with
sentiments such as “Bobbi Loves Dubai,” while
a store in Moscow, Russia, features a fireplace to
warm consumers from the cold.
Meanwhile, our e-commerce and m-commerce
business continued their robust growth.
Globally, we inspired terrific sales from our
brand sites, as well as retailer sites. We sell
through more than 180 e-commerce and
m-commerce sites in 20 markets and are rapidly
expanding our brands’ mobile capabilities as
sales from these devices continue to rise. Fifteen
of our brands sell directly to consumers online
through our own e-commerce sites and select
m-commerce sites in 20 countries. In fiscal
2013, our online business in the Americas grew
double-digits. As a leader in online Prestige
Beauty, we invest our resources to improve our
brands’ High-Touch services, marketing tools
and technology across these platforms.
The Bobbi Brown flagship store at the Dubai Mall in the United Arab Emirates boasts a private events space, where consumers
may receive one-on-one makeup lessons in a more intimate setting.


51
driving growth through innovationWe believe that the Prestige Beauty experience must involve elements
that feel fresh and surprising — a chance to try a new skin care product, an
unexpected High-Touch service or a new shade of lipstick. Our vibrant
relationships with external partners, including labs, universities and
suppliers, help us develop innovative offerings that continue to delight
consumers. Each year we introduce new products and services, improve
and reformulate others, and launch scores of new color stories, among
other initiatives. These innovations create buzz, drive traffic to stores and
keep consumers coming back for more.
In fiscal 2013, innovation across all brands and regions contributed to
our overall growth. Sixteen percent of our sales came from innovations
and new products. One of our greatest strengths is our ability to give
consumers around the world the products and services they crave, even
before they know they want or need them. Clinique followed its highly
successful BB cream with the introduction of Moisture Surge CC Cream,
a color-correcting treatment that uses new technology to address a number
of skin concerns. And true to its dermatological heritage, the brand
launched A Different Nail Enamel for women with sensitive skin.
Origins GinZing moisturizer harnesses the power of energy-boosting ingredients such as ginseng and coffee bean.

Clinique A Different Nail Enamel is formulated especially for sensitive skin.


54
M.A.C’S WEBSITE DREW 18 MILLION VISITORS IN ONE DAY WITH THE
EXCLUSIVE ONLINE LAUNCH OF RIRI WOO LIPSTICK, PART OF
THE RIRI HEARTS M.A.C COLLECTION FORMED IN COLLABORATION
WITH GLOBAL POP SUPERSTAR, RIHANNA.
La Mer took the nutrient-rich Miracle Broth™,
the essential ingredient of its Crème de la Mer
product line, and launched its blockbuster The
Moisturizing Soft Cream, which offers renewal
results of the original crème in a supple new
texture. This launch, the biggest in the brand’s
history, has brought a new generation
of global consumers to the La Mer franchise.
The product itself has received dozens of
awards, including the 2013 Marie Claire Prix
d’Excellence de la Beauté. This highly successful
launch serves as a prime example of industry-
leading innovation combined with the strong
execution for which The Estée Lauder Companies
is known.
Meanwhile, Ojon continues to reinvent and
innovate in the restorative oil sub-category of
hair care. The brand was recognized for its multi-
benefit Rare Blend Oil Total Hair Therapy
product, which won the Best Hair Care Product
award at the 2013 Cosmetic Executive Women
Beauty Insider Choice Awards.
M·A·C collaborated with superstar Rihanna to launch the exclusive RiRi Hearts The M.A.C collection.


We build on the power of our existing product franchises with cutting-
edge insights and technologies. For us, innovation is a continuous process
that is creativity-driven and consumer-inspired. In fiscal 2013, the Estée
Lauder brand introduced Advanced Night Repair Eye Serum Infusion
formulated specifically for eyes, as a part of its highly successful Advanced
Night Repair franchise. The brand also reformulated and re-launched its
Advanced Time Zone line of gel and crème moisturizers to great success.
Clinique leveraged the tremendous popularity of its Even Better products
by launching Even Better Eyes Dark Circle Corrector. This breakthrough
product performed extremely well around the globe, and received
multiple international awards including Elle UK’s Best Beauty Product of
2012 and Marie Claire Australia Prix d’Excellence. Bumble and bumble
followed its cult favorite, Surf Spray, coveted by consumers seeking
sexy, beachy waves, with Surf Foam Wash Shampoo and Surf Creme
Rinse Conditioner.
Bumble and bumble introduced Surf Foam Wash Shampoo and Surf Creme Rinse Conditioner to complement cult favorite, Surf Spray.


We strive to delight our consumers by creating exciting and unexpected
products and experiences. Jo Malone London exemplified this with its
debut of Sugar & Spice, a limited-edition collection of fragrances inspired
by English desserts, such as Lemon Tart and Redcurrant & Cream.
Smashbox launched the world’s first social-media integrated photo booth
in one of the longest-standing Smashbox counters in Ireland. Drawing on
its heritage of the iconic photography studio where the brand was born,
Smashbox Makeup Artists provided consumers with glamorous mini-
makeovers and then invited guests into the “socially-enabled” photo
booth. Guests could immediately share their snapshots with friends
digitally on Twitter, Facebook or email, and print out their photos
as keepsakes.
Jo Malone London Sugar & Spice limited edition collection is inspired by English desserts such as Lemon Tart and Redcurrant & Cream.
60
Consumer desire is a primary inspiration for ideas, launches and product
innovation. Lab Series Skincare for Men connects with its primarily male
consumers by using language that resonates — such as describing skin
complexion in ads as “shiny” instead of “oily,” and referring to toners as
“skin solutions.” Using terminology that speaks to the core consumer has
contributed to the success of Lab Series’ best-selling Oil Control line of
products. Similarly, La Mer responded to its consumers’ desire to achieve
a sun-kissed look. In Spring 2013, the brand launched Soleil de La Mer,
adding both in-sun SPF protection and sunless tanning properties to its
luxurious products.
Our brands are trendsetters that also drive growth through innovative
creative partnerships with fashion designers, artists and musicians, as well
as movie, TV and theater productions. Across brands, we participate in
top fashion shows around the world each year. M.A.C continued to
deepen its ties with pop culture, participating in 460 films, including
The Great Gatsby, and 350 plays, including Cyndi Lauper’s Tony Award-
winning hit, Kinky Boots.
Lab Series Pro LS All-In-One Face Treatment provides four skin care benefits in one formula.


63
Our collaborations with some of the world’s top fashion designers and
brands include Tom Ford, Donna Karan New York, Michael Kors, Coach,
Ermenegildo Zegna and Marni. To tap into a modern British luxury
aesthetic, Jo Malone London invited fashion editor Charlotte Stockdale
to serve as the brand’s style editor. As one of her first initiatives,
Ms. Stockdale designed a limited-edition bottle for her favorite Jo Malone
London fragrance, Red Roses, which looks as if it were dipped in neon
pink paint. We believe creative partnerships such as these will help sustain
our growth for many years to come.
Our approach to innovation is balanced across brands, regions and
functions, and we are extremely excited about the new technologies,
formulations and products we will launch in the future.
The Michael Kors collection features fragrance, color cosmetics and body care.
64
bringing Prestige Beauty to consumers worldwideThe desire for Prestige Beauty transcends
geographic borders. Our products are sold in
more than 150 countries and territories, and
in fiscal 2013 international markets accounted
for more than 60 percent of our business.
We continue to refine our global strategy,
focusing on the most promising categories and
regions for growth, and introducing products
and services that are relevant to the specific
tastes and needs of each local market, while
staying true to the identity of our brands.
Asia/Pacific is one of our fastest-growing
regions, with China standing out as one of our
greatest opportunities. We recently celebrated
the 10th anniversary of our affiliate in China and,
in 2013, China represented our third-largest
country in net sales overall, behind the United
States and the United Kingdom.
M·A·C celebrated the Lunar New Year with a Year of the Snake palette of vibrant shades and shimmering finishes.


67
Chinese consumers are very focused on skin
care, which represents a key pillar of strength
for us. We continue to capture consumers there
by entering new cities, opening more doors and
expanding our reach through our e-commerce
and m-commerce.
We recognize that success in the Chinese
market depends largely on investment in people,
innovation and local relevance of our products.
We are extremely proud of the successful
execution by our team in this regard. The Estée
Lauder brand continues to be the number one
Prestige Beauty brand in its distribution in China.
Clinique was among the fastest-growing brands
at retail in key markets around the globe. La Mer
also achieved notable results by focusing on skin
care products and service rituals that resonate
with Chinese consumers, both those in China
and Chinese residents traveling abroad. Today,
we estimate that one-third of La Mer’s sales
come from Chinese consumers, a testimony to
their love of the brand.
La Mer skin care products and service rituals resonate with the Chinese consumer.

Shades for Africa. Guaranteed.Even Better Makeup SPF 15Makeup that virtually erases the need for makeup.
69
Drawing on the full capabilities of our Asia Skin Care Institute in Shanghai,
we launched Osiao in fiscal 2013, a skin care line specifically designed
for Asian consumers. Osiao represents a natural evolution of our business
in China from a company that offers brands created and manufactured in
North America and Europe, to one that also offers a truly Asian experience.
Osiao’s specialized formulas contain Chinese plants like ginseng, Asiatic
pennywort herb and ganoderma — all designed to meet the specific skin
care needs of Asian consumers. Osiao counters emulate traditional
apothecaries. As part of the Osiao experience, consumers are offered
diagnostic consultations inspired by the deep ancestral learnings of
Traditional Chinese Medicine. Osiao debuted exclusively in Hong Kong
with Lane Crawford at the Canton Road and Times Square locations.
In addition to China, we have identified opportunities in other countries
where we can build long-term relationships to serve a growing consumer
base. For example, Darphin’s heritage as a professional Parisian skin care
brand resonated with consumers across markets, leading to strong
performance in Canada, Turkey and Germany. M.A.C expanded its
presence in Sub-Saharan Africa this fiscal year with the opening of
freestanding stores in Nigeria, Botswana and Zambia.
Clinique Even Better Makeup SPF 15 offers shades matched for consumers in Africa.
70
As a multinational company, we rely on our ability to bring globally
appealing and locally relevant products and services to consumers of all
ethnicities, cultures and regions. This often involves creating new products
or reinterpreting existing ones to meet the specific needs of local markets.
Bobbi Brown recognized that its highly successful Creamy Concealer Kit,
an iconic hero product in the United States, could address under-eye
circles in Asian markets and launched it there in fiscal 2013. And
Jo Malone London Saffron Cologne, developed for the Middle East
consumer, gained broad acceptance around the world after launching in
the Middle East, where intense fragrances are favored.
Locally relevant advertising and promotions have proven an effective tool
in attracting consumers to our brands. In fiscal 2013, Clinique opened
the Clinique Chubby Lounge in Seoul, Korea. This interactive pop-up shop
drew an appearance by top Korean actress, Park Bo Young, creating buzz
for Clinique’s popular line of Chubby Stick Moisturizing Lip Colour Balm.
Television, print and digital advertising for Estée Lauder Double Wear
Makeup tailored to Japanese consumers with the tagline “Porcelain
Perfection. Non-Stop Wear.“ This locally relevant advertising drove
consumers to stores and became the catalyst for sales growth across the
brand in Japan.
Estée Lauder Amber Mystique is a fragrance tailored to meet the discerning tastes of consumers in the Middle East.

Introducing
este
elau
der.
com
©
201
2 Es
tée
Laud
er In
c.

72
traveling with our consumerAs a global leader in Prestige Beauty, we set the bar for beauty retailing
excellence in airports around the world and continue to see robust growth
in the Travel Retail channel, where we continue to gain share. We currently
hold number one global positions in prestige skin care and makeup,
a testament to the relevance of our brands among traveling consumers.
We continue to see significant growth opportunities in the Travel Retail
channel, as well as in the local markets to which consumers travel.
An estimated one billion travelers took international flights in 2012 and we
expect traffic will continue to grow. By exposing world travelers to our
innovative products, cutting-edge marketing and High-Touch services,
we are increasing sales and building equity for our brands.
We invent new ways to provide High-Touch services adapted to the
compressed schedules and preferences of traveling consumers, such as
relaxing massage treatments and makeup demonstrations. We set the
standard with world-class merchandising, talented people and our
Travelers encountered an expansive ad for Clinique Even Better Clinical Dark Spot Corrector at the Copenhagen Airport.


75
beautiful store designs, which are complemented
frequently by renovated airport settings.
Recognizing the importance of creating an
environment that welcomes all consumers, we
continue to embrace a diversity of languages,
both with our merchandising and our beauty
consultants, advisors and artists, so we can greet
consumers in the languages they know best.
Our Travel Retail sales were strong around the
world, with increased performance in Europe,
the Middle East and Africa. Consumers who live
in emerging markets have helped fuel our
growth in recent years, and they also make
prestige purchases when they are traveling.
Travel Retail sales continued to be strong
in Asia/Pacific, driven largely by rapid growth in
China. Our strength in skin care and makeup
positions us well to take advantage of this
growth. As incomes in China rise and the middle
class expands, growing numbers of Chinese
consumers are taking to the sky. Nearly 42 million
Chinese now travel internationally each year,
a number that is expected to more than double
in coming years.
Origins Make A Difference Plus+ is a rejuvenating moisturizer fortified with rose of Jericho, lychee and watermelon.

este
elau
der.c
om
© 2
012
Esté
e La
uder
Inc.
Estée Lauder introduced the new Advanced Night Repair Eye Serum Infusion
to the successful Advanced Night Repair line.

NUEVO
Ahora, la fuente de juventud para sus ojos.
Nuevo. AdvancedNight RepairSuero Restaurador Contorno de OjosLos hechos: Cada día la polución puede dañar la delicada zona del contorno de ojos y acelerar el envejecimiento visible.
Ahora, descubra este nuevo suero súper efi caz con tecnología anti-polución que ayuda signifi cativamente a inhibir el daño producido por el ozono.* Para unos ojos de aspecto más bonito, luminoso y joven.
Testado y probado: Reduce de forma espectacularel aspecto de finas líneas, arrugas,ojeras, sequedad y bolsas.
Inspirado en las investigaciones sobre el ADN. 20 Patentes Internacionales.
*Pruebas in vitro.

78
Our sales of skin care and makeup in the Travel Retail channel were strong
in fiscal 2013. The Estée Lauder brand’s Advanced Night Repair and
Nutritious lines did particularly well, while La Mer products and our
upscale fragrances were strong performers.
In fiscal 2013, we enriched our marketing and advertising in highly
trafficked airports around the world to develop a more powerful and
compelling presence, knowing that our consumers shop outside their
home countries. Travelers to Copenhagen Airport encountered an
expansive Clinique billboard for Even Better Makeup, and signage near
gates in New York’s John F. Kennedy International Airport changed
languages based on arriving and departing flights. We believe that
through our marketing and advertising, a greater number of travelers will
become our consumers, leading to incremental sales.
DKNY Be Delicious captures a refreshing scent in an iconic apple-shaped bottle.


81
WE TAKE PRIDE IN CREATING A WORK ENVIRONMENT THAT
ENCOURAGES DIALOGUE AND NURTURES THE TALENT AND
INSIGHTS OF OUR EMPLOYEES AT ALL LEVELS.
While we continue on our path to sustainable,
profitable growth, we are guided each day by
our deep-seated family values and strengths —
trust, honesty, respect for individuals, and passion
for excellence in all we do. This philosophy leads
our Corporate Responsibility initiatives.
In October 2012, under the leadership of our
Executive Chairman, William P. Lauder, we
published our fourth Corporate Responsibility
report, which outlines our ongoing commitment
to our people and the communities in which
we live and work.
preserving our family heritage and values
The Breast Cancer Awareness Campaign celebrated its 20th anniversary in 2012.
82
We are deeply committed to leading by example and fostering a culture
that supports inclusion and leadership from every level of our global
organization. We take pride in creating a work environment that
encourages dialogue and nurtures the talent and insights of our employees
at all levels. We understand that, in addition to encouraging people to
lead from every chair, we must also learn from every chair.
In 2013, we launched the first global initiative of our three-year Global
Inclusion and Diversity Action Plan. Under this plan, we will develop the
next generation of our leaders, driving creativity and innovation through
a globally inclusive and diverse culture.
Deepening our commitment to sustainability, we expanded our efforts
to reduce our impact throughout our operations by conserving energy
and cutting greenhouse gas emissions, recycling and reusing many
of our resources, and exploring new ways to reduce water use in our
factory processes.
We have worked to support the communities in which we operate;
in fiscal 2013, we advanced in our priority areas — women’s health,
women’s empowerment, education, health and human services, and
emergency disaster relief.
Our largest corporate-wide philanthropic initiative to date is The Estée
Lauder Companies’ Breast Cancer Awareness (BCA) Campaign, which
was created by Mrs. Evelyn H. Lauder in 1992. The BCA Campaign’s goal
to defeat breast cancer through education and medical research stands
strong and is supported by our employees and our brands. We recently
celebrated the 20th anniversary of The BCA Campaign, recognizing total
contributions of more than $37 million and awareness programs in more
than 70 countries and territories worldwide.
Tourmaline is a responsibly sourced crystal boron silicate mineral used by Aveda.


85
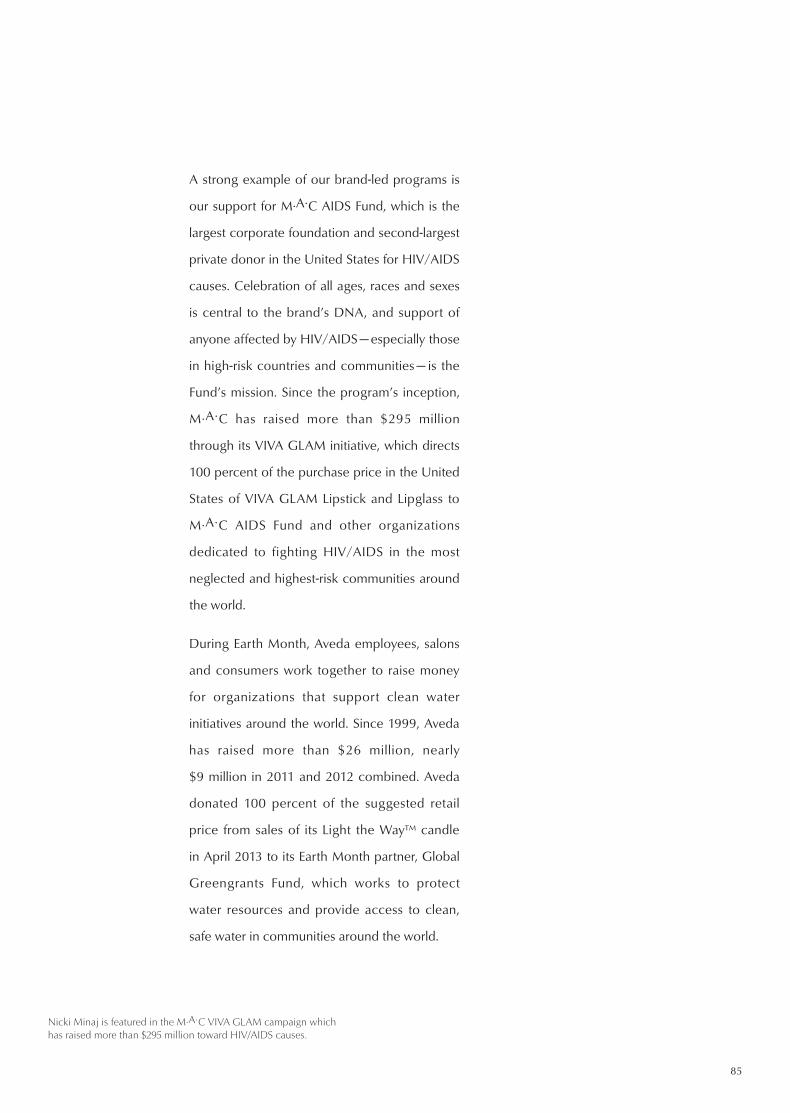
A strong example of our brand-led programs is
our support for M.A.C AIDS Fund, which is the
largest corporate foundation and second-largest
private donor in the United States for HIV/AIDS
causes. Celebration of all ages, races and sexes
is central to the brand’s DNA, and support of
anyone affected by HIV/AIDS — especially those
in high-risk countries and communities — is the
Fund’s mission. Since the program’s inception,
M.A.C has raised more than $295 million
through its VIVA GLAM initiative, which directs
100 percent of the purchase price in the United
States of VIVA GLAM Lipstick and Lipglass to
M.A.C AIDS Fund and other organizations
dedicated to fighting HIV/AIDS in the most
neglected and highest-risk communities around
the world.
During Earth Month, Aveda employees, salons
and consumers work together to raise money
for organizations that support clean water
initiatives around the world. Since 1999, Aveda
has raised more than $26 million, nearly
$9 million in 2011 and 2012 combined. Aveda
donated 100 percent of the suggested retail
price from sales of its Light the Way™ candle
in April 2013 to its Earth Month partner, Global
Greengrants Fund, which works to protect
water resources and provide access to clean,
safe water in communities around the world.
Nicki Minaj is featured in the M.A.C VIVA GLAM campaign which has raised more than $295 million toward HIV/AIDS causes.

86
This year, to celebrate World Oceans Day, La Mer created a limited-
edition Crème de La Mer jar and donated $200,000 to Oceana, the
world’s largest international ocean advocacy organization. La Mer teamed
with renowned oceanographer, Dr. Silvia Earle, and National Geographic
Society to create an impactful film for World Oceans Day.
Jo Malone London, which uses gardens as an inspiration for many of its
scents, launched a program that supports community gardening projects
in urban areas. The brand regenerated the “Old English Garden” in
Battersea Park, London, and has announced plans to revitaize a
community garden in Brooklyn in collaboration with Bette Midler’s
New York Restoration Project, a nonprofit organization dedicated to
transforming open space in underserved communities.
Further information on our Corporate Responsibility activities can be
found in our Corporate Responsibility report at www.elcompanies.com.
Aveda Invati’s breakthrough formula addresses hair loss, naturally.

87

88

89
OUTLOOKEvery year, we refine our strategy to target the best opportunities for
profitable growth, emphasizing the most promising products and
categories and examining different markets and channels that will help us
achieve our goals. We will continue our strong focus on emerging-market
consumers, high-growth distribution channels, exemplary innovation and
the creation of locally relevant products and services.
As the largest beauty company focused exclusively on global Prestige
Beauty, we believe we are well-positioned to take advantage of the
underlying dynamics supporting our overall growth. We expect that
Prestige Beauty will continue to grow approximately three to four percent
over the next several years; it is our goal to grow at least one percent faster
than Prestige Beauty annually.
M·A·C Mineralize Rich Lipstick contains 77-Mineral Moist Complex to nourish lips with a luxurious, lightweight formula. The larger lipstick bullet delivers fuller, sleeker application.

90
While Prestige Beauty remains robust, it
currently represents only 30 percent of the
global beauty market. This means we have an
enormous opportunity to convert millions of
new consumers from mass channels and brands.
Thanks to our outstanding new products,
effective advertising and High-Touch services,
we once again posted sales growth that we
believe was greater than global Prestige Beauty,
and achieved strong across-the-board sales
gains in each of our geographic regions and
major product categories. We expect our strong
momentum to extend into fiscal 2014.
We are positioning ourselves to gain share in the
fastest-growing areas in Prestige Beauty. Several
demographic trends support our growth
outlook. Emerging markets, for example, where
more women are entering the middle class and
enjoying higher disposable incomes, present a
great opportunity for us. We have had robust
sales gains in many of these markets, including
China and the Middle East, and we expect this to
continue in the next fiscal year. At the same
time, the world’s population is aging, which
increases the desire for many of our anti-aging
skin care products.
Marni introduced its first fragrance in Spring 2013.


93
As we expand our global presence, we continue to focus on the most
dynamic distribution channels, including department stores, freestanding
stores, specialty multi-brand retailers and Travel Retail, which helps build
and reinforce the equity of our brands.
Consistent with our strategy, we intend to support our business with
targeted investments aimed at enhancing the global reach of our brands
and further building long-term brand equity. Finally, we expect to benefit
from the investments we’ve made in capabilities and technology.
Meanwhile, we will continue to refine our definition of Prestige Beauty,
and remain steadfast in our commitment to quality in all aspects of our
business. We will innovate ways to touch consumers across all cultures at
every stage of their shopping experience. We will preserve our rich family
heritage, even as we embrace rapid change and constant innovation, and
will continue to treat our consumers, employees and business partners
with the greatest respect.
By staying true to ourselves, we believe we have built a growth model that
will sustain us for many years to come.
Tom Ford brings his flawless signature style to a bold fragrance and beauty collection.

94
Estée Lauder was launched in 1946 and is the flagship brand of The Estée
Lauder Companies Inc. Estée Lauder products are sold in more than
150 countries and territories. They are technologically advanced,
high-performance products with a reputation for innovation,
sophistication, glamour and superior quality. Estée Lauder has produced
some of the most iconic skin care, makeup and fragrance products,
including Advanced Night Repair Synchronized Recovery Complex II,
Idealist Even Skintone Illuminator, Perfectionist CP+R, Double Wear,
Pure Color, and has two of the top ten fragrances in the United States,
Beautiful and pleasures.
Introduced in 1964, Aramis was the first prestige men’s fragrance to
be sold in department stores. It is sold in more than 130 countries and
territories worldwide. Aramis pioneered prestige men’s grooming with its
“master plan” that introduced 20 unique products. Today, Aramis remains
successful through its strong brand identity and continues to be a symbol
of classic masculinity and sophistication.
PORTFOLIO of BRANDS

Introduced in 1968, Clinique was the first ever dermatologist-created,
prestige cosmetics brand. Clinique’s mission has always been to provide
the highest quality and most effective line of products to enhance every
skin type and tone. The brand’s customized approach and quality
products — all meticulously tested and carefully formulated with the latest
science — have made Clinique one of the leading skin care authorities in
the world. All makeup and skin care products are Allergy Tested and 100%
Fragrance Free. Clinique offers products for men and women of all ages
and ethnicities. Clinique is sold in more than 150 countries and territories.
Prescriptives was introduced in 1979, featuring custom color for women.
Select Prescriptives makeup and skin care products are available for sale
at www.prescriptives.com.
Lab Series Skincare for Men was introduced by Aramis in 1987. It is sold
in more than 35 countries and territories worldwide. The brand’s team of
scientists, researchers and skin care specialists use modern technology,
advanced ingredients and the latest research on men’s physiological and
lifestyle needs to develop products with proven results that specifically
target the skin care concerns of modern men.
95

96
M.A.C (Make-up Art Cosmetics), a leading brand of professional
cosmetics, was created in Toronto, Canada, in 1984 and became one
of our brands in 1994. The brand’s popularity has grown through a
tradition of word-of-mouth endorsement from makeup artists, models,
photographers and journalists around the world. M.A.C is now sold in
86 countries and territories.
Origins was introduced in 1990 as the first department store wellness
brand. Sold in nearly 30 countries and territories, Origins products
are manufactured using a combination of renewable resources, wind
energy and earth-friendly practices. The mission at Origins is to create
high-performance natural skin care products that are “Powered by Nature.
Proven by Science.” Origins products use potent plants, organic
ingredients and 100 percent natural essential oils.
Tommy Hilfiger joined our family of brands when the exclusive global
license agreement was signed in 1993. Sold in more than 120 countries
and territories, Tommy Hilfiger produces fragrances and body products
that reflect the classic American cool of designer Tommy Hilfiger.

97
Kiton, a prestigious Italian tailoring company that combines the traditions
of fine Italian tailoring with a reverence for luxury and elegance, joined
our portfolio when the exclusive global fragrance license agreement was
signed in 1995. Sold in more than 22 countries and territories, Kiton’s
signature scent embodies the very essence of fashion, elegance and
sophisticated masculinity.
La Mer joined our family of brands in 1995 and is sold in more than 65
countries and territories. La Mer represents supreme luxury and serious
skin care treatment. The brand’s legendary product, Crème de la Mer,
continues to be one of the most innovative and coveted moisturizers.
Since its original conception by Dr. Max Huber, an aerospace physicist,
the iconic best-selling Crème de la Mer has expanded into a complete
range of skin care that continues to capture a devoted following.
Makeup artist Bobbi Brown revolutionized the beauty industry in 1991
with the launch of 10 brown-based lipsticks and a simple philosophy that
“makeup is a way for a woman to look and feel like herself, only prettier
and more confident.” In 1995, we acquired Bobbi Brown Cosmetics
and Bobbi Brown actively continues her role as Chief Creative Officer.
The brand is available in more than 65 countries and offers a full range of
color cosmetics, skin care, fragrance and accessories.

98
Donna Karan New York and DKNY joined our portfolio when the
exclusive global license agreement was signed in 1997. Sold in more than
90 countries and territories, the collection consists of luxury fragrance,
bath and body collections that reflect the quality, style and innovation
identified with designer Donna Karan.
Aveda joined our family of brands in 1997. It is currently sold in
freestanding experience centers and salon/spa locations in more than 30
countries and territories around the world. Aveda innovates in botanical
technologies, drawing inspiration from ancient Ayurvedic wisdom
to develop performance-driven, plant-based professional and consumer
hair, skin, body and makeup products, and a comprehensive menu of
ritual-based treatments. Guided by its Mission, Aveda has been a beauty
leader in environmental responsibility since its founding in 1978.
Jo Malone London celebrates British style with unexpected fragrances
and the elegant art of gift giving. Acquired by us in 1999, the brand is
now available in 34 countries worldwide and continues to inspire a
loyal following.

Bumble and bumble was founded in 1977 as a New York City salon known
for its inventive cuts and connection to the fashion and editorial world.
Today, the brand includes a hair care line with a full range of shampoos,
conditioners, styling and treatment products, as well as The House of
Bumble, home to an additional salon and Bumble and bumble University,
which provides both business and design education to its network of
salons. Bb.Stylists support more than 70 fashion shows each fashion
season in New York, London, Milan and Paris. Bb.Products are coveted
by beauty and fashion insiders and editorial stylists around the world and
sold in more than 2,500 salons worldwide, and are also available at select
prestige specialty retailers around the world.
Michael Kors joined our portfolio when the exclusive global license
agreement was signed in 2003. With products that are sold in more than
35 countries and territories, the brand’s fragrances embody the jet-set
lifestyle positioning of Michael Kors. The designer’s signature scent,
Michael Kors, is a modern interpretation of the classic tuberose.
Darphin Paris was created by Pierre Darphin, a kinesitherapist with a
passion for botany — a true master of luxury skin care. In 1958, he opened
his first “Institut de Beauté” in Paris and revolutionized beauty with his
exclusive skin-sculpting techniques, customized skin analysis and
serums. Today, Darphin remains faithful to its founding philosophy, fusing
pleasure with performance while crafting aromatic botanical formulas
and innovative skin care to create vibrant, visibly healthy skin at any age.
Darphin is sold in 50 countries and is available in select pharmacies, luxury
department stores and prestigious spas around the world.
99

100
American Beauty is a cosmetics, skin care and fragrance brand that
celebrates the approachable beauty of American style. American Beauty
was established in 2004 and is available exclusively in the United States
at Kohl’s Department Stores and Kohls.com.
FLIRT! is a fresh, fun, flirty makeup collection. Playful and informative
“color bars” and color-matched packaging ensure shopping is as delightful
as the products themselves. FLIRT! was established in 2004 and is
available exclusively in the United States at Kohl’s Department Stores
and Kohls.com.
GoodSkin Labs is a targeted problem/solution, clinically-proven skin care
brand committed to offering real results instantly and long-term. With star
products including Tri-Aktiline Instant Deep Wrinkle Filler and Eyliplex-2
Eye Lift + Circle Reducer, the brand sells its products in retailers globally,
including Douglas Germany and Sephora China. Since its introduction in
2007, GoodSkin Labs is now sold in more than 16 countries worldwide
and is available exclusively in the United States at Kohl’s Department
Stores and Kohls.com.

101
Grassroots Research Labs is a truly sensorial skin care experience that
combines nature’s powerful ingredients with advanced science to deliver
extraordinary results. Grassroots Research Labs was introduced in 2008
and is available exclusively in the United States at Kohl’s Department
Stores and Kohls.com.
Founded in 2005, Tom Ford Beauty is sold in more than 40 markets and
includes iconic signature fragrances such as Tom Ford Black Orchid
and Tom Ford Noir, as well as a Private Blend Collection of luxury artisanal
fragrances. In 2011, the brand expanded with a complete wardrobe
of luxurious, sensual color cosmetics and high-performance skin care.
Today Tom Ford Beauty continues to redefine luxury and taste for global
Prestige Beauty.
Coach, Inc., a leading brand of modern classic American accessories,
joined our portfolio in 2006. It is now under an exclusive global license.
The collection of fragrance and ancillary beauty products embodies the
timelessly chic American style. The collection is available in department
stores, Coach stores in the United States, retail stores in Asia and online.
102
Our Company acquired Ojon in 2007. Ojon is a high-performance,
treatment and repair-based hair care brand. At the heart of each formula
is the brand’s exclusive reparative ingredient, Ojon™ Oil — a rare, powerful
and restorative 500-year-old beauty secret renowned for its ability
to repair damaged hair. Ojon is committed to traditional, sustainable
harvesting practices that protect the purity and potency of the brand’s
naturally derived ingredients and respect the welfare of the land and
surrounding communities.
Founded in 1996 and acquired in 2010, Smashbox Cosmetics was born
out of Smashbox Studios in Los Angeles — the modern-day image factory
where countless iconic celebrity and fashion images have been shot.
Smashbox is a fast-growing, prestige cosmetics brand sold in 30 countries
and 5 regions worldwide.
Founded in 1910 in Trivero, in the Biella Alps, by the young entrepreneur
Ermenegildo Zegna, our Company acquired the exclusive worldwide
license for the global luxury brand’s fragrance and grooming business
in 2011. Ermenegildo Zegna fragrances are sold in markets across
North America, Europe and Asia, as well as in Ermenegildo Zegna
boutiques worldwide.
103
Launched in late 2012, AERIN Beauty consists of edited makeup
collections personally curated by its founder, Aerin Lauder, to make
choosing makeup effortless with both essential and seasonal color
collections. It embodies the stylish, feminine and modern aesthetic of
her new lifestyle brand, AERIN. Exclusively available in select specialty
retail in North America and the United Kingdom.
Truly vital skin radiates with energy and light, as if lit from within. Osiao is
dedicated to unlocking the secrets to ageless beauty inside and out with a
collection of meticulously formulated, rare and truly luxurious concentrates
and complementary treatments. Osiao was created and developed at
IdeaBank, a division of our BeautyBank organization, and launched
exclusively in Asia in 2012.
MARNI, a coveted Italian design house, joined our portfolio with an
exclusive global fragrance license agreement. Marni fragrance was
launched in the Spring of 2013 and is available in high-end retailers in nine
countries. Marni is a mindset, not just a label or a style. It’s a world of its
own, slightly out of the ordinary. A spirited sensorial language: individual,
unpredictable, with a quirk.

104
ROSE MARIE BRAVO, CBE2, 4 Retail and Marketing Consultant
JANE LAUDER Global President, General Manager, Origins, Ojon and Darphin
PAUL J. FRIBOURG1, 2, 4 Chairman, Chief Executive Officer, Continental Grain Company
FABRIZIO FREDA President and Chief Executive Officer, The Estée Lauder Companies Inc.
BARRY S. STERNLICHT2, 4 Chairman, Chief Executive Officer, Starwood Capital Group
RICHARD D. PARSONS2, 3 Senior Advisor, Providence Equity Partners LLC
AERIN LAUDER Founder and Creative Director, AERIN; Style and Image Director, Estée Lauder
Photo courtesy of the Fortune 500 issue, May 21, 2012

105
BOARD OF DIRECTORS
WILLIAM P. LAUDER3 Executive Chairman, The Estée Lauder Companies Inc.
LYNN FORESTER DE ROTHSCHILD3 Chief Executive Officer, E.L. Rothschild Ltd.
WEI SUN CHRISTIANSON3 Co-CEO of Asia Pacific and CEO of China, Morgan Stanley
LEONARD A. LAUDER Chairman Emeritus, The Estée Lauder Companies Inc.
CHARLENE BARSHEFSKY3 Senior International Partner, WilmerHale
RICHARD F. ZANNINO1 Managing Director, CCMP Capital Advisors, LLC
MELLODY HOBSON1 President, Ariel Investments, LLC
IRVINE O. HOCKADAY, JR.1 Retired President and Chief Executive Officer, Hallmark Cards, Inc.
1. Member of Audit Committee 2. Member of Compensation Committee 3. Member of Nominating and Board Affairs Committee 4. Member of Stock Plan Subcommittee

106
EXECUTIVE OFFICERSJOHN DEMSEY Group President
AMY DIGESO Executive Vice President, Global Human Resources
(until September 30, 2013)
FABRIZIO FREDA President and Chief Executive Officer
CARL HANEY Executive Vice President, Global Research and Development,
Corporate Product Innovation, Package Development
LEONARD A. LAUDER Chairman Emeritus
RONALD S. LAUDER Chairman, Clinique Laboratories, LLC
WILLIAM P. LAUDER Executive Chairman
SARA E. MOSS Executive Vice President and General Counsel
MICHAEL O’HARE Executive Vice President, Global Human Resources
(as of September 30, 2013)
GREGORY F. POLCER Executive Vice President, Global Supply Chain
CEDRIC PROUVÉ Group President, International
TRACEY T. TRAVIS Executive Vice President and Chief Financial Officer
ALEXANDRA C. TROWER Executive Vice President, Global Communications

107
FINANCIAL h i g h l i g h t s
Financial Overview
* Attributable to The Estée Lauder Companies Inc.
Global Net Sales
2009: $7.32 Billion
59%International$4.30 Billion
41%U.S.$3.02 Billion
2013: $10.18 Billion
63%International$6.42 Billion
37%U.S.$3.76 Billion
FISCAL YEAR ENDED OR AT JUNE 30 2013 2012 Change
(Dollars in millions, except per share data)
Net Sales $10,181.7 $9,713.6 5%Operating Income 1,526.0 1,311.7 16%Net Earnings* 1,019.8 856.9 19%Net Earnings Per Common Share — Diluted* 2.58 2.16 20%Total Assets 7,145.2 6,593.0 8%Stockholders’ Equity* 3,286.9 2,733.2 20%

108
Net Sales(In billions)
Operating Income(In millions)
$10.18
$1,526.0
Historical Net Sales Growth
2013$10.2 billion
2003$5 billion
1985$1 billion
1972$100 million
1953
7.32 7.80 8.81 9.71 10.18
418.4 789.9 1,089.4 1,311.7 1,526.0
2009 2010 2011 2012 2013
2009 2010 2011 2012 2013
109
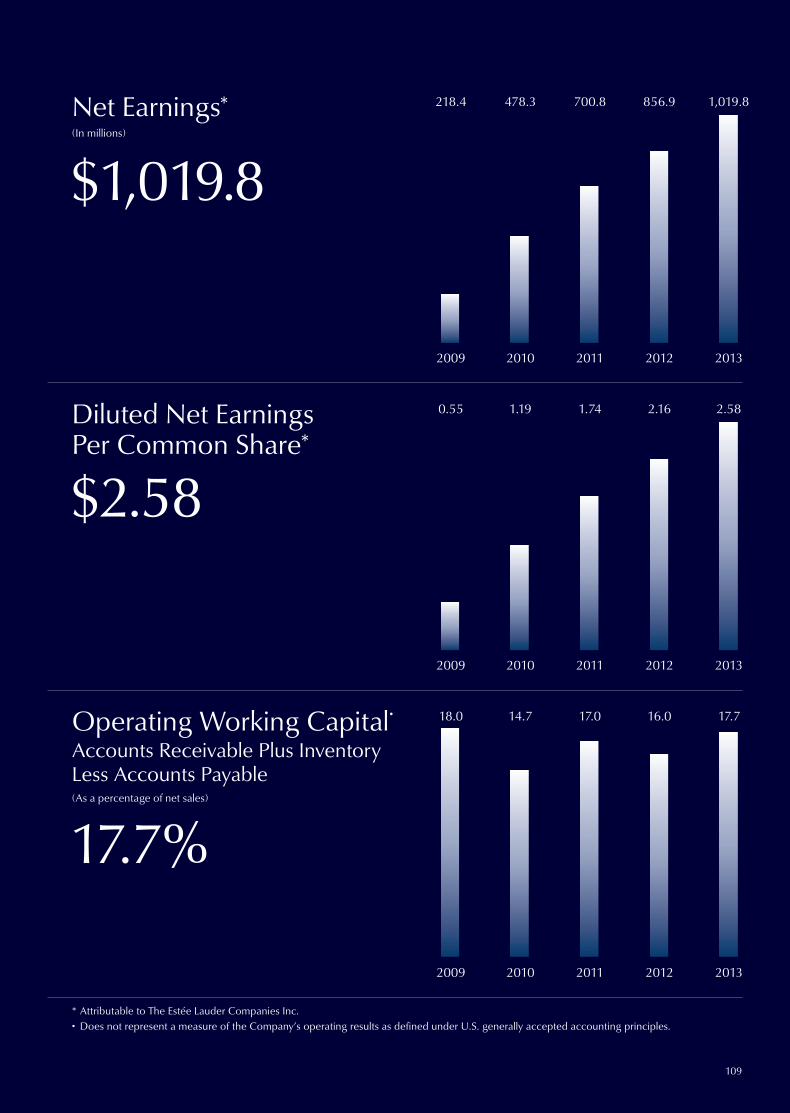
Net Earnings*(In millions)
Diluted Net Earnings Per Common Share*
Operating Working Capital†
Accounts Receivable Plus Inventory Less Accounts Payable(As a percentage of net sales)
$1,019.8
$2.58
17.7%
* Attributable to The Estée Lauder Companies Inc.† Does not represent a measure of the Company’s operating results as defined under U.S. generally accepted accounting principles.
0.55 1.19 1.74 2.16 2.58
218.4 478.3 700.8 856.9 1,019.8
18.0 14.7 17.0 16.0 17.7
2009 2010 2011 2012 2013
2009 2010 2011 2012 2013
2009 2010 2011 2012 2013
110
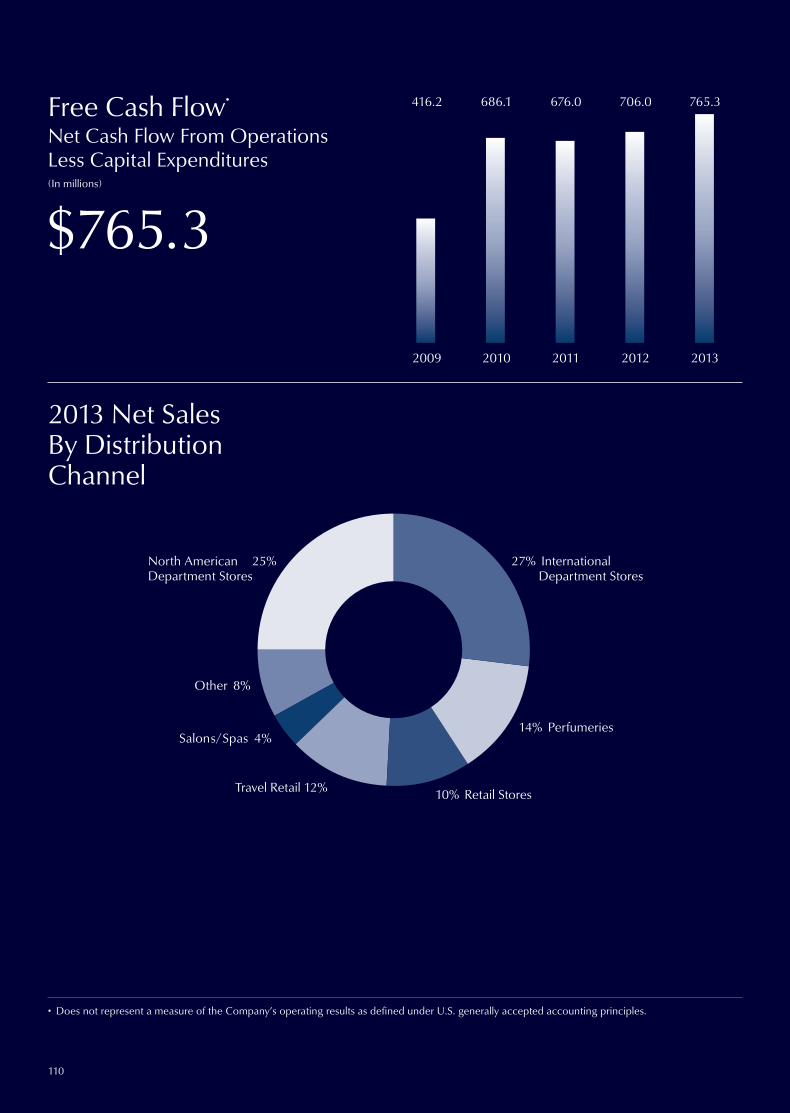
2013 Net Sales By Distribution Channel
$765.3
Free Cash Flow†
Net Cash Flow From Operations Less Capital Expenditures(In millions)
Other 8%
Salons/Spas 4%
Travel Retail 12% 10% Retail Stores
14% Perfumeries
27% International Department Stores
North American 25%Department Stores
416.2 686.1 676.0 706.0 765.3
2009 2010 2011 2012 2013
† Does not represent a measure of the Company’s operating results as defined under U.S. generally accepted accounting principles.

111
FINANCIALs e c t i o n
112 THE EST{E LAUDER COMPANIES INC.
113 Selected Financial Data
114 Management’s Discussion and Analysis of Financial
Condition and Results of Operations
138 Consolidated Statements of Earnings
139 Consolidated Statements of
Comprehensive Income (Loss)
140 Consolidated Balance Sheets
141 Consolidated Statements of Equity
142 Consolidated Statements of Cash Flows
143 Notes to Consolidated Financial Statements
181 Management’s Report on Internal Control Over Financial Reporting
182 Report of Independent Registered Public Accounting Firm on Internal Control Over Financial Reporting
183 Report of Independent Registered Public Accounting Firm
184 Stockholder Information
FINANCIAL CONTENTS

The table below summarizes selected financial information. For further information, refer to the audited consolidated financial statements and the notes thereto beginning on page 138 of this report.
YEAR ENDED OR AT JUNE 30 2013(a) 2012(a) 2011 (a) 2010(a) 2009(a)
(In millions, except per share data)
STATEMENT OF EARNINGS DATA:Net sales $10,181.7 $9,713.6 $8,810.0 $7,795.8 $7,323.8Gross profit 8,155.8 7,717.8 6,873.1 5,966.4 5,442.2Operating income 1,526.0 1,311.7 1,089.4 789.9 418.4Interest expense, net 54.8 61.1 63.9 74.3 75.7Interest expense on debt extinguishment(b) 19.1 — — 27.3 —Other income(c) 23.1 10.5 — — —Earnings before income taxes 1,475.2 1,261.1 1,025.5 688.3 342.7Provision for income taxes 451.4 400.6 321.7 205.9 115.9Net earnings 1,023.8 860.5 703.8 482.4 226.8Net earnings attributable to noncontrolling interests (4.0) (3.6) (3.0) (4.1) (8.4)Net earnings attributable to The Estée Lauder
Companies Inc. 1,019.8 856.9 700.8 478.3 218.4
CASH FLOW DATA:Net cash flows provided by operating activities $ 1,226.3 $1,126.7 $1,027.0 $ 956.7 $ 696.0Net cash flows used for investing activities (465.5) (428.3) (606.9) (281.4) (339.5)Net cash flows provided by (used for) financing activities (611.5) (585.1) (313.1) (406.1) 125.8
PER SHARE DATA:Net earnings attributable to The Estée Lauder
Companies Inc. per common share:Basic $ 2.63 $ 2.20 $ 1.78 $ 1.21 $ 0.56Diluted $ 2.58 $ 2.16 $ 1.74 $ 1.19 $ 0.55
Weighted-average common shares outstanding:Basic 387.6 388.7 394.0 395.4 392.6Diluted 394.9 397.0 402.4 401.5 395.5
Cash dividends declared per common share $ 1.08 $ .525 $ .375 $ .275 $ .275
BALANCE SHEET DATA:Working capital $ 2,362.6 $1,729.3 $1,743.2 $1,548.8 $1,453.3Total assets 7,145.2 6,593.0 6,273.9 5,335.6 5,176.6Total debt(b) (d) 1,344.3 1,288.1 1,218.1 1,228.4 1,421.4Stockholders’ equity — The Estée Lauder Companies Inc. 3,286.9 2,733.2 2,629.4 1,948.4 1,640.0
2013(a)
$10,181.78,155.81,526.0
54.819.123.1
1,475.2451.4
1,023.8(4.0)
1,019.8
$ 1,226.3(465.5)(611.5)
$ 2.63$ 2.58
387.6394.9
$ 1.08
$ 2,362.67,145.21,344.33,286.9
(a) Fiscal 2013 results included $11.7 million, after tax, or $.03 per diluted share related to total charges associated with restructuring activities. Fiscal 2012 results included $44.1 million, after tax, or $.11 per diluted share related to total charges associated with restructuring activities. Fiscal 2011 results included $41.7 million, after tax, or $.10 per diluted share related to total charges associated with restructuring activities. Fiscal 2010 results included $55.9 million, after tax, or $.14 per diluted share related to total charges associated with restructuring activities. Fiscal 2009 results included $61.7 million, after tax, or $.16 per diluted share related to total charges associated with restructuring activities.
(b) In September 2012, we redeemed the $230.1 million principal amount of our 7.75% Senior Notes due November 1, 2013 (“2013 Senior Notes”) at a price of 108% of the principal amount. We recorded a pre-tax expense on the extinguishment of debt of $19.1 million ($12.2 million after tax, or $.03 per diluted share) representing the call premium of $18.6 million and the pro-rata write-off of $0.5 million of issuance costs and debt discount. In May 2010, we completed a cash tender offer for $130.0 million principal amount of our 6.00% Senior Notes due January 15, 2012 at a price of 108.500% of the principal amount and for $69.9 million principal amount of our 2013 Senior Notes at a tender price of 118.813% of the principal amount. During the fourth quarter of fiscal 2010, we recorded a pre-tax expense on the extinguishment of debt of $27.3 million representing the tender premium, the pro-rata write-off of unamortized terminated interest rate swap, issuance costs and debt discount, and tender offer costs associated with both series of notes.
(c) In December 2012, we amended the agreement related to the August 2007 sale of Rodan + Fields (a brand then owned by us) to receive a fixed amount in lieu of future contingent consideration and other rights. Accordingly, we recognized $22.4 million, net of discount of $0.4 million, which has been classified as other income in our consolidated statement of earnings. Prior to this amendment, we earned and received $0.7 million of contingent consideration. In November 2011, we settled a commercial dispute with third parties that was outside our normal operations. In connection therewith, we received a $10.5 million cash payment, which has been classified as other income in our consolidated statement of earnings.
(d) In August 2012, we issued $250.0 million of 2.35% Senior Notes due August 15, 2022 and $250.0 million of 3.70% Senior Notes due August 15, 2042 in a public offering. We used the net proceeds of the offering to redeem the 2013 Senior Notes and for general corporate purposes.
SELECTED FINANCIAL DATA
THE EST{E LAUDER COMPANIES INC. 113
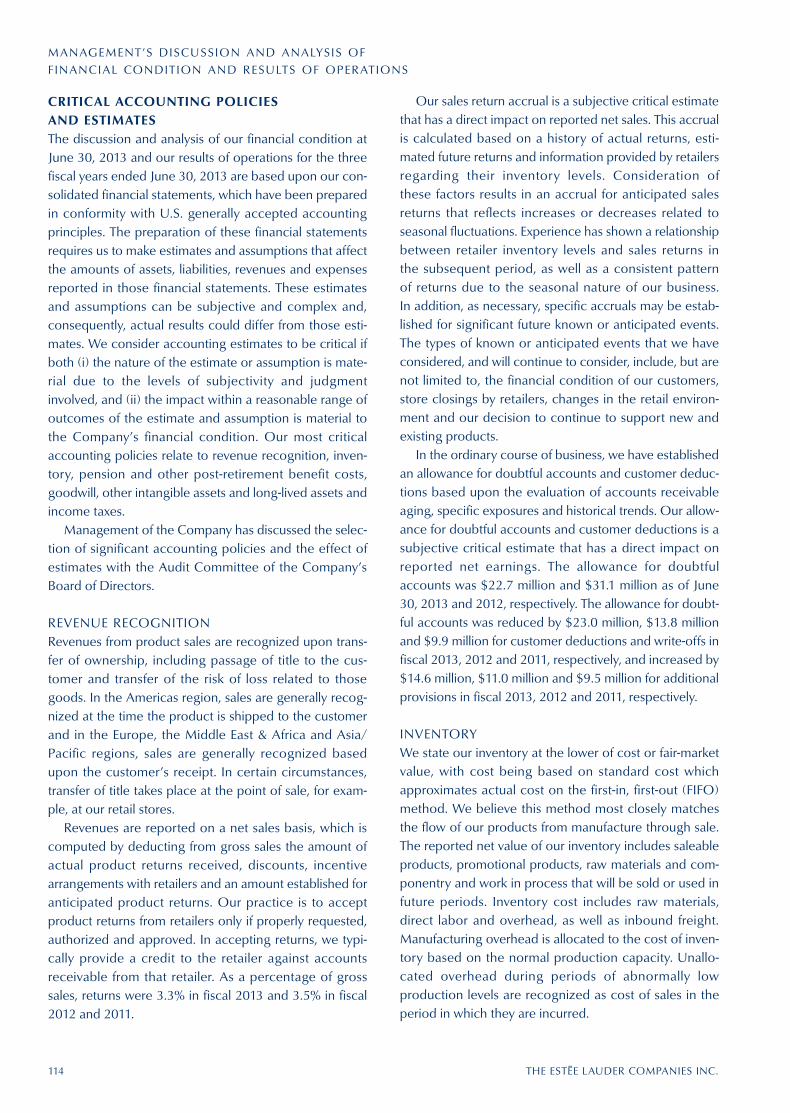
CRITICAL ACCOUNTING POLICIES AND ESTIMATESThe discussion and analysis of our financial condition at June 30, 2013 and our results of operations for the three fiscal years ended June 30, 2013 are based upon our con-solidated financial statements, which have been prepared in conformity with U.S. generally accepted accounting principles. The preparation of these financial statements requires us to make estimates and assumptions that affect the amounts of assets, liabilities, revenues and expenses reported in those financial statements. These estimates and assumptions can be subjective and complex and, consequently, actual results could differ from those esti-mates. We consider accounting estimates to be critical if both (i) the nature of the estimate or assumption is mate-rial due to the levels of subjectivity and judgment involved, and (ii) the impact within a reasonable range of outcomes of the estimate and assumption is material to the Company’s financial condition. Our most critical accounting policies relate to revenue recognition, inven-tory, pension and other post-retirement benefit costs, goodwill, other intangible assets and long-lived assets and income taxes.
Management of the Company has discussed the selec-tion of significant accounting policies and the effect of estimates with the Audit Committee of the Company’s Board of Directors.
REVENUE RECOGNITIONRevenues from product sales are recognized upon trans-fer of ownership, including passage of title to the cus-tomer and transfer of the risk of loss related to those goods. In the Americas region, sales are generally recog-nized at the time the product is shipped to the customer and in the Europe, the Middle East & Africa and Asia/ Pacific regions, sales are generally recognized based upon the customer’s receipt. In certain circumstances, transfer of title takes place at the point of sale, for exam-ple, at our retail stores.
Revenues are reported on a net sales basis, which is computed by deducting from gross sales the amount of actual product returns received, discounts, incentive arrangements with retailers and an amount established for anticipated product returns. Our practice is to accept product returns from retailers only if properly requested, authorized and approved. In accepting returns, we typi-cally provide a credit to the retailer against accounts receivable from that retailer. As a percentage of gross sales, returns were 3.3% in fiscal 2013 and 3.5% in fiscal 2012 and 2011.
Our sales return accrual is a subjective critical estimate that has a direct impact on reported net sales. This accrual is calculated based on a history of actual returns, esti-mated future returns and information provided by retailers regarding their inventory levels. Consideration of these factors results in an accrual for anticipated sales returns that reflects increases or decreases related to seasonal fluctuations. Experience has shown a relationship between retailer inventory levels and sales returns in the subsequent period, as well as a consistent pattern of returns due to the seasonal nature of our business. In addition, as necessary, specific accruals may be estab-lished for significant future known or anticipated events. The types of known or anticipated events that we have considered, and will continue to consider, include, but are not limited to, the financial condition of our customers, store closings by retailers, changes in the retail environ-ment and our decision to continue to support new and existing products.
In the ordinary course of business, we have established an allowance for doubtful accounts and customer deduc-tions based upon the evaluation of accounts receivable aging, specific exposures and historical trends. Our allow-ance for doubtful accounts and customer deductions is a subjective critical estimate that has a direct impact on reported net earnings. The allowance for doubtful accounts was $22.7 million and $31.1 million as of June 30, 2013 and 2012, respectively. The allowance for doubt-ful accounts was reduced by $23.0 million, $13.8 million and $9.9 million for customer deductions and write-offs in fiscal 2013, 2012 and 2011, respectively, and increased by $14.6 million, $11.0 million and $9.5 million for additional provisions in fiscal 2013, 2012 and 2011, respectively.
INVENTORYWe state our inventory at the lower of cost or fair-market value, with cost being based on standard cost which approximates actual cost on the first-in, first-out (FIFO) method. We believe this method most closely matches the flow of our products from manufacture through sale. The reported net value of our inventory includes saleable products, promotional products, raw materials and com-ponentry and work in process that will be sold or used in future periods. Inventory cost includes raw materials, direct labor and overhead, as well as inbound freight. Manufacturing overhead is allocated to the cost of inven-tory based on the normal production capacity. Unallo-cated overhead during periods of abnormally low production levels are recognized as cost of sales in the period in which they are incurred.
MANAGEMENT’S DISCUSSION AND ANALYSIS OF F INANCIAL CONDITION AND RESULTS OF OPERATIONS
114 THE EST{E LAUDER COMPANIES INC.

We also record an inventory obsolescence reserve, which represents the difference between the cost of the inventory and its estimated realizable value, based on various product sales projections. This reserve is calcu-lated using an estimated obsolescence percentage applied to the inventory based on age, historical trends and requirements to support forecasted sales. In addition, and as necessary, we may establish specific reserves for future known or anticipated events.
PENSION AND OTHER POST-RETIREMENT BENEFIT COSTSWe offer the following benefits to some or all of our employees: a domestic trust-based noncontributory qual-ified defined benefit pension plan (“U.S. Qualified Plan”) and an unfunded, non-qualified domestic noncon-tributory pension plan to provide benefits in excess of statutory limitations (collectively with the U.S. Qualified Plan, the “Domestic Plans”); a domestic contributory defined contribution plan; international pension plans, which vary by country, consisting of both defined benefit and defined contribution pension plans; deferred compensation arrangements; and certain other post-retirement benefit plans.
The amounts needed to fund future payouts under our defined benefit pension and post-retirement benefit plans are subject to numerous assumptions and variables. Cer-tain significant variables require us to make assumptions that are within our control such as an anticipated discount rate, expected rate of return on plan assets and future compensation levels. We evaluate these assumptions with our actuarial advisors and select assumptions that we believe reflect the economics underlying our pension and post-retirement obligations. While we believe these assumptions are within accepted industry ranges, an increase or decrease in the assumptions or economic events outside our control could have a direct impact on reported net earnings.
The discount rate for each plan used for determining future net periodic benefit cost is based on a review of highly rated long-term bonds. For fiscal 2013, we used a discount rate for our Domestic Plans of 3.90% and vary-ing rates on our international plans of between 1.00% and 7.00%. The discount rate for our Domestic Plans is based on a bond portfolio that includes only long-term bonds with an Aa rating, or equivalent, from a major rating agency. As of June 30, 2013, we used an above-mean yield curve, rather than the broad-based yield curve we used before, because we believe it represents a better estimate of an effective settlement rate of the obligation, and the timing and amount of cash flows related to the
bonds included in this portfolio are expected to match the estimated defined benefit payment streams of our Domestic Plans. The benefit obligation of our Domestic Plans would have been higher by approximately $34 mil-lion at June 30, 2013 had we not used the above-mean yield curve. For our international plans, the discount rate in a particular country was principally determined based on a yield curve constructed from high quality corporate bonds in each country, with the resulting portfolio having a duration matching that particular plan.
For fiscal 2013, we used an expected return on plan assets of 7.50% for our U.S. Qualified Plan and varying rates of between 2.25% and 7.00% for our international plans. In determining the long-term rate of return for a plan, we consider the historical rates of return, the nature of the plan’s investments and an expectation for the plan’s investment strategies. See “Note 12 — Pension, Deferred Compensation and Post-retirement Benefit Plans” of Notes to Consolidated Financial Statements for details regarding the nature of our pension and post-retirement plan invest-ments. The difference between actual and expected return on plan assets is reported as a component of accu-mulated other comprehensive income. Those gains/losses that are subject to amortization over future periods will be recognized as a component of the net periodic benefit cost in such future periods. For fiscal 2013, our pension plans had actual return on assets of approximately $74 million as compared with expected return on assets of approximately $64 million. The resulting net deferred gain of approximately $10 million, when combined with gains and losses from previous years, will be amortized over periods ranging from approximately 7 to 22 years. The actual return on plan assets from our international pen-sion plans exceeded expectations, primarily reflecting a strong performance from fixed income and equity invest-ments. The lower than expected return on assets from our U.S. Qualified Plan was primarily due to weakness in our fixed income investments, partially offset by our strong equity returns.
A 25 basis-point change in the discount rate or the expected rate of return on plan assets would have had the following effect on fiscal 2013 pension expense:
25 Basis-Point 25 Basis-Point Increase Decrease(In millions)
Discount rate $(3.5) $3.9
Expected return on assets $(2.5) $2.7
Our post-retirement plans are comprised of health care plans that could be impacted by health care cost trend rates, which may have a significant effect on the amounts
THE EST{E LAUDER COMPANIES INC. 115

116 THE EST{E LAUDER COMPANIES INC.
reported. A one-percentage-point change in assumed health care cost trend rates for fiscal 2013 would have had the following effects: One-Percentage- One-Percentage- Point Increase Point Decrease(In millions)
Effect on total service and interest costs $ 1.3 $ (1.1)
Effect on post-retirement benefit obligations $12.4 $(11.1)
To determine the fiscal 2014 net periodic benefit cost, we are using discount rates of 4.90% and 4.30% for the U.S. Qualified Plan and the non-qualified domestic non-contributory pension plan, respectively, and varying rates for our international plans of between 1.00% and 7.25%. We are using an expected return on plan assets of 7.50% for the U.S. Qualified Plan and varying rates for our international pension plans of between 2.25% and 7.25%. The net change in these assumptions from those used in fiscal 2013 will result in a decrease in pension expense of approximately $5 million in fiscal 2014, of which approximately $3 million is attributable to using the above-mean yield curve for our Domestic Plans, as previously discussed.
GOODWILL, OTHER INTANGIBLE ASSETS AND LONG-LIVED ASSETSGoodwill is calculated as the excess of the cost of pur-chased businesses over the fair value of their underlying net assets. Other indefinite-lived intangible assets princi-pally consist of trademarks. Goodwill and other indefinite-lived intangible assets are not amortized.
We assess goodwill and other indefinite-lived intangi-bles at least annually for impairment as of the beginning of the fiscal fourth quarter, or more frequently if certain events or circumstances exist. We test goodwill for impair-ment at the reporting unit level, which is one level below our operating segments. We identify our reporting units by assessing whether the components of our operating segments constitute businesses for which discrete finan-cial information is available and management of each reporting unit regularly reviews the operating results of those components. We make certain judgments and assumptions in allocating assets and liabilities to deter-mine carrying values for our reporting units. Impairment testing is performed in two steps: (i) we determine if an indication of impairment exists by comparing the fair value of a reporting unit with its carrying value, and (ii) if there is an impairment, we measure the amount of impair-ment loss by comparing the implied fair value of goodwill
with the carrying amount of that goodwill. The impair-ment test for indefinite-lived intangible assets encom-passes calculating a fair value of an indefinite-lived intangible asset and comparing the fair value to its carry-ing value. If the carrying value exceeds the fair value an impairment charge is recorded.
Testing goodwill for impairment requires us to estimate fair values of reporting units using significant estimates and assumptions. The assumptions made will impact the outcome and ultimate results of the testing. We use indus-try accepted valuation models and set criteria that are reviewed and approved by various levels of management and, in certain instances, we engage third-party valuation specialists for advice. To determine fair value of the reporting unit, we generally use an equal weighting of the income and market approaches. In certain circumstances, equal weighting will not be applied if one of these meth-ods may be less applicable (e.g., only the income approach would be used for reporting units with existing negative margins). We believe both approaches are equally relevant and the most reliable indications of fair value because the fair value of product or service companies is more dependent on the ability to generate earnings than on the value of the assets used in the production process.
Under the income approach, we determine fair value using a discounted cash flow method, projecting future cash flows of each reporting unit, as well as a terminal value, and discounting such cash flows at a rate of return that reflects the relative risk of the cash flows. Under the market approach, we utilize information from comparable publicly traded companies with similar operating and investment characteristics as the reporting units, which creates valuation multiples that are applied to the operat-ing performance of the reporting unit being tested, to value the reporting unit.
The key estimates and factors used in these two approaches include, but are not limited to, revenue growth rates and profit margins based on internal fore-casts, terminal value, the weighted-average cost of capital used to discount future cash flows and comparable mar-ket multiples. The following fiscal 2013 estimates and factors exclude those related to our Darphin reporting unit, for which we recorded an impairment charge of the remainder of its goodwill (see Goodwill and Other Intangible Asset Impairments). The fiscal 2013 compound annual growth rate of sales for the first five to eight years of our projections, as considered appropriate for the indi-vidual reporting units, ranged between 5% and 22% with the higher growth rates in certain of the Company’s
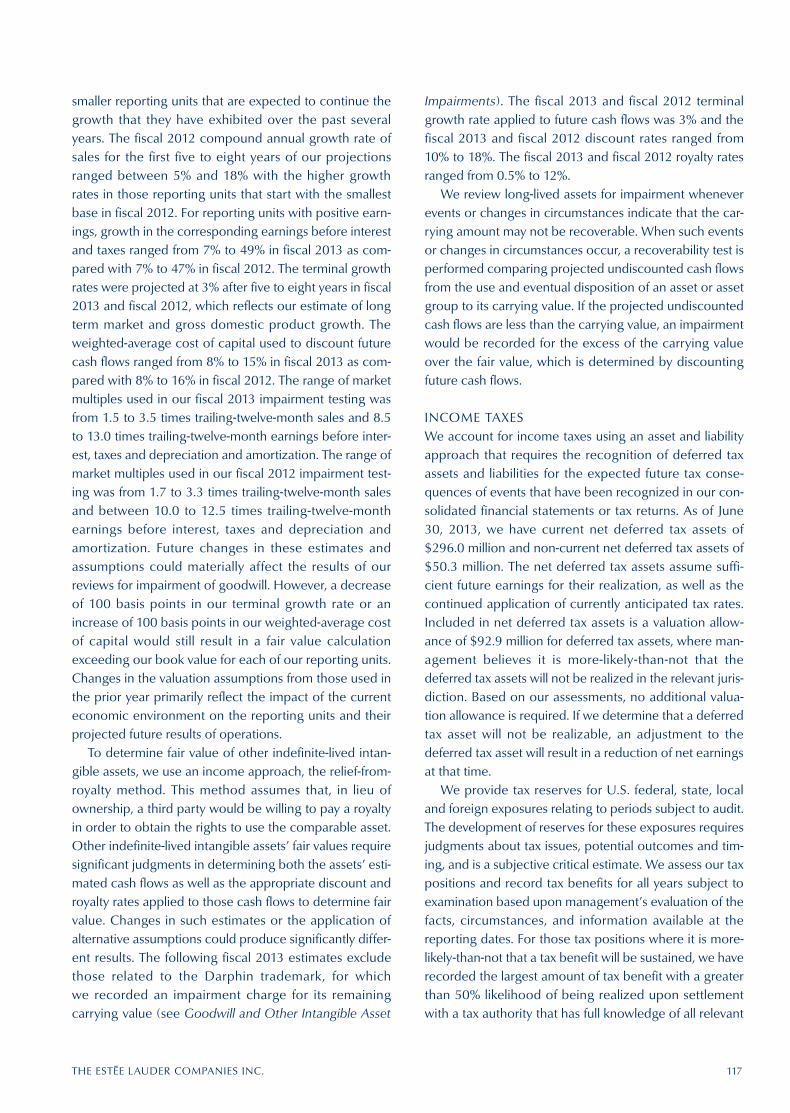
THE EST{E LAUDER COMPANIES INC. 117
smaller reporting units that are expected to continue the growth that they have exhibited over the past several years. The fiscal 2012 compound annual growth rate of sales for the first five to eight years of our projections ranged between 5% and 18% with the higher growth rates in those reporting units that start with the smallest base in fiscal 2012. For reporting units with positive earn-ings, growth in the corresponding earnings before interest and taxes ranged from 7% to 49% in fiscal 2013 as com-pared with 7% to 47% in fiscal 2012. The terminal growth rates were projected at 3% after five to eight years in fiscal 2013 and fiscal 2012, which reflects our estimate of long term market and gross domestic product growth. The weighted-average cost of capital used to discount future cash flows ranged from 8% to 15% in fiscal 2013 as com-pared with 8% to 16% in fiscal 2012. The range of market multiples used in our fiscal 2013 impairment testing was from 1.5 to 3.5 times trailing-twelve-month sales and 8.5 to 13.0 times trailing-twelve-month earnings before inter-est, taxes and depreciation and amortization. The range of market multiples used in our fiscal 2012 impairment test-ing was from 1.7 to 3.3 times trailing-twelve-month sales and between 10.0 to 12.5 times trailing-twelve-month earnings before interest, taxes and depreciation and amortization. Future changes in these estimates and assumptions could materially affect the results of our reviews for impairment of goodwill. However, a decrease of 100 basis points in our terminal growth rate or an increase of 100 basis points in our weighted-average cost of capital would still result in a fair value calculation exceeding our book value for each of our reporting units. Changes in the valuation assumptions from those used in the prior year primarily reflect the impact of the current economic environment on the reporting units and their projected future results of operations.
To determine fair value of other indefinite-lived intan-gible assets, we use an income approach, the relief-from-royalty method. This method assumes that, in lieu of ownership, a third party would be willing to pay a royalty in order to obtain the rights to use the comparable asset. Other indefinite-lived intangible assets’ fair values require significant judgments in determining both the assets’ esti-mated cash flows as well as the appropriate discount and royalty rates applied to those cash flows to determine fair value. Changes in such estimates or the application of alternative assumptions could produce significantly differ-ent results. The following fiscal 2013 estimates exclude those related to the Darphin trademark, for which we recorded an impairment charge for its remaining carrying value (see Goodwill and Other Intangible Asset
Impairments). The fiscal 2013 and fiscal 2012 terminal growth rate applied to future cash flows was 3% and the fiscal 2013 and fiscal 2012 discount rates ranged from 10% to 18%. The fiscal 2013 and fiscal 2012 royalty rates ranged from 0.5% to 12%.
We review long-lived assets for impairment whenever events or changes in circumstances indicate that the car-rying amount may not be recoverable. When such events or changes in circumstances occur, a recoverability test is performed comparing projected undiscounted cash flows from the use and eventual disposition of an asset or asset group to its carrying value. If the projected undiscounted cash flows are less than the carrying value, an impairment would be recorded for the excess of the carrying value over the fair value, which is determined by discounting future cash flows.
INCOME TAXESWe account for income taxes using an asset and liability approach that requires the recognition of deferred tax assets and liabilities for the expected future tax conse-quences of events that have been recognized in our con-solidated financial statements or tax returns. As of June 30, 2013, we have current net deferred tax assets of $296.0 million and non-current net deferred tax assets of $50.3 million. The net deferred tax assets assume suffi-cient future earnings for their realization, as well as the continued application of currently anticipated tax rates. Included in net deferred tax assets is a valuation allow-ance of $92.9 million for deferred tax assets, where man-agement believes it is more-likely-than-not that the deferred tax assets will not be realized in the relevant juris-diction. Based on our assessments, no additional valua-tion allowance is required. If we determine that a deferred tax asset will not be realizable, an adjustment to the deferred tax asset will result in a reduction of net earnings at that time.
We provide tax reserves for U.S. federal, state, local and foreign exposures relating to periods subject to audit. The development of reserves for these exposures requires judgments about tax issues, potential outcomes and tim-ing, and is a subjective critical estimate. We assess our tax positions and record tax benefits for all years subject to examination based upon management’s evaluation of the facts, circumstances, and information available at the reporting dates. For those tax positions where it is more-likely-than-not that a tax benefit will be sustained, we have recorded the largest amount of tax benefit with a greater than 50% likelihood of being realized upon settlement with a tax authority that has full knowledge of all relevant

118 THE EST{E LAUDER COMPANIES INC.
information. For those tax positions where it is not more-likely-than-not that a tax benefit will be sustained, no tax benefit has been recognized in the consolidated financial statements. We classify applicable interest and penalties as a component of the provision for income taxes. Although the outcome relating to these exposures is uncertain, in management’s opinion adequate provisions for income taxes have been made for estimable potential liabilities emanating from these exposures. If actual outcomes differ materially from these estimates, they could have a material impact on our consolidated results of operations.
QUANTITATIVE ANALYSISDuring the three-year period ended June 30, 2013, there have not been material changes in the assumptions under-lying these critical accounting policies, nor to the related significant estimates. The results of our business underly-ing these assumptions have not differed significantly from our expectations.
While we believe that the estimates that we have made are proper and the related results of operations for the period are presented fairly in all material respects, other assumptions could reasonably be justified that would change the amount of reported net sales, cost of sales, operating expenses or our provision for income taxes as they relate to the provisions for anticipated sales returns, allowance for doubtful accounts, inventory obsolescence reserve and income taxes. For fiscal 2013, had these esti-mates been changed simultaneously by 2.5% in either direction, our reported gross profit would have increased or decreased by approximately $6.3 million, operating expenses would have changed by approximately $0.8 mil-lion and the provision for income taxes would have increased or decreased by approximately $0.7 million. The collective impact of these changes on operating income, net earnings attributable to The Estée Lauder Companies Inc., and net earnings attributable to The Estée Lauder Companies Inc. per diluted common share would be an increase or decrease of approximately $7.1 million, $6.4 million and $.02, respectively.
RESULTS OF OPERATIONSWe manufacture, market and sell beauty products includ-ing those in the skin care, makeup, fragrance and hair care categories which are distributed in over 150 coun-tries and territories. The following table is a comparative summary of operating results for fiscal 2013, 2012 and 2011 and reflects the basis of presentation described in “Note 2 — Summary of Significant Accounting Policies and Note 19 — Segment Data and Related Information” of Notes to Consolidated Financial Statements for all periods presented. Products and services that do not meet our definition of skin care, makeup, fragrance and hair care have been included in the “other” category.
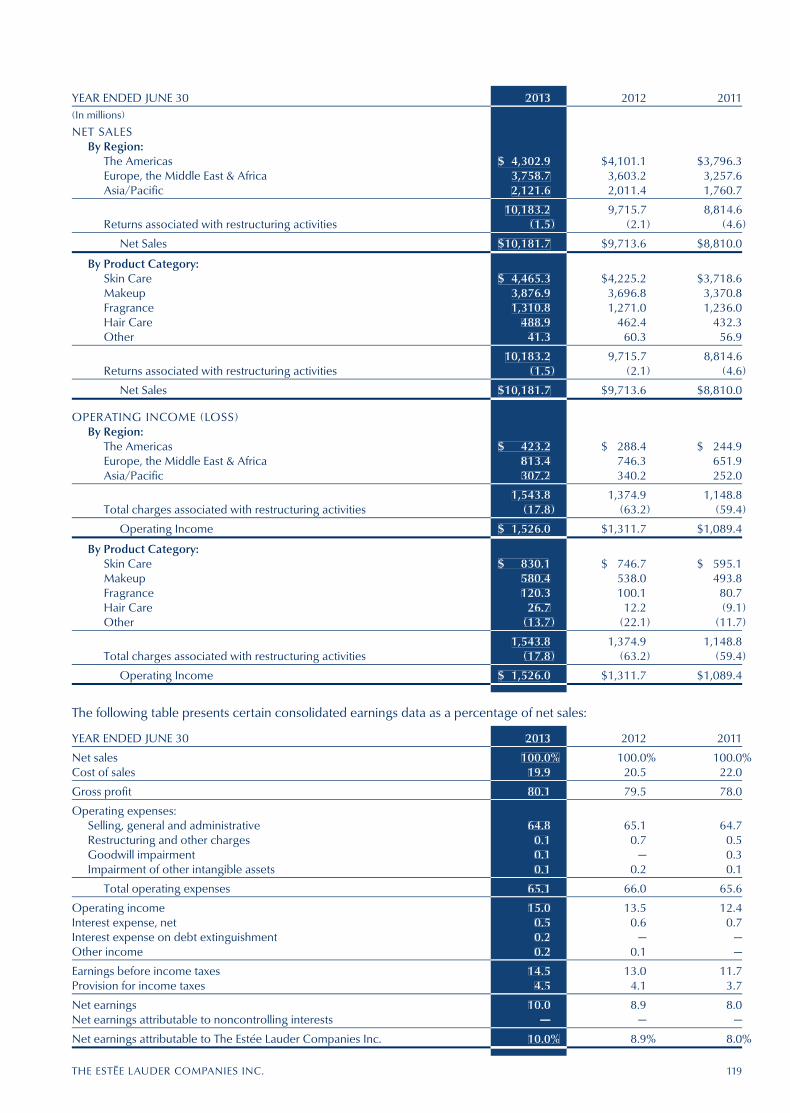
YEAR ENDED JUNE 30 2013 2012 2011(In millions)
NET SALESBy Region:
The Americas $ 4,302.9 $4,101.1 $3,796.3Europe, the Middle East & Africa 3,758.7 3,603.2 3,257.6Asia/Pacific 2,121.6 2,011.4 1,760.7
10,183.2 9,715.7 8,814.6Returns associated with restructuring activities (1.5) (2.1) (4.6)
Net Sales $10,181.7 $9,713.6 $8,810.0
By Product Category:Skin Care $ 4,465.3 $4,225.2 $3,718.6Makeup 3,876.9 3,696.8 3,370.8Fragrance 1,310.8 1,271.0 1,236.0Hair Care 488.9 462.4 432.3Other 41.3 60.3 56.9
10,183.2 9,715.7 8,814.6Returns associated with restructuring activities (1.5) (2.1) (4.6)
Net Sales $10,181.7 $9,713.6 $8,810.0
OPERATING INCOME (LOSS)By Region:
The Americas $ 423.2 $ 288.4 $ 244.9Europe, the Middle East & Africa 813.4 746.3 651.9Asia/Pacific 307.2 340.2 252.0
1,543.8 1,374.9 1,148.8Total charges associated with restructuring activities (17.8) (63.2) (59.4)
Operating Income $ 1,526.0 $1,311.7 $1,089.4
By Product Category:Skin Care $ 830.1 $ 746.7 $ 595.1Makeup 580.4 538.0 493.8Fragrance 120.3 100.1 80.7Hair Care 26.7 12.2 (9.1)Other (13.7) (22.1) (11.7)
1,543.8 1,374.9 1,148.8Total charges associated with restructuring activities (17.8) (63.2) (59.4)
Operating Income $ 1,526.0 $1,311.7 $1,089.4
2013
$ 4,302.93,758.72,121.6
10,183.2(1.5)
$10,181.7
$ 4,465.33,876.91,310.8
488.941.3
10,183.2(1.5)
$10,181.7
$ 423.2813.4307.2
1,543.8(17.8)
$ 1,526.0
$ 830.1580.4120.3
26.7(13.7)
1,543.8(17.8)
$ 1,526.0
The following table presents certain consolidated earnings data as a percentage of net sales:
YEAR ENDED JUNE 30 2013 2012 2011
Net sales 100.0% 100.0% 100.0%Cost of sales 19.9 20.5 22.0
Gross profit 80.1 79.5 78.0
Operating expenses:Selling, general and administrative 64.8 65.1 64.7Restructuring and other charges 0.1 0.7 0.5Goodwill impairment 0.1 — 0.3Impairment of other intangible assets 0.1 0.2 0.1
Total operating expenses 65.1 66.0 65.6
Operating income 15.0 13.5 12.4Interest expense, net 0.5 0.6 0.7Interest expense on debt extinguishment 0.2 — —Other income 0.2 0.1 —
Earnings before income taxes 14.5 13.0 11.7Provision for income taxes 4.5 4.1 3.7
Net earnings 10.0 8.9 8.0Net earnings attributable to noncontrolling interests — — —
Net earnings attributable to The Estée Lauder Companies Inc. 10.0% 8.9% 8.0%
2013
100.0%19.9
80.1
64.80.10.10.1
65.1
15.00.50.20.2
14.54.5
10.0—
10.0%
THE EST{E LAUDER COMPANIES INC. 119

In order to meet the demands of consumers, we continu-ally introduce new products, support new and established products through advertising, merchandising and sam-pling and phase out existing products that no longer meet the needs of our consumers or our objectives. The eco-nomics of developing, producing, launching, supporting and discontinuing products impact our sales and operat-ing performance each period. The introduction of new products may have some cannibalizing effect on sales of existing products, which we take into account in our busi-ness planning.
We operate on a global basis, with the majority of our net sales generated outside the United States. Accord-ingly, fluctuations in foreign currency exchange rates can affect our results of operations. Therefore, we present cer-tain net sales information excluding the effect of foreign currency rate fluctuations to provide a framework for assessing the performance of our underlying business outside the United States. Constant currency information compares results between periods as if exchange rates had remained constant period-over-period. We calculate constant currency information by translating current year results using prior year weighted-average foreign currency exchange rates.
OVERVIEWWe believe that the best way to continue to increase stockholder value is to provide our customers and con-sumers with the products and services that they have come to expect from us in the most efficient and profit-able manner while recognizing consumers’ changing shopping habits. To be the global leader in prestige beauty, we continued to implement a long-term strategy that is guiding us through fiscal 2016. The strategy has numerous initiatives across geographic regions, product categories, brands and functions that are designed to leverage our strengths, make us more productive and grow our sales.
We have a strong, diverse and highly valuable brand portfolio with global reach and potential, and we plan to continue building upon and leveraging our history of outstanding creativity, innovation and entrepreneurship. We have succeeded in expanding our distinctive “High-Touch” service model and will continue to look for ways to further evolve it within our channels of distribu-tion and geographic regions. As an example, we continue to develop capabilities to deliver superior retailing experi-ences, particularly in freestanding stores. We continue to increase brand awareness by expanding our efforts to
evolve our online strategy into a multi-pronged digital strategy encompassing e-commerce and m-commerce, as well as digital and social media. We are leveraging our regional organization in an effort to assure that we are locally relevant with our products, services, marketing and visual merchandising.
As part of our strategy, we are positioning ourselves to capitalize on opportunities in the fastest-growing areas in prestige beauty. Skin care, our most profitable product category, continues to be a strategic priority for our inno-vation and investment spending, particularly in the Asia/ Pacific region. We are also focusing our attention on luxury consumers across all product categories and have seen continued strength in the net sales of many of our higher-end prestige products. We will also continue to build our makeup product category through the introduc-tion of new product offerings, re-emphasize our focus on fragrance innovation to drive profitable growth and expand our hair care brands both in salons and in other retail channels.
We are strengthening our geographic presence by seeking share growth in large, image-building cities within core markets such as the United States, the United King-dom, France, Italy and Japan. In addition, we continue to prioritize efforts to expand our presence and accelerate share growth in emerging markets such as China, the Middle East, Eastern Europe and Brazil and focus on con-sumers who purchase in the travel retail channel, in stores at their travel destinations or when they return to their home market. We also continue to expand our digital presence which has resulted in growth in the net sales of our products sold online. In North America, we continue to implement programs to drive profitable growth in our traditional department store channel. At the same time, we are also expanding our presence in other channels, such as specialty retailers, freestanding stores and online. Internationally, we continue to take actions to grow in European perfumeries and pharmacies and in department stores in Asia. In addition, we are emphasizing our skin care and makeup initiatives to boost our travel retail busi-ness and continuing efforts to grow our freestanding store, online, specialty retailer and prestige salon busi-nesses. The travel retail business continues to be an important source of sales growth and profitability. Our business in this channel has benefited from the implemen-tation of programs we designed to target consumers in distinct travel corridors, enhance consumers’ “High-Touch” experiences and convert travelers into purchasers.
120 THE EST{E LAUDER COMPANIES INC.

While our overall business is performing well, we are seeing continued weakness in certain Southern European countries and Korea due to challenging economic envi-ronments. In Korea, we are also seeing competitive pres-sures in prestige beauty. Elsewhere, we are cautious of a slowing retail environment in the United States in the short term and a slowing of the future growth trend in China. During the first half of fiscal 2013, we also saw a slowing in the exceptional growth we had experienced in fiscal 2012 in travel retail, due in part to select retailer destocking to enable tighter working capital manage-ment. However, our sales growth in the channel has since improved and we expect this trend to continue into fiscal 2014. We believe we have and will continue to offset to some extent the impact of these events as a result of our strategy to mitigate weaknesses we find in certain areas with strengths in others. However, if economic conditions or the degree of uncertainty or volatility worsen or the adverse conditions previously discussed are further pro-longed, then we expect there to be a negative effect on ongoing consumer confidence, demand and spending and, as a result, our business. We will continue to monitor these and other risks that may affect our business. Our Venezuelan subsidiary has been operating in a highly inflationary economy since January 2010. In February 2013, the Venezuelan government announced the devalu-ation of its currency, the bolivar fuerte. This devaluation did not have a significant impact on our business or our consolidated financial statements for the year ended June 30, 2013. We do not expect this devaluation to have a significant impact on our ongoing future consolidated net sales or operating income. However, any further devalua-tion could have a negative effect on our local business.
We plan to continue to invest in the significant mod-ernization of our global information systems, which includes the Strategic Modernization Initiative (“SMI”) as well as other initiatives. As part of SMI, we anticipate the continued migration of our operations to SAP-based tech-nologies, with the majority of our locations being enabled through calendar 2014. During the fiscal 2013 third quar-ter SMI implementation of the global supply planning component, challenges emerged which caused some cus-tomer service delays and certain products to be out of stock. As a result, we decided to defer the previously scheduled January 2014 SMI implementation by six months. Subsequently, we resolved the SMI-related chal-lenges, so that customer service delays and products out of stock related to this rollout have improved as expected. These challenges did not have a significant impact on our
business or our consolidated financial results for the year ended June 30, 2013. We expect our initiatives should over time provide for overall profitability improvements by enhancing gross margin and supporting efficiencies in select operating expenses, which should enable us to stra-tegically reinvest our savings in activities that will support our future growth.
Looking ahead to fiscal 2014, we plan to continue building on our strengths and our heritage of innovation to bring unique and high-performance products with long-term appeal and enduring quality to our consumers. We expect our strategy will enable us to continue to suc-ceed in high growth channels, benefit from regional opportunities, focus on emerging market consumers and enhance our local relevance. We plan on continuing to bring highly innovative products to consumers and elevat-ing our personalized “High-Touch” philosophy through customization with key retailers, expansion in freestand-ing stores and extending it to fast-growing digital plat-forms. We remain dedicated to investing in select areas to improve our capabilities or develop new ones. Our main focuses are accelerating our digital capabilities, research and development, product innovation, consumer insight and local relevance.
RETURNS AND CHARGES ASSOCIATED WITH RESTRUCTURING ACTIVITIESIn an effort to drive down costs and achieve synergies within our organization, in February 2009, we announced the implementation of a multi-faceted cost savings pro-gram (the “Program”) to position the Company to achieve long-term profitable growth. We anticipated the Program would result in total cumulative restructuring charges and other costs to implement those initiatives of between $350 million and $450 million before taxes. During the second quarter of fiscal 2013, we closed the Program. We concluded the approval of all initiatives under the Pro-gram and anticipate commencing the execution of those initiatives through fiscal 2014. As a result of the closure of the Program and evaluation of the initiatives that have been implemented, as of June 30, 2013, we anticipate total cumulative restructuring charges and other costs to implement those initiatives to total between $320 million and $330 million and that such charges have been sub-stantially recorded through fiscal 2013. We will continue to monitor the progress of these initiatives and revise esti-mates as appropriate.
THE EST{E LAUDER COMPANIES INC. 121

• Turnaround or Exit Unprofitable Operations— To improve the profitability in certain of our brands and regions, we have selectively exited certain channels of distribution, categories and markets, and have made changes to turn around others. This included the exit from the global wholesale distribution of our Prescriptives brand, the reformulation of Ojon brand products and the exit from the global distribution of Sean John products. In con-nection with these activities, we incurred charges for product returns, inventory write-offs, reduction of work-force and termination of contracts. As of June 30, 2013, we identified approximately $21 million of previously-approved returns and other costs related to these activities that will not be incurred, primarily as a result of better-than-expected sales of products prior to the exit of the operations, as well as lower employee-related and store closure costs than originally estimated.
• Outsourcing — In order to balance the growing need for information technology support with our efforts to pro-vide the most efficient and cost effective solutions, we continued the outsourcing of certain information tech-nology processes. We incurred costs to transition services to outsource providers and employee-related termination costs. As of June 30, 2013, we identified approximately $26 million of previously-approved out-sourcing initiatives for information technology services stemming from the decision not to implement certain aspects of these initiatives, as well as lower costs than originally anticipated to transition services on initiatives that were implemented.
122 THE EST{E LAUDER COMPANIES INC.
We estimate that the implementation of this Program, combined with other on-going cost savings efforts, resulted in savings of approximately $780 million through the end of fiscal 2013 which included the reduction of certain costs relative to an assumed normalized spending pattern. Any changes from adjustments of estimated costs, as referenced above, have been included within our estimated savings. Our long-range forecast for operating margin reflects these anticipated savings, net of strategic reinvestments.
The Program focused on a redesign of our organiza-tional structure in order to integrate the Company in a more cohesive way and operate more globally across brands and functions. The principal aspect of the Program was the reduction of the workforce by approximately 2,000 employees. Specific actions taken since Program inception included:
• Resize and Reorganize the Organization—We continued the realignment and optimization of our organization to better leverage scale, improve productivity, reduce com-plexity and achieve cost savings in each region and across various functions. This included reduction of the workforce which occurred through the consolidation of certain functions, which we achieved through a combination of normal attrition and job eliminations, and the closure and consolidation of certain distribution and office facilities. As of June 30, 2013, we identified approximately $14 million of previously-approved restructuring costs that will not be incurred related to these activities, primarily as a result of certain employees relocating to other available positions within the Company.
The following is a reconciliation of cumulative approved charges under the Program as compared with the revised estimated charges related to initiatives under the Program and total cumulative charges incurred through June 30, 2013:
Restructuring Charges Total Contract Restructuring Employee- Terminations Charges and Related Asset and Other Total Inventory Other Other Costs (In millions) Costs Write-offs Exit Costs Restructuring Returns Write-offs Charges to Implement
Approved charges from inception through December 31, 2012 $205.5 $23.5 $43.5 $272.5 $43.0 $20.0 $50.0 $385.5
Adjustments of estimated costs over (under) (35.0) (2.0) (4.0) (41.0) (11.0) 4.0 (13.0) (61.0)
Revised estimated charges as of June 30, 2013 $170.5 $21.5 $39.5 $231.5 $32.0 $24.0 $37.0 $324.5
Cumulative charges incurred through June 30, 2013 $169.6 $21.4 $37.4 $228.4 $32.0 $23.2 $36.8 $320.4
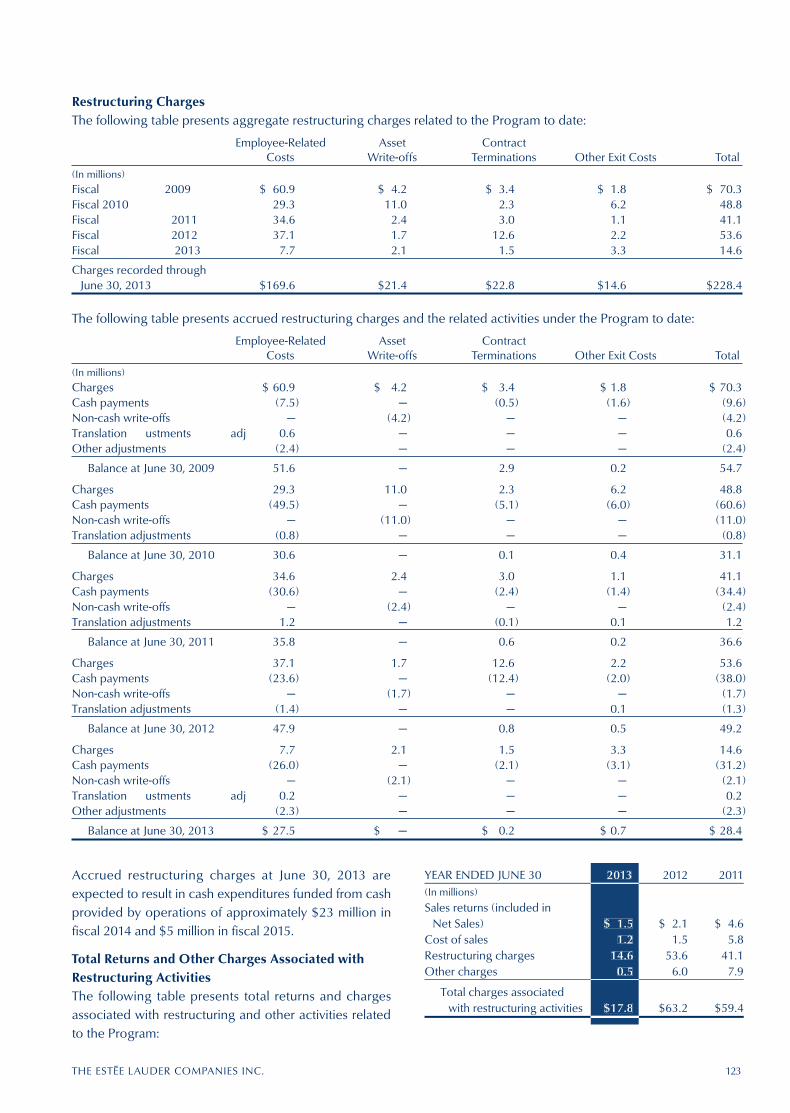
Accrued restructuring charges at June 30, 2013 are expected to result in cash expenditures funded from cash provided by operations of approximately $23 million in fiscal 2014 and $5 million in fiscal 2015.
Total Returns and Other Charges Associated with Restructuring ActivitiesThe following table presents total returns and charges associated with restructuring and other activities related to the Program:
YEAR ENDED JUNE 30 2013 2012 2011(In millions)
Sales returns (included in Net Sales) $ 1.5 $ 2.1 $ 4.6
Cost of sales 1.2 1.5 5.8Restructuring charges 14.6 53.6 41.1Other charges 0.5 6.0 7.9
Total charges associated with restructuring activities $17.8 $63.2 $59.4
2013
$ 1.51.2
14.60.5
$17.8
THE EST{E LAUDER COMPANIES INC. 123
Restructuring ChargesThe following table presents aggregate restructuring charges related to the Program to date:
Employee-Related Asset Contract Costs Write-offs Terminations Other Exit Costs Total(In millions)Fiscal 2009 $ 60.9 $ 4.2 $ 3.4 $ 1.8 $ 70.3Fiscal 2010 29.3 11.0 2.3 6.2 48.8Fiscal 2011 34.6 2.4 3.0 1.1 41.1Fiscal 2012 37.1 1.7 12.6 2.2 53.6Fiscal 2013 7.7 2.1 1.5 3.3 14.6
Charges recorded through June 30, 2013 $169.6 $21.4 $22.8 $14.6 $228.4
The following table presents accrued restructuring charges and the related activities under the Program to date:
Employee-Related Asset Contract Costs Write-offs Terminations Other Exit Costs Total(In millions)Charges $ 60.9 $ 4.2 $ 3.4 $ 1.8 $ 70.3Cash payments (7.5) — (0.5) (1.6) (9.6)Non-cash write-offs — (4.2) — — (4.2)Translation adjustments 0.6 — — — 0.6Other adjustments (2.4) — — — (2.4)
Balance at June 30, 2009 51.6 — 2.9 0.2 54.7
Charges 29.3 11.0 2.3 6.2 48.8Cash payments (49.5) — (5.1) (6.0) (60.6)Non-cash write-offs — (11.0) — — (11.0)Translation adjustments (0.8) — — — (0.8)
Balance at June 30, 2010 30.6 — 0.1 0.4 31.1
Charges 34.6 2.4 3.0 1.1 41.1Cash payments (30.6) — (2.4) (1.4) (34.4)Non-cash write-offs — (2.4) — — (2.4)Translation adjustments 1.2 — (0.1) 0.1 1.2
Balance at June 30, 2011 35.8 — 0.6 0.2 36.6
Charges 37.1 1.7 12.6 2.2 53.6Cash payments (23.6) — (12.4) (2.0) (38.0)Non-cash write-offs — (1.7) — — (1.7)Translation adjustments (1.4) — — 0.1 (1.3)
Balance at June 30, 2012 47.9 — 0.8 0.5 49.2
Charges 7.7 2.1 1.5 3.3 14.6Cash payments (26.0) — (2.1) (3.1) (31.2)Non-cash write-offs — (2.1) — — (2.1)Translation adjustments 0.2 — — — 0.2Other adjustments (2.3) — — — (2.3)
Balance at June 30, 2013 $ 27.5 $ — $ 0.2 $ 0.7 $ 28.4

During fiscal 2013, we recorded $1.5 million reflecting sales returns (less related cost of sales of $0.2 million) and a write-off of inventory of $1.4 million associated with exiting unprofitable operations.
During fiscal 2012, we recorded $2.1 million reflecting sales returns (less related cost of sales of $0.3 million) and a write-off of inventory of $1.8 million associated with exiting unprofitable operations.
During fiscal 2011, we recorded $4.6 million reflecting sales returns (less related cost of sales of $1.2 million) and a write-off of inventory of $7.0 million associated with turnaround operations, primarily related to the reformula-tion of Ojon brand products.
Other charges in connection with the implementation of the Program primarily relate to consulting and other professional services.
GOODWILL AND OTHER INTANGIBLE ASSET IMPAIRMENTSAs of our annual step-one goodwill impairment test on April 1, 2013, all reporting units’ fair values substantially exceeded their respective carrying values, with the exception of our Darphin reporting unit. As a result, we recorded an impairment charge for the remainder of the goodwill related to the Darphin reporting unit of $9.6 mil-lion. The fair value of the reporting unit was based upon the income approach, utilizing estimated cash flows and a terminal value, discounted at a rate of return that reflects the relative risk of cash flows. As of our annual indefinite-lived asset impairment test on April 1, 2013, the fair values of all other indefinite-lived intangible assets substantially exceeded their respective carrying values, with the excep-tion of our Darphin trademark. We determined that the carrying value of this trademark exceeded its estimated fair value, which was based on the relief-from-royalty method. As a result, we recognized an impairment charge of $8.1 million for the remaining carrying value of the related trademark. These impairment charges were reflected in the skin care product category and in the Europe, the Middle East & Africa region.
We will continue to monitor and evaluate the potential impact of the volatility of global economic conditions and uncertainties on our business and on our annual impair-ment testing. Accordingly, it is possible that we could rec-ognize an impairment charge in the future with respect to goodwill, other intangible assets and/or long-lived assets.
FISCAL 2013 AS COMPARED WITH FISCAL 2012
NET SALESNet sales increased 5%, or $468.1 million, to $10,181.7 million, reflecting growth in all of our major product categories within each geographic region. Excluding the impact of foreign currency translation, net sales increased 6%.
The following discussions of Net Sales by Product Categories and Geographic Regions exclude the impact of returns associated with restructuring activities of $1.5 million and $2.1 million recorded during fiscal 2013 and fiscal 2012, respectively. We believe the following analysis of net sales better reflects the manner in which we conduct and view our business.
Product CategoriesSkin Care Net sales of skin care products increased 6%, or $240.1 million, to $4,465.3 million. The recent launches of Perfectionist CP+R, Advanced Time Zone, Advanced Night Repair Eye Serum Infusion and the Optimizer line of products from Estée Lauder contributed approximately $273 million, combined, to the increase. Also contributing approximately $99 million, combined, to the increase were the recent launches of The Moisturizing Soft Cream from La Mer and Even Better Eyes Dark Circle Corrector from Clinique. Partially offsetting these increases were lower sales of Perfectionist CP+ Serum and Time Zone, as well as Idealist Even Skintone Illuminator, which was a new launch in the prior year, from Estée Lauder of approximately $162 million, combined. Excluding the impact of foreign currency translation, skin care net sales increased 7%.
Makeup Makeup net sales increased 5%, or $180.1 mil-lion, to $3,876.9 million, primarily reflecting an increase in net sales from our makeup artist brands of approximately $156 million, combined. The recent launches of High Impact Extreme Volume Mascara and Chubby Stick Intense from Clinique and Pure Color Vivid Shine Lipstick from Estée Lauder contributed approximately $47 million of incremental sales, combined to the increase. Partially offsetting these increases were lower sales of Repairwear Laser Focus Makeup from Clinique and Pure Color Eyeshadow and Doublewear Stay-In-Place Makeup from Estée Lauder, all of which were new launches in the prior year, of approximately $45 million, combined. Excluding the impact of foreign currency translation, makeup net sales increased 6%.
124 THE EST{E LAUDER COMPANIES INC.

Fragrance Net sales of fragrance products increased 3%, or $39.8 million, to $1,310.8 million. Incremental sales from the recent launches of Zegna Uomo, DKNY Be Delicious So Intense, Tommy Hilfiger Freedom Men and Coach Love contributed approximately $30 million, combined, to the increase. Higher sales of Jo Malone and Tom Ford fragrances contributed approximately $60 million, combined, to the increase. These increases were partially offset by lower sales of Estée Lauder Sensuous Nude and DKNY Golden Delicious, both of which were new launches in the prior year, as well as pureDKNY, of approximately $52 million, combined. Excluding the impact of foreign currency translation, fragrance net sales increased 4%.
Hair Care Hair care net sales increased 6%, or $26.5 million, to $488.9 million, primarily reflecting the contin-ued success of the Invati line of products and recent launches of Pure Abundance Style Prep and Be Curly Curl Controller from Aveda. The category also benefited from sales generated from expanded global distribution, in particular, to salons for Aveda and multi-brand specialty retailers for Bumble and bumble. Partially offset-ting these increases were lower sales of Bumble and bumble brand products to salons and lower net sales of Ojon brand products due, in part, to a reduction in our business in the DRTV channel. The impact of foreign currency translation on hair care net sales was de minimis.
Geographic RegionsNet sales in the Americas increased 5%, or $201.8 million, to $4,302.9 million. The increase during the current year was primarily attributable to growth in the United States of approximately $172 million, due in large part to prod-uct offerings from our heritage and makeup artist brands. Net sales in Canada increased approximately $13 million, primarily reflecting increased sales from certain of our heritage brands as a result of expanded distribution. These increases also reflect the efforts of our expanded pull/push activities, which include innovative advertising that continues to draw new consumers to our brands and our ongoing efforts to work with retailers in the United States and Canada on strengthening the “High-Touch” concepts used to help market our products. We are cau-tious of a slowing retail environment in the United States in the short term. Net sales in Latin America increased approximately $19 million, led by Venezuela and Mexico. The impact of foreign currency translation on net sales in the Americas was de minimis.
In Europe, the Middle East & Africa, net sales increased 4%, or $155.5 million, to $3,758.7 million, primarily reflecting higher sales from our travel retail business and
in the United Kingdom and the Middle East of approxi-mately $185 million, combined. The net sales increase in our travel retail business primarily reflected a strong retail environment for our products, new product launches and, to a lesser extent, an increase in global airline passenger traffic. Higher sales in the United Kingdom were primarily driven by our makeup artist brands and new product launches from certain of our heritage brands. In addition, the United Kingdom benefited from increased sales of certain of our luxury fragrance and skin care products. Higher sales in the Middle East were primarily driven by our makeup artist brands and sales of luxury fragrances. These increases in the region were partially offset by lower net sales in Spain, Russia, Switzerland and the Bal-kans of approximately $45 million, combined. With the exception of Russia, these lower net sales reflected the challenging economic environments in certain countries in Europe. Accordingly, we remain cautious in the near term. The lower net sales in Russia primarily reflected destocking associated with ongoing challenges with a certain customer. The overall change in Europe, the Middle East & Africa net sales was inclusive of unfavorable exchange rates due to the strengthening of the U.S. dollar against most currencies in this region of approximately $75 million. Excluding the impact of foreign currency translation, net sales in Europe, the Middle East & Africa increased 6%.
Net sales in Asia/Pacific increased 5%, or $110.2 mil-lion, to $2,121.6 million, primarily reflecting growth in our sales of skin care products, in line with our strategy. We increased sales by approximately $160 million in China and Hong Kong. Net sales in China benefited from expanded distribution. While we gained share in the pres-tige business in China, we are cautious that a slowing of the future growth trend of the Chinese economy may temper our retail sales growth, including that of our travel retail business. Higher sales in Hong Kong were primarily driven by launches from our heritage brands and higher-end prestige skin care products. These increases were partially offset by lower net sales in Korea and Japan of approximately $66 million, combined. The lower net sales in Korea primarily reflected a challenging economic envi-ronment and continued competitive pressures facing prestige beauty in Korea. The decline in Japan was driven by the weakening of the Japanese yen. Excluding the impact of foreign currency translation, net sales in Asia/ Pacific increased 6%.
We strategically stagger our new product launches by geographic market, which may account for differences in regional sales growth.
THE EST{E LAUDER COMPANIES INC. 125

126 THE EST{E LAUDER COMPANIES INC.
of total returns and charges associated with restructuring activities of $17.8 million, or 0.2% of net sales, in fiscal 2013 and $63.2 million, or 0.7% of net sales, in fiscal 2012. We believe the following analysis of operating results better reflects the manner in which we conduct and view our business.
Product CategoriesSkin care operating income increased 11%, or $83.4 mil-lion, to $830.1 million, primarily reflecting improved results from higher-margin product launches from Estée Lauder and La Mer, partially offset by goodwill and other intangible asset impairment charges of $17.7 million. Makeup operating income increased 8%, or $42.4 mil-lion, to $580.4 million, primarily reflecting improved results from our M.A.C brand, partially offset by certain of our heritage brands and an increase in investment spend-ing in line with our strategy. Fragrance operating income increased 20%, or $20.2 million, to $120.3 million, primarily reflecting increased profitability from certain Jo Malone, Estée Lauder and Clinique products, partially offset by lower results from certain of our designer fragrances. Hair care operating results increased over 100%, or $14.5 million, to $26.7 million, due to a favor-able comparison to the prior year which was impacted by other intangible asset impairment charges of $21.7 mil-lion, partially offset by lower sales of Bumble and bumble brand products and higher investment spending by Aveda to support the Invati line of products.
Geographic RegionsOperating income in the Americas increased 47%, or $134.8 million, to $423.2 million, primarily reflecting improved results from our makeup artist and luxury brands and certain of our hair care and heritage brands, driven by improved category mix, partially offset by the timing and level of strategic investment spending in the current year.
In Europe, the Middle East & Africa, operating income increased 9%, or $67.1 million, to $813.4 million. Higher results from our travel retail business, the Middle East and the United Kingdom totaled approximately $77 million, combined. Partially offsetting these improvements were lower results in Germany and Spain of approximately $5 million, combined, as well as goodwill and other intangi-ble asset impairment charges of $17.7 million.
In Asia/Pacific, operating income decreased 10%, or $33.0 million, to $307.2 million. Higher results from China and Thailand totaled approximately $22 million, com-bined. These higher results were more than offset by lower operating results of approximately $51 million in Korea, Hong Kong and Japan, combined. The lower
COST OF SALESCost of sales as a percentage of total net sales decreased to 19.9% as compared with 20.5% in the prior year. This improvement reflected changes in the mix of our business and pricing of approximately 40 basis points, favorable manufacturing variances of approximately 20 basis points and the favorable effect of exchange rates of approxi-mately 10 basis points. These improvements were partially offset by a provision for foreign transactional taxes of approximately 10 basis points.
Since certain promotional activities are a component of sales or cost of sales and the timing and level of promo-tions vary with our promotional calendar, we have experi-enced, and expect to continue to experience, fluctuations in the cost of sales percentage. In addition, future cost of sales mix may be impacted by the inclusion of potential new brands or channels of distribution that have margin and product cost structures different from those of our current mix of business.
OPERATING EXPENSESOperating expenses as a percentage of net sales decreased to 65.1% as compared with 66.0% in the prior year. This improvement reflected a decrease in general and administrative costs as a percentage of net sales of approximately 50 basis points, a decrease in charges asso-ciated with restructuring activities of approximately 40 basis points and lower selling and shipping costs as a per-centage of net sales of 10 basis points. Also included in this improvement was a favorable change in foreign exchange transactions of approximately 10 basis points and lower charges associated with other intangible asset impairments of approximately 10 basis points. Partially offsetting these improvements were higher costs related to stock-based compensation of approximately 20 basis points and increased spending on advertising, merchan-dising and sampling in line with our strategy of approxi-mately 10 basis points.
Changes in advertising, merchandising and sampling spending result from the type, timing and level of activi-ties related to product launches and rollouts, as well as the markets being emphasized.
OPERATING RESULTSOperating income increased 16%, or $214.3 million, to $1,526.0 million. Operating margin increased to 15.0% of net sales as compared with 13.5% in the prior year, reflecting our higher gross margin and the decrease in our operating expense margin, as previously discussed. The following discussions of Operating Results by Product Categories and Geographic Regions exclude the impact

THE EST{E LAUDER COMPANIES INC. 127
the effective income tax rate of 120 basis points was principally due to a decrease in the effective tax rate of our foreign operations as compared with the prior year, as well as the retroactive reinstatement of the U.S. federal research and development tax credit signed into law on January 2, 2013.
NET EARNINGS ATTRIBUTABLE TO THE EST{E LAUDER COMPANIES INC.Net earnings attributable to The Estée Lauder Companies Inc. as compared with fiscal 2012 increased 19%, or $162.9 million, to $1,019.8 million and diluted net earn-ings per common share increased 20% from $2.16 to $2.58. The results in the current year include the impact of total returns and charges associated with restructuring activities of $11.7 million, after tax, or $.03 per diluted common share. The results in fiscal 2012 year include the impact of total returns and charges associated with restructuring activities of $44.1 million, after tax, or $.11 per diluted common share.
FISCAL 2012 AS COMPARED WITH FISCAL 2011
NET SALESNet sales increased 10%, or $903.6 million, to $9,713.6 million, reflecting growth in all of our major product categories within each geographic region. The impact of foreign currency translation on net sales was de minimis.
The following discussions of Net Sales by Product Categories and Geographic Regions exclude the impact of returns associated with restructuring activities of $2.1 million and $4.6 million recorded during fiscal 2012 and fiscal 2011, respectively. We believe the following analysis of net sales better reflects the manner in which we conduct and view our business.
Product CategoriesSkin Care Net sales of skin care products increased 14%, or $506.6 million, to $4,225.2 million, primarily reflecting the continued success of our strategic focus on growing this category. The fiscal 2012 launches of Turnaround Overnight Radiance Moisturizer, Moisture Surge Intense and Repairwear Uplifting Firming Cream from Clinique and Revitalizing Supreme Global Anti-Aging Creme from Estée Lauder contributed incremental sales of approxi-mately $78 million, combined. Higher sales of Idealist Even Skintone Illuminator, Advanced Night Repair Synchronized Recovery Complex and Idealist Cooling Eye Illuminator from Estée Lauder and various products from La Mer and Origins contributed approximately $237 mil-lion, combined, to the increase. The fiscal 2012 relaunch of the reformulated Resilience Lift and Nutritious
results in Hong Kong were due in part to investment spending to support new product launches.
INTEREST EXPENSE, NETNet interest expense was $54.8 million as compared with $61.1 million in the prior year. Interest expense decreased primarily due to the refinancing of debt at lower rates.
INTEREST EXPENSE ON DEBT EXTINGUISHMENTDuring the first quarter of fiscal 2013, we redeemed the $230.1 million principal amount of our 7.75% Senior Notes due 2013 at a price of 108% of the principal amount. We recorded a pre-tax expense on the extin-guishment of debt of $19.1 million representing the call premium of $18.6 million and the pro-rata write-off of $0.5 million of issuance costs and debt discount.
OTHER INCOMEIn December 2012, we amended the agreement related to the August 2007 sale of Rodan + Fields (a brand then owned by us) to receive a fixed amount in lieu of future contingent consideration and other rights. Accordingly, we recognized $22.4 million, net of discount of $0.4 mil-lion, which has been classified as other income in our consolidated statements of earnings. Prior to this amend-ment, we earned and received $0.7 million of contingent consideration.
In November 2011, we settled a commercial dispute with third parties that was outside our normal operations. In connection therewith, we received a $10.5 million cash payment, which has been classified as other income in our consolidated statement of earnings.
PROVISION FOR INCOME TAXESThe provision for income taxes represents U.S. federal, foreign, state and local income taxes. The effective rate differs from the federal statutory rate primarily due to the effect of state and local income taxes, the taxation of for-eign income and income tax reserve adjustments, which represent changes in our net liability for unrecognized tax benefits including tax settlements and lapses of the applicable statutes of limitations. Our effective tax rate will change from year to year based on recurring and non-recurring factors including, but not limited to, the geographical mix of earnings, enacted tax legislation, state and local income taxes, tax reserve adjustments, the ultimate disposition of deferred tax assets relating to stock-based compensation and the interaction of various global tax strategies.
The effective income tax rate for fiscal 2013 was 30.6% as compared with 31.8% in the prior year. The decrease in
128 THE EST{E LAUDER COMPANIES INC.
Geographic RegionsNet sales in the Americas increased 8%, or $304.8 million, to $4,101.1 million. The increase in fiscal 2012 was primar-ily attributable to growth in the United States of approxi-mately $257 million, primarily due to new product offerings from our heritage and makeup artist brands, as well as an increase in sales of our higher-end prestige skin care products. These increases reflect, in part, our ongo-ing efforts to work with retailers in the U.S. department store channel on strengthening the “High-Touch” con-cepts used to help market our products. Net sales in Latin America increased approximately $30 million, primarily reflecting growth in Brazil and Chile. Net sales in Canada increased approximately $19 million, primarily reflecting increased sales from our heritage and makeup artist brands. The impact of foreign currency translation on net sales in the Americas was de minimis.
In Europe, the Middle East & Africa, net sales increased 11%, or $345.6 million, to $3,603.2 million, due to growth in each major product category reflecting our strategy to strengthen our geographic presence and continue to suc-ceed in the travel retail channel. Due to the economic uncertainties in Europe, our business in some countries experienced slower than anticipated net sales growth. Net sales increases of approximately $313 million were driven by our travel retail business, the United Kingdom, the Middle East, Germany and Italy. The net sales improve-ment in our travel retail business reflected an increase in global airline passenger traffic, new points of distribution and benefits of programs designed to enhance consum-ers’ “High-Touch” experiences and convert travelers into purchasers. The growth in the United Kingdom, Germany and Italy was primarily attributable to successful launches of skin care and makeup products from certain of our heritage brands, as well as higher combined sales from our makeup artist brands. Net sales in the Middle East benefited from a new fragrance launch designed specifi-cally for consumers there, in line with our strategy to be locally relevant. These increases were partially offset by lower net sales in Russia, Spain and the Balkans of approx-imately $25 million, combined. The lower net sales in Russia primarily reflected destocking associated with ongoing challenges with a certain customer. Net sales in Spain and the Balkans declined primarily due to difficult economic environments. Excluding the impact of foreign currency translation, net sales in Europe, the Middle East & Africa increased 12%.
Net sales in Asia/Pacific increased 14%, or $250.7 mil-lion, to $2,011.4 million, reflecting growth in each major product category and from most countries in the region, several of which had a significant favorable impact of
Vita-Mineral lines of products from Estée Lauder con-tributed incremental sales of approximately $187 million, combined. This growth was partially offset by approxi-mately $112 million of lower sales from the existing line of Resilience Lift Extreme products from Estée Lauder and Cyber White EX from Clinique. Excluding the impact of foreign currency translation, skin care net sales increased 13%.
Makeup Makeup net sales increased 10%, or $326.0 mil-lion, to $3,696.8 million, primarily reflecting an increase in net sales from our makeup artist brands of approximately $218 million, combined. The fiscal 2012 launches of Repairwear Laser Focus All-Smooth Makeup and Lid Smoothie Antioxidant 8-Hour Eye Colour from Clinique and Doublewear Stay-In-Place Makeup from Estée Lauder contributed approximately $85 million, combined, to the increase. Higher sales of Even Better Makeup and Chubby Stick Moisturizing Lip Colour balm from Clinique contrib-uted approximately $41 million to the increase. This growth was partially offset by lower sales of Doublewear Powder Makeup and Doublewear Stay-in-Place Flawless Wear Concealer from Estée Lauder and Repairwear Anti-Aging Makeup from Clinique of approximately $34 mil-lion, combined. The impact of foreign currency translation on makeup net sales was de minimis.
Fragrance Net sales of fragrance products increased 3%, or $35.0 million, to $1,271.0 million. Incremental sales from the fiscal 2012 launches of Estée Lauder Sensuous Nude and DKNY Golden Delicious contributed approxi-mately $58 million, combined, to the category. Higher sales from Jo Malone and Tom Ford fragrances contrib-uted approximately $37 million to the increase. Partially offsetting these increases were approximately $68 million, combined, of lower sales of DKNY Be Delicious, Estée Lauder Sensuous, pureDKNY and Estée Lauder pleasures bloom. The impact of foreign currency translation on fragrance net sales was de minimis.
Hair Care Hair care net sales increased 7%, or $30.1 million, to $462.4 million, reflecting an increase in sales generated from expanded global distribution. The cate-gory also benefited from fiscal 2012 launches including the Invati line of products from Aveda and Concen-Straight from Bumble and bumble. Partially offsetting these increases were lower net sales of Ojon brand prod-ucts due, in part, to softness in our business in the DRTV channel. The impact of foreign currency translation on hair care net sales was de minimis.

THE EST{E LAUDER COMPANIES INC. 129
OPERATING RESULTSOperating income increased 20%, or $222.3 million, to $1,311.7 million. Operating margin increased to 13.5% of net sales as compared with 12.4% in fiscal 2011, reflecting our higher gross margin, partially offset by the increase in our operating expense margin, as previously discussed. The following discussions of Operating Results by Product Categories and Geographic Regions exclude the impact of total returns and charges associated with restructuring activities of $63.2 million, or 0.7% of net sales, in fiscal 2012 and $59.4 million, or 0.7% of net sales, in fiscal 2011. We believe the following analysis of operating results better reflects the manner in which we conduct and view our business.
Product CategoriesSkin care operating income increased 25%, or $151.6 mil-lion, to $746.7 million, primarily reflecting improved results from higher-margin product launches from certain of our heritage brands, as well as increased results from higher-end prestige skin care products. Makeup operating income increased 9%, or $44.2 million, to $538.0 million, primarily reflecting improved results from our makeup art-ist brands. Both our skin care and makeup categories were impacted by higher investment spending on global advertising, merchandising and sampling to support major launches and existing franchises in line with our strategy. Fragrance operating income increased 24%, or $19.4 million, to $100.1 million, primarily reflecting improved cost of goods and a more strategically focused approach to spending from our heritage brands as part of our strategy to improve profitability. Hair care operating results increased over 100%, or $21.3 million, to $12.2 million, primarily reflecting expanded global distribution, improved results driven by new product launches, as well as a favorable comparison to fiscal 2011 which was impacted by higher goodwill and other intangible asset impairment charges of $15 million.
Geographic RegionsOperating income in the Americas increased 18%, or $43.5 million, to $288.4 million, primarily reflecting improved results from our heritage and makeup artist brands that were driven by improved category mix, as well as a favorable comparison to fiscal 2011 which was impacted by higher goodwill and other intangible asset impairment charges of $16 million. Partially offsetting these improvements was the level of strategic investment spending in fiscal 2012.
In Europe, the Middle East & Africa, operating income increased 14%, or $94.4 million, to $746.3 million. Higher results from our travel retail business and the Middle East
foreign currency translation. Net sales of approximately $193 million were driven by China, Hong Kong and Thailand, combined, primarily reflecting strong sales of skin care and makeup products. Our businesses in Japan, Korea and Australia continued to be challenged due to difficult economic conditions, but we reported net sales gains of approximately $37 million, combined, which for both Japan and Australia were generated predominantly from the strengthening of their respective currencies. Excluding the impact of foreign currency translation, Asia/ Pacific net sales increased 11%.
We strategically stagger our new product launches by geographic market, which may account for differences in regional sales growth.
COST OF SALESCost of sales as a percentage of total net sales decreased to 20.5% as compared with 22.0% in fiscal 2011. This improvement primarily reflected our efforts in connection with the Program, including strategic changes in the mix of our business and pricing of approximately 140 basis points, favorable manufacturing variances of approxi-mately 10 basis points and the favorable effect of exchange rates of approximately 10 basis points. These improvements were partially offset by an increase in obso-lescence charges of approximately 10 basis points.
OPERATING EXPENSESOperating expenses as a percentage of net sales increased to 66.0% as compared with 65.6% in fiscal 2011. This change reflected increased spending in adver-tising, merchandising and sampling costs in line with our strategy of approximately 80 basis points, higher costs related to stock-based compensation of approximately 20 basis points, an increase in general and administrative costs of approximately 10 basis points and higher charges associated with restructuring activities of approximately 10 basis points. Partially offsetting these changes were lower selling and shipping costs as a percentage of net sales of approximately 50 basis points, lower charges associated with goodwill and other intangible asset impairments of approximately 20 basis points and a favorable change in foreign exchange transactions of approximately 10 basis points.
Changes in advertising, merchandising and sampling spending result from the type, timing and level of activi-ties related to product launches and rollouts, as well as the markets being emphasized.

130 THE EST{E LAUDER COMPANIES INC.
returns and charges associated with restructuring activi-ties of $44.1 million, after tax, or $.11 per diluted common share. The results in fiscal 2011 include the impact of total returns and charges associated with restructuring activities of $41.7 million, after tax, or $.10 per diluted common share.
FINANCIAL CONDITION
LIQUIDITY AND CAPITAL RESOURCESOverviewOur principal sources of funds historically have been cash flows from operations, borrowings pursuant to our com-mercial paper program, borrowings from the issuance of long-term debt and committed and uncommitted credit lines provided by banks and other lenders in the United States and abroad. At June 30, 2013, we had cash and cash equivalents of $1,495.7 million compared with $1,347.7 million at June 30, 2012. Our cash and cash equivalents are maintained at a number of financial insti-tutions. As of June 30, 2013, less than 1% of the total bal-ance was insured by governmental agencies, reflecting the expiration of temporary unlimited deposit insurance provided in the United States. To mitigate the risk of unin-sured balances, we select financial institutions based on their credit ratings and financial strength and perform ongoing evaluations of these institutions to limit our concentration risk exposure.
Our business is seasonal in nature and, accordingly, our working capital needs vary. From time to time, we may enter into investing and financing transactions that require additional funding. To the extent that these needs exceed cash from operations, we could, subject to market conditions, issue commercial paper, issue long-term debt securities or borrow under our revolving credit facilities.
Based on past performance and current expectations, we believe that cash on hand, cash generated from opera-tions, available credit lines and access to credit markets will be adequate to support currently planned business operations, information systems enhancements, capital expenditures, potential stock repurchases, commitments and other contractual obligations on both a near-term and long-term basis. Our cash and cash equivalents balance at June 30, 2013 includes approximately $871 million of cash in offshore jurisdictions associated with our perma-nent reinvestment strategy. We do not believe that the indefinite reinvestment of these funds offshore impairs our ability to meet our domestic debt or working capital obligations. If these indefinitely reinvested earnings were repatriated into the United States as dividends, we would be subject to additional taxes.
totaled approximately $109 million, combined. Partially offsetting these improvements were lower results in Rus-sia and France of approximately $28 million, combined. The lower results in Russia primarily reflected strategic investment spending to support this emerging market, coupled with a decrease in sales as a result of destocking associated with ongoing challenges with a certain cus-tomer. The lower results in France primarily reflected stra-tegic investment spending.
In Asia/Pacific, operating income increased 35%, or $88.2 million, to $340.2 million. Most countries in the region reported higher operating results, led by approxi-mately $70 million in Hong Kong, China, Japan and Korea, combined.
INTEREST EXPENSE, NETNet interest expense was $61.1 million as compared with $63.9 million in fiscal 2011. Interest expense decreased due to the replacement of our 6.00% Senior Notes in January 2012 with commercial paper.
PROVISION FOR INCOME TAXESThe provision for income taxes represents U.S. federal, foreign, state and local income taxes. The effective rate differs from the federal statutory rate primarily due to the effect of state and local income taxes, the taxation of for-eign income and income tax reserve adjustments, which represent changes in our net liability for unrecognized tax benefits including tax settlements and lapses of the appli-cable statutes of limitations. Our effective tax rate will change from year to year based on recurring and non-recurring factors including, but not limited to, the geo-graphical mix of earnings, enacted tax legislation, state and local income taxes, tax reserve adjustments, the ulti-mate disposition of deferred tax assets relating to stock-based compensation and the interaction of various global tax strategies.
The effective income tax rate for fiscal 2012 was 31.8% as compared with 31.4% in fiscal 2011. The increase in the effective income tax rate of 40 basis points was principally due to a decrease in favorable tax reserve adjustments as compared with fiscal 2011 partially offset by a lower effective tax rate related to our foreign operations.
NET EARNINGS ATTRIBUTABLE TO THE EST{E LAUDER COMPANIES INC.Net earnings attributable to The Estée Lauder Companies Inc. as compared with fiscal 2011 increased 22%, or $156.1 million, to $856.9 million and diluted net earnings per common share increased 24% from $1.74 to $2.16. The results in fiscal 2012 include the impact of total

THE EST{E LAUDER COMPANIES INC. 131
Downgrades in our credit ratings may reduce our ability to issue commercial paper and/or long-term debt and would likely increase the relative costs of borrowing. A credit rating is not a recommendation to buy, sell, or hold securities, is subject to revision or withdrawal at any time by the assigning rating organization, and should be evalu-ated independently of any other rating. As of August 19, 2013, our commercial paper is rated A-1 by Standard & Poor’s and P-1 by Moody’s and our long-term debt is rated A with a stable outlook by Standard & Poor’s and A2 with a stable outlook by Moody’s.
The effects of inflation have not been significant to our overall operating results in recent years. Generally, we have been able to introduce new products at higher prices, increase prices and implement other operating efficiencies to sufficiently offset cost increases, which have been moderate.
Credit RatingsChanges in our credit ratings will likely result in changes in our borrowing costs. Our credit ratings also impact the cost of our revolving credit facility as discussed below.
DebtAt June 30, 2013, our outstanding borrowings were as follows: Long-term Debt Current Debt Total Debt(In millions)
3.70% Senior Notes, due August 15, 2042 (“2042 Senior Notes”)(1), (6) $ 248.9 $ — $ 248.96.00% Senior Notes, due May 15, 2037 (“2037 Senior Notes”)(2), (6) 296.5 — 296.55.75% Senior Notes, due October 15, 2033 (“2033 Senior Notes”)(3) 197.8 — 197.82.35% Senior Notes, due August 15, 2022 (“2022 Senior Notes”)(4), (6) 249.8 — 249.85.55% Senior Notes, due May 15, 2017 (“2017 Senior Notes”)(5), (6) 328.0 — 328.0Other borrowings 5.0 18.3 23.3
$1,326.0 $18.3 $1,344.3
(1) Consists of $250.0 million principal and unamortized debt discount of $1.1 million.
(2) Consists of $300.0 million principal and unamortized debt discount of $3.5 million.
(3) Consists of $200.0 million principal and unamortized debt discount of $2.2 million.
(4) Consists of $250.0 million principal and unamortized debt discount of $0.2 million.
(5) Consists of $300.0 million principal, unamortized debt discount of $0.2 million and a $28.2 million adjustment to reflect the termination value of interest rate swaps.
(6) As of June 30, 2013, we were in compliance with all restrictive covenants, including limitations on indebtedness and liens, and expect continued compliance.
In August 2012, we issued $250.0 million of 2.35% Senior Notes due August 15, 2022 (“2022 Senior Notes”) and $250.0 million of 3.70% Senior Notes due August 15, 2042 (“2042 Senior Notes”) in a public offering. The 2022 Senior Notes were priced at 99.911% with a yield of 2.360%. The 2042 Senior Notes were priced at 99.567% with a yield of 3.724%. Interest payments on both notes are required to be made semi-annually on February 15 and August 15, commencing February 15, 2013. During the first quarter of fiscal 2013, we used the net proceeds of the offering to redeem the $230.1 million principal amount of our 7.75% Senior Notes due November 1, 2013 at a price of 108% of the principal amount and recorded a pre-tax expense on the extinguishment of debt of $19.1 million representing the call premium of $18.6 million and the pro-rata write-off of $0.5 million of issu-ance costs and debt discount. We used the remaining net proceeds of the offering for general corporate purposes.
We have a commercial paper program under which we may issue commercial paper in the United States. In the second quarter of fiscal 2013, we increased the limit of this program from $750.0 million to $1.0 billion. In the first quarter of fiscal 2013, we had repaid, using cash on hand, $200.0 million of commercial paper that was out-standing at June 30, 2012. At June 30, 2013, we had no commercial paper outstanding.
We have a $1.0 billion senior unsecured revolving credit facility that expires on July 14, 2015 (the “Facility”). The Facility may be used to provide credit support for our commercial paper program and for general corporate purposes. Up to the equivalent of $250 million of the Facility is available for multi-currency loans. The interest rate on borrowings under the Facility is based on LIBOR or on the higher of prime, which is the rate of interest publicly announced by the administrative agent, or ½% plus the Federal funds rate. We incurred costs of
resulting from the timing and level of tax payments. Cash flows from operating activities increased in fiscal 2012 as compared with fiscal 2011 primarily driven by an increase in net earnings, favorable levels of accounts payable, primarily due to the timing of payments, and a decrease in the levels of inventory. These improvements were partially offset by the change in other liabilities, primarily due to the timing of payments and costs related to employee compensation, advertising, merchandising and sampling, and payroll and other taxes, as well as an increase in accounts receivable balances primarily due to the timing of shipments.
Net cash used for investing activities was $465.5 mil-lion, $428.3 million and $606.9 million in fiscal 2013, 2012 and 2011, respectively. The increase in cash flows used for investing activities as compared with fiscal 2012 primarily reflected higher capital expenditure activity in the current year related to counters and leasehold improvements. The decrease in cash flows used for invest-ing activities during fiscal 2012 as compared with fiscal 2011 primarily reflected a favorable comparison with the fiscal 2011 acquisition of Smashbox Cosmetics, partially offset by an increase in capital expenditures for counters and leasehold improvements.
Net cash used for financing activities was $611.5 mil-lion, $585.1 million and $313.1 million in fiscal 2013, 2012 and 2011, respectively. The increase in cash used for financing activities as compared with fiscal 2012 primarily reflected the repayment of outstanding commercial paper during the current year, higher dividends paid as a result of the increase in the annual dividend rate and transition to a quarterly dividend payout schedule, and higher redemptions of long-term debt during the current year, partially offset by the proceeds from the issuance of the 2022 Senior Notes and 2042 Senior Notes in August 2012 and lower treasury stock repurchases. The change in net cash used for financing activities in fiscal 2012 as com-pared with fiscal 2011 primarily reflected an increase in treasury stock purchases, lower net proceeds from employee stock transactions and an increase in the pay-ment of dividends during fiscal 2012 as a result of an increase in the annual dividend rate. The repayment of the 2012 Senior Notes during fiscal 2012 was offset by proceeds from the issuance of short-term commercial paper. Subsequent to June 30, 2013, we purchased approximately 0.6 million additional shares of Class A Common Stock for $41.8 million pursuant to our share repurchase program.
132 THE EST{E LAUDER COMPANIES INC.
approximately $1 million to establish the Facility which are being amortized over the term of the Facility. The Facility has an annual fee of $0.7 million, payable quar-terly, based on our current credit ratings. The Facility also contains a cross-default provision whereby a failure to pay other material financial obligations in excess of $100.0 million (after grace periods and absent a waiver from the lenders) would result in an event of default and the accel-eration of the maturity of any outstanding debt under this facility. At June 30, 2013, no borrowings were outstanding under this agreement.
We have a fixed rate promissory note agreement with a financial institution pursuant to which we may borrow up to $150.0 million in the form of loan participation notes through one of our subsidiaries in Europe. The inter-est rate on borrowings under this agreement is at an all-in fixed rate determined by the lender and agreed to by us at the date of each borrowing. At June 30, 2013, no borrow-ings were outstanding under this agreement. Debt issuance costs incurred related to this agreement were de minimis.
We have borrowing agreements with two financial institutions pursuant to which our subsidiary in Turkey may borrow up to 50.0 million Turkish lira ($26.0 million at the exchange rate at June 30, 2013). The interest rate on borrowings under these agreements was approxi-mately 7%. There were no debt issuance costs incurred related to these agreements. The outstanding balance at June 30, 2013 was 14.1 million Turkish lira ($7.4 million at the exchange rate at June 30, 2013) and is classified as current debt in our consolidated balance sheet.
Total debt as a percent of total capitalization (exclud-ing noncontrolling interests) was 29% at June 30, 2013 and 32% at June 30, 2012.
Cash FlowsNet cash provided by operating activities was $1,226.3 million, $1,126.7 million and $1,027.0 million in fiscal 2013, 2012 and 2011, respectively. The increase in cash flows from operating activities as compared with fiscal 2012 was primarily driven by an increase in net earnings, a decrease in pension and post-retirement benefit contri-butions and a favorable change in accounts receivable due to the timing of shipments and collections. These improvements were partially offset by an increase in the levels of inventory, primarily to maintain acceptable service levels in line with forecasted sales activity, as well as for the remaining safety stock for the SMI implementa-tion. Also offsetting these improvements were a change in accounts payable, primarily due to the timing of payments, and a decrease in accrued income taxes,
On August 14, 2013, a dividend was declared in the amount of $.18 per share on our Class A and Class B Common Stock. The dividend is payable in cash on Sep-tember 16, 2013 to stockholders of record at the close of business on August 30, 2013.
Pension and Post-retirement Plan FundingSeveral factors influence the annual funding requirements for our pension plans. For the U.S. Qualified Plan, our funding policy consists of annual contributions at a rate that provides for future plan benefits and maintains appro-priate funded percentages. Such contribution is not less than the minimum required by the Employee Retirement Income Security Act of 1974, as amended, (“ERISA”) and subsequent pension legislation, and is not more than the maximum amount deductible for income tax purposes. For each international plan, our funding policies are deter-mined by local laws and regulations. In addition, amounts necessary to fund future obligations under these plans could vary depending on estimated assumptions as detailed in “Management’s Discussion and Analysis of Financial Condition and Results of Operations — Critical Accounting Policies and Estimates.” The effect of our pen-sion plan funding on future operating results will depend on economic conditions, employee demographics, mor-tality rates, the number of participants electing to take lump-sum distributions, investment performance and funding decisions.
For the U.S. Qualified Plan, we maintain an investment strategy of matching the duration of a substantial portion of the plan assets with the duration of the underlying plan liabilities. This strategy assisted in maintaining a funded ratio of more than 100% as of June 30, 2013. For fiscal 2013 and 2012, we met or exceeded all minimum contri-butions required by ERISA for the U.S. Qualified Plan. For fiscal 2013, minimum contributions to the U.S. Qualified Plan required by ERISA were satisfied by using a portion of the credit balance. Credit balances occur when contri-butions to the plan exceed the minimum required by ERISA. In fiscal 2012, we made discretionary payments of $75.6 million to the U.S. Qualified Plan and $9.4 million
to our U.S. post-retirement medical plan. As we continue to monitor the performance of our plan assets, we may decide to make discretionary cash contributions to the U.S. Qualified Plan or our post-retirement plan in the United States during fiscal 2014, but do not have plans to do so at this time.
For fiscal 2013 and 2012, we made benefit payments under our non-qualified domestic noncontributory pension plan of $6.1 million and $6.6 million, respectively. We expect to make benefit payments under this plan dur-ing fiscal 2014 of approximately $12.1 million. For fiscal 2013 and 2012, we made cash contributions to our inter-national defined benefit pension plans of $25.9 million and $29.7 million, respectively. We expect to make contributions under these plans during fiscal 2014 of approximately $29.2 million.
Commitments and ContingenciesCertain of our business acquisition agreements include “earn-out” provisions. These provisions generally require that we pay to the seller or sellers of the business addi-tional amounts based on the performance of the acquired business. Since the size of each payment depends upon performance of the acquired business, we do not expect that such payments will have a material adverse impact on our future results of operations or financial condition.
For additional contingencies refer to “Note 13 — Commitments and Contingencies” of Notes to Consoli-dated Financial Statements.
THE EST{E LAUDER COMPANIES INC. 133
DividendsWe transitioned to a quarterly dividend payout schedule for our Class A and Class B Common Stock beginning in the fiscal 2013 third quarter.
The following is a summary of cash dividends declared per share on our Class A and Class B Common Stock during the year ended June 30, 2013:
Date Declared Record Date Payable Date Amount per Share
November 1, 2012 November 30, 2012 December 17, 2012 $.72February 4, 2013 February 28, 2013 March 15, 2013 $.18May 1, 2013 May 31, 2013 June 17, 2013 $.18

Derivative Financial Instruments and Hedging ActivitiesWe address certain financial exposures through a con-trolled program of risk management that includes the use of derivative financial instruments. We enter into foreign currency forward contracts. We may enter into option contracts to reduce the effects of fluctuating foreign currency exchange rates and interest rate derivatives to manage the effects of interest rate movements on our aggregate liability portfolio. We also enter into foreign currency forward contracts and may use option contracts, not designated as hedging instruments, to mitigate the change in fair value of specific assets and liabilities on the balance sheet. We do not utilize derivative financial instruments for trading or speculative purposes. Costs associated with entering into these derivative financial instruments have not been material to our consolidated financial results.
For each derivative contract entered into where we look to obtain hedge accounting treatment, we formally document all relationships between hedging instruments and hedged items, as well as our risk-management objec-tive and strategy for undertaking the hedge transaction, the nature of the risk being hedged, how the hedging
instruments’ effectiveness in offsetting the hedged risk will be assessed prospectively and retrospectively, and a description of the method of measuring ineffectiveness. This process includes linking all derivatives to specific assets and liabilities on the balance sheet or to specific firm commitments or forecasted transactions. We also for-mally assess, both at the hedge’s inception and on an ongoing basis, whether the derivatives that are used in hedging transactions are highly effective in offsetting changes in fair values or cash flows of hedged items. If it is determined that a derivative is not highly effective, or that it has ceased to be a highly effective hedge, we will be required to discontinue hedge accounting with respect to that derivative prospectively.
Foreign Exchange Risk ManagementWe enter into foreign currency forward contracts to hedge anticipated transactions, as well as receivables and payables denominated in foreign currencies, for periods consistent with our identified exposures. The purpose of the hedging activities is to minimize the effect of foreign exchange rate movements on costs and on the cash flows that we receive from foreign subsidiaries. The majority of foreign currency forward contracts are denominated in
134 THE EST{E LAUDER COMPANIES INC.
Contractual ObligationsThe following table summarizes scheduled maturities of our contractual obligations for which cash flows are fixed and determinable as of June 30, 2013:
Payments Due in Fiscal
Total 2014 2015 2016 2017 2018 Thereafter(In millions)Debt service(1) $2,386.3 $ 79.6 $ 65.5 $ 61.8 $361.3 $ 44.7 $1,773.4Operating lease commitments(2) 1,534.7 280.2 241.0 210.9 176.5 146.1 480.0Unconditional purchase obligations(3) 2,681.7 1,441.6 346.3 358.2 139.1 143.8 252.7Gross unrecognized tax benefits
and interest — current(4) 0.9 0.9 — — — — —
Total contractual obligations $6,603.6 $1,802.3 $652.8 $630.9 $676.9 $334.6 $2,506.1
(1) Includes long-term and current debt and the related projected interest costs, and to a lesser extent, capital lease commitments. Interest costs on long-term and current debt are projected to be $61.3 million in each of the years from fiscal 2014 through fiscal 2017, $44.6 million in fiscal 2018 and $773.3 million thereafter. Projected interest costs on variable rate instruments were calculated using market rates at June 30, 2013. Refer to “Note 9 — Debt” of Notes to Consolidated Financial Statements.
(2) Minimum operating lease commitments only include base rent. Certain leases provide for contingent rents that are not measurable at inception and primarily include rents based on a percentage of sales in excess of stipulated levels, as well as common area maintenance. These amounts are excluded from minimum operating lease commitments and are included in the determination of total rent expense when it is probable that the expense has been incurred and the amount is reasonably measurable.
(3) Unconditional purchase obligations primarily include inventory commitments, estimated future earn-out payments, estimated royalty payments pursuant to license agreements, advertising commitments, capital improvement commitments, planned funding of pension and other post-retire-ment benefit obligations, commitments pursuant to executive compensation arrangements, obligations related to our cost savings initiatives and acquisitions. Future earn-out payments and future royalty and advertising commitments were estimated based on planned future sales for the term that was in effect at June 30, 2013, without consideration for potential renewal periods.
(4) Refer to “Note 7 — Income Taxes” of Notes to Consolidated Financial Statements for information regarding unrecognized tax benefits. As of June 30, 2013, the noncurrent portion of our unrecognized tax benefits, including related accrued interest and penalties was $80.5 million. At this time, the settlement period for the noncurrent portion of the unrecognized tax benefits, including related accrued interest and penalties, cannot be determined and therefore was not included.

currencies of major industrial countries. We may also enter into foreign currency option contracts to hedge anticipated transactions where there is a high probability that anticipated exposures will materialize. The foreign currency forward contracts entered into to hedge antici-pated transactions have been designated as foreign currency cash-flow hedges and have varying maturities through the end of March 2015. Hedge effectiveness of foreign currency forward contracts is based on a hypo-thetical derivative methodology and excludes the portion of fair value attributable to the spot-forward difference which is recorded in current-period earnings. Hedge effectiveness of foreign currency option contracts is based on a dollar offset methodology. The ineffective portion of both foreign currency forward and option con-tracts is recorded in current-period earnings. For hedge contracts that are no longer deemed highly effective, hedge accounting is discontinued and gains and losses accumulated in other comprehensive income (loss) are reclassified to earnings when the underlying forecasted transaction occurs. If it is probable that the forecasted transaction will no longer occur, then any gains or losses in accumulated other comprehensive income (loss) are reclassified to current-period earnings. As of June 30, 2013, these foreign currency cash-flow hedges were highly effective in all material respects.
At June 30, 2013, we had foreign currency forward contracts in the amount of $1,579.6 million. The foreign currencies included in foreign currency forward contracts (notional value stated in U.S. dollars) are principally the British pound ($426.2 million), Euro ($268.8 million), Canadian dollar ($198.6 million), Swiss franc ($111.5 mil-lion), Australian dollar ($92.1 million), Thailand baht ($75.5 million) and Hong Kong dollar ($58.1 million).
Credit RiskAs a matter of policy, we only enter into derivative con-tracts with counterparties that have a long-term credit rat-ing of at least A- or higher by at least two nationally recognized rating agencies. The counterparties to these contracts are major financial institutions. Exposure to credit risk in the event of nonperformance by any of the counterparties is limited to the gross fair value of con-tracts in asset positions, which totaled $21.7 million at June 30, 2013. To manage this risk, we have established counterparty credit guidelines that are continually moni-tored. Accordingly, management believes risk of loss under these hedging contracts is remote.
Certain of our derivative financial instruments contain credit-risk-related contingent features. At June 30, 2013, we were in a net asset position for certain derivative
contracts that contain such features with two counter-parties. The fair value of those contracts as of June 30, 2013 was approximately $4.6 million. As of June 30, 2013, we were in compliance with such credit-risk-related contingent features.
Market RiskWe use a value-at-risk model to assess the market risk of our derivative financial instruments. Value-at-risk repre-sents the potential losses for an instrument or portfolio from adverse changes in market factors for a specified time period and confidence level. We estimate value-at-risk across all of our derivative financial instruments using a model with historical volatilities and correlations calcu-lated over the past 250-day period. The high, low and average measured value-at-risk during fiscal 2013 related to our foreign exchange contracts is as follows:
YEAR ENDED JUNE 30, 2013 (In millions) High Low Average
Foreign exchange contracts $24.5 $19.1 $21.9
The model estimates were made assuming normal market conditions and a 95 percent confidence level. We used a statistical simulation model that valued our derivative financial instruments against one thousand randomly gen-erated market price paths. Our calculated value-at-risk exposure represents an estimate of reasonably possible net losses that would be recognized on our portfolio of derivative financial instruments assuming hypothetical movements in future market rates and is not necessarily indicative of actual results, which may or may not occur. It does not represent the maximum possible loss or any expected loss that may occur, since actual future gains and losses will differ from those estimated, based upon actual fluctuations in market rates, operating exposures, and the timing thereof, and changes in our portfolio of derivative financial instruments during the year. We believe, however, that any such loss incurred would be offset by the effects of market rate movements on the respective underlying transactions for which the deriva-tive financial instrument was intended.
OFF-BALANCE SHEET ARRANGEMENTSWe do not maintain any off-balance sheet arrangements, transactions, obligations or other relationships with unconsolidated entities, other than operating leases, that would be expected to have a material current or future effect upon our financial condition or results of operations.
THE EST{E LAUDER COMPANIES INC. 135

136 THE EST{E LAUDER COMPANIES INC.
RECENTLY ISSUED ACCOUNTING STANDARDSRefer to “Note 2 — Summary of Significant Accounting Policies” of Notes to Consolidated Financial Statements for discussion regarding the impact of accounting stan-dards that were recently issued but not yet effective, on our consolidated financial statements.
FORWARD-LOOKING INFORMATIONWe and our representatives from time to time make writ-ten or oral forward-looking statements, including state-ments contained in this and other filings with the Securities and Exchange Commission, in our press releases and in our reports to stockholders. The words and phrases “will likely result,” “expect,” “believe,” “planned,” “may,” “should,” “could,” “anticipate,” “estimate,” “project,” “intend,” “forecast” or similar expressions are intended to identify “forward-looking statements” within the meaning of the Private Securities Litigation Reform Act of 1995. These statements include, without limitation, our expectations regarding sales, earn-ings or other future financial performance and liquidity, product introductions, entry into new geographic regions, information systems initiatives, new methods of sale, our long-term strategy, restructuring and other charges and resulting cost savings, and future operations or operating results. Although we believe that our expectations are based on reasonable assumptions within the bounds of our knowledge of our business and operations, actual results may differ materially from our expectations. Factors that could cause actual results to differ from expectations include, without limitation:
(1) increased competitive activity from companies in the skin care, makeup, fragrance and hair care businesses, some of which have greater resources than we do;
(2) our ability to develop, produce and market new prod-ucts on which future operating results may depend and to successfully address challenges in our business;
(3) consolidations, restructurings, bankruptcies and reor-ganizations in the retail industry causing a decrease in the number of stores that sell our products, an increase in the ownership concentration within the retail industry, owner-ship of retailers by our competitors or ownership of com-petitors by our customers that are retailers and our inability to collect receivables;
(4) destocking and tighter working capital management by retailers;
(5) the success, or changes in timing or scope, of new product launches and the success, or changes in the timing or the scope, of advertising, sampling and merchandising programs;
(6) shifts in the preferences of consumers as to where and how they shop for the types of products and services we sell;
(7) social, political and economic risks to our foreign or domestic manufacturing, distribution and retail opera-tions, including changes in foreign investment and trade policies and regulations of the host countries and of the United States;
(8) changes in the laws, regulations and policies (includ-ing the interpretations and enforcement thereof) that affect, or will affect, our business, including those relating to our products or distribution networks, changes in accounting standards, tax laws and regulations, environ-mental or climate change laws, regulations or accords, trade rules and customs regulations, and the outcome and expense of legal or regulatory proceedings, and any action we may take as a result;
(9) foreign currency fluctuations affecting our results of operations and the value of our foreign assets, the relative prices at which we and our foreign competitors sell products in the same markets and our operating and manufacturing costs outside of the United States;
(10) changes in global or local conditions, including those due to the volatility in the global credit and equity mar-kets, natural or man-made disasters, real or perceived epidemics, or energy costs, that could affect consumer purchasing, the willingness or ability of consumers to travel and/or purchase our products while traveling, the financial strength of our customers, suppliers or other contract counterparties, our operations, the cost and availability of capital which we may need for new equip-ment, facilities or acquisitions, the returns that we are able to generate on our pension assets and the resulting impact on funding obligations, the cost and availability of raw materials and the assumptions underlying our critical accounting estimates;
(11) shipment delays, commodity pricing, depletion of inventory and increased production costs resulting from disruptions of operations at any of the facilities that manu-facture nearly all of our supply of a particular type of product (i.e. focus factories) or at our distribution or inventory centers, including disruptions that may be caused by the implementation of SAP as part of our Strategic Modernization Initiative or by restructurings;

THE EST{E LAUDER COMPANIES INC. 137
(12) real estate rates and availability, which may affect our ability to increase or maintain the number of retail locations at which we sell our products and the costs associated with our other facilities;
(13) changes in product mix to products which are less profitable;
(14) our ability to acquire, develop or implement new information and distribution technologies and initiatives on a timely basis and within our cost estimates and our ability to maintain continuous operations of such systems and the security of data and other information that may be stored in such systems or other systems or media;
(15) our ability to capitalize on opportunities for improved efficiency, such as publicly-announced strategies and restructuring and cost-savings initiatives, and to integrate acquired businesses and realize value therefrom;
(16) consequences attributable to local or international conflicts around the world, as well as from any terrorist action, retaliation and the threat of further action or retaliation;
(17) the timing and impact of acquisitions and divesti-tures, which depend on willing sellers and buyers, r espectively; and
(18) additional factors as described in our filings with the Securities and Exchange Commission, including this Annual Report on Form 10-K for the fiscal year ended June 30, 2013.
We assume no responsibility to update forward-looking statements made herein or otherwise.
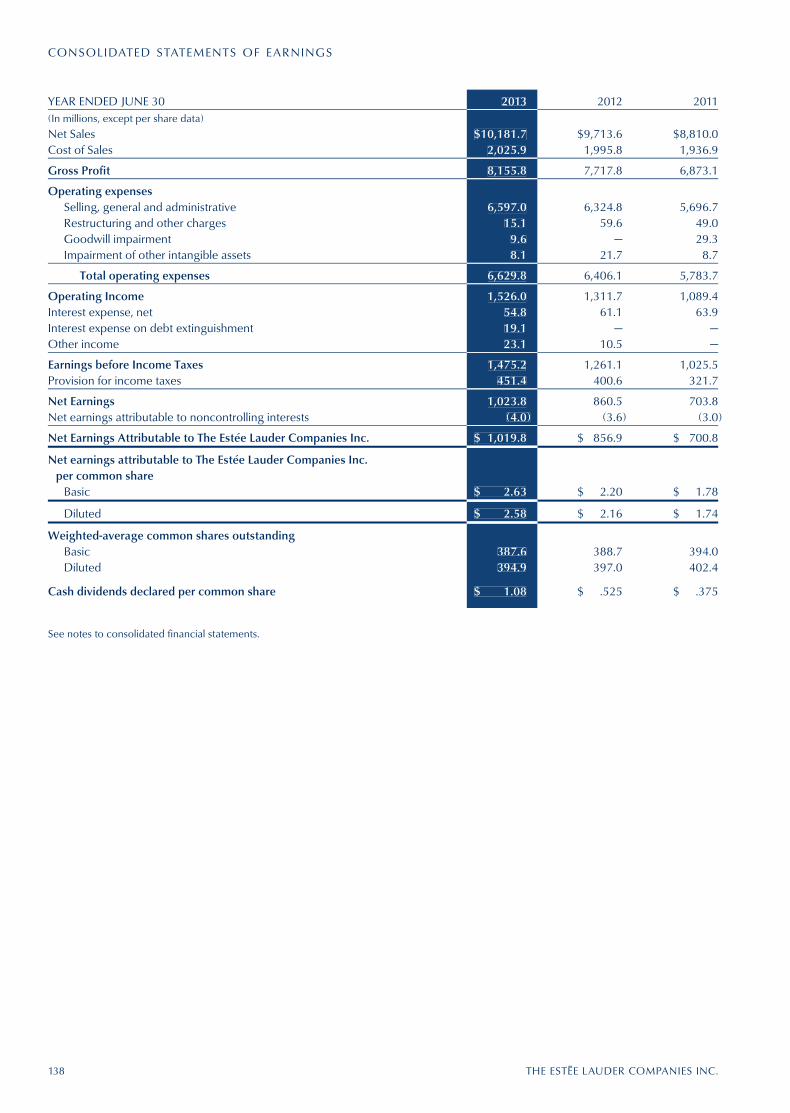
YEAR ENDED JUNE 30 2013 2012 2011(In millions, except per share data)
Net Sales $10,181.7 $9,713.6 $8,810.0Cost of Sales 2,025.9 1,995.8 1,936.9
Gross Profit 8,155.8 7,717.8 6,873.1
Operating expensesSelling, general and administrative 6,597.0 6,324.8 5,696.7Restructuring and other charges 15.1 59.6 49.0Goodwill impairment 9.6 — 29.3Impairment of other intangible assets 8.1 21.7 8.7
Total operating expenses 6,629.8 6,406.1 5,783.7
Operating Income 1,526.0 1,311.7 1,089.4Interest expense, net 54.8 61.1 63.9Interest expense on debt extinguishment 19.1 — —Other income 23.1 10.5 —
Earnings before Income Taxes 1,475.2 1,261.1 1,025.5Provision for income taxes 451.4 400.6 321.7
Net Earnings 1,023.8 860.5 703.8Net earnings attributable to noncontrolling interests (4.0) (3.6) (3.0)
Net Earnings Attributable to The Estée Lauder Companies Inc. $ 1,019.8 $ 856.9 $ 700.8
Net earnings attributable to The Estée Lauder Companies Inc. per common share
Basic $ 2.63 $ 2.20 $ 1.78
Diluted $ 2.58 $ 2.16 $ 1.74
Weighted-average common shares outstandingBasic 387.6 388.7 394.0Diluted 394.9 397.0 402.4
Cash dividends declared per common share $ 1.08 $ .525 $ .375
2013
$10,181.72,025.9
8,155.8
6,597.015.1
9.68.1
6,629.8
1,526.054.819.123.1
1,475.2451.4
1,023.8(4.0)
$ 1,019.8
$ 2.63
$ 2.58
387.6394.9
$ 1.08
See notes to consolidated financial statements.
CONSOLIDATED STATEMENTS OF EARNINGS
138 THE EST{E LAUDER COMPANIES INC.
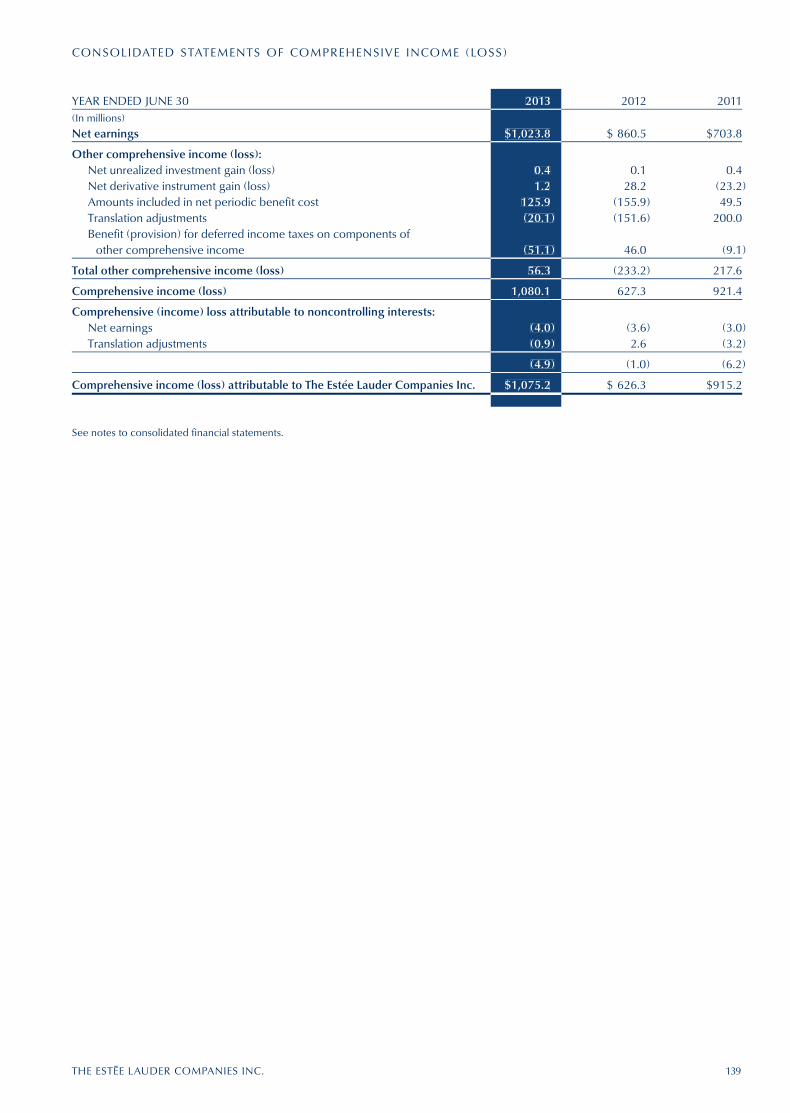
THE EST{E LAUDER COMPANIES INC. 139
YEAR ENDED JUNE 30 2013 2012 2011(In millions)
Net earnings $1,023.8 $ 860.5 $703.8
Other comprehensive income (loss):Net unrealized investment gain (loss) 0.4 0.1 0.4Net derivative instrument gain (loss) 1.2 28.2 (23.2)Amounts included in net periodic benefit cost 125.9 (155.9) 49.5Translation adjustments (20.1) (151.6) 200.0Benefit (provision) for deferred income taxes on components of
other comprehensive income (51.1) 46.0 (9.1)
Total other comprehensive income (loss) 56.3 (233.2) 217.6
Comprehensive income (loss) 1,080.1 627.3 921.4
Comprehensive (income) loss attributable to noncontrolling interests:Net earnings (4.0) (3.6) (3.0)Translation adjustments (0.9) 2.6 (3.2)
(4.9) (1.0) (6.2)
Comprehensive income (loss) attributable to The Estée Lauder Companies Inc. $1,075.2 $ 626.3 $915.2
2013
$1,023.8
0.41.2
125.9(20.1)
(51.1)
56.3
1,080.1
(4.0)(0.9)
(4.9)
$1,075.2
See notes to consolidated financial statements.
CONSOLIDATED STATEMENTS OF COMPREHENSIVE INCOME (LOSS)
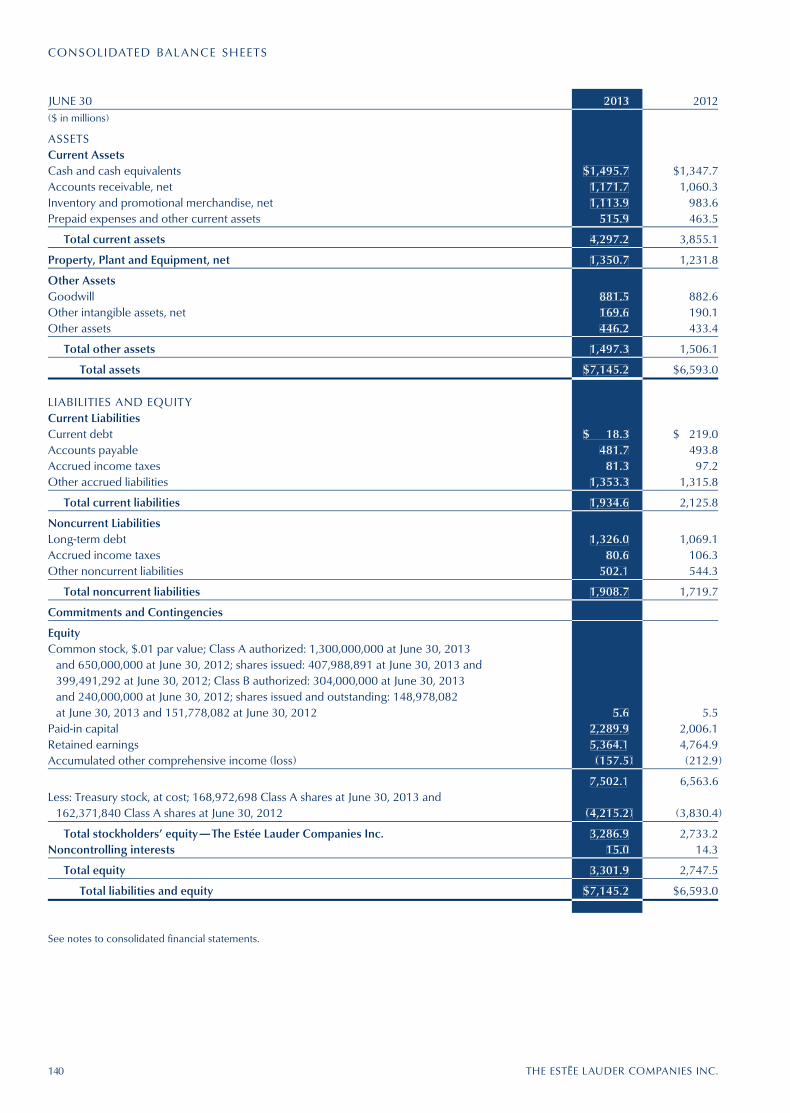
140 THE EST{E LAUDER COMPANIES INC.
JUNE 30 2013 2012($ in millions)
ASSETSCurrent AssetsCash and cash equivalents $1,495.7 $1,347.7Accounts receivable, net 1,171.7 1,060.3Inventory and promotional merchandise, net 1,113.9 983.6Prepaid expenses and other current assets 515.9 463.5
Total current assets 4,297.2 3,855.1
Property, Plant and Equipment, net 1,350.7 1,231.8
Other AssetsGoodwill 881.5 882.6Other intangible assets, net 169.6 190.1Other assets 446.2 433.4
Total other assets 1,497.3 1,506.1
Total assets $7,145.2 $6,593.0
LIABILITIES AND EQUITYCurrent LiabilitiesCurrent debt $ 18.3 $ 219.0Accounts payable 481.7 493.8Accrued income taxes 81.3 97.2Other accrued liabilities 1,353.3 1,315.8
Total current liabilities 1,934.6 2,125.8
Noncurrent LiabilitiesLong-term debt 1,326.0 1,069.1Accrued income taxes 80.6 106.3Other noncurrent liabilities 502.1 544.3
Total noncurrent liabilities 1,908.7 1,719.7
Commitments and Contingencies
EquityCommon stock, $.01 par value; Class A authorized: 1,300,000,000 at June 30, 2013
and 650,000,000 at June 30, 2012; shares issued: 407,988,891 at June 30, 2013 and 399,491,292 at June 30, 2012; Class B authorized: 304,000,000 at June 30, 2013 and 240,000,000 at June 30, 2012; shares issued and outstanding: 148,978,082 at June 30, 2013 and 151,778,082 at June 30, 2012 5.6 5.5
Paid-in capital 2,289.9 2,006.1Retained earnings 5,364.1 4,764.9Accumulated other comprehensive income (loss) (157.5) (212.9)
7,502.1 6,563.6Less: Treasury stock, at cost; 168,972,698 Class A shares at June 30, 2013 and
162,371,840 Class A shares at June 30, 2012 (4,215.2) (3,830.4)
Total stockholders’ equity — The Estée Lauder Companies Inc. 3,286.9 2,733.2Noncontrolling interests 15.0 14.3
Total equity 3,301.9 2,747.5
Total liabilities and equity $7,145.2 $6,593.0
2013
$1,495.71,171.71,113.9
515.9
4,297.2
1,350.7
881.5169.6446.2
1,497.3
$7,145.2
$ 18.3481.7
81.31,353.3
1,934.6
1,326.080.6
502.1
1,908.7
5.62,289.95,364.1(157.5)
7,502.1
(4,215.2)
3,286.915.0
3,301.9
$7,145.2
See notes to consolidated financial statements.
CONSOLIDATED BAL ANCE SHEETS

THE EST{E LAUDER COMPANIES INC. 141
YEAR ENDED JUNE 30 2013 2012 2011(In millions)
Common stock, beginning of year $ 5.5 $ 5.5 $ 5.5Stock-based compensation 0.1 — —
Common stock, end of year 5.6 5.5 5.5
Paid-in capital, beginning of year 2,006.1 1,735.6 1,428.7Stock-based compensation 283.8 270.7 306.9Purchase of noncontrolling interest — (0.2) —
Paid-in capital, end of year 2,289.9 2,006.1 1,735.6
Retained earnings, beginning of year 4,764.9 4,113.7 3,561.2Common stock dividends (420.6) (204.1) (148.3)Stock-based compensation — (1.6) —Net earnings attributable to The Estée Lauder Companies Inc. 1,019.8 856.9 700.8
Retained earnings, end of year 5,364.1 4,764.9 4,113.7
Accumulated other comprehensive income (loss), beginning of year (212.9) 17.7 (196.7)Other comprehensive income (loss) 55.4 (230.6) 214.4
Accumulated other comprehensive income (loss), end of year (157.5) (212.9) 17.7
Treasury stock, beginning of year (3,830.4) (3,243.1) (2,850.3)Acquisition of treasury stock (342.6) (555.2) (376.9)Stock-based compensation (42.2) (32.1) (15.9)
Treasury stock, end of year (4,215.2) (3,830.4) (3,243.1)
Total stockholders’ equity — The Estée Lauder Companies Inc. 3,286.9 2,733.2 2,629.4
Noncontrolling interests, beginning of year 14.3 17.6 17.0Net earnings attributable to noncontrolling interests 4.0 3.6 3.0Distributions to noncontrolling interest holders (4.2) (3.9) (5.6)Purchase of noncontrolling interest — (0.4) —Other comprehensive income (loss) 0.9 (2.6) 3.2
Noncontrolling interests, end of year 15.0 14.3 17.6
Total equity $3,301.9 $2,747.5 $2,647.0
2013
$ 5.50.1
5.6
2,006.1283.8
—
2,289.9
4,764.9(420.6)
—1,019.8
5,364.1
(212.9)55.4
(157.5)
(3,830.4)(342.6)
(42.2)
(4,215.2)
3,286.9
14.34.0
(4.2)—
0.9
15.0
$3,301.9
See notes to consolidated financial statements.
CONSOLIDATED STATEMENTS OF EQUIT Y
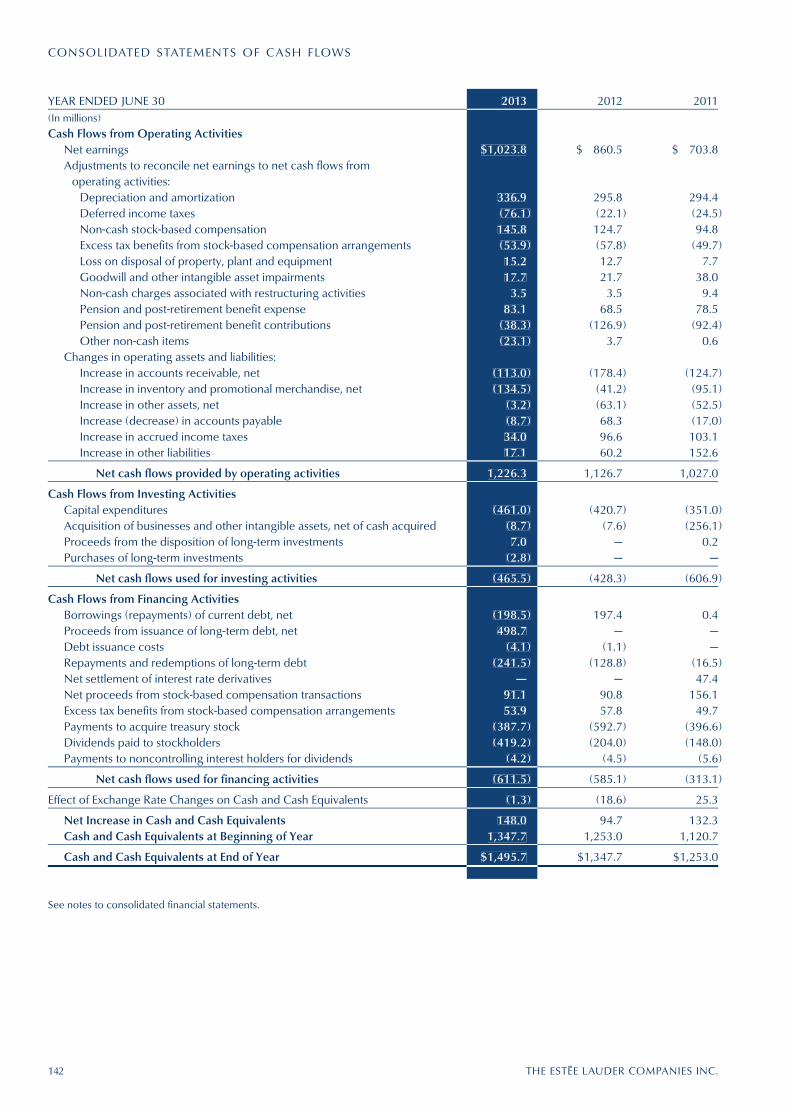
142 THE EST{E LAUDER COMPANIES INC.
YEAR ENDED JUNE 30 2013 2012 2011(In millions)
Cash Flows from Operating ActivitiesNet earnings $1,023.8 $ 860.5 $ 703.8Adjustments to reconcile net earnings to net cash flows from
operating activities:Depreciation and amortization 336.9 295.8 294.4Deferred income taxes (76.1) (22.1) (24.5)Non-cash stock-based compensation 145.8 124.7 94.8Excess tax benefits from stock-based compensation arrangements (53.9) (57.8) (49.7)Loss on disposal of property, plant and equipment 15.2 12.7 7.7Goodwill and other intangible asset impairments 17.7 21.7 38.0Non-cash charges associated with restructuring activities 3.5 3.5 9.4Pension and post-retirement benefit expense 83.1 68.5 78.5Pension and post-retirement benefit contributions (38.3) (126.9) (92.4)Other non-cash items (23.1) 3.7 0.6
Changes in operating assets and liabilities:Increase in accounts receivable, net (113.0) (178.4) (124.7)Increase in inventory and promotional merchandise, net (134.5) (41.2) (95.1)Increase in other assets, net (3.2) (63.1) (52.5)Increase (decrease) in accounts payable (8.7) 68.3 (17.0)Increase in accrued income taxes 34.0 96.6 103.1Increase in other liabilities 17.1 60.2 152.6
Net cash flows provided by operating activities 1,226.3 1,126.7 1,027.0
Cash Flows from Investing ActivitiesCapital expenditures (461.0) (420.7) (351.0)Acquisition of businesses and other intangible assets, net of cash acquired (8.7) (7.6) (256.1)Proceeds from the disposition of long-term investments 7.0 — 0.2Purchases of long-term investments (2.8) — —
Net cash flows used for investing activities (465.5) (428.3) (606.9)
Cash Flows from Financing ActivitiesBorrowings (repayments) of current debt, net (198.5) 197.4 0.4Proceeds from issuance of long-term debt, net 498.7 — —Debt issuance costs (4.1) (1.1) —Repayments and redemptions of long-term debt (241.5) (128.8) (16.5)Net settlement of interest rate derivatives — — 47.4Net proceeds from stock-based compensation transactions 91.1 90.8 156.1Excess tax benefits from stock-based compensation arrangements 53.9 57.8 49.7Payments to acquire treasury stock (387.7) (592.7) (396.6)Dividends paid to stockholders (419.2) (204.0) (148.0)Payments to noncontrolling interest holders for dividends (4.2) (4.5) (5.6)
Net cash flows used for financing activities (611.5) (585.1) (313.1)
Effect of Exchange Rate Changes on Cash and Cash Equivalents (1.3) (18.6) 25.3
Net Increase in Cash and Cash Equivalents 148.0 94.7 132.3Cash and Cash Equivalents at Beginning of Year 1,347.7 1,253.0 1,120.7
Cash and Cash Equivalents at End of Year $1,495.7 $1,347.7 $1,253.0
2013
$1,023.8
336.9(76.1)145.8(53.9)15.217.7
3.583.1
(38.3)(23.1)
(113.0)(134.5)
(3.2)(8.7)34.017.1
1,226.3
(461.0)(8.7)7.0
(2.8)
(465.5)
(198.5)498.7
(4.1)(241.5)
—91.153.9
(387.7)(419.2)
(4.2)
(611.5)
(1.3)
148.01,347.7
$1,495.7
See notes to consolidated financial statements.
CONSOLIDATED STATEMENTS OF CASH FLOWS
THE EST{E LAUDER COMPANIES INC. 143
NOTES TO CONSOLIDATED FINANCIAL STATEMENTS
NOTE 1 — DESCRIPTION OF BUSINESSThe Estée Lauder Companies Inc. manufactures, markets and sells skin care, makeup, fragrance and hair care prod-ucts around the world. Products are marketed under various brand names including: Estée Lauder, Aramis, Clinique, Prescriptives, Lab Series, Origins, M.A.C, Bobbi Brown, La Mer, Aveda, Jo Malone, Bumble and bumble, Darphin, Flirt!, GoodSkin Labs, Ojon and Smashbox. Certain subsidiaries of The Estée Lauder Companies Inc. are also the global licensee of the Tommy Hilfiger, Kiton, Donna Karan, Michael Kors, Tom Ford, Coach and Ermenegildo Zegna brand names for fragrances and/or cosmetics.
NOTE 2 — SUMMARY OF SIGNIFICANT ACCOUNTING POLICIESPrinciples of ConsolidationThe accompanying consolidated financial statements include the accounts of The Estée Lauder Companies Inc. and its subsidiaries (collectively, the “Company”). All significant intercompany balances and transactions have been eliminated.
Certain amounts in the consolidated financial state-ments of prior years have been reclassified to conform to current year presentation.
All share (except par value per share), earnings per common share and cash dividends declared per common share information for fiscal 2011 reflects the two-for-one stock split on the Company’s Class A and Class B Com-mon Stock, which was effected in the form of a stock dividend for each share held by stockholders of record at the close of business on January 4, 2012. The number of shares of the Company’s Class A Common Stock issuable upon exercise of outstanding stock options and vesting of other stock-based awards were proportionately increased in accordance with the terms of the respective plans.
Management EstimatesThe preparation of financial statements and related disclo-sures in conformity with U.S. generally accepted account-ing principles (“U.S. GAAP”) requires management to make estimates and assumptions that affect the reported amounts of assets and liabilities and disclosure of con-tingent assets and liabilities at the date of the financial statements and the reported amounts of revenues and expenses reported in those financial statements. Certain significant accounting policies that contain subjective management estimates and assumptions include those related to revenue recognition, inventory, pension and other post-retirement benefit costs, goodwill, other intangible assets and long-lived assets, and income taxes.
Management evaluates its estimates and assumptions on an ongoing basis using historical experience and other factors, including the current economic environment, and makes adjustments when facts and circumstances dictate. As future events and their effects cannot be determined with precision, actual results could differ significantly from those estimates and assumptions. Significant changes, if any, in those estimates and assumptions resulting from continuing changes in the economic environment will be reflected in the consolidated financial statements in future periods.
Currency Translation and TransactionsAll assets and liabilities of foreign subsidiaries and affiliates are translated at year-end rates of exchange, while reve-nue and expenses are translated at weighted-average rates of exchange for the period. Unrealized translation gains (losses) reported as cumulative translation adjust-ments through other comprehensive income (loss) (“OCI”) attributable to The Estée Lauder Companies Inc. amounted to $(25.6) million, $(154.2) million and $210.5 million, net of tax, in fiscal 2013, 2012 and 2011, respec-tively. For the Company’s Venezuelan subsidiary operat-ing in a highly inflationary economy, the U.S. dollar is the functional currency. Remeasurement adjustments in finan-cial statements in a highly inflationary economy and other transactional gains and losses are reflected in earnings.
The Company enters into foreign currency forward contracts and may enter into option contracts to hedge foreign currency transactions for periods consistent with its identified exposures. Accordingly, the Company cate-gorizes these instruments as entered into for purposes other than trading.
The accompanying consolidated statements of earn-ings include net exchange losses on foreign currency transactions of $3.5 million, $0.5 million and $18.6 million in fiscal 2013, 2012 and 2011, respectively.
Cash and Cash EquivalentsCash and cash equivalents include $843.5 million and $660.2 million of short-term time deposits at June 30, 2013 and 2012, respectively. The Company considers all highly liquid investments with original maturities of three months or less to be cash equivalents. As of June 30, 2013, approximately 21% and 20% of the Company’s cash and cash equivalents are held by two financial institutions.
Accounts ReceivableAccounts receivable is stated net of the allowance for doubtful accounts and customer deductions totaling $22.7 million and $31.1 million as of June 30, 2013 and
2012, respectively. This reserve is based upon the evalua-tion of accounts receivable aging, specific exposures and historical trends.
Inventory and Promotional MerchandiseInventory and promotional merchandise only includes inventory considered saleable or usable in future periods, and is stated at the lower of cost or fair-market value, with cost being based on standard cost which approximates actual cost on the first-in, first-out method. Cost compo-nents include raw materials, componentry, direct labor and overhead (e.g., indirect labor, utilities, depreciation, purchasing, receiving, inspection and warehousing) as well as inbound freight. Manufacturing overhead is allocated to the cost of inventory based on the normal production capacity. Unallocated overhead during peri-ods of abnormally low production levels are recognized as cost of sales in the period in which they are incurred. Promotional merchandise is charged to expense at the time the merchandise is shipped to the Company’s cus-tomers. Included in inventory and promotional merchan-dise is an inventory obsolescence reserve, which represents the difference between the cost of the inven-tory and its estimated realizable value, based on various product sales projections. This reserve is calculated using an estimated obsolescence percentage applied to the inventory based on age, historical trends and require-ments to support forecasted sales. In addition, and as necessary, specific reserves for future known or antici-pated events may be established.
Derivative Financial InstrumentsThe Company’s derivative financial instruments are recorded as either assets or liabilities on the balance sheet and measured at fair value. All derivatives are (i) desig-nated as a hedge of the fair value of a recognized asset or liability or of an unrecognized firm commitment (“fair-value” hedge), (ii) designated as a hedge of a fore-casted transaction or of the variability of cash flows to be received or paid related to a recognized asset or liability (“foreign currency cash-flow” hedge), or (iii) not desig-nated as a hedging instrument. Changes in the fair value of a derivative that is designated and qualifies as a fair-value hedge that is highly effective are recorded in current-period earnings, along with the loss or gain on the hedged asset or liability that is attributable to the hedged risk (including losses or gains on unrecognized firm com-mitments). Changes in the fair value of a derivative that is designated and qualifies as a foreign currency cash-flow hedge of a foreign-currency-denominated forecasted transaction that is highly effective are recorded in OCI. Gains and losses deferred in OCI are then recognized in
current-period earnings when earnings are affected by the variability of cash flows of the hedged foreign- currency-denominated forecasted transaction (e.g., when periodic settlements on a variable-rate asset or liability are recorded in earnings). Changes in the fair value of deriva-tive instruments not designated as hedging instruments are reported in current-period earnings.
Property, Plant and EquipmentProperty, plant and equipment, including leasehold and other improvements that extend an asset’s useful life or productive capabilities, are carried at cost less accumu-lated depreciation and amortization. Costs incurred for computer software developed or obtained for internal use are capitalized during the application development stage and expensed as incurred during the preliminary project and post-implementation stages. For financial statement purposes, depreciation is provided principally on the straight-line method over the estimated useful lives of the assets ranging from 3 to 40 years. Leasehold improvements are amortized on a straight-line basis over the shorter of the lives of the respective leases or the expected useful lives of those improvements.
Goodwill and Other Indefinite-lived Intangible AssetsGoodwill is calculated as the excess of the cost of purchased businesses over the fair value of their underly-ing net assets. Other indefinite-lived intangible assets principally consist of trademarks. Goodwill and other indefinite-lived intangible assets are not amortized.
The Company assesses goodwill and other indefinite-lived intangible assets at least annually for impairment as of the beginning of the fiscal fourth quarter, or more fre-quently if certain events or circumstances exist. The Com-pany tests goodwill for impairment at the reporting unit level, which is one level below the Company’s operating segments. The Company identifies its reporting units by assessing whether the components of its operating seg-ments constitute businesses for which discrete financial information is available and management of each report-ing unit regularly reviews the operating results of those components. The Company makes certain judgments and assumptions in allocating assets and liabilities to deter-mine carrying values for its reporting units. Impairment testing is performed in two steps: (i) the Company determines impairment by comparing the fair value of a reporting unit with its carrying value, and (ii) if there is an impairment, the Company measures the amount of impairment loss by comparing the implied fair value of goodwill with the carrying amount of that goodwill. The impairment test for indefinite-lived intangible assets encompasses calculating a fair value of an indefinite-lived
144 THE EST{E LAUDER COMPANIES INC.
intangible asset and comparing the fair value to its carry-ing value. If the carrying value exceeds the fair value, impairment is recorded.
Testing goodwill for impairment requires the Company to estimate fair values of reporting units using significant estimates and assumptions. The assumptions made will impact the outcome and ultimate results of the test-ing. The Company uses industry accepted valuation models and set criteria that are reviewed and approved by various levels of management and, in certain instances, the Company engages third-party valuation specialists for advice. To determine fair value of the reporting unit, the Company generally uses an equal weighting of the income and market approaches. In certain circumstances, equal weighting will not be applied if one of these methods may be less applicable (e.g., only the income approach would be used for reporting units with existing negative margins). The Company believes both approaches are equally relevant and the most reliable indications of fair value because the fair value of product or service companies is more dependent on the ability to generate earnings than on the value of the assets used in the production process.
Under the income approach, the Company determines fair value using a discounted cash flow method, project-ing future cash flows of each reporting unit, as well as a terminal value, and discounting such cash flows at a rate of return that reflects the relative risk of the cash flows. Under the market approach, the Company utilizes infor-mation from comparable publicly traded companies with similar operating and investment characteristics as the reporting units, which creates valuation multiples that are applied to the operating performance of the reporting unit being tested, to value the reporting unit. The key esti-mates and factors used in these two approaches include, but are not limited to, revenue growth rates and profit margins based on internal forecasts, terminal value, the weighted-average cost of capital used to discount future cash flows and comparable market multiples.
To determine fair value of other indefinite-lived intan-gible assets, the Company uses an income approach, the relief-from-royalty method. This method assumes that, in lieu of ownership, a third party would be willing to pay a royalty in order to obtain the rights to use the comparable asset. Other indefinite-lived intangible assets’ fair values require significant judgments in determining both the assets’ estimated cash flows as well as the appropriate discount and royalty rates applied to those cash flows to determine fair value. Changes in such estimates or the application of alternative assumptions could produce significantly different results.
Long-Lived AssetsThe Company reviews long-lived assets for impairment whenever events or changes in circumstances indicate that the carrying amount may not be recoverable. When such events or changes in circumstances occur, a recover-ability test is performed comparing projected undis-counted cash flows from the use and eventual disposition of an asset or asset group to its carrying value. If the pro-jected undiscounted cash flows are less than the carrying value, then an impairment charge would be recorded for the excess of the carrying value over the fair value, which is determined by discounting future cash flows.
Concentration of Credit RiskThe Company is a worldwide manufacturer, marketer and distributor of skin care, makeup, fragrance and hair care products. Domestic and international sales are made primarily to department stores, perfumeries and specialty retailers. The Company grants credit to all qualified customers and does not believe it is exposed significantly to any undue concentration of credit risk.
The Company’s largest customer sells products primar-ily within the United States and accounted for $1,078.8 million, or 11%, $1,048.1 million, or 11%, and $967.6 mil-lion, or 11%, of the Company’s consolidated net sales in fiscal 2013, 2012 and 2011, respectively. This customer accounted for $113.7 million, or 10%, and $110.2 million, or 10%, of the Company’s accounts receivable at June 30, 2013 and 2012, respectively.
Revenue RecognitionRevenues from product sales are recognized upon transfer of ownership, including passage of title to the customer and transfer of the risk of loss related to those goods. In the Americas region, sales are generally recog-nized at the time the product is shipped to the customer and in the Europe, the Middle East & Africa and Asia/ Pacific regions, sales are generally recognized based upon the customer’s receipt. In certain circumstances, transfer of title takes place at the point of sale, for exam-ple, at the Company’s retail stores. The Company records revenues generated from purchase with purchase promo-tions in Net Sales and costs of its purchase with purchase and gift with purchase promotions in Cost of Sales.
Revenues are reported on a net sales basis, which is computed by deducting from gross sales the amount of actual product returns received, discounts, incentive arrangements with retailers and an amount established for anticipated product returns. The Company’s practice is to accept product returns from retailers only if properly requested, authorized and approved. In accepting returns, the Company typically provides a credit to the retailer
THE EST{E LAUDER COMPANIES INC. 145

146 THE EST{E LAUDER COMPANIES INC.
on a straight-line basis over the applicable lease term. The Company considers lease renewals when such renewals are reasonably assured. From time to time, the Company may receive capital improvement funding from its lessors. These amounts are recorded as deferred liabili-ties and amortized over the remaining lease term as a reduction of rent expense.
License ArrangementsThe Company’s license agreements provide the Company with worldwide rights to manufacture, market and sell beauty and beauty-related products (or particular catego-ries thereof) using the licensors’ trademarks. The licenses typically have an initial term of approximately 5 years to 11 years, and are renewable subject to the Company’s compliance with the license agreement provisions. The remaining terms, including the potential renewal periods, range from approximately 7 years to 28 years. Under each license, the Company is required to pay royal-ties to the licensor, at least annually, based on net sales to third parties.
Most of the Company’s licenses were entered into to create new business. In some cases, the Company acquired, or entered into, a license where the licensor or another licensee was operating a pre-existing beauty products business. In those cases, other intangible assets are capitalized and amortized over their useful lives.
Certain license agreements may require minimum roy-alty payments, incremental royalties based on net sales levels and minimum spending on advertising and promo-tional activities. Royalty expenses are accrued in the period in which net sales are recognized while advertising and promotional expenses are accrued at the time these costs are incurred.
Stock-Based CompensationThe Company records stock-based compensation, mea-sured at the fair value of the award, as an expense in the consolidated financial statements. Upon the exercise of stock options or the vesting of restricted stock units, per-formance share units, performance share units based on total stockholder return and market share units, the result-ing excess tax benefits, if any, are credited to additional paid-in capital. Any resulting tax deficiencies will first be offset against those cumulative credits to additional paid-in capital. If the cumulative credits to additional paid-in capital are exhausted, tax deficiencies will be recorded to the provision for income taxes. Excess tax benefits are required to be reflected as financing cash inflows in the accompanying consolidated statements of cash flows.
against accounts receivable from that retailer. As a per-centage of gross sales, returns were 3.3% in 2013 and 3.5% in fiscal 2012 and 2011.
Payments to CustomersCertain incentive arrangements require the payment of a fee to customers based on their attainment of pre- established sales levels. These fees have been recorded as a reduction of Net Sales in the accompanying consoli-dated statements of earnings and were not material to the results of operations in any period presented.
The Company enters into transactions related to adver-tising, product promotions and demonstrations, some of which involve cooperative relationships with customers. These activities may be arranged either with unrelated third parties or in conjunction with the customer. The Company’s share of the cost of these transactions (regard-less of to whom they were paid) are reflected in Selling, general and administrative expenses in the accompanying consolidated statements of earnings and were approxi-mately $1,412 million, $1,343 million and $1,152 million in fiscal 2013, 2012 and 2011, respectively.
Advertising and PromotionGlobal net expenses for advertising, merchandising, sam-pling, promotion and product development costs were $2,798.0 million, $2,655.7 million and $2,345.8 million in fiscal 2013, 2012 and 2011, respectively, and are expensed as incurred. Excluding the impact of purchase with pur-chase and gift with purchase promotions, advertising, merchandising, sampling and promotion expenses included in operating expenses were $2,584.2 million, $2,458.9 million and $2,160.7 million in fiscal 2013, 2012 and 2011, respectively.
Research and DevelopmentResearch and development costs amounted to $103.6 million, $96.5 million and $85.7 million in fiscal 2013, 2012 and 2011, respectively. Research and development costs are expensed as incurred.
Shipping and HandlingShipping and handling expenses of $337.9 million, $312.4 million and $289.7 million in fiscal 2013, 2012 and 2011, respectively, are recorded in Selling, general and adminis-trative expenses in the accompanying consolidated state-ments of earnings and include distribution center costs, third-party logistics costs and outbound freight.
Operating LeasesThe Company recognizes rent expense from operating leases with periods of free and scheduled rent increases
THE EST{E LAUDER COMPANIES INC. 147
If entities determine, on the basis of qualitative factors, that the fair value of the reporting unit is more-likely-than-not less than the carrying amount, the two-step impair-ment test would be required. This guidance became effective in the beginning of the Company’s fiscal 2013. The adoption of this guidance did not have an impact on the Company’s consolidated financial statements.
In June 2011, the FASB amended its authoritative guid-ance related to the presentation of comprehensive income, requiring entities to present items of net income and other comprehensive income either in one continu-ous statement or in two separate consecutive statements. This guidance also required entities to present reclassifica-tion adjustments for each component of accumulated other comprehensive income in both net income and other comprehensive income on the face of the financial statements. In December 2011, the FASB issued an update to this guidance deferring the requirement to present reclassification adjustments on the face of the financial statements. However, the Company is still required to present reclassification adjustments on either the face of the financial statement where comprehensive income is reported or disclose the reclassification adjust-ments in the notes to the financial statements. This guid-ance, including the deferral, became effective for the Company’s fiscal 2013 first quarter, with full retrospective application required. The Company has elected to present the items of net income and other comprehensive income in two separate consecutive statements. The adoption of this disclosure-only guidance did not have an impact on the Company’s results of operations, financial position or cash flows.
Recently Issued Accounting StandardsIn July 2013, the FASB issued authoritative guidance that requires an entity to present an unrecognized tax benefit, or a portion of an unrecognized tax benefit, in the finan-cial statements as a reduction to a deferred tax asset for a net operating loss (“NOL”) carryforward, a similar tax loss, or a tax credit carryforward. If either (i) an NOL carry-forward, a similar tax loss, or tax credit carryforward is not available as of the reporting date under the governing tax law to settle taxes that would result from the disallowance of the tax position or (ii) the entity does not intend to use the deferred tax asset for this purpose (provided that the tax law permits a choice), an entity should present an unrecognized tax benefit in the financial statements as a liability and should not net the unrecognized tax benefit with a deferred tax asset. This guidance becomes effective prospectively for unrecognized tax benefits that exist as of the Company’s fiscal 2015 first quarter, with retrospective
Income TaxesThe Company accounts for income taxes using an asset and liability approach that requires the recognition of deferred tax assets and liabilities for the expected future tax consequences of events that have been recognized in its consolidated financial statements or tax returns. The net deferred tax assets assume sufficient future earnings for their realization, as well as the continued application of currently anticipated tax rates. Included in net deferred tax assets is a valuation allowance for deferred tax assets, where management believes it is more-likely-than-not that the deferred tax assets will not be realized in the relevant jurisdiction. Based on the Company’s assessments, no additional valuation allowance is required. If the Company determines that a deferred tax asset will not be realizable, an adjustment to the deferred tax asset will result in a reduction of net earnings at that time.
The Company provides tax reserves for U.S. federal, state, local and foreign exposures relating to periods sub-ject to audit. The development of reserves for these expo-sures requires judgments about tax issues, potential outcomes and timing, and is a subjective critical estimate. The Company assesses its tax positions and records tax benefits for all years subject to examination based upon management’s evaluation of the facts, circumstances, and information available at the reporting dates. For those tax positions where it is more-likely-than-not that a tax benefit will be sustained, the Company has recorded the largest amount of tax benefit with a greater than 50% likelihood of being realized upon settlement with a tax authority that has full knowledge of all relevant information. For those tax positions where it is not more-likely-than-not that a tax benefit will be sustained, no tax benefit has been recognized in the consolidated financial statements. The Company classifies applicable interest and penalties as a component of the provision for income taxes. Although the outcome relating to these exposures is uncertain, in management’s opinion adequate provisions for income taxes have been made for estimable potential liabilities emanating from these exposures. If actual outcomes differ materially from these estimates, they could have a material impact on the Company’s consolidated results of operations.
Recently Adopted Accounting StandardsIn September 2011, the Financial Accounting Standards Board (“FASB”) amended its authoritative guidance related to testing goodwill for impairment. Under the revised guidance, entities testing goodwill for impairment have the option of performing a qualitative assessment before performing Step 1 of the goodwill impairment test.
148 THE EST{E LAUDER COMPANIES INC.
the Company’s fiscal 2015 first quarter, with early adop-tion permitted. The Company will apply this guidance when it becomes effective, and the adoption of this guid-ance is not expected to have a significant impact on its consolidated financial statements.
In February 2013, the FASB issued authoritative guid-ance requiring an entity to present, in a single location either parenthetically on the face of the financial state-ments or in a separate note, significant amounts reclassi-fied from each component of accumulated other comprehensive income and the income statement line items affected by the reclassification. An entity is not per-mitted to provide this information parenthetically on the face of the income statement if it has items that are not required to be reclassified in their entirety to net income. Instead of disclosing the income statement line affected, a cross reference to other disclosures that provide addi-tional details on these items is required. This guidance becomes effective prospectively for the Company’s fiscal 2014 first quarter, with early adoption permitted. The Company will apply this new guidance when it becomes effective, and the adoption of this guidance is not expected to have a significant impact on its consolidated financial statements.
In July 2012, the FASB amended its authoritative guid-ance related to testing indefinite-lived intangible assets for impairment. Under the revised guidance, entities testing their indefinite-lived intangible assets for impairment have the option of performing a qualitative assessment before performing further impairment testing. If entities deter-mine, on the basis of qualitative factors, that it is more-likely-than-not that the asset is impaired, a quantitative test is required. The guidance becomes effective in the beginning of the Company’s fiscal 2014, with early adop-tion permitted. The Company will apply this new guid-ance when it becomes effective, and the adoption of this guidance is not expected to have a significant impact on its consolidated financial statements.
In December 2011, the FASB issued authoritative guid-ance that creates new disclosure requirements about the nature of an entity’s rights of offset and related arrange-ments associated with its financial instruments and deriva-tive instruments. This revised guidance helps reconcile differences in the offsetting requirements under U.S. GAAP and International Financial Reporting Standards (“IFRS”). These requirements mandate that entities dis-close both gross and net information about instruments and transactions eligible for offset in the statement of financial position as well as instruments and transactions subject to an agreement similar to a master netting arrangement. In January 2013, the FASB issued an update
application and early adoption permitted. The Company is currently evaluating the timing of adoption and the impact of this balance sheet presentation guidance but does not expect it to have a significant impact on the Company’s consolidated financial statements.
In March 2013, the FASB issued authoritative guidance to resolve the diversity in practice concerning the release of the cumulative translation adjustment (“CTA”) into net income (i) when a parent sells a part or all of its invest-ment in a foreign entity or no longer holds a controlling financial interest in a subsidiary or group of assets within a foreign entity, and (ii) in connection with a step acquisi-tion of a foreign entity. This amended guidance requires that CTA be released in net income only if the sale or transfer results in the complete or substantially complete liquidation of the foreign entity in which the subsidiary or group of assets had resided, and that a pro rata portion of the CTA be released into net income upon a partial sale of an equity method investment in a foreign entity only. In addition, the amended guidance clarifies the definition of a sale of an investment in a foreign entity to include both, events that result in the loss of a controlling financial inter-est in a foreign entity and events that result in an acquirer obtaining control of an acquiree in which it held an equity interest immediately prior to the date of acquisition. The CTA should be released into net income upon the occur-rence of such events. This guidance becomes effective prospectively for the Company’s fiscal 2015 first quarter with early adoption permitted. The Company will apply this new guidance when it becomes effective, and the adoption of this guidance is not expected to have a significant impact on its consolidated financial statements.
In February 2013, the FASB issued authoritative guid-ance for the recognition, measurement, and disclosure of obligations resulting from joint and several liability arrangements for which the total amount of the obliga-tions within the scope of this guidance is fixed at the reporting date. It does not apply to certain obligations that are addressed within existing guidance in U.S. GAAP. This guidance requires an entity to measure in-scope obli-gations with joint and several liability (e.g., debt arrange-ments, other contractual obligations, settled litigations, judicial rulings) as the sum of the amount the reporting entity agreed to pay on the basis of its arrangement among its co-obligors and any additional amount it expects to pay on behalf of its co-obligors. In addition, an entity is required to disclose the nature and amount of the obligation. This guidance should be applied retro-spectively to all prior periods for those obligations result-ing from joint and several liability arrangements within the scope of this guidance that exist at the beginning of

THE EST{E LAUDER COMPANIES INC. 149
NOTE 3 — INVENTORY AND PROMOTIONAL MERCHANDISE
JUNE 30 2013 2012(In millions)
Inventory and promotional merchandise, net consists of:
Raw materials $ 274.2 $220.7Work in process 116.8 98.0Finished goods 510.9 473.9Promotional merchandise 212.0 191.0
$1,113.9 $983.6
2013
$ 274.2116.8510.9212.0
$1,113.9
NOTE 4 — PROPERTY, PLANT AND EQUIPMENT
JUNE 30 2013 2012(In millions)
Asset (Useful Life)Land $ 14.7 $ 14.6Buildings and improvements
(10 to 40 years) 195.4 188.8Machinery and equipment
(3 to 10 years) 647.9 620.9Computer hardware and software
(4 to 10 years) 948.4 850.4Furniture and fixtures
(5 to 10 years) 71.6 66.4Leasehold improvements 1,349.6 1,227.3
3,227.6 2,968.4Less accumulated depreciation
and amortization 1,876.9 1,736.6
$1,350.7 $1,231.8
2013
$ 14.7
195.4
647.9
948.4
71.61,349.6
3,227.6
1,876.9
$1,350.7
The cost of assets related to projects in progress of $178.7 million and $231.6 million as of June 30, 2013 and 2012, respectively, is included in their respective asset catego-ries above. Depreciation and amortization of property, plant and equipment was $329.8 million, $286.9 million and $283.5 million in fiscal 2013, 2012 and 2011, respec-tively. Depreciation and amortization related to the Company’s manufacturing process is included in Cost of sales and all other depreciation and amortization is included in Selling, general and administrative expenses in the accompanying consolidated statements of earnings.
that limits the scope of these disclosures to recognized derivative instruments, repurchase agreements and reverse repurchase agreements, and securities borrowing and lending transactions to the extent they are offset in the balance sheet or subject to an enforceable master net-ting arrangement or similar agreement. This disclosure-only guidance becomes effective for the Company’s fiscal 2014 first quarter, with retrospective application required. The Company currently does not hold any financial or derivative instruments within the scope of this guidance that are offset in its consolidated balance sheets or are subject to an enforceable master netting arrangement. The adoption of this guidance is not expected to have an impact on the Company’s results of operations, financial position or cash flows, but may require certain additional disclosures if the Company enters into additional arrange-ments that fall under the scope of this guidance.
Out-of-period AdjustmentsDuring the year ended June 30, 2013, the Company identified and recorded out-of-period adjustments related to the fiscal years ended June 30, 2008 through June 30, 2012.
During the three months ended September 30, 2012, these out-of-period adjustments resulted in a net decrease in earnings before taxes of $5.9 million, a decrease in net earnings of $7.4 million and a decrease in diluted net earnings per common share of $.02. These out-of-period adjustments resulted from an understatement of foreign transactional taxes (no impact on the provision for income taxes), an overstatement of accounts payable balances and an overstatement of prepaid asset balances.
During the three months ended December 31, 2012, the Company recorded an additional out-of-period adjust-ment related to the overstatement of accounts payable balances. This adjustment resulted in an increase in earn-ings before taxes of $13.6 million, an increase in net earn-ings of $9.1 million and an increase in diluted net earnings per common share of $.02 for the three months ended December 31, 2012.
The impact of these adjustments for the year ended June 30, 2013 is an increase in earnings before taxes of $7.7 million, an increase in net earnings of $1.7 million and no change in diluted net earnings per common share.
Individually and in the aggregate, these out-of-period adjustments did not have a material impact on the Com-pany’s consolidated financial statements for the year ended June 30, 2013, and the related items were not material to any previously issued consolidated financial statements.

150 THE EST{E LAUDER COMPANIES INC.
NOTE 5 — GOODWILL AND OTHER INTANGIBLE ASSETS
GoodwillThe Company assigns goodwill of a reporting unit to the product category in which that reporting unit predominantly operates at the time of acquisition. The following table presents goodwill by product category and the related change in the carrying amount: Skin Care Makeup Fragrance Hair Care Total(In millions)
Balance as of June 30, 2011Goodwill $ 70.4 $412.6 $55.0 $406.9 $944.9Accumulated impairments (24.4) — — (43.2) (67.6)
46.0 412.6 55.0 363.7 877.3
Goodwill acquired during the year — 8.8 — — 8.8Translation and other adjustments (1.5) (0.3) (0.2) (1.5) (3.5)
(1.5) 8.5 (0.2) (1.5) 5.3
Balance as of June 30, 2012Goodwill 68.1 421.1 54.8 403.4 947.4Accumulated impairments (23.6) — — (41.2) (64.8)
44.5 421.1 54.8 362.2 882.6
Goodwill acquired during the year — 9.2 — — 9.2Impairment charges (9.6) — — — (9.6)Translation and other adjustments 0.3 0.1 — (1.1) (0.7)
(9.3) 9.3 — (1.1) (1.1)
Balance as of June 30, 2013Goodwill 67.7 430.4 54.8 401.6 954.5Accumulated impairments (32.5) — — (40.5) (73.0)
$ 35.2 $430.4 $54.8 $361.1 $881.5
Other Intangible AssetsOther intangible assets include trademarks and patents, as well as license agreements and other intangible assets resulting from or related to businesses and assets purchased by the Company. Indefinite-lived intangible assets (e.g., trademarks) are not subject to amortization and are assessed at least annually for impairment during the fiscal fourth quarter, or more frequently if certain events or circumstances exist. Other intangible assets (e.g., non-compete agreements, customer lists) are amortized on a straight-line basis over their expected period of benefit, approximately 2 years to 20 years. Intangible assets related to license agreements were amortized on a straight-line basis over their useful lives based on the terms of the respective agreements. The costs incurred and expensed by the Company to extend or renew the term of acquired intangible assets during fiscal 2013 and 2012 were not significant to the Company’s results of operations.
Other intangible assets consist of the following:
JUNE 30, 2013 JUNE 30, 2012 Gross Accumulated Total Net Gross Accumulated Total Net Carrying Value Amortization Book Value Carrying Value Amortization Book Value(In millions)
Amortizable intangible assets:Customer lists and other $268.0 $204.1 $ 63.9 $268.4 $191.9 $ 76.5License agreements 43.0 43.0 — 43.0 43.0 —
$311.0 $247.1 63.9 $311.4 $234.9 76.5 Non-amortizable
intangible assets:Trademarks and other 105.7 113.6
Total intangible assets $169.6 $190.1
JUNE 30, 2013
Gross Accumulated Total NetCarrying Value Amortization Book Value
$268.0 $204.1 $ 63.943.0 43.0 —
$311.0 $247.1 63.9
105.7
$169.6

Impairment Testing During Fiscal 2013As of the Company’s annual step-one goodwill impair-ment test on April 1, 2013, the Company determined that the carrying value of the Darphin reporting unit exceeded its fair value. As a result, the Company recorded an impairment charge for the remainder of the goodwill related to the Darphin reporting unit of $9.6 million. The fair value of the reporting unit was based upon the income approach, utilizing estimated cash flows and a terminal value, discounted at a rate of return that reflects the relative risk of cash flows. The Company also deter-mined that the carrying value of the Darphin trademark exceeded its estimated fair value, which was based on the use of a royalty rate to determine discounted projected future cash flows (“relief-from-royalty method”). As a result, the Company recognized an impairment charge of $8.1 million for the remaining carrying value of the related trademark. These impairment charges were reflected in the skin care product category and in the Europe, the Middle East & Africa region.
Impairment Testing During Fiscal 2012During the second quarter of fiscal 2012, the Ojon report-ing unit identified a potential decline in its projected results of operations, primarily resulting from a softness in the direct response television channel, which caused the Company to review and revise Ojon’s long-term forecast. The Company concluded that these changes in the busi-ness of the Ojon reporting unit triggered the need for an interim impairment test of its trademarks as of December 31, 2011. These changes in circumstances were also an indicator that the carrying amount of the customer list may not be recoverable. The Company performed an interim impairment test for the trademarks and a recover-ability test for the customer list as of December 31, 2011. For the trademarks, the Company concluded that the carrying value exceeded its estimated fair value, which was based on the relief-from-royalty method. As a result, the Company recognized an impairment charge of $6.7 million. This charge was reflected in the hair care product category and in the Americas region. The Company concluded that the carrying value of the customer list was recoverable.
As of the Company’s annual indefinite-lived asset impairment test on April 1, 2012, the Company deter-mined that the carrying value of the Ojon brand trademark exceeded its estimated fair value, which was based on the relief-from-royalty method. As a result, the Company recognized an impairment charge of $3.3 million for the remaining carrying value of the related trademark. The Company also determined that the future cash flows associated with the Ojon brand customer list were less than its carrying value. As the remaining carry-ing value of the customer list was not recoverable, the Company recognized an impairment charge of $11.7 million. These impairment charges were reflected in the hair care product category and in the Americas region.
NOTE 6 — RETURNS AND CHARGES ASSOCIATED WITH RESTRUCTURING ACTIVITIESIn an effort to drive down costs and achieve synergies within the organization, in February 2009, the Company announced the implementation of a multi-faceted cost savings program (the “Program”) to position the Company to achieve long-term profitable growth. The Company anticipated the Program would result in total cumulative restructuring charges and other costs to implement those initiatives of between $350 million and $450 million before taxes. During the second quarter of fiscal 2013, the Company closed the Program. The Company concluded the approval of all initiatives under the Program and anticipates commencing the execution of those initiatives through fiscal 2014. As a result of the closure of the Program and the evaluation of the initiatives that have been implemented, as of June 30, 2013, the Company anticipates total cumulative restruc-turing charges and other costs to implement those initiatives to total between $320 million and $330 million and that such charges have been substantially recorded through fiscal 2013. The Company will continue to moni-tor the progress of these initiatives and revise estimates as appropriate.
THE EST{E LAUDER COMPANIES INC. 151
The aggregate amortization expense related to amortizable intangible assets for fiscal 2013, 2012 and 2011 was $12.5 million, $13.9 million and $14.6 million, respectively. The estimated aggregate amortization expense for each of the next five fiscal years is as follows:
FISCAL 2014 2015 2016 2017 2018(In millions)
Estimated aggregate amortization expense $12.4 $12.1 $12.0 $9.9 $8.4

made changes to turn around others. This included the exit from the global wholesale distribution of its Prescriptives brand, the reformulation of Ojon brand products and the exit from the global distribution of Sean John products. In connection with these activities, the Company incurred charges for product returns, inventory write-offs, reduction of workforce and termina-tion of contracts. As of June 30, 2013, the Company identified approximately $21 million of previously-approved returns and other costs related to these activi-ties that will not be incurred, primarily as a result of better-than-expected sales of products prior to the exit of the operations, as well as lower employee-related and store closure costs than originally estimated.
• Outsourcing — In order to balance the growing need for information technology support with the Company’s efforts to provide the most efficient and cost effective solutions, it continued the outsourcing of certain infor-mation technology processes. The Company incurred costs to transition services to outsource providers and employee-related termination costs. As of June 30, 2013, the Company identified approximately $26 million of previously-approved outsourcing initiatives for informa-tion technology services stemming from the decision not to implement certain aspects of these initiatives, as well as lower costs than originally anticipated to transition services on initiatives that were implemented.
152 THE EST{E LAUDER COMPANIES INC.
The Program focused on a redesign of the Company’s organizational structure in order to integrate it in a more cohesive way and operate more globally across brands and functions. The principal aspect of the Program was the reduction of the workforce by approximately 2,000 employees. Specific actions taken since the Program inception included:
• Resize and Reorganize the Organization — The Company continued the realignment and optimization of its organization to better leverage scale, improve produc-tivity, reduce complexity and achieve cost savings in each region and across various functions. This included reduction of the workforce which occurred through the consolidation of certain functions, which it achieved through a combination of normal attrition and job elimi-nations, and the closure and consolidation of certain distribution and office facilities. As of June 30, 2013, the Company identified approximately $14 million of previ-ously-approved restructuring costs that will not be incurred related to these activities, primarily as a result of certain employees relocating to other available positions within the Company.
• Turnaround or Exit Unprofitable Operations—To improve the profitability in certain of the Company’s brands and regions, the Company has selectively exited certain channels of distribution, categories and markets, and has
The following is a reconciliation of cumulative approved charges under the Program as compared with the revised estimated charges related to initiatives under the Program and total cumulative charges incurred through June 30, 2013:
Restructuring Charges Total Contract Restructuring Employee- Terminations Charges and Related Asset and Other Total Inventory Other Other Costs (In millions) Costs Write-offs Exit Costs Restructuring Returns Write-offs Charges to Implement
Approved charges from inception through December 31, 2012 $205.5 $23.5 $43.5 $272.5 $43.0 $20.0 $50.0 $385.5
Adjustments of estimated costs over (under) (35.0) (2.0) (4.0) (41.0) (11.0) 4.0 (13.0) (61.0)
Revised estimated charges as of June 30, 2013 $170.5 $21.5 $39.5 $231.5 $32.0 $24.0 $37.0 $324.5
Cumulative charges incurred through June 30, 2013 $169.6 $21.4 $37.4 $228.4 $32.0 $23.2 $36.8 $320.4
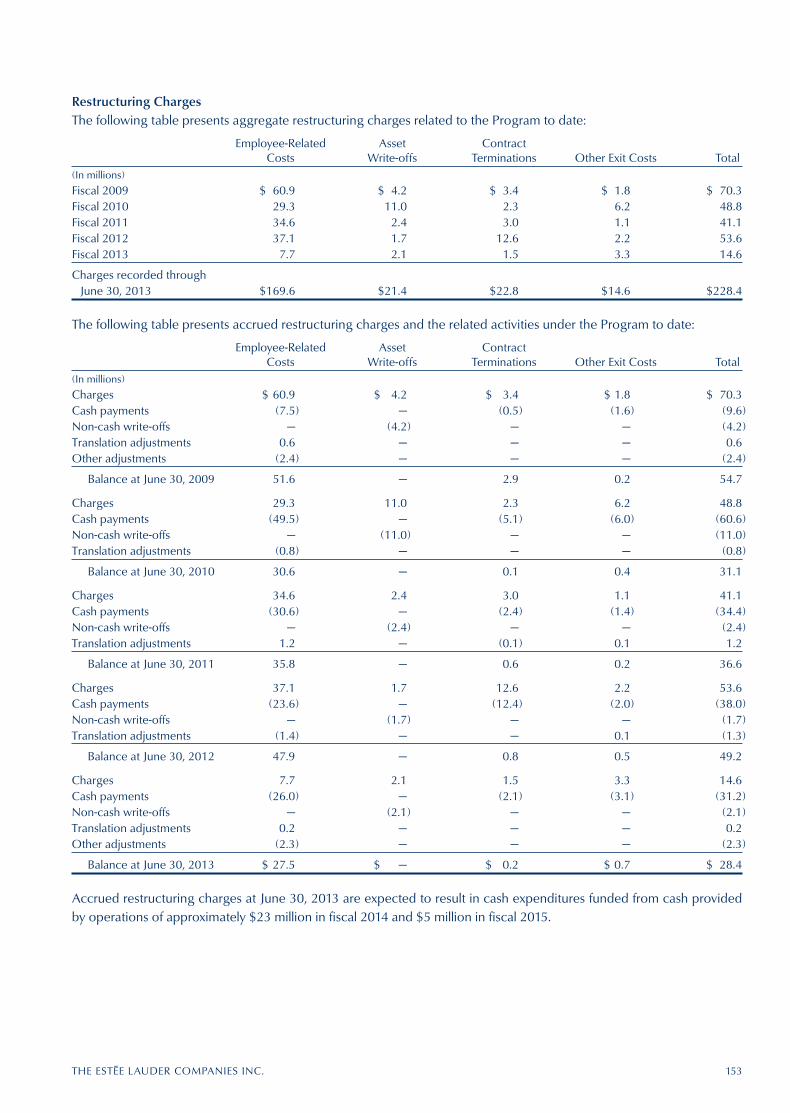
THE EST{E LAUDER COMPANIES INC. 153
Restructuring ChargesThe following table presents aggregate restructuring charges related to the Program to date:
Employee-Related Asset Contract Costs Write-offs Terminations Other Exit Costs Total(In millions)
Fiscal 2009 $ 60.9 $ 4.2 $ 3.4 $ 1.8 $ 70.3Fiscal 2010 29.3 11.0 2.3 6.2 48.8Fiscal 2011 34.6 2.4 3.0 1.1 41.1Fiscal 2012 37.1 1.7 12.6 2.2 53.6Fiscal 2013 7.7 2.1 1.5 3.3 14.6
Charges recorded through June 30, 2013 $169.6 $21.4 $22.8 $14.6 $228.4
The following table presents accrued restructuring charges and the related activities under the Program to date:
Employee-Related Asset Contract Costs Write-offs Terminations Other Exit Costs Total(In millions)
Charges $ 60.9 $ 4.2 $ 3.4 $ 1.8 $ 70.3Cash payments (7.5) — (0.5) (1.6) (9.6)Non-cash write-offs — (4.2) — — (4.2)Translation adjustments 0.6 — — — 0.6Other adjustments (2.4) — — — (2.4)
Balance at June 30, 2009 51.6 — 2.9 0.2 54.7
Charges 29.3 11.0 2.3 6.2 48.8Cash payments (49.5) — (5.1) (6.0) (60.6)Non-cash write-offs — (11.0) — — (11.0)Translation adjustments (0.8) — — — (0.8)
Balance at June 30, 2010 30.6 — 0.1 0.4 31.1
Charges 34.6 2.4 3.0 1.1 41.1Cash payments (30.6) — (2.4) (1.4) (34.4)Non-cash write-offs — (2.4) — — (2.4)Translation adjustments 1.2 — (0.1) 0.1 1.2
Balance at June 30, 2011 35.8 — 0.6 0.2 36.6
Charges 37.1 1.7 12.6 2.2 53.6Cash payments (23.6) — (12.4) (2.0) (38.0)Non-cash write-offs — (1.7) — — (1.7)Translation adjustments (1.4) — — 0.1 (1.3)
Balance at June 30, 2012 47.9 — 0.8 0.5 49.2
Charges 7.7 2.1 1.5 3.3 14.6Cash payments (26.0) — (2.1) (3.1) (31.2)Non-cash write-offs — (2.1) — — (2.1)Translation adjustments 0.2 — — — 0.2Other adjustments (2.3) — — — (2.3)
Balance at June 30, 2013 $ 27.5 $ — $ 0.2 $ 0.7 $ 28.4
Accrued restructuring charges at June 30, 2013 are expected to result in cash expenditures funded from cash provided by operations of approximately $23 million in fiscal 2014 and $5 million in fiscal 2015.

Total Returns and Other Charges Associated with Restructuring ActivitiesThe following table presents total returns and charges associated with restructuring and other activities related to the Program:
YEAR ENDED JUNE 30 2013 2012 2011(In millions)
Sales returns (included in Net Sales) $ 1.5 $ 2.1 $ 4.6
Cost of sales 1.2 1.5 5.8Restructuring charges 14.6 53.6 41.1Other charges 0.5 6.0 7.9
Total charges associated with restructuring activities $17.8 $63.2 $59.4
2013
$ 1.51.2
14.60.5
$17.8
During fiscal 2013, the Company recorded $1.5 million reflecting sales returns (less related cost of sales of $0.2 million) and a write-off of inventory of $1.4 million associated with exiting unprofitable operations.
During fiscal 2012, the Company recorded $2.1 million reflecting sales returns (less related cost of sales of $0.3 million) and a write-off of inventory of $1.8 million associated with exiting unprofitable operations.
During fiscal 2011, the Company recorded $4.6 million reflecting sales returns (less related cost of sales of $1.2 million) and a write-off of inventory of $7.0 million associated with turnaround operations, primarily related to the reformulation of Ojon brand products.
Other charges in connection with the implementation of the Program primarily relate to consulting and other professional services.
154 THE EST{E LAUDER COMPANIES INC.
NOTE 7— INCOME TAXESThe provision for income taxes is comprised of the following:
YEAR ENDED JUNE 30 2013 2012 2011(In millions)
Current:Federal $261.7 $154.5 $127.2Foreign 241.5 254.1 220.0State and local 24.3 14.1 (1.0)
527.5 422.7 346.2
Deferred:Federal (35.2) (13.8) (27.8)Foreign (41.3) (9.0) 2.6State and local 0.4 0.7 0.7
(76.1) (22.1) (24.5)
$451.4 $400.6 $321.7
2013
$261.7241.5
24.3
527.5
(35.2)(41.3)
0.4
(76.1)
$451.4
A reconciliation of the U.S. federal statutory income tax rate to our actual effective tax rate on earnings before income taxes is as follows:
YEAR ENDED JUNE 30 2013 2012 2011(In millions)
Provision for income taxes at statutory rate 35.0% 35.0% 35.0%Increase (decrease) due to:
State and local income taxes, net of federal tax benefit 1.3 1.1 0.8Taxation of foreign operations (4.9) (4.2) (2.7)Income tax reserve adjustments (1.0) (0.8) (1.8)Other, net 0.2 0.7 0.1
Effective tax rate 30.6% 31.8% 31.4%
2013
35.0%
1.3(4.9)(1.0)0.2
30.6%
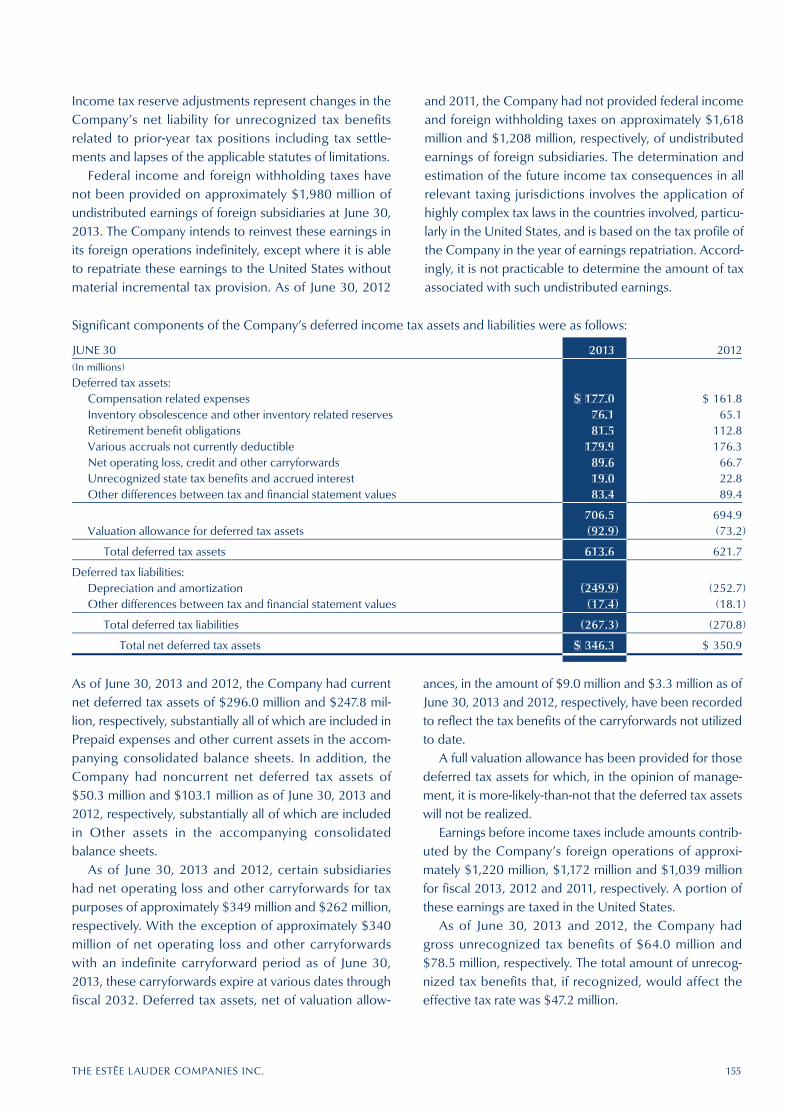
Income tax reserve adjustments represent changes in the Company’s net liability for unrecognized tax benefits related to prior-year tax positions including tax settle-ments and lapses of the applicable statutes of limitations.
Federal income and foreign withholding taxes have not been provided on approximately $1,980 million of undistributed earnings of foreign subsidiaries at June 30, 2013. The Company intends to reinvest these earnings in its foreign operations indefinitely, except where it is able to repatriate these earnings to the United States without material incremental tax provision. As of June 30, 2012
As of June 30, 2013 and 2012, the Company had current net deferred tax assets of $296.0 million and $247.8 mil-lion, respectively, substantially all of which are included in Prepaid expenses and other current assets in the accom-panying consolidated balance sheets. In addition, the Company had noncurrent net deferred tax assets of $50.3 million and $103.1 million as of June 30, 2013 and 2012, respectively, substantially all of which are included in Other assets in the accompanying consolidated balance sheets.
As of June 30, 2013 and 2012, certain subsidiaries had net operating loss and other carryforwards for tax purposes of approximately $349 million and $262 million, respectively. With the exception of approximately $340 million of net operating loss and other carryforwards with an indefinite carryforward period as of June 30, 2013, these carryforwards expire at various dates through fiscal 2032. Deferred tax assets, net of valuation allow-
and 2011, the Company had not provided federal income and foreign withholding taxes on approximately $1,618 million and $1,208 million, respectively, of undistributed earnings of foreign subsidiaries. The determination and estimation of the future income tax consequences in all relevant taxing jurisdictions involves the application of highly complex tax laws in the countries involved, particu-larly in the United States, and is based on the tax profile of the Company in the year of earnings repatriation. Accord-ingly, it is not practicable to determine the amount of tax associated with such undistributed earnings.
ances, in the amount of $9.0 million and $3.3 million as of June 30, 2013 and 2012, respectively, have been recorded to reflect the tax benefits of the carryforwards not utilized to date.
A full valuation allowance has been provided for those deferred tax assets for which, in the opinion of manage-ment, it is more-likely-than-not that the deferred tax assets will not be realized.
Earnings before income taxes include amounts contrib-uted by the Company’s foreign operations of approxi-mately $1,220 million, $1,172 million and $1,039 million for fiscal 2013, 2012 and 2011, respectively. A portion of these earnings are taxed in the United States.
As of June 30, 2013 and 2012, the Company had gross unrecognized tax benefits of $64.0 million and $78.5 million, respectively. The total amount of unrecog-nized tax benefits that, if recognized, would affect the effective tax rate was $47.2 million.
THE EST{E LAUDER COMPANIES INC. 155
Significant components of the Company’s deferred income tax assets and liabilities were as follows:
JUNE 30 2013 2012(In millions)
Deferred tax assets:Compensation related expenses $ 177.0 $ 161.8Inventory obsolescence and other inventory related reserves 76.1 65.1Retirement benefit obligations 81.5 112.8Various accruals not currently deductible 179.9 176.3Net operating loss, credit and other carryforwards 89.6 66.7Unrecognized state tax benefits and accrued interest 19.0 22.8Other differences between tax and financial statement values 83.4 89.4
706.5 694.9Valuation allowance for deferred tax assets (92.9) (73.2)
Total deferred tax assets 613.6 621.7
Deferred tax liabilities:Depreciation and amortization (249.9) (252.7)Other differences between tax and financial statement values (17.4) (18.1)
Total deferred tax liabilities (267.3) (270.8)
Total net deferred tax assets $ 346.3 $ 350.9
2013
$ 177.076.181.5
179.989.619.083.4
706.5(92.9)
613.6
(249.9)(17.4)
(267.3)
$ 346.3

156 THE EST{E LAUDER COMPANIES INC.
transfer pricing, which may require an extended period of time for resolution.
The Company had been notified of a disallowance of tax deductions claimed by its subsidiary in Spain for fiscal years 1999 through 2002. An appeal against this reassessment was filed with the Chief Tax Inspector. On July 18, 2005, the final assessment made by the Chief Tax Inspector was received, confirming the reassessment made by the tax auditors. During fiscal 2006, an appeal against this final assessment was filed with the Madrid Regional Economic Administrative Tribunal (“TEAR”). In view of the TEAR’s silence, during fiscal 2007 the claim was presumed to be dismissed and an appeal was filed against it with the Central Economic-Administrative Tribunal (“TEAC”). During the fiscal 2008 fourth quarter, the TEAC dismissed the claim and, on June 10, 2008, the Company filed an appeal for judicial review with the National Appellate Court. During fiscal 2009, the Company completed the appeal proceedings with the National Appellate Court and, as of June 30, 2011, awaited the court’s decision. During the first quarter of fiscal 2012, the National Appellate Court notified the Company that the appeal was denied. The Company has been assessed corporate income tax and interest of $3.7 million, net of tax, at current exchange rates. In response, the Company filed an appeal with the Spain Supreme
Earnings from the Company’s global operations are subject to tax in various jurisdictions both within and out-side the United States. During fiscal 2011, the Company commenced participation in the U.S. Internal Revenue Service (the “IRS”) Compliance Assurance Program (“CAP”). The objective of CAP is to reduce taxpayer bur-den and uncertainty while assuring the IRS of the accu-racy of income tax returns prior to filing, thereby reducing or eliminating the need for post-filing examinations.
During the first and fourth quarters of fiscal 2013, the Company formally concluded the compliance process with respect to fiscal years 2011 and 2012, respectively, under the IRS CAP. The conclusion of this process did not impact the Company’s consolidated financial statements. As of June 30, 2013, the compliance process was ongoing with respect to fiscal 2013.
During the second quarter of fiscal 2012, the Company formally concluded the IRS examination of fiscal years 2009 and 2010. The conclusion of this examination did not materially impact the Company’s consolidated finan-cial statements.
The Company is currently undergoing income tax examinations and controversies in several state, local and foreign jurisdictions. These matters are in various stages of completion and involve complex multi-jurisdictional issues common among multinational enterprises, including
The Company classifies applicable interest and penal-ties related to unrecognized tax benefits as a component of the provision for income taxes. During fiscal 2013 and 2012, the Company recognized gross interest and penalty benefits of $8.2 million and $6.8 million, respectively, in the accompanying consolidated statements of earnings.
The total gross accrued interest and penalties in the accompanying consolidated balance sheets at June 30, 2013 and 2012 were $17.4 million and $28.6 million, respectively. A reconciliation of the beginning and ending amount of gross unrecognized tax benefits is as follows:
JUNE 30 2013 2012(In millions)
Beginning of the year balance of gross unrecognized tax benefits $ 78.5 $104.8Gross amounts of increases as a result of tax positions taken during a prior period 5.6 16.4Gross amounts of decreases as a result of tax positions taken during a prior period (9.8) (16.4)Gross amounts of increases as a result of tax positions taken during the current period 8.4 5.5Amounts of decreases in unrecognized tax benefits relating to settlements with
taxing authorities (6.8) (12.2)Reductions to unrecognized tax benefits as a result of a lapse of the applicable
statutes of limitations (11.9) (19.6)
End of year balance of gross unrecognized tax benefits $ 64.0 $ 78.5
2013
$ 78.55.6
(9.8)8.4
(6.8)
(11.9)
$ 64.0

THE EST{E LAUDER COMPANIES INC. 157
Major Jurisdiction Open Fiscal Years
Belgium 2009–2013Canada 2006–2013China 2009–2013France 2006–2013Germany 2004–2013Hong Kong 2007–2013Japan 2012–2013Korea 2009–2013Russia 2013Spain 1999–2002, 2008–2013Switzerland 2011–2013United Kingdom 2012–2013United States 2013State of California 2007–2013State of New York 2010–2013
The Company is also subject to income tax examinations in numerous other state, local and foreign jurisdictions. The Company believes that its tax reserves are adequate for all years subject to examination.
NOTE 8 — OTHER ACCRUED LIABILITIES Other accrued liabilities consist of the following:
JUNE 30 2013 2012(In millions)
Advertising, merchandising and sampling $ 338.4 $ 318.6
Employee compensation 433.3 431.4Payroll and other taxes 135.7 133.0Restructuring 23.2 34.8Other 422.7 398.0
$1,353.3 $1,315.8
2013
$ 338.4433.3135.7
23.2422.7
$1,353.3
Court. While no assurance can be given as to the out-come in respect of this assessment and pending appeal in the Spanish courts, based on the decision of the National Appellate Court, management believes it is not more-likely-than-not that the subsidiary will be successful in its appeal to the Spain Supreme Court. Accordingly, the Company established a reserve during fiscal 2012 which resulted in an increase to the provision for income taxes equal to the $3.7 million exposure, net of tax. Separately, during fiscal 2012, the Company’s subsidiary in Spain made cash payments totaling $4.0 million, at current exchange rates, to the Spain tax authority as an advance deposit to limit the additional interest that would be due to the Spain tax authority should it receive an unfavorable decision from the Spain Supreme Court.
During fiscal 2013, the Company concluded various state, local and foreign income tax audits and examina-tions while several other matters, including those noted above, were initiated or remained pending. On the basis of the information available in this regard as of June 30, 2013, it is reasonably possible that the total amount of unrecognized tax benefits could decrease in a range of $10 million to $15 million within 12 months as a result of projected resolutions of global tax examinations and con-troversies and a potential lapse of the applicable statutes
of limitations.The tax years subject to examination vary depending
on the tax jurisdiction. As of June 30, 2013, the following tax years remain subject to examination by the major tax jurisdictions indicated:
NOTE 9 — DEBTThe Company’s current and long-term debt and available financing consist of the following:
Available financing Debt at June 30 at June 30, 2013
2013 2012 Committed Uncommitted(In millions)
3.70% Senior Notes, due August 15, 2042 (“2042 Senior Notes”) $ 248.9 $ — $ — $ —6.00% Senior Notes, due May 15, 2037 (“2037 Senior Notes”) 296.5 296.4 — —5.75% Senior Notes, due October 15, 2033 (“2033 Senior Notes”) 197.8 197.7 — —2.35% Senior Notes, due August 15, 2022 (“2022 Senior Notes”) 249.8 — — —5.55% Senior Notes, due May 15, 2017 (“2017 Senior Notes”) 328.0 334.9 — —7.75% Senior Notes, due November 1, 2013 (“2013 Senior Notes”) — 230.1 — —Commercial paper — 200.0 — 1,000.0Loan participation notes — — — 150.0Other long-term borrowings 5.0 10.0 — —Other current borrowings 18.3 19.0 — 203.8Revolving credit facility — — 1,000.0 —
1,344.3 1,288.1 $1,000.0 $1,353.8
Less current debt including current maturities (18.3) (219.0)
$1,326.0 $1,069.1
2013
$ 248.9 296.5197.8249.8328.0
———
5.018.3
—
1,344.3
(18.3)
$1,326.0

As of June 30, 2013, the Company had outstanding $248.9 million of the 2042 Senior Notes consisting of $250.0 million principal and unamortized discount of $1.1 million. The 2042 Senior Notes, when issued in August 2012, were priced at 99.567% with a yield of 3.724%. Interest payments are required to be made semi-annually on February 15 and August 15.
As of June 30, 2013, the Company had outstanding $296.5 million of 2037 Senior Notes consisting of $300.0 million principal and unamortized debt discount of $3.5 million. The 2037 Senior Notes, when issued in May 2007, were priced at 98.722% with a yield of 6.093%. Interest payments are required to be made semi-annually on May 15 and November 15. In April 2007, in anticipation of the issuance of the 2037 Senior Notes, the Company entered into a series of forward-starting interest rate swap agree-ments on a notional amount totaling $210.0 million at a weighted-average all-in rate of 5.45%. The forward- starting interest rate swap agreements were settled upon the issuance of the new debt and the Company recog-nized a loss in other comprehensive income of $0.9 mil-lion that will be amortized to interest expense over the life of the 2037 Senior Notes. As a result of the forward- starting interest rate swap agreements, the debt discount and debt issuance costs, the effective interest rate on the 2037 Senior Notes will be 6.181% over the life of the debt.
As of June 30, 2013, the Company had outstanding $197.8 million of 2033 Senior Notes consisting of $200.0 million principal and unamortized debt discount of $2.2 million. The 2033 Senior Notes, when issued in September 2003, were priced at 98.645% with a yield of 5.846%. Interest payments are required to be made semi-annually on April 15 and October 15. In May 2003, in anticipation of the issuance of the 5.75% Senior Notes, the Company entered into a series of treasury lock agreements on a notional amount totaling $195.0 million at a weighted-average all-in rate of 4.53%. The treasury lock agreements were settled upon the issuance of the new debt and the Company received a payment of $15.0 million that will be amortized against interest expense over the life of the 2033 Senior Notes. As a result of the treasury lock agree-ments, the debt discount and debt issuance costs, the effective interest rate on the 2033 Senior Notes will be 5.395% over the life of the debt.
As of June 30, 2013, the Company had outstanding $249.8 million of the 2022 Senior Notes consisting of $250.0 million principal and unamortized discount of $0.2 million. The 2022 Senior Notes, when issued in August 2012, were priced at 99.911% with a yield of 2.360%. Interest payments are required to be made semi-annually on February 15 and August 15.
As of June 30, 2013, the Company had outstanding $328.0 million of 2017 Senior Notes consisting of $300.0 million principal, an unamortized debt discount of $0.2 million and a $28.2 million adjustment to reflect the remaining termination value of an interest rate swap. The 2017 Senior Notes, when issued in May 2007, were priced at 99.845% with a yield of 5.570%. Interest payments are required to be made semi-annually on May 15 and November 15. During fiscal 2011, the Company termi-nated its interest rate swap agreements with a notional amount totaling $250.0 million which had effectively con-verted the fixed rate interest on its outstanding 2017 Senior Notes to variable interest rates. The instrument, which was classified as an asset, had a fair value of $47.4 million at the date of cash settlement. This net settlement is classified as a financing activity on the consolidated statements of cash flows. Hedge accounting treatment was discontinued prospectively and the fair value adjust-ment to the carrying amount of the related debt is being amortized against interest expense over the remaining life of the debt.
In September 2012, the Company used the net pro-ceeds of the 2022 Senior Notes and 2042 Senior Notes to redeem the $230.1 million principal amount of its 2013 Senior Notes at a price of 108% of the principal amount and recorded a pre-tax expense on the extinguishment of debt of $19.1 million representing the call premium of $18.6 million and the pro-rata write-off of $0.5 million of issuance costs and debt discount.
The Company has a commercial paper program under which it may issue commercial paper in the United States. In the second quarter of fiscal 2013, the Company increased the limit of this program from $750.0 million to $1.0 billion. In the first quarter of fiscal 2013, the Company had repaid, using cash on hand, $200.0 million of commercial paper that was outstanding at June 30, 2012. At June 30, 2013, the Company had no commercial paper outstanding.
As of June 30, 2013, the Company had overdraft borrowing agreements with two financial institutions pursuant to which its subsidiary in Turkey may borrow up to 50.0 million Turkish lira ($26.0 million at the exchange rate at June 30, 2013). The interest rate on borrowings under these agreements was approximately 7%. There were no debt issuance costs incurred related to these agreements. The outstanding balance at June 30, 2013 was 14.1 million Turkish lira ($7.4 million at the exchange rate at June 30, 2013) and is classified as current debt on the Company’s consolidated balance sheet.
As of June 30, 2013, the Company had a fixed rate promissory note agreement with a financial institution
158 THE EST{E LAUDER COMPANIES INC.
pursuant to which the Company may borrow up to $150.0 million in the form of loan participation notes through one of its subsidiaries in Europe. The interest rate on borrow-ings under this agreement is at an all-in fixed rate deter-mined by the lender and agreed to by the Company at the date of each borrowing. At June 30, 2013, no borrow-ings were outstanding under this agreement. Debt issuance costs incurred related to this agreement were de minimis.
As of June 30, 2013, the Company had a $1.0 billion senior unsecured revolving credit facility that expires on July 14, 2015 (the “Facility”). The Facility may be used to provide credit support for the Company’s commercial paper program and for general corporate purposes. Up to the equivalent of $250 million of the Facility is available for multi-currency loans. The interest rate on borrowings under the Facility is based on LIBOR or on the higher of prime, which is the rate of interest publicly announced by the administrative agent, or ½% plus the Federal funds rate. In fiscal 2012, the Company incurred costs of approxi-mately $1 million to establish the Facility which are being amortized over the term of the Facility. The Facility has an annual fee of $0.7 million, payable quarterly, based on the Company’s current credit ratings. The Facility also con-tains a cross-default provision whereby a failure to pay other material financial obligations in excess of $100.0 million (after grace periods and absent a waiver from the lenders) would result in an event of default and the accel-eration of the maturity of any outstanding debt under this facility. At June 30, 2013, no borrowings were outstanding under this agreement.
The Company maintains uncommitted credit facilities in various regions throughout the world. Interest rate terms for these facilities vary by region and reflect prevail-ing market rates for companies with strong credit ratings. During fiscal 2013 and 2012, the monthly average amount outstanding was approximately $11.8 million, and the annualized monthly weighted-average interest rate incurred was approximately 8.8% and 14.1%, respectively.
Refer to Note 13 — Commitments and Contingencies for the Company’s projected debt service payments, as of June 30, 2013, over the next five fiscal years.
NOTE 10 — DERIVATIVE FINANCIAL INSTRUMENTS The Company addresses certain financial exposures through a controlled program of risk management that includes the use of derivative financial instruments. The Company enters into foreign currency forward contracts. The Company may enter into option contracts to reduce the effects of fluctuating foreign currency exchange rates and interest rate derivatives to manage the effects of interest rate movements on the Company’s aggregate liability portfolio. The Company also enters into foreign currency forward contracts and may use option contracts, not designated as hedging instruments, to mitigate the change in fair value of specific assets and liabilities on the balance sheet. The Company does not utilize derivative financial instruments for trading or speculative purposes. Costs associated with entering into these deriv-ative financial instruments have not been material to the Company’s consolidated financial results.
For each derivative contract entered into where the Company looks to obtain hedge accounting treatment, the Company formally documents all relationships between hedging instruments and hedged items, as well as its risk-management objective and strategy for under-taking the hedge transaction, the nature of the risk being hedged, how the hedging instruments’ effectiveness in offsetting the hedged risk will be assessed prospectively and retrospectively, and a description of the method of measuring ineffectiveness. This process includes linking all derivatives to specific assets and liabilities on the balance sheet or to specific firm commitments or forecasted trans-actions. The Company also formally assesses, both at the hedge’s inception and on an ongoing basis, whether the derivatives that are used in hedging transactions are highly effective in offsetting changes in fair values or cash flows of hedged items. If it is determined that a deriv-ative is not highly effective, or that it has ceased to be a highly effective hedge, the Company will be required to discontinue hedge accounting with respect to that derivative prospectively.
THE EST{E LAUDER COMPANIES INC. 159

160 THE EST{E LAUDER COMPANIES INC.
The fair values of the Company’s derivative financial instruments included in the consolidated balance sheets are presented as follows:
Asset Derivatives Liability Derivatives
Balance Sheet Location Fair Value(1) Balance Sheet Location Fair Value(1) June 30 June 30
2013 2012 2013 2012 (In millions)
Derivatives Designated as Hedging Instruments:
Prepaid expenses and Foreign currency forward contracts other current assets $20.8 $16.1 Other accrued liabilities $6.4 $4.9
Derivatives Not Designated as Hedging Instruments:
Prepaid expenses and Foreign currency forward contracts other current assets 0.9 1.6 Other accrued liabilities 2.7 1.3
Total Derivatives $21.7 $17.7 $9.1 $6.2
2013
$20.8
0.9$21.7
2013
$6.4
2.7$9.1
(1) See Note 11— Fair Value Measurements for further information about how the fair value of derivative assets and liabilities are determined.
The amounts of the gains and losses related to the Company’s derivative financial instruments designated as hedging
instruments are presented as follows:
Amount of Gain or (Loss) Location of Gain or (Loss) Amount of Gain or (Loss)Recognized in OCI Reclassified from Reclassified from
on Derivatives Accumulated OCI into Accumulated OCI into (Effective Portion) Earnings (Effective Portion) Earnings (Effective Portion)(1)
June 30 June 30
2013 2012 2013 2012(In millions)
Derivatives in Cash Flow Hedging Relationships:
Foreign currency forward contracts $10.3 $40.2 Cost of sales $ (1.8) $ 4.6
Selling, general and administrative 10.6 7.1
Total derivatives $10.3 $40.2 $ 8.8 $11.7
2013
$10.3
$10.3
2013
$ (1.8)
10.6$ 8.8
(1) The amount of gain (loss) recognized in earnings related to the amount excluded from effectiveness testing was $1.8 million and $(0.8) million for fiscal 2013 and 2012, respectively. The loss recognized in earnings related to the ineffective portion of the hedging relationships was $0.2 million for fiscal 2013. The gain recognized in earnings related to the ineffective portion of the hedging relationships was de minimis for fiscal 2012.
The amounts of the gains and losses related to the Company’s derivative financial instruments not designated as hedging instruments are presented as follows:
Location of Gain or (Loss) Amount of Gain or (Loss) Recognized in Earnings on Derivatives Recognized in Earnings on Derivatives June 30
2013 2012(In millions)
Derivatives Not Designated as Hedging Instruments:
Foreign currency forward contracts Selling, general and administrative $(2.1) $(0.3)
2013
$(2.1)
Foreign Currency Cash-Flow HedgesThe Company enters into foreign currency forward contracts to hedge anticipated transactions, as well as receivables and payables denominated in foreign curren-cies, for periods consistent with the Company’s identified exposures. The purpose of the hedging activities is to minimize the effect of foreign exchange rate movements on costs and on the cash flows that the Company receives from foreign subsidiaries. The majority of foreign currency forward contracts are denominated in currencies of major industrial countries. The Company may also enter into foreign currency option contracts to hedge anticipated transactions where there is a high probability that antici-pated exposures will materialize. The foreign currency forward contracts entered into to hedge anticipated transactions have been designated as foreign currency cash-flow hedges and have varying maturities through the end of March 2015. Hedge effectiveness of foreign cur-rency forward contracts is based on a hypothetical deriva-tive methodology and excludes the portion of fair value attributable to the spot-forward difference which is recorded in current-period earnings. Hedge effectiveness of foreign currency option contracts is based on a dollar offset methodology.
The ineffective portion of both foreign currency for-ward and option contracts is recorded in current-period earnings. For hedge contracts that are no longer deemed highly effective, hedge accounting is discontinued and gains and losses accumulated in OCI are reclassified to earnings when the underlying forecasted transaction occurs. If it is probable that the forecasted transaction will no longer occur, then any gains or losses in accumulated OCI are reclassified to current-period earnings. As of June 30, 2013, the Company’s foreign currency cash-flow hedges were highly effective in all material respects. The estimated net gain as of June 30, 2013 that is expected to be reclassified from accumulated OCI into earnings, net of tax, within the next twelve months is $9.5 million. The accumulated gain on derivative instruments in accumu-lated OCI was $16.9 million and $15.3 million as of June 30, 2013 and June 30, 2012, respectively.
At June 30, 2013, the Company had foreign currency forward contracts in the amount of $1,579.6 million. The foreign currencies included in foreign currency forward contracts (notional value stated in U.S. dollars) are principally the British pound ($426.2 million), Euro ($268.8 million), Canadian dollar ($198.6 million), Swiss franc ($111.5 million), Australian dollar ($92.1 million), Thailand baht ($75.5 million) and Hong Kong dollar ($58.1 million).
At June 30, 2012, the Company had foreign currency forward contracts in the amount of $1,476.0 million. The foreign currencies included in foreign currency forward contracts (notional value stated in U.S. dollars) are princi-pally the British pound ($376.7 million), Euro ($223.4 million), Canadian dollar ($184.0 million), Swiss franc ($129.9 million), Australian dollar ($106.5 million), Korean won ($75.1 million) and Thailand baht ($51.3 million).
Fair-Value HedgesThe Company may enter into interest rate derivative con-tracts to manage the exposure to interest rate fluctuations on its funded indebtedness and anticipated issuance of debt for periods consistent with the identified exposures. During fiscal 2011, the Company terminated its interest rate swap agreements which had effectively converted the fixed rate interest on its outstanding 2017 Senior Notes to variable interest rates. Additionally, the instru-ment, which was classified as an asset, had a fair value of $47.4 million at the date of cash settlement. This net set-tlement is classified as a financing activity on the consoli-dated statements of cash flows. Hedge accounting treatment was discontinued prospectively and the fair value adjustment to the carrying amount of the related debt is being amortized against interest expense over the remaining life of the debt.
Credit RiskAs a matter of policy, the Company only enters into deriv-ative contracts with counterparties that have a long-term credit rating of at least A- or higher by at least two nation-ally recognized rating agencies. The counterparties to these contracts are major financial institutions. Exposure to credit risk in the event of nonperformance by any of the counterparties is limited to the gross fair value of con-tracts in asset positions, which totaled $21.7 million at June 30, 2013, of which 22% and 21% were attributable to two counterparties. To manage this risk, the Company has established strict counterparty credit guidelines that are continually monitored. Accordingly, management believes risk of loss under these hedging contracts is remote.
Certain of the Company’s derivative financial instru-ments contain credit-risk-related contingent features. At June 30, 2013, the Company was in a net asset position for certain derivative contracts that contain such features with two counterparties. The fair value of those contracts as of June 30, 2013 was approximately $4.6 million. As of June 30, 2013, the Company was in compliance with such credit-risk-related contingent features.
THE EST{E LAUDER COMPANIES INC. 161

162 THE EST{E LAUDER COMPANIES INC.
Level 1: Inputs based on quoted market prices for identi-cal assets or liabilities in active markets at the measurement date.
Level 2: Observable inputs other than quoted prices included in Level 1, such as quoted prices for similar assets and liabilities in active markets; quoted prices for identical or similar assets and liabilities in markets that are not active; or other inputs that are observable or can be corrobo-rated by observable market data.
Level 3: Inputs reflect management’s best estimate of what market participants would use in pricing the asset or liability at the measurement date. The inputs are unobservable in the market and significant to the instrument’s valuation.
NOTE 11 — FAIR VALUE MEASUREMENTSThe Company records its financial assets and liabilities at fair value, which is defined as the price that would be received to sell an asset or paid to transfer a liability, in the principal or most advantageous market for the asset or liability, in an orderly transaction between market partici-pants at the measurement date. The accounting for fair value measurements must be applied to nonfinancial assets and nonfinancial liabilities, which principally consist of assets and liabilities acquired through business com-binations, goodwill, indefinite-lived intangible assets and long-lived assets for the purposes of calculating potential impairment, and liabilities associated with restructuring activities. The Company is required to maximize the use of observable inputs and minimize the use of unobserv-able inputs when measuring fair value. The three levels of inputs that may be used to measure fair value are as follows:
The following table presents the Company’s hierarchy for its financial assets and liabilities measured at fair value on a recurring basis as of June 30, 2013: Level 1 Level 2 Level 3 Total(In millions)
Assets:Foreign currency forward contracts $ — $21.7 $ — $21.7Available-for-sale securities 6.5 — — 6.5
Total $6.5 $21.7 $ — $28.2
Liabilities:Foreign currency forward contracts $ — $ 9.1 $ — $ 9.1
The following table presents the Company’s hierarchy for its financial assets and liabilities measured at fair value on a recurring basis as of June 30, 2012: Level 1 Level 2 Level 3 Total(In millions)
Assets:Foreign currency forward contracts $ — $17.7 $ — $17.7Available-for-sale securities 5.9 — — 5.9
Total $5.9 $17.7 $ — $23.6
Liabilities:Foreign currency forward contracts $ — $ 6.2 $ — $ 6.2
The following table presents the Company’s hierarchy and impairment charges for certain of its nonfinancial assets mea-sured at fair value on a nonrecurring basis during fiscal 2013:
Impairment Date of Charges Carrying Value Carrying Value Level 3(In millions)
Goodwill $ 9.6 April 1, 2013 $ — $ —Other intangible assets, net (trademark) 8.1 April 1, 2013 — —
Total $17.7

To determine the fair value of the Darphin reporting unit at April 1, 2013, the Company used the income approach. Under the income approach, the Company determines fair value using a discounted cash flow method, project-ing future cash flows of the reporting unit. For the Darphin reporting unit, negative cash flows in future forecasted periods would not support a value in excess of carrying value and therefore the Company concluded that all remaining goodwill was fully impaired.
To determine fair value of the Ojon trademark at December 31, 2011, the Company used the relief-from-royalty method. This method, which is an income approach, assumed that, in lieu of ownership, a third party would be willing to pay a royalty in order to obtain the rights to use the comparable asset. The calculation of fair value requires significant judgment in determining both the assets’ estimated cash flows as well as the appropriate discount and royalty rates applied to those cash flows to determine fair value. As these inputs are unobservable in the market and significant to the fair value calculation, the trademark was classified as Level 3. In determining its fair value, a terminal growth rate of 3% was applied to future cash flows, and was used in conjunction with a 1.5% royalty rate discounted to present value at a 17% rate.
To determine fair value of the Ojon trademark and cus-tomer list at April 1, 2012, the Company assessed the future performance of the related reporting unit and determined that negative cash flows in future forecasted periods would not support a royalty rate for the calcula-tion of fair value of the trademark and negative income associated with existing customers would not support a value for the customer list. The Company therefore concluded that the carrying value of these assets were not recoverable.
See Note 5 — Goodwill and Other Intangible Assets for further discussion of the Company’s impairment testing.
The following methods and assumptions were used to estimate the fair value of the Company’s other classes of financial instruments for which it is practicable to estimate that value:
To determine fair value of the Darphin trademark at April 1, 2013, the Company assessed the future perfor-mance of the related reporting unit and determined that negative cash flows in future forecasted periods would not support a royalty rate for the calculation of fair value of the trademark. The Company therefore concluded that the carrying value of this asset was not recoverable.
The following table presents the Company’s hierarchy and impairment charges for certain of its nonfinancial assets measured at fair value on a nonrecurring basis during fiscal 2012:
Cash and cash equivalents — The carrying amount approximates fair value, primarily because of the short maturity of cash equivalent instruments.
Available-for-sale securities — Available-for-sale securi-ties are generally comprised of mutual funds and are valued using quoted market prices on an active exchange. Available-for-sale securities are included in Other assets in the accompanying consolidated balance sheets.
Note receivable — During the second quarter of fiscal 2013, the Company amended the agreement related to the August 2007 sale of Rodan + Fields (a brand then owned by the Company) to receive a fixed amount in lieu of future contingent consideration and other rights. The fair value of the receivable under the amended agree-ment was determined by discounting the future cash flows using an implied market rate of 6.6%. This implied market rate reflects the Company’s estimate of interest rates prevailing in the market for notes with comparable remaining maturities, the creditworthiness of the counter-party, and an assessment of the ultimate collectability of the instrument. The implied market rate is deemed to be an unobservable input and as such the Company’s note receivable is classified within Level 3 of the valuation hier-archy. An increase or decrease in the risk premium of 100 basis points would not result in a significant change to the fair value of the receivable. See Note 13 — Commitments and Contingencies for further discussion on the amended agreement.
Foreign currency forward contracts — The fair values of the Company’s foreign currency forward contracts were determined using an industry-standard valuation model,
THE EST{E LAUDER COMPANIES INC. 163
Impairment Date of Charges Carrying Value Carrying Value Level 3(In millions)
Other intangible assets, net (trademark) $ 6.7 December 31, 2011 $3.3 $3.3Other intangible assets, net (trademark) 3.3 April 1, 2012 — —Other intangible assets, net (customer list) 11.7 April 1, 2012 — —
Total $21.7

which is based on an income approach. The significant observable inputs to the model, such as swap yield curves and currency spot and forward rates, were obtained from an independent pricing service. To determine the fair value of contracts under the model, the difference between the contract price and the current forward rate was discounted using LIBOR for contracts with maturities up to 12 months, and swap yield curves for contracts with maturities greater than 12 months.
NOTE 12 — PENSION, DEFERRED COMPENSATION AND POST-RETIREMENT BENEFIT PLANSThe Company maintains pension plans covering substan-tially all of its full-time employees for its U.S. operations and a majority of its international operations. Several plans provide pension benefits based primarily on years of service and employees’ earnings. In certain instances, the Company adjusts benefits in connection with inter-national employee transfers.
Retirement Growth Account Plan (U.S.)The Retirement Growth Account Plan is a trust-based, noncontributory qualified defined benefit pension plan. The Company’s funding policy consists of contributions at a rate that provides for future plan benefits and maintains appropriate funded percentages. Such contribution is not less than the minimum required by the Employee Retirement Income Security Act of 1974 (“ERISA”), as amended, and subsequent pension legislation and is not more than the maximum amount deductible for income tax purposes.
Restoration Plan (U.S.)The Company also has an unfunded, non-qualified domestic noncontributory pension Restoration Plan to provide benefits in excess of Internal Revenue Code limitations.
Current and long-term debt — The fair value of the Company’s debt was estimated based on the current rates offered to the Company for debt with the same remaining maturities. To a lesser extent, debt also includes capital lease obligations for which the carrying amount approxi-mates the fair value. The Company’s debt is classified within Level 2 of the valuation hierarchy.
The estimated fair values of the Company’s financial instruments are as follows:
International Pension PlansThe Company maintains international pension plans, the most significant of which are defined benefit pension plans. The Company’s funding policies for these plans are determined by local laws and regulations. The Company’s most significant defined benefit pension obligations are included in the plan summaries below.
Post-retirement Benefit PlansThe Company maintains a domestic post-retirement ben-efit plan which provides certain medical and dental benefits to eligible employees. Employees hired after January 1, 2002 are not eligible for retiree medical bene-fits when they retire. Certain retired employees who are receiving monthly pension benefits are eligible for par-ticipation in the plan. Contributions required and benefits received by retirees and eligible family members are dependent on the age of the retiree. It is the Company’s practice to fund these benefits as incurred and to provide discretionary funding for the future liability up to the max-imum amount deductible for income tax purposes.
Certain of the Company’s international subsidiaries and affiliates have post-retirement plans, although most participants are covered by government-sponsored or administered programs.
164 THE EST{E LAUDER COMPANIES INC.
JUNE 30, 2013 JUNE 30, 2012
Carrying Amount Fair Value Carrying Amount Fair Value(In millions)
NonderivativesCash and cash equivalents $1,495.7 $1,495.7 $1,347.7 $1,347.7Available-for-sale securities 6.5 6.5 5.9 5.9Note receivable 16.8 16.9 — —Current and long-term debt 1,344.3 1,387.8 1,288.1 1,478.9
DerivativesForeign currency forward contracts — asset 12.6 12.6 11.5 11.5
JUNE 30, 2013
Carrying Amount Fair Value
$1,495.7 $1,495.76.5 6.5
16.8 16.91,344.3 1,387.8
12.6 12.6
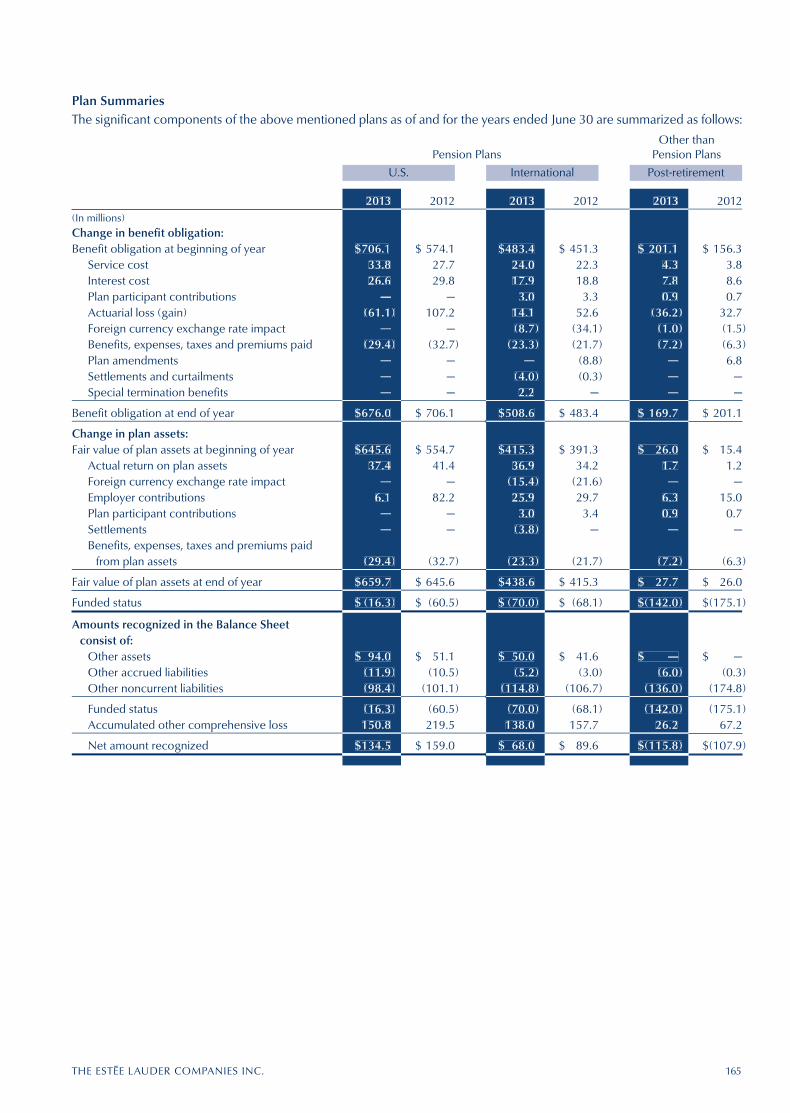
Plan SummariesThe significant components of the above mentioned plans as of and for the years ended June 30 are summarized as follows:
Other than Pension Plans Pension Plans
U.S. International Post-retirement
2013 2012 2013 2012 2013 2012(In millions)Change in benefit obligation:Benefit obligation at beginning of year $706.1 $ 574.1 $483.4 $ 451.3 $ 201.1 $ 156.3
Service cost 33.8 27.7 24.0 22.3 4.3 3.8Interest cost 26.6 29.8 17.9 18.8 7.8 8.6Plan participant contributions — — 3.0 3.3 0.9 0.7Actuarial loss (gain) (61.1) 107.2 14.1 52.6 (36.2) 32.7Foreign currency exchange rate impact — — (8.7) (34.1) (1.0) (1.5)Benefits, expenses, taxes and premiums paid (29.4) (32.7) (23.3) (21.7) (7.2) (6.3)Plan amendments — — — (8.8) — 6.8Settlements and curtailments — — (4.0) (0.3) — —Special termination benefits — — 2.2 — — —
Benefit obligation at end of year $676.0 $ 706.1 $508.6 $ 483.4 $ 169.7 $ 201.1
Change in plan assets:Fair value of plan assets at beginning of year $645.6 $ 554.7 $415.3 $ 391.3 $ 26.0 $ 15.4
Actual return on plan assets 37.4 41.4 36.9 34.2 1.7 1.2Foreign currency exchange rate impact — — (15.4) (21.6) — —Employer contributions 6.1 82.2 25.9 29.7 6.3 15.0Plan participant contributions — — 3.0 3.4 0.9 0.7Settlements — — (3.8) — — —Benefits, expenses, taxes and premiums paid
from plan assets (29.4) (32.7) (23.3) (21.7) (7.2) (6.3)
Fair value of plan assets at end of year $659.7 $ 645.6 $438.6 $ 415.3 $ 27.7 $ 26.0
Funded status $ (16.3) $ (60.5) $ (70.0) $ (68.1) $(142.0) $(175.1)
Amounts recognized in the Balance Sheet consist of:
Other assets $ 94.0 $ 51.1 $ 50.0 $ 41.6 $ — $ —Other accrued liabilities (11.9) (10.5) (5.2) (3.0) (6.0) (0.3)Other noncurrent liabilities (98.4) (101.1) (114.8) (106.7) (136.0) (174.8)
Funded status (16.3) (60.5) (70.0) (68.1) (142.0) (175.1)Accumulated other comprehensive loss 150.8 219.5 138.0 157.7 26.2 67.2
Net amount recognized $134.5 $ 159.0 $ 68.0 $ 89.6 $(115.8) $(107.9)
2013
$706.133.826.6
—(61.1)
—(29.4)
———
$676.0
$645.637.4
—6.1
——
(29.4)
$659.7
$ (16.3)
$ 94.0(11.9)(98.4)
(16.3)150.8
$134.5
2013
$483.424.017.9
3.014.1(8.7)
(23.3)—
(4.0)2.2
$508.6
$415.336.9
(15.4)25.9
3.0(3.8)
(23.3)
$438.6
$ (70.0)
$ 50.0(5.2)
(114.8)
(70.0)138.0
$ 68.0
2013
$ 201.1 4.37.80.9
(36.2)(1.0)(7.2)
———
$ 169.7
$ 26.0 1.7
—6.30.9
—
(7.2)
$ 27.7
$(142.0)
$ —(6.0)
(136.0)
(142.0)26.2
$(115.8)
THE EST{E LAUDER COMPANIES INC. 165

Other than Pension Plans Pension Plans
U.S. International Post-retirement
2013 2012 2011 2013 2012 2011 2013 2012 2011($ in millions)Components of net periodic
benefit cost:Service cost, net $ 33.8 $ 27.7 $ 25.8 $ 24.0 $ 22.3 $ 21.5 $ 4.3 $ 3.8 $ 3.8Interest cost 26.6 29.8 27.8 17.9 18.8 19.5 7.8 8.6 7.8Expected return on assets (45.2) (38.9) (34.7) (19.2) (21.1) (21.9) (2.0) (1.2) (0.5)Amortization of:
Actuarial loss (gain) 14.5 7.9 9.7 9.3 4.9 5.8 4.4 1.9 1.7Prior service cost 0.7 0.7 0.7 2.8 3.3 2.5 0.8 0.3 (0.1)Transition (asset) obligation — — — (0.1) — — — — —Settlements — — — 0.7 (0.3) 9.1 — — —
Curtailments — — — (0.2) — — — — —Special termination benefits — — — 2.2 — — — — —
Net periodic benefit cost $ 30.4 $ 27.2 $ 29.3 $ 37.4 $ 27.9 $ 36.5 $15.3 $13.4 $12.7
Weighted-average assumptions used to determine benefit obligations at June 30:
Discount rate 4.30– 3.90% 5.40% 1.00– 1.00– 1.25– 4.75– 3.70– 5.40– 4.90% 7.25% 7.00% 8.25% 8.75% 8.65% 8.75%
Rate of compensation increase 4.00– 4.00– 4.00– 1.00– 1.00– 2.00– N/A N/A N/A 12.00% 12.00% 12.00% 5.50% 6.00% 6.00%Weighted-average assumptions
used to determine net periodic benefit cost for the year ended June 30:
Discount rate 3.90% 5.40% 5.30% 1.00– 1.25– 1.25– 3.70– 5.40– 5.30– 7.00% 8.25% 8.00% 8.65% 8.75% 9.00%
Expected return on assets 7.50% 7.75% 7.75% 2.25– 2.00– 2.50– 7.50% 7.75% 7.75% 7.00% 8.25% 8.00%
Rate of compensation increase 4.00– 4.00– 4.00– 1.00– 2.00– 2.00– N/A N/A N/A 12.00% 12.00% 12.00% 6.00% 6.00% 6.00%
2013
$ 33.826.6
(45.2)
14.50.7
————
$ 30.4
4.30–4.90%
4.00–12.00%
3.90%
7.50%
4.00–12.00%
2013
$ 24.017.9
(19.2)
9.32.8
(0.1)0.7
(0.2)2.2
$ 37.4
1.00–7.25%
1.00–5.50%
1.00–7.00%
2.25–7.00%
1.00–6.00%
2013
$ 4.37.8
(2.0)
4.40.8
————
$15.3
4.75–8.75%
N/A
3.70–8.65%
7.50%
N/A
The discount rate for each plan used for determining future net periodic benefit cost is based on a review of highly rated long-term bonds. The discount rate for the Company’s Domestic Plans is based on a bond portfolio that includes only long-term bonds with an Aa rating, or equivalent, from a major rating agency. As of June 30, 2013, the Company used an above-mean yield curve, rather than the broad-based yield curve it used before, because it believes it represents a better estimate of an effective settlement rate of the obligation, and the timing and amount of cash flows related to the bonds included in this portfolio are expected to match the estimated defined benefit payment streams of the Company’s Domes-tic Plans. For the Company’s international plans, the discount rate in a particular country was principally determined based on a yield curve constructed from high quality corporate bonds in each country, with the resulting portfolio having a duration matching that particular plan. In determining the long-term rate of return for a plan, the Company considers the historical rates of return, the nature of the plan’s investments and an expectation for the plan’s strategies.
Assumed health care cost trend rates have a significant effect on the amounts reported for the health care plans. The assumed weighted-average health care cost trend rate for the coming year is 6.51% while the weighted-average ultimate trend rate of 4.56% is expected to be reached in approximately 15 years. A one-percentage-point change in assumed health care cost trend rates for fiscal 2013 would have had the following effects:
One-Percentage-Point Increase One-Percentage-Point Decrease(In millions) Effect on total service and interest costs $ 1.3 $ (1.1)
Effect on post-retirement benefit obligations $12.4 $(11.1)
166 THE EST{E LAUDER COMPANIES INC.
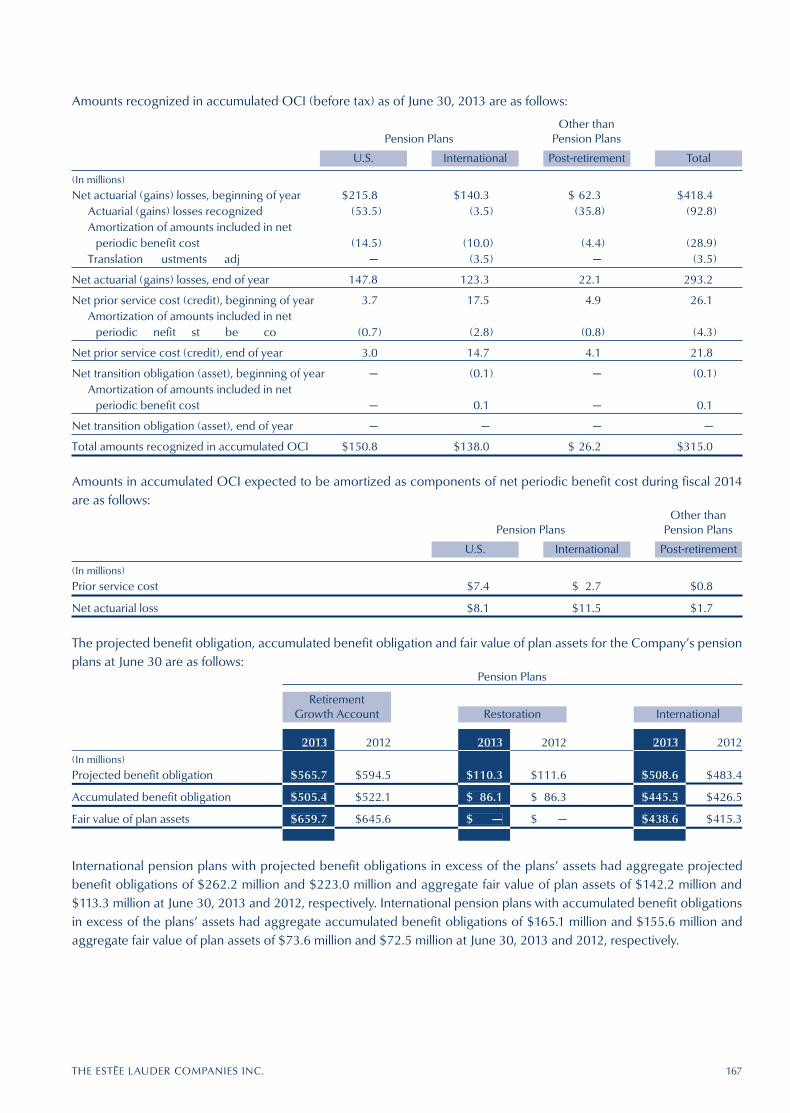
THE EST{E LAUDER COMPANIES INC. 167
Amounts recognized in accumulated OCI (before tax) as of June 30, 2013 are as follows:
Other than Pension Plans Pension Plans
U.S. International Post-retirement Total
(In millions)
Net actuarial (gains) losses, beginning of year $215.8 $140.3 $ 62.3 $418.4Actuarial (gains) losses recognized (53.5) (3.5) (35.8) (92.8)Amortization of amounts included in net
periodic benefit cost (14.5) (10.0) (4.4) (28.9)Translation adjustments — (3.5) — (3.5)
Net actuarial (gains) losses, end of year 147.8 123.3 22.1 293.2
Net prior service cost (credit), beginning of year 3.7 17.5 4.9 26.1Amortization of amounts included in net
periodic benefit cost (0.7) (2.8) (0.8) (4.3)
Net prior service cost (credit), end of year 3.0 14.7 4.1 21.8
Net transition obligation (asset), beginning of year — (0.1) — (0.1)Amortization of amounts included in net
periodic benefit cost — 0.1 — 0.1
Net transition obligation (asset), end of year — — — —
Total amounts recognized in accumulated OCI $150.8 $138.0 $ 26.2 $315.0
Amounts in accumulated OCI expected to be amortized as components of net periodic benefit cost during fiscal 2014 are as follows:
Other than Pension Plans Pension Plans
U.S. International Post-retirement
(In millions)
Prior service cost $7.4 $ 2.7 $0.8
Net actuarial loss $8.1 $11.5 $1.7
The projected benefit obligation, accumulated benefit obligation and fair value of plan assets for the Company’s pension plans at June 30 are as follows:
Pension Plans
Retirement Growth Account Restoration International
2013 2012 2013 2012 2013 2012(In millions)
Projected benefit obligation $565.7 $594.5 $110.3 $111.6 $508.6 $483.4
Accumulated benefit obligation $505.4 $522.1 $ 86.1 $ 86.3 $445.5 $426.5
Fair value of plan assets $659.7 $645.6 $ — $ — $438.6 $415.3
2013
$565.7
$505.4
$659.7
2013
$110.3
$ 86.1
$ —
2013
$508.6
$445.5
$438.6
International pension plans with projected benefit obligations in excess of the plans’ assets had aggregate projected benefit obligations of $262.2 million and $223.0 million and aggregate fair value of plan assets of $142.2 million and $113.3 million at June 30, 2013 and 2012, respectively. International pension plans with accumulated benefit obligations in excess of the plans’ assets had aggregate accumulated benefit obligations of $165.1 million and $155.6 million and aggregate fair value of plan assets of $73.6 million and $72.5 million at June 30, 2013 and 2012, respectively.

The following is a description of the valuation method-ologies used for plan assets measured at fair value:
Short-term investment funds — The fair value is determined using the Net Asset Value (“NAV”) provided by the administrator of the fund. The NAV is based on the value of the underlying assets owned by the fund, minus its liabilities, and then divided by the number of shares outstanding. The NAV is a quoted price in a market that is not active and is primarily classified as Level 2. When quoted in an active market, these investments are classi-fied within Level 1 of the valuation hierarchy.
Government and agency securities — When quoted prices are available in an active market, the investments are clas-sified as Level 1. When quoted market prices are not avail-able in an active market, these investments are classified as Level 2.
Equity securities — The fair values reflect the closing price reported on a major market where the individual securities are traded. These investments are classified within Level 1 of the valuation hierarchy.
Debt instruments — The fair values are based on a compilation of primarily observable market information or a broker quote in a non-active market. These invest-ments are primarily classified within Level 2 of the valuation hierarchy.
Commingled funds — The fair values are determined using NAV provided by the administrator of the fund. The NAV is based on the value of the underlying assets owned by the trust/entity, minus its liabilities, and then divided by the number of shares outstanding. When quoted in an active market, these investments are classified within Level 1 of the valuation hierarchy. When the market is not active, these investments are generally classified within Level 2. When the market is not active and some inputs are unobservable, these investments are generally classi-fied within Level 3.
168 THE EST{E LAUDER COMPANIES INC.
The expected cash flows for the Company’s pension and post-retirement plans are as follows: Other than Pension Plans Pension Plans
U.S. International Post-retirement
(In millions)
Expected employer contributions for year ending June 30, 2014 $ — $ 29.2 $ —
Expected benefit payments for year ending June 30,2014 53.3 20.2 6.22015 53.9 17.0 6.82016 51.6 19.8 7.42017 48.3 22.3 8.22018 50.6 22.4 8.9Years 2019 –2023 277.4 123.9 56.7
Plan AssetsThe Company’s investment strategy for its pension and post-retirement plan assets is to maintain a diversified portfolio of asset classes with the primary goal of meeting long-term cash requirements as they become due. Assets are primarily invested in diversified funds that hold equity or debt securities to maintain the security of the funds while maximizing the returns within each plan’s investment policy. The investment policy for each plan specifies the type of investment vehicles appropriate for the plan, asset allocation guidelines, criteria for selection of investment managers, procedures to monitor overall investment performance, as well as investment manager performance.
The Company’s target asset allocation at June 30, 2013 is as follows:
Other than Pension Plans Pension Plans
U.S. International Post-retirement
Equity 30% 19% 30%Debt securities 41% 54% 41%Other 29% 27% 29%
100% 100% 100%
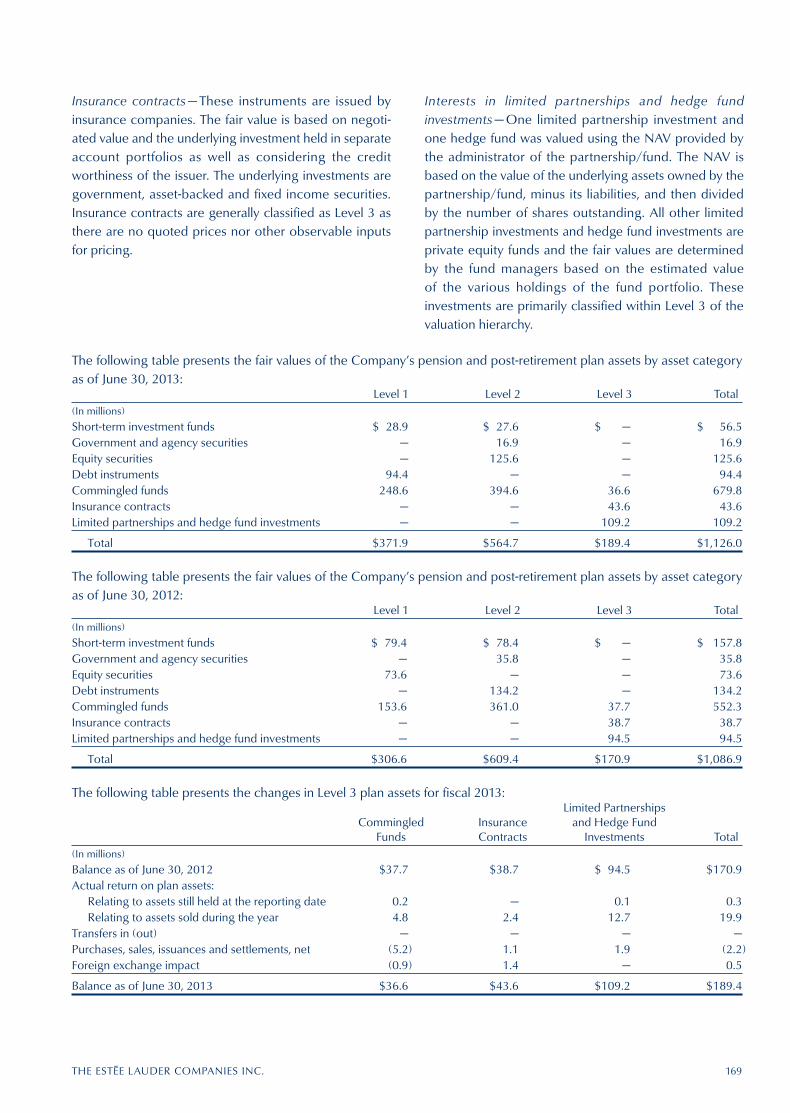
Insurance contracts — These instruments are issued by insurance companies. The fair value is based on negoti-ated value and the underlying investment held in separate account portfolios as well as considering the credit worthiness of the issuer. The underlying investments are government, asset-backed and fixed income securities. Insurance contracts are generally classified as Level 3 as there are no quoted prices nor other observable inputs for pricing.
Interests in limited partnerships and hedge fund investments — One limited partnership investment and one hedge fund was valued using the NAV provided by the administrator of the partnership/fund. The NAV is based on the value of the underlying assets owned by the partnership/fund, minus its liabilities, and then divided by the number of shares outstanding. All other limited partnership investments and hedge fund investments are private equity funds and the fair values are determined by the fund managers based on the estimated value of the various holdings of the fund portfolio. These investments are primarily classified within Level 3 of the valuation hierarchy.
THE EST{E LAUDER COMPANIES INC. 169
The following table presents the fair values of the Company’s pension and post-retirement plan assets by asset category as of June 30, 2013: Level 1 Level 2 Level 3 Total(In millions)
Short-term investment funds $ 28.9 $ 27.6 $ — $ 56.5Government and agency securities — 16.9 — 16.9Equity securities — 125.6 — 125.6Debt instruments 94.4 — — 94.4Commingled funds 248.6 394.6 36.6 679.8Insurance contracts — — 43.6 43.6Limited partnerships and hedge fund investments — — 109.2 109.2
Total $371.9 $564.7 $189.4 $1,126.0
The following table presents the fair values of the Company’s pension and post-retirement plan assets by asset category as of June 30, 2012: Level 1 Level 2 Level 3 Total(In millions)
Short-term investment funds $ 79.4 $ 78.4 $ — $ 157.8Government and agency securities — 35.8 — 35.8Equity securities 73.6 — — 73.6Debt instruments — 134.2 — 134.2Commingled funds 153.6 361.0 37.7 552.3Insurance contracts — — 38.7 38.7Limited partnerships and hedge fund investments — — 94.5 94.5
Total $306.6 $609.4 $170.9 $1,086.9
The following table presents the changes in Level 3 plan assets for fiscal 2013: Limited Partnerships Commingled Insurance and Hedge Fund Funds Contracts Investments Total(In millions)
Balance as of June 30, 2012 $37.7 $38.7 $ 94.5 $170.9Actual return on plan assets:
Relating to assets still held at the reporting date 0.2 — 0.1 0.3Relating to assets sold during the year 4.8 2.4 12.7 19.9
Transfers in (out) — — — —Purchases, sales, issuances and settlements, net (5.2) 1.1 1.9 (2.2)Foreign exchange impact (0.9) 1.4 — 0.5
Balance as of June 30, 2013 $36.6 $43.6 $109.2 $189.4
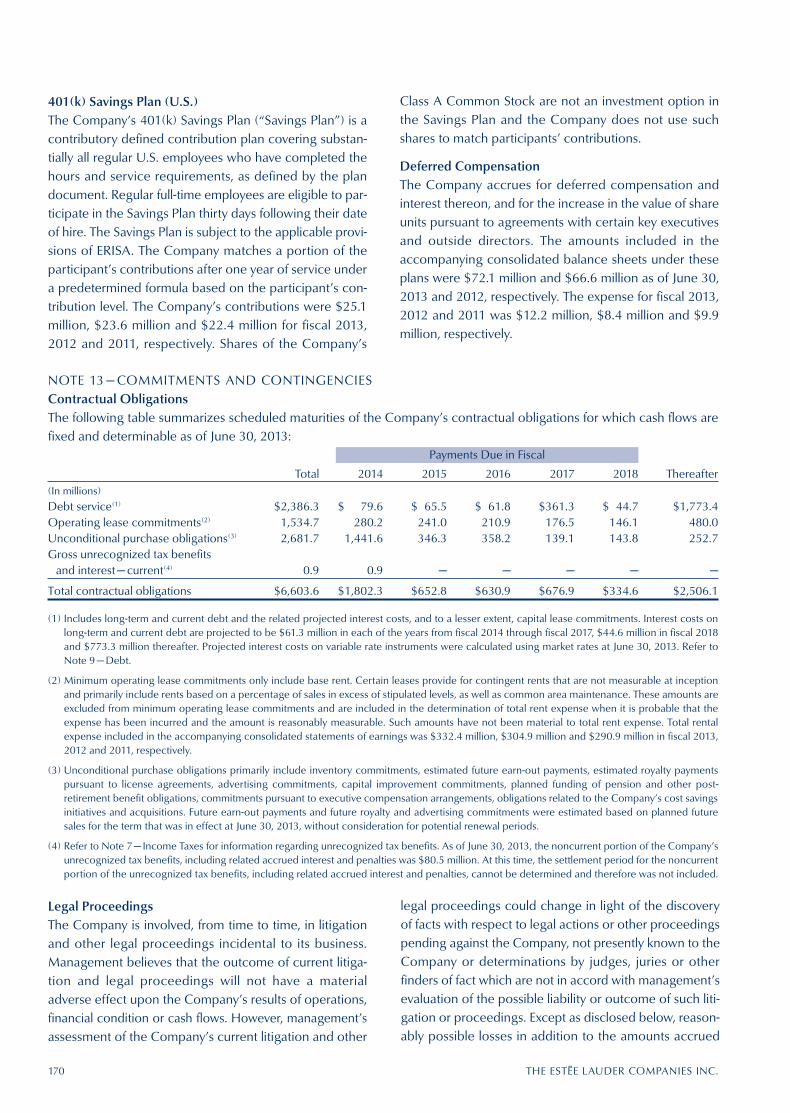
401(k) Savings Plan (U.S.)The Company’s 401(k) Savings Plan (“Savings Plan”) is a contributory defined contribution plan covering substan-tially all regular U.S. employees who have completed the hours and service requirements, as defined by the plan document. Regular full-time employees are eligible to par-ticipate in the Savings Plan thirty days following their date of hire. The Savings Plan is subject to the applicable provi-sions of ERISA. The Company matches a portion of the participant’s contributions after one year of service under a predetermined formula based on the participant’s con-tribution level. The Company’s contributions were $25.1 million, $23.6 million and $22.4 million for fiscal 2013, 2012 and 2011, respectively. Shares of the Company’s
Legal ProceedingsThe Company is involved, from time to time, in litigation and other legal proceedings incidental to its business. Management believes that the outcome of current litiga-tion and legal proceedings will not have a material adverse effect upon the Company’s results of operations, financial condition or cash flows. However, management’s assessment of the Company’s current litigation and other
Class A Common Stock are not an investment option in the Savings Plan and the Company does not use such shares to match participants’ contributions.
Deferred CompensationThe Company accrues for deferred compensation and interest thereon, and for the increase in the value of share units pursuant to agreements with certain key executives and outside directors. The amounts included in the accompanying consolidated balance sheets under these plans were $72.1 million and $66.6 million as of June 30, 2013 and 2012, respectively. The expense for fiscal 2013, 2012 and 2011 was $12.2 million, $8.4 million and $9.9 million, respectively.
legal proceedings could change in light of the discovery of facts with respect to legal actions or other proceedings pending against the Company, not presently known to the Company or determinations by judges, juries or other finders of fact which are not in accord with management’s evaluation of the possible liability or outcome of such liti-gation or proceedings. Except as disclosed below, reason-ably possible losses in addition to the amounts accrued
170 THE EST{E LAUDER COMPANIES INC.
NOTE 13 — COMMITMENTS AND CONTINGENCIESContractual ObligationsThe following table summarizes scheduled maturities of the Company’s contractual obligations for which cash flows are fixed and determinable as of June 30, 2013:
Payments Due in Fiscal
Total 2014 2015 2016 2017 2018 Thereafter(In millions)
Debt service(1) $2,386.3 $ 79.6 $ 65.5 $ 61.8 $361.3 $ 44.7 $1,773.4Operating lease commitments(2) 1,534.7 280.2 241.0 210.9 176.5 146.1 480.0Unconditional purchase obligations(3) 2,681.7 1,441.6 346.3 358.2 139.1 143.8 252.7Gross unrecognized tax benefits
and interest — current(4) 0.9 0.9 — — — — —
Total contractual obligations $6,603.6 $1,802.3 $652.8 $630.9 $676.9 $334.6 $2,506.1
(1) Includes long-term and current debt and the related projected interest costs, and to a lesser extent, capital lease commitments. Interest costs on long-term and current debt are projected to be $61.3 million in each of the years from fiscal 2014 through fiscal 2017, $44.6 million in fiscal 2018 and $773.3 million thereafter. Projected interest costs on variable rate instruments were calculated using market rates at June 30, 2013. Refer to Note 9 — Debt.
(2) Minimum operating lease commitments only include base rent. Certain leases provide for contingent rents that are not measurable at inception and primarily include rents based on a percentage of sales in excess of stipulated levels, as well as common area maintenance. These amounts are excluded from minimum operating lease commitments and are included in the determination of total rent expense when it is probable that the expense has been incurred and the amount is reasonably measurable. Such amounts have not been material to total rent expense. Total rental expense included in the accompanying consolidated statements of earnings was $332.4 million, $304.9 million and $290.9 million in fiscal 2013, 2012 and 2011, respectively.
(3) Unconditional purchase obligations primarily include inventory commitments, estimated future earn-out payments, estimated royalty payments pursuant to license agreements, advertising commitments, capital improvement commitments, planned funding of pension and other post- retirement benefit obligations, commitments pursuant to executive compensation arrangements, obligations related to the Company’s cost savings initiatives and acquisitions. Future earn-out payments and future royalty and advertising commitments were estimated based on planned future sales for the term that was in effect at June 30, 2013, without consideration for potential renewal periods.
(4) Refer to Note 7 — Income Taxes for information regarding unrecognized tax benefits. As of June 30, 2013, the noncurrent portion of the Company’s unrecognized tax benefits, including related accrued interest and penalties was $80.5 million. At this time, the settlement period for the noncurrent portion of the unrecognized tax benefits, including related accrued interest and penalties, cannot be determined and therefore was not included.

for litigation and other legal proceedings are not material to the Company’s consolidated financial statements.
During the fiscal 2007 fourth quarter, the former owner of the Darphin brand initiated litigation in the Paris Commercial Court against the Company and one of its subsidiaries seeking to recover €60.0 million ($78.3 mil-lion at the exchange rate at June 30, 2013) that he claims he was owed as additional consideration for the sale of Darphin to the Company in April 2003. On December 23, 2011, the Paris Commercial Court issued its judgment, awarding the former owner €22.9 million ($29.9 million at the exchange rate at June 30, 2013) plus interest from 2007. The Company has filed its appeal with the Paris Court of Appeal and oral arguments for the appeal are scheduled for December 2013. In accordance with the judgment, in January 2012, the Company paid €25.3 million ($33.0 million at the exchange rate at June 30, 2013) to the former owner and received from him a bank guarantee to assure repayment to the Company of such sum (or any part thereof) in the event that the judgment is reversed by the Paris Court of Appeal. Based upon its assessment of the case, as well as the advice of external counsel, the Company is maintaining the amount it previously accrued as an amount that it believes will ultimately be paid based on the probable outcome of the appeal. Such amount is less than the Paris Commercial Court’s award.
Other IncomeDuring the fiscal 2013 second quarter, the Company amended the agreement related to the August 2007 sale of Rodan + Fields (a brand then owned by the Company) to receive a fixed amount in lieu of future contingent consideration and other rights. Prior to this amendment, the Company earned and recognized $1.8 million during the three months ended September 30, 2012 as contin-gent consideration in accordance with the original terms of the agreement, of which $0.7 million was received. The remaining $1.1 million of unpaid consideration was included under the amended agreement, whereas the Company is to receive a principal amount of $22.8 mil-lion. As of June 30, 2013, the Company received $6.0 mil-lion of the principal amount. The remaining $16.8 million principal amount is due in payments of $8.4 million on March 31, 2014 and March 31, 2015 and are included in Prepaid expenses and other current assets and Other assets, respectively, in the accompanying consolidated balance sheet as of June 30, 2013. As a result of the original and amended terms of this agreement, the Company recognized $23.1 million as other income in the consolidated statement of earnings during fiscal 2013.
In November 2011, the Company settled a commercial dispute with third parties that was outside its normal oper-ations. In connection therewith, the Company received a $10.5 million cash payment, which has been classified as other income in its consolidated statement of earnings during fiscal 2012.
NOTE 14 — COMMON STOCKAs of June 30, 2013, the Company’s authorized common stock consists of 1,300 million shares of Class A Common Stock, par value $.01 per share, and 304 million shares of Class B Common Stock, par value $.01 per share. Class B Common Stock is convertible into Class A Common Stock, in whole or in part, at any time and from time to time at the option of the holder, on the basis of one share of Class A Common Stock for each share of Class B Common Stock converted. Holders of the Company’s Class A Common Stock are entitled to one vote per share and holders of the Company’s Class B Common Stock are entitled to ten votes per share.
Information about the Company’s common stock out-standing is as follows: Class A Class B(Shares in thousands)
Balance at June 30, 2010 241,283.3 154,164.1Acquisition of treasury stock (10,515.1) —Conversion of Class B to Class A 2,200.0 (2,200.0)Stock-based compensation 9,630.7 —
Balance at June 30, 2011 242,598.9 151,964.1Acquisition of treasury stock (11,980.2) —Conversion of Class B to Class A 186.0 (186.0)Stock-based compensation 6,314.8 —
Balance at June 30, 2012 237,119.5 151,778.1Acquisition of treasury stock (6,718.8) —Conversion of Class B to Class A 2,800.0 (2,800.0)Stock-based compensation 5,815.5 —
Balance at June 30, 2013 239,016.2 148,978.1
The Company is authorized by the Board of Directors to repurchase up to 216.0 million shares of Class A Common Stock in the open market or in privately negotiated transactions, depending on market conditions and other factors. As of June 30, 2013, the cumulative total of acquired shares pursuant to the authorization was 167.1 million, reducing the remaining authorized share repur-chase balance to 48.9 million. Subsequent to June 30, 2013, the Company purchased approximately 0.6 million additional shares of Class A Common Stock for $41.8 million pursuant to its share repurchase program.
The Company transitioned to a quarterly dividend pay-out schedule for its Class A and Class B Common Stock beginning in the fiscal 2013 third quarter.
THE EST{E LAUDER COMPANIES INC. 171
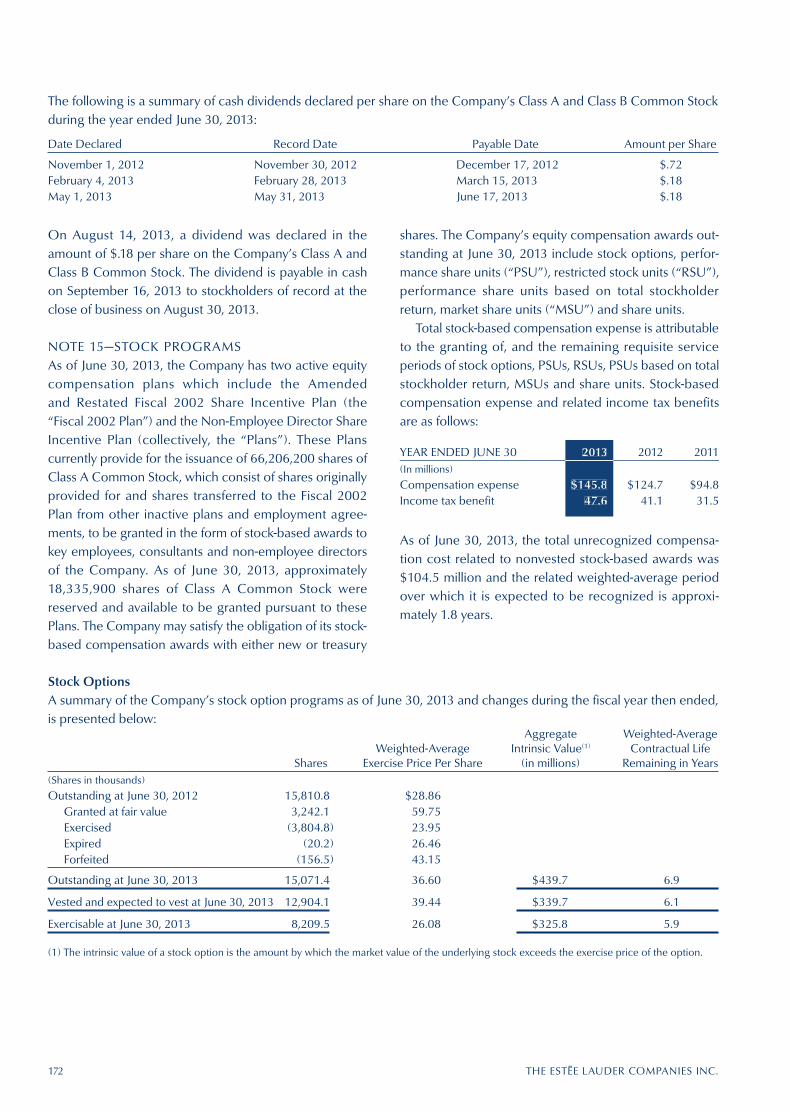
shares. The Company’s equity compensation awards out-standing at June 30, 2013 include stock options, perfor-mance share units (“PSU”), restricted stock units (“RSU”), performance share units based on total stockholder return, market share units (“MSU”) and share units.
Total stock-based compensation expense is attributable to the granting of, and the remaining requisite service periods of stock options, PSUs, RSUs, PSUs based on total stockholder return, MSUs and share units. Stock-based compensation expense and related income tax benefits are as follows:
YEAR ENDED JUNE 30 2013 2012 2011(In millions)
Compensation expense $145.8 $124.7 $94.8Income tax benefit 47.6 41.1 31.5
2013
$145.847.6
As of June 30, 2013, the total unrecognized compensa-tion cost related to nonvested stock-based awards was $104.5 million and the related weighted-average period over which it is expected to be recognized is approxi-mately 1.8 years.
172 THE EST{E LAUDER COMPANIES INC.
On August 14, 2013, a dividend was declared in the amount of $.18 per share on the Company’s Class A and Class B Common Stock. The dividend is payable in cash on September 16, 2013 to stockholders of record at the close of business on August 30, 2013.
NOTE 15—STOCK PROGRAMSAs of June 30, 2013, the Company has two active equity compensation plans which include the Amended and Restated Fiscal 2002 Share Incentive Plan (the “Fiscal 2002 Plan”) and the Non-Employee Director Share Incentive Plan (collectively, the “Plans”). These Plans currently provide for the issuance of 66,206,200 shares of Class A Common Stock, which consist of shares originally provided for and shares transferred to the Fiscal 2002 Plan from other inactive plans and employment agree-ments, to be granted in the form of stock-based awards to key employees, consultants and non-employee directors of the Company. As of June 30, 2013, approximately 18,335,900 shares of Class A Common Stock were reserved and available to be granted pursuant to these Plans. The Company may satisfy the obligation of its stock-based compensation awards with either new or treasury
The following is a summary of cash dividends declared per share on the Company’s Class A and Class B Common Stock during the year ended June 30, 2013:
Date Declared Record Date Payable Date Amount per Share
November 1, 2012 November 30, 2012 December 17, 2012 $.72February 4, 2013 February 28, 2013 March 15, 2013 $.18May 1, 2013 May 31, 2013 June 17, 2013 $.18
Stock OptionsA summary of the Company’s stock option programs as of June 30, 2013 and changes during the fiscal year then ended, is presented below: Aggregate Weighted-Average Weighted-Average Intrinsic Value(1) Contractual Life Shares Exercise Price Per Share (in millions) Remaining in Years(Shares in thousands)
Outstanding at June 30, 2012 15,810.8 $28.86Granted at fair value 3,242.1 59.75Exercised (3,804.8) 23.95Expired (20.2) 26.46Forfeited (156.5) 43.15
Outstanding at June 30, 2013 15,071.4 36.60 $439.7 6.9
Vested and expected to vest at June 30, 2013 12,904.1 39.44 $339.7 6.1
Exercisable at June 30, 2013 8,209.5 26.08 $325.8 5.9
(1) The intrinsic value of a stock option is the amount by which the market value of the underlying stock exceeds the exercise price of the option.

The exercise period for all stock options generally may not exceed ten years from the date of grant. Stock option grants to individuals generally become exercisable in three substantively equal tranches over a service period of up to four years. The Company attributes the value of option awards on a straight-line basis over the requisite service period for each separately vesting portion of the award as if the award was, in substance, multiple awards.
The following is a summary of the per-share weighted-average grant date fair value of stock options granted and total intrinsic value of stock options exercised:
YEAR ENDED JUNE 30 2013 2012 2011(In millions, except per share data)
Per-share weighted-average grant date fair value of stock options granted $20.30 $17.41 $18.93
Intrinsic value of stock options exercised $145.8 $154.0 $178.1
2013
$20.30
$145.8
The fair value of each option grant was estimated on the date of grant using the Black-Scholes option-pricing model with the following assumptions:
YEAR ENDED JUNE 30 2013 2012 2011
Weighted-average expected stock-price volatility 34% 35% 31%
Weighted-average expected option life 8 years 8 years 8 years
Average risk-free interest rate 1.2% 1.7% 2.2%Average dividend yield 1.0% 1.0% 1.1%
2013
34%
8 years1.2%1.0%
The Company uses a weighted-average expected stock-price volatility assumption that is a combination of both current and historical implied volatilities of the underlying stock. The implied volatilities were obtained from publicly available data sources. For the weighted-average expected option life assumption, the Company considers the exercise behavior of past grants and models the pattern of aggregate exercises. The average risk-free interest rate is based on the U.S. Treasury strip rate for the expected term of the options and the average dividend yield is based on historical experience.
Performance Share UnitsDuring fiscal 2013, the Company granted approximately 250,900 PSUs, which will be settled in stock subject to the achievement of the Company’s net sales, diluted net earnings per common share and return on invested capi-tal goals for the three fiscal years ending June 30, 2015, all subject to the continued employment or retirement of the grantees. Settlement will be made pursuant to a range of opportunities relative to the net sales, diluted net earnings
per common share and return on invested capital targets of the Company and, as such, the compensation cost of the PSU is subject to adjustment based upon the attain-ability of these target goals. No settlement will occur for results below the applicable minimum threshold of a tar-get and additional shares shall be issued if performance exceeds the targeted performance goals. Certain PSUs are accompanied by dividend equivalent rights that will be payable in cash upon settlement of the PSU. Other PSUs granted in fiscal 2013 are not accompanied by divi-dend equivalent rights and, as such, were valued at the closing market value of the Company’s Class A Common Stock on the date of grant less the discounted present value of the dividends expected to be paid on the shares during the vesting period. These awards are subject to the provisions of the agreement under which the PSUs are granted. The PSUs were valued at the closing market value of the Company’s Class A Common Stock on the date of grant and generally vest at the end of the perfor-mance period. Approximately 548,700 shares of Class A Common Stock are anticipated to be issued, relative to the target goals set at the time of issuance, in settlement of the 365,900 PSUs that vested as of June 30, 2013. In September 2012, approximately 495,900 shares of the Company’s Class A Common Stock were issued and related accrued dividends were paid, relative to the target goals set at the time of issuance, in settlement of 330,600 PSUs which vested as of June 30, 2012.
The following is a summary of the status of the Company’s PSUs as of June 30, 2013 and activity during the fiscal year then ended: Weighted-Average Grant Date Shares Fair Value Per Share(Shares in thousands)
Nonvested at June 30, 2012 625.9 $37.31Granted 250.9 59.09Vested (365.9) 29.31Forfeited — —
Nonvested at June 30, 2013 510.9 53.73
Restricted Stock UnitsThe Company granted approximately 1,425,000 RSUs during fiscal 2013 which, at the time of grant, were sched-uled to vest as follows: 637,800 on October 31, 2013, 2,900 on January 8, 2014, 336,100 on October 31, 2014, 6,000 on January 8, 2015, 32,600 on June 30, 2015, 4,900 on September 4, 2015, 206,900 on November 2, 2015, 124,300 on November 16, 2015, 8,500 on January 8, 2016, 32,500 on June 30, 2016 and 32,500 on June 30, 2017, all subject to the continued employment or retire-ment of the grantees. Certain RSUs granted in fiscal 2013
THE EST{E LAUDER COMPANIES INC. 173
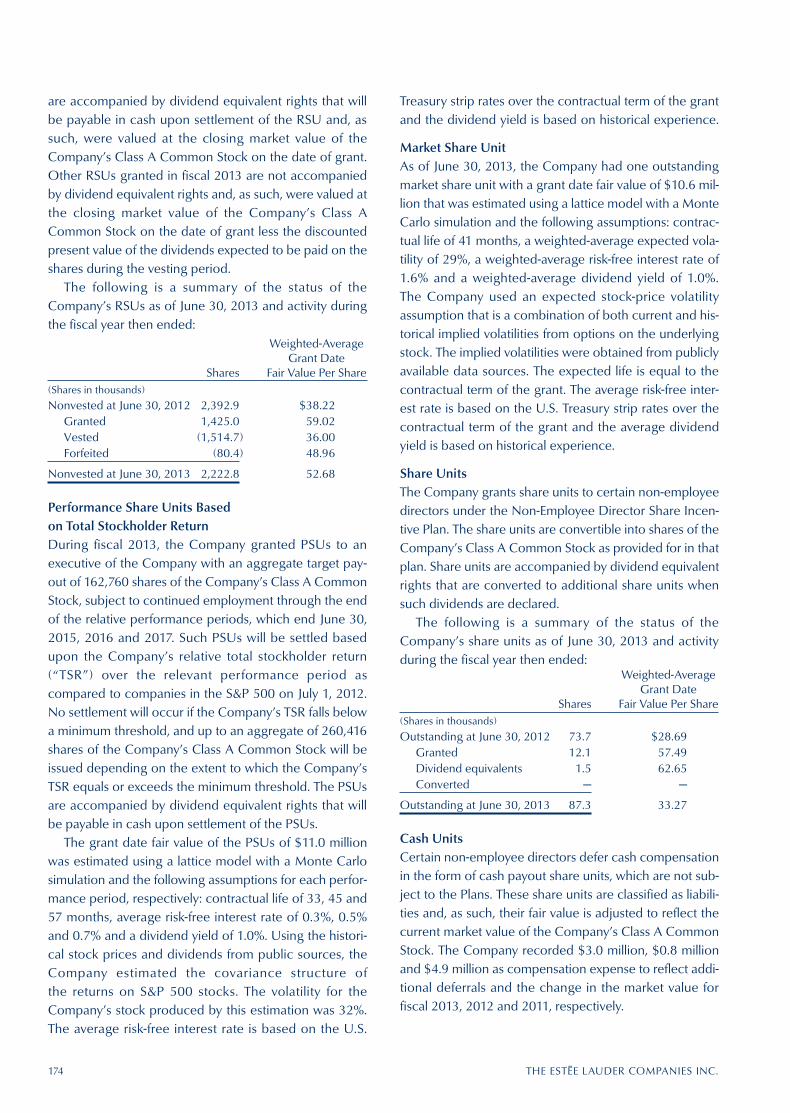
174 THE EST{E LAUDER COMPANIES INC.
Treasury strip rates over the contractual term of the grant and the dividend yield is based on historical experience.
Market Share UnitAs of June 30, 2013, the Company had one outstanding market share unit with a grant date fair value of $10.6 mil-lion that was estimated using a lattice model with a Monte Carlo simulation and the following assumptions: contrac-tual life of 41 months, a weighted-average expected vola-tility of 29%, a weighted-average risk-free interest rate of 1.6% and a weighted-average dividend yield of 1.0%. The Company used an expected stock-price volatility assumption that is a combination of both current and his-torical implied volatilities from options on the underlying stock. The implied volatilities were obtained from publicly available data sources. The expected life is equal to the contractual term of the grant. The average risk-free inter-est rate is based on the U.S. Treasury strip rates over the contractual term of the grant and the average dividend yield is based on historical experience.
Share UnitsThe Company grants share units to certain non-employee directors under the Non-Employee Director Share Incen-tive Plan. The share units are convertible into shares of the Company’s Class A Common Stock as provided for in that plan. Share units are accompanied by dividend equivalent rights that are converted to additional share units when such dividends are declared.
The following is a summary of the status of the Company’s share units as of June 30, 2013 and activity during the fiscal year then ended: Weighted-Average Grant Date Shares Fair Value Per Share(Shares in thousands)
Outstanding at June 30, 2012 73.7 $28.69Granted 12.1 57.49Dividend equivalents 1.5 62.65Converted — —
Outstanding at June 30, 2013 87.3 33.27
Cash UnitsCertain non-employee directors defer cash compensation in the form of cash payout share units, which are not sub-ject to the Plans. These share units are classified as liabili-ties and, as such, their fair value is adjusted to reflect the current market value of the Company’s Class A Common Stock. The Company recorded $3.0 million, $0.8 million and $4.9 million as compensation expense to reflect addi-tional deferrals and the change in the market value for fiscal 2013, 2012 and 2011, respectively.
are accompanied by dividend equivalent rights that will be payable in cash upon settlement of the RSU and, as such, were valued at the closing market value of the Company’s Class A Common Stock on the date of grant. Other RSUs granted in fiscal 2013 are not accompanied by dividend equivalent rights and, as such, were valued at the closing market value of the Company’s Class A Common Stock on the date of grant less the discounted present value of the dividends expected to be paid on the shares during the vesting period.
The following is a summary of the status of the Company’s RSUs as of June 30, 2013 and activity during the fiscal year then ended: Weighted-Average Grant Date Shares Fair Value Per Share(Shares in thousands)
Nonvested at June 30, 2012 2,392.9 $38.22Granted 1,425.0 59.02Vested (1,514.7) 36.00Forfeited (80.4) 48.96
Nonvested at June 30, 2013 2,222.8 52.68
Performance Share Units Based on Total Stockholder ReturnDuring fiscal 2013, the Company granted PSUs to an executive of the Company with an aggregate target pay-out of 162,760 shares of the Company’s Class A Common Stock, subject to continued employment through the end of the relative performance periods, which end June 30, 2015, 2016 and 2017. Such PSUs will be settled based upon the Company’s relative total stockholder return (“TSR”) over the relevant performance period as c ompared to companies in the S&P 500 on July 1, 2012. No settlement will occur if the Company’s TSR falls below a minimum threshold, and up to an aggregate of 260,416 shares of the Company’s Class A Common Stock will be issued depending on the extent to which the Company’s TSR equals or exceeds the minimum threshold. The PSUs are accompanied by dividend equivalent rights that will be payable in cash upon settlement of the PSUs.
The grant date fair value of the PSUs of $11.0 million was estimated using a lattice model with a Monte Carlo simulation and the following assumptions for each perfor-mance period, respectively: contractual life of 33, 45 and 57 months, average risk-free interest rate of 0.3%, 0.5% and 0.7% and a dividend yield of 1.0%. Using the histori-cal stock prices and dividends from public sources, the Company estimated the covariance structure of the returns on S&P 500 stocks. The volatility for the Company’s stock produced by this estimation was 32%. The average risk-free interest rate is based on the U.S.

THE EST{E LAUDER COMPANIES INC. 175
NOTE 16 — NET EARNINGS ATTRIBUTABLE TO THE EST{E LAUDER COMPANIES INC. PER COMMON SHARENet earnings attributable to The Estée Lauder Companies Inc. per common share (“basic EPS”) is computed by dividing net earnings attributable to The Estée Lauder Companies Inc. by the weighted-average number of common shares outstanding and contingently issuable shares (which satisfy certain conditions). Net earnings attributable to The Estée Lauder Companies Inc. per common share assuming dilution (“diluted EPS”) is computed by reflecting potential dilution from stock-based awards.
A reconciliation between the numerators and denominators of the basic and diluted EPS computations is as follows:
YEAR ENDED JUNE 30 2013 2012 2011(In millions, except per share data)
Numerator:Net earnings attributable to The Estée Lauder Companies Inc. $1,019.8 $856.9 $700.8
Denominator:Weighted-average common shares outstanding — Basic 387.6 388.7 394.0Effect of dilutive stock options 5.5 6.3 6.5Effect of RSUs 1.4 1.8 1.9Effect of performance share units based on TSR 0.1 — —Effect of MSU 0.3 0.2 —
Weighted-average common shares outstanding — Diluted 394.9 397.0 402.4
Net earnings attributable to The Estée Lauder Companies Inc. per common share:
Basic $ 2.63 $ 2.20 $ 1.78Diluted 2.58 2.16 1.74
2013
$1,019.8
387.65.51.40.10.3
394.9
$ 2.632.58
As of June 30, 2013, 0.1 million outstanding stock options were not included in the computation of diluted EPS because their inclusion would be anti-dilutive. As of June 30, 2012 and 2011, outstanding stock options that were not included in the computation of diluted EPS because their inclusion would be anti-dilutive were de minimis. As of June 30, 2013, 2012 and 2011, 0.5 million, 0.6 million and 0.7 million, respectively, of PSUs have been excluded from the calculation of diluted EPS because the number of shares ultimately issued is contingent on the achievement of certain performance targets of the Company, as discussed in Note 15 — Stock Programs.

176 THE EST{E LAUDER COMPANIES INC.
NOTE 17 — ACCUMULATED OTHER COMPREHENSIVE INCOME (LOSS)The components of Accumulated OCI (“AOCI”) included in the accompanying consolidated balance sheets consist of the following:
YEAR ENDED JUNE 30 2013 2012 2011(In millions)
Net unrealized investment gains (losses), beginning of year $ 0.5 $ 0.5 $ 0.2Unrealized investment gains (losses) 0.4 0.1 0.4Benefit (provision) for deferred income taxes (0.1) (0.1) (0.1)
Net unrealized investment gains, end of year 0.8 0.5 0.5
Net derivative instruments, beginning of year 17.4 (0.7) 14.3Gain (loss) on derivative instruments 10.3 40.2 (38.0)Benefit (provision) for deferred income taxes on derivative instruments (3.6) (14.3) 13.4Reclassification to earnings during the year:
Foreign currency forward contracts (8.8) (11.7) 15.1Settled interest rate-related derivatives (0.3) (0.3) (0.3)
Benefit (provision) for deferred income taxes on reclassification 3.3 4.2 (5.2)
Net derivative instruments, end of year 18.3 17.4 (0.7)
Net pension and post-retirement adjustments, beginning of year (293.5) (199.0) (217.6)Changes in plan assets and benefit obligations:
Net actuarial gains (losses) recognized 92.8 (176.9) 30.7Net prior service credit (cost) recognized — 2.0 (10.6)Translation adjustments 3.5 7.6 (16.4)Benefit (provision) for deferred income taxes (36.8) 60.4 (5.9)
Amortization of amounts included in net periodic benefit cost:Net actuarial (gains) losses 28.9 14.7 26.3Net prior service cost (credit) 4.3 4.3 3.1Net transition asset (obligation) (0.1) — —Benefit (provision) for deferred income taxes on reclassification (12.8) (6.6) (8.6)
Net pension and post-retirement adjustments, end of year (213.7) (293.5) (199.0)
Cumulative translation adjustments, beginning of year 62.7 216.9 6.4Translation adjustments (24.5) (156.6) 213.2Benefit (provision) for deferred income taxes (1.1) 2.4 (2.7)
Cumulative translation adjustments, end of year 37.1 62.7 216.9
Accumulated other comprehensive income (loss) $(157.5) $(212.9) $ 17.7
2013
$ 0.50.4
(0.1)
0.8
17.410.3(3.6)
(8.8)(0.3)3.3
18.3
(293.5)
92.8—
3.5(36.8)
28.94.3
(0.1)(12.8)
(213.7)
62.7(24.5)
(1.1)
37.1
$(157.5)
Of the $18.3 million, net of tax, derivative instrument gain recorded in AOCI at June 30, 2013, $10.9 million in gains, net of tax, related to foreign currency forward contracts, which the Company will reclassify to earnings through March 2015. Also included in the net derivative instru-ment gain recorded in AOCI was $7.9 million, net of tax, related to the October 2003 gain from the settlement of the treasury lock agreements upon the issuance of the Company’s 2033 Senior Notes, which is being reclassified to earnings as an offset to interest expense over the life of
the debt. These gains were partially offset by $0.5 million, net of tax, related to a loss from the settlement of a series of forward-starting interest rate swap agreements upon the issuance of the Company’s 2037 Senior Notes, which is being reclassified to earnings as an addition to interest expense over the life of the debt.
Refer to Note 12—Pension, Deferred Compensation andPost-retirement Benefit Plans for the discussion regarding the net pension and post-retirement adjustments.

THE EST{E LAUDER COMPANIES INC. 177
NOTE 18 — STATEMENT OF CASH FLOWS Supplemental cash flow information is as follows:
YEAR ENDED JUNE 30 2013 2012 2011(In millions)
Cash:Cash paid during the year for interest $ 85.4 $ 75.0 $ 72.6
Cash paid during the year for income taxes $500.2 $326.4 $241.7
Non-cash investing and financing activities:Incremental tax benefit from the exercise of stock options $ (9.8) $ (10.0) $ (20.0)
Capital lease obligations incurred $ 5.0 $ 8.6 $ 1.0
Note receivable $ (16.8) $ — $ —
Interest rate swap derivative mark to market $ — $ — $ 8.7
2013
$ 85.4
$500.2
$ (9.8)
$ 5.0
$ (16.8)
$ —
NOTE 19 — SEGMENT DATA AND RELATED INFORMATIONReportable operating segments include components of an enterprise about which separate financial information is available that is evaluated regularly by the chief operat-ing decision maker (the “Chief Executive”) in deciding how to allocate resources and in assessing performance. As a result of the similarities in the manufacturing, market-ing and distribution processes for all of the Company’s products, much of the information provided in the con-solidated financial statements is similar to, or the same as, that reviewed on a regular basis by the Chief Executive. Although the Company operates in one business segment, beauty products, management also evaluates performance on a product category basis.
While the Company’s results of operations are also reviewed on a consolidated basis, the Chief Executive reviews data segmented on a basis that facilitates comparison to industry statistics. Accordingly, net sales, depreciation and amortization, and operating income are available with respect to the manufacture and distribution of skin care, makeup, fragrance, hair care and other prod-ucts. These product categories meet the definition of operating segments and, accordingly, additional financial data are provided below. The “other” segment includes the sales and related results of ancillary products and services that do not fit the definition of skin care, makeup, fragrance and hair care.
Product category performance is measured based upon net sales before returns associated with restructur-ing activities, and earnings before income taxes, other income, net interest expense, interest expense on debt extinguishment and total charges associated with restruc-turing activities. Returns and charges associated with restructuring activities are not allocated to the product categories because they result from activities that are deemed a company-wide program to redesign the Company’s organizational structure. The accounting policies for the Company’s reportable segments are the same as those described in the summary of significant accounting policies, except for depreciation and amorti-zation charges, which are allocated, primarily, based upon net sales. The assets and liabilities of the Company are managed centrally and are reported internally in the same manner as the consolidated financial statements; thus, no additional information is produced for the Chief Executive or included herein.

178 THE EST{E LAUDER COMPANIES INC.
YEAR ENDED JUNE 30 2013 2012 2011(In millions)
PRODUCT CATEGORY DATANet Sales:
Skin Care $ 4,465.3 $4,225.2 $3,718.6Makeup 3,876.9 3,696.8 3,370.8Fragrance 1,310.8 1,271.0 1,236.0Hair Care 488.9 462.4 432.3Other 41.3 60.3 56.9
10,183.2 9,715.7 8,814.6Returns associated with restructuring activities (1.5) (2.1) (4.6)
$10,181.7 $9,713.6 $8,810.0
Depreciation and Amortization:Skin Care $ 139.6 $ 119.9 $ 116.3Makeup 144.6 127.8 127.4Fragrance 42.5 37.5 40.0Hair Care 9.5 9.5 9.7Other 0.7 1.1 1.0
$ 336.9 $ 295.8 $ 294.4
Goodwill and Other Intangible Asset Impairments:Skin Care $ 17.7 $ — $ 3.8Makeup — — 1.1Fragrance — — —Hair Care — 21.7 33.1Other — — —
$ 17.7 $ 21.7 $ 38.0
Operating Income (Loss) before total charges associated with restructuring activities:
Skin Care $ 830.1 $ 746.7 $ 595.1Makeup 580.4 538.0 493.8Fragrance 120.3 100.1 80.7Hair Care 26.7 12.2 (9.1)Other (13.7) (22.1) (11.7)
1,543.8 1,374.9 1,148.8Reconciliation:
Total charges associated with restructuring activities (17.8) (63.2) (59.4)Interest expense, net (54.8) (61.1) (63.9)Other income 23.1 10.5 —Interest expense on debt extinguishment (19.1) — —
Earnings before income taxes $ 1,475.2 $1,261.1 $1,025.5
2013
$ 4,465.33,876.91,310.8
488.941.3
10,183.2(1.5)
$10,181.7
$ 139.6144.6
42.59.50.7
$ 336.9
$ 17.7————
$ 17.7
$ 830.1580.4120.3
26.7(13.7)
1,543.8
(17.8)(54.8)23.1
(19.1)
$ 1,475.2
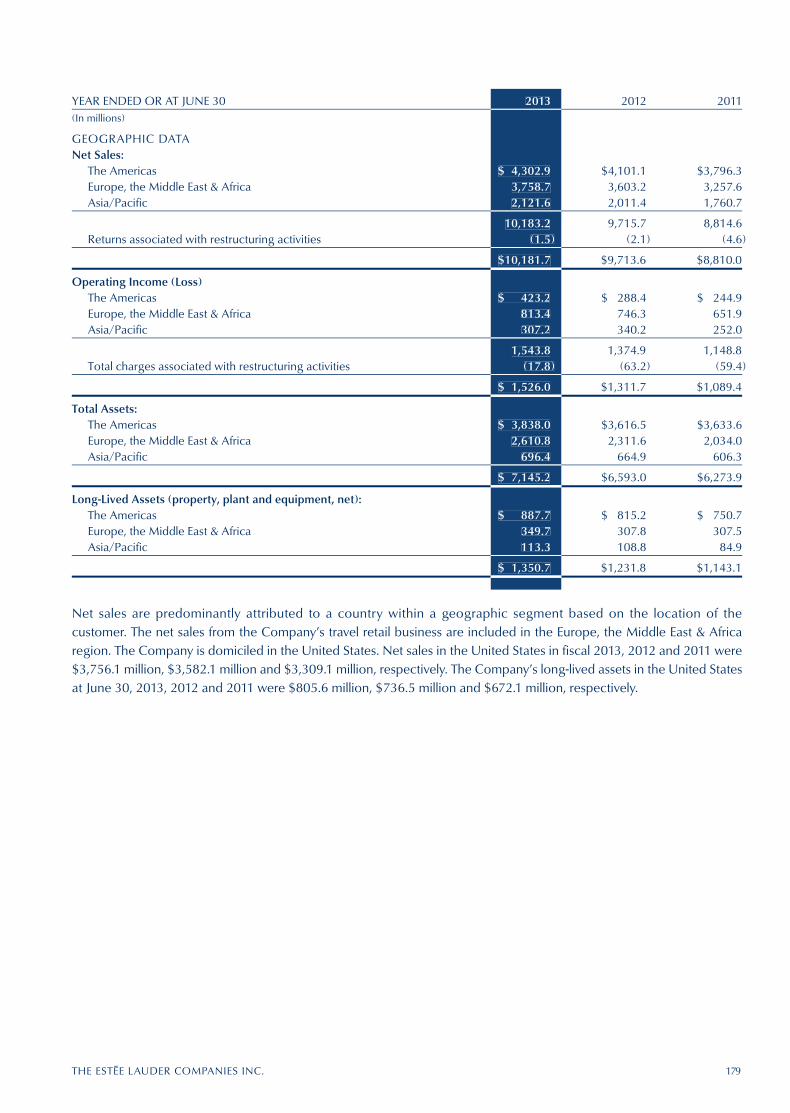
THE EST{E LAUDER COMPANIES INC. 179
YEAR ENDED OR AT JUNE 30 2013 2012 2011(In millions)
GEOGRAPHIC DATANet Sales:
The Americas $ 4,302.9 $4,101.1 $3,796.3Europe, the Middle East & Africa 3,758.7 3,603.2 3,257.6Asia/Pacific 2,121.6 2,011.4 1,760.7
10,183.2 9,715.7 8,814.6Returns associated with restructuring activities (1.5) (2.1) (4.6)
$10,181.7 $9,713.6 $8,810.0
Operating Income (Loss)The Americas $ 423.2 $ 288.4 $ 244.9Europe, the Middle East & Africa 813.4 746.3 651.9Asia/Pacific 307.2 340.2 252.0
1,543.8 1,374.9 1,148.8Total charges associated with restructuring activities (17.8) (63.2) (59.4)
$ 1,526.0 $1,311.7 $1,089.4
Total Assets:The Americas $ 3,838.0 $3,616.5 $3,633.6Europe, the Middle East & Africa 2,610.8 2,311.6 2,034.0Asia/Pacific 696.4 664.9 606.3
$ 7,145.2 $6,593.0 $6,273.9
Long-Lived Assets (property, plant and equipment, net):The Americas $ 887.7 $ 815.2 $ 750.7Europe, the Middle East & Africa 349.7 307.8 307.5Asia/Pacific 113.3 108.8 84.9
$ 1,350.7 $1,231.8 $1,143.1
2013
$ 4,302.93,758.72,121.6
10,183.2(1.5)
$10,181.7
$ 423.2813.4307.2
1,543.8(17.8)
$ 1,526.0
$ 3,838.02,610.8
696.4
$ 7,145.2
$ 887.7349.7113.3
$ 1,350.7
Net sales are predominantly attributed to a country within a geographic segment based on the location of the customer. The net sales from the Company’s travel retail business are included in the Europe, the Middle East & Africa region. The Company is domiciled in the United States. Net sales in the United States in fiscal 2013, 2012 and 2011 were $3,756.1 million, $3,582.1 million and $3,309.1 million, respectively. The Company’s long-lived assets in the United States at June 30, 2013, 2012 and 2011 were $805.6 million, $736.5 million and $672.1 million, respectively.

NOTE 20 — UNAUDITED QUARTERLY FINANCIAL DATAThe following summarizes the unaudited quarterly operating results of the Company for fiscal 2013 and 2012:
Quarter Ended
September 30(1) December 31(2) March 31(3) June 30(4) Total Year(In millions, except per share data)
Fiscal 2013Net Sales(5) $2,549.5 $2,933.0 $2,291.8 $2,407.4 $10,181.7Gross Profit 2,010.3 2,365.0 1,848.7 1,931.8 8,155.8Operating Income(5) 482.0 653.1 245.1 145.8 1,526.0Net Earnings Attributable to
The Estée Lauder Companies Inc. 299.5 447.5 178.8 94.0 1,019.8Net earnings attributable to
The Estée Lauder Companies Inc. per common share:
Basic .77 1.16 .46 .24 2.63Diluted .76 1.13 .45 .24 2.58
Fiscal 2012Net Sales(5) (6) $2,476.7 $2,737.5 $2,248.2 $2,251.2 $ 9,713.6Gross Profit 1,942.4 2,186.5 1,778.9 1,810.0 7,717.8Operating Income(5) 430.0 597.0 211.5 73.2 1,311.7Net Earnings Attributable to
The Estée Lauder Companies Inc. 278.6 396.7 130.4 51.2 856.9Net earnings attributable to
The Estée Lauder Companies Inc. per common share:
Basic .71 1.03 .34 .13 2.20Diluted .70 1.00 .33 .13 2.16
(1) Fiscal 2013 first quarter results include charges associated with restructuring activities of $(0.4) million, debt extinguishment charges of $(19.1) million ($(12.2) million after tax, or $(.03) per diluted common share), certain out-of-period adjustments of $(5.9) million ($(7.4) million after tax, or $(.02) per diluted common share) and other income of $1.8 million ($1.2 million after tax). Fiscal 2012 first quarter results include charges associated with restructuring activities of $(4.1) million ($(2.9) million after tax, or $(.01) per diluted common share).
(2) Fiscal 2013 second quarter results include charges associated with restructuring activities of $(14.6) million ($(9.5) million after tax, or $(.02) per diluted common share), certain out-of-period adjustments of $13.6 million ($9.1 million after tax, or $.02 per diluted common share) and other income of $21.3 million ($13.6 million after tax, or $.03 per diluted common share). Fiscal 2012 second quarter results include charges associated with restructuring activities of $(6.1) million ($(4.4) million after tax, or $(.01) per diluted common share), other intangible asset impairment charges of $(6.7) million ($(4.3) million after tax, or $(.01) per diluted common share) and other income of $10.5 million ($6.7 million after tax, or $.02 per diluted common share).
(3) Fiscal 2013 third quarter results include adjustments associated with restructuring activities of $1.7 million ($1.0 million after tax). Fiscal 2012 third quarter results include charges associated with restructuring activities of $(28.8) million ($(18.8) million after tax, or $(.05) per diluted common share).
(4) Fiscal 2013 fourth quarter results include charges associated with restructuring activities of $(4.5) million ($(2.8) million after tax, or $(.01) per diluted common share) and goodwill and other intangible asset impairment charges of $(17.7) million ($(15.0) million after tax, or $(.04) per diluted common share). Fiscal 2012 fourth quarter results include charges associated with restructuring activities of $(24.2) million ($(18.0) million after tax, or $(.04) per diluted common share), other intangible asset impairment charges of $(15.0) million ($(9.6) million after tax, or $(.02) per diluted common share) and certain out-of-period adjustments of $(8.6) million after tax, or $(.02) per diluted common share.
(5) As a result of the Company’s SAP rollout, approximately $94 million and $30 million of accelerated orders were recorded as net sales (approximately $78 million and $23 million of operating income) in the fiscal 2013 and fiscal 2012 second quarters, respectively, that likely would have occurred in the fiscal 2013 and fiscal 2012 third quarters, respectively.
(6) The Company established a provision in the fiscal 2012 third quarter for then-anticipated returns of approximately $16 million as a result of repositioning certain products due to changes in regulations related to sunscreen products in the United States. These regulations were subsequently deferred and, accordingly, the Company reversed this provision in the fiscal 2012 fourth quarter.
180 THE EST{E LAUDER COMPANIES INC.

Management of The Estée Lauder Companies Inc. (including its subsidiaries) (the “Company”) is responsible for establishing and maintaining adequate internal control over financial reporting (as defined in Rules 13a-15(f) of the Securities Exchange Act of 1934, as amended).
A company’s internal control over financial reporting is a process designed to provide reasonable assurance regarding the reliability of financial reporting and the preparation of financial statements for external purposes in accordance with U.S. generally accepted accounting principles. A company’s internal control over financial reporting includes those policies and procedures that (1) pertain to the maintenance of records that, in reasonable detail, accurately and fairly reflect the transactions and dispositions of the assets of the company; (2) provide reasonable assurance that transactions are recorded as necessary to permit preparation of financial statements in accordance with U.S. generally accepted accounting principles, and that receipts and expenditures of the company are being made only in accordance with authorizations of management and directors of the company; and (3) provide reasonable assurance regarding prevention or timely detection of unauthorized acquisition, use, or disposition of the company’s assets that could have a material effect on the financial statements.
Because of its inherent limitations, internal control over financial reporting may not prevent or detect misstatements. Also, projections of any evaluation of effectiveness to future periods are subject to the risk that controls may become inadequate because of changes in conditions, or that the degree of compliance with the policies or procedures may deteriorate.
Under the supervision of and with the participation of the Chief Executive Officer and the Chief Financial Officer, the Company’s management conducted an assessment of the effectiveness of the Company’s internal control over financial reporting based on the framework and criteria established in Internal Control — Integrated Framework, issued by the Committee of Sponsoring Organizations of the Treadway Commission. Based on this assessment, the Company’s management has concluded that, as of June 30, 2013, the Company’s internal control over financial reporting was effective.
The effectiveness of the Company’s internal control over financial reporting as of June 30, 2013 has been audited by KPMG LLP, an independent registered public accounting firm, as stated in their report which appears under the heading “Report of Independent Registered Public Accounting Firm on Internal Control Over Financial Reporting.”
Fabrizio Freda Tracey T. Travis President and Chief Executive Officer Executive Vice President and Chief Financial Officer
August 23, 2013
THE EST{E LAUDER COMPANIES INC. 181
MANAGEMENT’S REPORT ON INTERNAL CONTROL OVER FINANCIAL REPORTING

182 THE EST{E LAUDER COMPANIES INC.
REPORT OF INDEPENDENT REGISTERED PUBLIC ACCOUNTING FIRM ON INTERNAL CONTROL OVER FINANCIAL REPORTING
The Board of Directors and Stockholders The Estée Lauder Companies Inc.:
We have audited The Estée Lauder Companies Inc. and subsidiaries’ (“the Company”) internal control over financial reporting as of June 30, 2013, based on criteria established in Internal Control — Integrated Framework issued by the Committee of Sponsoring Organizations of the Treadway Commission (COSO). The Company’s management is responsible for maintaining effective internal control over financial reporting and for its assessment of the effectiveness of internal control over financial reporting, included in the accompanying Management’s Report on Internal Control Over Financial Reporting. Our responsibility is to express an opinion on the Company’s internal control over financial reporting based on our audit.
We conducted our audit in accordance with the standards of the Public Company Accounting Oversight Board (United States). Those standards require that we plan and perform the audit to obtain reasonable assurance about whether effective internal control over financial reporting was maintained in all material respects. Our audit included obtaining an understanding of internal control over financial reporting, assessing the risk that a material weakness exists, and testing and evaluating the design and operating effectiveness of internal control based on the assessed risk. Our audit also included performing such other procedures as we considered necessary in the circumstances. We believe that our audit provides a reasonable basis for our opinion.
A company’s internal control over financial reporting is a process designed to provide reasonable assurance regarding the reliability of financial reporting and the preparation of financial statements for external purposes in accordance with generally accepted accounting principles. A company’s internal control over financial reporting includes those policies and procedures that (1) pertain to the maintenance of records that, in reasonable detail, accurately and fairly reflect the transactions and dispositions of the assets of the company; (2) provide reasonable assurance that transactions are recorded as necessary to permit preparation of financial statements in accordance with generally accepted accounting principles, and that receipts and expenditures of the company are being made only in accordance with authorizations of management and directors of the company; and (3) provide reasonable assurance regarding prevention or timely detection of unauthorized acquisition, use, or disposition of the company’s assets that could have a material effect on the financial statements.
Because of its inherent limitations, internal control over financial reporting may not prevent or detect misstatements. Also, projections of any evaluation of effectiveness to future periods are subject to the risk that controls may become inadequate because of changes in conditions, or that the degree of compliance with the policies or procedures may deteriorate.
In our opinion, The Estée Lauder Companies Inc. and subsidiaries maintained, in all material respects, effective internal control over financial reporting as of June 30, 2013, based on criteria established in Internal Control — Integrated Framework issued by the COSO.
We also have audited, in accordance with the standards of the Public Company Accounting Oversight Board (United States), the consolidated balance sheets of The Estée Lauder Companies Inc. and subsidiaries as of June 30, 2013 and 2012, and the related consolidated statements of earnings, equity, comprehensive income (loss), and cash flows for each of the years in the three-year period ended June 30, 2013, and our report dated August 23, 2013 expressed an unqualified opinion on those consolidated financial statements.
New York, New York August 23, 2013

THE EST{E LAUDER COMPANIES INC. 183
REPORT OF INDEPENDENT REGISTERED PUBLIC ACCOUNTING FIRM
The Board of Directors and Stockholders The Estée Lauder Companies Inc.:
We have audited the accompanying consolidated balance sheets of The Estée Lauder Companies Inc. and subsidiaries (“the Company”) as of June 30, 2013 and 2012, and the related consolidated statements of earnings, equity, comprehensive income (loss), and cash flows for each of the years in the three-year period ended June 30, 2013. These consolidated financial statements are the responsibility of the Company’s management. Our responsibility is to express an opinion on these consolidated financial statements, based on our audits.
We conducted our audits in accordance with the standards of the Public Company Accounting Oversight Board (United States). Those standards require that we plan and perform the audit to obtain reasonable assurance about whether the financial statements are free of material misstatement. An audit includes examining, on a test basis, evidence supporting the amounts and disclosures in the financial statements. An audit also includes assessing the accounting principles used and significant estimates made by management, as well as evaluating the overall financial statement presentation. We believe that our audits provide a reasonable basis for our opinion.
In our opinion, the consolidated financial statements referred to above present fairly, in all material respects, the financial position of The Estée Lauder Companies Inc. and subsidiaries as of June 30, 2013 and 2012, and the results of their operations and their cash flows for each of the years in the three-year period ended June 30, 2013, in conformity with U.S. generally accepted accounting principles.
We also have audited, in accordance with the standards of the Public Company Accounting Oversight Board (United States), The Estée Lauder Companies Inc. and subsidiaries’ internal control over financial reporting as of June 30, 2013, based on criteria established in Internal Control — Integrated Framework issued by the Committee of Sponsoring Organizations of the Treadway Commission (COSO), and our report dated August 23, 2013 expressed an unqualified opinion on the effectiveness of the Company’s internal control over financial reporting.
New York, New York August 23, 2013

184 THE EST{E LAUDER COMPANIES INC.
STOCKHOLDER INFORMATION
Company HeadquartersThe Estée Lauder Companies Inc.767 Fifth Avenue, New York, New York 10153 212-572-4200
Stockholder InformationStockholders may access Company information, including a summary of the latest financial results, 24 hours a day, by dialing our toll-free information line, 800-308-2334. Company news releases are available online at www.elcompanies.com.
Investor InquiriesWe welcome inquiries from investors, securities analysts and other members of the professional financial commu-nity. Please contact the Investor Relations Department in writing at the Company’s headquarters or by telephone at 212-572-4384.
Annual Report on Form 10-KIf you would like a copy of the Company’s Annual Report on Form 10-K, as filed with the Securities and Exchange Commission, please call the toll-free information line, 800-308-2334, or write to the Investor Relations Depart-ment at the Company’s headquarters. Our Form 10-K is also available on our website at www.elcompanies.com as well as at the Securities and Exchange Commission website at www.sec.gov.
Common Stock InformationThe Class A Common Stock of The Estée Lauder Com-panies Inc. is listed on the New York Stock Exchange with the symbol EL.
Quarterly Per Share Market Prices and Cash Dividends on Common Stock
Fiscal 2013 Market Price of Common Stock CashQuarter Ended High Low Close Dividends
September 30 $62.24 $49.81 $61.57 $ —December 31 65.00 56.04 59.86 .72March 31 66.51 59.90 64.03 .18June 30 72.70 62.29 65.77 .18
DividendsDividends on the common stock are expected to be paid following the declaration by the Board of Directors. In the fiscal 2013 third quarter, the Company transitioned from an annual to a quarterly dividend payout schedule. The last annual dividend was $.72 per share and was paid in December 2012. Quarterly dividend payments are expected to be in March, June, September and December.
Annual MeetingThe Company’s Annual Meeting of Stockholders will be held on Tuesday, November 12, 2013, at 10:00 a.m. at: JW Marriott Essex House New York160 Central Park South New York, New York 10019
Attendance at the Annual Meeting will require an admission ticket.
Stockholder ServicesComputershare is the Com pany’s transfer agent and registrar. Please contact Computershare directly with all inquiries and requests to:
• Change the name, address, or ownership of stock;
• Replace lost certificates or dividend checks;
• Obtain information about dividend reinvestment, direct stock purchase or direct deposit of dividends.
Computershare P.O. Box 43006Providence, RI 02940-3006 888-860-6295www.computershare.com/investor

THE EST{E LAUDER COMPANIES INC. 185
Performance GraphThe following graph compares the cumulative five-year total stockholder return (stock price appreciation plus dividends) on the Company’s Class A Common Stock with the cumulative total return of the S&P 500 Index and a market weighted index of a publicly traded peer group. The returns are calculated by assuming an investment of $100 in the Class A Common Stock and in each index on June 30, 2008. The publicly traded companies included in the peer group are: Avon Products, Inc., Beiersdorf AG, L’Oreal S.A., LVMH Moët Hennessy Louis Vuitton S.A., The Procter & Gamble Company and Shiseido Company, Ltd.
Cumulative five-year total stockholder return
The Estée Lauder Companies Inc. S&P 500 Peer Group
June 2008 June 2009 June 2010 June 2011 June 2012 June 20130
50
100
150
200
250
300
$350

186 THE EST{E LAUDER COMPANIES INC.
TrademarksThe Estée Lauder Companies Inc. and its subsidiaries own numerous trademarks. Those appearing in the text in this report include:
A Different Nail Enamel, American Beauty, American Beauty Perfect Mineral, Aramis, Aveda, Be Legendary, Bobbi Brown, Bumble and bumble, Bumble and bumble Surf Creme, Bumble and bumble Surf Spray, Bumble and bumble Thickening Full Form, Chubby Stick, Clinique, Clinique Even Better, Clinique Even Better Clinical, Clinique Even Better Eyes, Clinique Moisture Surge, Crème de la Mer, Damage Remedy, Darphin, Estée Lauder, Estée Lauder Advanced Night Repair, Estée Lauder Advanced Time Zone, Estée Lauder Beautiful, Estée Lauder Double Wear, Estée Lauder Nutritious, Fashion Sets, Flirt!, Flirt! Have a Ball!, GoodSkin Labs, GoodSkin Labs BB10, Grassroots Research Labs, Ideal Resource, Invati, Jo Malone, La Mer, Lab Series, Lab Series Pro LS, Light the Way, M.A.C, M.A.C AIDS Fund, M.A.C Viva Glam, Mineralize, Miracle Broth, Ojon, Origins, Origins GinZ-ing, Origins Make A Difference, Origins Plantscription, Osiao, Osiao Inner Radiance Concentrate, Prescriptives, Pretty Powerful, Pure Color, Rare Blend, Smarty Plants, Smashbox, Soleil de La Mer and Super Line Preventor.
AERIN is a licensed trademark from AERIN LLC; Coach and Coach Poppy are licensed trademarks from Coach Services Inc.; DKNY Be Delicious, Donna Karan Cashmere Mist and Donna Karan New York are licensed trademarks from Donna Karan Studio LLC; Ermenegildo Zegna and Ermenegildo Zegna Uomo are licensed trademarks from Consitex S.A.; Kiton is a licensed trade-mark from Ciro Paone S.p.A.; Marni is a licensed trademark from Marni International S.A.; Michael Kors and Michael Kors Signature are licensed trademarks from Michael Kors LLC; Tom Ford and Tom Ford Neroli Portofino are licensed trademarks from 001 Corporation; Tommy Hilfiger and Tommy Girl are licensed trademarks from Tommy Hilfiger Licensing LLC.

THE EST{E LAUDER COMPANIES INC. 2013 ANNUAL REPORT ENVIRONMENTAL FIGURES
The Estée Lauder Companies Inc. 2013 Annual Report is printed on paper that is made with certified renewable electricity and is Forest Stewardship Council™ (FSC®) Certified, ensuring all papers come from responsibly managed forests. Paper used in the financial section is made with 100% post-consumer recycled fiber (PCRF), Green Seal™ Certified and Carbon Neutral Plus, all of which ensure a reduction in carbon emissions and demonstrate a commitment to conserve the environment.
The coated paper in the Annual Report is Elemental Chlorine Free (ECF), a technique that uses chlorine dioxide for the bleaching of wood pulp. It does not use elemental chlorine gas during the bleaching process and prevents the formation of dioxin. The paper made with 100% PCRF is Processed Chlorine Free (PCF), recycled paper in which the recycled content is unbleached or bleached without chlorine or chlorine derivatives.
Combined savings from using 8,625 lbs of paper made with 100% PCRF and 14,155 lbs of paper made with 20% PCRF to produce this report:
42,166 lbs wood A total of 129 trees, which supply enough oxygen for 65 people annually.
27 trees PCRF displaces wood fiber with savings translated as trees. (Assumes a mix of hardwoods and softwoods 6” to 8” in diameter and 40’ tall.)
59,449 gal water Enough water to take 3,569 eight-minute showers.
12,080 gal waste water PCRF content eliminates wastewater produced by processing equivalent virgin fiber. (Swimming pools - 1 Olympic-sized swimming pool holds 660,430 gallons.)
796 lbs solid waste PCRF content eliminates solid waste generated through the pulp and paper manufacturing process. (Garbage trucks - 1 fully loaded garbage truck weighs an average of 28,000 lbs.)
3,584 lbs solid waste Solid waste trash thrown away by 800 people in a single day.
11 million BTU PCRF content displaces energy used to process equivalent virgin fiber. (Homes per year - The average US household uses 91 million BTUs of energy in a year.)
41 min BTUs energy Enough energy to power an average American household for 165 days.
13,219 lbs emissions Carbon sequestered by 104 tree seedlings grown for 5 years.
Reduction of emissions derived from using paper made with 100% renewable energy:
9,061 lbs Combined amount of CO2, SO2, and NOx not emitted.
11,108 lbs Greenhouse Gas Reduction - PCRF content reduces greenhouse gas emissions (measured (1 cars/year) in CO2 equivalents) that would be generated by equivalent virgin fiber production. Purchasing green power significantly reduces greenhouse gas emissions, as well. (Cars per year - the average car emits 11,013 pounds of CO2 in a year.)
Savings of these greenhouse gas emissions are equivalent to:
4,690.59 hours Number of kilowatt-hours of electricity offset by purchase of renewable energy.
1,202 hours Total continuous electricity used by a single-family home.
5,607 lbs Amount of waste recycled instead of disposed in landfills.
Sandy Alexander Inc., an ISO 14001:2004 certified printer with FSC® Chain-of-Custody Certification, printed this report with the use of 100% certified renewable wind power sources, which benefit the environment by preventing emissions of greenhouse gases.
Reduction of emissions from printing using wind-generated electricity:4,613.17 lbs. of CO2 not emitted.
This amount of wind-generated electricity is equivalent to:4,002 miles not driven in an automobile or 314 trees being planted.


THE EST{E LAUDER COMPANIES INC. 767 Fifth Avenue New York, New York 10153