the ellipsoid-referenced zoned datum: a poor man’s vdatum ... · canadian hydrographic conference...
TRANSCRIPT
Canadian Hydrographic Conference May 16-19, 2016 Halifax, NS
1
The Ellipsoid-Referenced Zoned Datum:
A Poor Man’s VDatum for NOAA Hydrography in Alaska
Jack L. Riley1 (presenter), Samuel Greenaway
1, and Douglas Wood
1,2
1NOAA NOS Office of Coast Survey Development Lab, Hydrographic Systems & Technology Branch
2Earth Resource Technologies
Abstract
Hydrographic surveying using ellipsoid-referenced global positioning requires a vertical datum
transformation model to reference elevations on the nautical chart. The NOAA VDatum
software provides such a capability, transforming bathymetric and topographic data between
geometric, orthometric, and tidal datums; however, the development of VDatum for regions is
on-going. In particular, VDatum spatial coverage in Alaska of the ortho-tidal transformation
components, involving the topography of the sea surface (TSS) and mean tidal water-levels
(mean lower low water, mean high water, etc.), is lacking. The Office of Coast Survey
Hydrographic Systems & Technology Branch has begun to fill the gaps in VDatum ellipsoid-
chart datum separation (SEP) coverage using existing NOAA hybrid-geoid models, leveraged
with gridded TSS from recovered bench marks and standard zoned tidal-datum models from the
traditional hydrographic survey. We discuss how this “poor man’s VDatum” (PMVD) SEP is
related to the published methodology in the otherwise official NOAA software and present
results from ellipsoid referenced survey work in Kotzebue Sound, AK and West Prince of Wales,
AK. While formal VDatum support is preferable, our engineering approach in PMVD provides
SEP coverage in Alaska today. A PMVD SEP is quite useful for quality control of ellipsoid-
referenced surveys and their datum transformation wherever approved tidal models exist.
Introduction
Hydrographic measurements in ellipsoidal referenced surveys (ERS) require a vertical datum
transformation to relate depths and heights to the chart tidal-datum. In NOAA, the official
methodology for such a transformation or datum “separation” (SEP) is encapsulated in the
software tool VDatum. Specifically, an ERS SEP is determined in VDatum via three
transformations classes which link the geometric, orthometric, and tidal datum. NOAA policy is
to conduct ERS whenever possible; unfortunately, VDatum is not available everywhere NOAA
charts. VDatum SEP output is currently unavailable in Alaska due to a lack of ortho-tidal
transformation grids for the topography of the sea surface (TSS) and the tidal (chart) datum
offset. Those gaps in VDatum grid coverage may be filled using sensible interpolation of
“leveled” tidal bench marks and standard tidal-datum models which are otherwise developed for
the traditional hydrographic survey; given the formal basis of the latter, this interim VDatum
SEP is aptly called an ellipsoid-referenced “zoned” datum. Colloquially we have come to refer
to this concept as Poor Man’s VDatum (PMVD).
Canadian Hydrographic Conference May 16-19, 2016 Halifax, NS
2
Methods
The philosophy of VDatum and PMVD is rooted in the summation of geometric, orthometric,
and tidal datum transformations, where the realizations of the (latest) North American Datum of
1983 (NAD 83), the North American Vertical Datum of 1988 (NAVD 88), and local mean sea
level (LMSL) are used explicitly. NOAA regards this technique superior to the approach of
simply interpolating between pointwise total SEP observations. VDatum affords sophisticated
modeling to incorporate the appropriate physics and available historical tidal and geodetic data—
including those pointwise total SEP measurements as constraints.
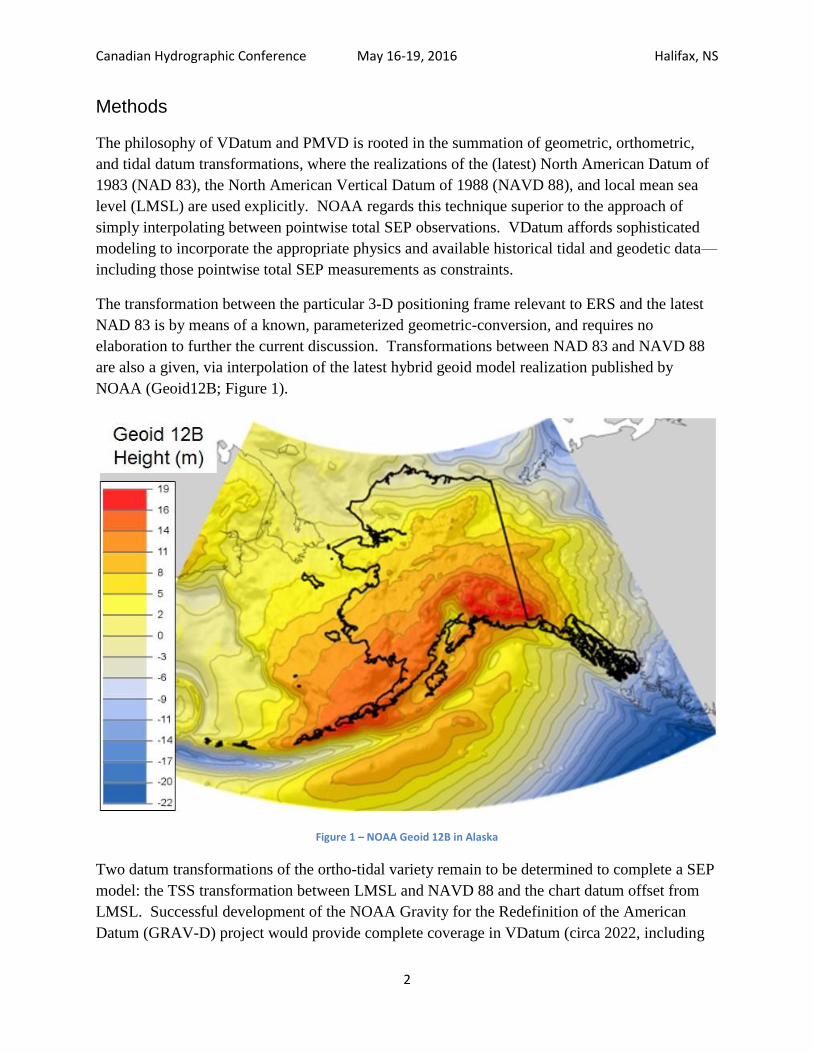
The transformation between the particular 3-D positioning frame relevant to ERS and the latest
NAD 83 is by means of a known, parameterized geometric-conversion, and requires no
elaboration to further the current discussion. Transformations between NAD 83 and NAVD 88
are also a given, via interpolation of the latest hybrid geoid model realization published by
NOAA (Geoid12B; Figure 1).
Figure 1 – NOAA Geoid 12B in Alaska
Two datum transformations of the ortho-tidal variety remain to be determined to complete a SEP
model: the TSS transformation between LMSL and NAVD 88 and the chart datum offset from
LMSL. Successful development of the NOAA Gravity for the Redefinition of the American
Datum (GRAV-D) project would provide complete coverage in VDatum (circa 2022, including

Canadian Hydrographic Conference May 16-19, 2016 Halifax, NS
3
Alaska) for transformations between geometric datums and, by definition therein, the geoid, at a
nominal accuracy of 2 cm. We will have to live with NAVD 88 realizations until the gravity-
based accurate vertical datum that is GRAV-D comes to fruition.
NOAA charts heights relative to mean high water and depths relative to mean lower low water
(MLLW); hereafter, we will refer to “chart datum” as MLLW for simplicity. The variation in
magnitude of the hybrid geoid dominates the character of the SEP model in Alaska (Figure 2).
Figure 2 – One example out of the several possible qualitative relationships between datum types in Alaska. Shown are North American Datum of 1983 (NAD 83), local mean sea level (LMSL), North American Vertical Datum of 1988 (NAVD 88), and chart datum (MLLW). For hydrography referenced to NAD 83, a model for ellipsoid offset, or separation (SEP), to chart datum (MLLW) is best achieved through a summation of the ortho-tidal offset components, one of which being topography of the sea surface (TSS). The figure is by no means to scale, but the notion that the [hybrid] geoid (Geoid12B) has a dominate effect on SEP in Alaska is accurate; note how the NAVD 88 swings above and below the NAD 83 ellipsoid “line”.
The tidal marine grids in VDatum include up to six tidal datum types relative to the LMSL [1]:
mean higher high water (MHHW), mean high water (MHW), mean tide level (MTL), diurnal
tide level (DTL), mean low water (MLW), and MLLW. The VDatum marine grids are populated
using regional hydrodynamic or tidal models, incorporating as much of the important physics as
possible; regardless of the level of sophistication, the models take time to develop and mature to
the point where they are deemed adequate for formal inclusion in VDatum.
NOAA chart datum is defined according to the National Tidal Datum Epoch (NTDE) [2] via the
National Water Level Observation Network (NWLON). Presently, tide station datums in Alaska
are defined according to mean water level observations covering either the 19 years of 1983-
2001 or the 5 years of 2007-2011. The five year NTDE effectively handles noteworthy post-
2001 land-water relative elevation changes for regions of Alaska affected by significant tectonic
and post-glacial isostatic rebound activity.
Topography of the Sea Surface (TSS = NAVD 88 – LMSL)
The official vertical datum for the United States is NAVD 88. The adopted methodology for the
creation of the TSS grid in VDatum assumes that the tidal marine grids have first been developed
for VDatum. The VDatum TSS offset at each NOAA tidal bench mark is formulated in terms of
Canadian Hydrographic Conference May 16-19, 2016 Halifax, NS
4
a mean residual value. At a given bench mark, the leveled-observations of the MHHW, MHW,
and MLW datums relative to MLLW are differenced with the corresponding VDatum-modeled
tidal datum offset values relative to LMSL. The resulting MLLW – MSL residuals from that
operation are combined with the bench mark NAVD 88 – MLLW offset and averaged to
generate a TSS point. Minimal-curvature interpolation that makes use of a boundary tension
parameter is used to produce the VDatum TSS grid, all the while honoring the recovered point
data [3].
The formation of our TSS for a PMVD in Alaska makes use of the available NOAA tidal datum
bench mark data as well, but differs slightly from VDatum in two ways: (i) in the details of
point-TSS recovery and (ii) in the specific type of interpolation employed.
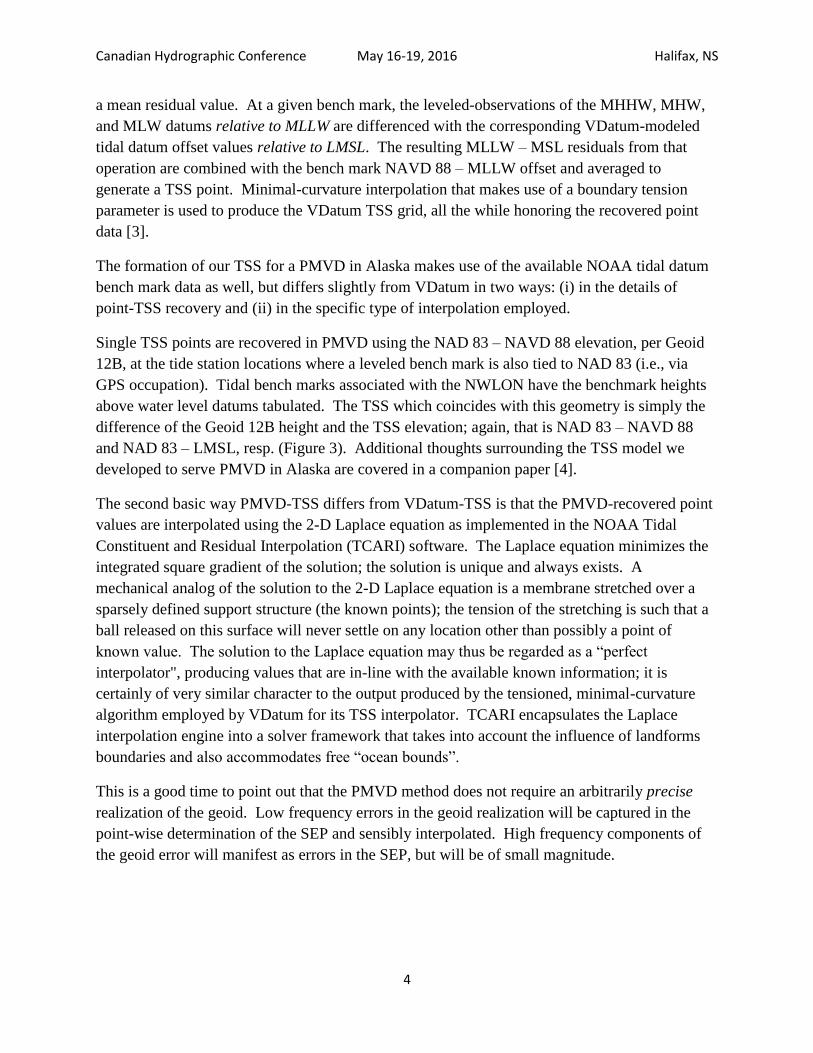
Single TSS points are recovered in PMVD using the NAD 83 – NAVD 88 elevation, per Geoid
12B, at the tide station locations where a leveled bench mark is also tied to NAD 83 (i.e., via
GPS occupation). Tidal bench marks associated with the NWLON have the benchmark heights
above water level datums tabulated. The TSS which coincides with this geometry is simply the
difference of the Geoid 12B height and the TSS elevation; again, that is NAD 83 – NAVD 88
and NAD 83 – LMSL, resp. (Figure 3). Additional thoughts surrounding the TSS model we
developed to serve PMVD in Alaska are covered in a companion paper [4].
The second basic way PMVD-TSS differs from VDatum-TSS is that the PMVD-recovered point
values are interpolated using the 2-D Laplace equation as implemented in the NOAA Tidal
Constituent and Residual Interpolation (TCARI) software. The Laplace equation minimizes the
integrated square gradient of the solution; the solution is unique and always exists. A
mechanical analog of the solution to the 2-D Laplace equation is a membrane stretched over a
sparsely defined support structure (the known points); the tension of the stretching is such that a
ball released on this surface will never settle on any location other than possibly a point of
known value. The solution to the Laplace equation may thus be regarded as a “perfect
interpolator", producing values that are in-line with the available known information; it is
certainly of very similar character to the output produced by the tensioned, minimal-curvature
algorithm employed by VDatum for its TSS interpolator. TCARI encapsulates the Laplace
interpolation engine into a solver framework that takes into account the influence of landforms
boundaries and also accommodates free “ocean bounds”.
This is a good time to point out that the PMVD method does not require an arbitrarily precise
realization of the geoid. Low frequency errors in the geoid realization will be captured in the
point-wise determination of the SEP and sensibly interpolated. High frequency components of
the geoid error will manifest as errors in the SEP, but will be of small magnitude.
Canadian Hydrographic Conference May 16-19, 2016 Halifax, NS
5
Figure 3 – Schematic showing the recovery of a data point for topography of the sea surface (TSS) using tide station measured mean lower low water (MLLW) offset from mean sea level (MSL), a tidal bench mark of known ellipsoid height and leveled to MLLW, and the Geoid 12B model. Numerical values are consistent with tide station Adak Island. Graphics adapted from a companion paper [4].
Additional work is needed in assessing the uncertainty of the PMVD TSS. To date, we have
performed a cross-validation, leave-one-out residual study [5] on our Alaska TSS. That is, we
have computed N+1 Laplace interpolation solutions for comparison: At each point “i” in our
determination of TSS we have computed a residual Ri = TSSN – TSSN – i, where TSSN is the all-
in estimate using all locations (N in total) and TSSN – i is the TSS solution computed using N–1
values excluding the station point “i” from the boundary conditions. Laplace interpolation is
then performed on the residual field to map out the spatial distribution of this cross-validation
analysis.
Poor Man’s VDatum (Local) Mean Sea Level - Chart Datum Offset
We proceed with the summary of how chart datum offset (e.g., LMSL – MLLW) is put together
in PMVD, as the basic procedure utilized in VDatum for this piece has been covered above as
required in the discussion of TSS in VDatum.
The origin of the PMVD ideas stems chiefly from the understanding that “traditional”
hydrographic surveys (non-ERS) have always realized a vertical datum transformation, albeit
through water-level corrections from “zoned tides”. So, how do we repackage the familiar tides
package—that is a tried-and-true vertical datum transformation—into time-independent SEP
form, to improve our ability to do ERS in Alaska?
Canadian Hydrographic Conference May 16-19, 2016 Halifax, NS
6
The recovery of chart datum offset points for PMVD is achieved using the established datums of
the NWLON stations which make up the standard hydrographic tide package. Water-level
correction tide packages in NOAA hydrography come in two types: zoned tides and TCARI.
Zoned Tides & Zoned Datums
Zoned tides define polygons wherein the water level in each discrete area is described by
applying a phase (time) offset and an amplitude (height) multiplier to the water level as observed
at a specified or governing tide gauge. Phase offset values are some fraction of the (semi)diurnal
period, on the order of minutes to perhaps hours; that is an insignificant amount of time as
compared to the 5- or 19-year period used to compute mean water levels as defined by the
NTDE. Since we are interested in datums, rather than instantaneous water levels, we may
dispose of the phase-zoning information. The zoned datum offset consistent with the defined
tide package is simply equal to the datum offset value known at the governing tide gauge scaled
by the amplitude multiplier.
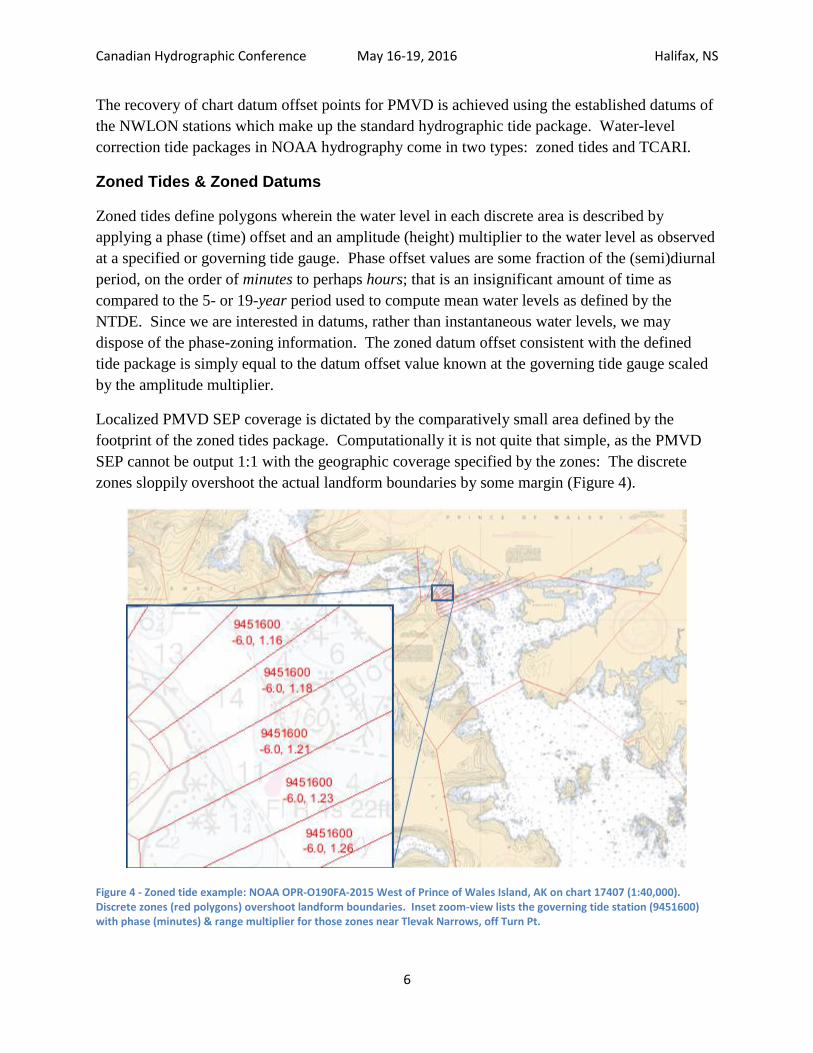
Localized PMVD SEP coverage is dictated by the comparatively small area defined by the
footprint of the zoned tides package. Computationally it is not quite that simple, as the PMVD
SEP cannot be output 1:1 with the geographic coverage specified by the zones: The discrete
zones sloppily overshoot the actual landform boundaries by some margin (Figure 4).
Figure 4 - Zoned tide example: NOAA OPR-O190FA-2015 West of Prince of Wales Island, AK on chart 17407 (1:40,000). Discrete zones (red polygons) overshoot landform boundaries. Inset zoom-view lists the governing tide station (9451600) with phase (minutes) & range multiplier for those zones near Tlevak Narrows, off Turn Pt.
Canadian Hydrographic Conference May 16-19, 2016 Halifax, NS
7
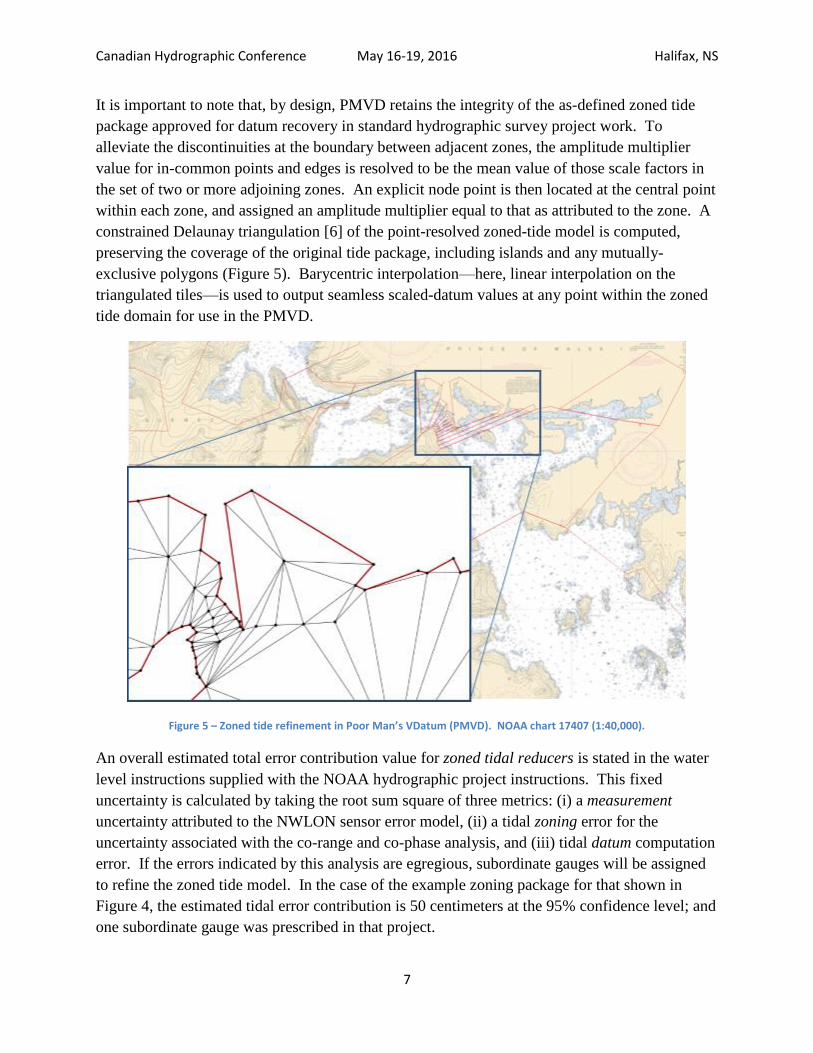
It is important to note that, by design, PMVD retains the integrity of the as-defined zoned tide
package approved for datum recovery in standard hydrographic survey project work. To
alleviate the discontinuities at the boundary between adjacent zones, the amplitude multiplier
value for in-common points and edges is resolved to be the mean value of those scale factors in
the set of two or more adjoining zones. An explicit node point is then located at the central point
within each zone, and assigned an amplitude multiplier equal to that as attributed to the zone. A
constrained Delaunay triangulation [6] of the point-resolved zoned-tide model is computed,
preserving the coverage of the original tide package, including islands and any mutually-
exclusive polygons (Figure 5). Barycentric interpolation—here, linear interpolation on the
triangulated tiles—is used to output seamless scaled-datum values at any point within the zoned
tide domain for use in the PMVD.
Figure 5 – Zoned tide refinement in Poor Man’s VDatum (PMVD). NOAA chart 17407 (1:40,000).
An overall estimated total error contribution value for zoned tidal reducers is stated in the water
level instructions supplied with the NOAA hydrographic project instructions. This fixed
uncertainty is calculated by taking the root sum square of three metrics: (i) a measurement
uncertainty attributed to the NWLON sensor error model, (ii) a tidal zoning error for the
uncertainty associated with the co-range and co-phase analysis, and (iii) tidal datum computation
error. If the errors indicated by this analysis are egregious, subordinate gauges will be assigned
to refine the zoned tide model. In the case of the example zoning package for that shown in
Figure 4, the estimated tidal error contribution is 50 centimeters at the 95% confidence level; and
one subordinate gauge was prescribed in that project.

Canadian Hydrographic Conference May 16-19, 2016 Halifax, NS
8
Tidal Constituent and Residual Interpolation Water Levels & Datums
As mentioned in the TSS section, above, TCARI utilizes 2-D Laplace interpolation. TCARI
formulates its astronomical tide component in terms of a standard suite of 37 governing
harmonic constituents, each specifying a phase and amplitude. Laplace interpolation is
independently applied to each tidal constituent component.
TCARI is in the VDatum “tide model” toolkit for generating datum fields in those cases where a
sophisticated hydrodynamic model is not otherwise available. TCARI performs datum field
interpolation in the same manner as described above for TSS in PMVD: the solution to the 2-D
scalar Laplace equation, with boundary conditions specified according to known datum points,
and where the influence of shoreline, islands, and free “ocean bounds” are taken into account.
Uncertainty model analysis in TCARI water levels has undergone some study [7]. The basic
idea is rooted in the same cross-validation concept as utilized in our PMVD TSS formulation,
presented above. TCARI includes additional jackknife- and Monte Carlo-based simulation work
to better characterize the spatial statistics involved. This work has culminated to produce an a
priori spatial error characterization for each TCARI package distributed for use in a given
NOAA hydrographic survey. Briefly, a nominal residual value is assessed at each gauge that is
the difference between its observed value and interpolated-model solution. These nominal
residual values are then propagated throughout the triangulated TCARI domain nodes using
water-distance weighting.
Canadian Hydrographic Conference May 16-19, 2016 Halifax, NS
9
Poor Man’s VDatum Ellipsoid-Chart Datum Separation (SEP) Quality Assessment
The most accurate way to validate the veracity of a PMVDatum SEP value is by obtaining a GPS
height observation at a point wherein the tidal datum is known to the NTDE. Indeed, data from
all available tidal bench marks with historical datums are used to create our regional ERS SEP in
the first place; true quality control needs encompass areas spatially distinct from those known
nodal locations.
Equivalent short-term datums referenced to the ellipsoid provide an accurate point-check on the
SEP. Useful ellipsoid-referenced tidal datum observations from secondary- and tertiary-control
tide stations [2] situated “away from shore” may be conducted using (e.g.) a mobile radar gauge
or a GPS tide buoy [8].
Ellipsoidal Referenced “Zoned” Tides (ERZT)
Arguably the most pragmatic way in which to evaluate VDatum or PMVD SEP is to compare to
an ellipsoid-referenced version of the traditional datum “transformation” achieved through tide
corrections: the ERZT (ellipsoidal referenced zoned tide). The term “zoning” is used in ERZT
because hydrographic water level modeling methods may be regarded as using some notion of
“zoning” to express areas of similar water-level regimes [9], whether from traditional discrete
zones or via the grid-interpolated TCARI.
Uncertainty in the ERZT is equal to the sum of the tide-correction-to-datum uncertainty plus the
uncertainty of the survey platform ellipsoidal height, reduced according to statistical averaging
according to the spatiotemporal sampling. Currently, NOAA scales the gridded ERZT-SEP
standard deviation according to one over the square root of the nominal number of survey lines
which transect an average grid cell; in effect, treating each transect as an independent
measurement. Grid cells are sized commensurate to the notion of the area of a tidal zone; e.g., 1
km2.
Results
In the Methods section we describe the SEP philosophy common to VDatum and PMVD, where
geometric, orthometric, and tidal datum component fields are summed for the ellipsoid-chart
datum transformation. Both PMVD and VDatum incorporate the NAVD 88 (Geoid 12B
realization); the new work required to form the PMVD SEP concerns the remaining two ortho-
tidal components: TSS and chart datum offset from LMSL (e.g., LMSL – MLLW).
Poor Man’s VDatum, Topography of the Sea Surface: Alaska
We developed a TSS model for PMVD which spans all Alaskan waters in one fell swoop, by
interpolating through the over one hundred “known” points that we recovered from NOAA
historical records [4]. Figure 6 and Figure 7 show the interpolated Alaska TSS and the
corresponding cross-validation differences, resp.

Canadian Hydrographic Conference May 16-19, 2016 Halifax, NS
10
Figure 6 – Topography of the sea surface (TSS) model for Alaska: the mean sea level (MSL) elevation with respect to the North American Vertical Datum 1988 (NAVD 88, NOAA hybrid geoid realization Geoid 12B). Graphics adapted from a companion paper [4].
Figure 7 – Cross-validation of topography of the sea surface (TSS) model for Alaska: the interpolated residual differences between interpolated TSS and known TSS. The mean residual computed from the set of cross-validations computed at each gauge is nearly zero (-0.008 m), with a root mean square error (RMSE) of 0.124 m (12.4 cm). Graphics adapted from a companion paper [4].
Canadian Hydrographic Conference May 16-19, 2016 Halifax, NS
11
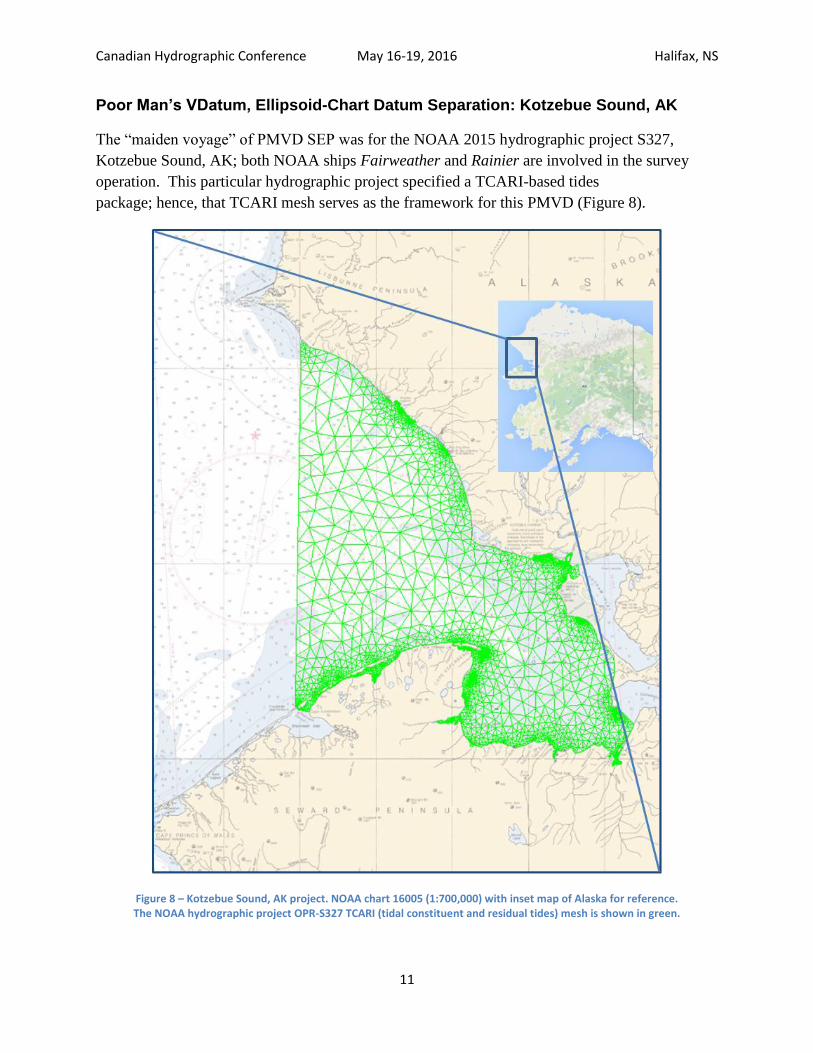
Poor Man’s VDatum, Ellipsoid-Chart Datum Separation: Kotzebue Sound, AK
The “maiden voyage” of PMVD SEP was for the NOAA 2015 hydrographic project S327,
Kotzebue Sound, AK; both NOAA ships Fairweather and Rainier are involved in the survey
operation. This particular hydrographic project specified a TCARI-based tides
package; hence, that TCARI mesh serves as the framework for this PMVD (Figure 8).
Figure 8 – Kotzebue Sound, AK project. NOAA chart 16005 (1:700,000) with inset map of Alaska for reference. The NOAA hydrographic project OPR-S327 TCARI (tidal constituent and residual tides) mesh is shown in green.

Canadian Hydrographic Conference May 16-19, 2016 Halifax, NS
12
NAD 83- and WGS 84-referenced PMVD SEPs to MLLW and MHW for the Kotzebue Sound,
AK project were generated using software created by the NOAA Office of Coast Survey,
Hydrographic Systems and Technology Branch. The PMVD SEP constituent transformation
surfaces are shown in Figure 9; final PMVD SEP is shown in Figure 10. The dynamic character
of the hybrid geoid dominates the shape of the final SEP in Kotzebue Sound; the range of the
gridded values within the constituent layers of WGS 84-Geoid 12B, TSS, and LMSL – MLLW
are 5.44 m, 0.28 m, and 0.23 m, resp. Although the TSS and chart datum offset components are
relatively flat as compared to the geoid, their magnitude is still quite important as compared to
the total allowable vertical error budget in the hydrographic survey.
Figure 9 – Kotzebue Sound, AK Poor Man's VDatum constituent transformation surfaces a, b, and c (left-to-right): (a) Geoid 12B as WGS 84-referenced NAVD 88 (ellipsoid dictated by ERS control); +0.17 m (red) to -5.27 m (purple), (b) Topography of the sea surface (TSS) = NAVD 88 – LMSL; -0.91 m (red) to -1.19 m (purple), and (c) Chart datum offset, LMSL – MLLW per TCARI; +0.30 m (red) to +0.07 m (purple)
Figure 10 - Kotzebue Sound, AK Poor Man's VDatum chart datum model: WGS 84 – MLLW. The SEP values range from -0.66 m (red) to -6.16 m (purple)

Canadian Hydrographic Conference May 16-19, 2016 Halifax, NS
13
NOAA ship Rainier survey personnel conducted an evaluation of the WGS 84 – MLLW PMVD
SEP using the ERZT method, outlined above. ERZT SEPs are computed for the three survey
“sheets” comprising OPR-S327-RA-15: H12820, H12821, and H12829.
Table 1 - A comparison of ellipsoid (WGS 84) - mean lower low water (MLLW) datum separation (SEP) realizations for three survey areas in Kotzebue Sound, AK: Poor Man's VDatum (PMVD) – Ellipsoidal Referenced Zoned Tides (ERZT)
OPR-S327-RA-15
Survey Registry No.
(sheet)
Difference of WGS 84 – MLLW SEP Realizations
PMVD [100m] – ERZT [1000m]
Mean Difference Standard Deviation
H12820 -5.1 cm 8.0 cm
H12821 -5.8 cm 5.5 cm
H12829 -7.9 cm 7.5 cm
Conclusion
The datum separation surface is critical for ellipsoidal-referenced surveys (ERS). We have
demonstrated a practical method to estimate the ERS datum separation surface (SEP) critical for
hydrographic survey operations in Alaska where NOAA VDatum does not yet provide coverage.
We have leveraged existing geoid models, a newly derived model of sea surface topography
(SST), and tried-and-true water-level – turned datum-control packages. Modeling the SEP in
these separate components, as is done by the more rigorous VDatum approach, explicitly
addresses the different physical processes at work. To date, our “Poor Man’s VDatum” (PMVD)
approach has been used to evaluate and quality control the empirically derived ERZT separation
surfaces for several surveys in Alaska. This alone is quite useful, for evaluation of these ERZT
surfaces is otherwise a challenge. We anticipate that in some cases the datum reduction by
PMVD may be superior to an ERZT approach, though additional analysis needs to be done in
this regard. During this learning process, each method will remain a useful check on the other
until we gain greater confidence with these applications. The elimination of the reliance on
phase (in the case of zoned tides) and residuals (in the case of TCARI) is a significant step. This
method is generally applicable to other areas where SEP surfaces do not exist, given a geoid
model, ellipsoidal-referenced tidal datum information, and a zoned or TCARI water level model;
the PMVD software we have developed is robust enough to process new datasets as-is. This
method does not supplant the more exhaustive approaches used in VDatum, but does provide a
useful intermediate step while more comprehensive products are being completed.
Canadian Hydrographic Conference May 16-19, 2016 Halifax, NS
14
References
[1] "NOAA Special Publication NOS CO-OPS 2," 2003.
[2] "NOAA Special Publication NOS CO-OPS 1," 2001.
[3] M. Kenny, E. Myers and K. Hess, "VDatum Manual for Developement and Support of NOAA's Vertical
Datum Transformation Tool, VDatum," National Ocean Service, Silver Spring, MD, 2012.
[4] D. A. Wood, J. L. Riley and S. Greenaway, "A Derived Model of Alaskan Sea Surface Topography: a
critical piece of the vertical datum transformation for ellipsoid referenced hydrography," in CHC
2016, Halifax, NS, 2016.
[5] M. Tomczak, "Spatial Interpolation and its Uncertainty Using Automated Anisotropic Inverse Distance
Weighting (IDW) - Cross-Validation/Jackknife Approach," Journal of Geographic Information and
Decision Analysis, vol. 2, pp. 18-30, 1998.
[6] J. R. Shewchuk, "Triangle A Two-Dimensional Quality Mesh Generator and Delaunay Triangulator,"
28 July 2005. [Online]. Available: https://www.cs.cmu.edu/~quake/triangle.html.
[7] R. T. Brennan, "An Uncertainty Model for the Tidal Constituent and Residual Interpolation (TCARI)
Method of Water Level Correction," 2005.
[8] "NOS Hydrographic Surveys Specifications and Deliverables," May 2015. [Online]. Available:
http://www.nauticalcharts.noaa.gov/hsd/specs/Specs_2015.pdf.
[9] G. Rice and J. L. Riley, "Measuring the Water Level Datum Relative to the Ellipsoid During
Hydrographic Survey," in US HYDRO, Tampa, FL, 2011.
Author biography
Jack Riley is a physical scientist in the Office of Coast Survey located in Silver Spring,
Maryland. Jack has over 20 years of experience in NOAA hydrography and his professional
interests include GNSS positioning and navigation, software automation, and photonics.
Acknowledgements
A special thanks to Barry Gallagher for support concerning the inner-workings of TCARI and
numerous valuable conversations about the hydrographic datum. The PMVD would have little
value without real ERS data from the field. Thanks to the survey personnel and crew of the
NOAA ships Rainier and Fairweather for providing a rich set of data for our analysis;
Commanding Officers Edward J. Van Den Ameele and David J. Zezula, Field Operations Officer
LT Steven Loy, and Chief Survey Tech Douglas Bravo.