the electoral effectiveness of constituency campaigning in the 2010 british general election: the...
TRANSCRIPT
e at SciVerse ScienceDirect
Electoral Studies 30 (2011) 816–828
Contents lists availabl
Electoral Studies
journal homepage: www.elsevier .com/locate/e lectstud
The electoral effectiveness of constituency campaigning in the 2010British general election: The ‘triumph’ of Labour?q
Justin Fisher a,*, David Cutts b, Edward Fieldhouse b
aMagna Carta Institute, Brunel University, Uxbridge UB8 3PH, UKb Institute for Social Change, School of Social Sciences, University of Manchester, Manchester M13 9PL, UK
a r t i c l e i n f o
Article history:Received 14 April 2011Received in revised form 9 August 2011Accepted 24 August 2011
Keywords:CampaigningPolitical parties2010 general electionBritainCampaign managementElectoral impact
q Research for this article was funded by theResearch Council. Grant Number RES-000-22-2762.* Corresponding author.
E-mail addresses: [email protected] (J.manchester.ac.uk (D. Cutts), ed.fieldhou(E. Fieldhouse).
0261-3794/$ – see front matter � 2011 Elsevier Ltddoi:10.1016/j.electstud.2011.08.002
a b s t r a c t
This article establishes a model of likely campaign effectiveness, before examining theintensity of constituency campaigning at the 2010 general election in Britain and itssubsequent impact on electoral outcomes, using both aggregate and individual level data.It shows that constituency campaigning yielded benefits in varying degrees for all threemain parties and that Labour’s constituency campaign efforts were effective despite theelectoral context, and ultimately affected the overall outcome of the election. Thesefindings have significant implications for our understanding of the circumstances underwhich campaigns are likely to be more or less effective, and provide further evidence thata carefully managed campaign stands the most chance of delivering tangible electoralpayoffs.
� 2011 Elsevier Ltd. All rights reserved.
1. Introduction – the growing importance andpotential for campaign effects
In studies of the past few elections, a broad consensushas developed to suggest that election campaigningmay beelectorally effective in Britain (Clarke et al., 2004, 2009;Whiteley and Seyd, 1994; Pattie et al., 1995; Denver et al.,2003). Indeed, there are several contextual effects thatheighten the potential for campaign payoffs. First, thestrength of partisan identification in Britain has declined inintensity, and to a lesser extent in overall volume thoughthe core of fairly strong partisans has remained relativelyconstant (see Fig. 1). Secondly, voter hesitancy hasincreased (see Fig. 2). In 2010, fully 37% of respondents tothe British Election Study post-election survey indicated
Economic and Social
Fisher), david.cutts@[email protected]
. All rights reserved.
that they had made their decision on how to vote duringthe campaign, with a further 13% indicating that theirdecision had been taken since the turn of the year. Giventhat all parties engage in ‘long-term’ campaigning – espe-cially in target seats (Fisher and Denver, 2008) – therewould appear to be significant potential at least forconstituency campaigning to be electorally significant.Thirdly, while voters may indeed make electoral judge-ments ostensibly exogenous to campaigning, long-termparty campaigning could theoretically act to some degreeas a preference shaper of voter judgements, which, asClarke et al. (2011) show, have become increasinglyimportant in voters’ choices.
Some sceptics, however, point out that few voterschange their minds as a result of campaigns. Rather, rein-forcement is the most likely outcome. Consequently, it isargued that this may suggest the relative unimportance ofcampaigns (see, for example, Holbrook, 1996: 613). Thisargument however, is flawed for two reasons. First themobilisation of supporters by a party to turn out to vote canmake a large impact on their vote share. Second, althoughcounter-factual and not observable, failure to campaign

Election
201020052001199719921987198319791974O1974F197019661964
%100
80
60
40
20
0
Fairly Strong Partisan Identifiers
Very Strong Partisan Identifiers
Total Partisan Identifiers
Fig. 1. Partisan identification 1964–2010. Source: British Election Study.
1 As is customary, no candidates from the major parties (in this case,Labour and the Liberal Democrats) contested the seat of the Speaker.
J. Fisher et al. / Electoral Studies 30 (2011) 816–828 817
might result in loss of votes for a party. The observedchange in party support hides the impact on those whowere persuaded to stick with their party of choice. Thus thedown-playing of reinforcement makes no logical sense:vote switching may be easier to measure, but thecementing of voter choice is just as significant.
Beyond these broader contextual factors the importanceand potential electoral impact of campaigning is nowwidely accepted at the constituency level. Three differentresearch teams have repeatedly demonstrated the electoralbenefits that can accrue from well organised and intenseelection campaigns at constituency level in Britain, despiteusing different methodological approaches and measuresof campaign strength (see, for example, Whiteley and Seyd,1994; Pattie et al., 1995; Denver et al., 2003). Moreover,work combining the different methods of measurement ofcampaign effort, has shown that all three major partiesdirected their resources to target and more marginal seatsin the 2005 election, and this additional effort was rewar-ded both in boosting the party’s vote and reducing itsopponent’s vote (Fieldhouse and Cutts, 2008).
In this article we seek tomeasure the electoral impact ofthe three main British parties’ campaigns at the 2010election (Conservative, Labour and the Liberal Democrats).Aggregate data are drawn from a survey of all electoralagents of the five major parties in Great Britain – theConservatives, Labour, Liberal Democrats, Plaid Cymru and
the Scottish National Party (N ¼ 1993).1 1079 validresponses were received – an overall response rate of 54%.Details of responses by party are shown in the Appendix.These illustrate a representative spread of constituencies.In order to confirm this, however, means were compared inrespect of candidate spending (percentage of maximumspent) during the regulated long and short campaigns. Forall parties, the results indicate that our sample is robust(see Appendix). In addition, in depth interviews wereconducted with the parties at national level, as well as withagents in constituencies selected on the basis of theirelectoral status. We also use individual level data from theBritish Election Study’s Campaign Internet Panel Survey toconfirm the patterns observed in our aggregate level data.
2. The electoral context
Notwithstanding these more general observations,about the heightened potential for campaign effectsprevious research on the impact of constituency campaignshas demonstrated how the extent the electoral impact willvary by electoral context. Broadly speaking, three patternsemerge. First, the competitiveness of an election will have

Election
201020052001199719921987198319791974F1974O197019661964
% D
ec
id
ed
D
urin
g C
am
pa
ig
n
40
35
30
25
20
15
10
Fig. 2. Late deciders 1964–2010. Source: British Election Study.
J. Fisher et al. / Electoral Studies 30 (2011) 816–828818
a bearing on the level of electoral impact – tight elections(such as the British election of 1992) will generally lead tostronger electoral campaigns and a greater impact of thosecampaigns. Second, elections where significant change isanticipated – maybe even critical elections (such as theBritish election of 1997) – are likely to produce moreeffective campaigns – particularly for the principal chal-lenger. Thirdly, successful constituency campaigns arepartly a function of good central coordination (Fisher et al.,2006a). Coordination is better achieved when there arefewer target seats, and so campaigns will tend to be moreeffective when there are fewer seats to target. For example,in the 2001 election, both the Labour and the Conserva-tives’ campaigns were generally less effective, in partbecause they were targeting so many seats (Denver et al.,2002a).
In addition to these factors, campaigns will also beaffected in part by the ‘national mood’. We would expectthat campaigns are likely to be less effective when a partyis unpopular and on the defensive, thereby creatingconditions where voters are less receptive to a party’scampaign. An example of this is 2005, when Labourcampaigning, despite being well organised, had signifi-cantly less impact compared with previous elections(Fisher et al., 2005). Other research using experimentalmethods has also shown that campaign interventions areaffected by the level of popularity of the party (Niven,2001; Hillygus, 2005; Arceneaux and Nickerson, 2009).In other words (and not surprisingly) overall party
popularity in the run-up to an election may matter tocampaign effectiveness.
Overall, the effectiveness of campaigns for all partiesshould be stronger when the parties are reasonablypopular. We refer to this as popularity equilibrium. In otherwords, parties may not be equally popular (else the electioncould theoretically result in a tie) but that no parties areespecially unpopular – there is, in effect, a normal state ofaffairs in terms of the relative popularity of the parties.Under the conditions of popularity equilibrium, targetinga large number of seats is likely to lead to less effectivecampaigning. However, where one or more parties are veryunpopular, the effects of targeting a large numbers of seatsmay be partially reversed for the more popular party.Equally, a tight election (bearing in mind that electoraloutcomes are a function of changes in seat shares, whichmay not closely reflect aggregate votes shares) shouldgenerate equally effective campaigning under the condi-tions of popularity equilibrium, but not where one or moreparties is relatively unpopular. We can summarise theseexpected outcomes in Table 1.
The 2010 election was one where all of these ostensiblyexogenous factors were important to some extent. First, theelectionwas increasingly tight. The Conservatives’ 17-pointpoll lead in previous September 2009 had been signifi-cantly reduced on the back of increasing economic opti-mism and a growing view that the incumbent party hadhandled the economic crisis well, coupled with concernsabout the likely impact of significant cuts in the event of

Table 1Exogenous factors influencing likely effectiveness of constituency campaigns.
More effective Less effective
Closeness of election Popularity equilibrium Unpopular party(ies)
Significant change likely Challenger(s) Incumbent
High no’s of target seats Unpopular party(ies) Popularity equilibrium
J. Fisher et al. / Electoral Studies 30 (2011) 816–828 819
a Conservative victory (Clarke et al., 2011). By the time theelection was called in early April 2010, the Conservativelead was around 8–9 points. Coupled with that, the pollrating of the Liberal Democrats increased significantly atparticular points during the short campaign (though it alsofell back as polling day approached). Together with theeffects of the electoral system (which have tended to favourLabour in recent elections), the outcome of the electionremained unclear during much of the campaign. Second, itwas evident nevertheless that some significant change wason the horizon. At the very least, it was plain that thirteenyears of Labour majority rule were coming to an end.Beyond that, therewere a number of possibilities, includingeither a Conservative minority or majority administration(few predicted a coalition). For those reasons, we mighthave expected constituency campaigning to be moreeffective for the challengers.
On the other hand, the electoral arithmetic suggestedthat parties’powers of coordinationwould be stretched. TheConservatives needed towin116 seats just to gain amajorityof one. This would have represented the third largestnumberof gains in the post-war period, betteredonly by thelandslide victories of 1945 and 1997 (the next largestnumber of gains was 67 in 1970). The Liberal Democrats toohad many more seats to target. In the first instance, therewas the large number of their own seats to defend. Unfor-tunately for the Liberal Democrats, few can normally beregarded as being truly ‘safe’ – particularly with a resurgentConservative Party. Second, the Liberal Democrats’ successinwinning someseats fromLabour in 2005meant that therewereopportunities to increase their numberof seats further,particularly with Labour being relatively unpopular. Inaddition, Labour found itself seeking to defend seats froma number of parties in order to minimise its losses. Labourknew it would lose seats. The key issue was ensuring that itdid not lose too many. All in all, this meant that all partieswere potentially stretched in terms of effectively coordi-nating their efforts at constituency level.
Overall, these factors would have suggested thefollowing in terms of the likely effectiveness of theirconstituency campaigns: the Conservatives had advantagesunder all three conditions of the election’s closeness, thelikelihood of change and the number of targets. In all three,the relative unpopularity of Labour made conditions morefavourable for the Conservatives. However, while Labourwas unpopular, the Conservatives were not themselvesoverwhelming popular, thus tempering their advantage.Labour’s unpopularity meant that it was at a disadvantage
across all three exogenous factors. Finally, the LiberalDemocrats had distinct advantages. The party was rela-tively popular and despite targeting relatively largenumbers of seats, was advantaged by Labour’s unpopularityand the Conservatives’ less robust standing.
3. Target seats and targeting strategies
All three parties, as would be expected, had target seatsand specific targeting strategies. What has emerged,however, over recent elections is not so much a binarymeasure of whether or not a seat is a target, but particularcategories of target seat status. There is an overall group ofseats which are identified as targets, but the emphasisplaced upon different sub-groups may not be identical – atleast at central party level from where much direct mail isdistributed (Fisher et al., 2011). Each of the three mainparties identified a large number of seats to target, butwithin that group of seats there were divisions – very muchlike a football league – and the intention was that in seatswithin certain key divisions there would be more intensecampaigning.
Positioning within these divisions was not entirely fixed– depending on political and electoral circumstances, someseats were moved in or out of the core groups (Fisher et al.,2011). For example, following the Liberal Democrat boostand Labour’s decline in the opinion polls following theleaders’ debates (Pattie and Johnston, 2011), the Conser-vatives sought to switch their efforts from Liberal Democratmarginals to those seats where the party now thought itcould more realistically challenge Labour. Of course, a shiftin emphasis mid-campaign may be easier to accomplish interms of the distribution of direct mail and telephone voteridentification at a national level (Fisher, 2010). At locallevel, such a shift in emphasis will be more difficult toaccomplish quickly.
The Conservatives identified around 160 seats withinfour divisions. The ‘premier league’ consisted of 38 seats,and were ones the party expected to gain without signifi-cant effort. These were described as ‘certainties’. Moreimportant were the first and second divisions (‘core targets’and ‘possibles’) – seats the party would need to focus uponif it was to have any chance of power. The third division(‘hopefuls’) consisted of seats that were within the party’srange, but which the party would only be likely towin if theelectoral picture was going very well. Labour had 145targets overall. It, too, had four divisions of seats devised ona sophisticated basis according to electoral circumstances

Table 2Campaign intensity by party and target status (2001 scale in parenthesis).
All Held NotTarget
Target Not HeldNot Target
Conservative 112 (112) 118 (119) 140 (140) 92 (91)Labour 100 (100) 116 (117) 131 (132) 76 (76)Liberal Democrat 91 (90) – 140 (140) 82 (82)
J. Fisher et al. / Electoral Studies 30 (2011) 816–828820
as well as levels of party activity (Fisher et al., 2011). Notsurprisingly, the seats were almost always ones that theparty was defending with differing expectations as to thelikelihood of success. The Liberal Democrats hada comparatively large number of target seats, including alltheir own seats plus a further 37 (mainly Labour-held) seatsthat the party hoped to gain: 99 in total. Thus, there weretwo divisions – defensive and offensive.
4. Overall campaign intensity
Overall campaign intensity is best illustrated by thecreation of an index, which incorporates all of the corecomponents of a constituency campaign: preparation,organisation, manpower, use of computers, use of tele-phones, polling day activity, use of direct mail, level ofdoorstep canvassing, and leafleting (see, for example,Denver and Hands, 1997). In this article, we initially utilisetwo scales. First, the scale developed first in the 2001 studyof constituency campaigning, which provides a good,comprehensive picture of campaign intensity (the 2001scale). Second, we develop a new scale, which incorporatesnew measures first utilised in the 2010 study, whichcapture developments in e-campaigning (see Fisher et al.,2011). The intensity indexes are calculated using a Prin-cipal Components Analysis (PCA) of all these core indicatorsof constituency campaigning.2 Using conventional cut-offcriteria, the PCAs suggest one factor is sufficient to repre-sent the variance in the original variables in both of theindexes (details of which are shown in the Appendix). ThePCAs produce factor scores which are then standardisedaround a mean of 100. This process allows easy compari-sons between parties as well as the target status of seats.The difference between the scores incorporating e-cam-paigning and those that do not are marginal. For informa-tion, we list both scores here, but the subsequent multi-variate analyses are conducted using the broader 2010index (which includes e-campaigning).3
The first step is to evaluate the distribution of campaignintensity by party and by target status. There are threecategories: Targets (seats which a party is seeking to gain ordefending, often with a small majority), Held Not Target(seats that party holds comfortably), and Not Held NotTarget (seats in which the party has very little chance of
2 Where there were missing data on individual variables that formedpart of these scales, multiple imputation was used, which took account ofthe individual party and the target status of the seat.
3 The Campaign Intensity scales were calculated using responses fromall five parties in the survey. However, only the scores for the Conser-vatives, Labour and Liberal Democrats are shown in this article.
winning). Parties that fail to target their resources effec-tively are less likely to generate positive electoral payoffsoverall. Thus, we would expect parties as far as possible todistribute their resources such that target seats should havethe most intense campaigns and ‘hopeless’ seats, the leastintense. By and large, we would also expect seats thatparties hold, but which are not targets to score somewherein between, in part because safe seats tend to have higherlevels of membership or local resources (Fisher, 2000;Fisher et al., 2006b).
Table 2 illustrates the mean campaign index scores foreach party overall and then by seat status. First, it is clearthat the Conservatives had the strongest campaigns overall,with the Liberal Democrats having the weakest of the threelargest parties. However, overall strength only tells part ofthe story. What is more important is that the strongestcampaigns take place in the target seats. As Fisher andDenver (2008) have shown for example, while the LiberalDemocrats have always been much weaker overall, theyhave been very successful in fighting their strongestcampaigns where they were needed most, and thereforemoving to a level of campaign development that is on a parwith that of the Conservatives, despite the significantdisparity in overall resources (see also Fieldhouse andCutts, 2008). Table 2 illustrates that the Liberal Democratswere again successful in this respect, the intensity of thecampaigns in their target seats being slightly higher thanthat of Labour and equal to that of the Conservatives.Nevertheless, this represents something of a change for theConservatives, who have historically struggled to focustheir efforts effectively. Indeed, perhaps the principalsurprise is the relative strength of Conservative cam-paigning in its hopeless seats (Not Held, Not Target) –
possibly reflecting the enthusiasm of Conservativesupporters in an election where the party had a realisticchance of overall victory. Elsewhere, the results are prettymuch as expected for the other parties (with the means forall categories being statistically significant from eachother).
Given that the parties had divisions of target seats,however, it is also interesting to see if the distributionof campaign effort varied in more detail. For each ofthe main parties, we compare the mean distribution oncampaign intensity across the various internally
Fig. 3. Conservative campaign by detailed target status.

Fig. 4. Labour campaign by detailed target status.
Table 3The impact of constituency campaigning on share of the vote 2010.
Conservative Labour Lib Dems
Constant 2.290 (0.705)** �6.728 (0.920)** 1.231 (0.701)Vote share 2005 0.987 (0.020)** 0.896 (0.023)** 0.723 (0.032)**Incumbent 0.866 (0.557) 2.706 (0.699)** 3.078 (0.991)**Campaign
intensity0.016 (0.007)* 0.030 (0.010)** 0.064 (0.009)**
Adj. R2 0.955 0.901 0.861
Coefficients are unstandardised b values. Standard Errors in parenthesis.**p < 0.01; *p < 0.05.
J. Fisher et al. / Electoral Studies 30 (2011) 816–828 821
determined categories of seats. The differences in themeans are not statistically significant (though they arecompared with non-targets). They do, however, providesuggestive evidence of some differentiation in terms ofcampaign effort. Fig. 3 examines Conservative seats, andthe distribution is almost exactly as one might predict.The level of campaign intensity in the ‘certainties’ or the‘premier league’ was higher than in non-targets, but notas high as in the ‘core targets’ (or division one). In thenext set of targets, campaigning is a little lower than thecertainties, while the long shots or ‘hopefuls’ had theleast intense campaigns among the target seats. If weexamine Labour (Fig. 4), we observe a significant differ-ence between targets and non-targets, and a progressiveincrease in intensity from the most vulnerable seats tothe more defendable (up to the penultimate category) –suggesting a very defensive strategy by Labour. In thecase of the Liberal Democrats (Fig. 5), the differencebetween targets and non-targets is very clear. However,what is slightly surprising is that the intensity of cam-paigning was almost identical in Liberal Democrat seatsas it was in its offensive targets (seats that the partyhoped to gain). All in all, these figures suggest that therewas some variation at constituency level in the intensityof campaigning in different target seats, but not as muchas might have been predicted at national level, suggesting
Fig. 5. Liberal democrat campaign by detailed target status.
that such variation is difficult to manage with as muchprecision at local level.
5. The electoral impact
In Table 3, we examine the estimated electoral impact ofconstituency campaigning by each of themain three partiesusing ordinary least squares regression (OLS). On account ofextensive boundary revisions in England andWales, we areunable to estimate impact on the preferred dependentvariable of share of the electorate as no robust data on‘notional electorates’ for 2005 are available. Instead, shareof the vote is used. The model we employ is straightfor-ward. Each party’s share of the vote in 2010 is regressed onthe campaign intensity index, controlling for ‘notional’share of the vote in 2005 (data for which are robust), andpersonal incumbency. The use of the notional share of thevote in 2005 as a control makes the model a dynamic testand also ensures that other variables that are correlatedwith previous vote, such as demographics, are effectivelycontrolled. In addition, previous vote share will alsocapture previous campaign efforts. Thus, insofar ascampaign efforts are correlated over time, the true extent ofcampaign effects may actually be under-estimated. The testis a stiff one – not surprisingly, previous vote share capturesa great deal of the variance, so the model provides a robustfirst test of whether or not constituency campaigning madea positive and significant contribution to vote shares at thiselection.
For each party, it is apparent that more intenseconstituency campaigning did indeed appear to yieldelectoral payoffs, though the impact varies a little, withLiberal Democrat campaigning having the greatest impact.For example, the model suggests that a Liberal Democratcandidate (non-incumbent) whose campaign reached theaverage intensity of a Liberal Democrat target seat (140from Table 2) could expect to win 35.4% of the votecompared to a similar candidate with a campaign intensityof a non-target seat (82) who would win 31.7% of the vote.The difference of 3.7% suggests a reasonable boost in votefor those Liberal Democrat candidates running a strongcampaign. The equivalent figures for the Conservatives are39.1% (campaign intensity 140) and 38.3% (campaignintensity 92) suggesting a difference of less than onepercent. These results represent both change and conti-nuity with previous studies of constituency campaigning(Denver and Hands,1997; Denver et al., 2002a, 2003; Fisheret al., 2005). In respect of the Liberal Democrats, there is

J. Fisher et al. / Electoral Studies 30 (2011) 816–828822
continuity. The party’s seemingly effective targeting policyonce again meant that local campaigns did yield tangiblepayoffs in addition to the positive effects of personalincumbency. In the case of the Conservatives, while itscampaigning effects were the weakest of the three mainparties, there is further evidence that the party hascontinued to improve in the way it conducts constituencycampaigning such that it is now seemingly electorallyeffective. In previous elections, the party has periodicallysuffered from the fact that while it was running strongcampaigns overall, the resources in campaigns were ofteninsufficiently well focussed uponwhere theywere requiredmost.
Labour’s result is, however, perhaps themost surprising.Given the importance of electoral context, we would haveexpected that Labour campaigning would be less effective,given that there was a widespread expectation that theparty would lose majority rule, that it was required totarget so many seats, and that it was unpopular and on thedefensive. However, the results here suggest that facedwith defeat and the prospect of a Conservative governmentor even losing second place to the Liberal Democrats, localLabour campaigns proved to be more effective than mighthave been imagined. Despite controlling for vote share in2005 and some fairly substantial personal incumbencyeffects, Labour’s constituency campaigning still yieldedelectoral payoffs. A Labour candidate (non-incumbent)whose campaign reached the average intensity of a Labourtarget seat (131) could expect to win 1.65%more of the voteshare than a candidate with a campaign intensity of a non-target seat (intensity 76).
The results in Table 3, however, only tell us so muchsince of course, campaigns do not occur in isolation – otherparties are also campaigning in constituencies and thus theoptimal outcome of any one party’s campaign is not only toenhance its share of the vote, but also to damage that ofother parties. A further analysis is therefore required,which includes constituencies where we have campaignintensity scores for all three parties. Inevitably, this resultsin a reduction in the number of available cases and so it ishere, where we have 102 constituencies with full scores forthe Conservatives, Labour and the Liberal Democrats.
Table 4SUR model of party support in the 2010 general election.
Variables Model 1 Lab-LD Model 1 Lab-Con Mo
Constant �0.273 0.262 0Conservative campaign intensity 0.003 0.008* 0Labour campaign intensity �0.011* �0.010* �0Lib Dem campaign intensity 0.009* 0.002 0Conservative incumbent 0.539* 0.716* 0Labour incumbent �0.408* �0.790* �0Lib Dem incumbent 0.757* 0.084 �0Lab-LD 2005 vote ratio – – 0Lab-Con 2005 vote ratio – – –
LD-Con 2005 vote ratio – – –
R2 0.76 0.70 0RMSEA 0.466 0.573 0Number of observations 102 102 102
* Significant 5% level.Model 1: Breusch–Pagan Test of Independence: chi2(1) ¼ 65.995, Pr ¼ 0.0000.Model 2: Breusch–Pagan Test of Independence: chi2(1) ¼ 45.391, Pr ¼ 0.0000.Model 3: Breusch–Pagan Test of Independence: chi2(1) ¼ 25.982, Pr ¼ 0.0000.
The application of OLS is, however, not necessarilyappropriate for the analysis of vote shares in multi-partyelections for three main reasons (Cutts and Shryane,2006; Cutts and Webber, 2009). First, vote sharesbetween two parties are negatively correlated – yet OLSmodels lack an appreciation of these substitution effects.Second, and related to the first reason, an assumption ofOLS is that the residuals of separate models are uncorre-lated. The residuals would be positively correlated becausein constituencies where party vote share is higher thanpredicted by the model at least one of the other partiesmust be weaker than predicted, leading to large residualvariances in both equations (Cutts and Shryane, 2006;Cutts, 2006). Using an OLS approach would ignore thiscorrelation and could produce inefficient estimates.Thirdly, a party’s vote share is bounded between 0 and 100per cent. OLS predictions, however, are unbounded and arebased on continuous data which follow normal distribu-tions. Consequently, using OLS models it is possible togenerate vote share estimates that are either negative orgreater than 100 per cent.
To combat the potential problems of using OLSregressions when analysing multi-party vote shares,a number of scholars have proposed using a method thatis based upon the Seemingly Unrelated Regression (SUR)modelling technique (Katz and King, 1999; Tomz et al.,2002; Cutts and Shryane, 2006). To deal with theproblem of unbounded predicted values, party voteshares are converted into vote share ratios usinga logistic transformation. After the selection of a party asthe reference category the natural log of the vote shareratio between it and other parties is obtained, therebymapping bounded vote share values (i.e. 0–100 percent)onto an unbounded (�N to þN) vote share ratiomeasure. Non-independence is therefore dealt with inSUR by specifying equations (one for each of thedependent variables) to be jointly modelled and allow-ing the error terms to be correlated across equations(Cutts and Shryane, 2006). The selection of the partybase category enables differences in vote shares betweenthat party and another party to be analysed. Forexample, in Table 4 below where Labour and Liberal
del 2 Lab-LD Model 2 Lab-Con Model 3 LD-Con Model 3 LD-Con
.456* 0.580* 0.535* 0.015
.002 0.001 0.005* �0.000
.007* �0.003* 0.001 0.003*
.003* �0.000 �0.007* �0.002*
.108 0.108 0.177* 0.114*
.232* �0.152* �0.382* �0.022
.173 �0.090 �0.673* 0.191
.755* – – –
0.953* – –
– – 0.824*.90 0.96 0.54 0.83.303 0.217 0.340 0.211
102 102 102

J. Fisher et al. / Electoral Studies 30 (2011) 816–828 823
Democrat vote share is the base category, the equationcan be written as follows:ln ðConi=LabiÞ ¼ Xbi1 þ εi1
ln ðLibDemi=LabiÞ ¼ Xbi2 þ εi2(1)
ln ðConi=LibDemiÞ ¼ Xbi1 þ εi1
ln ðLabi=LibDemiÞ ¼ Xbi2 þ εi2(2)
where ε is the residuals for each constituency that arecorrelated across equations (e.g. εi1 and εi2 within theequation), X is a set of independent explanatory variablesand b is a set of coefficients to be estimated. Equations (1)and (2) stated above do not include where the Conserva-tives are the base category and this would be needed fora comprehensive estimation.4 However for ease of inter-pretation, we provide the results where Labour is the basecategory and include the Conservative-Liberal Democratcomparison where the latter is the reference to show thedifferences in vote shares between all the main parties.5
Table 4 (Model 1 and 2) shows the SUR model of whereLabour is the reference category and the natural log of thevote share ratio between it and the other two parties as thedependent variables. Negative coefficients indicate anincrease in Labour support compared with the Conserva-tives and the Liberal Democrats because Labour vote shareis the denominator in the ratio-dependent variable. Herewe show the results of two models – with and withoutparty support in the previous election. In both models, weran the Breusch–Pagan test to assess whether the residualswere uncorrelated across equations. The highly significantresults indicate the violation of OLS assumptions and thejustification for using the SUR approach.
In Models 1 and 2, Labour campaigning, as measuredthrough the campaign intensity index, had a significantimpact and improved the Labour vote against both that ofthe Liberal Democrats and the Conservatives. LiberalDemocrat campaigning was effective in improving itsrelative vote share against Labour, while Conservativecampaigning had no significant impact on its performancewhen compared against Labour once previous vote share iscontrolled for. Personal incumbency again mattered forLabour. Where the Labour candidate was an incumbent theparty significantly improved its vote against both rivalparties even after controlling for previous support. No suchpersonal incumbency effects were evident for the
4 Theoretically, there appears to be an inverted duplication in thedependent variables with, for example, ln (LDi/Labi) and ln (Labi/LDi).However, such an assertion is incorrect as the estimation of these twodependent variables is based on the simultaneous estimation of twoother different dependent variables. As the errors will be correlated indifferent ways then the coefficients will be different too. Nevertheless,the quantitative estimates of explanatory variable coefficients for seem-ingly identical dependent variables will be highly correlated and similarin magnitude. But empirically, they will not necessarily be the same.
5 In Table 4, we provide the vote share differences between the mainparties and not the results from the full set of base categories necessaryfor comprehensive estimation. However, the full results of the SUR modelwhere 1) the Liberal Democrats are the base category against Labour; 2)the Conservatives are the base category against Labour and the LiberalDemocrats; 3) Other parties are the base categories is available from theauthors on request.
Conservatives or the Liberal Democrats against Labourwhen previous support was included in the model.
Table 4 (Model 3) shows the SUR model of where theLiberal Democrats is the reference category. LiberalDemocrat campaigning, as measured through thecampaign intensity index, had a significant impact andimproved the Liberal Democrat vote against the Conser-vatives, while Conservative campaigning had no significantimpact on its performance relative to the Liberal Democratswhen previous vote share is included. Labour campaigningdid have a negative impact on the Liberal Democrat votesuggesting that Labour campaign intensity improved theConservative vote at the expense of the Liberal Democrats.Where the Conservatives stood the same candidate as inthe previous election, their vote significantly improvedwhen compared against the Liberal Democrats. Personalincumbency effects were not evident for the LiberalDemocrats or Labour.
There is one caveat to these multi-party results. Bynecessity, we can only use cases where we have responsesfor all three parties. Perhaps inevitably, the distribution ofthose cases is not as representative as where we are onlyusing data from only one party. Thus, in our 102 cases thatwe are able to use for the SUR modelling, there is an over-representation of safer seats. Given that the Conservativeswere on the offensive and Labour was on the defensive,there is a possibility therefore that our SUR results mayoverestimate the impact of Labour campaigns and under-estimate that of the Conservatives. That said, the singleparty analyses and the individual level analyses (seeSection 5.1) produce similar patterns to the SUR results,suggesting that whatever the limitations of the distributionof our case in the SUR analyses, that the broad findings arestill robust.
Overall, these findings are consistent with the resultsfrom previous studies (Denver and Hands, 1997; Denveret al., 2002a, 2003; Fisher et al., 2005). Labour and LiberalDemocrat campaigning at constituency level tends to bemore effective than that of the Conservatives. However,what is particularly noteworthy are the results for Labour.Once again, what emerges from these data is that Labourcampaigns were successful against the odds and it is thanksto them in part that Labour’s losses were not nearly as greatas might have been expected. All of this begs the questionas to why electoral context did not appear to necessarilyexert influence in ways that might be expected. The elec-tion was tight and change was expected, yet it was Labourand the Liberal Democrats whose campaigns were mosteffective, with Labour’s campaigning being effectivedespite its defensive stance and relative unpopularity.
5.1. Individual level analysis
So why was Labour so apparently successful in terms ofits constituency campaigning? One explanation is thatLabour was successful in persuading ‘late deciders’ to votefor the party. We test this proposition using the BritishElection Campaign study, examining the ultimate votechoices made by respondents who initially declaredthemselves to be undecided in terms of which party tosupport in the pre-campaign survey, conducted just before

Table 5The impact of campaign contacts on previously undecided voters(Conservative vote).
n ¼ 3221 Model 1 Model 2 Model 3
Con campaign 0.391 (0.067) 0.274 (0.073) 0.297 (0.083)Lab campaign �0.302 (0.080) �0.238 (0.087) �0.241 (0.096)Lib Dem
campaign�0.271 (0.082) �0.209 (0.088) �0.223 (0.097)
Con vote 2005 n/a 2.130 (0.108) 1.752 (0.119)Con MiP n/a n/a 1.720 (0.123)Lab MiP n/a n/a �1.443 (0.218)Lib Dem MiP n/a n/a �1.333 (0.198)Constant �1.167 (0.054) �1.597 (0.063) �1.572 (0.075)Nagelkerke R2 0.021 0.198 0.351�2 log likelihood 3456.694 3047.826 2649.407
Standard errors in parenthesis; n/a: not applicable; MiP: most importantproblem.
Table 7The impact of campaign contacts on previously undecided voters (liberalDemocrat vote).
n ¼ 3221 Model 1 Model 2 Model 3
Con campaign n.s. n.s. n.s.Lab campaign �0.264 (0.067) �0.235 (0.069) �0.257 (0.074)Lib Dem
campaign0.546 (0.069) 0.450 (0.071) 0.471 (0.077)
Lib Demvote 2005
n/a 1.290 (0.098) 1.209 (0.104)
Con MiP n/a n/a �0.926 (0.133)Lab MiP n/a n/a n.s.Lib Dem MiP n/a n/a 1.845 (0.130)Constant �0.466 (0.047) �0.685 (0.051) �0.779 (0.061)Nagelkerke R2 0.032 0.104 0.237�2 log likelihood 4284.974 4102.234 3739.410
Standard errors in parenthesis; n.s.: not statistically significant; n/a: notapplicable; MiP: most important problem.
J. Fisher et al. / Electoral Studies 30 (2011) 816–828824
the beginning of the campaign ‘proper’ at the end of March/beginning of April 2010. We then examine whether theywere contacted by the parties and if so, in how manydifferent ways they were contacted by each party over thecourse of the campaign. The British Election Study featuredquestions about eight different forms of party contact bothduring and immediately before the campaign (doorstep,telephone, in the street, leaflets, email, text, Twitter/Face-book or other). A scale was constructed of all these itemsfor party to capture campaign intensity – more forms ofcontact being a surrogate for more intense campaigning. Ofcourse, some of these forms of contact could includecontacts from the national party rather than as a result oflocal efforts (especially leaflets or telephone calls), andvoters would be unable to distinguish between the sourceof such contacts (local and national). However, given thatwe know that local and national campaigns are themselvesincreasingly integrated (Fisher and Denver, 2008), theseindividual data still therefore provide us with the oppor-tunity to confirm the patterns found in our aggregate datawhich focus exclusively on local effort.
Tables 5–7 show the results of our individual levelanalyses by party voted for in 2010. Our analyses are cross-sectional, having selected voters who were undecided interms of vote choice prior to the campaign. This is sowe canisolate the effect of the campaign on those who had notalready made up their mind. We use binary logistic
Table 6The impact of campaign contacts on previously undecided voters (Labourvote).
n ¼ 3221 Model 1 Model 2 Model 3
Con campaign �0.272 (0.077) �0.231 (0.082) �0.199 (0.086)Lab campaign 0.563 (0.073) 0.471 (0.079) 0.462 (0.082)Lib Dem
campaign�0.491 (0.091) �0.392 (0.095) �0.451 (0.102)
Lab vote 2005 n/a 1.655 (0.091) 1.430 (0.096)Con MiP n/a n/a �1.143 (0.205)Lab MiP n/a n/a 1.284 (0.116)Lib Dem MiP n/a n/a �0.835 (0.171)Constant �1.190 (0.054) �1.920 (0.076) �1.875 (0.085)Nagelkerke R2 0.039 0.190 0.286�2 log likelihood 3360.551 3013.008 2772.558
Standard errors in parenthesis; n/a: not applicable; MiP: most importantproblem.
regression with the dependent variable being coded asa vote for a particular party or not (i.e. Vote Conservative 1,Not Vote Conservative 0). We fit three models each withadditional control variables. Model 1 examines the impactof the campaigns on undecided voters without anycontrols. Model 2 controls for previous vote for the partythat the respondent ultimately chose. Including previousvote as a control helps remove any possible effects ofendogeneity similar to including previous vote share in theconstituency level analyses. This effectively controls for thepossibility that parties send more campaign material topeople who have supported the party previously(measured by previous vote).
In order to further test the robustness of our results, weestimate with a third model (Model 3), which includes theadditional controls of which party was deemed to have thebest policies to solve the respondent’s assessment of themost important problem (MiP) facing the country; Clarkeet al. (2004, 2009, 2011) show how this assessment hasbeen a critical determinant of voting behaviour in the lastthree elections. These are, therefore useful further controlvariables to confirm the impact of our variables of interest –the campaigns. Of course issue performance is itself likelyto be influenced by the campaign, so the inclusion of theseas independent variables may lead to an underestimationof the campaign’s effects. However it is useful to run themodels with the additional controls to provide a lowerbound on the campaign effects.6 What is clear from theresults in Model 3, however, is that despite the additions of
6 We ran a further model including evaluations of the three main partyleaders following Clarke et al’s (2004, 2009, 2011) demonstration of theimportance of leadership effects on vote choice. Due to a large number ofmissing values, this resulted in an unacceptable loss of 173 cases. Weinclude the model in the Appendix (see Table A1), nevertheless, forinformation. The results are broadly unchanged, except for the fact thatthe negative impact of Conservative campaigning of the Labour vote, andLabour campaigning on the Conservative vote are now non-significant.However, our view is that these changes can be explained by the factthat evaluations of leaders are themselves influenced by the campaign(see, for example, Stevens et al., 2011). Campaigning will, by its verynature, seek to influence leadership evaluations (especially in a campaignso dominated by leaders – see Pattie and Johnston, 2011; Stevens et al.,2011).
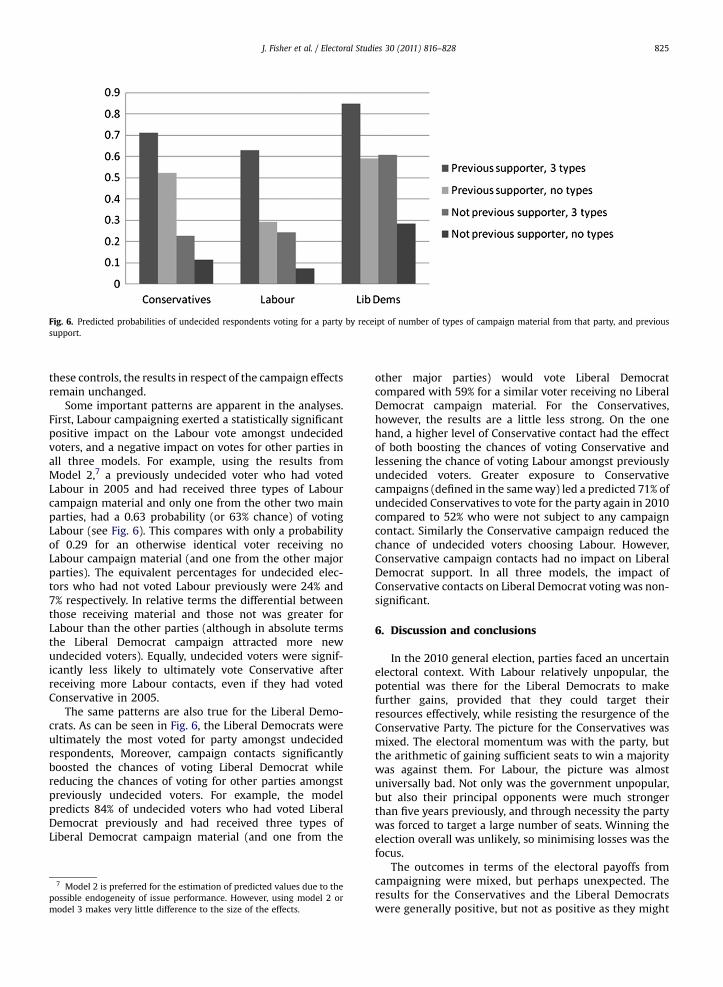
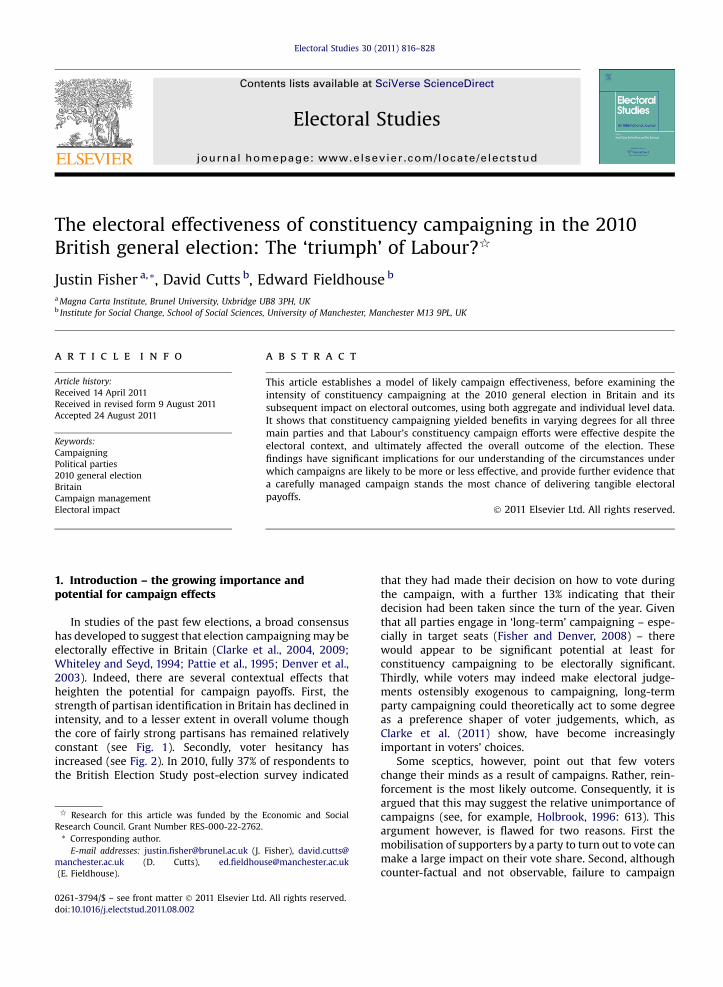
Fig. 6. Predicted probabilities of undecided respondents voting for a party by receipt of number of types of campaign material from that party, and previoussupport.
J. Fisher et al. / Electoral Studies 30 (2011) 816–828 825
these controls, the results in respect of the campaign effectsremain unchanged.
Some important patterns are apparent in the analyses.First, Labour campaigning exerted a statistically significantpositive impact on the Labour vote amongst undecidedvoters, and a negative impact on votes for other parties inall three models. For example, using the results fromModel 2,7 a previously undecided voter who had votedLabour in 2005 and had received three types of Labourcampaign material and only one from the other two mainparties, had a 0.63 probability (or 63% chance) of votingLabour (see Fig. 6). This compares with only a probabilityof 0.29 for an otherwise identical voter receiving noLabour campaign material (and one from the other majorparties). The equivalent percentages for undecided elec-tors who had not voted Labour previously were 24% and7% respectively. In relative terms the differential betweenthose receiving material and those not was greater forLabour than the other parties (although in absolute termsthe Liberal Democrat campaign attracted more newundecided voters). Equally, undecided voters were signif-icantly less likely to ultimately vote Conservative afterreceiving more Labour contacts, even if they had votedConservative in 2005.
The same patterns are also true for the Liberal Demo-crats. As can be seen in Fig. 6, the Liberal Democrats wereultimately the most voted for party amongst undecidedrespondents, Moreover, campaign contacts significantlyboosted the chances of voting Liberal Democrat whilereducing the chances of voting for other parties amongstpreviously undecided voters. For example, the modelpredicts 84% of undecided voters who had voted LiberalDemocrat previously and had received three types ofLiberal Democrat campaign material (and one from the
7 Model 2 is preferred for the estimation of predicted values due to thepossible endogeneity of issue performance. However, using model 2 ormodel 3 makes very little difference to the size of the effects.
other major parties) would vote Liberal Democratcompared with 59% for a similar voter receiving no LiberalDemocrat campaign material. For the Conservatives,however, the results are a little less strong. On the onehand, a higher level of Conservative contact had the effectof both boosting the chances of voting Conservative andlessening the chance of voting Labour amongst previouslyundecided voters. Greater exposure to Conservativecampaigns (defined in the sameway) led a predicted 71% ofundecided Conservatives to vote for the party again in 2010compared to 52% who were not subject to any campaigncontact. Similarly the Conservative campaign reduced thechance of undecided voters choosing Labour. However,Conservative campaign contacts had no impact on LiberalDemocrat support. In all three models, the impact ofConservative contacts on Liberal Democrat voting was non-significant.
6. Discussion and conclusions
In the 2010 general election, parties faced an uncertainelectoral context. With Labour relatively unpopular, thepotential was there for the Liberal Democrats to makefurther gains, provided that they could target theirresources effectively, while resisting the resurgence of theConservative Party. The picture for the Conservatives wasmixed. The electoral momentum was with the party, butthe arithmetic of gaining sufficient seats to win a majoritywas against them. For Labour, the picture was almostuniversally bad. Not only was the government unpopular,but also their principal opponents were much strongerthan five years previously, and through necessity the partywas forced to target a large number of seats. Winning theelection overall was unlikely, so minimising losses was thefocus.
The outcomes in terms of the electoral payoffs fromcampaigning were mixed, but perhaps unexpected. Theresults for the Conservatives and the Liberal Democratswere generally positive, but not as positive as they might

J. Fisher et al. / Electoral Studies 30 (2011) 816–828826
have been given the electoral context. In both cases,a plausible explanation is that there were too many tar-geted seats for the electoral payoffs to be as high as onemight have expected. In the case of the Conservatives,this was understandable. An outright victory waspossible, but only if the party gained at least 116 seats.Thus, the targeting of a large number of seats wasa necessity given the results of the 2005 election. Withthe benefit of hindsight, less attention could, perhaps,have been paid to the party’s ‘certainties’ – the verymarginal seats that were likely to fall to the Conserva-tives anyway. As Fig. 3 shows, relatively less intensecampaigning occurred in these seats compared with the‘core targets’ but given the marginality of these seats,more intense campaigning in the ‘possibles’ (which wasof slightly lower intensity compared with the ‘certain-ties’) would probably have yielded stronger electoralpayoffs. Of course, campaign planners would probablynot have wanted to risk such a strategy. In any case,whether this effort could have been re-directed else-where is not clear. Indeed, for all parties, there is littlebenefit from campaigning less where the benefits areuncertain and resources are relatively immobile.
The Liberal Democrats, however, were probably bothover ambitious and at the same time over cautious. Interms of ambition, the party possibly over-extended itselfin terms of offensive targets. Previous elections have seenmore modest targets in terms of gains reflecting the par-ty’s lower level of resource compared with the Conser-vatives and Labour. More problematic, however, was thedefensive strategy in terms of existing Liberal Democratseats, where as Fig. 5 shows, there was virtually an iden-tical level of intensity compared with the party’s offensivetargets. With the benefit of hindsight, much activity wasexpended unnecessarily, though the same caveats con-cerning mobility of resources apply here as to theConservatives. In sum, the Liberal Democrats were – asusual – very successful in differentiating campaign effortsbetween target and non-target seats, but like theConservatives, it appears that their choice of targets wassub-optimal.
This becomes more apparent when we compare theirresults with those of Labour, whose campaigning wassuccessful against the odds suggested by the electoralcontext. To help explain this, one might point to the
Table 8New exogenous factors influencing likely effectiveness of constituency campaign
More effective
Closeness of election Popularity equilibrium
Significant change likely Challenger(s)
High No’s of target seats Unpopular party(ies)
Central management Clear objectives
relatively sophisticated way in which Labour target seatswere designated (Fisher et al., 2011). Labour’s targetingdecisions were derived from propensity modelling. Thistechnique applied four criteria: the level of activity in thelocal party, the electoral performance in various electionssince 2005, the notional majority, and the existence of anyparticular political circumstances (such as hospital closuresor expenses). All criteria were given a score with the modelthen predicting the result. The outcome was that Labourseemingly selected the most appropriate targets and hadrealistic assumptions about the result. Labour’s strategywas to minimise its losses and deny the Conservativesa majority. The evidence here suggests that the party’sconstituency level campaigning was one contributoryfactor in its success. All of this tallies with previous workthat has suggested that good central management ofcampaigns is as important – if not more important – thanthe level of raw resources on the ground (Fisher et al.,2006a).
These findings, then, are of some significance. In the firstinstance, they help explain why Labour was successful indenying the Conservative a majority despite securing itslowest post-war vote share save for that of 1983. Ourmodelof campaign effectiveness (see Table 1) predicted correctlythat the Conservative and Liberal Democrat campaignswould be more likely to be successful on account ofcloseness of the election and the likelihood of significantchange. It also helps explain why the Conservatives mayhave been less successful due to problems of coordinatingthe necessarily large number of target seats. But on the faceof it, it failed to explain why Labour’s campaigns wererelatively successful. To varying degrees, all of the variablesin the model suggested that Labour’s campaigns shouldhave been less effective – Labour’s unpopularity shouldhave offset the impact of the closeness of the election andto a degree, the impact of the Conservatives’ need to targetso many seats. Equally, Labour’s status as incumbent in anelection where significant change was likely should havebeen to its disadvantage.
However, the findings suggest strong campaignmanagement can help overcome such conditions toa degree. They emphasise that good campaign manage-ment really matters, and good management is aboutrealism in respect of what a party can achieve. Thus, setagainst a group of very unfavourable variables, Labour was
s.
Less effective
Unpopular party(ies)
Incumbent
Popularity equilibrium
Unclear objectives

Group Question
Preparation How prepared – jobsHow prepared – campaign fundsHow prepared – main committee roomsHow prepared – local committee roomsHow prepared – electoral registerHow prepared – election addressHow prepared – printingHow prepared – identifying supportersStarted serious planningUse of previous canvass records
Organisation % of const covered by active local orgsHow long ago knew responsibleDelegated duties – canvassing organiserDelegated duties – postal votesDelegated duties – candidate aideDelegated duties – computer officerLocal orgainsers or sub-agents
Manpower Number of campaign workersNumber of campaign helpers on polling day
Computers Delegated duties – computer officerUse of computers – direct mailUse of computers – canvass returnsUse computerised electoral registerComputers used to compile knock-up listsElection software provided by party HQ
J. Fisher et al. / Electoral Studies 30 (2011) 816–828 827
able to achieve its realistic objective of denying theConservatives a majority. Compare this with the Conser-vative’s strategy in 2001 of targeting 180 seats followingthe results of the 1997 election (Denver et al., 2002b). Abetter strategy thenmight well have been to focus on fewerseats to try and reduce Labour’s majority. Good campaignmanagement can then temper the effects of exogenousfactors as much as less good campaign management canreduce their advantage. As such, in the light of these find-ings, our model as featured in Table 1 can be re-formulated(see Table 8).
So, management matters in predicting campaignsuccess, but politics matters, too. Labour was conspicuouslysuccessful in recruiting undecided voters through itscampaign efforts, which given Labour’s difficulties in itsthird term points to a failing of both other parties (butparticularly the Conservatives) to ‘seal the deal’ with theelectorate. When Labour won in 1997, the party and itsleader were both very popular in absolute terms. In 2010,Labour was unpopular, and the Conservatives were onlypopular in terms relative to Labour (Clarke et al., 2011:252). In this context, Labour’s campaigns were less likely tosuffer from a tide of resignation and were more likely to begalvanised, both by the prospect of a Conservative victoryand by the possibility in the short campaign that Labourcould end up third in terms of vote share following therapid improvement in Liberal Democrat poll ratings. Suchsuccesses were aided by very effective targeting. Labour, ofcourse, lost the 2010 election, but the result of theconstituency campaigns and their impact on the finaloutcome arguably points paradoxically to a form of‘triumph’ for Labour against the odds.
Pollingday activity
Good morning leaflets deliveredVoters knocked up on polling day% of constituency covered
Appendix
Number of campaign helpers on polling dayVolunteers sent into your constituency
Telephones Use telephone canvassing in constituencyOutside canvassingUse telephone canvassingTelephone canvassing organised fromoutside constituency
Responses
The numbers of responses for each party by target statuswere as follows:
All HeldNot Target
Target Not TargetNot Held
Conservative 287 120 56 111Labour 388 129 74 185Liberal democrat 353 – 50 303
Voters contacted by telephone on polling dayDirect mail Leaflets targeted at particular groups
Direct mail used to target individual votersCanvassing % of electorate canvassed
% of electorate telephone canvassed?Leaflets How many regionally/nationally produced
leaflets distributedTotal number of locally produced leaflets
E-Campaigning Pre-election campaign – operatingand maintaining a websitePre-election campaign – using socialnetworking sitesContact voters in the constituencyby text message
Mean percentage of maximum spend by responses during longand short campaigns
% Respondents All constituencies
Conservative 37.2 38.1Labour 22.5 25.6Liberal democrat 18.8 19.6SNP 17.0 16.3Plaid Cymru 13.9 15.7
Calculation of campaign intensity index
Responses to the questions below are grouped throughadditive scales into the following core components ofconstituency campaigning: Preparation, Organisation,Manpower, Computers, Polling Day Activity, Telephones,Direct Mail, Canvassing, Leaflets and E-Campaigning. Thesegroups are then entered into a PCA, which produced thesolution overleaf.
Make use of twitter to communicatewith votersUse of computers – emailing votersLocal party & candidate websiteCampaign effort – maintaining websiteCampaign effort – emailing votersCampaign effort – social networking sitesCampaign effort – video/image sharing sitesVoters contacted by text on polling dayVoters contacted by email on polling day
J. Fisher et al. / Electoral Studies 30 (2011) 816–828828
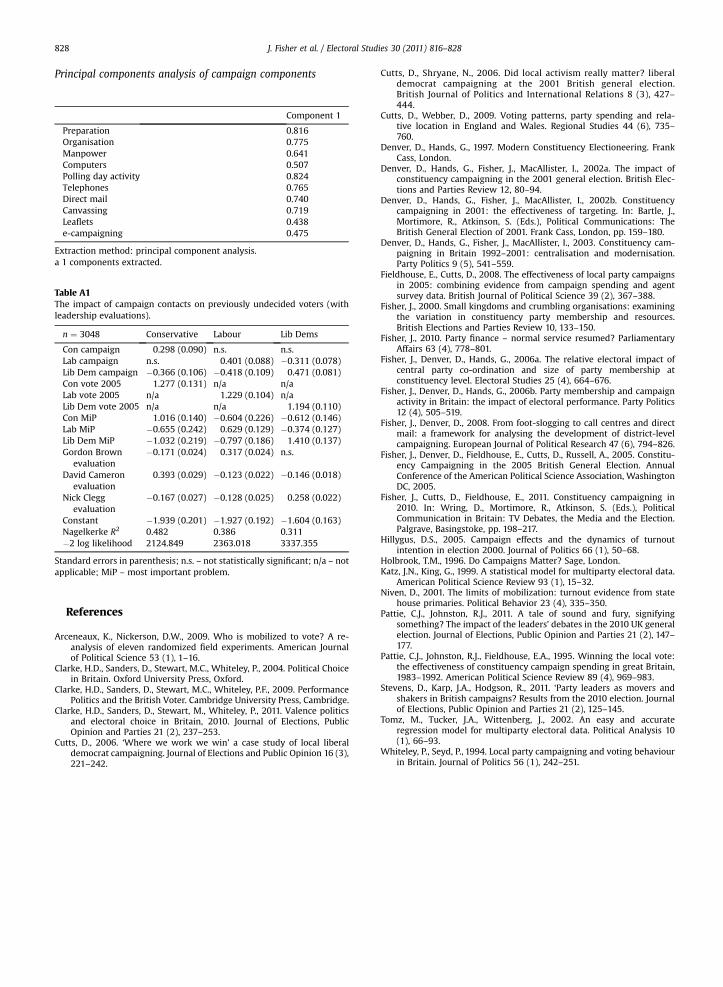
Principal components analysis of campaign components
Component 1
Preparation 0.816Organisation 0.775Manpower 0.641Computers 0.507Polling day activity 0.824Telephones 0.765Direct mail 0.740Canvassing 0.719Leaflets 0.438e-campaigning 0.475
Extraction method: principal component analysis.a 1 components extracted.
Table A1The impact of campaign contacts on previously undecided voters (withleadership evaluations).
n ¼ 3048 Conservative Labour Lib Dems
Con campaign 0.298 (0.090) n.s. n.s.Lab campaign n.s. 0.401 (0.088) �0.311 (0.078)Lib Dem campaign �0.366 (0.106) �0.418 (0.109) 0.471 (0.081)Con vote 2005 1.277 (0.131) n/a n/aLab vote 2005 n/a 1.229 (0.104) n/aLib Dem vote 2005 n/a n/a 1.194 (0.110)Con MiP 1.016 (0.140) �0.604 (0.226) �0.612 (0.146)Lab MiP �0.655 (0.242) 0.629 (0.129) �0.374 (0.127)Lib Dem MiP �1.032 (0.219) �0.797 (0.186) 1.410 (0.137)Gordon Brown
evaluation�0.171 (0.024) 0.317 (0.024) n.s.
David Cameronevaluation
0.393 (0.029) �0.123 (0.022) �0.146 (0.018)
Nick Cleggevaluation
�0.167 (0.027) �0.128 (0.025) 0.258 (0.022)
Constant �1.939 (0.201) �1.927 (0.192) �1.604 (0.163)Nagelkerke R2 0.482 0.386 0.311�2 log likelihood 2124.849 2363.018 3337.355
Standard errors in parenthesis; n.s. – not statistically significant; n/a – notapplicable; MiP – most important problem.
References
Arceneaux, K., Nickerson, D.W., 2009. Who is mobilized to vote? A re-analysis of eleven randomized field experiments. American Journalof Political Science 53 (1), 1–16.
Clarke, H.D., Sanders, D., Stewart, M.C., Whiteley, P., 2004. Political Choicein Britain. Oxford University Press, Oxford.
Clarke, H.D., Sanders, D., Stewart, M.C., Whiteley, P.F., 2009. PerformancePolitics and the British Voter. Cambridge University Press, Cambridge.
Clarke, H.D., Sanders, D., Stewart, M., Whiteley, P., 2011. Valence politicsand electoral choice in Britain, 2010. Journal of Elections, PublicOpinion and Parties 21 (2), 237–253.
Cutts, D., 2006. ‘Where we work we win’ a case study of local liberaldemocrat campaigning. Journal of Elections and Public Opinion 16 (3),221–242.
Cutts, D., Shryane, N., 2006. Did local activism really matter? liberaldemocrat campaigning at the 2001 British general election.British Journal of Politics and International Relations 8 (3), 427–444.
Cutts, D., Webber, D., 2009. Voting patterns, party spending and rela-tive location in England and Wales. Regional Studies 44 (6), 735–760.
Denver, D., Hands, G., 1997. Modern Constituency Electioneering. FrankCass, London.
Denver, D., Hands, G., Fisher, J., MacAllister, I., 2002a. The impact ofconstituency campaigning in the 2001 general election. British Elec-tions and Parties Review 12, 80–94.
Denver, D., Hands, G., Fisher, J., MacAllister, I., 2002b. Constituencycampaigning in 2001: the effectiveness of targeting. In: Bartle, J.,Mortimore, R., Atkinson, S. (Eds.), Political Communications: TheBritish General Election of 2001. Frank Cass, London, pp. 159–180.
Denver, D., Hands, G., Fisher, J., MacAllister, I., 2003. Constituency cam-paigning in Britain 1992–2001: centralisation and modernisation.Party Politics 9 (5), 541–559.
Fieldhouse, E., Cutts, D., 2008. The effectiveness of local party campaignsin 2005: combining evidence from campaign spending and agentsurvey data. British Journal of Political Science 39 (2), 367–388.
Fisher, J., 2000. Small kingdoms and crumbling organisations: examiningthe variation in constituency party membership and resources.British Elections and Parties Review 10, 133–150.
Fisher, J., 2010. Party finance – normal service resumed? ParliamentaryAffairs 63 (4), 778–801.
Fisher, J., Denver, D., Hands, G., 2006a. The relative electoral impact ofcentral party co-ordination and size of party membership atconstituency level. Electoral Studies 25 (4), 664–676.
Fisher, J., Denver, D., Hands, G., 2006b. Party membership and campaignactivity in Britain: the impact of electoral performance. Party Politics12 (4), 505–519.
Fisher, J., Denver, D., 2008. From foot-slogging to call centres and directmail: a framework for analysing the development of district-levelcampaigning. European Journal of Political Research 47 (6), 794–826.
Fisher, J., Denver, D., Fieldhouse, E., Cutts, D., Russell, A., 2005. Constitu-ency Campaigning in the 2005 British General Election. AnnualConference of the American Political Science Association, WashingtonDC, 2005.
Fisher, J., Cutts, D., Fieldhouse, E., 2011. Constituency campaigning in2010. In: Wring, D., Mortimore, R., Atkinson, S. (Eds.), PoliticalCommunication in Britain: TV Debates, the Media and the Election.Palgrave, Basingstoke, pp. 198–217.
Hillygus, D.S., 2005. Campaign effects and the dynamics of turnoutintention in election 2000. Journal of Politics 66 (1), 50–68.
Holbrook, T.M., 1996. Do Campaigns Matter? Sage, London.Katz, J.N., King, G., 1999. A statistical model for multiparty electoral data.
American Political Science Review 93 (1), 15–32.Niven, D., 2001. The limits of mobilization: turnout evidence from state
house primaries. Political Behavior 23 (4), 335–350.Pattie, C.J., Johnston, R.J., 2011. A tale of sound and fury, signifying
something? The impact of the leaders’ debates in the 2010 UK generalelection. Journal of Elections, Public Opinion and Parties 21 (2), 147–177.
Pattie, C.J., Johnston, R.J., Fieldhouse, E.A., 1995. Winning the local vote:the effectiveness of constituency campaign spending in great Britain,1983–1992. American Political Science Review 89 (4), 969–983.
Stevens, D., Karp, J.A., Hodgson, R., 2011. ‘Party leaders as movers andshakers in British campaigns? Results from the 2010 election. Journalof Elections, Public Opinion and Parties 21 (2), 125–145.
Tomz, M., Tucker, J.A., Wittenberg, J., 2002. An easy and accurateregression model for multiparty electoral data. Political Analysis 10(1), 66–93.
Whiteley, P., Seyd, P., 1994. Local party campaigning and voting behaviourin Britain. Journal of Politics 56 (1), 242–251.