the efficacy of therapeutic faradic stimulation in patients … the efficacy of therapeutic faradic...
TRANSCRIPT

i
The Efficacy of Therapeutic Faradic Stimulation in patients with Myofascial Pain Syndrome of the Trapezius and Levator Scapula Musculature.
Mini-dissertation in partial compliance with the requirements for the Masters
Degree in Technology: Chiropractic, in the Department of Chiropractic at
the Durban Institute of Technology.
By
Hayley Anne Bedell-Sivright
I, Hayley Anne Bedell-Sivright, declare that this dissertation represents my
own work, both in conception and execution.
DATE:
APPROVED FOR FINAL EXAMINATION
Dr. Horace Lindsay White Dr Charmaine Maria Korporaal BSc; BEd, Dipl Ed.Tech; M.Tech Chiropractic; CCFC M.Tech:Chiropractic, CCFC, CCSP, ICSSD
(Co-Supervisor) (Supervisor)
DATE: DATE:

i
DEDICATION
This work is dedicated to my wonderful parents, Rose and Revell, whose love,
support and encouragement throughout my Chiropractic Journey and throughout
life have allowed me to get to where I am today. I love you.
A special thank-you to my mum who has always been at my rescue whenever
I‟ve needed a helping hand or a shoulder to lean on.
You‟ve been fantastic, thanks mum.
ii
ACKNOWLEDGEMENTS
I would like to thank my brother Gareth, for your love and support that you‟ve
given me over the years.
To my classmate and good friend, the late Donna Weyer-Henderson, for the very
special memories I have of you especially in our early Chiropractic days. I will
miss you as my friend and as my colleague. May you rest in peace, Donna.
To my family in Kloof, who have generously allowed me computer access over
the years, and in particular my granny Pat, who has always kept my tummy
happy during the many study sessions where „Diggs life‟ hasn‟t justified home.
Thank-you.
To my good friends in Durban and classmates, thank-you for being there for me
during the hard times and for celebrating the good ones.
In particular to Rowan White, for your positivity towards Chiropractic and for
encouraging me to pursue this awesome profession.
A big and special thank-you to Charmaine, my “Chiro-mentor” and
supervisor...for your positive enthusiasm, efficiency and for your guidance
throughout my research. You‟ve been fantastic, thank you !
To Dr White, my co-supervisor, and excellent Prac Lecturer. Thank-you for your
inspiration and confidence in us students and for your help with my research.
To Grant Harper and Ingrid Adamson, for your assistance with the photography
To Pat, Linda and Mrs Ireland, for your kind and efficient manner in the clinic
To all my patients who participated in this study, without you this research project
would not have been possible.
iii
ABSTRACT
The purpose of this study was to determine the efficacy of Therapeutic Faradic
Stimulation in patients with Myofascial Pain Syndrome of theTrapezius and
Levator Scapula musculature.
This study was a quantitative pilot placebo controlled clinical trial. The sample
size used was 60 patients selected from the Durban Metropolitan Area. Only
patients between the ages of 30 and 50, who were office workers and were
diagnosed with active trigger points in either the Trapezius and/or the Levator
Scapula muscles were accepted into this study.
The sample was divided into 3 groups of 20. One group received Faradic
Stimulation in the form of the Transeva, another group received Placebo
Transeva and the third group received Pulsed Ultrasound. Each patient received
2 research treatments with a maximum of 72 hours between treatment 1 and 2,
and the third free Chiropractic treatment being a week later.
Data (both subjective and objective) were obtained from the patients at the first
and second consultations, prior to treatments and at the third follow up before
treatment. Subjective data were obtained with the Short form McGill pain
questionnaire, the Numerical Pain Rating Scale and the CMCC Neck Disability
Index. Objective data were obtained from the Pressure Algometer and the CROM
Cervical Range of Motion Instrument.
Statistical Analysis of the data was conducted using the SPSS (version 9)
software suite. This Statistical software program was manufactured by SPSS Inc,
444N. Michigan Avenue, Chicago, Illinois, USA. Various Descriptive and
Inferential Statistical techniques were used. The Descriptive procedures used
were various tables and graphs and a few summary statistics including but not
limited to means, proportions and percentages. Inferential Statistics included

iv
various Hypothesis testing techniques. Due to the size of our samples, namely
20 in each group, non-parametric Statistical Tests were used. All the tests were
set at type 1 error at 5%, or mentioned differently = 0.05. If our p value as
reported was less than 0.05 we declared a significant result and our Null
Hypothesis was rejected.
Evaluation of the statistical analyses revealed significant improvements with
regards to subjective and objective data for mostly the Attenuated Faradic
Treatment (Transeva) group. Although significant Placebo and Ultrasound effects
were obtained initially after the first treatment, the Transeva group showed more
favourable results between consultations two and three, giving a good indication
of the progression of the treatment regimen.
Comparison between groups showed a significant difference with regards to
CMCC Neck Disability Index scores, NPRS 101 questionnaires, CROM
extension and right lateral flexion readings and Algometer readings.
It was concluded that the Transeva is an effective form of treatment for the active
trigger points of Myofascial Pain Syndrome of the Trapezius and Levator
Scapula musculature in terms of both subjective and objective clinical findings.
Suggestions were made to double-blind further studies as this will aid in reducing
researcher bias toward a favoured treatment protocol. This study and
observations made by the author with respect to Myofascial Transeva treatment
are hoped to contribute to the limited literature available on this modality.

v
TABLE OF CONTENTS
Page
Dedication………………………………………………………………….. i
Acknowledgements………………………………………………………. ii
Abstract…………………………………………………………………….. iii
Table of contents…………………………………………………………. v
List of tables……………………………………………………………….. viii
List of figures………………………………………………….................. x
List of plates ………………………………………………………………. xi
List of appendices…………………………………………….................. xii
CHAPTER 1 INTRODUCTION
1.1 The Problem …………..…………………………………… 1
1.1 Objectives of this research …………………………….. 2
1.2 Assumptions of this study ……………………………... 4
1.3 Potential benefits of this study ……………………….. 5
CHAPTER 2 LITERATURE REVIEW
2.1 Myofascial Pain Syndrome.……………………………... 6
2.1.1 Aetiology of Myofascial Pain Syndrome.……………... 7
2.1.2 Mechanism of trigger point development …………… 8
2.2 Clinical Features ………………………………………….. 8
2.2.1 Common symptoms of active myofascial trigger
Points ……………………………………………………….. 8
2.2.2 Common signs of active myofascial trigger points … 9
2.2.3 Findings on examination and diagnosis ……………... 10
2.3 Treatment of myofascial trigger points ……………….. 10
2.3.1 The Transeva ………………………………………………. 11
vi
2.3.2 Pulsed ultrasound ………………………………………... 13
2.3.3 Placebo (Sham Transeva) ………………………………. 15
2.4 Compendium of Muscles ……………………………….. 15
2.5 Conclusion ………………………………………………… 17
CHAPTER 3 RESEARCH DESIGN AND METHODS
3.1 Study Design …………………………………………….. 18
3.2 Advertising ………………………………………………. 18
3.3 Sample Selection ……………………………………….. 18
3.4 Sample Size ……………………………………………… 19
3.5 Sample Allocation ……………………………………… 19
3.6 Research – Patient procedure ………………………. 19
3.7 Inclusion & Exclusion criteria ……………………….. 20
3.8 Location & diagnosis of the Myofascial Trigger
Points of the Upper Trapezius Muscle and Levator
Scapula Muscle ………………………………………… 22
3.9 Interventions ……………………………………………. 25
3.10 Intervention frequency ………………………………... 27
3.11 Measurement Tools
a. Subjective measurements …………………….. 27
b. Objective measurements ……………………… 29
c. Measurement frequency ……………………… 30
3.12 Statistical Analysis …………………………………….. 32
CHAPTER 4 STATISTICAL REPORT AND DISCUSSION
4.1 Introduction …………………………………………….. 35
4.2 Descriptive Statistics
Group A …………………………………………………. 36
Group B …………………………………………………. 38
Group C …………………………………………………. 40
vii
4.3 Inferential Statistics
4.3.1 Intra Group Tests …………………………………….. 44
a. Subjective ……………………………………….. 44
b. Objective ………………………………………… 55
4.3.2 Inter Group Tests …………………………………….. 69
a. Subjective ………………………………………. 69
b. Objective ……………………………………….. 75
4.4 Observations – Transeva Treatment …………….. 87
CHAPTER 5 CONCLUSION AND RECOMMENDATIONS
5.1 Conclusion …………………………………………… 89
5.2 Recommendations for future studies …………. 91
viii
LIST OF TABLES
Table 4.0 Descriptive Statistics for Age (Group A)………...…………………36
Table 4.1 Frequency Distribution Table of Occupation (Group A)…………37
Table 4.2 Descriptive Statistics for Age (Group B)……………………………38
Table 4.3 Frequency Distribution Table of Occupation (Group B)…………39
Table 4.4 Descriptive Statistics for Age (Group C)……………………………40
Table 4.5 Frequency Distribution Table of Occupation (Group C)…………41
Table 4.6 Descriptive Statistics for CMCC by Group…………………………44
Table 4.7 Wilcoxon Tests Results for CMCC by Group………………………45
Table 4.8 Descriptive Statistics for NPRS by Group ………………………...48
Table 4.9 Wilcoxon Tests Results for NPRS by Group……………………....49
Table 4.10 Descriptive Statistics for SFMQ by Group………………………...51
Table 4.11 Wilcoxon Tests Results for SFMQ by Group……………………..52
Table 4.12 Descriptive Statistics for CROM (flexion) by Group……………..55
Table 4.13 Wilcoxon Tests Results for CROM (flexion) by Group………….56
Table 4.14 Descriptive Statistics for CROM (extension) by Group…………57
Table 4.15 Wilcoxon Tests Results for CROM(extension) by Group………58
Table 4.16 Descriptive Statistics for CROM (lat flexion-right) by Group…..59
Table 4.17 Wilcoxon Tests Results for CROM(lat flexion-right) by Group..59
Table 4.18 Descriptive Statistics for CROM (lat flexion-left) by Group…….61
Table 4.19 Wilcoxon Tests Results for CROM(lat flexion-left) by Group….62
Table 4.20 Descriptive Statistics for CROM (rotation-right) by Group……..63
Table 4.21 Wilcoxon Tests Results for CROM (rotation-right) by Group….64
Table 4.22 Descriptive Statistics for CROM (rotation-left) by Group……….65
Table 4.23 Wilcoxon Tests Results for CROM(rotation-left) by group…….66
Table 4.24 Descriptive Statistics for Algometer by Group…………………..67
Table 4.25 Wilcoxon Tests Results for Algometer by Group………………..68
Table 4.26 Kruskal Wallis Test Results forCMCC……………………………...69
Table 4.27 Mann Whitney Test-ranks output Results for visits 1 and 2……69
Table 4.28 Mann Whitney Test-Final Results for visits 1 and 2……………..70
Table 4.29 Mann Whitney Test-ranks output Results for visits 2 and 3……70
Table 4.30 Mann Whitney Test-Final Results for visits 2 and 3………..…….70

ix
Table 4.31 Mann Whitney Test-ranks output Results for visits 1 and 3…...70
Table 4.32 Mann Whitney Test-Final Results for visits 1 and 3……………..71
Table 4.33 Kruskal Wallis Test Results for NPRS……………………………...72
Table 4.34 Mann Whitney Test-ranks output Results for visits 1 and 2……72
Table 4.35 Mann Whitney Test-Final Results for visits 1 and 2……………...72
Table 4.36 Mann Whitney Test-ranks output Results for visits 2 and 3……73
Table 4.37 Mann Whitney Test-Final Results for visits 2 and 3……………...73
Table 4.38 Mann Whitney Test-ranks output Results for visits 1 and 3……73
Table 4.39 Mann Whitney Test-Final Results for visits 1 and 3……………..73
Table 4.40 Kruskal Wallis Test Results for SFMQ……………………………..74
Table 4.41 Kruskal Wallis Test Results for Crom flexion…………………….75
Table 4.42 Kruskal Wallis Test Results for Crom extension…………………76
Table 4.43 Mann Whitney Test-ranks output Results for visits 1 and 2……76
Table 4.44 Mann Whitney Test-Final Results for visits 1 and 2……………..76
Table 4.45 Mann Whitney Test-ranks output Results for visits 2 and 3……77
Table 4.46 Mann Whitney Test-ranks output Results for visits 1 and 3……77
Table 4.47 Mann Whitney Test-Final Results for visits 1 and 3……………..77
Table 4.48 Kruskal Wallis Test Results for Crom LF right……………………78
Table 4.49 Mann Whitney Test-ranks output Results for visits 1 and 2……79
Table 4.50 Mann Whitney Test-Final Results for visits 1 and 2……………..79
Table 4.51 Mann Whitney Test-ranks output Results for visits 2 and 3……79
Table 4.52 Mann Whitney Test Final Results for visits 2 and 3……………..79
Table 4.53 Mann Whitney Test-ranks output Results for visits 1 and 3……80
Table 4.54 Mann Whitney Test-Final Results for visits 1 and 3……………...80
Table 4.55 Kruskal Wallis Test Results for Crom LF left………………...……81
Table 4.56 Kruskal Wallis Test Results for Crom Rot right………………......82
Table 4.57 Kruskal Wallis Test Results for Crom Rot left…………………..82
Table 4.58 Kruskal Wallis Test Results for Algometer………………………...83
Table 4.59 Mann Whitney Test-Final Results for visits 1 and 2……………..83
Table 4.60 Mann Whitney Test-Final Results for visits 2 and 3……………..84
Table 4.61 Mann Whitney Test-Final Results for visits 1 and 3……………..84

x
LIST OF FIGURES
Figure 1: Illustration showing Trapezius MFTP 1 with
referral pain pattern…………………..…………. 23
Figure 2: Illustration showing Trapezius MFTP 2
With referral pain pattern ……………………… 24
Figure 3: Group A - Sample Segmentation of Gender.. 36
Figure 4: Group A - Sample Segmentation of Race….. 37
Figure 5: Group B - Sample Segmentation of Gender.. 38
Figure 6: Group B - Sample Segmentation of Race….. 39
Figure 7: Group C - Sample Segmentation of Gender.. 40
Figure 8: Group C - Sample Segmentation of Race….. 41

xi
LIST OF PLATES
Plate 1 / 2 : Plates 1(left) and 2(right): Demonstration of
patient/practitioner for palpation of trigger points in the upper fibres of
Trapezius Muscle by pincer palpation (plate 1) and trigger points in the
Levator Scapula Muscle by flat palpation (plate 2) …….…………………...…31
Plate 3: Demonstration of patient/practitioner for the Transeva Placebo
treatment of the upper fibres of Trapezius muscle.……………………..…….31
Plate 4: Demonstration of patient/practitioner for the Ultrasound
treatment of the upper fibres of Trapezius muscle in seated (plate on right),
and prone (plate on left) position……………………………...…...……………..32

xii
LIST OF APPENDICES
Appendix A: Letter to patient
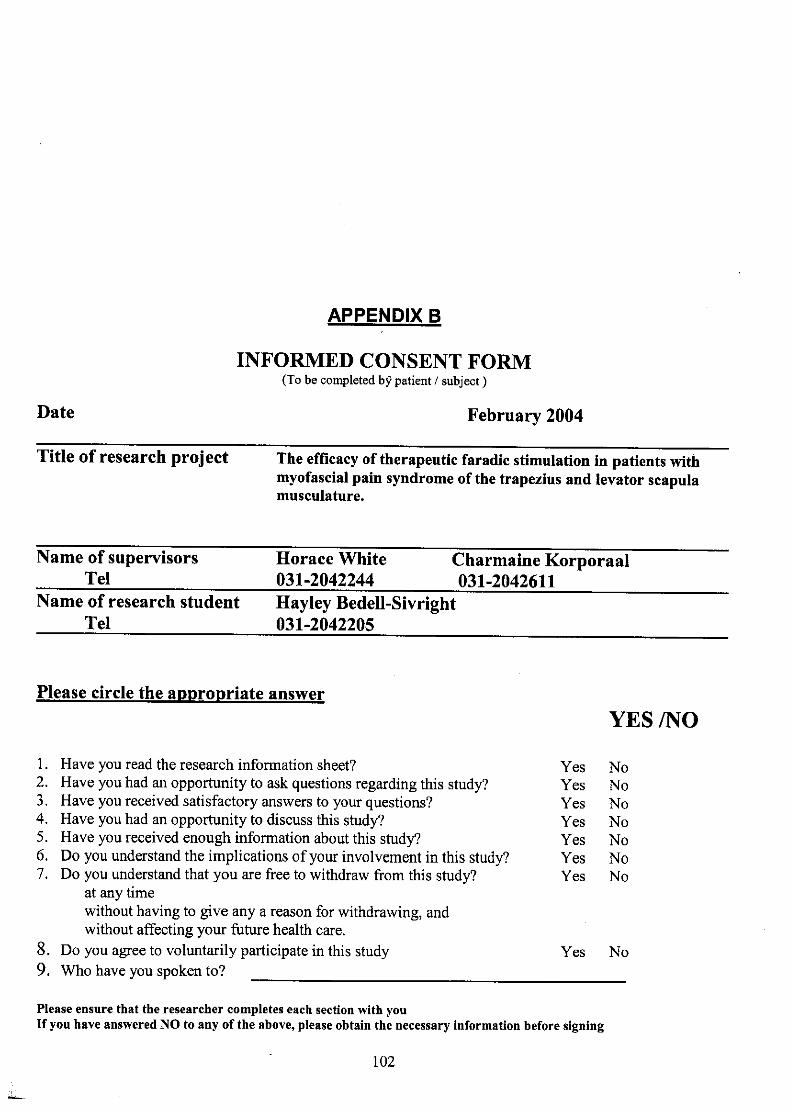
Appendix B: Informed Consent Form
Appendix C: Case History
Appendix D: Physical Examination
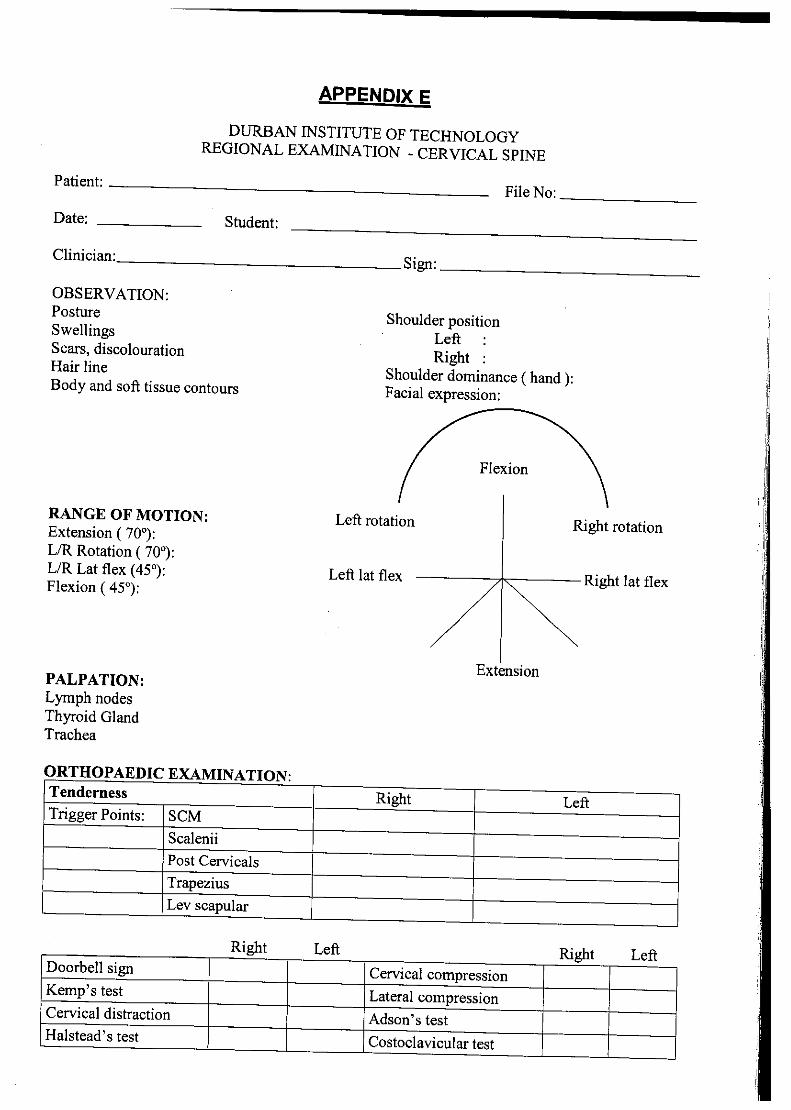
Appendix E: Regional Examination - Cervical
Appendix F: Myofascial Diagnostics Scale
Appendix G: Short form McGill Pain Questionnaire
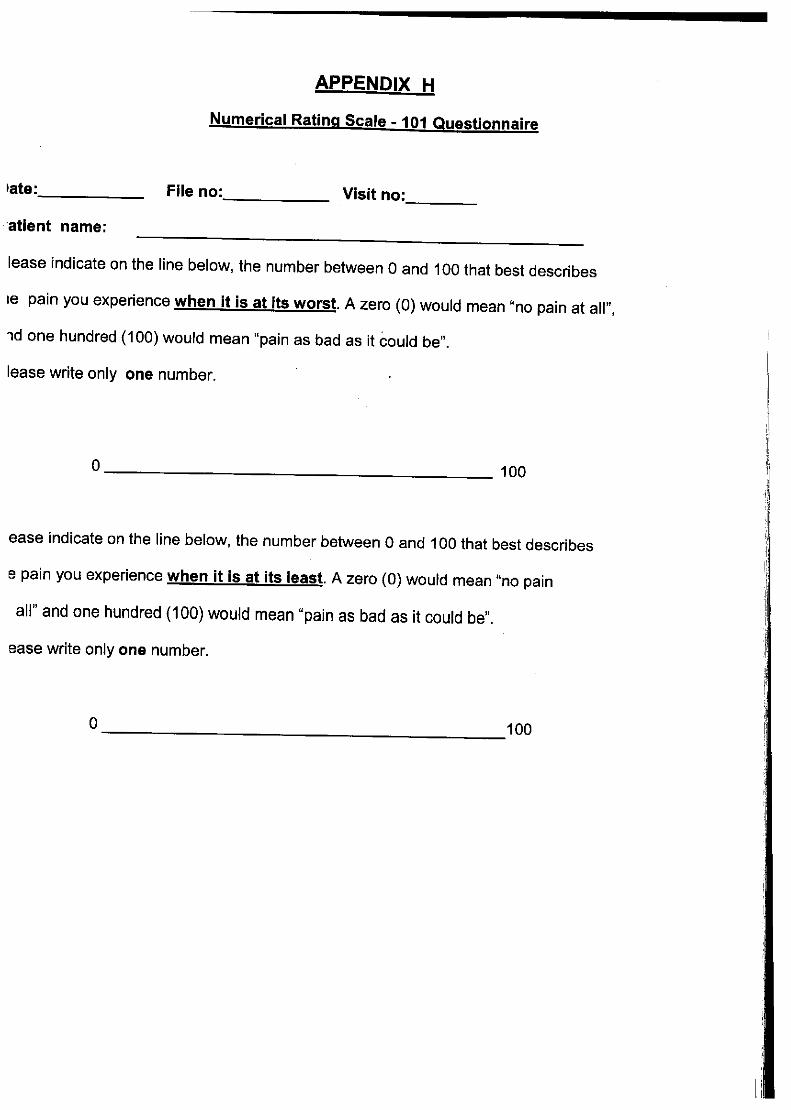
Appendix H: Numerical Rating Scale – 101 Questionnaire
Appendix I: CMCC Neck Disability Index
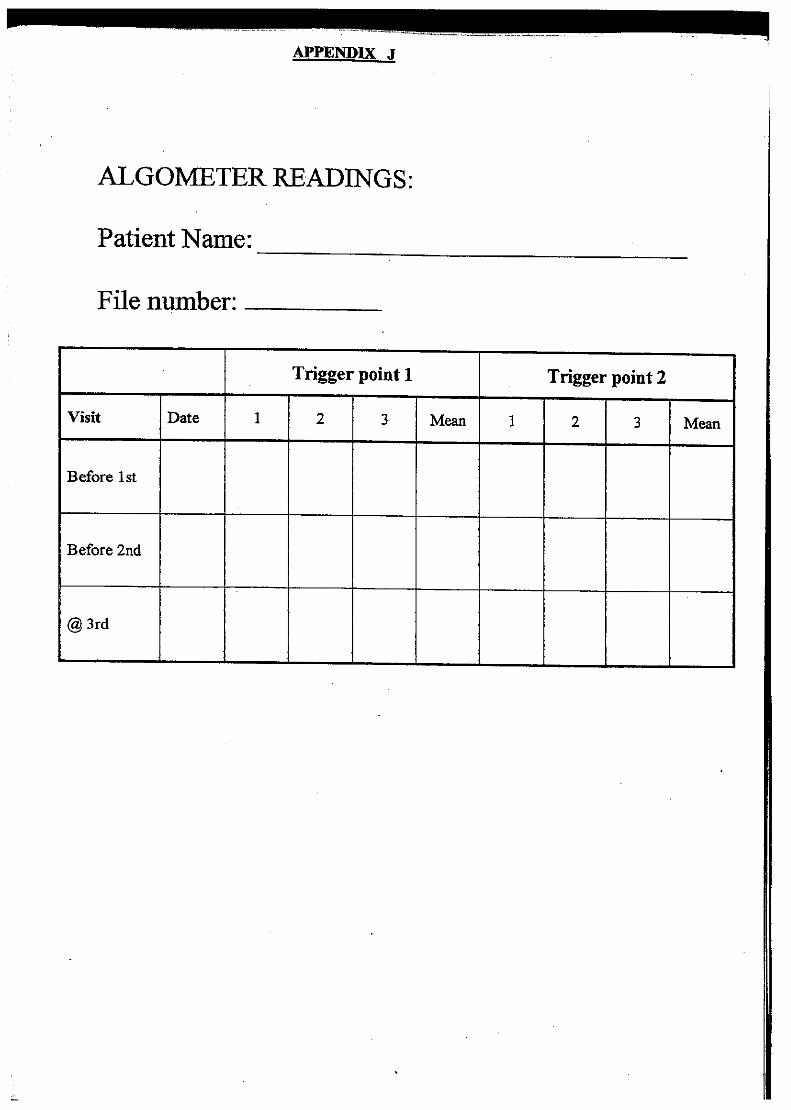
Appendix J: Algometer Readings
Appendix K: CROM Readings
Appendix L: Advertisement
Appendix P: Oscilloscope Readings
Chapter 1: Introduction
1
CHAPTER 1
INTRODUCTION
1.1 THE PROBLEM
Myofascial pain syndrome (MFPS) has been described as a common health
problem affecting a substantial portion of the population, which affects the
individual in every aspect of life (Esenyel et al. 2000; Fishbain et al. 1987).
Myofascial pain syndrome results from trigger points, which Esenyel et a.l (2000)
and Chaitow and DeLany (2002) define as a hyper-irritable location within a taut
band of skeletal muscle that is painful when compressed and can give rise to
characteristic referred pain, tenderness and tightness.
Myofascial pain syndrome encompasses the largest group of unrecognized and
under-treated acute and chronic medical disorders of muscular origin, deemed
the most overlooked cause of disability in clinical practice (Skootsky, 1989.
Auleciems,1995) This has resulted in numerous studies that have been
conducted at the Technikon Natal / Durban Institute of Technology on the
treatment of myofascial pain syndrome: Christie (1995); Hutchings (1998); Mac
Dougall (1999); Pooke (2000), and Chettiar (2001), to name a few. Despite
remarkable advances in this field, disparity still exists in the understanding,
evaluating and managing of this common musculo-skeletal condition (Bruce,
1995).
As is indicated in the research previously completed, there are several non-
invasive therapies used in the treatment of myofascial pain syndrome. One of
these is electrical stimulation (Hubbard and Berkoff, 1993). Within this category
lies faradism which is widely used in the treatment of muscular-, tendon-, joint-
Chapter 1: Introduction
2
and neuro-pathologies that cause a sustained involuntary wavelike muscular
contraction to affect the patients presenting complaint. (Greene, 2003).
Due to the similarity in the waveform of the faradic therapeutic modality (the
Transeva) in relation to the unattenuated faradic wave pattern (Appendix P) (as
used by Graham, 1893, DeFranca 1988 and Sanya 2000), it could be assumed
that the biphasic effects of faradism hold true for the Transeva. This along with
the increased use of the attenuated faradic unit (Lewis, 2003; White R, 2003;
Rawlens, 2003; Greene, 2003), indicates that this unit should be researched in
order to identify its potential uses. In addition as the review of current literature
does not show any studies that have established the efficacy of the attenuated
faradic waveform (i.e. Transeva) in the treatment of myofascial pain syndrome in
particular, this study aims to develop the clinical science related to the
management of myofascial pain syndrome, with this relatively untested
intervention such that it may be more formally investigated.
1.2 OBJECTIVES OF THIS RESEARCH
This study was to assess the efficacy of the attenuated faradic waveform (i.e.
Transeva), by evaluating the use of therapeutic faradism compared to sham
faradism and pulsed Ultrasound. This was evaluated in terms of subjective and
objective clinical findings in patients with myofascial pain syndrome of the
trapezius and levator scapula musculature.
Objective 1
The first objective of this study was to evaluate the effect of therapeutic Faradic
stimulation, sham Faradism and pulsed Ultrasound in terms of subjective clinical
findings utilizing a Short form McGill pain questionnaire (Appendix G) (Melzack,
1975), the numerical pain rating scale101 (appendix H) (Jensen et al-1986), and
Chapter 1: Introduction
3
the CMCC neck disability index questionnaire (appendix I) (Vernon and Mior,
1991)
Hypothesis 1:
The hypothesis was that the attenuated faradic current would decrease
the overall intensity of pain, from severe or moderate to mild or no pain
recorded by the Short-form Mcgill Pain Questionaire. It would record lower
readings out of 100 according to the Numerical Rating Scale-101
Questionaire; and the ability to manage everyday life would be made
easier measured by the CMCC Neck Disability Index.
Objective 2
The second objective of this study was to evaluate the effect of therapeutic
Faradic stimulation, sham Faradism and pulsed Ultrasound in terms of objective
clinical findings utilizing a digital algometer (appendix J1) (Fisher-1987) and the
CROM (appendix J2).
Hypothesis 2:
The hypothesis was that the attenuated faradic current would decrease
the pain threshold and intensity of the active Trapezius and Levator
Scapulae trigger points diagnosed, recorded by the algometer; and would
increase the cervical range of motion measured by the CROM readings of
cervical flexion, extension, lateral flexion and rotation.
Objective 3
The third objective of this study was to compare the trends that are evident
between the subjective and the objective findings in order to ascertain whether
there was any relationship between the objective and subjective results achieved
Chapter 1: Introduction
4
Hypothesis 3
The hypothesis was that the objective CROM measures would show an
increase in the patients range of motion and that the patients trigger points
were not as active as measured by the algometer readings, also that the
patients intensity of pain would be decreased according to McGill pain
Questionaire and their everyday life actions would be made easier
according to the CMCC Neck Disability index.
Rationale
The main goals of myofascial trigger point therapy are to relieve pain and spasm
of the involved muscles (Esenyl et al. 2000). Hou et al. (2002) state that despite
all research done on MFPS the clinical efficacy of treatment has not been well
established. The effects of faradism have been shown to be effective in the
treatment of MFPS (Graham, 1893; Defranca, 1988; Sanya A O, 2000), but this
is not certain due to the multiple aspects of problems diagnosed (joint and
myofascial components) and in some research, the multiple treatment
interventions used.
Further to this as, no clinical trial has been documented, a placebo- controlled
clinical study would be appropriate to establish its clinical efficacy.
Therefore the aim of this research was to evaluate the effects of treatment with
faradic stimulation on myofascial trigger points in the upper fibres of Trapezius
muscles and the Levator Scapulae muscles.
1.3 ASSUMPTIONS OF THIS STUDY
Due to the similarity in the waveform of the attenuated faradic therapeutic
modality (the Transeva) in relation to the unattenuated faradic wave pattern
(Appendix P) (as used by Graham, 1893; DeFranca 1988 and Sanya 2000), it
could be assumed that the biphasic effects of faradism hold true for the
Transeva.

Chapter 1: Introduction
5
1.4 POTENTIAL BENEFITS OF THIS STUDY
The muscle contraction-relaxation action caused by the Transeva causes an
increase not only in the arterial circulation, but at the same time aids the venous
and lymphatic return to such an extent that products of inflammation collecting in
the tissues are not allowed to become stagnant, so the prevention of adhesions
is still further assisted (Greene, 1993). This is supported by Graham who
concluded that the faradism affords the quickest means of relief after stretching
or tearing injuries to muscles (Graham, 1893). The adhesion reduction may be
related to pain relief as decreased adhesions allow for increased range of motion
and subjective improvement in ability due to the increased mobility of the muscle
within its sheath.
It is hoped that this study will provide important information with regards to the
efficacy of Faradic stimulation compared to Pulsed Ultrasound for the treatment
of myofascial syndrome, as it would provide the chiropractor or any other manual
therapist with more knowledge of simple, effective, non-invasive treatment that is
cost effective, for MFTP’s in terms of pain relief and an increase in muscle range
of motion.
In view of the fact that there is little information on the effects of treatment with
Faradism on the myofascial syndrome, it is hoped that further studies will be
conducted into the use of the Transeva on other muscular and soft tissue
conditions and comparing the Transeva to other Faradic Current types.

Chapter 2 : Literature Review
6
CHAPTER TWO
LITERATURE REVIEW
The purpose of this review of related literature is to summarise the theories and
facts surrounding myofascial pain syndrome and its treatment. Currently there is
no information available to clarify the role of the Transeva in the treatment of
myofascial pain syndromes. The following aspects were discussed: -
Myofasciitis of the Trapesius and Levator Scapula musculature in office
workers
The Transeva
Ultrasound
2.1 MYOFASCIAL PAIN SYNDROME
Muscular pain is the most common work-related injury and the second most
common cause of visits by patients to physicians (Hubbard, 1998:16).
One of the contributors to muscular pain being myofascial pain syndrome
(MFPS), which has been described as a common health problem affecting a
substantial portion of the population, which affects the individuals in every aspect
of their lives (Esenyel et al. 2000; Fishbain et al.1987). Myofascial pain syndrome
results from trigger points, which Esenyel et al. (2000) and Chaitow and DeLany
(2002) define as a hyperirritable location within a taut band of skeletal muscle
that is painful when compressed and can give rise to characteristic referred pain,
tenderness and tightness.

Chapter 2 : Literature Review
7
2.1.1 Aetiology of Myofascial Pain Syndrome
Travell and Simons (1999) explain that a “myofascial trigger point is a hyper-
irritable locus within a taut band of skeletal muscle, located in the muscle tissue
and/or its associated fascia”. The mechanical stresses which tend to cause acute
myofascial trigger points include wrenching movements, motor vehicle accidents,
falls, dislocations or a direct blow on the muscle (Travell, Simons and Simons
1999). According to Auleciems (1995) trigger points are microscopic lesions
resulting from overuse, disuse or misuse of a muscle or group of muscles.
According to Baldry (1989), the activation of trigger points may occur gradually,
for example when a muscle is subjected to repeated episodes of minor trauma or
is repeatedly overloaded. Baldry (1989) also cites unusual exercise as a main
cause of trigger point genesis. Conditions believed to perpetuate or exacerbate
the severity of myofascial pain syndrome including biomechanical stress,
nutritional inadequacies, pharmaceutical agents, metabolic and endocrine
imbalance, chronic infections and psychological factors (Chaitow and DeLany,
2002 1:45).
Due to the fact that the patients who participated in my study all worked in an
office for a minimum of three to four hours a day, according to Sauter et al.
(1991), Bergqvist et al. (1995) the following office ergonomic variables have been
isolated as potential contributors to disorders:
-Screen distance, horizontal and vertical position.
-Keyboard and mouse vertical position and distance.
-Seat height and depth.
-Relative size of back support.
-Backrest inclination.
-Resting of the wrists whilst typing.

Chapter 2 : Literature Review
8
2.1.2 Mechanisms of trigger point development
Hong and Simons (1998) proposed a hypothetical mechanism utilising
spontaneous electrical activity (SEA) as a mechanism of recording activity within
a MFTP region of taut band formation. They proposed that intracellular calcium in
certain muscle fibres may be excessively released in response to trauma or
abnormal stress. This would lead to an increase in metabolism and uncontrolled
shortening of the muscle fibres. As a result of this there is an impairment of local
blood perfusion, decreasing the amount of oxygen and nutrients to the area
which are thought to be responsible for creating a vicious cycle, which results in
a local energy crisis and the formation of taut bands (Hong and Simons, 1998).
2.2 CLINICAL FEATURES
2.2.1 Common symptoms of active myofascial trigger points:
The patient may complain of a pain ranging from a mild ache to an excruciating
pain, is either sharp or dull, and is often associated with general fatigue and a
decreased range of motion and loss of muscle strength (Han and Harrison,
1997).
Myofascial pain is often referred to a distant site from the MFTP, in a
characteristic pattern for that muscle and sometimes patients are even aware of
a numbness or paraesthesia rather than pain (Travell, Simons and Simons, 1999
1:20).
Patients often complain of disturbed sleep as a result of myofascial pain
syndrome, which can lead to a vicious cycle of in creased pain sensitivity the
following day (Travell, Simons and Simons 1999 1:21).

Chapter 2 : Literature Review
9
2.2.2 Common signs of active myofascial trigger points:
The diagnostic criteria for myofascial pain syndrome, which is outlined by
Schneider (1996) says that to diagnose myofascial pain syndrome, all 5 major
criteria should be present and at least 1 of the minor criteria.
Major criteria:
1. Regional pain complaint
2. Pain pattern follows a known distribution of muscular referred pain.
3. Palpable taut band (in accessible muscles).
4. Exquisite focal tenderness at one point or nodule within a taut
band.
5. Some restricted range of motion or muscle weakness (when
measurable).
Minor criteria:
1. Manual pressure on the MFTP nodule reproduces the chief pain
complaint.
2. Snapping palpation of the taut band at the MFTP elicits a local
twitch response.
3. Pain is diminished or eliminated by muscular treatment, e.g.
therapeutic stretch, ischemic compression or needle injection of the
MFTP.
These criteria are principally assessed by palpation of the affected muscles. The
application of a sustained deep pressure is the method used most frequently in
the diagnosis of MFTP’s. When MFTP’s are palpated, the pain is either
concentrated in the trigger point area or along that muscles distinct referral
pattern, which is constant, reproducible, and does not follow a dermatomal or
nerve distribution (Han and Harrison, 1997).
Chapter 2 : Literature Review
10
2.2.3 Findings on examination and diagnosis:
The criteria for diagnosis of myofascial trigger points have been based on the
criteria described by Chettiar (2001) and patients were only accepted into the
study if their initial score was 17 or more. The Myofascial Diagnostic Scale
(appendix F) was designed to assess the extent to which the patient is suffering
from myofascial pain syndrome via a rating of the patient’s symptoms. Even
though the myofascial diagnostic scale as developed by Chettiar (1999) has not
yet been validated, it is the only standardised tool that can be used to
consistently measure changes in trigger points.
For the purposes of this research, the palpatory diagnosis had been utilised as
the above techniques have validated the palpatory diagnosis as a reliable and
valid method of patient assessment in respect of myofascial pain syndrome
(Hsieh et al. 2000).
2.3 Treatment of myofascial trigger points
Aulciems (1995) found that when effectively managed, active myofascial trigger
points have an excellent prognosis and although myofascial trigger point pain
syndrome is usually not curable, it is well controllable.
As a result of a vast amount of research, a large number of different treatments
have been shown to be clinically effective in the treatment of MFTP. These
treatments include amongst others
- Ischemic compression (Mance et al. 1986),
- Myofascial manipulation (Nook, 2000),
- Spray and stretch (Han and Harrison, 1997: 97),
- Ultrasound (Gam et al, 1998:73),
- Transcutaneous electrical nerve stimulation (Han and Harrison, 1997:97),
Chapter 2 : Literature Review
11
- Dry needling (Hong and Simons 1998:256) and
- All Neuromuscular techniques (Chaitow and DeLany, 2003).
2.3.1 The Transeva
The attenuated faradic current produced by the “Transeva” is a short duration
interrupted direct current with a pulse duration of 0.1 -1.0 units and a frequency
of 50-100 Hz. It is surged to produce a near- normal tetanic-like contraction and
relaxation of the muscle (Forster and Palastanga, 1990).When a muscle
contracts as a result of electrical stimulation, the changes taking place within the
muscle are similar to those associated with voluntary contraction. There is
increased metabolism, with a consequent increase in demand for oxygen and
foodstuffs and an increased output of waste products, including metabolites. The
metabolites cause dilatation of capillaries and arterioles and there is a
considerable increase in the blood supply to the muscle (Foster and Palastanga,
1990). As the muscles contract and relax they exert a pumping action on the
veins and lymphatic vessels lying within and around them. The valves in these
vessels ensure that the fluid they contain is moved towards the heart and if the
muscle contractions are sufficiently strong to cause joint movement this also
exerts a pumping effect. There is thus increased venous and lymphatic return
(Foster and Palastanga 1990). This is supported by Greene (2003) who states
that there are many methods of increasing the arterial supply to any particular
part, but unless that method improves the return circulation via the veins and
lymphatics to the same degree, it might even produce a greater congestion and
so result in a diminution of the local circulation and so retard the process of
healing (Greene, 1993).
This muscle action caused by the Transeva causes an increase, not only in the
arterial circulation, in the venous and lymphatic return to such an extent that
products of inflammation collecting in the tissues are not allowed to become
stagnant, so the prevention of adhesions is still further assisted. This is

Chapter 2 : Literature Review
12
supported by Graham who concluded that the faradism affords the quickest
means of relief after stretching or tearing injuries to muscles (Graham, 1893).
The adhesions may be related to pain relief as decreased adhesions allow for
increased range of motion and subjective improvement in ability due to the
increased mobility of the muscle within its sheath.
The term faradism was originally used to signify the type of current produced by
a faradic coil, which is a type of induction coil (Forster and Palastanga, 1990).
Faradic current lost its appeal because it was a rather painful procedure in the
past, but due to modern advancement in recent years, that negate the pain
problem, it has now been developed as a therapeutic modality called the
Transeva.
The effects of treatment by rhythmic muscular contractions of the Transeva can
thus be summarised as follows (Greene, 1993):
1. Muscle elasticity, irritability and contractility (i.e. muscle tone), are rapidly
restored to normal.
2. An increase in blood is brought to the muscles and to neighbouring tissues
with all the attendant beneficial physio-chemical consequences.
3. Waste tissue products are rapidly cleared away and stagnation of lymph,
with its serious sequelae, is prevented.
4. A large supply of oxygen and nourishment is brought to the injured part.
5. Rapid absorption of fluid and extravagated blood and lymph is actively
promoted
6. Beneficial chemical and physical changes after muscle activity take place.
7. The movements of muscle do not allow organisation of lymph to take
place between their surfaces and thus the danger of adhesions is
minimised.
8. As the movements do much to prevent stagnation of lymph in areolar
tissue in the joint interspaces, the danger of the areolar tissue losing the
suppleness and flexibility necessary for efficient joint action is diminished.

Chapter 2 : Literature Review
13
9. If adhesions have formed in the muscles and peri-articular tissues, the
adherent surfaces are gently and gradually torn apart by causing
increasingly powerful contractions of the muscles.
10. Muscles are prevented from wasting, particularly if treatment is given soon
after the injury. Muscles already wasted increase in bulk.
11. No attempt is made to cut short the process of inflammation, but to guide
and control the process.
2.3.2 Pulsed Ultrasound
Gam et al. (1998) reported that ultrasound therapy has achieved recognition as a
suitable method in physical medicine to treat acute and chronic muscular-skeletal
disorders. Ultrasound treatment involves the use of high frequency acoustic
energy that is generated using the reverse piezo-electric effect (Esenyel et al.
2000). The biophysical effects resulting with the interaction of ultrasound with
tissue are grouped into two categories
- Thermally induced therapeutic effects
These are attributed primarily to heating and are proposed by Lehman and de
Lateur (1990) and Kitchen and Bazin (1996), to include the following:
The increased extensibility of collagen-rich structures such as tendons
and joint capsules.
A decrease in joint stiffness.
A reduction in muscle pain and spasm.
The production of a mild inflammatory reaction, inducing a marked
increase in blood flow, which helps in the resolution of chronic
inflammatory process.

Chapter 2 : Literature Review
14
- Non thermal effects
According to Hogan et al. (1982) examples of therapeutically significant non-
thermal benefits of ultrasound include:
Stimulation of tissue regeneration.
Soft tissue repair.
Improved blood flow in chronically ischaemic tissue.
Stimulation of protein synthesis
This has been refined by Kitchen and Bazin (1996), who postulate that the non-
thermal effects of ultrasound produce certain phenomena. Cavitation occurs
when ultrasound produces micro-sized gas bubbles within the tissues that
vibrate, increasing the permeability of the cells to various ions, especially calcium
which increases the activity of the cells. The other phenomenon is that the
unidirectional activity of the ultrasound waves causes high velocity gradients next
to boundries between fluids and structures. This causes increased permeability
of cell membranes, increased protein synthesis, increased uptake of calcium by
the cells and increased production of growth factors by macrophages. All these
effects account for the acceleration of repair following ultrasound therapy.
Therapeutic benefits of the Pulsed waveform of ultrasound seem to be immediate
and better sustained over the treatment period as opposed to continuous
ultrasound (Pillay, 2003).
Therefore Reid (1992) states that due to the ease of application of therapeutic
ultrasound together with its accessibility, it is used and will continue to be used
by physical therapists, athletic therapists, podiatrists and chiropractors.
Nonetheless Reid (1992) states that the lack of adequate studies in this area has

Chapter 2 : Literature Review
15
been a constant theme and is disappointing.
2.3.3 Placebo (sham Transeva):
Placebo is defined as a “dummy treatment” administered to the control group in a
controlled clinical trial in order that the specific and non-specific effects of the
experimental treatment can be distinguished (Dorland and Newman, 1998). In
the case of this research the placebo group will receive sham faradism.
The significance of the placebo group was to provide a control to negate the non-
specific effects of treatment.
2.4 Compendium of muscles
The Trapezius Muscle:
The Trapezius muscle is divided into the upper, middle and lower sections, with
trigger points occurring most commonly in the upper Trapezius (Travell and
Simons, 1999). Sola et al. (1981) and Bruce (1995) also concluded that the
upper Trapezius is the muscle most commonly affected by myofascial trigger
points. For the purpose of this study, the active trigger points diagnosed in either
Trapezius TP1 or TP2 and / or the Levator Scapula TP1 or TP2, where treated.
The following information on the upper Trapezius and Levator Scapula regarding
anatomical attachments, trigger point location and referral pain patterns and
innervation are according to Travell and Simons (1999:278), and Chaitow and
DeLany (2003:320-329)
Attachments:The upper fibres of the Trapezius muscle attach superiorly to the
middle third of the superior nuchal line attaching to the midline of the ligamentum

Chapter 2 : Literature Review
16
nuchae and to the spinal processes of the first to fifth cervical vertebrae. Distally
the fibres converge latterly attaching to the outer third of the clavicle.
Trigger point location:
TP1 is located in the upper free margin of the Trapezius superiorly to both the
supraspinatus muscle and the apex of the lung, while TP2 is located caudal and
posterior to the free border of the upper Trapezius superior to the upper border of
the Scapula.
Referral Pain Pattern:
TP1 characteristic pain is severe posterolateral neck, a temporal headache
centering to the orbit. Less common presentations include referred pain to the
angle of the ipsilateral jaw, molar teeth and pinna of the ear, mimicking dental
pain. TP2 is not associated with headaches and the pain is restricted to the
posterior neck, stopping at the mastoid.
Innervation:
The muscle is innervated by the spinal division of the XI cranial nerve, which
supplies mainly motor fibres, the second to fourth cervical nerves supply mainly
sensory fibres to the muscle.
The Levator Scapula Muscle
The Levator Scapula muscle is one of the most commonly involved shoulder-
girdle muscles, with respect to Myofascial Pain (Travell, Simons and
Simons,1999 1:491). Trigger points within this muscle develop in two locations, a
primary trigger point at the angle of the neck, where the muscle emerges
beneath the anterior border of the upper Trapezius, and a second trigger point
just above the muscle’s attachment to the superior angle of the Scapula. (Travell,
Simons and Simons, 1999 1:491).

Chapter 2 : Literature Review
17
Attachments:
This muscle attaches above to the Transverse processes of the first four cervical
vertebrae, and attaches below to the medial Scapular border between the
superior angle and the medial end of the spine of the Scapula.
Referred pain:
From these trigger points pain is concentrated at the angle of the neck, with
some spill over pain along the vertebral border of the Scapula. Involvement of
this muscle results in a stiff neck that consistently limits neck rotation due to pain.
Innervation:
This muscle is supplied by the branches of the third and fourth cervical nerves
via the cervical plexus and sometimes by fibres from the dorsal Scapular nerve
derived from C5 root.
2.5 Conclusion
With reference to the fact that myofascial pain syndrome is a common problem
and seems to affect the Trapezius and Levator Scapula muscles most
commonly, it is reasonable that an effective form of treatment is necessary.
Therefore in order to assess the efficacy of the attenuated faradic waveform (i.e.
Transeva) in order to assess its ability to treat myofascial pain syndromes, this
study evaluated the use of therapeutic faradism compared to sham faradism and
pulsed ultrasound in terms of subjective and objective clinical findings in patients
with myofascial pain syndrome of the Trapezius and Levator Scapula
musculature.

Chapter 3 : Research Design and Methods
18
Chapter3
Research Design and Methods
3.1 Study Design
This study was a quantitative pilot Placebo- controlled clinical trial.
The purpose was to compare and evaluate the efficacy of the modified faradic
current in the form of the Transeva, in terms of subjective and objective clinical
findings, for the treatment of Myofascial Pain Syndrome.
3.2 Advertising
Advertisements (APPENDIX L) were placed on office notice boards, at gymnasia,
in local newspapers and on the DIT Campus which informed the public of the
study. The study was limited to those patients presenting to the chiropractic clinic
at the Durban Institute of Technology in response to advertisements or referrals.
Patients were obtained via advertising in the form of pamphlets and posters (see
Appendix L), or by referrals.
3.3 Sample selection
As a result of the advertising process, a non-probability convenience sampling
technique was applied to this study.
Chapter 3 : Research Design and Methods
19
3.4 Sample size
This study involved 60 patients divided into 3 groups. There were 20 patients in
group A and 20 patients in group B and 20 in group C.
3.5 Sample allocation
Once accepted into the study, each patient was randomly assigned to a
treatment group (either group A for the Transeva treatment, group B for Placebo
treatment in the form of sham faradic current (Transeva), or group C for the
pulsed Ultrasound treatment). This included selection by assigning consecutive
patients who presented to the clinic into either Group A, Group B or group C by
means of drawing out of a hat.
3.6 Research - Patient procedure
Telephonic interview: Patients were required to initially contact the
chiropractic department telephonically in order to find out if they met the study
requirements.
Telephonically they were asked:
- Their age.
- What type of work they did.
- Questions pertaining to the exclusion criteria.
If they met the inclusion criteria they were told briefly what the study was
about and what was required of them.

Chapter 3 : Research Design and Methods
20
Patient assessment:
Once patients met the telephonic requirements, the prospective patients were
invited to attend a consultation at the Chiropractic Clinic, where they were
screened to determine if they met the studies’ inclusion criteria. This was
achieved if a positive diagnosis of myofascial pain syndrome of the Trapezius
or Levator Scapular muscles was made by the researcher based on a case
history (APPENDIX C), a physical examination (APPENDIX D) and regional
examination (APPENDIX E) of the cervical spine and neck musculature in
order to determine if they were eligible for the study. The patients then had to
read the letter of information (APPENDIX A) and then sign the letter of
consent (APPENDIX B) before they were allowed to participate.
The assessment ensured that the patient was accepted into the study on the
basis of the following criteria:
3.7 Inclusion and exclusion criteria
a. Inclusion criteria
1.Patients of either gender had to be between the ages of 30 and 50.
Individuals of either sex and of any age can develop myofascial Trigger
points (Travel and Simons, 1999), but patients between the ages of 30 to
49 are more commonly plagued by the condition, which then decreases
with age (Han and Harrison, 1997:90). With advancing age follows
reduced activity and the stiffness and reduced range of motion become
more prominent factors in trigger point presentation (Travell Simons and
Simons, 1999 1:13).
2. Patients had to have a trigger point in either their Trapezius or Levator
Scapulae muscles. These muscles were selected for inclusion as
myofascial trigger points are common in the postural muscles of the neck

Chapter 3 : Research Design and Methods
21
and shoulder (Gatterman, 1990:285; Hubbard, 1998:18; Travel and
Simons, 1999 1:279, Sciotti et al. 2000:259 and Chaitow and DeLany,
2002:21)
3. The criteria for diagnosis of myofascial trigger points was based on the
criteria described by Chettiar (1999) and patients were only accepted into
the study if their initial score was 17 or more. The Myofascial Diagnostic
Scale (appendix F) was designed to assess the extent to which the patient
was suffering from myofascial pain syndrome via a rating of the patient’s
symptoms. Even though the myofascial diagnostic scale as developed by
Chettiar (1999) had not yet been validated, it was the only standardised
tool that could be used to consistently measure changes in trigger points.
4. Patients needed to sign an informed consent (APPENDIX B) and read
the letter of information (APPENDIX A) before inclusion into the study.
b. Exclusion criteria:
1. Patients taking any form of medication that would influence the results of
the study ie. Analgesics, muscle relaxants, non-steroidal anti-inflammatory
druds or steroids. A washout period of 48hours, recommended by Poul et
al. (1993), would be applied.
2. Any patients outside the ranges 30 to 50 years of age (see in inclusion
criteria).
3. Individuals with fresh fractures, to avoid unwanted motion; active
haemorrhage; phlebitis; and cardiac pacemakers were excluded from the
study (Kahn, 1994: 76).

Chapter 3 : Research Design and Methods
22
4. Patients who had received any faradic treatment in the past three months,
to ensure maximal naivety of the participating patients and to ensure that
the Placebo treatment was not perceived as a sham (Mouton, 1996).
5. Patients were asked to refrain from any other treatment protocol for
MFPS, including drugs and manual interventions (Poul et al. 1993). They
were also expected not to alter their current lifestyle or to enter into any
new activity. All patients were instructed not to ice, stretch or rub the
muscles treated after the treatment and during the duration of the study.
3.8 Location and diagnosis of the Myofascial Trigger Points’ of
the Upper Trapezius Muscle and Levater Scapula Muscle
Travell, Simons and Simons (1999) discuss two main regions for the
presence of MFTP’s, as found in the upper Trapezius muscle fibres,
namely MFTP 1 and MFTP 2 and in the Levator Scapular muscle fibres
namely MFTP 1 and MFTP 2.
Trapezius MFTP 1 is located by pincer palpation of the free margin of the
upper Trapezius muscle, approximately midway between the spinous
processes and the acromion, in the anterior fibres.
Referred pain from this MFTP is unilateral, along the posterior aspect of
the neck to the mastoid process. When severe, this pain may extend to
the side of the head and temple as well as the back of the orbit, it may
include the angle of the jaw. It is a common cause of tension neck ache
and temporal headaches (Travell, Simons and Simons, 1999 1:278).

Chapter 3 : Research Design and Methods
23
Figure 1: Illustration showing Trapezius MFTP 1 with referral pain
pattern
(Shacksnovis, 2005)
Trapezius MFTP 2 is located close to MFTP1, but is slightly posterior and
inferior, just caudal to the free border of the upper Trapezius.
Palpation of this trigger point is performed in a similar manner as for
MFTP1, but larger patients may require flat palpation. Referred pain from
this MFTP also lies posterior to that of MFTP1, blending with its distribution
behind the ear (Travell, Simons and Simons 1999 1:278).

Chapter 3 : Research Design and Methods
24
Figure 2: Illustration showing Trapezius MFTP 2 with referral pain
pattern
(Shacksnovis, 2005)
Levator Scapula MFTP 1
This is a primary trigger point at the angle of the neck, where the muscle
emerges beneath the anterior border of the upper Trapezius
Levator Scapula MFTP 2
A second trigger point just above the muscles’ attachment to the superior angle
of the scapula. (Travell,Simons and Simons,1999).
Referred pain from these Levator Scapula trigger points is concentrated at the
angle of the neck, with some spill-over pain along the vertebral border of the
scapula. Involvement of this muscle results in a stiff neck that consistently limits
neck rotation due to pain.

Chapter 3 : Research Design and Methods
25
In addition to the location and the referred pain pattern, the following criteria
were utilised in order to determine the presence of the above MFTP’s. The
criteria for diagnosis of myofascial trigger points had been based on the
criteria described by Chettiar (1999) and patients were only accepted into
the study if their initial score was 17 or more. The Myofascial Diagnostic
Scale (appendix F) was designed to assess the extent to which the patient
is suffering from myofascial pain syndrome via a rating of the patient’s
symptoms.
3.9 Interventions
GROUP A:
According to Forster and Palastanga (1990), the faradic current is a short
duration interrupted direct current with a pulse duration of 0.1-1ms and a
frequency of 50-100 Hz. Due to the similarity in waveform of the Transeva in
relation to the unattenuated faradic wave pattern, it could be assumed that
the biphasic effects of faradism hold true for the Transeva.
Therefore Group A patients received faradic treatment for 20 minutes with a
pulse duration of 0.1-1ms and a frequency of 50-100 hz (Forster and
Palastanga,1990). The patient, after passing a full sensory neurological
examination including a sharp-blunt and light-crude touch test with their eyes
closed, was positioned prone lying with the saline-soaked negative pad
placed under their thighs. The area to be treated had Ultrasound gel applied
as a transmission medium for the faradic current. The mobile electrode was
moved from place to place over the lubricated treatment area until the hand
holding the mobile electrode felt the muscular contraction. Bony prominences

Chapter 3 : Research Design and Methods
26
were avoided and the surge control was then adjusted to give about 90-100
contractions per minute. As the patient became accustomed to this degree of
muscular contraction, usually one to two minutes, the intensity was increased,
but always slowly to the amount desired to induce muscular contraction.
During treatment the mobile electrode always remained in full contact with the
skin, but the electrode was moving all the time. It could not be strapped in
one place therefore preventing a large number of consecutive contractions to
those muscles with myofascial trigger points in the area. The duration of the
treatment was 20 minutes. At the conclusion of the treatment, the intensity
was reduced gradually to zero. The machine was then switched off (Greene,
1993).
Group B:
Patients falling into group B of the study received Placebo treatment in the
form of sham faradic current over the Trapezius and Levator Scapula
musculature. Each patient was prepared and positioned as if receiving
legitimate faradism. The patients were at no time given any indication that the
treatment they received was Placebo.
Group C:
These patients received Pulsed Ultrasound treatment over the Trapezius and
Levator Scapula musculature after passing a sensory neurological
examination, including a hot-cold and sharp-blunt test with their eyes closed.
The patients were at no time given any indication that the treatment they
received was Ultrasound, Therapeutic Faradism (Transeva) or Placebo
Transeva. Ultrasound gel was used as a transmission medium between the
skin overlying the affected area and the Ultrasound head. The unit intensity
was set at 1.2 w/cm2 and the duration of treatment was 6 minutes as it was

Chapter 3 : Research Design and Methods
27
administered manually on the body surface (Kitchen and Bazin, 1996; Kahn,
1994).
Ultrasound has been used successfully in various research studies done
at the DIT (Van Lingen, 1998; Du Plessis, 2002; Gray,2002;
Pillay, 2003) to establish clinical efficacy of an outlined protocol. The treatment
procedure for the Ultrasound and the Transeva is similar in that they both use a
mobile electrode over the body surface with a lubricant gel. This contributes to
the effects of a single-blind study.
3.10 Intervention frequency
Group A, B and C received two treatments with a maximum of 72 hours in-
between each treatment. As no research has been done to establish the number
of treatments that are required for a patient with myofascial pain syndrome to
respond to the Transeva, I used the advice from Greene (2003) who mainly uses
the Transeva for her treatments as a physiotherapist for any muscular pain.
3.11 Measurement tools
a. Subjective measurements:
1. Short form McGill pain questionnaire(S-F MPQ) (APPENDIX G) was used, as
this is easy to understand and quick to use and it provides information on the
sensory, affective and overall intensity of pain according to Melzack (1975). It
consists of 15 descriptors of pain, rated on an intensity scale as 0=none,
1=mild, 2=moderate or 3=severe, and it provides information on the sensory
affective and overall intensity of pain (Melzack, 1975). The S-FMPQ was
Chapter 3 : Research Design and Methods
28
chosen as a measurement for this study as it is sensitive, quick to administer
and easy to understand by patients. On completion of the questionnaire, the
points are added up to form a final maximum score out of 45 for each
consultation.
2. A Numerical pain rating scale (NPRS) (APPENDIX H) was also used which
asks the patient to rate their pain intensity on a numerical scale of 0 – 100. In
a study of by Jensen et al. (1986), comparing 6 methods on 75 chronic pain
patients, the NRS was deemed the most practical index to use for its
simplicity and ease of administration. The two scores were added together
and then averaged. The NRS is a scale that asks the patient to rate their pain
intensity out of 100 where 0= the least amount of pain and 100= the most
amount of pain. This is a practical index to use, as it is easy to administer and
score (Jensen et al.1986). On completion of the scale, the mean score of the
least and the worst was found by adding them together.
3. The CMCC Neck Disability Index was used to show subjective information
regarding the extent to which the patient’s lifestyle was affected by the pain
experienced. The questionnaire was developed by Vernon and Mior (1991),
and in a study of its reliability and validity, it was found to demonstrate a high
degree of test-retest reliability and internal consistency. The CMCC Neck
Disability Index consists of ten sections dealing with different aspects of the
patients’ lifestyle. Each section had six options, with the first scorring “0” and
the next five increasing progressively by a value of “1” to a maximum of “5”.
All the scores were added together and were expressed out of the maximum
score (50). These questionnaires were completed at the initial, second and
third follow-up consultations so that any improvements in the condition could
be recorded and assessed.

Chapter 3 : Research Design and Methods
29
b. Objective measurements
1. Pressure algometer - Wagner FDK20 Force Dial (Wagner Instuments, P.O.
Box 1217, Greenwich, CT, 06836, U.S.A.).
Algometer readings (APPENDIX J1) were taken to measure changes in
pressure pain threshold for each patient over the course of each of the
research treatments. This form of measurement has been proven to be
useful for the assessment of treatment results (Fischer, 1987:207).
The procedure according to Fischer (1987):
- The dial on the gauge was set to zero.
- The disc was placed on the point of maximum
sensitivity.
- Pressure was increased at 1kg/cm2/sec.
- The patient was asked to indicate by saying “yes” at the
point where the pain was first perceived.
- The pressure was stopped at this point and a reading was
taken.
According to Reeves et al. (1986), as quoted by Han and Harrison
(1997), pressure algometry is a diagnostic tool used to quantify the
pressure pain threshold for each patient over the course of each
treatment. This is the measurement of minimum pressure that
induces pain, which is useful in the assessment of the results and is
a reliable tool for quantifying MFTP sensitivity (Reeves et al. 1986,
Fischer 1987 and Han and Harrison 1997).
Chapter 3 : Research Design and Methods
30
Algometer readings are to be taken to measure changes in
pressure pain threshold for each patient over the course of
research treatments. This form of measurement has been proven to
be useful for the assessment of treatment results (Fischer
1987:207)
2. The CROM:Cervical Range of Motion Instrument (Performance
Attainment Associates; Patient no. 4,777,965 & 4,928,709) is a device
with a magnetic yoke and gravity goniometers which measure the cervical
range of motion in the frontal and sagittal planes. Research by Youdas et
al. (1991) concluded that after testing 337 subjects that inter tester and
intra tester reliability using the CROM device were accurate to an intra
class coefficient of greater than 80. CROM readings included flexion,
extension, rotation and lateral flexion as these ranges of motion were
influenced by the Trapezius and Levator Scapula musculature.
c. Measurement frequency:
Measurements (both subjective and objective) of the patients were taken
prior to each of the two treatments and at the third follow up.

Chapter 3 : Research Design and Methods
31
Plates 1(left) and 2(right): Demonstration of patient/practitioner for palpation of trigger points in the upper fibres of Trapezius Muscle by pincer palpation (plate 1) and trigger points in the Levator Scapula Muscle by flat palpation (plate 2)

Chapter 3 : Research Design and Methods
32
Plate 3: Demonstration of patient/practitioner for the Transeva/ Transeva Placebo treatment of the upper fibres of Trapezius muscle.
: Plate 4: Demonstration of patient/practitioner for the Ultrasound treatment of the upper fibres of Trapezius muscle in seated (plate on right), and prone (plate on left) position

Chapter 3 : Research Design and Methods
33
3.12 Statistical analysis
Statistical Analysis was conducted using the SPSS (version 11.5) software suite.
This Statistical software program was manufactured by SPSS Inc, 444N.
Michigan Avenue, Chicago, Illinois, USA. Various descriptive and inferential
statistical techniques were used. The descriptive procedures used were various
tables and graphs and a few summary statistics including but not limited to
means, proportions and percentages. Inferential Statistics included various
Hypothesis-testing techniques. Due to the size of our samples, namely 20 in
each group, we used non-parametric Statistical Tests. All our tests were set at
our type 1 error at 5%, or mentioned differently = 0.05. If our p value as
reported was less than 0.05 we declared a significant result and our Null
Hypothesis was rejected.
Objective (Intra Group Tests)
We had 2 objective and 3 subjective measurement scales. For each type of
scale we conducted a Freidmann Test to test for a significant difference in
population means between all three readings. If these tests proved to be
significant they were followed up by multiple Wilcoxon Test for matched pairs.
The former test was revealed if there was a significant difference between any of
our 3 means and the latter indicated where that significant difference occurred.
The above analysis was conducted for all three treatment groups.

Chapter 3 : Research Design and Methods
34
Objective 1 (Inter Group Tests)
We calculated the different values between all readings, for each subjective
measurement scale within each group. These common differences were then
compared across groups per each measurement scale using the Kruskal Wallis,
which allowed one to test for significant differences in population mean
differences between all three groups. If these tests proved to be significant they
were followed up by various Mann Whitney U -Tests. The former test revealed if
there was a significant difference between any of our 3 means and the latter
indicated where that significant difference occurred.
Objective 2 (Inter Group Tests)
We calculated the different values between all readings, for each objective
measurement scale within each group. These common differences were then
compared across groups for each measurement scale using the Kruskal Wallis,
which allowed one to test for significant differences in population mean
differences between all three groups. If these tests proved to be significant they
were followed up by various Mann Whitney U –Tests. The former test would
reveal if there was a significant difference between any of our 3 means and the
latter indicated where that significant difference occurred.

Chapter 4 : Results and Discussion of Results
35
Chapter 4 Statistical report
4.1 Introduction
This chapter involved the results and discussion of demographic data as well as
the results and discussion of the statistical analysis of the subjective and
objective data. These were further evaluated in terms of intra- and inter-group
comparisons.
Evaluation of the intra-group results between the first and third consultations
(overall measurement interval) gave an indication of the overall effectiveness of
the treatment regime. Evaluation of the results between the first and second
consultations gave an indication of the initial effectiveness of the treatment
regimen, whilst evaluation of the results between consultations two and three,
gave an indication of the progression of the treatment regimen.
Evaluation of inter-group results of the first consultation revealed any variance in
the subjective and objective findings between the three groups presenting at the
start of the study. Similar evaluation at consultations two and three revealed any
difference in the overall improvement as well as the rate of improvement between
the three groups.
KEY: CMCC CMCC Neck Disability Index NPRS Numerical pain rating scale (APPENDIX H ) SFMQ Short Form Mc Gill Questionaire CROM Cervical range of motion ALG Algometer readings GROUP A Transeva treatment GROUP B Placebo Transeva GROUP C Pulsed Ultrasound treatment

Chapter 4 : Results and Discussion of Results
36
4.2 Descriptive Statistics : Group A
Gender
Female
30%
Male
70%
Figure 3: Sample Segmentation of Gender. Statistics for Pie Chart above: Male=14 and Female=6.
Descriptive Statis ticsa
20 30.00 49.00 38.9000 6.91223
20
AGE
Valid N (lis tw ise)
N Minimum Maximum Mean Std. Deviation
GR = 1.00a.
Table 4.0 Descriptive Statistics for Age.
Chapter 4 : Results and Discussion of Results
37
Race
Asian
15%Coloured
0%
White
80%
African
5%
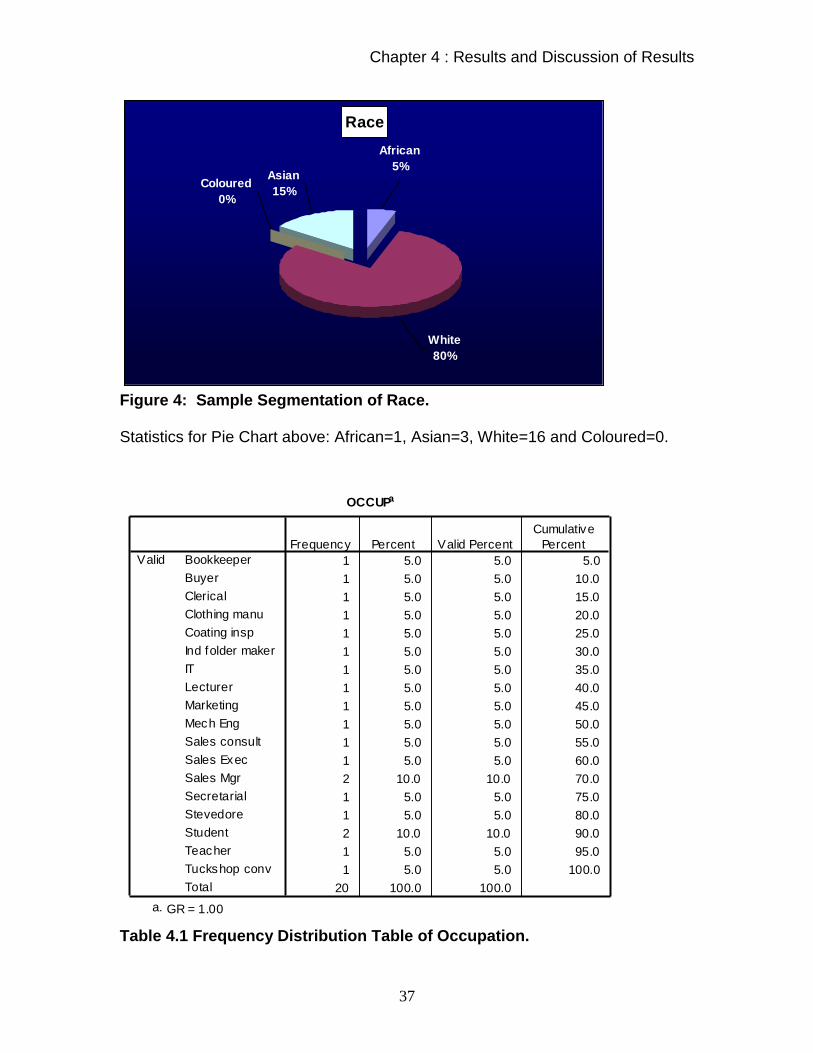
Figure 4: Sample Segmentation of Race. Statistics for Pie Chart above: African=1, Asian=3, White=16 and Coloured=0.
OCCUPa
1 5.0 5.0 5.0
1 5.0 5.0 10.0
1 5.0 5.0 15.0
1 5.0 5.0 20.0
1 5.0 5.0 25.0
1 5.0 5.0 30.0
1 5.0 5.0 35.0
1 5.0 5.0 40.0
1 5.0 5.0 45.0
1 5.0 5.0 50.0
1 5.0 5.0 55.0
1 5.0 5.0 60.0
2 10.0 10.0 70.0
1 5.0 5.0 75.0
1 5.0 5.0 80.0
2 10.0 10.0 90.0
1 5.0 5.0 95.0
1 5.0 5.0 100.0
20 100.0 100.0
Bookkeeper
Buyer
Clerical
Clothing manu
Coating insp
Ind folder maker
IT
Lecturer
Marketing
Mech Eng
Sales consult
Sales Exec
Sales Mgr
Secretarial
Stevedore
Student
Teacher
Tuckshop conv
Total
Valid
Frequency Percent Valid Percent
Cumulative
Percent
GR = 1.00a.
Table 4.1 Frequency Distribution Table of Occupation.
Chapter 4 : Results and Discussion of Results
38
Group B
Gender
Female
75%
Male
25%
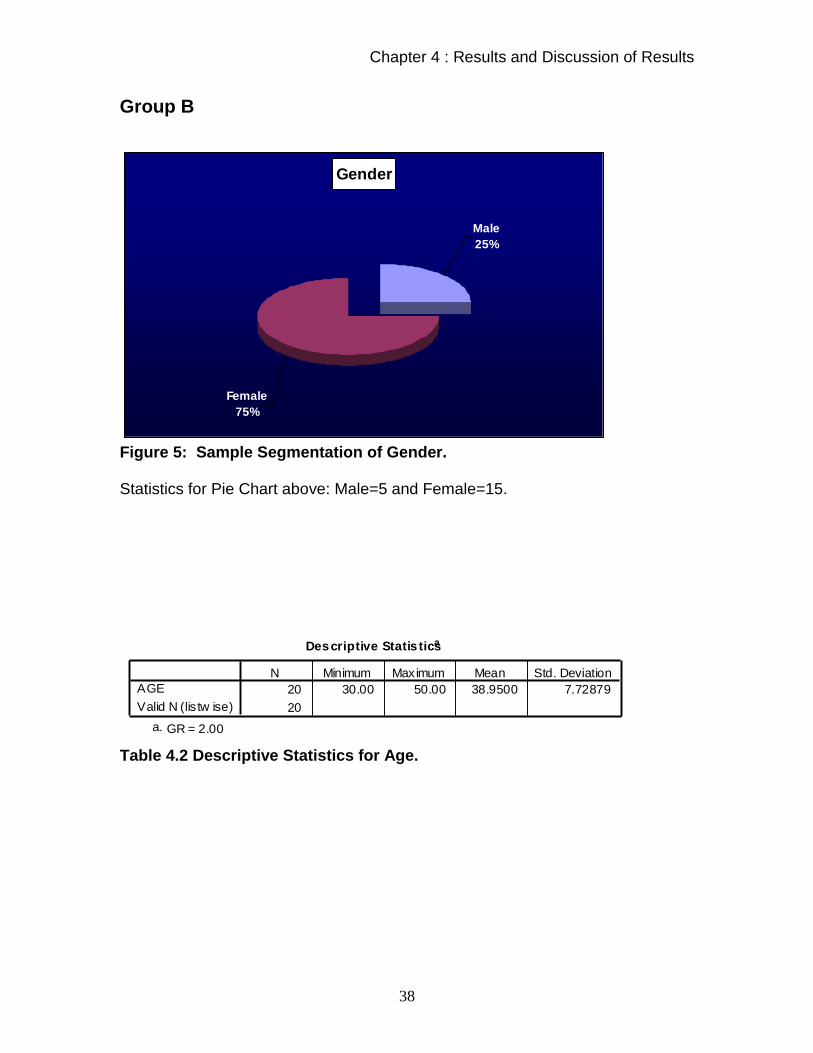
Figure 5: Sample Segmentation of Gender. Statistics for Pie Chart above: Male=5 and Female=15.
Descriptive Statis ticsa
20 30.00 50.00 38.9500 7.72879
20
AGE
Valid N (lis tw ise)
N Minimum Maximum Mean Std. Deviation
GR = 2.00a.
Table 4.2 Descriptive Statistics for Age.
Chapter 4 : Results and Discussion of Results
39
Race
Asian
30%
Coloured
0%White
70%
African
0%
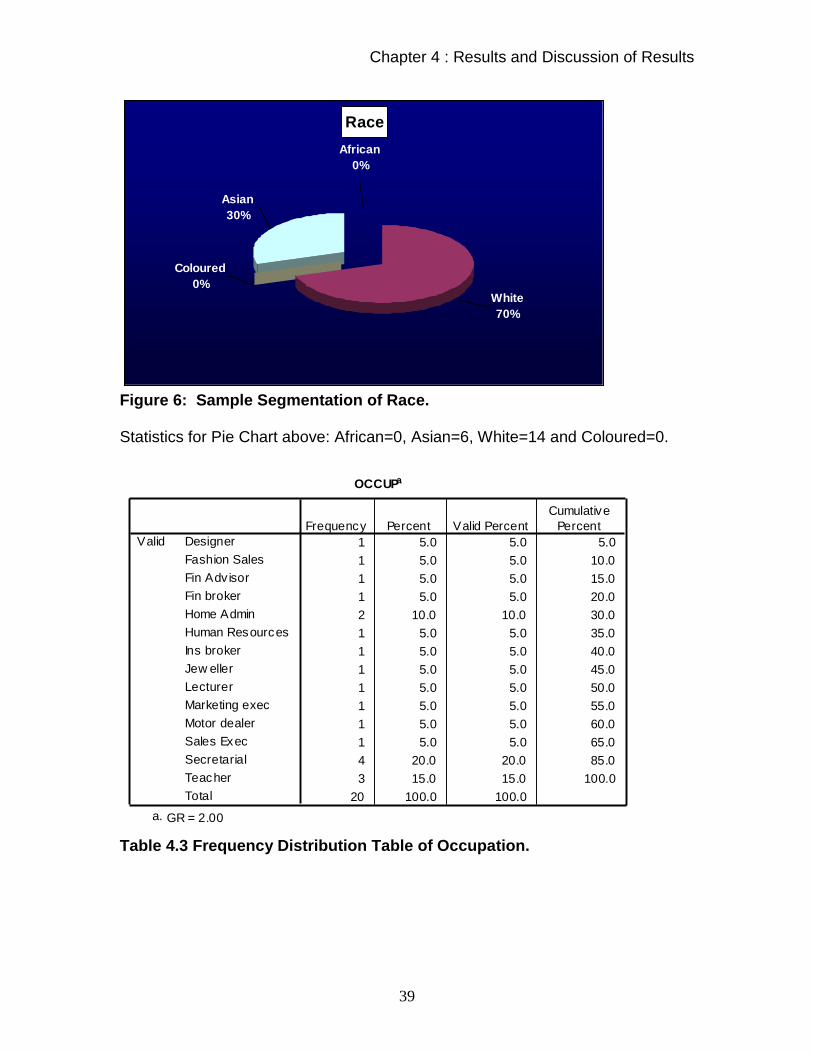
Figure 6: Sample Segmentation of Race. Statistics for Pie Chart above: African=0, Asian=6, White=14 and Coloured=0.
OCCUPa
1 5.0 5.0 5.0
1 5.0 5.0 10.0
1 5.0 5.0 15.0
1 5.0 5.0 20.0
2 10.0 10.0 30.0
1 5.0 5.0 35.0
1 5.0 5.0 40.0
1 5.0 5.0 45.0
1 5.0 5.0 50.0
1 5.0 5.0 55.0
1 5.0 5.0 60.0
1 5.0 5.0 65.0
4 20.0 20.0 85.0
3 15.0 15.0 100.0
20 100.0 100.0
Designer
Fashion Sales
Fin Adv isor
Fin broker
Home Admin
Human Resources
Ins broker
Jew eller
Lecturer
Marketing exec
Motor dealer
Sales Exec
Secretarial
Teacher
Total
Valid
Frequency Percent Valid Percent
Cumulative
Percent
GR = 2.00a.
Table 4.3 Frequency Distribution Table of Occupation.

Chapter 4 : Results and Discussion of Results
40
Group C
Gender
Female
75%
Male
25%
Figure 7: Sample Segmentation of Gender. Statistics for Pie Chart above: Male=5 and Female=15.
Descriptive Statis ticsa
20 30.00 48.00 39.4500 5.61460
20
AGE
Valid N (lis tw ise)
N Minimum Maximum Mean Std. Deviation
GR = 3.00a.
Table 4.4 Descriptive Statistics for Age.

Chapter 4 : Results and Discussion of Results
41
Race
Asian
25%
Coloured
10%White
60%
African
5%
Figure 8: Sample Segmentation of Race. Statistics for Pie Chart above: African=1, Asian=5, White=12 and Coloured=2.
OCCUPa
2 10.0 10.0 10.0
1 5.0 5.0 15.0
1 5.0 5.0 20.0
1 5.0 5.0 25.0
1 5.0 5.0 30.0
1 5.0 5.0 35.0
1 5.0 5.0 40.0
1 5.0 5.0 45.0
1 5.0 5.0 50.0
1 5.0 5.0 55.0
1 5.0 5.0 60.0
1 5.0 5.0 65.0
1 5.0 5.0 70.0
1 5.0 5.0 75.0
1 5.0 5.0 80.0
1 5.0 5.0 85.0
3 15.0 15.0 100.0
20 100.0 100.0
Admin
Admin clerk
Bank Super
Bookseller
Cashier
Fin adv
Home admin
Hotel admin
IT consult
Lecturer
LEcturer
Psychologist
Sales Mgr
Secretary
Supervisor
Sw itchboard
Teacher
Total
Valid
Frequency Percent Valid Percent
Cumulative
Percent
GR = 3.00a.
Table 4.5 Frequency Distribution Table of Occupation.

Chapter 4 : Results and Discussion of Results
42
In conclusion it can be seen that : Group A consists of 70% male and 30% female, has a mean age of 38.9 years
and is mostly White (80%) and Asian (15%) and has various occupational
groups.
Group B consists of 25% male and 75% female, has a mean age of 38.9 years
and is mostly white (70%) and Asian (30%) and has various occupational groups.
Group C consists of 25% male and 75% female, has a mean age of 39.45 years
and is mostly white (60%) and Asian (25%) and has various occupational groups.
Therefore all three groups are fairly similar from a demographic point of view;
however, group 1 is mostly male whereas the other 2 groups are dominated by
females.
The research study was not a true reflection of the demographic representation
of South Africa’s population, as there where only 2 African patients who took part
in the study. Therefore the results of this study suggest that there is a limited
exposure of certain parts of the population to treatments such as the Transeva,
which is not utilised as part of traditional African healing methods or associated
with hospital care where most patients are exposed almost exclusively to
medication or some form of drug therapy for pain control (Prout, 1996). Prout
concludes that the notion of cultural bias is a more flexible, realistic and useful
way of conceptualising variations in household health practices and beliefs
(Prout,1996) Therefore there seems to be a need to educate parts of our
society so that all may benefit in that part of health care that chiropractic
provides.

Chapter 4 : Results and Discussion of Results
43
In addition to this the researcher also realises that there could have been an
influence in terms of the advertising for participants for this study, whereby the
nature of the advert and the placement of the advert may have inadvertently
biased the sample according to ethnicity.
The predominance in the number of female subjects that took part could possibly
be due to the predominance of office workers/secretaries that suffered from neck
pain. Han and Harrison state that myofascial pain syndrome is more common in
females, thus this study shows congruency with literature regarding the sex
distribution of the above condition (Han and Harrison 1997).
Of the various occupation groups accepted into the study, one common factor
which was congruent with the inclusion criteria was that they all did some office
work in a day and all reported that working at a desk or in front of a computer
was the activity most commonly associated with aggravating their condition. Poor
posture associated with prolonged sitting at a desk may explain the high
prevalence of neck pain with these patients (Han and Harrison 1997).
Furthermore this is congruent with and supports the findings of Peek (2005),
where he found in his ergonomics related study that there was a significant
correlation with neck pain and office ergonomics.

Chapter 4 : Results and Discussion of Results
44
4.3 Inferential Statistics
4.3.1 Intra Group Tests 4.3.1a Subjective : CMCC
Table 4.6 Descriptive Statistics for CMCC by Group.
Friedmann Test
Group A P value = 0.000
Group B P value = 0.001 Group C P value = 0.000
Since the p values in all three groups above are less than 0.05 which
equals the significance level, then the Null hypothesis can be rejected in
all three cases and the study can conclude that at least one of the
population means are significantly different to the others again in all three
cases. As to where these differences are occurring will be analyzed below
by applying multiple Wilcoxon Tests for matched pairs.
Descriptive Statistics
20 10.7500 5.99012 2.00 27.00
20 7.5000 5.16568 .00 21.00
20 5.3500 4.95533 .00 18.00
20 10.4000 5.66057 2.00 20.00
20 8.3000 6.68935 .00 20.00
20 7.5500 4.81746 .00 17.00
20 11.5000 6.37842 2.00 24.00 20 8.8500 5.17357 1.00 20.00 20 8.0000 5.03671 .00 19.00
CMCC1
CMCC2
CMCC3
CMCC1
CMCC2
CMCC3
CMCC1 CMCC2
CMCC3
GR
A
B
C
N Mean Std. Deviation Minimum Maximum

Chapter 4 : Results and Discussion of Results
45
Table 4.7 Wilcoxon Tests Results for CMCC by Group. In the case of group A all three p values are less than 0.05 which allows us to
reject the Null hypothesis in all three cases and conclude that there is a
significant difference in population means, in other words CMCC scores change
significantly in each of the sequential visits.
The results obtained for group A is consistent with the literature that indicates a
treatment effect is present when the Transeva is applied (Forster and Palastanga
1990, Greene 2003). It is therefore conceivable that the patients should improve
throughout the course of the applied treatment.
In the case of group B only two p values are less than 0.05 which allows us to
reject the Null hypothesis in the two cases and conclude that there is a significant
difference in population means here, in other words CMCC scores change
significantly from visit 1 to 2 and visits 1 to 3 but not from visits 2 to 3.
This group represented the Placebo Transeva group. Due to the application of
this detuned modality, it is possible that the improvements initially seen here
could be due to :
Mechanical stimulation of the superficial nerve endings by means of
the head of the detuned Transeva, stimulate inhibitory interneurons
causing an increase in mechano-receptive activity and reduce the
Test Statistics b
-3.822 a -3.931 a -3.151 a
.000 .000 .002
-2.342 a -3.413 a -.786 a
.019 .001 .432
-2.788 a -2.849 a -1.381 a
.005 .004 .167
Z
Asymp. Sig. (2-tailed)
Z
Asymp. Sig. (2-tailed)
Z
Asymp. Sig. (2-tailed)
GR A
B
C
CMCC2 - CMCC1
CMCC3 - CMCC1
CMCC3 - CMCC2
Based on positive ranks. a.
Wilcoxon Signed Ranks Test b.

Chapter 4 : Results and Discussion of Results
46
amount of pain signal transmitted, as per the “Gate control theory”
(Melzack and Wall,1965).
“Placebo Effect” –by the psychological thought of being treated
which results in perceived patient improvement which is not based
on a physiological response associated with healing. This effect is
negated with time as the patient does not respond physiologically to
the treatment and maintains the same level of dysfunctional ability.
(Mouton, 1996)
“Hawthorne” effect”– the effect by which when the patient sees you
as a Doctor, they try to please the Doctor with a well intentioned but
false subjective improvement that does not correlate with their
objective response and therefore the results average out at a false
mean. This effect is negated with time as the patient does not
respond physiologically to the treatment and maintains the same
level of dysfunctional ability. (Mouton, 1996)
In the case of group C only two p values are less than 0.05 which allows
us to reject the Null hypothesis in the two cases and conclude that there is
a significant difference in population means here, in other words CMCC
scores change significantly from visit 1 to 2 and visits 1 to 3 but not from
visits 2 to 3.
This group represented the pulsed Ultrasound group. Due to the
application of this modality, it is possible that the improvements initially
seen here could be due to:
Mechanical stimulation of the superficial nerve endings by
means of the head of the Ultrasound, causing an increase in
mechano-receptive activity as per the “Gate control theory”
(Melzack and Wall,1965)
Micro-massage effect of the vibration according to the
mechanisms by which vibration minimizes pain may include

Chapter 4 : Results and Discussion of Results
47
both peripheral and central mechanisms (Melzack and
Wall,1965 ;Kitchen and Bazin, 1996)
Thermal effect (Kitchen and Bazin ,1996)
Degree of penetration of the therapeutic effect is possibly
relative to patient size. With increased adipose tissue / muscle,
the Ultrasound may be less effective. Females generally have a
higher percentage body fat than males (Frish, 1997) and after
concluding that the Ultrasound and Placebo groups have a
higher percentage females, this must be taken into account.
These findings suggest that the Transeva group showed a greater improvement
to manage everyday life between all three visits than the Placebo Transeva or
Pulsed Ultrasound group over the duration of the research program:
The Placebo; it stands to reason that it could play a role in all three
groups and therefore its effect is negated.
It would seem that the Ultrasound has limited function, in that it only
seems to provide micro-massage and a thermal effect as opposed to
both micro-massage and a thermal effect as well as a muscular
contractile effect.
In contrast to the Transeva which acts by this dual mechanism,
vascular and neurological:
o Massage effect as per the Ultrasound
o Muscle effect – contraction and relation of the muscle:
The pumping action of the muscle contraction allows for a
synergistic aid to the micro-massage that the Transeva
imparts.
Relaxation or normalisation of the action potentials of the
muscles by means of resetting the calcium channels within
the sarcolemma of the muscle (Guyton and Hall, 2000) has
an effect on decreasing the tonicity of the muscle. Thereby

Chapter 4 : Results and Discussion of Results
48
allowing for the muscle to be in a more relaxed state post the
treatment.
When adding the above results to the demographic profile of the patients, it was
noted that there was a higher percentage of Asian population in groups B and C
than group A. This could have affected the responses from these patient groups,
as a result of a greater psychosocial or cultural bias effect, as defined by Prout
(1996).
Numerical Pain Rating Scale
Table 4.8 Descriptive Statistics for NPRS by Group.
Friedmann Test
Group A P value = 0.000
Group B P value = 0.002 Group C P value = 0.021
Descriptive Statistics
20 48.3000 13.78061 20.00 75.00
20 39.2000 14.73485 10.00 60.00
20 28.0000 17.27487 5.00 80.00
20 47.6000 11.25494 25.00 70.00
20 41.6500 13.09188 25.00 70.00
20 37.3000 13.89093 20.00 65.00
20 48.0500 15.56134 25.00 75.00
20 43.2000 17.14213 10.00 75.00
20 37.5750 17.05508 7.50 70.00
NRS1
NRS2
NRS3
NRS1
NRS2
NRS3
NRS1
NRS2
NRS3
GR A
B
C
N Mean Std. Deviation Minimum Maximum

Chapter 4 : Results and Discussion of Results
49
Since the p values in all three groups above are less than 0.05 which equals the
significance level, then the Null hypothesis can be rejected in all three cases and
the study can conclude that at least one of the population means is significantly
different to the others again in all three cases. As to where these differences are
occurring will be analyzed below by applying multiple Wilcoxon Tests for
matched pairs.
Table 4.9 Wilcoxon Tests Results for NPRS by Group. In the case of group A all three p values are less than 0.05 which allows us to
reject the Null hypothesis in all three cases and conclude that there is a
significant difference in population means, in other words NPRS scores change
significantly in each of the sequential visits.
The results obtained for group A is consistent with the literature that indicates a
treatment effect is present when the Transeva is applied (Forster and
Palastanga, 1990 and Greene, 2003). It is therefore conceivable that the patients
improved throughout the course of the applied treatment by showing a greater
reduction in pain intensity over the research program.
In the case of group B all three p values are less than 0.05 which allows us to
reject the Null hypothesis in all three cases and conclude that there is a
Test Statistics b
-2.867 a -3.346 a -3.155 a
.004 .001 .002 -2.646 a -2.867 a -2.085 a
.008 .004 .037 -1.476 a -2.512 a -1.822 a
.140 .012 .068
Z
Asymp. Sig. (2-tailed) Z
Asymp. Sig. (2-tailed) Z
Asymp. Sig. (2-tailed)
GR
A
B
C
NRS2 - NRS1 NRS3 - NRS1 NRS3 - NRS2
Based on positive ranks. a.
Wilcoxon Signed Ranks Test b.

Chapter 4 : Results and Discussion of Results
50
significant difference in population means, in other words NPRS scores change
significantly in each of the sequential visits.
This group represented the Placebo Transeva group. Due to the application of
this detuned modality, it is possible that the improvements initially seen here
could be due to :
Mechanical stimulation of the superficial nerve endings by means of
the head of the Transeva, causing an increase in mechano-
receptive activity as per the “Gate control theory” (Melzack and
Wall,1965)
Mechanical stimulus is temporary (Melzack and Wall,1965)
There is no flushing effect of increased blood flow to the area and
lymphatic removal, therefore the patients will revert to previous
levels of pain or show an un-sustained pain pattern as the pain
stimulus is still there.
In the case of group C only one p value is less than 0.05 which allows us to reject
the Null hypothesis in that case and conclude that there is a significant difference
in population means here, in other words NPRS scores change significantly from
visit 1 to 3.
This group represented the pulsed Ultrasound group. Due to the application of
this modality, it is possible that the improvements initially seen here could be due
to:
Mechanical stimulation of the superficial nerve endings by
means of the head of the Ultrasound, causing an increase in
mechano-receptive activity as per the “Gate control theory”
(Melzack and Wall, 1965).
Micro- massage effect of the vibration according to the
mechanisms by which vibration minimizes pain may include

Chapter 4 : Results and Discussion of Results
51
both peripheral and central mechanisms. ( Melzack and
Wall,1965)
Thermal effect (Kitchen and Bazin ,1996)
Degree of penetration of the Ultrasound wave relative to patient
size (adipose / muscle) may be less effective, as there is a
higher percentage of females in groups B and C and females
generally have a higher percentage body fat (Frish, 1997).
These findings suggest that the Transeva and Placebo groups showed a greater
reduction in pain intensity over the research program. A significant improvement
within the Placebo group was not expected.
The Placebo stands to reason as above (see page 45)
The Ultrasound has limited function in that it only provides micro-
massage and thermal effects as above (see page 46)
Which is in contrast to the Transeva which acts by dual mechanism,
both vascular and neurological as above (see page 47)
Again the psychosocial/ Cultural bias in groups B and C versus group A must be
a factor to take into consideration with these results (Prout, 1996)

Chapter 4 : Results and Discussion of Results
52
Short Form Mc Gill Questionnaire
Table 4.10 Descriptive Statistics for SFMQ by Group.
Friedmann Test
Group A P value = 0.000 Group B P value = 0.000 Group C P value = 0.002
Since the p values in all three groups above are less than 0.05 which
equals the significance level, then the Null hypothesis can be rejected in
all three cases and the study can conclude that at least one of the
population means is significantly different to the others again in all three
cases. As to where these differences are occurring will be analyzed below
by applying multiple Wilcoxon Tests for matched pairs.
Table 4.11 Wilcoxon Tests Results for SFMQ by Group.
Descriptive Statistics
20 13.0500 6.53311 4.00 26.00
20 7.7500 5.41805 1.00 19.00 20 5.2000 5.35675 .00 19.00
20 11.7000 7.10152 2.00 25.00
20 7.0500 4.99974 1.00 16.00
20 6.3500 5.01865 .00 18.00
20 12.6500 8.39972 3.00 31.00 20 8.9500 5.90695 2.00 27.00
20 6.8000 4.61804 .00 16.00
SM1 SM2
SM3
SM1 SM2
SM3 SM1
SM2
SM3
GR
A
B
C
N Mean Std. Deviation Minimum Maximum
Test Statistics b
-3.871 a -3.924 a -2.901 a
.000 .000 .004
-3.254 a -3.538 a -1.089 a
.001 .000 .276
-2.826 a -3.184 a -1.422 a
.005 .001 .155
Z
Asymp. Sig. (2-tailed) Z
Asymp. Sig. (2-tailed) Z
Asymp. Sig. (2-tailed)
GR
A
B
C
SM2 - SM1 SM3 - SM1 SM3 - SM2
Based on positive ranks. a.
Wilcoxon Signed Ranks Test b.

Chapter 4 : Results and Discussion of Results
53
In the case of group A all three p values are less than 0.05 which allows
us to reject the Null hypothesis in all three cases and conclude that there
is a significant difference in population means, in other words Short Form
McGill scores change significantly in each of the sequential visits.
The results obtained for group A is consistent with the literature that
indicates a treatment effect is present when the Transeva is applied
(Forster and Palastanga, 1990, Greene 2003). It is therefore conceivable
that the patients improved throughout the course of the applied treatment.
In the case of group B only two p values are less than 0.05 which allows
us to reject the Null hypothesis in the two cases and conclude that there is
a significant difference in population means here, in other words scores
from Short Form McGill change significantly from visit 1 to 2 and visits 1 to
3 but not from visits 2 to 3.
This group represented the Placebo Transeva group. Due to the
application of this detuned modality, it is possible that the improvements
initially seen here could be due to:
Mechanical stimulation of the superficial nerve endings by
means of the head of the Transeva, causing an increase in
mechano-receptive activity as seen above (page 45)
Placebo effect as seen above (page 45)
Hawthorne effect as seen above (page 45)
In the case of group C only two p values are less than 0.05 which allows us to
reject the Null hypothesis in the two cases and conclude that there is a significant
difference in population means here, in other words Short Form McGill scores
change significantly from visit 1 to 2 and visits 1 to 3 but not from visits 2 to 3.
Chapter 4 : Results and Discussion of Results
54
This group represented the pulsed Ultrasound group. Due to the
application of this modality, it is possible that the improvements initially
seen here could be due to:
Mechanical stimulation of the superficial nerve endings by
means of the head of the Ultrasound, causing an increase in
mechano-receptive activity as per the “Gate control theory”
(Melzack and Wall, 1965).
Micro-massage effect of the vibration according to the
mechanisms by which vibration minimizes pain may include
both peripheral and central mechanisms ( Melzack and
Wall,1965).
Thermal effect (Kitchen and Bazin ,1996).
Degree of penetration possibly relative to patient size. With
increased adipose tissue / muscle, the Ultrasound may be less
effective, due to the increased number of females present
compared to group A. (as per the above –page 46)
These findings suggest that the Transeva group showed a greater reduction in
the quality and intensity of pain over all three visits than the Placebo Transeva or
Pulsed Ultrasound group over the duration of the research program:
The Placebo stands to reason as above (page 45)
The Ultrasound has limited function in that it only provides micro-
massage and thermal effects as above (see page 46)
Which is in contrast to the Transeva which acts by dual mechanism,
both vascular and neurological as above( page 47)
By looking at the demographic results, it was noted that there was a higher
percentage of Asian population in groups B and C than group A. This could
cause a greater psychosocial or cultural bias effect in these two groups which
could have had an effect on the results (Prout, 1996).
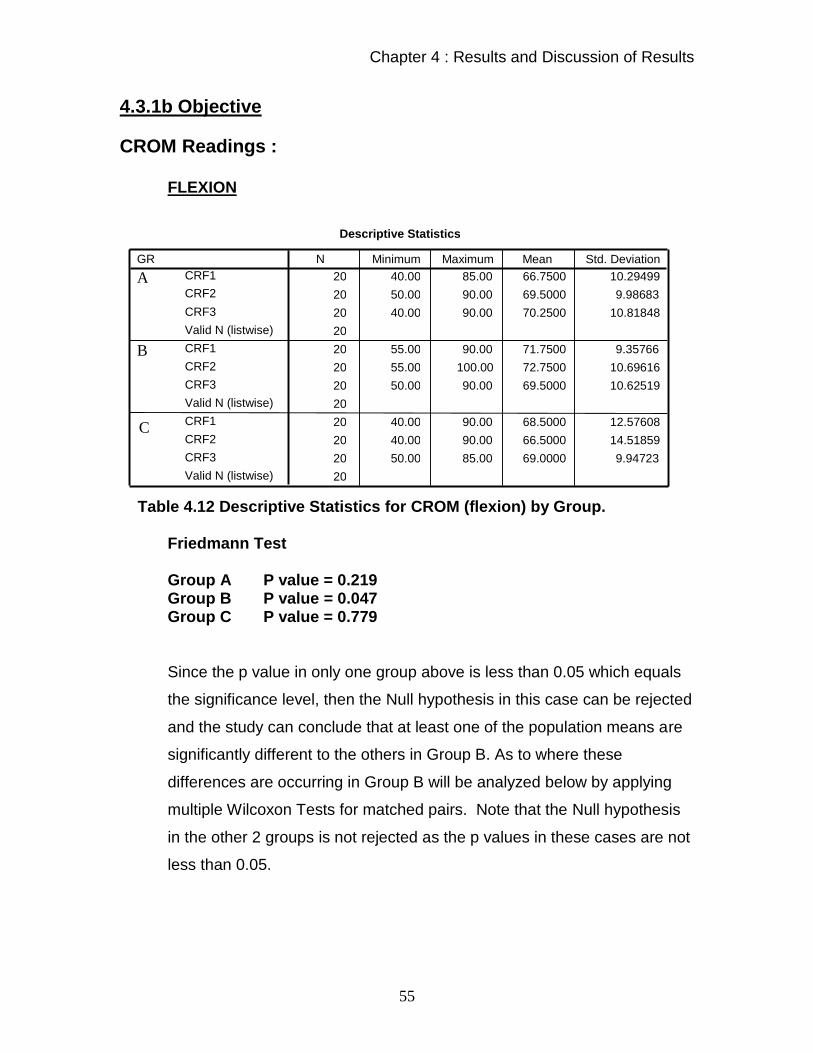
Chapter 4 : Results and Discussion of Results
55
4.3.1b Objective
CROM Readings : FLEXION
Table 4.12 Descriptive Statistics for CROM (flexion) by Group.
Friedmann Test
Group A P value = 0.219 Group B P value = 0.047 Group C P value = 0.779
Since the p value in only one group above is less than 0.05 which equals
the significance level, then the Null hypothesis in this case can be rejected
and the study can conclude that at least one of the population means are
significantly different to the others in Group B. As to where these
differences are occurring in Group B will be analyzed below by applying
multiple Wilcoxon Tests for matched pairs. Note that the Null hypothesis
in the other 2 groups is not rejected as the p values in these cases are not
less than 0.05.
Descriptive Statistics
20 40.00 85.00 66.7500 10.29499
20 50.00 90.00 69.5000 9.98683
20 40.00 90.00 70.2500 10.81848
20
20 55.00 90.00 71.7500 9.35766
20 55.00 100.00 72.7500 10.69616
20 50.00 90.00 69.5000 10.62519
20
20 40.00 90.00 68.5000 12.57608
20 40.00 90.00 66.5000 14.51859
20 50.00 85.00 69.0000 9.94723
20
CRF1 CRF2
CRF3
Valid N (listwise)
CRF1
CRF2
CRF3
Valid N (listwise)
CRF1
CRF2
CRF3
Valid N (listwise)
GR
A
B
C
N Minimum Maximum Mean Std. Deviation

Chapter 4 : Results and Discussion of Results
56
Test Statis ticsc,d
-.893a -1.208b -1.446b
.372 .227 .148
Z
Asymp. Sig. (2-tailed)
CRF2 - CRF1 CRF3 - CRF1 CRF3 - CRF2
Based on negative ranks.a.
Based on positive ranks.b.
Wilcoxon Signed Ranks Testc.
GR = 2.00d.
Table 4.13 Wilcoxon Tests Results for CROM (flexion) by Group.
In the case of group B no p values are less than 0.05, therefore the study
cannot reject the Null hypothesis and conclude that there is a significant
difference in population means, in other words CROM (flex) scores do not
change significantly in each of the sequential visits.
Group A – Is as expected due to the treatment received by its action of dual
mechanism.(see above –page 47)
Group B – holds true for Placebo, where there is no treatment effect, yet pain is
reduced due to the mechanical stimuli, which is seen in NPRS results.
Group C -The Ultrasound has no flushing effect for the increasing rate of
inflammation to allow for quicker resolution of the myofascial trigger point.
The worsening effect initially may be due to the irritation of the myofascial trigger
point or stimulation of the inflammatory process to increase the rate of healing.
The results then return to pre-treatment readings once inflammation has
decreased and resolved within 72 hours (Vizniak, 2003).

Chapter 4 : Results and Discussion of Results
57
EXTENSION
Table 4.14 Descriptive Statistics for CROM (extension) by Group.
Friedmann Test
Group A P value = 0.024 Group B P value = 0.235 Group C P value = 0.673
Since the p value in only one group above is less than 0.05 which equals
the significance level, then the Null hypothesis in this case can be rejected
and the study can conclude that at least one of the population means are
significantly different to the others in Group A. As to where these
differences are occurring in Group A will be analyzed below by applying
multiple Wilcoxon Tests for matched pairs. Note that the Null hypothesis
in the other 2 groups is not rejected as the p values in these cases are not
less than 0.05.
Descriptive Statistics
20 40.00 80.00 58.9000 10.36137
20 40.00 95.00 64.5000 14.13283
20 40.00 100.00 64.5000 14.13283
20
20 50.00 85.00 67.2500 12.08250
20 50.00 90.00 67.5000 12.61787
20 50.00 90.00 65.5000 12.86570 20
20 25.00 100.00 67.2500 15.85087
20 30.00 100.00 65.7500 18.08423
20 20.00 100.00 64.5000 19.59457
20
CRE1
CRE2
CRE3
Valid N (listwise)
CRE1
CRE2
CRE3
Valid N (listwise)
CRE1
CRE2
CRE3 Valid N (listwise)
GR
A
B
C
N Minimum Maximum Mean Std. Deviation

Chapter 4 : Results and Discussion of Results
58
Test Statis ticsc,d
-2.143a -1.978a .000b
.032 .048 1.000
Z
Asymp. Sig. (2-tailed)
CRE2 - CRE1 CRE3 - CRE1 CRE3 - CRE2
Based on negative ranks.a.
The sum of negative ranks equals the sum of pos itive ranks.b.
Wilcoxon Signed Ranks Testc.
GR = 1.00d.
Table 4.15 Wilcoxon Tests Results for CROM(extension) by Group.
In the case of group A only two p values are less than 0.05 which allows
us to reject the Null hypothesis in all these cases and conclude that there
is a significant difference in population means, in other words CROM (flex)
scores change significantly in each of the sequential visits in this group.
Extension does not cause stretch (elongation) of the Trapezius and Levator
Scapula muscles, it causes contraction of the muscles and this causes irritation
of the trigger points that are present. Thus it stands to reason that irritated trigger
points will be associated with a decrease in extension ROM.
Group A –Resulted in a decrease in trigger points due to the dual mechanism (as
seen on page 47), and this allows for an increase in Range Of Motion.
Group B –Transeva Placebo group resulted in no treatment effect, thus the
trigger point runs its natural history and therefore may get worse with time.
Group C – The Ultrasound group had no flushing effect for the increasing rate of
inflammation as the trigger points contracted in extension to allow for resolution
of the myofascial trigger point, causing a decrease in extension.

Chapter 4 : Results and Discussion of Results
59
LATERAL FLEXION (RIGHT)
Table 4.16 Descriptive Statistics for CROM (lat flexion-right) by Group.
Friedmann Test Group A P value = 0.029 Group B P value = 0.612 Group C P value = 0.835
Since the p value in only one group above is less than 0.05 which equals
the significance level, then the Null hypothesis in this case can be rejected
and the study can conclude that at least one of the population means are
significantly different to the others in Group A. As to where these
differences are occurring in Group A will be analyzed below by applying
multiple Wilcoxon Tests for matched pairs. Note that the Null hypothesis
in the other 2 groups are not rejected as the p values in these cases are
not less than 0.05.
Test Statis ticsb,c
-1.204a -2.583a -2.292a
.229 .010 .022
Z
Asymp. Sig. (2-tailed)
CRLFR2 -
CRLFR1
CRLFR3 -
CRLFR1
CRLFR3 -
CRLFR2
Based on negative ranks.a.
Wilcoxon Signed Ranks Testb.
GR = 1.00c.
Table 4.17 Wilcoxon Tests Results for CROM (lat flexion-right) by Group.
Descriptive Statistics
20 25.00 60.00 43.2500 7.82624
20 30.00 60.00 45.0000 7.43392
20 35.00 60.00 48.0000 7.50438
20
20 30.00 65.00 45.7500 10.42202
20 30.00 60.00 47.0000 10.43779
20 30.00 60.00 45.2500 10.57243 20
20 30.00 60.00 45.7500 9.63478
20 30.00 60.00 46.0000 9.26226
20 30.00 65.00 46.5000 10.64993
20
CRLFR1
CRLFR2
CRLFR3
Valid N (listwise)
CRLFR1
CRLFR2
CRLFR3
Valid N (listwise)
CRLFR1
CRLFR2
CRLFR3 Valid N (listwise)
GR
A
B
C
N Minimum Maximum Mean Std. Deviation

Chapter 4 : Results and Discussion of Results
60
In the case of group A the p values less than 0.05 is just between 1 and 3
which allows us to reject the Null hypothesis in all these cases and
conclude that there is a significant difference in population means here, in
other words CROM (LFR) scores change significantly in each of the
sequential visits.
Group A – trends as before. The Transeva group resulted in a decrease in trigger
points due to the dual mechanism (as seen above on page 47), and this allows
for an increase in range of motion.
Group B –The Transeva Placebo group had increased movement due to
perceived decreased pain (Melzack and Wall, 1965), but with no treatment effect
they reverted to previous readings.
Group C –Pulsed Ultrasound group reached a plateau when maximum extension
range of motion for those patients was reached.
The technique for measurements was the same and this ensured reproducibility
(keeping the shoulders level)
The influence of right handedness may have an effect, causing the right sided
trigger points to be worse, therefore the left side has greater contractility (this
results in improved response to any treatment modality due to a relatively less
severe myofascial trigger point on the left), thereby allowing for improvement in
right lateral flexion.

Chapter 4 : Results and Discussion of Results
61
LATERAL FLEXION (LEFT)
Table 4.18 Descriptive Statistics for CROM (lat flexion-left) by Group.
Friedmann Test
Group A P value = 0.194
Group B P value = 0.023 Group C P value = 0.234
Since the p value in only one group above is less than 0.05 which equals
the significance level, then the Null hypothesis in this case can be rejected
and the study can conclude that at least one of the population means are
significantly different to the others in Group B. As to where these
differences are occurring in Group A will be analyzed below by applying
multiple Wilcoxon Tests for matched pairs. Note that the Null hypothesis
in the other 2 groups is not rejected as the p values in these cases are not
less than 0.05.
Descriptive Statistics
20 20.00 65.00 44.0000 10.58798
20 20.00 70.00 46.5000 11.13317
20 20.00 70.00 48.7500 11.68388
20
20 25.00 70.00 48.2500 12.16931
20 35.00 65.00 51.2500 9.71637
20 30.00 70.00 52.2500 10.93943 20
20 20.00 60.00 46.9000 10.64202
20 20.00 60.00 46.7500 11.27118
20 30.00 60.00 49.7500 8.65645
20
CRLFL1
CRLFL2
CRLFL3
Valid N (listwise)
CRLFL1
CRLFL2
CRLFL3
Valid N (listwise)
CRLFL1
CRLFL2
CRLFL3 Valid N (listwise)
GR
A
B
C
N Minimum Maximum Mean Std. Deviation
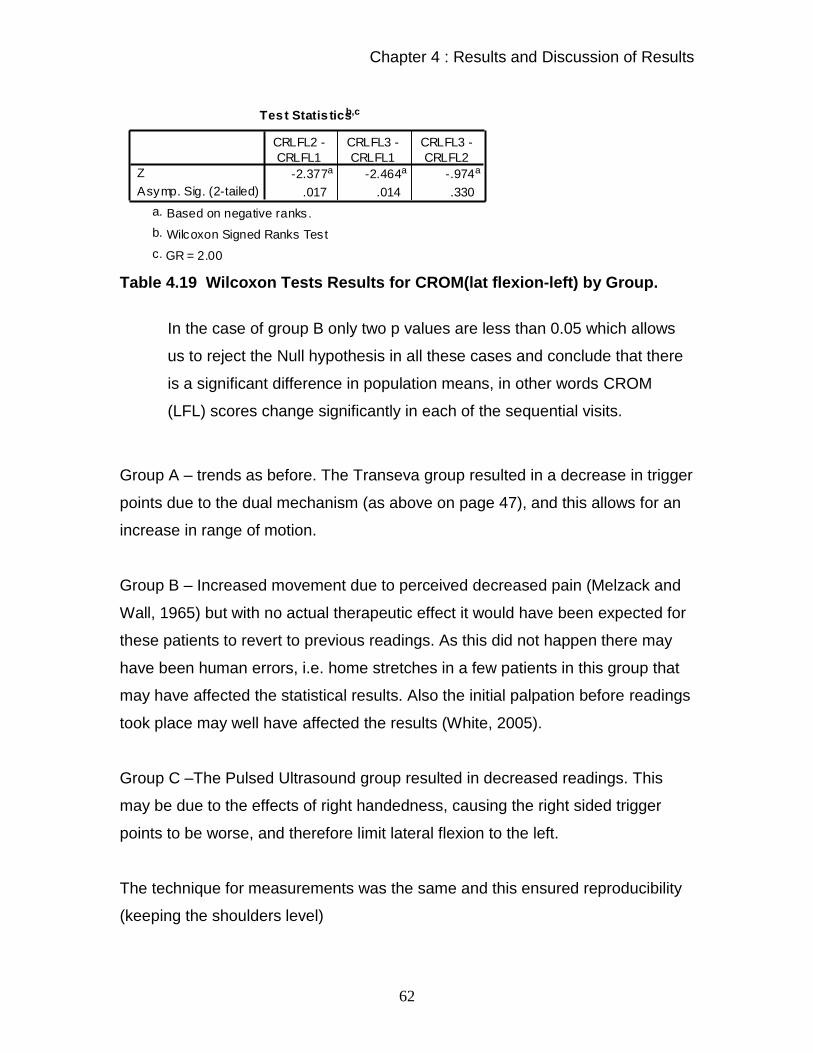
Chapter 4 : Results and Discussion of Results
62
Test Statis ticsb,c
-2.377a -2.464a -.974a
.017 .014 .330
Z
Asymp. Sig. (2-tailed)
CRLFL2 -
CRLFL1
CRLFL3 -
CRLFL1
CRLFL3 -
CRLFL2
Based on negative ranks.a.
Wilcoxon Signed Ranks Testb.
GR = 2.00c.
Table 4.19 Wilcoxon Tests Results for CROM(lat flexion-left) by Group.
In the case of group B only two p values are less than 0.05 which allows
us to reject the Null hypothesis in all these cases and conclude that there
is a significant difference in population means, in other words CROM
(LFL) scores change significantly in each of the sequential visits.
Group A – trends as before. The Transeva group resulted in a decrease in trigger
points due to the dual mechanism (as above on page 47), and this allows for an
increase in range of motion.
Group B – Increased movement due to perceived decreased pain (Melzack and
Wall, 1965) but with no actual therapeutic effect it would have been expected for
these patients to revert to previous readings. As this did not happen there may
have been human errors, i.e. home stretches in a few patients in this group that
may have affected the statistical results. Also the initial palpation before readings
took place may well have affected the results (White, 2005).
Group C –The Pulsed Ultrasound group resulted in decreased readings. This
may be due to the effects of right handedness, causing the right sided trigger
points to be worse, and therefore limit lateral flexion to the left.
The technique for measurements was the same and this ensured reproducibility
(keeping the shoulders level)

Chapter 4 : Results and Discussion of Results
63
ROTATION RIGHT
Table 4.20 Descriptive Statistics for CROM (rotation-right) by Group.
Friedmann Test
Group A P value = 0.099 Group B P value = 0.045 Group C P value = 0.387
Since the p value in only one group above is less than 0.05 which equals
the significance level, then the Null hypothesis in this case can be rejected
and the study can conclude that at least one of the population means are
significantly different to the others in Group B. As to where these
differences are occurring in Group A will be analyzed below by applying
multiple Wilcoxon Tests for matched pairs. Note that the Null hypothesis
in the other 2 groups is rejected as the p values in these cases are not
less than 0.05.
Descriptive Statistics
20 45.00 90.00 65.2500 12.61526
20 60.00 100.00 73.0000 10.05249
20 65.00 100.00 75.0000 9.03211
20
20 40.00 100.00 70.0000 14.50953
20 45.00 90.00 73.5000 9.47295
20 50.00 100.00 76.2500 13.84833 20
20 40.00 100.00 75.2500 17.73155
20 40.00 100.00 79.0000 18.32456
20 40.00 100.00 78.7500 17.00426
20
CRRR1
CRRR2
CRRR3
Valid N (listwise)
CRRR1
CRRR2
CRRR3
Valid N (listwise)
CRRR1
CRRR2
CRRR3 Valid N (listwise)
GR
A
B
C
N Minimum Maximum Mean Std. Deviation

Chapter 4 : Results and Discussion of Results
64
Test Statis ticsb,c
-1.671a -2.433a -1.305a
.095 .015 .192
Z
Asymp. Sig. (2-tailed)
CRRR2 -
CRRR1
CRRR3 -
CRRR1
CRRR3 -
CRRR2
Based on negative ranks.a.
Wilcoxon Signed Ranks Testb.
GR = 2.00c.
Table 4.21 Wilcoxon Tests Results for CROM (rotation-right) by
Group.
In the case of group A the p values less than 0.05 is just between visits 1
and 3 which allows us to reject the Null hypothesis in all these cases and
conclude that there is a significant difference in population means here, in
other words CROM (ROT R) scores change significantly in each of the
sequential visits.
The effects of right handedness, causing the right sided trigger points to be
worse, therefore the left side has greater contractility (this results in improved
response to any treatment modality due to a relatively less severe myofascial
trigger point on the left), thereby allowing for improvement in right rotation.
Rotation is not the principal movement of either muscle and therefore it is at best
an indirect measure of muscle performance / patient improvement.
Scalenii or the Sternocleidomastoid muscles would be more of an indicator, but
these muscles were not assessed in the study (Magee 1992).

Chapter 4 : Results and Discussion of Results
65
ROTATION LEFT
Table 4.22 Descriptive Statistics for CROM (rotation-left) by Group.
Friedmann Test
Group A P value = 0.022 Group B P value = 0.673 Group C P value = 0.659
Since the p value in only one group above is less than 0.05 which equals
the significance level, then the Null hypothesis in this case can be rejected
and the study can conclude that at least one of the population means are
significantly different to the others in Group A. As to where these
differences are occurring in Group A will be analyzed below by applying
multiple Wilcoxon Tests for matched pairs. Note that the Null hypothesis
in the other 2 groups is not rejected as the p values in these cases are not
less than 0.05.
Descriptive Statistics
20 30.00 90.00 69.7500 14.37057
20 50.00 90.00 71.7500 11.38732
20 50.00 100.00 78.0000 13.11889
20
20 40.00 100.00 71.0000 16.18967
20 50.00 100.00 71.5000 13.18891
20 50.00 90.00 73.5000 13.08877 20
20 55.00 110.00 79.2500 14.71439
20 50.00 105.00 79.0000 15.44089
20 40.00 110.00 77.2500 17.43220
20
CRRL1
CRRL2
CRRL3
Valid N (listwise)
CRRL1
CRRL2
CRRL3
Valid N (listwise)
CRRL1
CRRL2
CRRL3 Valid N (listwise)
GR
A
B
C
N Minimum Maximum Mean Std. Deviation

Chapter 4 : Results and Discussion of Results
66
Test Statis ticsb,c
-.638a -2.062a -2.172a
.523 .039 .030
Z
Asymp. Sig. (2-tailed)
CRRL2 -
CRRL1
CRRL3 -
CRRL1
CRRL3 -
CRRL2
Based on negative ranks.a.
Wilcoxon Signed Ranks Testb.
GR = 1.00c.
Table 4.23 Wilcoxon Tests Results for CROM(rotation-left) by group.
In the case of group B only two p values are less than 0.05 which allows
us to reject the Null hypothesis in all these cases and conclude that there
is a significant difference in population means, in other words CROM
(ROT L) scores change significantly in each of the sequential visits.
Group A - Transeva – improves consistently and significantly for all readings
even when the “other factors” (see below) affecting the readings have been
accounted for.
Group B –Transeva Placebo group resulted in no treatment effect, therefore
trigger point runs its natural history course, therefore gets worse with time.
Other factors affecting the readings:
Use of 2 CROM instruments ( due to other students also using the
CROM) …may have made a small difference
Patient’s own home care, they could have self- treated even after
being told not to.
Changes at work / home, resulting in stressor increase / decrease.

Chapter 4 : Results and Discussion of Results
67
Algometer readings
Table 4.24 Descriptive Statistics for Algometer by Group. Friedmann Test
Group A P value = 0.000 Group B P value = 0.422 Group C P value = 0.137
Since the p value in only one group above is less than 0.05 which equals
the significance level, then the Null hypothesis in this case can be rejected
and the study can conclude that at least one of the population means are
significantly different to the others in Group A. As to where these
differences are occurring in Group A will be analyzed below by applying
multiple Wilcoxon Tests for matched pairs. Note that the Null hypothesis
in the other 2 groups are not rejected as the p values in these cases is not
less than 0.05.
Descriptive Statistics
20 1.80 4.90 3.1350 .83620
20 1.90 5.80 3.5850 .94327
20 2.10 5.80 3.9900 1.00467
20
20 1.00 3.80 2.5400 .86960
20 .80 3.80 2.5550 .89764
20 .50 4.70 2.6500 1.03593 20
20 1.10 5.50 3.0850 1.21970
20 .60 6.10 3.2050 1.39453
20 1.20 7.10 3.3350 1.43757
20
A1
A2
A3
Valid N (listwise)
A1
A2
A3
Valid N (listwise)
A1
A2
A3 Valid N (listwise)
GR
A
B
C
N Minimum Maximum Mean Std. Deviation

Chapter 4 : Results and Discussion of Results
68
Test Statis ticsb,c
-3.189a -3.930a -3.228a
.001 .000 .001
Z
Asymp. Sig. (2-tailed)
A2 - A1 A3 - A1 A3 - A2
Based on negative ranks.a.
Wilcoxon Signed Ranks Testb.
GR = 1.00c.
Table 4.25 Wilcoxon Tests Results for Algometer by Group.
In the case of group A all three p values are less than 0.05 which allows
us to reject the Null hypothesis in all three cases and conclude that there
is a significant difference in population means, in other words the
Algometer scores change significantly in each of the sequential visits.
Group A – Is as expected due to the treatment received by its action
of dual mechanism (as seen above on page 47)
Group B – holds true for Placebo, where there is no treatment effect
Group C– The Ultrasound group readings improved due to the Mechanical
stimulation of the superficial nerve endings by means of the head of the
Ultrasound, causing an increase in mechano-receptive activity as per the “Gate
control theory” (Melzack and Wall,1965) and due to other theories discussed on
pages 46 and 47.
The micro-massage effects and vascular effects also contribute to the improved
readings (Kitchen and Bazin, 1996) as seen above on page 46.

Chapter 4 : Results and Discussion of Results
69
4.3.2 Inter Group Tests 4.3.2 a Subjective : Note in this case difference scores between visits are calculated i.e : the score
for visit 1 minus the score for visit 2 and so on. These difference columns are
then compared across groups.
CMCC
Test Statis ticsa,b
2.730 1.732 9.101
2 2 2
.255 .421 .011
Chi-Square
df
Asymp. Sig.
CMCCD12 CMCCD23 CMCCD13
Kruskal Wallis Testa.
Grouping Variable: GRb.
Table 4.26 Kruskal wallis Test Results for CMCC
Since the p value for the difference scores from visit one and three is less than
0.05 which equals the significance value then one can reject the Null hypothesis
here and conclude that of all three groups one has a population mean difference
which is significantly different to the other two. As to where that difference
occurs, is followed up by the Mann Whitney Tests.
A and B
Table 4.27 Mann Whitney Test-ranks output Results for visits 1 and 2
Ranks
20 25.90 518.00
20 15.10 302.00
40
GR
A
B Total
CMCCD13 N Mean Rank Sum of Ranks

Chapter 4 : Results and Discussion of Results
70
Test Statis ticsb
92.000
302.000
-2.956
.003
.003a
Mann-Whitney U
Wilcoxon W
Z
Asymp. Sig. (2-tailed)
Exact Sig. [2*(1-tailed
Sig.)]
CMCCD13
Not corrected for ties .a.
Grouping Variable: GRb.
Table 4.28 Mann Whitney Test-Final Results for visits 1 and 2 B and C
Table 4.29 Mann Whitney Test-ranks output Results for visits 2 and 3
Test Statis ticsb
188.000
398.000
-.328
.743
.758a
Mann-Whitney U
Wilcoxon W
Z
Asymp. Sig. (2-tailed)
Exact Sig. [2*(1-tailed
Sig.)]
CMCCD13
Not corrected for ties .a.
Grouping Variable: GRb.
Table 4.30 Mann Whitney Test-Final Results for visits 2 and 3 A and C
Table 4.31 Mann Whitney Test-ranks output Results for visits 1 and 3
Ranks
20 24.65 493.00
20 16.35 327.00
40
GR
A
C Total
CMCCD13 N Mean Rank Sum of Ranks
Ranks
20 21.10 422.00
20 19.90 398.00
40
GR
B
C Total
CMCCD13 N Mean Rank Sum of Ranks

Chapter 4 : Results and Discussion of Results
71
Table 4.32 Mann Whitney Test-Final Results for visits 1 and 3 The three p values are :
Groups A and B p value= 0.003 < 0.05, therefore reject the Null hypothesis.
Groups B and C p value = 0.758 < 0.05, therefore reject the Null hypothesis.
Groups A and C p value = 0.024 < 0.05, therefore reject the Null hypothesis.
Therefore the magnitudinal changes are significantly different in visits 1 and 3
across all three groups and this occurs significantly between groups A and B and
groups A and C according to the p values above and in both cases group A is
showing significantly higher drops than groups B and C.
Transeva – improves consistently and significantly for all readings when
comparing the CMCC (functional ability) readings between groups.
This concludes that there is a greater improvement to manage everyday life in
the Transeva group over the treatment regime.
Test Statistics b
117.000 327.000
-2.259 .024
.024 a
Mann-Whitney U Wilcoxon W
Z Asymp. Sig. (2-tailed) Exact Sig. [2*(1-tailed Sig.)]
CMCCD13
Not corrected for ties. a.
Grouping Variable: GR b.

Chapter 4 : Results and Discussion of Results
72
Numerical Pain Rating Scale
Test Statis ticsa,b
1.577 4.358 7.005
2 2 2
.454 .113 .030
Chi-Square
df
Asymp. Sig.
NRSD1_2 NRSD2_3 NRSD1_3
Kruskal Wallis Testa.
Grouping Variable: GRb.
Table 4.33 Kruskal wallis Test Results for NPRS
Since the p value for the difference scores from visit one and three is less than
0.05 which equals the significance value one can reject the Null hypothesis here
and conclude that of all three groups one has a population mean difference
which is significantly different to the other two. As to where that difference
occurs, is followed up by a few Mann Whitney Tests.
A and B
Table 4.34 Mann Whitney Test-ranks output Results for visits 1 and 2
Table 4.35 Mann Whitney Test-Final Results for visits 1 and 2
Ranks
20 24.60 492.00
20 16.40 328.00
40
GR
A
B Total
NRSD1_3 N Mean Rank Sum of Ranks
Test Statis ticsb
118.000
328.000
-2.224
.026
.026a
Mann-Whitney U
Wilcoxon W
Z
Asymp. Sig. (2-tailed)
Exact Sig. [2*(1-tailed
Sig.)]
NRSD1_3
Not corrected for ties.a.
Grouping Variable: GRb.

Chapter 4 : Results and Discussion of Results
73
B and C
Table 4.36 Mann Whitney Test-ranks output Results for visits 2 and 3
Test Statis ticsb
189.000
399.000
-.299
.765
.779a
Mann-Whitney U
Wilcoxon W
Z
Asymp. Sig. (2-tailed)
Exact Sig. [2*(1-tailed
Sig.)]
NRSD1_3
Not corrected for ties.a.
Grouping Variable: GRb.
Table 4.37 Mann Whitney Test-Final Results for visits 2 and 3 A and C
Table 4.38 Mann Whitney Test-ranks output Results for visits 1 and 3
Test Statis ticsb
114.500
324.500
-2.323
.020
.020a
Mann-Whitney U
Wilcoxon W
Z
Asymp. Sig. (2-tailed)
Exact Sig. [2*(1-tailed
Sig.)]
NRSD1_3
Not corrected for ties.a.
Grouping Variable: GRb.
Table 4.39 Mann Whitney Test-Final Results for visits 1 and 3
Ranks
20 21.05 421.00
20 19.95 399.00
40
GR
B
C Total
NRSD1_3 N Mean Rank Sum of Ranks
Ranks
20 24.78 495.50
20 16.23 324.50
40
GR
A
C Total
NRSD1_3 N Mean Rank Sum of Ranks

Chapter 4 : Results and Discussion of Results
74
The three p values are :
Groups A and B p value= 0.026 < 0.05, therefore reject the Null hypothesis.
Groups B and C p value = 0.779 < 0.05, therefore reject the Null hypothesis.
Groups A and C p value = 0.020 < 0.05, therefore reject the Null hypothesis.
Therefore the magnitudinal changes are significantly different in visits 1 and 3
across all three groups and this occurs significantly between groups A and B and
groups A and C according to the p values above and in both cases group A is
showing significantly higher drops than groups B and C.
Transeva – improves consistently and significantly for all readings when
comparing the NRS (subjective pain rating) readings between groups
Short Form Mc Gill Questionaire
Test Statis ticsa,b
2.934 3.765 4.239
2 2 2
.231 .152 .120
Chi-Square
df
Asymp. Sig.
SMD1_2 SMD2_3 SMD1_3
Kruskal Wallis Testa.
Grouping Variable: GRb.
Table 4.40 Kruskal wallis Test Results for SFMQ
Since no p values for the differences are less than 0.05 which equals the
significance value the study cannot reject the Null hypothesis in any of the three
cases, reflecting no significant magnitudinal changes across all three groups for
the short form McGill questionnaire. Evaluation of the statistical results of the
Kruskal Wallis test, the SFMQ readings did not change significantly across all
three groups which implied that there was minimal variance with regards to these
particular data collected. Reasons for this can be cultural bias, interpretation/
mis-interpretation of words or meaning. (Prout, 1996 and Sciotti, 2001)

Chapter 4 : Results and Discussion of Results
75
Also measurement tools measure gross improvement and therefore mask small
improvements as it cannot record them.
4.3.2b Objective CROM Readings :
FLEXION
Test Statisticsa,b
2.707 4.814 5.482
2 2 2
.258 .090 .065
Chi-Square
df
Asymp. Sig.
CRFD2_1 CRFD3_2 CRFD3_1
Kruskal Wallis Testa.
Grouping Variable: GRb.
Table 4.41 Kruskal wallis Test Results for CROM flexion
Since no p values for the differences are less than 0.05 which equals the
significance value the study cannot reject the Null hypothesis in any of the three
cases, reflecting no significant magnitudinal changes across all three groups for
the CROM (flex) scores.
One would expect there to be a difference between the groups, which can be
seen in the significance in CRFD3_1, where it approximates 0.005. Thus it is
suggested that this trend may be enhanced in future studies with increased
samples sizes or by means of more accurate measurement tools.

Chapter 4 : Results and Discussion of Results
76
EXTENSION
Test Statis ticsa,b
4.538 1.391 6.446
2 2 2
.103 .499 .040
Chi-Square
df
Asymp. Sig.
CRED2_1 CRED3_2 CRED3_1
Kruskal Wallis Testa.
Grouping Variable: GRb.
Table 4.42 Kruskal wallis Test Results for CROM extension
Since the p value for the difference scores from visit one and three is less than
0.05 which equals the significance value then one can reject the Null hypothesis
here and conclude that of all three groups one has a population mean difference
which is significantly different to the other two. As to where that difference
occurs, is followed up by a few Mann Whitney Tests.
A and B
Table 4.43 Mann Whitney Test-ranks output Results for visits 1 and 2
Test Statis ticsb
117.000
327.000
-2.279
.023
.024a
Mann-Whitney U
Wilcoxon W
Z
Asymp. Sig. (2-tailed)
Exact Sig. [2*(1-tailed
Sig.)]
CRED3_1
Not corrected for ties.a.
Grouping Variable: GRb.
Table 4.44 Mann Whitney Test final Results for visits 1 and 2
Ranks
20 24.65 493.00
20 16.35 327.00
40
GR
A
B Total
CRED3_1 N Mean Rank Sum of Ranks

Chapter 4 : Results and Discussion of Results
77
B and C
Table 4.45 Mann Whitney Test-ranks output results for visits 2 and 3 A and C
Table 4.46 Mann Whitney Test-ranks output Results for visits 1 and 3
Test Statis ticsb
123.500
333.500
-2.099
.036
.038a
Mann-Whitney U
Wilcoxon W
Z
Asymp. Sig. (2-tailed)
Exact Sig. [2*(1-tailed
Sig.)]
CRED3_1
Not corrected for ties.a.
Grouping Variable: GRb.
Table 4.47 Mann Whitney Test-Final Results for visits 1 and 3 The three p values are :
Groups A and B p value= 0.024 < 0.05, therefore reject the Null hypothesis.
Groups B and C p value = 0.883 < 0.05, therefore reject the Null hypothesis.
Groups A and C p value = 0.038 < 0.05, therefore reject the Null hypothesis.
Ranks
20 20.80 416.00
20 20.20 404.00
40
GR
B
C Total
CRED3_1 N Mean Rank Sum of Ranks
Ranks
20 24.33 486.50
20 16.68 333.50
40
GR
A
C Total
CRED3_1 N Mean Rank Sum of Ranks

Chapter 4 : Results and Discussion of Results
78
Therefore the magnitudinal changes are significantly different in visits 1 and 3
across all three groups and this occurs significantly between groups A and B and
groups A and C according to the p values above and in both cases group A
shows significantly higher drops than groups B and C.
This concludes that the Transeva group improves consistently and significantly
for all readings when comparing the extension ROM readings between groups.
This indicates improvement in muscle contraction of the Trapezius and Levator
Scapula.
LATERAL FLEXION-RIGHT
Test Statis ticsa,b
.437 6.492 4.100
2 2 2
.804 .039 .129
Chi-Square
df
Asymp. Sig.
CRLFRD21 CRLFRD32 CRLFRD31
Kruskal Wallis Testa.
Grouping Variable: GRb.
Table 4.48 Kruskal wallis Test Results for CROM LF right
Since the p value for the difference scores from visit two and three is less than
0.05 which equals the significance value then one can reject the Null hypothesis
here and conclude that of all three groups one has a population mean difference
which is significantly different to the other two. As to where that difference
occurs, is followed up the Mann Whitney Tests.
A and B
Table 4.49 Mann Whitney Test-ranks output Results for visits 1 and 2
Ranks
20 24.73 494.50
20 16.27 325.50
40
GR
A
B Total
CRLFRD32 N Mean Rank Sum of Ranks

Chapter 4 : Results and Discussion of Results
79
Test Statis ticsb
115.500
325.500
-2.417
.016
.021a
Mann-Whitney U
Wilcoxon W
Z
Asymp. Sig. (2-tailed)
Exact Sig. [2*(1-tailed
Sig.)]
CRLFRD32
Not corrected for ties .a.
Grouping Variable: GRb.
Table 4.50 Mann Whitney Test-Final Results for visits 1 and 2 B and C
Table 4.51 Mann Whitney Test-ranks output Results for visits 2 and 3
Test Statis ticsb
161.500
371.500
-1.145
.252
.301a
Mann-Whitney U
Wilcoxon W
Z
Asymp. Sig. (2-tailed)
Exact Sig. [2*(1-tailed
Sig.)]
CRLFRD32
Not corrected for ties .a.
Grouping Variable: GRb.
Table 4.52 Mann Whitney Test Final Results for visits 2 and 3 A and C
Ranks
20 18.58 371.50
20 22.43 448.50
40
GR
B
C
total
CRLFRD32 N Mean Rank Sum of Ranks
Ranks
20 23.08 461.50
20 17.93 358.50
40
GR
A
C Total
CRLFRD32 N Mean Rank Sum of Ranks

Chapter 4 : Results and Discussion of Results
80
Table 4.53 Mann Whitney Test-ranks output Results for visits 1 and 3
Test Statis ticsb
148.500
358.500
-1.533
.125
.165a
Mann-Whitney U
Wilcoxon W
Z
Asymp. Sig. (2-tailed)
Exact Sig. [2*(1-tailed
Sig.)]
CRLFRD32
Not corrected for ties .a.
Grouping Variable: GRb.
Table 4.54 Mann Whitney Test-Final Results for visits 1 and 3
The three p values are :
Groups A and B p value= 0.021 < 0.05, therefore reject the Null hypothesis.
Groups B and C p value = 0.3019 < 0.05, therefore reject the Null hypothesis.
Groups A and C p value = 0.165 < 0.05, therefore reject the Null hypothesis.
Therefore the magnitudinal changes are significantly different in visits 2 and 3
across all three groups and this occurs significantly between groups A and B
which shows significantly higher drops than the other group combinations.
These results are consistent with theories discussed under intra-group tests. (see
above on pages 45-47)
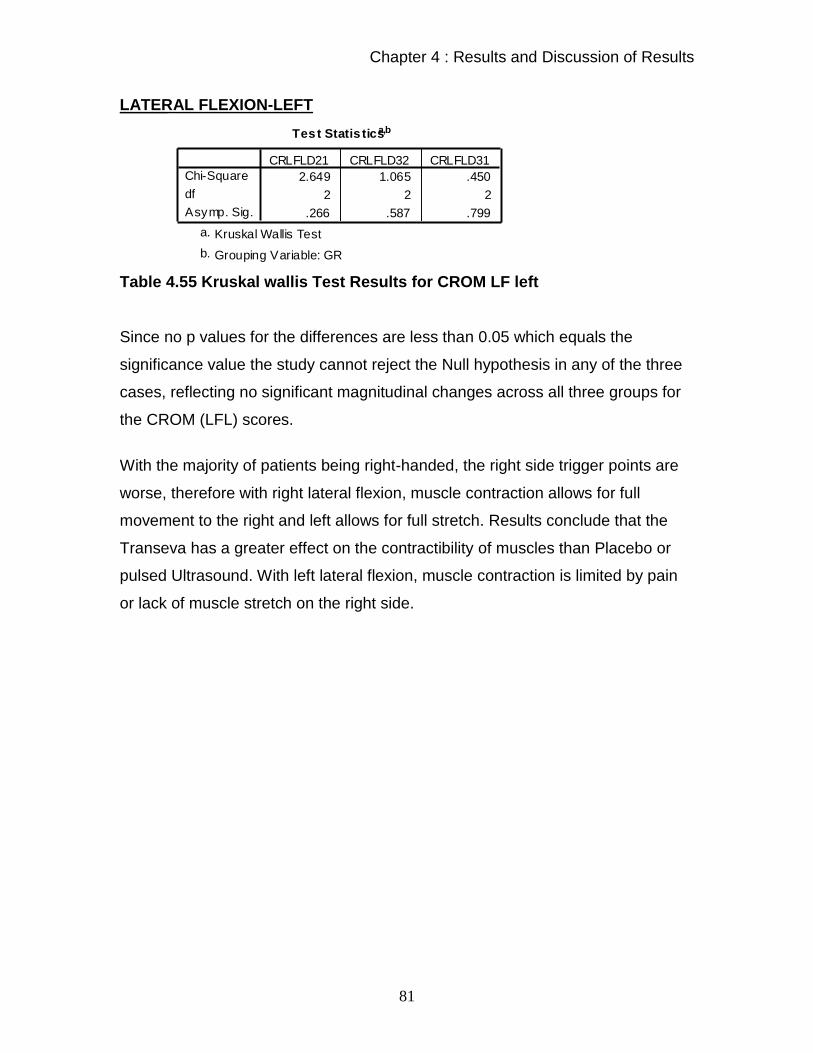
Chapter 4 : Results and Discussion of Results
81
LATERAL FLEXION-LEFT
Test Statis ticsa,b
2.649 1.065 .450
2 2 2
.266 .587 .799
Chi-Square
df
Asymp. Sig.
CRLFLD21 CRLFLD32 CRLFLD31
Kruskal Wallis Testa.
Grouping Variable: GRb.
Table 4.55 Kruskal wallis Test Results for CROM LF left
Since no p values for the differences are less than 0.05 which equals the
significance value the study cannot reject the Null hypothesis in any of the three
cases, reflecting no significant magnitudinal changes across all three groups for
the CROM (LFL) scores.
With the majority of patients being right-handed, the right side trigger points are
worse, therefore with right lateral flexion, muscle contraction allows for full
movement to the right and left allows for full stretch. Results conclude that the
Transeva has a greater effect on the contractibility of muscles than Placebo or
pulsed Ultrasound. With left lateral flexion, muscle contraction is limited by pain
or lack of muscle stretch on the right side.

Chapter 4 : Results and Discussion of Results
82
ROTATION-RIGHT
Test Statis ticsa,b
1.290 1.765 1.625
2 2 2
.525 .414 .444
Chi-Square
df
Asymp. Sig.
CRRRD2_1 CRRRD3_2 CRRRD3_1
Kruskal Wallis Testa.
Grouping Variable: GRb.
Table 4.56 Kruskal wallis Test Results for CROM Rot right
Since no p values for the differences are less than 0.05 which equals the
significance value the study cannot reject the Null hypothesis in any of the three
cases, reflecting no significant magnitudinal changes across all three groups for
the CROM (ROT R) scores.
ROTATION-LEFT
Test Statis ticsa,b
.354 5.914 5.467
2 2 2
.838 .052 .065
Chi-Square
df
Asymp. Sig.
CRRLD2_1 CRRLD3_2 CRRLD3_1
Kruskal Wallis Testa.
Grouping Variable: GRb.
Table 4.57 Kruskal wallis Test Results for CROM Rot left
Since no p values for the differences are less than 0.05 which equals the
significance value the study cannot reject the Null hypothesis in any of the three
cases, reflecting no significant magnitudinal changes across all three groups for
the CROM (ROT L) scores.
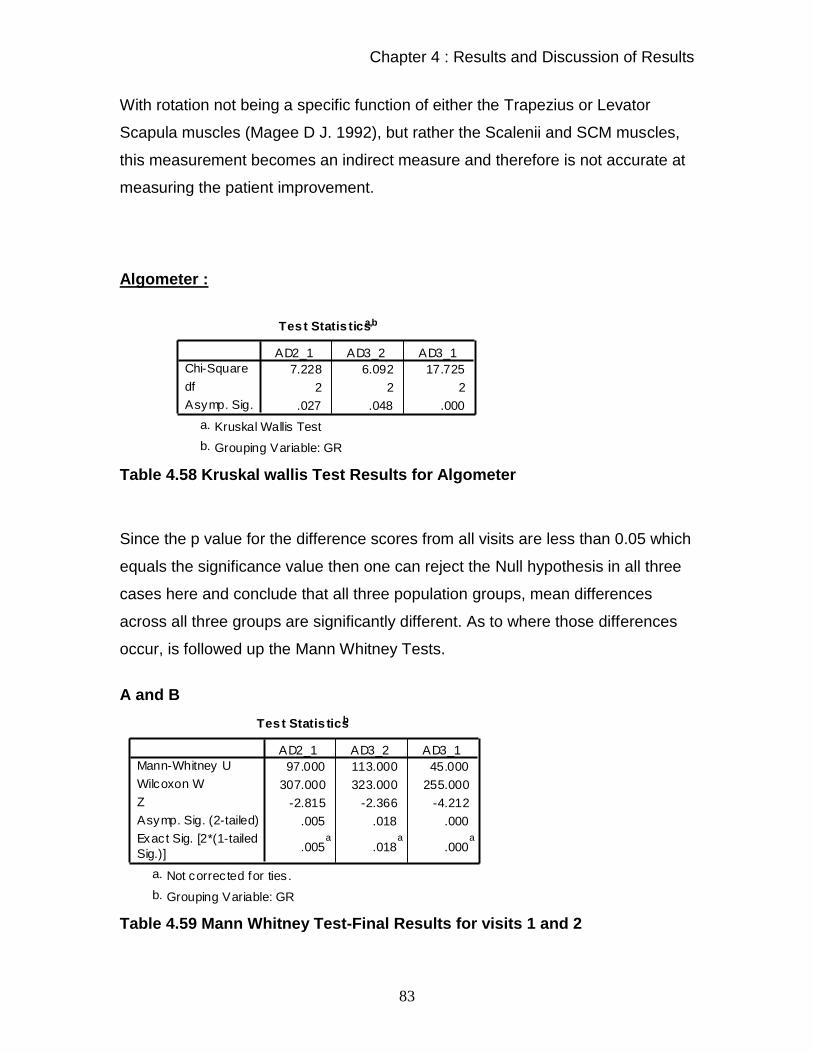
Chapter 4 : Results and Discussion of Results
83
With rotation not being a specific function of either the Trapezius or Levator
Scapula muscles (Magee D J. 1992), but rather the Scalenii and SCM muscles,
this measurement becomes an indirect measure and therefore is not accurate at
measuring the patient improvement.
Algometer :
Test Statis ticsa,b
7.228 6.092 17.725
2 2 2
.027 .048 .000
Chi-Square
df
Asymp. Sig.
AD2_1 AD3_2 AD3_1
Kruskal Wallis Testa.
Grouping Variable: GRb.
Table 4.58 Kruskal wallis Test Results for Algometer
Since the p value for the difference scores from all visits are less than 0.05 which
equals the significance value then one can reject the Null hypothesis in all three
cases here and conclude that all three population groups, mean differences
across all three groups are significantly different. As to where those differences
occur, is followed up the Mann Whitney Tests.
A and B
Test Statis ticsb
97.000 113.000 45.000
307.000 323.000 255.000
-2.815 -2.366 -4.212
.005 .018 .000
.005a
.018a
.000a
Mann-Whitney U
Wilcoxon W
Z
Asymp. Sig. (2-tailed)
Exact Sig. [2*(1-tailed
Sig.)]
AD2_1 AD3_2 AD3_1
Not corrected for ties .a.
Grouping Variable: GRb.
Table 4.59 Mann Whitney Test-Final Results for visits 1 and 2
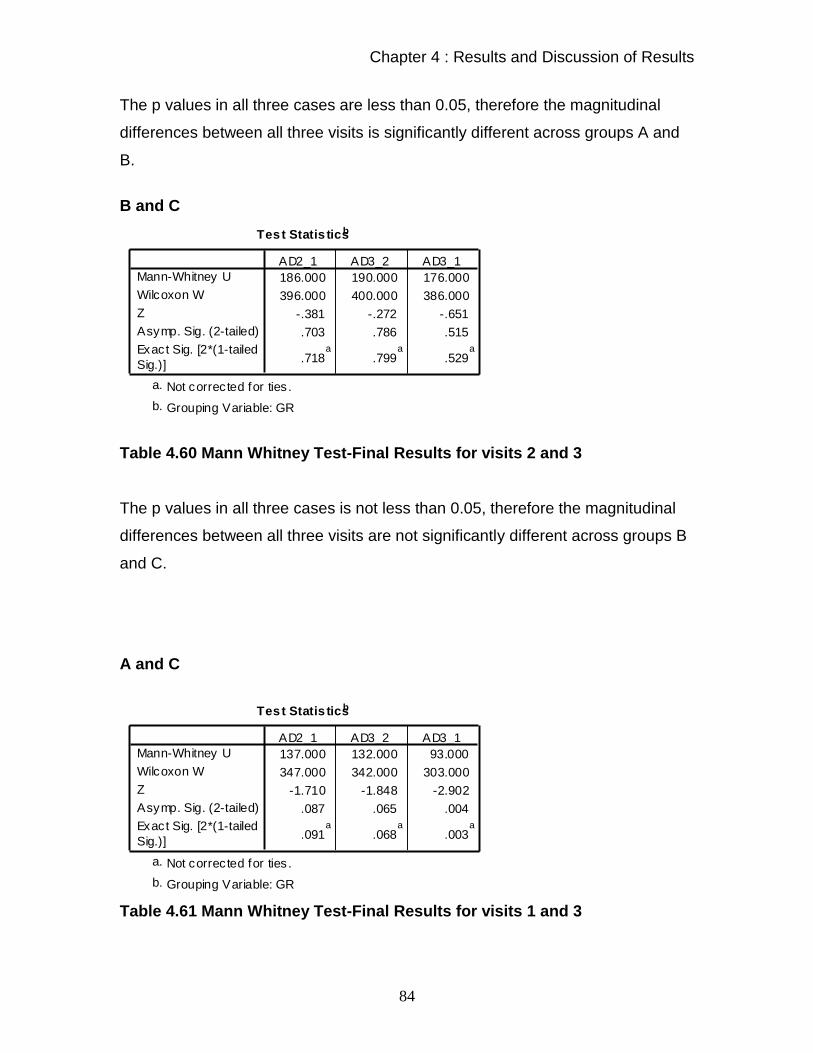
Chapter 4 : Results and Discussion of Results
84
The p values in all three cases are less than 0.05, therefore the magnitudinal
differences between all three visits is significantly different across groups A and
B.
B and C
Test Statis ticsb
186.000 190.000 176.000
396.000 400.000 386.000
-.381 -.272 -.651
.703 .786 .515
.718a
.799a
.529a
Mann-Whitney U
Wilcoxon W
Z
Asymp. Sig. (2-tailed)
Exact Sig. [2*(1-tailed
Sig.)]
AD2_1 AD3_2 AD3_1
Not corrected for ties .a.
Grouping Variable: GRb.
Table 4.60 Mann Whitney Test-Final Results for visits 2 and 3 The p values in all three cases is not less than 0.05, therefore the magnitudinal
differences between all three visits are not significantly different across groups B
and C.
A and C
Test Statis ticsb
137.000 132.000 93.000
347.000 342.000 303.000
-1.710 -1.848 -2.902
.087 .065 .004
.091a
.068a
.003a
Mann-Whitney U
Wilcoxon W
Z
Asymp. Sig. (2-tailed)
Exact Sig. [2*(1-tailed
Sig.)]
AD2_1 AD3_2 AD3_1
Not corrected for ties .a.
Grouping Variable: GRb.
Table 4.61 Mann Whitney Test-Final Results for visits 1 and 3

Chapter 4 : Results and Discussion of Results
85
The p values in one of the three cases is less than 0.05, therefore the
magnitudinal differences between visits 1 and 3 is significantly different across
groups A and C.
Therefore, from the above results in all three visits, group A shows significantly
higher increases, at all stages, than group B. Group B and group C do not show
any significant differences in increases and group A only shows a significant
higher increase between visits 1 and 3 than group C.
These results are consistent with theories discussed under intra – group
algometer results.
Group A – Is as expected due to the treatment received by its action
of dual mechanism, both vascular and neurological.( as seen above on page 47)
Group B – Holds true for Placebo, where there is no treatment effect (As seen
above on page 45)
Group C– The Ultrasound group readings improved due to the Mechanical
stimulation of the superficial nerve endings by means of the head of the
Ultrasound, causing an increase in mechano-receptor activity as per the “Gate
control theory” (Melzack and Wall,1965)
The micro-massage effects and vascular effects as seen above ( page 46) also
contributed to the improved readings. (Kitchen and Bazin ,1996)
Therefore Transeva showed improvement in the patients’ ability to manage everyday life
and showed a greater reduction in the quality and intensity of pain between all
three visits than the Placebo Transeva or Pulsed Ultrasound group over the
duration of the research program.

Chapter 4 : Results and Discussion of Results
86
Transeva group improved consistently and significantly for all readings when
comparing the extension ROM readings between groups. This indicates
improvement in muscle contraction of the Trapezius and Levator Scapula.
Transeva group had a decreased pain threshold and intensity of the active
Trapezius and Levator Scapula trigger points diagnosed compared to the
Ultrasound and the Placebo groups
Thus it would seem that the Transeva by virtue of the dual mechanism is able to
achieve greater clinical efficacy than the Transeva Placebo group or the Pulsed
Ultrasound group.
Objective 1
The first objective of this study was to evaluate the effect of attenuated
therapeutic Faradic stimulation (Transeva), sham Faradism and pulsed
Ultrasound in terms of subjective clinical findings.
Hypothesis 1:
The hypothesis is that the attenuated Faradic current would decrease the
overall intensity of pain, from severe or moderate to mild or no pain
recorded by the Short-form Mcgill Pain Questionnaire and increase the
ability to manage everyday life as recorded by the CMCC Neck Disability
Index.
Hypothesis one is accepted for CMCC. Rejected for SFMPQ

Chapter 4 : Results and Discussion of Results
87
Objective 2
The second objective of this study is to evaluate the effect of therapeutic Faradic
stimulation, sham Faradism and pulsed Ultrasound in terms of objective clinical
criteria.
Hypothesis 2:
The hypothesis is that the attenuated faradic current will decrease the pain
threshold and intensity of the active Trapezius and Levator Scapular
trigger points diagnosed/ recorded by the Algometer; and will increase the
cervical range of motion measured by the CROM readings of cervical
flexion, extension, lateral flexion and rotation.
Hypothesis two is accepted for the Algometer readings and increased range of
motion in extension and right lateral flexion; but rejected for flexion, left lateral
flexion and rotation ranges of motion.
Objective 3
The third objective of this study is to compare the trends that are evident
between the subjective and the objective findings in order to ascertain whether
there is any relationship between the objective and subjective results achieved
Hypothesis 3
The hypothesis is that when the objective CROM measures show an
increase in the patients range of motion and when the patients trigger
points are not as active measured by the Algometer readings, then the
patients intensity of pain should be decreased according to McGill pain
Questionaire and their everyday life actions should be made easier
according to the CMCC Neck Disability index.

Chapter 4 : Results and Discussion of Results
88
As for hypothesis 1 and 2 above.
4.4 OBSERVATIONS: TRANSEVA TREATMENT Owing to the fact that no studies prior to this have been conducted on the
Transeva and very little information exists on its application and mechanism of
action, it is hoped that the following observations made throughout the research
program may provide a basis for further studies and contribute to the literature
currently available to this modality. These observations did not form part of the
data collected and analysed in the study, but are merely observations made by
the author and would certainly require further study to determine their validity.
One observation made was that when the Transeva patients came for the third
set of readings taken before the free chiropractic treatment, and reported on how
much better they were feeling, the Transeva treatment was then continued with
the normal chiropractic necessary adjustments in the cervical region. After a
phone call a few days later, it was reported that the treatment of both
manipulation and the Transeva was most successful.
Although there was no specific data collected to compare the rate of
improvement between men and women, the men in the group seemed to report a
more rapid rate of improvement than the women. This could not be confirmed
statistically, but at least 11 of the 14 men treated reported an 80% (or more)
reduction in their pain levels and /or symptoms after the first treatment. None of
the women showed as significant a reduction after one treatment. The author
suggests that this difference may be due to the larger muscle bulk in men, but
this is merely speculative and requires further research.

Chapter 5 : Conclusion & Recommendations
89
Chapter 5
Conclusion and Recommendations
5.1 Conclusion This study consisted of 60 patients, divided into 3 groups of 20 each. Every
patient underwent a full case history, physical, and cervical regional examination
in order to determine that they fitted the inclusion and exclusion criteria with
respect to active Trapezius and / or Levator Scapula trigger points.
Thereafter each patient was placed into either the Transeva, Placebo Transeva,
or Pulsed Ultrasound groups at random. Those patients that were in group A
were in the Transeva group, those in group B were in the Placebo Transeva
group and those in C were in the Pulsed Ultrasound group. All patients then
received 2 treatments and had 1 follow up consultation 1 week later.
At set intervals (prior to treatments 1 and 2, and at the follow up consultation)
measurements where taken with the CMCC, NPRS, and McGill pain
questionnaire (subjective readings), CROM and Algometer (objective readings).
The evaluation of these recordings showed that treatments showed a statistical
improvement in terms of subjective and objective clinical findings to conclude
that:
-Transeva showed improvement in the patient’s ability to manage everyday life
and showed a greater reduction in the quality and intensity of pain between all
three visits than the Placebo Transeva or Pulsed Ultrasound group over the
duration of the research program.

Chapter 5 : Conclusion & Recommendations
90
-Transeva group had a decreased pain intensity of the active Trapezius and
Levator Scapula trigger points diagnosed compared to the Ultrasound and the
Placebo groups.
-Transeva group improves consistently and significantly for all readings when
comparing the extension and right lateral flexion ROM readings between groups.
This indicates improvement in muscle contraction of the Trapezius and Levator
Scapula.
Thus it would seem that the Transeva by virtue of the dual mechanism is able to
achieve greater clinical efficacy than the Transeva Placebo group or the Pulsed
Ultrasound group.
Schneider (1995) states that Chiropractors who use only osseous manipulative
techniques will have great difficulty when attempting to treat patients with
Myofascial Pain Syndrome, for the trigger points found in this condition require
specific treatment, applied directly to the muscle tissue. This study provides the
Chiropractor with a simple, effective, non-invasive modality to add to the choice
of myofascial treatments currently available for use in the clinical environment.

Chapter 5 : Conclusion & Recommendations
91
6.2 Recommendations for future studies
There seems to be a need to educate parts of our society so that all may benefit
in that part of health care that chiropractic provides.
There seems to be a need for studies looking at increasing the number and
frequency of treatments to see whether Ultrasound is more effective on a
cumulative scale over an increased period.
With regards to the Ultrasound, it is suggested that this trend of results may be
enhanced in future studies with increased sample sizes and by means of more
accurate measurement tools.
It would be recommended to have a one-month follow-up with the patients to
assess continued results.
It has been interesting to note that Transeva Placebo and Pulsed Ultrasound are
of similar clinical benefit. These results do not correlate entirely to Pillay ‘s (2003)
findings in his Placebo-based research and this invites further investigation into
Placebo-Ultrasound in this field.
A more accurate representation of South African population may be obtained by
advertising to the broader community and using advertisements in their own
language. The non-caucasian races are in the majority in South Africa and more
information is needed regarding the epidemiology, etiology and treatment
regimens effective for such conditions in all South Africans, which can only be
obtained by further research.

Chapter 5 : Conclusion & Recommendations
92
In order to eliminate researcher bias towards a favoured treatment, it is
recommended that two experienced practitioners be assigned to a treatment
protocol each and the researcher takes note only of the readings, being blinded
from the treatments being applied to the patients.
Finally since Transeva treatment appears to be more effective than Placebo and
Pulsed Ultrasound for the treatment of Myofascial Pain Syndrome of the
Trapezius and Levator Scapula, further study suggestions include:
Comparison of this modality to other forms of Treatment for Myofascial
Pain (for example; dry needling, laser, injection or anti-inflammatories)
Using Myofascial Transeva treatment as part of a treatment protocol,
including Chiropractic adjustive techniques and education with regards to
home stretching and exercise routines, and comparing this protocol to
another.
Research into the efficacy of the Transeva for the treatment of conditions
where soft tissue adhesions and scar tissue contribute to pain and
restricted range of motion (for example; chronic tendonitis, capsulitis,
fibromyalgia etc)