the effects of the social structure of digital networks on ... · pdf filebampo et al.: the...
TRANSCRIPT
Information Systems ResearchVol. 19, No. 3, September 2008, pp. 273–290issn 1047-7047 �eissn 1526-5536 �08 �1903 �0273
informs ®
doi 10.1287/isre.1070.0152©2008 INFORMS
The Effects of the Social Structure of DigitalNetworks on Viral Marketing Performance
Mauro BampoSchool of Information Technology, Monash University, Melbourne, Australia,
Michael T. EwingDepartment of Marketing, Monash University, Melbourne, Australia,
Dineli R. MatherSchool of Engineering and Information Technology, Deakin University, Melbourne, Australia,
David StewartDepartment of Marketing, Monash University, Melbourne, Australia,
Mark WallaceSchool of Information Technology, Monash University, Melbourne, Australia,
Viral marketing is a form of peer-to-peer communication in which individuals are encouraged to pass onpromotional messages within their social networks. Conventional wisdom holds that the viral marketing
process is both random and unmanageable. In this paper, we deconstruct the process and investigate the for-mation of the activated digital network as distinct from the underlying social network. We then consider theimpact of the social structure of digital networks (random, scale free, and small world) and of the transmissionbehavior of individuals on campaign performance. Specifically, we identify alternative social network models tounderstand the mediating effects of the social structures of these models on viral marketing campaigns. Next,we analyse an actual viral marketing campaign and use the empirical data to develop and validate a computersimulation model for viral marketing. Finally, we conduct a number of simulation experiments to predict thespread of a viral message within different types of social network structures under different assumptions andscenarios. Our findings confirm that the social structure of digital networks play a critical role in the spreadof a viral message. Managers seeking to optimize campaign performance should give consideration to thesefindings before designing and implementing viral marketing campaigns. We also demonstrate how a simulationmodel is used to quantify the impact of campaign management inputs and how these learnings can supportmanagerial decision making.
Key words : digital communication; social structure of digital networks; viral marketingHistory : Anil Gupta, Senior Editor. This paper was received on July 14, 2006, and was with the authors
5 months for 2 revisions. Published online in Articles in Advance June 5, 2008.
1. IntroductionThe term “viral marketing” appears to have first beencoined by venture capitalist Steve Jurvetson in 1996 todescribe the marketing strategy of free e-mail serviceHotmail (Kaikati and Kaikati 2004). Since then, con-temporary business literature has become somewhatenamoured with the concept. Terms such as “word-of-web,” “word-of-mouse,” “customer-to-customer”
(C2C), or “peer-to-peer” (P2P) communication as wellas “buzz marketing” have also been variously asso-ciated with the process. The term “buzz,” almost bydefinition, has an ephemeral connotation. We con-cur with Dobele et al. (2005) and view “buzz” asan output or consequence of viral marketing. Theviral metaphor neatly captures the essence of thecommunications process and draws on a rich body
273
INFORMS
holds
copyrightto
this
article
and
distrib
uted
this
copy
asa
courtesy
tothe
author(s).
Add
ition
alinform
ation,
includ
ingrig
htsan
dpe
rmission
policies,
isav
ailableat
http://journa
ls.in
form
s.org/.
Bampo et al.: The Effects of the Social Structure of Digital Networks on Viral Marketing Performance274 Information Systems Research 19(3), pp. 273–290, © 2008 INFORMS
of literature in medicine and the health sciences (e.g.,Mather and Crofts 1999, Mather 2000).Viral marketing broadly describes any strategy
that encourages individuals to propagate a message,thus creating the potential for exponential growth inthe message’s exposure and influence. Kaikati andKaikati (2004) view it as “� � �word of mouth via a dig-ital platform � � � spreading the message via ‘word ofmouse’ and ensuring that the receivers have the inter-est to pass along the message to their acquaintances.”Similarly, Dobele et al. (2005) describe it as “encour-aging individuals to pass on messages received ina hypermedia environment, such as e-mail or othermessaging system.”Viral approaches have numerous advantages over
more traditional mass media. For example, there isa natural selection process embedded in the waythe message is propagated. This reduces redundancyin the sense that communication is more targeted.Other advantages include speed of diffusion and areduced likelihood for the message to be alteredby senders (in other words, a high degree of mes-sage integrity). And, if the message has an embed-ded call to action, then the conversion rate (i.e.,behavioral response) is potentially more quantifiablethan in other forms of mass communication. Viralcommunication also affords the marketer a greaterdegree of creative license through a message deliv-ery medium that is more intimate and personalized,thereby increasing the likelihood of reaching “hard-to-get” audience members.The viral process can be broadly modelled in terms
of three components: the social structure of the digitalnetwork through which the message is propagated,the behavioral characteristics of its members that facil-itate the propagation of the message, and a seedingstrategy that initiates the process. This study is basedon the model introduced by Stewart et al. (2004),where the underlying social network is representedby a random graph and network members’ behavioris defined by the susceptible-infective-removed (SIR)pattern from epidemic theory (Becker 1989).The objectives of the study are threefold: first,
to identify alternative social network models andto understand the mediating effects of social struc-tures of these models on viral marketing campaigns;second, to develop a process for modelling viral
marketing campaigns and empirically validate theensuing activated digital network model; and third,to conduct a number of simulation experiments toexplore the influence of the various controlled andexternal factors on viral campaigns.The article is set out as follows. First, we exam-
ine the viral marketing process and define variouscampaign performance metrics. We then model dif-ferent social structures as digital networks and defineparameters which describe the network and controlthe spread of the viral message. Next, we introduceempirical data from a recent viral marketing cam-paign carried out by a leading automotive manufac-turer, and develop a computer simulation model. Wethen describe a number of simulations which predictthe spread of a viral message within different kindsof social networks under different assumptions aboutthe network itself, the behavioral characteristics of itsmembers, and the seeding strategy that initiates theprocess. Finally, we draw conclusions about the medi-ating effect of the social structure of digital networkson campaign performance as well as the extent of thecontrol available to campaign managers.
2. Literature ReviewThe transition from traditional word-of-mouth net-works to digital networks has greatly expandedthe opportunities for bidirectional communication(Dellarocas 2003) and, in the process, created a per-vasive and intriguing phenomenon (Goldenberg et al.2001) that has piqued the attention of researchersfrom diverse disciplinary backgrounds. In reviewingthis rich body of cross-disciplinary literature, twoemerging streams are discernable: namely, a behav-ioral stream (incorporating advertising and market-ing) and a management science stream—with strongfoundations in information systems and operationsresearch.The behavioral stream has focused on characteris-
tics, motivations, and reported behaviors of customersand the extent to which these might influence the suc-cess of viral marketing campaigns. This has includedsurveys of intended purchasing behaviors (Gruenet al. 2006) as well as examining the interactionsbetween customer and product characteristics (Helm2000) and their effects on message transmission.
INFORMS
holds
copyrightto
this
article
and
distrib
uted
this
copy
asa
courtesy
tothe
author(s).
Add
ition
alinform
ation,
includ
ingrig
htsan
dpe
rmission
policies,
isav
ailableat
http://journa
ls.in
form
s.org/.
Bampo et al.: The Effects of the Social Structure of Digital Networks on Viral Marketing PerformanceInformation Systems Research 19(3), pp. 273–290, © 2008 INFORMS 275
Findings across the board in this research streamsuggest that inherent customer heterogeneity war-rants highly segmented viral campaigns to addressindividual customer differences and preferences. Mes-sage customization and social network status are twosalient antecedents to determining the “spread” of thecommunication (Phelps et al. 2004, Podoshen 2006).A third key determinant is customer motivations(Gelb and Sundaram 2002, Phelps et al. 2004), be theyintrinsic or extrinsic (e.g., reward programs, competi-tions, coupons).The behavioral research stream is generally more
applied and is aimed at practising managers lookingto utilise digital social networks and online word-of-mouth in a more effective manner. Sophisticated tar-geting strategies are suggested and discussed (Dobeleet al. 2005) and much emphasis is placed on accurateinitial targeting (seeding) of customers (Phelps et al.2004).Despite the early progress made by the behavioral
researchers, progress in this area has been somewhatlimited by virtue of the character of viral market-ing and word-of-mouth networks—there are ethi-cal ramifications regarding consumer privacy (Phelpset al. 2004) if researchers were to accurately trackand record data on all consumer interactions duringa particular viral campaign. Additionally, importantinformation as to why consumers propagate viral mar-keting messages, such as emotional engagement withthe message (Dobele et al. 2007) or why consumersseek or provide an opinion for word-of-mouth net-works (Goldsmith and Horowitz 2006), is difficult toobtain without directly interviewing or surveying theconsumer. To do so invites the possibility of experi-menter expectancy effects (Miller and Turnbull 1986,Rosenthal 1994) and potentially influencing the natu-ral activity of passing on the marketing message. Fur-thermore, given the uncontrollable and “explosive”nature of the spread of viral marketing campaignsand online word-of-mouth networks (Dobele et al.2005), accurate sampling of the population reached bya viral campaign is problematic.More formalized studies are also needed to
progress beyond extrapolated knowledge gleanedfrom (often modest) samples of customers (or stu-dents) to larger, more heterogeneous, “real world”
populations—in other words, to model actual behav-ior rather than intended or reported behavior (Gelband Sundaram 2002, Gruen et al. 2006, Helm 2000).The majority of behavioral research has also been lim-ited to snapshot studies (Ba and Pavlou 2002, Gruenet al. 2006), with little opportunity for longitudinalstudies to gauge the full extent of viral marketingcampaigns on consumers in the natural setting. Small-sized samples (Weinberg and Davis 2005) and con-strained populations from which samples have beendrawn (Phelps et al. 2004), limitations common toresearch of this type, also reduce the generalisabil-ity of the behavioral research findings in this area. Inaddition, theoretical explanations for how viral mar-keting functions (Phelps et al. 2004) would furtherenhance understandings and applications of this area.The management science stream, in contrast, has
focused more on the design aspects of specificmechanisms (especially online reputation feedbackmechanisms) and on the potential for influencing per-formance through deliberate structural and designmanipulation. Using given systems parameters anddifferent theoretical approaches (such as game the-ory), this body of work exploits mathematical mod-elling approaches to studying online communicationnetworks. In particular, the work of Dellarocas (2003,2005) illustrates how the design of a given system(such as an eBay-like reputation mechanism) canengender, support, and elicit certain responses fromcustomers rather than relying on customer-initiatedbehavior. Other researchers in this stream have intro-duced trust into their models, not as a preexist-ing characteristic of the customer but as a constructengendered by the system itself (Ba and Pavlou 2002,Pavlou and Gefen 2004). Trust is crucial in this con-text given that the anonymity of online members andlack of actual context (Dellarocas 2003) increases theopportunity for online fraud (Bolton et al. 2004). Thebuilding of online reputations has even been mod-elled as a capital asset that must be maintained andinvested in Rob and Fishman (2005).This body of management science literature poten-
tially provides a proactive approach to afford greatercontrol over the performance of online mechanisms.The mathematical models are elegant and sophisti-cated in their execution and provide a solid frame-work (with given assumptions) on which knowledgeof online processes can be further developed.
INFORMS
holds
copyrightto
this
article
and
distrib
uted
this
copy
asa
courtesy
tothe
author(s).
Add
ition
alinform
ation,
includ
ingrig
htsan
dpe
rmission
policies,
isav
ailableat
http://journa
ls.in
form
s.org/.
Bampo et al.: The Effects of the Social Structure of Digital Networks on Viral Marketing Performance276 Information Systems Research 19(3), pp. 273–290, © 2008 INFORMS
However, the focus of this body of work tends tobe on the characteristics of the systems, not the char-acteristics and behaviors of the customers. As such,many are limited by parameter assumptions that arenot replicated in real-world applications. Characteris-tics and behaviors of the online consumers are oftenunknown variables within mathematical models. Arange of consumer characteristics, for example, intrin-sic personal motivations (Bolton et al. 2004) and socio-economic status (Ba and Pavlou 2002, Gruen et al.2002) are difficult to quantify in models, and behaviorthat falls outside of model parameters is equally prob-lematic (Dellarocas 2005). Additionally, some mod-els looking at consumer-generated feedback assumethat feedback is truthful and not manipulated (Boltonet al. 2004). Even when manipulation is factored asa variable in Internet opinion forum models, there isan underlying assumption that consumers are com-petent to gauge levels of manipulation by compa-nies (Dellarocas 2006) to adjust their own behavioraccordingly. Research in this area has indicated a needto further understand design and parameter impli-cations, for developing responses such as trust inconsumers (Pavlou and Gefen 2004), and for control-ling the behavior of users, for example, identity fraud(Dellarocas 2003).A third avenue of inquiry appears to be emerging
that has the potential to bridge the aforementionedtwo literature streams. Mayzlin and her colleagues(Chevalier and Mayzlin 2006, Godes and Mayzlin2004, Mayzlin 2006) draw on both behavioraland management science traditions and approachcustomer-generated characteristics and behaviors asconstructs which can be utilised as known quanti-ties in mathematical models. Godes and Mayzlin’s(2004) work, in particular, applies real-world data to amodel to reveal which components of word-of-mouthcommunication are most effective. Components suchas reach (Godes and Mayzlin 2004), quality of net-works (Goldenberg et al. 2001), and quality of themessage or feedback (Chevalier and Mayzlin 2006)can be modelled. Such information can potentiallyassist managers in predicting the usefulness of a par-ticular word-of-mouth strategy and the potential forflow-on marketing to continue even after the initialadvertising has ended (Goldenberg et al. 2001).
Notwithstanding the emerging bodies of literaturein this field, notable gaps still exist. In particular,Dellarocas’ (2003) call for more research on feedbackmechanism design can be extended more broadlyto other aspects of viral marketing/P2P commu-nication, including theory-driven experimental andempirical research that explores the global impact ofbuyer-seller behavior and a better understanding ofhow managers must adapt their strategies in onlinecontexts. Our study builds on Mayzlin’s foundationsand goes some way toward addressing Dellarocas’call. In so doing, it aims to assist firms to developmore formalised and sophisticated approaches toviral marketing (Helm 2000).
3. Deconstructing the Viral ProcessWe deconstruct the viral marketing process into thefollowing components: underlying population andtheir social connectivity; the campaign characteris-tics; the behavioral characteristics of the audience thatfacilitates the propagation of the message; the size andconnectivity of the successfully reached audience; andmeasures of dynamic campaign progress. Specifically,we model the size and connectivity of the popula-tion as a network, taking into account the campaigncharacteristics. We then simulate the campaign, andthe campaign performance measures are reflected asproperties of the simulation.
3.1. The Structure of a Digital NetworkA network is specified by a set of nodes and a setof edges linking pairs of nodes. The nodes representmembers of the population, or audience, and theedges represent communication links between themthat may be used to spread the viral message. Thedegree of a node is the number of edges linking it toother nodes. Two nodes are connected if there is asequence of edges forming a path from one node tothe other. Thus, a node with degree zero is not con-nected to any other node. The distance between twoconnected nodes is the length of the shortest path con-necting them.Three properties of a network that will be used in
this paper are: (i) its number of nodes N , (ii) the aver-age degree of its nodes �, and (iii) the average distancebetween pairs of nodes L. The parameter � is a measureof network connectedness.
INFORMS
holds
copyrightto
this
article
and
distrib
uted
this
copy
asa
courtesy
tothe
author(s).
Add
ition
alinform
ation,
includ
ingrig
htsan
dpe
rmission
policies,
isav
ailableat
http://journa
ls.in
form
s.org/.
Bampo et al.: The Effects of the Social Structure of Digital Networks on Viral Marketing PerformanceInformation Systems Research 19(3), pp. 273–290, © 2008 INFORMS 277
3.1.1. Random Networks. Stewart et al. (2004)introduced a random viral marketing model (RVM)based on the random network model developed byErdös and Rényi (1959) and described by Albert andBarabási (2002). This digital network is representedby a random graph and network members’ behav-ior is defined by the susceptible-infective-removedsequence (Becker 1989). A random network can begenerated by starting with a set of isolated nodes andallowing each of the N nodes to have a probability �
of being connected by an edge to each other node.As noted by Albert and Barabási (2002), in a ran-
dom network the degree of its nodes follows a bino-mial distribution with parameters N − 1 and �. Aseach node has the potential to connect up to N − 1other nodes, on average we expect each node to beconnected to � = ��N − 1� other nodes, resulting inan expected total of 1
2�N links. In the context of viralmarketing, a typical network has large N and small �
resulting in the average degree � remaining moderate.The degree of a node therefore has an approximatePoisson distribution with mean network connected-ness �. Because the standard deviation is
√�, it is very
unlikely for a node to have degree of size comparablewith N . In other words, it is unlikely that any node isdirectly linked to a significant proportion of the nodesin the network.
3.1.2. Scale-Free Networks. Research into scale-free networks has proliferated since their introductionby Barabási (1999) and Albert and Barabási (2002).These networks provide useful representations ofmany different self-organizing systems, ranging fromthe World Wide Web to citation patterns in scientificpublications to the electrical power grid of westernUnited States. The defining characteristic of a scale-free network is in the shape of the probability dis-tribution for the degree of each node, which deter-mines the number of communication links or edgesemanating from each member. The degree is assumedto follow a Power-law distribution, defined by P�k� ∝k−� with � > 0, where P�k� denotes the probabilitythat a node is connected to k other nodes. This is a“fat-tailed” distribution where, with increasing k, theprobabilities decline at a much slower rate than thoseof the Poisson distribution which essentially underliesthe RVM model. The Power-law distribution allowsfor a small number of nodes to be directly linked to
a significant proportion of the nodes in the networkwhile most nodes have few connections, thus keepingthe mean number of connections comparatively low.These high degree nodes, often called hubs, ensurethat the average distance L between any two nodes inthe network is small (independent of the size of thenetwork).The scale-free network structure emerges naturally
as a consequence of two phenomena: dynamic growthand preferential attachment (Barabási 1999, Albertand Barabási 2002), both important features of socialnetworks. Where a network is created by adding newmembers over time and these are connected to othermembers with a probability that is proportional totheir connectivity, the resulting distribution for thedegree or number of connections per node will exhibita Power-law distribution. These structures are calledscale-free networks because despite their growth, theypreserve statistical properties such as the average dis-tance L and the degree distribution.Some studies (Dorogovtsev and Mendes 2003,
Drineas et al. 2004), based on analysis of the traffic onSMTP servers, show that e-mail networks of limitedsize (involving members of a single university) dis-play properties of a scale-free network. e-mail graphswere constructed in those studies, representing e-mailaddresses by nodes and adding a communication linkbetween each pair of nodes where at least one mes-sage had passed between them. Both the number ofincoming and outgoing links have been shown to fol-low a Power-law distribution. This feature of e-mailgraphs makes scale-free networks particularly inter-esting from a viral marketing perspective. To create ascale-free graph, nodes are added one by one to thenetwork; every new node is linked by an undirectedarc to a preexisting node l with probability
P�l� = �
2· dl∑
m dm
�
dl being the degree of node l, {m} the set of previ-ously added nodes, and � the desired average degreeof the network. Theoretical models of the spread ofdiseases and the absence of epidemic thresholds inscale-free networks are discussed at length in Bogunaet al. (2003), Eguıluz and Klemm (2002), Moreno andVázquez (2003), and Pastor-Satorras and Vespignani(2001).
INFORMS
holds
copyrightto
this
article
and
distrib
uted
this
copy
asa
courtesy
tothe
author(s).
Add
ition
alinform
ation,
includ
ingrig
htsan
dpe
rmission
policies,
isav
ailableat
http://journa
ls.in
form
s.org/.
Bampo et al.: The Effects of the Social Structure of Digital Networks on Viral Marketing Performance278 Information Systems Research 19(3), pp. 273–290, © 2008 INFORMS
3.1.3. SmallWorldNetworks. Small world graphswere first introduced by Watts and Strogatz (1998) tomodel a class of social networks characterized by highclustering and short average distance between nodes.Clustering is a local property of the network and is ameasure of the connectivity of a neighbourhood. Theclustering coefficient C of a node is defined as the frac-tion of the node’s neighbours that are linked to eachother. High clustering and long average distances aretypical features of lattice networks (Dorogovtsev andMendes 2003), where nodes can be thought of aspoints in a multidimensional space and nearby pointsare linked by edges. In contrast, small world networkshave short average distances between nodes.Small world networks can be constructed from
lattice networks by applying a rewiring procedure:arcs connecting neighbours (within the clusters) areremoved from the graph with probability rewiringprobability r and substituted by random links (mak-ing connections outside of the cluster). As r increases,the average distance L decreases very quickly (Wattsand Strogatz 1998), producing a graph structure char-acterized by low node separation typical of randomnetworks and strongly connected neighbourhoods ofregular networks. With increasing r , the graph startsto become more like a random network. The tran-sition, however, is smooth and the evolution of theaverage distance and level of clustering is also influ-enced by N (Barthélémy and Amaral 1999).Small world networks are also potentially appli-
cable to viral marketing because they capture theconnections generated through physical proximity.Tightly linked neighbourhoods reflect social struc-tures based on friendship or professional relationshipswhich are likely to form among people who interactwithin a confined physical environment. For exam-ple, Albert and Barabási (2002) refer to a social systemwhere people are well-connected with their neigh-bours and work colleagues but also have a muchsmaller number of connections with people who livefar away, in another state or country. Random linksrepresent the distant acquaintances and are usefulin representing connections between local networks.A higher level of rewiring makes the viral messagespread faster and thus saturates the network sooner.
3.2. Campaign CharacteristicsThe impact of a viral marketing campaign can beinfluenced by the message attractiveness, the cam-paign design, and any intervention strategies. Theattractiveness or perceived value of a viral message aswell as offering an incentive (if any) play an impor-tant role in determining a recipient’s propensity toforward the communication as well as which com-munication links to activate from within their digitalnetwork connections. The campaign manager deter-mines the number of seeds used, with seeding typi-cally taking place at the start of a campaign. Once acampaign is in progress, there are a number of waysin which a campaign manager can track its progress.For example, if the campaign includes a call to actionsuch as an online coupon or uses a Web interface as aregistration process, it is possible to identify the signsof a flagging campaign and take corrective action toresuscitate it.
3.3. Modelling the Propagation of a Viral MessageThe behavior of network nodes determines the propa-gation of the message through the network. Networkpropagation is modelled on a discrete time basis. Prop-agation along network edges occurs simultaneously ateach time instant. Using the SIR sequence nodes canbe in three states: (i) S—susceptible; (ii) I—infective;and (iii) R—removed (or “immune”) and at any giventime, the total number of nodes N = S + I + R. Eachnode is in a “susceptible” state before receiving themessage. On receiving the message, a node becomesinfected and remains “infective” for one time periodwhen it may propagate (forward) the message alongany of its edges according to a probability pF (sam-pled from a probability distribution) which we referto as the forwarding parameter. This is analogous tothe contagion parameter in epidemic theory (Becker1989), as in a digital context the contagion parame-ter refers to the probability of forwarding a message.After that time period, the node becomes “immune”to the message (removed) and takes no further partin the propagation process. Thus, we assume that anyfurther messages reaching the node are ignored in theSIR sequence, as described by Moreno and Vázquez(2003).We employ the concept of a generation G (Stewart
et al. 2004) to identify the nodes reached by the mes-sage at each time instant, with the seeds forming the
INFORMS
holds
copyrightto
this
article
and
distrib
uted
this
copy
asa
courtesy
tothe
author(s).
Add
ition
alinform
ation,
includ
ingrig
htsan
dpe
rmission
policies,
isav
ailableat
http://journa
ls.in
form
s.org/.
Bampo et al.: The Effects of the Social Structure of Digital Networks on Viral Marketing PerformanceInformation Systems Research 19(3), pp. 273–290, © 2008 INFORMS 279
initial (zeroth) generation of the network membersreached. Hence, the generation can be used to indexthe sequence of transmissions. Under the SIR pattern,nodes forming each generation are the only infec-tive ones.
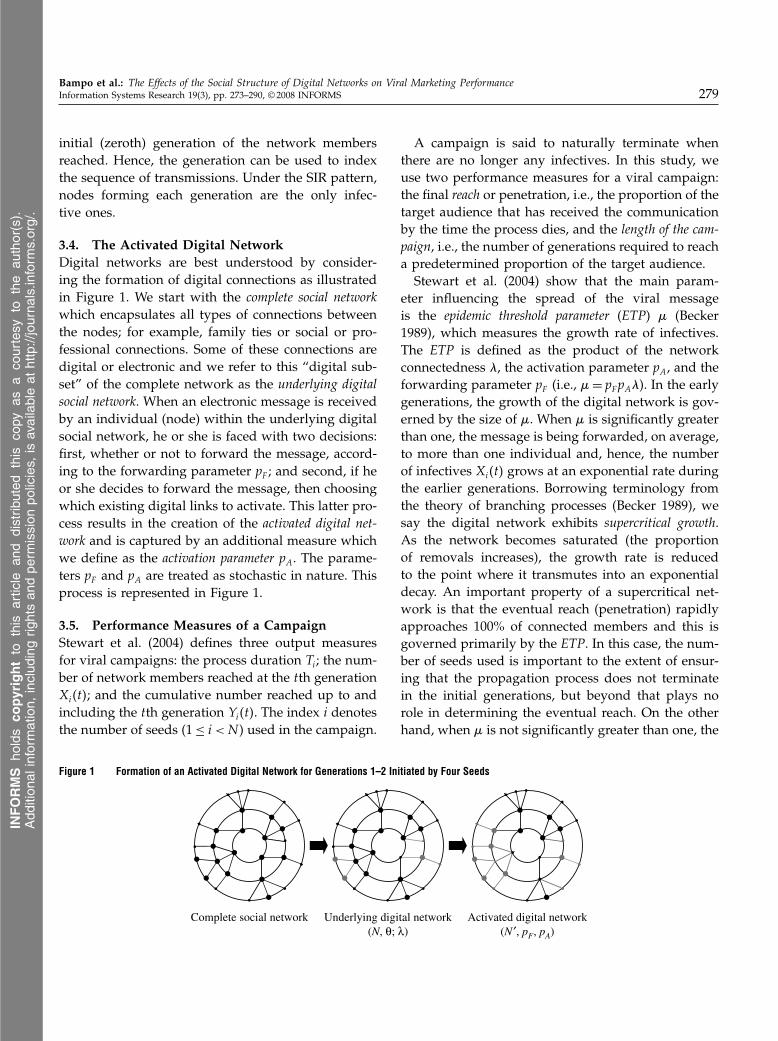
3.4. The Activated Digital NetworkDigital networks are best understood by consider-ing the formation of digital connections as illustratedin Figure 1. We start with the complete social networkwhich encapsulates all types of connections betweenthe nodes; for example, family ties or social or pro-fessional connections. Some of these connections aredigital or electronic and we refer to this “digital sub-set” of the complete network as the underlying digitalsocial network. When an electronic message is receivedby an individual (node) within the underlying digitalsocial network, he or she is faced with two decisions:first, whether or not to forward the message, accord-ing to the forwarding parameter pF ; and second, if heor she decides to forward the message, then choosingwhich existing digital links to activate. This latter pro-cess results in the creation of the activated digital net-work and is captured by an additional measure whichwe define as the activation parameter pA. The parame-ters pF and pA are treated as stochastic in nature. Thisprocess is represented in Figure 1.
3.5. Performance Measures of a CampaignStewart et al. (2004) defines three output measuresfor viral campaigns: the process duration Ti; the num-ber of network members reached at the tth generationXi�t�; and the cumulative number reached up to andincluding the tth generation Yi�t�. The index i denotesthe number of seeds (1≤ i < N ) used in the campaign.
Figure 1 Formation of an Activated Digital Network for Generations 1–2 Initiated by Four Seeds
Complete social network Underlying digital network(N, θ; λ)
Activated digital network(N ′, pF, pA)
A campaign is said to naturally terminate whenthere are no longer any infectives. In this study, weuse two performance measures for a viral campaign:the final reach or penetration, i.e., the proportion of thetarget audience that has received the communicationby the time the process dies, and the length of the cam-paign, i.e., the number of generations required to reacha predetermined proportion of the target audience.Stewart et al. (2004) show that the main param-
eter influencing the spread of the viral messageis the epidemic threshold parameter (ETP) (Becker1989), which measures the growth rate of infectives.The ETP is defined as the product of the networkconnectedness �, the activation parameter pA, and theforwarding parameter pF (i.e., = pF pA�). In the earlygenerations, the growth of the digital network is gov-erned by the size of . When is significantly greaterthan one, the message is being forwarded, on average,to more than one individual and, hence, the numberof infectives Xi�t� grows at an exponential rate duringthe earlier generations. Borrowing terminology fromthe theory of branching processes (Becker 1989), wesay the digital network exhibits supercritical growth.As the network becomes saturated (the proportionof removals increases), the growth rate is reducedto the point where it transmutes into an exponentialdecay. An important property of a supercritical net-work is that the eventual reach (penetration) rapidlyapproaches 100% of connected members and this isgoverned primarily by the ETP. In this case, the num-ber of seeds used is important to the extent of ensur-ing that the propagation process does not terminatein the initial generations, but beyond that plays norole in determining the eventual reach. On the otherhand, when is not significantly greater than one, the
INFORMS
holds
copyrightto
this
article
and
distrib
uted
this
copy
asa
courtesy
tothe
author(s).
Add
ition
alinform
ation,
includ
ingrig
htsan
dpe
rmission
policies,
isav
ailableat
http://journa
ls.in
form
s.org/.
Bampo et al.: The Effects of the Social Structure of Digital Networks on Viral Marketing Performance280 Information Systems Research 19(3), pp. 273–290, © 2008 INFORMS
network exhibits subcritical growth, where the numberof infectives Xi�t� decays at an exponential rate almostfrom the beginning of the campaign. In the subcriti-cal case, the number of seeds play an important roleas a higher penetration can be achieved by seeding awider proportion of the audience.
4. Design of the Simulation Modeland Empirical Validation
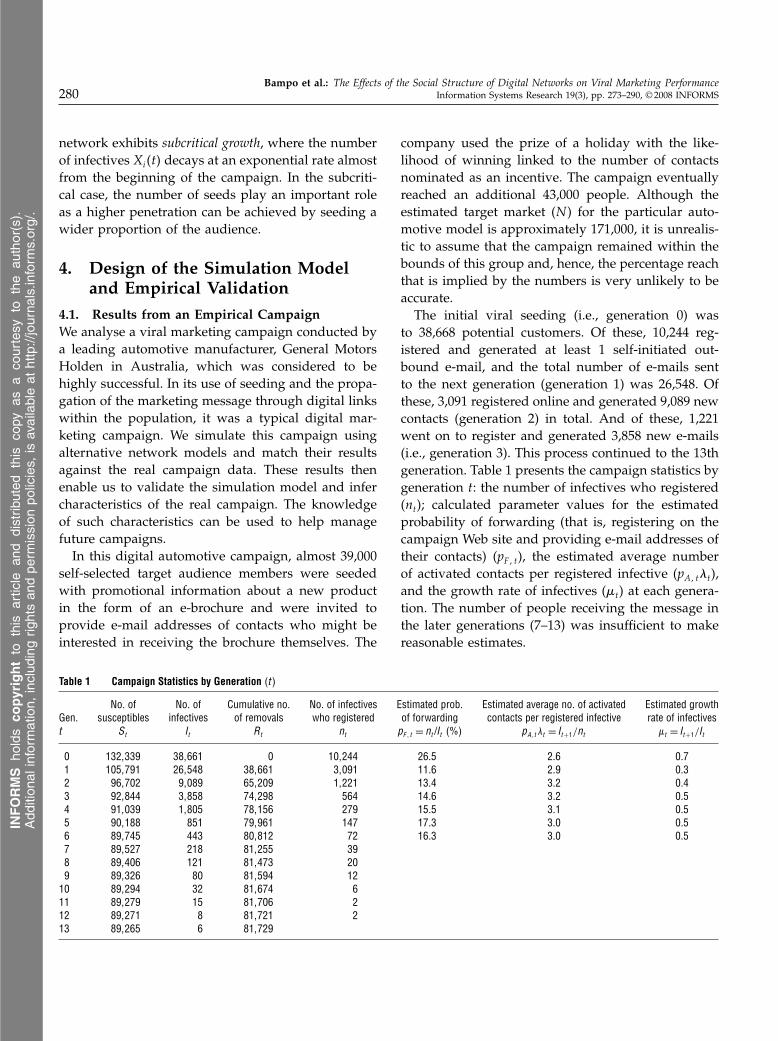
4.1. Results from an Empirical CampaignWe analyse a viral marketing campaign conducted bya leading automotive manufacturer, General MotorsHolden in Australia, which was considered to behighly successful. In its use of seeding and the propa-gation of the marketing message through digital linkswithin the population, it was a typical digital mar-keting campaign. We simulate this campaign usingalternative network models and match their resultsagainst the real campaign data. These results thenenable us to validate the simulation model and infercharacteristics of the real campaign. The knowledgeof such characteristics can be used to help managefuture campaigns.In this digital automotive campaign, almost 39,000
self-selected target audience members were seededwith promotional information about a new productin the form of an e-brochure and were invited toprovide e-mail addresses of contacts who might beinterested in receiving the brochure themselves. The
Table 1 Campaign Statistics by Generation �t�
No. of No. of Cumulative no. No. of infectives Estimated prob. Estimated average no. of activated Estimated growthGen. susceptibles infectives of removals who registered of forwarding contacts per registered infective rate of infectivest St It Rt nt pF � t = nt /It (%) pA� t�t = It+1/nt �t = It+1/It
0 132�339 38�661 0 10�244 26�5 2�6 0�71 105�791 26�548 38�661 3�091 11�6 2�9 0�32 96�702 9�089 65�209 1�221 13�4 3�2 0�43 92�844 3�858 74�298 564 14�6 3�2 0�54 91�039 1�805 78�156 279 15�5 3�1 0�55 90�188 851 79�961 147 17�3 3�0 0�56 89�745 443 80�812 72 16�3 3�0 0�57 89�527 218 81�255 398 89�406 121 81�473 209 89�326 80 81�594 12
10 89�294 32 81�674 611 89�279 15 81�706 212 89�271 8 81�721 213 89�265 6 81�729
company used the prize of a holiday with the like-lihood of winning linked to the number of contactsnominated as an incentive. The campaign eventuallyreached an additional 43,000 people. Although theestimated target market (N ) for the particular auto-motive model is approximately 171,000, it is unrealis-tic to assume that the campaign remained within thebounds of this group and, hence, the percentage reachthat is implied by the numbers is very unlikely to beaccurate.The initial viral seeding (i.e., generation 0) was
to 38,668 potential customers. Of these, 10,244 reg-istered and generated at least 1 self-initiated out-bound e-mail, and the total number of e-mails sentto the next generation (generation 1) was 26,548. Ofthese, 3,091 registered online and generated 9,089 newcontacts (generation 2) in total. And of these, 1,221went on to register and generated 3,858 new e-mails(i.e., generation 3). This process continued to the 13thgeneration. Table 1 presents the campaign statistics bygeneration t: the number of infectives who registered(nt); calculated parameter values for the estimatedprobability of forwarding (that is, registering on thecampaign Web site and providing e-mail addresses oftheir contacts) (pF � t), the estimated average numberof activated contacts per registered infective (pA� t�t),and the growth rate of infectives (t) at each genera-tion. The number of people receiving the message inthe later generations (7–13) was insufficient to makereasonable estimates.
INFORMS
holds
copyrightto
this
article
and
distrib
uted
this
copy
asa
courtesy
tothe
author(s).
Add
ition
alinform
ation,
includ
ingrig
htsan
dpe
rmission
policies,
isav
ailableat
http://journa
ls.in
form
s.org/.
Bampo et al.: The Effects of the Social Structure of Digital Networks on Viral Marketing PerformanceInformation Systems Research 19(3), pp. 273–290, © 2008 INFORMS 281
4.2. Network Model of the CampaignThe campaign data contains the communication linksthat were activated as the message was transmittedthrough the digital network. While it is not possibleto identify the totality of the underlying social or dig-ital network, the realised or activated digital networklinks are identified uniquely by the data. Closer anal-ysis of this activated network shows while most ofthe individuals have moderate to low (less than 10)number of contacts, a small number of the audiencemembers (less than 0.03%) forwarded the messageto a significantly large number of people (more than20 contacts, with a very small number forwarding toover 100). In other words, there is some semblanceof a small number of large hubs (suggestive of scale-freeness). The data also shows that a majority of mes-sage forwarding takes place within the same state,but a significant minority (10%) of links are activatedacross different Australian states. While this providessome preliminary evidence of small world character-istics with a high level of local clustering and a smallproportion of “long distance” connections, given thelarge geographic regions covered by the Australianstates, inferring local clustering based on being in thesame state may be questionable.A generation-by-generation analysis of the cam-
paign shows that the behavior of the seeds is verydifferent to that of the subsequent generations wherethe observed parameters are reasonably consistent.This variability is not surprising given that the seedswere a self-selected group who had registered before-hand on the company’s Web site to receive productnews and promotional information and, therefore,had already manifested some interest in the categoryof products. (This would not be unusual for viralmarketing campaigns where typically mailing listsare used to seed campaigns.) In contrast, the subse-quent generations are less aligned to the promotionand likely to be more homogenous in their behavior.Surprisingly, the campaign data also shows that theseeds, while being more likely to pass the messageon, on average nominate fewer contacts than those insubsequent generations.We observe another anomaly in the empirical data
in the distribution of the number of contacts providedby those who register for the campaign. As the Webinterface was designed to display five textboxes at a
time (with a button to request a further page for list-ing five more contacts), the distribution of the numberof contacts is a periodic U-shaped distribution thatcycles on multiples of five. Hence, the Web interfacein the General Motors campaign discouraged usersfrom forwarding a message to a large number of peo-ple. Therefore, forwarding to 5 people was easy butforwarding to 500 would have been an extremely longand tedious operation.Again, the seeds have a different distribution
(mean and shape), reinforcing the argument pre-sented above that the seeds behave differently to thelatter generations. Closer examination of the under-lying distribution for the number of contacts acrossthe campaign appears to provide a reasonable fit toa Power-law distribution, signifying that the associ-ated digital network will display scale freeness. How-ever, analysis of the data shows that there are a verysmall number of hubs in total and, given the decayin the reach, there are very few hubs beyond thefirst two generations. In light of the above discus-sion, the activated digital network of the campaignappears to exhibit mixed characteristics (random,small world, scale free) which perhaps on reflectionis not unexpected.
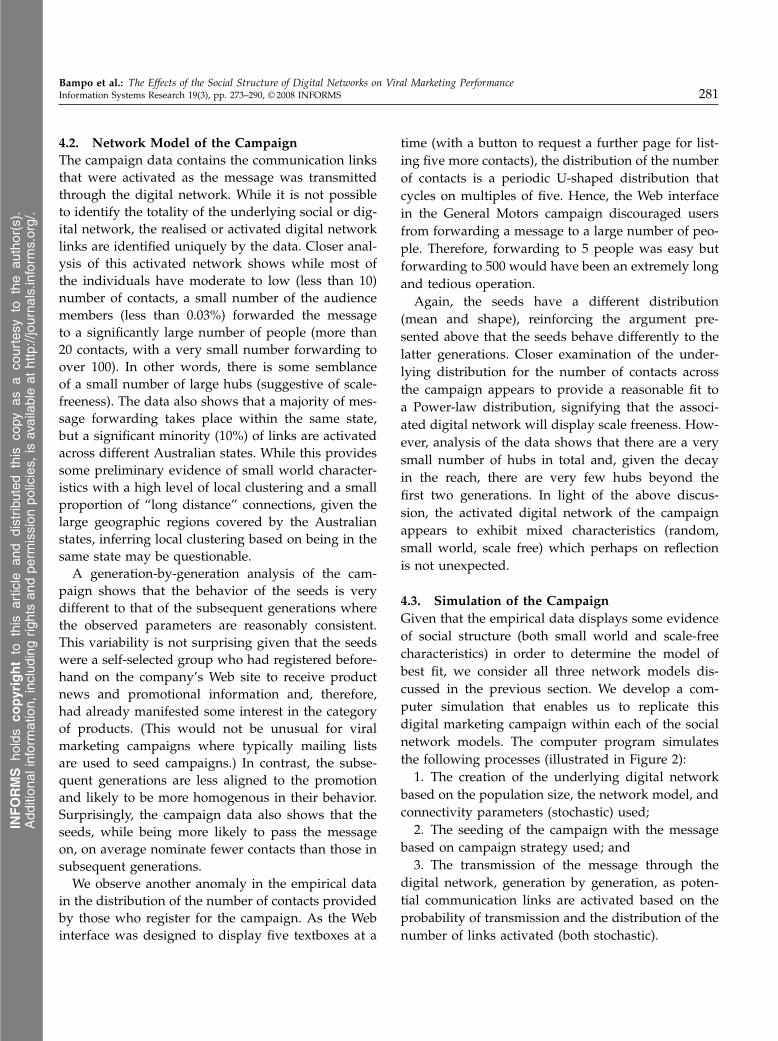
4.3. Simulation of the CampaignGiven that the empirical data displays some evidenceof social structure (both small world and scale-freecharacteristics) in order to determine the model ofbest fit, we consider all three network models dis-cussed in the previous section. We develop a com-puter simulation that enables us to replicate thisdigital marketing campaign within each of the socialnetwork models. The computer program simulatesthe following processes (illustrated in Figure 2):1. The creation of the underlying digital network
based on the population size, the network model, andconnectivity parameters (stochastic) used;2. The seeding of the campaign with the message
based on campaign strategy used; and3. The transmission of the message through the
digital network, generation by generation, as poten-tial communication links are activated based on theprobability of transmission and the distribution of thenumber of links activated (both stochastic).
INFORMS
holds
copyrightto
this
article
and
distrib
uted
this
copy
asa
courtesy
tothe
author(s).
Add
ition
alinform
ation,
includ
ingrig
htsan
dpe
rmission
policies,
isav
ailableat
http://journa
ls.in
form
s.org/.
Bampo et al.: The Effects of the Social Structure of Digital Networks on Viral Marketing Performance282 Information Systems Research 19(3), pp. 273–290, © 2008 INFORMS
Figure 2 The Processes Used in Simulating a Viral Marketing Campaign
Creation of the underlyingsocial network
Seeding the network withthe promotional message
Transmission of messagethrough the activation of
digital links (generation ofthe activated network)
Network model used(e.g., small world)
Connectivity parameters(e.g., number of contacts)
Behavioral parameters(e.g., prob. of forwarding
and to how many)
Campaign performance
(e.g., reach and spread)
Seeding strategy (e.g.,number and distribution
of seeds used)
measures
When running test simulations, we encountereda significant number of redundant communicationswhere some people receive the message from morethan one source, resulting in early termination ofthe simulated campaign. Unfortunately, as redundante-mails were not recorded in the actual campaign,we are not able to validate this fact. However, wewere able to confirm mathematically that it wouldnot have been possible for a viral communicationto spread through a population of the magnitude171,000 without having generated a significant num-ber of redundancies. As mentioned in §4.1, it is unre-alistic to assume that the campaign remained withinthe bounds of the target population. Hence, it islikely that the actual digital network through whichthis promotional message was transmitted was muchlarger. In the following simulations, we use a largernetwork of size one million in order to represent amore realistic (larger) target audience, generate a sim-ulation corresponding to the length of the actual cam-paign, and maintain a low proportion of simulatedredundancies (5%). A reason for limiting it to onemillion was a pragmatic consideration, taking intoaccount computer memory and time limitations.The simulation model uses weighted averages of
the observed transmission parameters, the estimatedtarget audience, and number of seeds used inthe campaign within each of three network struc-tures. The simulation model is validated using theempirical data.The initial results (base case) generated by the
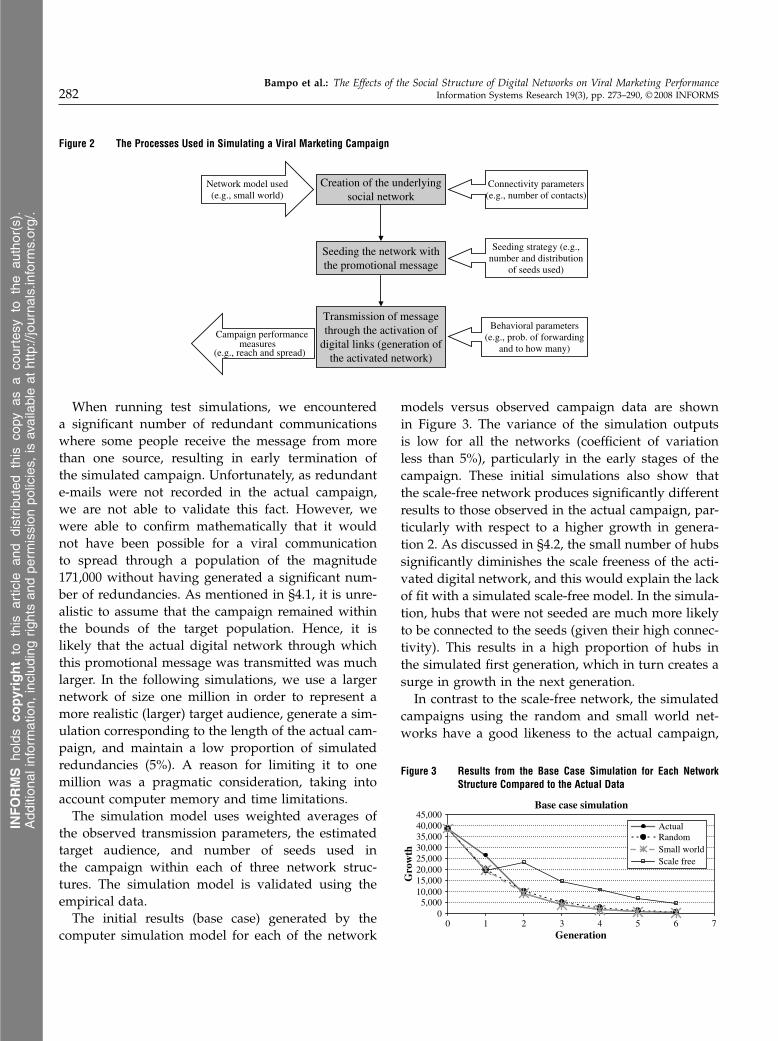
computer simulation model for each of the network
models versus observed campaign data are shownin Figure 3. The variance of the simulation outputsis low for all the networks (coefficient of variationless than 5%), particularly in the early stages of thecampaign. These initial simulations also show thatthe scale-free network produces significantly differentresults to those observed in the actual campaign, par-ticularly with respect to a higher growth in genera-tion 2. As discussed in §4.2, the small number of hubssignificantly diminishes the scale freeness of the acti-vated digital network, and this would explain the lackof fit with a simulated scale-free model. In the simula-tion, hubs that were not seeded are much more likelyto be connected to the seeds (given their high connec-tivity). This results in a high proportion of hubs inthe simulated first generation, which in turn creates asurge in growth in the next generation.In contrast to the scale-free network, the simulated
campaigns using the random and small world net-works have a good likeness to the actual campaign,
Figure 3 Results from the Base Case Simulation for Each NetworkStructure Compared to the Actual Data
Base case simulation
05,000
10,00015,00020,00025,00030,00035,00040,00045,000
0 1 2 5 6 7Generation
Gro
wth
ActualRandomSmall worldScale free
3 4
INFORMS
holds
copyrightto
this
article
and
distrib
uted
this
copy
asa
courtesy
tothe
author(s).
Add
ition
alinform
ation,
includ
ingrig
htsan
dpe
rmission
policies,
isav
ailableat
http://journa
ls.in
form
s.org/.
Bampo et al.: The Effects of the Social Structure of Digital Networks on Viral Marketing PerformanceInformation Systems Research 19(3), pp. 273–290, © 2008 INFORMS 283
but these results differ from the outputs observed inthe actual campaign in two aspects: first, there is asignificant difference in the number of contacts themessage was sent to by the seeds (the reach at gener-ation 1), where the real campaign registered a highervalue than the simulated cases; and second, there isa difference in the eventual reach, where the simu-lated campaigns’ performances are not as good as theactual campaign.
4.4. Model Enhancements to Improve the Fit toActual Campaign Results
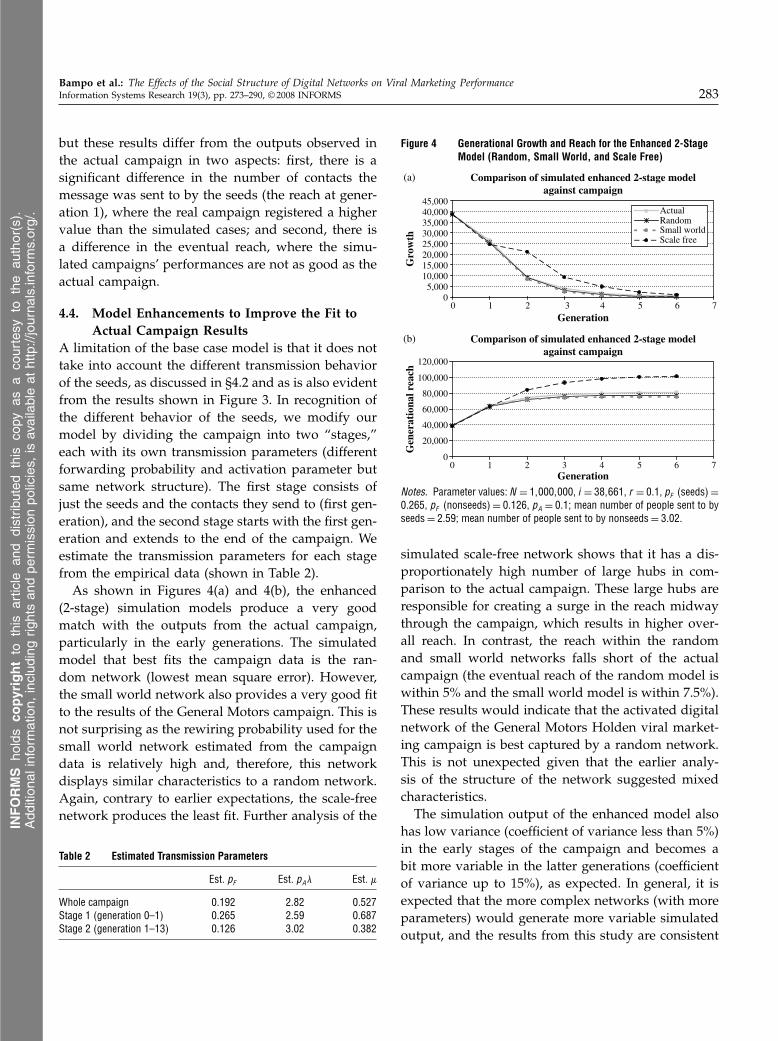
A limitation of the base case model is that it does nottake into account the different transmission behaviorof the seeds, as discussed in §4.2 and as is also evidentfrom the results shown in Figure 3. In recognition ofthe different behavior of the seeds, we modify ourmodel by dividing the campaign into two “stages,”each with its own transmission parameters (differentforwarding probability and activation parameter butsame network structure). The first stage consists ofjust the seeds and the contacts they send to (first gen-eration), and the second stage starts with the first gen-eration and extends to the end of the campaign. Weestimate the transmission parameters for each stagefrom the empirical data (shown in Table 2).As shown in Figures 4(a) and 4(b), the enhanced
(2-stage) simulation models produce a very goodmatch with the outputs from the actual campaign,particularly in the early generations. The simulatedmodel that best fits the campaign data is the ran-dom network (lowest mean square error). However,the small world network also provides a very good fitto the results of the General Motors campaign. This isnot surprising as the rewiring probability used for thesmall world network estimated from the campaigndata is relatively high and, therefore, this networkdisplays similar characteristics to a random network.Again, contrary to earlier expectations, the scale-freenetwork produces the least fit. Further analysis of the
Table 2 Estimated Transmission Parameters
Est. pF Est. pA� Est. �
Whole campaign 0.192 2.82 0.527Stage 1 (generation 0–1) 0.265 2.59 0.687Stage 2 (generation 1–13) 0.126 3.02 0.382
Figure 4 Generational Growth and Reach for the Enhanced 2-StageModel (Random, Small World, and Scale Free)
Comparison of simulated enhanced 2-stage modelagainst campaign
Comparison of simulated enhanced 2-stage modelagainst campaign
05,000
10,00015,00020,00025,00030,00035,00040,00045,000
Gro
wth
ActualRandomSmall worldScale free
0
20,000
40,000
60,000
80,000
100,000
120,000
0 2 4 6Generation
Gen
erat
iona
l rea
ch
1 3 5 7
0 2 4 6Generation
1 3 5 7
(a)
(b)
Notes. Parameter values: N = 1�000�000, i = 38�661, r = 0�1, pF (seeds)=0�265, pF (nonseeds)= 0�126, pA = 0�1; mean number of people sent to byseeds= 2�59; mean number of people sent to by nonseeds= 3�02.
simulated scale-free network shows that it has a dis-proportionately high number of large hubs in com-parison to the actual campaign. These large hubs areresponsible for creating a surge in the reach midwaythrough the campaign, which results in higher over-all reach. In contrast, the reach within the randomand small world networks falls short of the actualcampaign (the eventual reach of the random model iswithin 5% and the small world model is within 7.5%).These results would indicate that the activated digitalnetwork of the General Motors Holden viral market-ing campaign is best captured by a random network.This is not unexpected given that the earlier analy-sis of the structure of the network suggested mixedcharacteristics.The simulation output of the enhanced model also
has low variance (coefficient of variance less than 5%)in the early stages of the campaign and becomes abit more variable in the latter generations (coefficientof variance up to 15%), as expected. In general, it isexpected that the more complex networks (with moreparameters) would generate more variable simulatedoutput, and the results from this study are consistent
INFORMS
holds
copyrightto
this
article
and
distrib
uted
this
copy
asa
courtesy
tothe
author(s).
Add
ition
alinform
ation,
includ
ingrig
htsan
dpe
rmission
policies,
isav
ailableat
http://journa
ls.in
form
s.org/.
Bampo et al.: The Effects of the Social Structure of Digital Networks on Viral Marketing Performance284 Information Systems Research 19(3), pp. 273–290, © 2008 INFORMS
with that premise. With the small world network, thestrong clustering tendency makes simulation resultsespecially sensitive to the progress in the earlier gen-erations of the campaign, as the number of randomlinks that are activated by the early generations caninfluence how quickly the viral message spreads inthe system. In scale-free networks, the inclusion orexclusion of hubs at each generation can make a sig-nificant difference in the simulated growth.
5. Sensitivity AnalysisThe input parameters a campaign manager can influ-ence are: (i) the number of seeds used; (ii) theprobability of forwarding a message; and (iii) theaverage number of activated contacts (from the totalset of contacts). We vary each of these parametersone at a time (while keeping all other parametersconstant and in line with the actual campaign), andsimulate the spread of the campaign within each theo-retical network model. We vary the parameters withina range on either side of the observed value from theactual campaign.
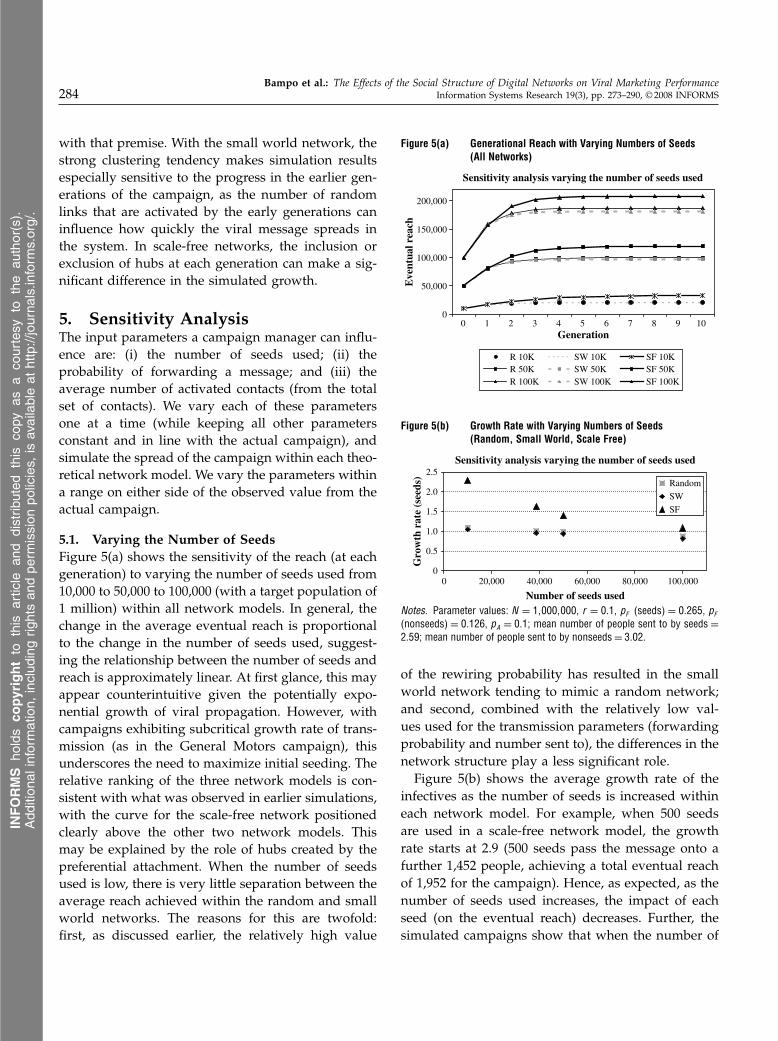
5.1. Varying the Number of SeedsFigure 5(a) shows the sensitivity of the reach (at eachgeneration) to varying the number of seeds used from10,000 to 50,000 to 100,000 (with a target population of1 million) within all network models. In general, thechange in the average eventual reach is proportionalto the change in the number of seeds used, suggest-ing the relationship between the number of seeds andreach is approximately linear. At first glance, this mayappear counterintuitive given the potentially expo-nential growth of viral propagation. However, withcampaigns exhibiting subcritical growth rate of trans-mission (as in the General Motors campaign), thisunderscores the need to maximize initial seeding. Therelative ranking of the three network models is con-sistent with what was observed in earlier simulations,with the curve for the scale-free network positionedclearly above the other two network models. Thismay be explained by the role of hubs created by thepreferential attachment. When the number of seedsused is low, there is very little separation between theaverage reach achieved within the random and smallworld networks. The reasons for this are twofold:first, as discussed earlier, the relatively high value
Figure 5(a) Generational Reach with Varying Numbers of Seeds(All Networks)
Sensitivity analysis varying the number of seeds used
0
50,000
100,000
150,000
200,000
0 1 4 6 7 9 10Generation
Eve
ntua
l rea
ch
R 10KR 50KR 100K
SW 10KSW 50KSW 100K
SF 10KSF 50KSF 100K
2 3 5 8
Figure 5(b) Growth Rate with Varying Numbers of Seeds(Random, Small World, Scale Free)
Sensitivity analysis varying the number of seeds used
0
0.5
1.0
1.5
2.0
2.5
0 20,000 40,000 60,000 80,000 100,000
Number of seeds used
Gro
wth
rat
e (s
eeds
)
Random
SW
SF
Notes. Parameter values: N = 1�000�000, r = 0�1, pF (seeds) = 0�265, pF
(nonseeds) = 0�126, pA = 0�1; mean number of people sent to by seeds =2�59; mean number of people sent to by nonseeds= 3�02.
of the rewiring probability has resulted in the smallworld network tending to mimic a random network;and second, combined with the relatively low val-ues used for the transmission parameters (forwardingprobability and number sent to), the differences in thenetwork structure play a less significant role.Figure 5(b) shows the average growth rate of the
infectives as the number of seeds is increased withineach network model. For example, when 500 seedsare used in a scale-free network model, the growthrate starts at 2.9 (500 seeds pass the message onto afurther 1,452 people, achieving a total eventual reachof 1,952 for the campaign). Hence, as expected, as thenumber of seeds used increases, the impact of eachseed (on the eventual reach) decreases. Further, thesimulated campaigns show that when the number of
INFORMS
holds
copyrightto
this
article
and
distrib
uted
this
copy
asa
courtesy
tothe
author(s).
Add
ition
alinform
ation,
includ
ingrig
htsan
dpe
rmission
policies,
isav
ailableat
http://journa
ls.in
form
s.org/.
Bampo et al.: The Effects of the Social Structure of Digital Networks on Viral Marketing PerformanceInformation Systems Research 19(3), pp. 273–290, © 2008 INFORMS 285
seeds used is high (10% of the total population), thereis little difference between the network models as themessage spreads very quickly (and easily) at the earlystages of the campaign and the intricacies of the net-work structure have less opportunity to play a role.
5.2. Varying the Probability of Forwardingthe Message
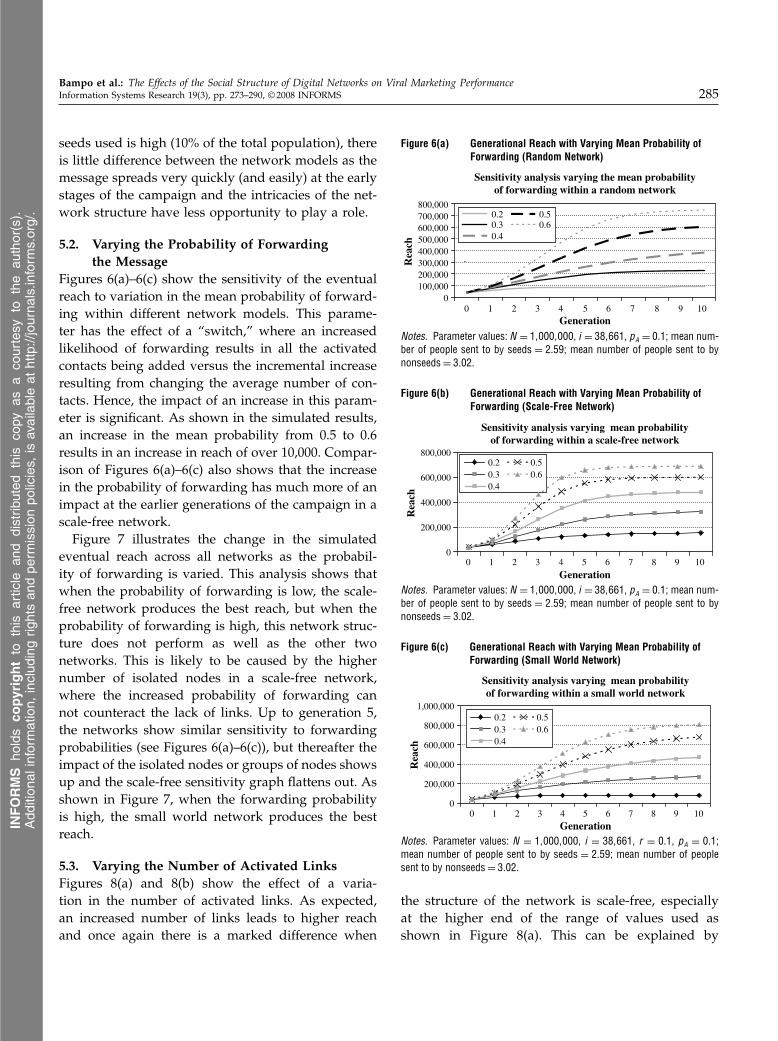
Figures 6(a)–6(c) show the sensitivity of the eventualreach to variation in the mean probability of forward-ing within different network models. This parame-ter has the effect of a “switch,” where an increasedlikelihood of forwarding results in all the activatedcontacts being added versus the incremental increaseresulting from changing the average number of con-tacts. Hence, the impact of an increase in this param-eter is significant. As shown in the simulated results,an increase in the mean probability from 0.5 to 0.6results in an increase in reach of over 10,000. Compar-ison of Figures 6(a)–6(c) also shows that the increasein the probability of forwarding has much more of animpact at the earlier generations of the campaign in ascale-free network.Figure 7 illustrates the change in the simulated
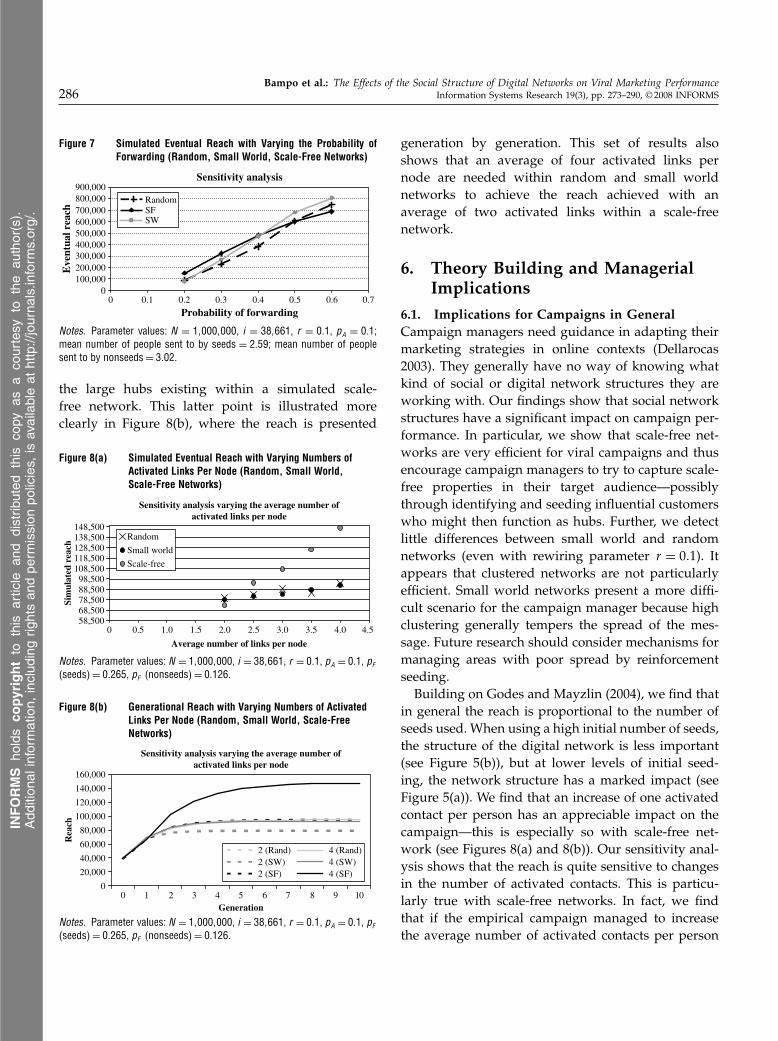
eventual reach across all networks as the probabil-ity of forwarding is varied. This analysis shows thatwhen the probability of forwarding is low, the scale-free network produces the best reach, but when theprobability of forwarding is high, this network struc-ture does not perform as well as the other twonetworks. This is likely to be caused by the highernumber of isolated nodes in a scale-free network,where the increased probability of forwarding cannot counteract the lack of links. Up to generation 5,the networks show similar sensitivity to forwardingprobabilities (see Figures 6(a)–6(c)), but thereafter theimpact of the isolated nodes or groups of nodes showsup and the scale-free sensitivity graph flattens out. Asshown in Figure 7, when the forwarding probabilityis high, the small world network produces the bestreach.
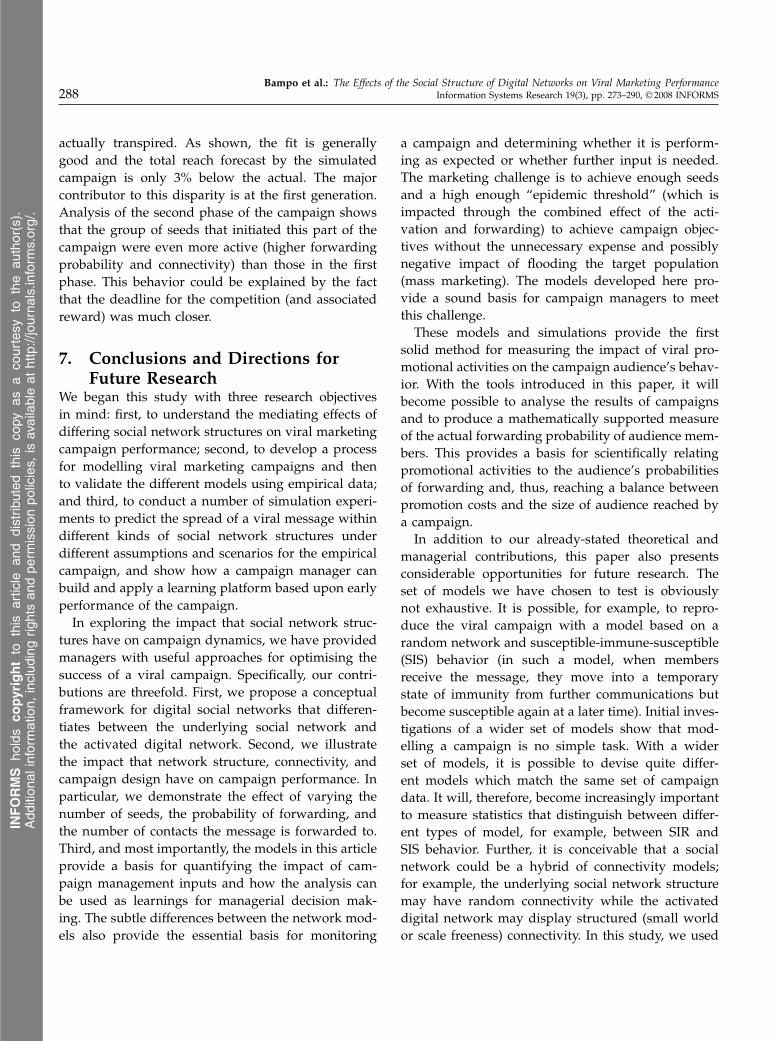
5.3. Varying the Number of Activated LinksFigures 8(a) and 8(b) show the effect of a varia-tion in the number of activated links. As expected,an increased number of links leads to higher reachand once again there is a marked difference when
Figure 6(a) Generational Reach with Varying Mean Probability ofForwarding (Random Network)
Sensitivity analysis varying the mean probabilityof forwarding within a random network
0100,000200,000300,000400,000500,000600,000700,000800,000
0 1 2 3 4 5 6 7 8 9 10Generation
Rea
ch
0.20.30.4
0.50.6
Notes. Parameter values: N = 1�000�000, i = 38�661, pA = 0�1; mean num-ber of people sent to by seeds = 2�59; mean number of people sent to bynonseeds= 3�02.
Figure 6(b) Generational Reach with Varying Mean Probability ofForwarding (Scale-Free Network)
0.20.30.4
0.50.6
0 1 2 3 4 5 6 7 8 9 10
Generation
Sensitivity analysis varying mean probabilityof forwarding within a scale-free network
0
200,000
400,000
600,000
800,000
Rea
ch
Notes. Parameter values: N = 1�000�000, i = 38�661, pA = 0�1; mean num-ber of people sent to by seeds = 2�59; mean number of people sent to bynonseeds= 3�02.
Figure 6(c) Generational Reach with Varying Mean Probability ofForwarding (Small World Network)
0 1 2 3 4 5 6 7 8 9 10Generation
Rea
ch
Sensitivity analysis varying mean probabilityof forwarding within a small world network
0
200,000
400,000
600,000
800,000
1,000,0000.20.30.4
0.50.6
Notes. Parameter values: N = 1�000�000, i = 38�661, r = 0�1, pA = 0�1;mean number of people sent to by seeds = 2�59; mean number of peoplesent to by nonseeds= 3�02.
the structure of the network is scale-free, especiallyat the higher end of the range of values used asshown in Figure 8(a). This can be explained by
INFORMS
holds
copyrightto
this
article
and
distrib
uted
this
copy
asa
courtesy
tothe
author(s).
Add
ition
alinform
ation,
includ
ingrig
htsan
dpe
rmission
policies,
isav
ailableat
http://journa
ls.in
form
s.org/.
Bampo et al.: The Effects of the Social Structure of Digital Networks on Viral Marketing Performance286 Information Systems Research 19(3), pp. 273–290, © 2008 INFORMS
Figure 7 Simulated Eventual Reach with Varying the Probability ofForwarding (Random, Small World, Scale-Free Networks)
Sensitivity analysis
0100,000200,000300,000400,000500,000600,000700,000800,000900,000
0 0.1 0.2 0.3 0.4 0.5 0.6 0.7
Probability of forwarding
Eve
ntua
l rea
ch
RandomSFSW
Notes. Parameter values: N = 1�000�000, i = 38�661, r = 0�1, pA = 0�1;mean number of people sent to by seeds = 2�59; mean number of peoplesent to by nonseeds= 3�02.
the large hubs existing within a simulated scale-free network. This latter point is illustrated moreclearly in Figure 8(b), where the reach is presented
Figure 8(a) Simulated Eventual Reach with Varying Numbers ofActivated Links Per Node (Random, Small World,Scale-Free Networks)
Sensitivity analysis varying the average number ofactivated links per node
58,50068,50078,50088,50098,500
108,500118,500128,500138,500148,500
0 0.5 1.0 1.5 2.0 2.5 3.0 3.5 4.0 4.5
Average number of links per node
Sim
ulat
ed r
each
Random
Small world
Scale-free
Notes. Parameter values: N = 1�000�000, i = 38�661, r = 0�1, pA = 0�1, pF
(seeds)= 0�265, pF (nonseeds)= 0�126.
Figure 8(b) Generational Reach with Varying Numbers of ActivatedLinks Per Node (Random, Small World, Scale-FreeNetworks)
Sensitivity analysis varying the average number ofactivated links per node
0
20,000
40,000
60,000
80,000
100,000
120,000
140,000
160,000
0 1 2 3 4 5 6 7 8 9 10Generation
Rea
ch
2 (Rand)2 (SW)2 (SF)
4 (Rand)4 (SW)4 (SF)
Notes. Parameter values: N = 1�000�000, i = 38�661, r = 0�1, pA = 0�1, pF
(seeds)= 0�265, pF (nonseeds)= 0�126.
generation by generation. This set of results alsoshows that an average of four activated links pernode are needed within random and small worldnetworks to achieve the reach achieved with anaverage of two activated links within a scale-freenetwork.
6. Theory Building and ManagerialImplications
6.1. Implications for Campaigns in GeneralCampaign managers need guidance in adapting theirmarketing strategies in online contexts (Dellarocas2003). They generally have no way of knowing whatkind of social or digital network structures they areworking with. Our findings show that social networkstructures have a significant impact on campaign per-formance. In particular, we show that scale-free net-works are very efficient for viral campaigns and thusencourage campaign managers to try to capture scale-free properties in their target audience—possiblythrough identifying and seeding influential customerswho might then function as hubs. Further, we detectlittle differences between small world and randomnetworks (even with rewiring parameter r = 0�1). Itappears that clustered networks are not particularlyefficient. Small world networks present a more diffi-cult scenario for the campaign manager because highclustering generally tempers the spread of the mes-sage. Future research should consider mechanisms formanaging areas with poor spread by reinforcementseeding.Building on Godes and Mayzlin (2004), we find that
in general the reach is proportional to the number ofseeds used. When using a high initial number of seeds,the structure of the digital network is less important(see Figure 5(b)), but at lower levels of initial seed-ing, the network structure has a marked impact (seeFigure 5(a)). We find that an increase of one activatedcontact per person has an appreciable impact on thecampaign—this is especially so with scale-free net-work (see Figures 8(a) and 8(b)). Our sensitivity anal-ysis shows that the reach is quite sensitive to changesin the number of activated contacts. This is particu-larly true with scale-free networks. In fact, we findthat if the empirical campaign managed to increasethe average number of activated contacts per person
INFORMS
holds
copyrightto
this
article
and
distrib
uted
this
copy
asa
courtesy
tothe
author(s).
Add
ition
alinform
ation,
includ
ingrig
htsan
dpe
rmission
policies,
isav
ailableat
http://journa
ls.in
form
s.org/.
Bampo et al.: The Effects of the Social Structure of Digital Networks on Viral Marketing PerformanceInformation Systems Research 19(3), pp. 273–290, © 2008 INFORMS 287
by one, from the observed value of 2.8, the relatedincremental increase in reach would be over 30,000.In contrast, given the low growth rate of seeds in thiscampaign, to achieve the same increase in reach, thecompany would have needed to seed between 15,000–20,000 more people. In practical terms, the impactof a viral marketing campaign is due to messagesbeing received from friends and acquaintances andnot from mass marketing. The initial seeds are notthe target of a viral campaign—their buying intentionsmay not be strongly influenced by a campaign becausethey have not received the message from a friendor acquaintance. In short, the target of the campaignmanager is strong growth, not massive seeding. Thereis also a cost trade-off between the acquisition costsof additional seeds versus the costs associated withwhatever incentives one embeds in the campaign. Asinferred from the simulated results, an incentive thatincreased the mean probability of forwarding in theactual campaign from 0.5 to 0.6 would have resultedin an increase in reach of over 10,000.The characteristics of the message and creative exe-
cution play an equally important role in determininga recipient’s propensity to forward the communica-tion, the average number of activated connections,and, hence, the average number of transmissions. Forexample, a humorous advertisement is likely to betransmitted in much the same manner as jokes aree-mailed within social networks. The other way toincrease the success of a viral campaign is to intro-duce a tangible promotional incentive and link it tobehaviors that increase p and �. However, one couldalso argue that incentives have the potential for thecampaign to extend outside the desired target mar-ket. While this is not necessarily a bad thing per seand there is no financial wastage involved, it has thepotential to inflate campaign performance statisticsand thus overstate the success of the campaign. Thereis evidence of this in the empirical data.
6.2. Implications for Specific CampaignsTo this point, we have simulated three different net-work structures and identified both random and smallworld networks as providing an adequate fit to theactual campaign. In addition to using the simulationto deconstruct campaigns and develop insights, thismethodology holds the promise of providing predic-tive modelling. For example, a campaign manager
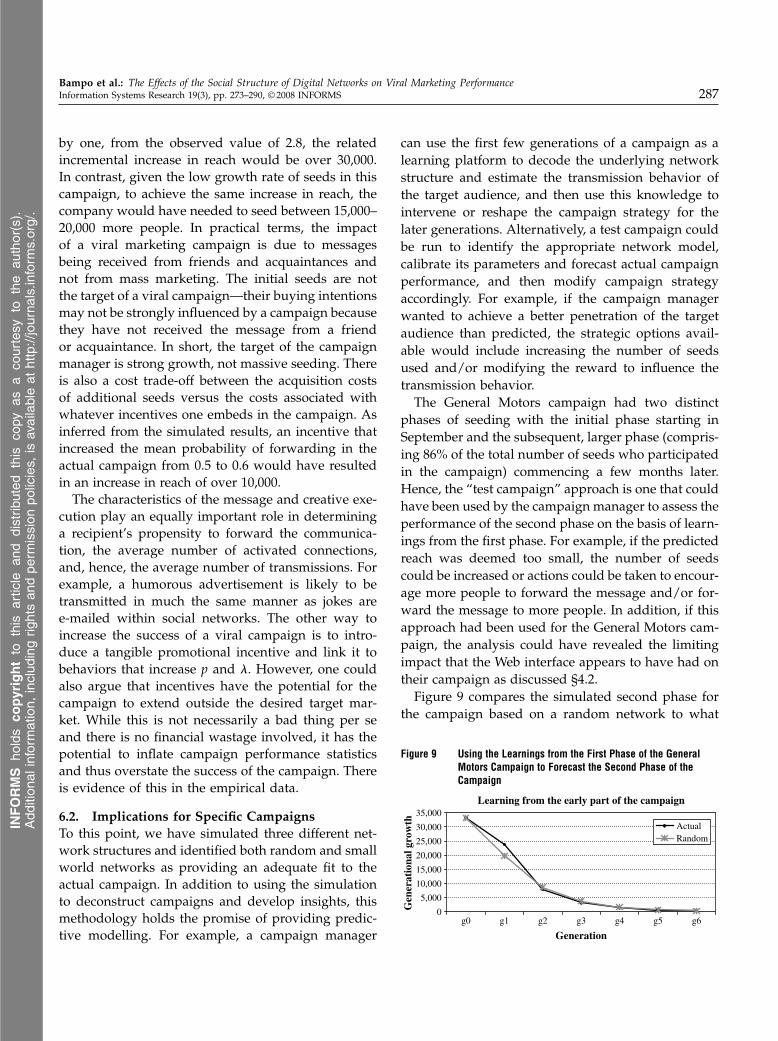
can use the first few generations of a campaign as alearning platform to decode the underlying networkstructure and estimate the transmission behavior ofthe target audience, and then use this knowledge tointervene or reshape the campaign strategy for thelater generations. Alternatively, a test campaign couldbe run to identify the appropriate network model,calibrate its parameters and forecast actual campaignperformance, and then modify campaign strategyaccordingly. For example, if the campaign managerwanted to achieve a better penetration of the targetaudience than predicted, the strategic options avail-able would include increasing the number of seedsused and/or modifying the reward to influence thetransmission behavior.The General Motors campaign had two distinct
phases of seeding with the initial phase starting inSeptember and the subsequent, larger phase (compris-ing 86% of the total number of seeds who participatedin the campaign) commencing a few months later.Hence, the “test campaign” approach is one that couldhave been used by the campaign manager to assess theperformance of the second phase on the basis of learn-ings from the first phase. For example, if the predictedreach was deemed too small, the number of seedscould be increased or actions could be taken to encour-age more people to forward the message and/or for-ward the message to more people. In addition, if thisapproach had been used for the General Motors cam-paign, the analysis could have revealed the limitingimpact that the Web interface appears to have had ontheir campaign as discussed §4.2.Figure 9 compares the simulated second phase for
the campaign based on a random network to what
Figure 9 Using the Learnings from the First Phase of the GeneralMotors Campaign to Forecast the Second Phase of theCampaign
Learning from the early part of the campaign
0
5,000
10,000
15,000
20,000
25,000
30,000
35,000
g0 g1 g2 g3 g4 g5 g6
Generation
Gen
erat
iona
l gro
wth Actual
Random
INFORMS
holds
copyrightto
this
article
and
distrib
uted
this
copy
asa
courtesy
tothe
author(s).
Add
ition
alinform
ation,
includ
ingrig
htsan
dpe
rmission
policies,
isav
ailableat
http://journa
ls.in
form
s.org/.
Bampo et al.: The Effects of the Social Structure of Digital Networks on Viral Marketing Performance288 Information Systems Research 19(3), pp. 273–290, © 2008 INFORMS
actually transpired. As shown, the fit is generallygood and the total reach forecast by the simulatedcampaign is only 3% below the actual. The majorcontributor to this disparity is at the first generation.Analysis of the second phase of the campaign showsthat the group of seeds that initiated this part of thecampaign were even more active (higher forwardingprobability and connectivity) than those in the firstphase. This behavior could be explained by the factthat the deadline for the competition (and associatedreward) was much closer.
7. Conclusions and Directions forFuture Research
We began this study with three research objectivesin mind: first, to understand the mediating effects ofdiffering social network structures on viral marketingcampaign performance; second, to develop a processfor modelling viral marketing campaigns and thento validate the different models using empirical data;and third, to conduct a number of simulation experi-ments to predict the spread of a viral message withindifferent kinds of social network structures underdifferent assumptions and scenarios for the empiricalcampaign, and show how a campaign manager canbuild and apply a learning platform based upon earlyperformance of the campaign.In exploring the impact that social network struc-
tures have on campaign dynamics, we have providedmanagers with useful approaches for optimising thesuccess of a viral campaign. Specifically, our contri-butions are threefold. First, we propose a conceptualframework for digital social networks that differen-tiates between the underlying social network andthe activated digital network. Second, we illustratethe impact that network structure, connectivity, andcampaign design have on campaign performance. Inparticular, we demonstrate the effect of varying thenumber of seeds, the probability of forwarding, andthe number of contacts the message is forwarded to.Third, and most importantly, the models in this articleprovide a basis for quantifying the impact of cam-paign management inputs and how the analysis canbe used as learnings for managerial decision mak-ing. The subtle differences between the network mod-els also provide the essential basis for monitoring
a campaign and determining whether it is perform-ing as expected or whether further input is needed.The marketing challenge is to achieve enough seedsand a high enough “epidemic threshold” (which isimpacted through the combined effect of the acti-vation and forwarding) to achieve campaign objec-tives without the unnecessary expense and possiblynegative impact of flooding the target population(mass marketing). The models developed here pro-vide a sound basis for campaign managers to meetthis challenge.These models and simulations provide the first
solid method for measuring the impact of viral pro-motional activities on the campaign audience’s behav-ior. With the tools introduced in this paper, it willbecome possible to analyse the results of campaignsand to produce a mathematically supported measureof the actual forwarding probability of audience mem-bers. This provides a basis for scientifically relatingpromotional activities to the audience’s probabilitiesof forwarding and, thus, reaching a balance betweenpromotion costs and the size of audience reached bya campaign.In addition to our already-stated theoretical and
managerial contributions, this paper also presentsconsiderable opportunities for future research. Theset of models we have chosen to test is obviouslynot exhaustive. It is possible, for example, to repro-duce the viral campaign with a model based on arandom network and susceptible-immune-susceptible(SIS) behavior (in such a model, when membersreceive the message, they move into a temporarystate of immunity from further communications butbecome susceptible again at a later time). Initial inves-tigations of a wider set of models show that mod-elling a campaign is no simple task. With a widerset of models, it is possible to devise quite differ-ent models which match the same set of campaigndata. It will, therefore, become increasingly importantto measure statistics that distinguish between differ-ent types of model, for example, between SIR andSIS behavior. Further, it is conceivable that a socialnetwork could be a hybrid of connectivity models;for example, the underlying social network structuremay have random connectivity while the activateddigital network may display structured (small worldor scale freeness) connectivity. In this study, we used
INFORMS
holds
copyrightto
this
article
and
distrib
uted
this
copy
asa
courtesy
tothe
author(s).
Add
ition
alinform
ation,
includ
ingrig
htsan
dpe
rmission
policies,
isav
ailableat
http://journa
ls.in
form
s.org/.
Bampo et al.: The Effects of the Social Structure of Digital Networks on Viral Marketing PerformanceInformation Systems Research 19(3), pp. 273–290, © 2008 INFORMS 289
the concept of a “generation” as a temporal mea-sure. It would be useful to understand the relation-ship between time (duration) and generation, as atime-based analysis would offer further insight froma managerial perspective.Further investigation on the mutual influence of
the network and behavior models presented hereis also required. Our current models do not takeinto account the notion of receptivity: All individ-uals reached by the viral message are assumed toassimilate it. Is this a valid assumption? Marketingstudies have pointed out the existence of special peo-ple, called “infuentials” (Keller and Berry 2003), or“salesmen” (Gladwell 2000) who are extraordinarilyeffective in persuading other people to adopt an idea.How can their effect on viral process’ dynamics bemodelled? What precise role do they play in messagediffusion? How much effort should marketers spendtrying to locate them and factor them into campaignplans?In closing, we offer three specific directions for
further research. First, we see a need for moresophisticated and targeted seeding experimentation.In particular, a better understanding of the role ofhubs in seeding strategies is needed, as these spe-cial individuals have considerably higher connectiv-ity than others (Gladwell 2000, Granovetter 1983)and, through identification and targeting as campaignseeds, can be successfully exploited to increase thesuccess of the campaign. Second, a related avenuefor further enquiry is to consider the effect of pos-sible managerial interventions during a campaign.Viral marketing has hitherto been portrayed as a ran-dom, ground-up phenomenon over which marketershave little control (Dobele et al. 2005). We disagreewith this contention and believe that further empiricaland experimental research with real campaigns willunearth opportunities for astute managers to proac-tively resurrect underperforming campaigns. Con-versely, there may even be occasions where a managerneeds to restrict an overly successful viral campaign,for example, one linked to an expensive sales promo-tion such as free samples or coupons. Finally, there isa need for further research into the aesthetic, creative,and technical components of campaign design. A viralcampaign can be designed in one of two ways: Eitherthe message is forwarded directly between audience
members using e-mail, for example, or via a cen-tralised system where an e-mail embedded link chan-nels recipients through a Web interface. The empiricalcampaign discussed in this study is an example of thelatter strategy. An inherent benefit of this strategy isthat it enables the manager to monitor the campaign’sprogress and control the process’ dynamics. An addi-tional benefit of this two-stage approach is that recip-ients effectively self-screen, thereby reducing wastage(e.g., generating unsolicited spam). This system alsoenables the manager to revive a flagging campaign.A key benefit of employing a Web interface is that itcan be used to produce an image of the underlyingsocial network of the target audience. As shown inthis study, the network structure plays a key role inhow a campaign should be managed.
AcknowledgmentsThe authors sincerely thank Peter Wicki, eBusiness Man-ager, General Motors Holden Australia, for help with thisproject and for access to viral marketing campaign data.
ReferencesAlbert, R., A. Barabási. 2002. Statistical mechanics of complex net-
works. Rev. Modern Phys. 74(1) 47–97.Ba, S., P. A. Pavlou. 2002. Evidence of the effect of trust building
technology in electronic markets: Price premiums and buyerbehavior. MIS Quart. 26(3) 243–268.
Barabási, A. R. 1999. Emergence of scaling in random networks.Science 286 509–512.
Barthélémy, M., L. A. N. Amaral. 1999. Small-world networks:Evidence for a crossover picture. Physical Rev. Lett. 82(15)3180–3183.
Becker, N. 1989. Analysis of Infectious Disease Data. Chapman & Hall,New York.
Boguna, M., R. Pastor-Satorras, A. Vespignani. 2003. Absence ofepidemic threshold in scale-free networks with degree correla-tions. Phys. Rev. Lett. 90(2) 028701.
Bolton, G. E., E. Katok, A. Ockenfels. 2004. How effective are elec-tronic reputation mechanisms? An experimental investigation.Management Sci. 50(11) 1587–1602.
Chevalier, J. A., D. Mayzlin. 2006. The effect of word of mouth onsales: Online book reviews. J. Marketing Res. 43(3) 345–354.
Dellarocas, C. 2003. The digitization of word-of-mouth: Promiseand challenges of online feedback mechanisms. ManagementSci. 49(10) 1407–1424.
Dellarocas, C. 2005. Reputation mechanism design in online trad-ing environments with pure moral hazard. Inform. Systems Res.16(2) 209–230.
Dellarocas, C. 2006. Strategic manipulation of Internet opinionforums: Implications for consumers and firms. Management Sci.52(10) 1577–1593.
INFORMS
holds
copyrightto
this
article
and
distrib
uted
this
copy
asa
courtesy
tothe
author(s).
Add
ition
alinform
ation,
includ
ingrig
htsan
dpe
rmission
policies,
isav
ailableat
http://journa
ls.in
form
s.org/.
Bampo et al.: The Effects of the Social Structure of Digital Networks on Viral Marketing Performance290 Information Systems Research 19(3), pp. 273–290, © 2008 INFORMS
Dobele, A., D. Toleman, M. Beverland. 2005. Controlled infection:Spreading the brand message through viral marketing. Bus.Horizons 48(2) 143–149.
Dobele, A., A. Lindgreen, M. Beverland, J. l. Vanhamme, R. vanWijk. 2007. Why pass on viral messages? Because they connectemotionally. Bus. Horizons 50(4) 291–304.
Dorogovtsev, S. N., J. Mendes. 2003. Evolution of Networks: From Bio-logical Nets to the Internet and WWW. Oxford University Press,Oxford, UK.
Drineas, P., M. S. Krishnamoorthy, M. D. Sofka, B. Yener. 2004.Studying e-mail graphs for intelligence monitoring and analy-sis in the absence of semantic information. IEEE Internat. Conf.on Intelligence and Security Informatics. IEEE, Washington, D.C.,297–306.
Eguıluz, V. M., K. Klemm. 2002. Epidemic threshold in structuredscale-free networks. Phys. Rev. Lett. 89 108701.
Erdös, P., A. Rényi. 1959. On random graphs. Pub. Math. Debrecen6 290–297.
Gelb, B. D., S. Sundaram. 2002. Adapting to “word of mouse.” Bus.Horizons 45(4) 21–25.
Gladwell, M. 2000. The Tipping Point. Little, Brown, and Company,Boston.
Godes, D., D. Mayzlin. 2004. Using online conversations to studyword-of-mouth communication. Marketing Sci. 23(4) 545–560.
Goldenberg, J., B. Libai, E. Muller. 2001. Talk of the network:A complex systems look at the underlying process of word-of-mouth. Marketing Lett. 12(3) 211–223.
Goldsmith, R. E., D. Horowitz. 2006. Measuring motivations foronline opinion seeking. J. Interactive Advertising 6(2) 1–16.
Granovetter, M. 1983. The strength of weak ties: A network theoryrevisited. Sociol. Theory 1 201–233.
Gruen, T. W., T. Osmonbekov, A. J. Czaplewski. 2006. eWOM: Theimpact of customer-to-customer online know-how exchange oncustomer value and loyalty. J. Bus. Res. 59(4) 449–456.
Helm, S. 2000. Viral marketing—Establishing customer relation-ships by “word-of-mouse.” Electronic Markets 10(3) 158–161.
Kaikati, A., J. Kaikati. 2004. Stealth marketing: How to reach con-sumers surreptitiously. California Management Rev. 46(4) 6–22.
Keller, E., J. Berry. 2003. The Influentials. Free Press, New York.Mather, D. R. 2000. A simulation model of the spread of Hepatitis C
within a closed cohort. J. Oper. Res. Soc. 51 656–665.Mather, D., N. Crofts. 1999. A computer model of the spread of
Hepatitis C Virus among injecting drug users. Eur. J. Epidemi-ology 15 5–10.
Mayzlin, D. 2006. Promotional chat on the Internet. Marketing Sci.25(2) 155–163.
Miller, D. T., W. Turnbull. 1986. Expectancies and interpersonal pro-cesses. Annual Rev. Psych. 37 233–256.
Moreno, Y., A. Vázquez. 2003. Disease spreading in structuredscale-free networks. Eur. Physical J. B—Condensed Matter 31(2)265–271.
Pastor-Satorras, R., A. Vespignani. 2001. Epidemic spreading inscale-free networks. Physical Rev. Lett. 86(14) 3200–3203.
Pavlou, P. A., D. Gefen. 2004. Building effective online market-places with institution-based trust. Inform. Systems Res. 15(1)37–59.
Phelps, J. E., R. Lewis, L. Mobilio, D. Perry, N. Raman. 2004. Viralmarketing or electronic word-of-mouth advertising: Examin-ing consumer responses and motivations to pass along email.J. Advertising Res. 44(4) 333–348.
Podoshen, J. S. 2006. Word of mouth, brand loyalty, accultura-tion and the American Jewish consumer. J. Consumer Marketing23(4/5) 266–282.
Rob, R., A. Fishman. 2005. Is bigger better? Customer base expan-sion through word-of-mouth reputation. J. Political Econom.113(5) 1146–1162.
Rosenthal, R. 1994. Interpersonal expectancy effects: A 30-year per-spective. Current Directions Psych. Sci. 3(6) 176–179.
Stewart, D., M. Ewing, D. Mather. 2004. e-Audience estimation:Modelling the spread of viral advertising using branching the-ory. Annual meeting, Institute for Operations Research and theManagement Sciences, Denver, CO, 24–27.
Watts, D. J., S. H. Strogatz. 1998. Collective dynamics of “small-world” networks. Nature 393 440–442.
Weinberg, B. D., L. Davis. 2005. Exploring the WOW in online-auction feedback. J. Bus. Res. 58(11) 1609–1621.
INFORMS
holds
copyrightto
this
article
and
distrib
uted
this
copy
asa
courtesy
tothe
author(s).
Add
ition
alinform
ation,
includ
ingrig
htsan
dpe
rmission
policies,
isav
ailableat
http://journa
ls.in
form
s.org/.