the effects of notch geometry on fracture testing of
TRANSCRIPT

University of Arkansas, FayettevilleScholarWorks@UARK
Civil Engineering Undergraduate Honors Theses Civil Engineering
12-2016
The Effects of Notch Geometry on Fracture Testingof Asphalt ConcreteRebekah Porter
Follow this and additional works at: http://scholarworks.uark.edu/cveguht
Part of the Civil Engineering Commons
This Thesis is brought to you for free and open access by the Civil Engineering at ScholarWorks@UARK. It has been accepted for inclusion in CivilEngineering Undergraduate Honors Theses by an authorized administrator of ScholarWorks@UARK. For more information, please [email protected], [email protected].
Recommended CitationPorter, Rebekah, "The Effects of Notch Geometry on Fracture Testing of Asphalt Concrete" (2016). Civil Engineering UndergraduateHonors Theses. 34.http://scholarworks.uark.edu/cveguht/34

THE EFFECTS OF NOTCH GEOMETRY ON FRACTURE TESTING OF ASPHALT CONCRETE

THE EFFECTS OF NOTCH GEOMETRY ON FRACTURE TESTING OF ASPHALT CONCRETE
An Honors Thesis submitted in partial fulfillment
of the requirements for Honors Studies in
Civil Engineering
By
Rebekah Porter
December 2016
Departments of Civil Engineering
The University of Arkansas

This thesis is approved for recommendation to the Honors College.
Dr. Andrew Braham
Dr. Micah Hale
Dr. Gary Prinz

1
Project Summary
Asphalt concrete is commonly used as the surface layer on pavements because of its
convenience, low cost, and smooth ride. However, there is a significant problem with the
cracking and deterioration of asphalt concrete roads. The effects or cracking in asphalt
concrete have led to an increasing number of researchers using fracture mechanics to
study the resistance of asphalt mixtures. Several testing methods are used for fracture
testing of asphalt concrete including single-edge notched beam test, the disk-shaped
compaction test, and the semicircular bend test (SCB). The SCB test will be used in this
research to determine the fracture energy, the amount of energy needed to separate two
surfaces, of asphalt concrete. However, there are problems with the current fracture
testing methods because they create stress concentrations at the top of a rectangular notch,
which forces the crack to initiate from one predetermined place. This may not accurately
represent how fracturing occurs out in the field. Researchers need to find ways to isolate
and measure the true fracture energy while testing.
This research will explore the fracture energy measured in a specimen using three
different notch geometries: a typical rectangular notch, a circular notch, and a fatigue-
cracked specimen. Researchers today know there is a problem with roads cracking and
understand that what we are doing is not working, and we believe that a step towards
better understanding fracture energy is by exploring notch geometries.
2
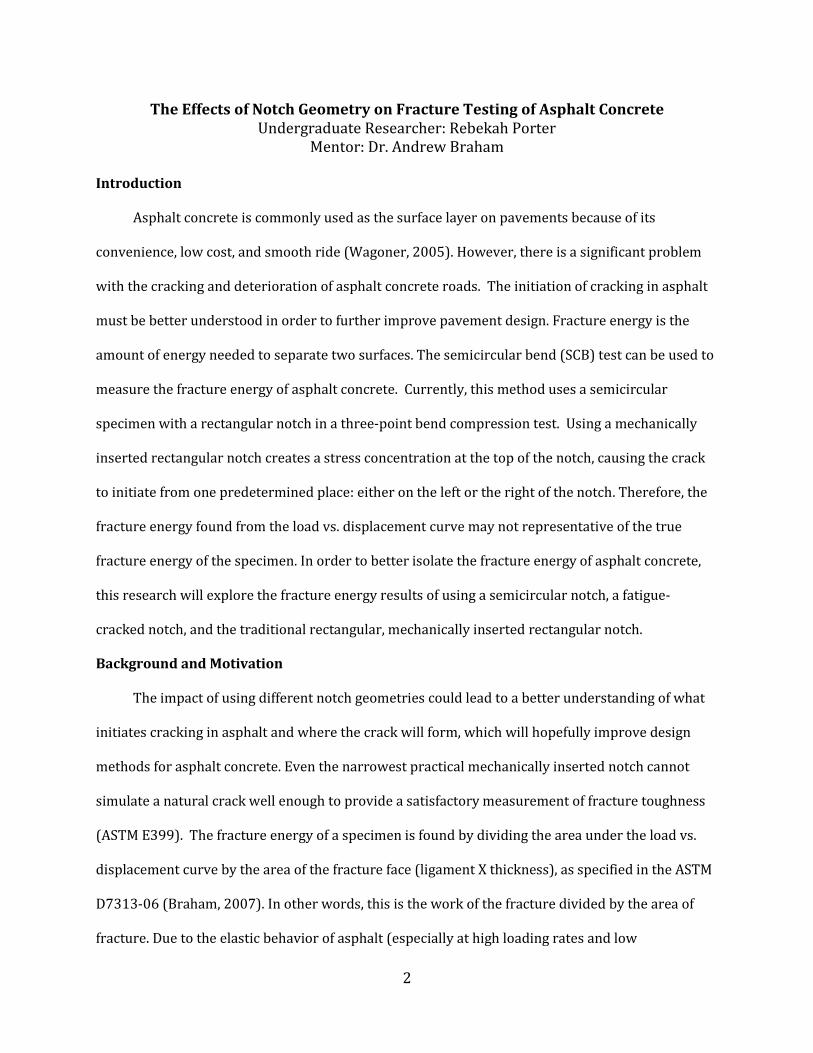
The Effects of Notch Geometry on Fracture Testing of Asphalt Concrete Undergraduate Researcher: Rebekah Porter
Mentor: Dr. Andrew Braham
Introduction
Asphalt concrete is commonly used as the surface layer on pavements because of its
convenience, low cost, and smooth ride (Wagoner, 2005). However, there is a significant problem
with the cracking and deterioration of asphalt concrete roads. The initiation of cracking in asphalt
must be better understood in order to further improve pavement design. Fracture energy is the
amount of energy needed to separate two surfaces. The semicircular bend (SCB) test can be used to
measure the fracture energy of asphalt concrete. Currently, this method uses a semicircular
specimen with a rectangular notch in a three-point bend compression test. Using a mechanically
inserted rectangular notch creates a stress concentration at the top of the notch, causing the crack
to initiate from one predetermined place: either on the left or the right of the notch. Therefore, the
fracture energy found from the load vs. displacement curve may not representative of the true
fracture energy of the specimen. In order to better isolate the fracture energy of asphalt concrete,
this research will explore the fracture energy results of using a semicircular notch, a fatigue-
cracked notch, and the traditional rectangular, mechanically inserted rectangular notch.
Background and Motivation
The impact of using different notch geometries could lead to a better understanding of what
initiates cracking in asphalt and where the crack will form, which will hopefully improve design
methods for asphalt concrete. Even the narrowest practical mechanically inserted notch cannot
simulate a natural crack well enough to provide a satisfactory measurement of fracture toughness
(ASTM E399). The fracture energy of a specimen is found by dividing the area under the load vs.
displacement curve by the area of the fracture face (ligament X thickness), as specified in the ASTM
D7313-06 (Braham, 2007). In other words, this is the work of the fracture divided by the area of
fracture. Due to the elastic behavior of asphalt (especially at high loading rates and low

3
temperatures), there is a significant rise in the load vs. displacement curve at the beginning of the
traditional SCB test, which correlates to a spike in energy before a crack forms because of the
development of a cohesive zone around the notch (Wagoner, 2005). When using a rectangular
notched specimen, the failure is expected to occur at the top of the notch at one of the corners, but
failure can occur due to a number of variables, including misalignment of the specimen during
testing or the random placement of the relatively large aggregate in the heterogeneous structure.
This “forcing” of a crack to form in a specific location provides difficulty in the ability to provide
accurate fracture properties. Using a circular notch like that of the Dog-Bone Direct Tension (DBDT)
test improves the disadvantages of a rectangular notch by providing a known failure plane (Koh,
2009). “Failure limits of the specimen are more accurately determined from measurements directly
on the failure plane with less propensity for failure due to eccentricity and effects than in specimens
of uniform cross-section (Koh, 2009).” Another solution to potentially inaccurate fracture energy
quantification would be the use of a fatigue crack. By fatigue cracking a specimen, a micro-crack is
produced that is unaffected by the cracking procedure and should reduce the initial energy spike
seen in the load vs. displacement curve, which dilutes the actual fracture energy of the formation of
new surfaces.
Objective
The objective of this research is to more precisely capture the fracture energy of asphalt
concrete by performing fracture tests using the traditional notch, a fatigue-cracked notch, and a
semicircular notch. Since current testing procedures create a high stress concentration at the top of
a rectangular notch, which then forces a crack to form at the corner and propagate through the
specimen, this research will explore and compare two new types of test specimen notch geometries.
One of the new geometries is a fatigue-crack that simulates the fracture tests run on steel by
creating a cyclic load on the specimen in order to weaken the cohesive zone before continuing the
test. This would likely measure more of a true fracture energy since the energy measured is only
the crack propagation through the specimen and not the initial crack formation. The other

4
geometry to be explored is similar to the Dog-Bone test in that the notch is a semicircle that allows
the crack to form anywhere along the notch instead of at a predetermined high stress
concentration. With a better understanding of the fracture energy of asphalt concrete, the future
design and testing of roads will eventually lead to fewer cracks and a more sustainable
infrastructure.
Materials and Methods
One traditional asphalt concrete mixture was used in this research. This mixture had a
nominal maximum aggregate size of 12.5mm coming from a surface mix of a typical state highway,
and a PG 64-22 asphalt binder. An air void content of 7% was targeted in order to be in the typical
range targeted in field construction. The SCB test method mentioned above was used. This method
called for a cylindrical specimen with a 150+-9mm diameter to be sliced into 24.7+-2mm thick
plates and then each plate cut in half, as shown in Figure 1. Each cylinder was batched and
compacted using the same mix design and the same gyratory compaction method. The specimens
were gyratory compacted to a calculated height of 134.3mm and an average air void of 6.3% was
achieved for the set of samples. Four semicircular specimens with 1” thickness were cut out of one
cylindrical sample. In total, 72 samples were created, however, some cylinders were misplaced and
a total of only 54 samples were tested. Tests were run using the SCB test method, specifically
looking at the three different notch geometries, three testing temperatures, and two loading rates.
The testing device is run using a specified loading rate, meaning the test is displacement controlled.
Figure 1: SCB Specimen Preparation from Asphalt Concrete Cylinder

5
The SCB test method consists of a closed-loop axial loading device (MTS system), a measuring
device, a three-point bend test fixture, and a data acquisition system (Li, 2004). Loading rates of
0.03 and 1.0mm/minute were used in order to ensure stable crack growth conditions. Load line
displacement (LLD) was measured by an external linear variable differential transformer (LVDT)
for all tests in order to have consistency. LLD is measured in the direction of the load and is
monitored using a clip gage placed on knife-edges that are glued 9mm apart on the bottom of the
specimen at the crack mouth. However, due to the semicircular notch geometry and in order to
remain consistent among all specimens, the gage was clipped onto knife-edges that were placed
9mm apart at the tip of the crack on the face of the specimen and therefore measured crack tip
opening displacement (CTOD). The SCB test was run until the load dropped below 0.5kN (Li, 2004).
If the load did not reach a maximum load that was above 0.5kN, the test was stopped after fifteen
minutes. Each specimen was kept at room temperature or in the temperature state at which it
would be eventually tested. This allows for better isolation of the actual fracture energy of the
specimen without dissipated energy. Temperature was controlled within 1˚C of the desired value;
each test was run at three different temperatures: +24˚C, 0˚C, and -24˚C with the three notch
geometries. A full factorial analysis of the experimental matrix shown in Table 1 was performed
with two to four replicates of each. The three different notch geometries that were tested are
shown in Figure 2 below.
Table 1. Experimental Matrix
Variables Values
Notch Geometry Rectangular, Fatigue-crack, Semicircle
Loading Rate (mm/min) 0.03, 1.0
Test Temperature (°C) -24, 0, 24
a) Rectangular Notch b) Semicircular Notch c) Fatigue-cracked Notch
Figure 2: Three Notch Geometries

6
The first test that was executed was run using the standard rectangular notch according to
AASHTO TP105-13 standard: Determining the Fracture Energy of Asphalt Mixtures using the
Semicircular Bend Geometry. For these tests, the rectangular 15+-5mm long notch, no wider than
1.5mm was cut along the axis of symmetry as shown in Figure 2a. Due to misplacing and breaking
some samples, only two replicates of each were tested. During the testing of specimens at the
warmest temperature (24°C) and the slowest loading rate (0.03 mm/min), the load never reached a
peak load above 0.5 kN, so the decision was made to stop the test consistently after 15 minutes.
Fracture energy in J/mˆ2 was calculated from the results and represented by the area under a plot
of a load vs. displacement (CTOD) curve.
The next test was using a semicircular notch similar to that of the research done by C. Koh in
2009, using Dog-Bone geometry. The notch has a 1” diameter, oriented as shown in Figure 2b. The
advantages of this geometry are that the failure plane is known and the stress concentrations near
the loading head have minimal effects on the test results. In addition, the crack was able to choose
the most natural path of formation and was not forced into one of two locations as is done with the
traditional rectangular geometry. Therefore this test was a measure of crack initiation and
propagation. The SCB test was run according to AASHTO TP105-13 for all specimens with this
geometry.
The ASTM E399 Standard Test Method describes the specimen for obtaining the plane-strain
fracture toughness of metallic specimens. The ASTM E399 was used as a starting point for the
testing of the third geometry shown in Figure 2c. Fatigue cracking a specimen allows for the
cohesive zone at the top of the notch to be at a minimum. In this method, it is assumed that the
fracture energy is size-independent and is constant along the crack path over the entire fracture
area. The methods from ASTM E399 and AASHTO TP105-13 were combined in order to perform the
SCB test on a fatigue cracked asphalt concrete specimen. This test was very dependent on human
control. Five increments were created based on the anticipated maximum load. The loads had to be
carefully watched and the test was manually stopped at each increment until the load visibly

7
reached a maximum. Once the maximum was reached, the test was allowed to continue running
according to the original ASTM specifications. Several attempts were made to create a program on
the MTS machine that would stop the test at each increment, but none were successful. Ideally, the
loads applied to the specimen should have been very fast and cyclic, however, the person had to run
over and release the load each time the test was stopped. There was no visible crack in the
specimen before the peak load was reached. A typical plot of load vs. displacement for an entire
process of a fatigue-cracked sample can be seen below in Figure 3. In this plot, one can see that the
specimen was loaded and then unloaded at 0.6kN, 1.1kN, 1.3kN, 1.4kN, then hit a peak of 1.6kN and
was allowed to continue running. Once the specimen had been fatigue cracked, the final run of the
test therefore measured only crack propagation since the cohesive zone was already weakened.
Results from all three tests were analyzed and compared to each other in order to determine if the
fracture energy of the specimens was more precisely captured.
Figure 3. Fatigue-crack test showing 5 increments
Results
The following Figures 4 and 5 show the results from testing. Figures 4a-c show the typical
load vs. displacement curve at a loading rate of 1.0 mm/min in order to compare each notch
geometry at each temperature.
0
0.2
0.4
0.6
0.8
1
1.2
1.4
1.6
1.8
0 0.05 0.1 0.15 0.2
Lo
ad
(k
N)
CTOD Displacement (mm)
1
2
3
4
5

8
Figure 4a. Load vs. Displacement at 24°C
Figure 4b. Load vs. Displacement at 0°C
Figure 4c. Load vs. Displacement at -24°C
0.0
0.5
1.0
1.5
2.0
2.5
3.0
0 0.1 0.2 0.3 0.4 0.5 0.6 0.7
Lo
ad
(k
N)
CTOD Displacement (mm)
Rectangular
Semicircular
Fatigue
0.0
0.5
1.0
1.5
2.0
2.5
3.0
0 0.1 0.2 0.3 0.4 0.5 0.6 0.7
Lo
ad
(k
N)
CTOD Displacement (mm)
Rectangular
Semicircular
Fatigue
0.0
0.5
1.0
1.5
2.0
2.5
3.0
0 0.02 0.04 0.06 0.08 0.1
Lo
ad
(k
N)
CTOD Displacement (mm)
Rectangular
Semicircular
Fatigue

9
409.0
237.8
194.4
449.7
405.1
194.3
423.5
332.5
22.2
0
100
200
300
400
500
600
1 2 3
Fra
ctu
re E
ne
rgy
(J/
mm
^2
)
Semcircular Rectangular Fatigue
24C
0C
-24C
65.5 63.3
116.6
364.0
311.2312.3329.0
240.1 228.9
0
100
200
300
400
500
600
1 2 3
Fra
ctu
re E
ne
rgy
(J/
mm
^2
)
Semicircular Rectangular Fatigue
24C
0C
-24C
For each of the different notch geometries and loading combinations, the fracture energy was
calculated using the area under the load vs. displacement curve. The results are shown in Figures 5a
& b with one standard deviation of error. If standard deviation is zero, only one sample was tested.
Figure 5a. Fracture energy at 0.03 mm/min loading rate
Figure 5b. Fracture energy at 1.0 mm/min loading rate
From a comparison of notch geometry in Figures 4 and 5, there are noticeable trends in
fracture energy. Semicircular notches consistently measured a greater fracture energy than that of
the standard rectangular notches, and the fatigue notches consistently measured a lower fracture

10
energy than that of the rectangular notch. It should be noted that when testing at the warmest
temperature and the slow loading rate, the material showed no significant peak load or visible
cracking; this test behaved more like a creep test and therefore is not a valid measure of fracture
energy. Conversely, when testing at the lowest temperature and highest loading rate, the material
showed a very brittle failure and split immediately when the peak load was reached. This also is not
a valid measure of fracture energy. The elastic behavior in the high temperatures and the brittle
behavior in the cold temperatures is noticeable in the graphs. From examining and comparing the
behavior of each specimen at the various temperatures as shown above in Figures 4a-c, it can also
be noted that in general, the colder the temperature the higher the peak load.
The trends seen in Figures 5a & b are to be expected. The high concentration of stress formed
in a rectangular notch would lead to a forced initiation of a crack at the corners beginning to
propagate through the sample and therefore, less energy required to separate the two surfaces.
Whereas, for a semicircular notch, the crack is most likely to form in the center of the sample but
has the freedom to form around a possible large aggregate if it is in the way. Because of this, there
was a greater amount of energy needed to separate the surfaces using a semicircular notch.
Similarly, in a fatigue-cracked sample, the cohesive zone was weakened if not diminished
completely which created a tiny non-visible crack in the sample and the final test measured solely
the crack propagation. It is reasonable for this measure of fracture energy to be less than that found
in the other geometries. Additionally, for all situations, the greatest fracture energy was measured
at a temperature of 0°C and the lowest fracture energy was measured at a temperature of 24°C.
Since fracture energy is a fundamental property of a material, it should be a measure of the
energy required to separate two surfaces. This indicates that the fatigue cracking method would be
most appropriate to measure fracture energy, as there is no cohesive zone. However, pavement
cracking does involve crack initiation and therefore does involve a cohesive zone. Therefore in this
case, the semicircular notch, in theory, would be the best test method in order to measure crack
initiation and propagation.

11
Conclusions
This research was an exploration of ways to measure fracture energy in order to determine a
more accurate representation of the true fracture energy. Based on the amount of cracking
occurring in pavements, it is possible that current test methods may be an underestimation of the
amount of energy required to actually separate two surfaces. This research explored two new forms
of testing by changing the geometry of the test specimen. One new geometry was a semicircular
notch which was specifically intended to measure crack initiation and propagation. The other
geometry was a fatigue cracked notch which was intended to measure solely crack propagation.
Both new methods were then compared to the standard test method used today. In total, three
different notch geometries were tested and analyzed.
Tests were performed using the SCB test based on mainly AASHTO TP105-13 with some
modifications taken from ASTM E399 in order to account for the new fatigue cracked geometry.
Instead of measuring displacement during loading at the crack mouth, it was measured at the crack
tip on the face of the specimen for all samples. Three temperatures, three notch geometries, and
two loading rates were used for testing, with between two and four replicates of each.
Based on results from testing, it is clear that the semicircular notch was in fact a measure of
both crack initiation and propagation and the fatigue cracked notch was able to measure solely
crack propagation. Because of this, the fracture energy measured with the semicircular notch was
greater than that of the standard rectangular notch and the fracture energy measured with fatigue
cracked samples was less than that of the standard rectangular notch. In theory, the fracture energy
is a material property, it should be a measure of solely the crack propagation through the specimen.
Therefore, the best test to measure this would be the fatigue cracked method. If the intent is to
measure both crack initiation and propagation, then the semicircular notch method would be best.
12
References
Braham, A., Buttlar, W., Marasteanu, M. Effect of Binder Type, Aggregate, and Mixture Composition on the Fracture Energy of Hot-Mix Asphalt in Cold Climates. Transportation Research Record: Journal of the Transportation Research Board, No. 2001, Transportation Research Board of the National Academies, Washington, D.C., 2007, pp. 102-109. Koh, C., Lopp, G., and Roque, R. “Development of a Dog-Bone Direct Tension Test (DBDT) for Asphalt Concrete,” Proc., 7th RILEM Symposium on Advanced Testing and Characterization of Bituminous Materials, Rhodes, Greece, Vol. 1, 2009, pp. 585–596. Li, X., Marasteanu, M. Evaluation of the Low Temperature Fracture Resistance of Asphalt Mixtures Using the Semi Circular Bend Test, Proceedings of the Association of Asphalt Paving Technologists, Vol. 73, 2004, pp. 401-426. Wagoner, M., Buttlar, W., and Paulino, G. “Disk-Shaped Compact Tension Test for Asphalt Concrete Fracture,” Society for Experimental Mechanics, Vol. 45, No. 3, June, 2005b, pp. 270-277.