the effects of non-plasticand plastic fines on the liquefaction of
TRANSCRIPT
8/8/2019 The Effects of Non-Plasticand Plastic Fines on the Liquefaction Of
http://slidepdf.com/reader/full/the-effects-of-non-plasticand-plastic-fines-on-the-liquefaction-of 1/288
8/8/2019 The Effects of Non-Plasticand Plastic Fines on the Liquefaction Of
http://slidepdf.com/reader/full/the-effects-of-non-plasticand-plastic-fines-on-the-liquefaction-of 2/288
The Effects Of Non-Plastic and Plastic Fines On The
Liquefaction Of Sandy Soils
Carmine Paul Polito
(ABSTRACT)
The presence of silt and clay particles has long been thought to affect the behavior of a
sand under cyclic loading. Unfortunately, a review of studies published in the literature
reveals that no clear conclusions can be drawn as to how altering fines content and
plasticity actually affects the liquefaction resistance of a sand. In fact, the literature
contains what appears to be contradictory evidence. There is a need to clarify the effects
of fines content and plasticity on the liquefaction resistance of sandy soils, and to
determine methods for accounting for these effects in engineering practice.
In order to help answer these questions, a program of research in the form of a laboratory
parametric study intended to clarify the effects which varying fines content and plasticity
have upon the liquefaction resistance of sandy sands was undertaken. The program of
research consisted of a large number of cyclic triaxial tests performed on two sands with
varying quantities of plastic and non-plastic fines. The program of research also
examined the applicability of plasticity based liquefaction criteria and the effects of finescontent and plasticity on pore pressure generation. Lastly, a review of how the findings
of this study may affect the manner in which simplified analyses are performed in
engineering practice was made.
The results of the study performed are used to clarify the effects of non-plastic fines
content and resolve the majority of the inconsistencies in the literature. The effects of
plastic fines content and fines plasticity are shown to be different than has been
previously reported. The validity of plasticity based liquefaction criteria is established,
the mechanism responsible for their validity is explained, and a new simplified criteria
proposed. The effects of fines content and plasticity on pore pressure generation are
discussed, and several recommendations are made for implementing the findings of thisstudy into engineering practice.
Keywords: Liquefaction, Fines, Silt, Clay, Liquefaction Criteria, Pore Pressures,
Simplified Procedure, Fines Correction, Cyclic Triaxial Test

8/8/2019 The Effects of Non-Plasticand Plastic Fines on the Liquefaction Of
http://slidepdf.com/reader/full/the-effects-of-non-plasticand-plastic-fines-on-the-liquefaction-of 3/288
iii
This work is dedicated to my family, without whose love and support it
could never have been attempted, much less completed

8/8/2019 The Effects of Non-Plasticand Plastic Fines on the Liquefaction Of
http://slidepdf.com/reader/full/the-effects-of-non-plasticand-plastic-fines-on-the-liquefaction-of 4/288
8/8/2019 The Effects of Non-Plasticand Plastic Fines on the Liquefaction Of
http://slidepdf.com/reader/full/the-effects-of-non-plasticand-plastic-fines-on-the-liquefaction-of 5/288
v
Acknowledgements
From beginning to end, my career as a doctoral candidate has spanned just over ten years.
To fully thank everyone involved in making this project possible and for helping to make
me the person and engineer that I have become would require a second volume at least as
large as the document before the reader. If I have left anyone off this list please realize
that you are only missing from this page, not from my heart.
I would like to thank my advisor, Doctor James R. Martin for his support and the freedom
to pursue this study, for better or worse, in the manner that I thought best. I would also
like to thank my committee for their time, efforts and valuable input.
I would like to thank my family for their support, encouragement and love during the
creation of this work and in my daily life.
I would like to thank my fellow graduate students and co-workers for their friendship,
input, and support over the years. This group includes, but is certainly not limited to,
Chris and Diane Baxter, Ken Berry, Fernando Bolinaga, Ron Boyer, Tony Brizendine, Ira
Brotman, Jim Coffey, Mary Jane Contos, George Filz, Trish Gallagher, Mike Galli, Mark
Gutberlet, Dick Gutschow, Ivan Hee, Matt Helmers, Glenn Hermanson, Jeff Huffman,
Ben Jarosz, Craig Johnson, Carolynn Jordan, Mia Kannik, Randy Kuzniakowski,
Christian Lovern, Lorena Manriquez, Steve McMullen, Clark Morrison, Aaron Muck,
Grigg Mullen, Kathy Murtagh, John Pappas, Larry Perko, Toni Poe, Eric Pond, Gretchen
Rau, Levi Regalado, Andy Rose, Keith Royston, Scott Saunders, Mike Scarlett, Jen
Schaefer, Will Shallenberger, C. J. Smith, Sharon Stoller, Trevor Thomas, Steve Winter,and Aaron Zdinak.
And a very special and heartfelt thanks to the special friends who have made it possible
for me to keep some small fraction of my sanity over the last 10 years. Mere words will
never be able to repay the debt I owe. Thanks to my mother Wynette, my sister
Antoinette, my Brother Dominic and his family, The Ellingboe Family, Mike Arnold,
Sam Lodge, Mark OrrNick Harman, Will Bassett, Rafael and Jean Castro, Jon Porter,
Jerry Tracy, Karen McClellan, Ron Boyle, Scott Mills, Brad Hardesty, Jennifer Scruggs
Brilliant, Harry Cook, Bruce Lacina, Jim Hawkins, Govi Kanann, Munish Kapoor, J.T.
McGinnis, Jeff McGregor, Brian Metcalfe, and Russell Green.
8/8/2019 The Effects of Non-Plasticand Plastic Fines on the Liquefaction Of
http://slidepdf.com/reader/full/the-effects-of-non-plasticand-plastic-fines-on-the-liquefaction-of 6/288
vi
Table Of Contents
ACKNOWLEDGEMENTS............................................................................................. V
LIST OF TABLES ..........................................................................................................IX
LIST OF FIGURES ......................................................................................................... X
CHAPTER 1: INTRODUCTION.................................................................................... 1
1.1 STATEMENT OF THE PROBLEM ................................................................................... 1
1.2 SCOPE OF THE RESEARCH.......................................................................................... 3
1.3 OUTLINE OF THIS DOCUMENT .................................................................................... 5
CHAPTER 2: LITERATURE REVIEW........................................................................ 8
2.1 THE EFFECTS OF FINE CONTENT AND PLASTICITY ON LIQUEFACTION RESISTANCE ....82.1.1 The Effects Of Non-Plastic Fine Content........................................................... 8
2.1.2 The Effects of Plastic Fines Content and Plasticity And Plasticity Based
Liquefaction Criteria ................................................................................................. 12
2.2.3 Plasticity Based Liquefaction Criteria.............................................................. 13
2.2 THE EFFECTS OF FINES CONTENT AND PLASTICITY ON PORE PRESSURE GENERATION
....................................................................................................................................... 14
2.2.1 Rate And Magnitude Of Pore Pressure Generation.......................................... 14
CHAPTER 3: THE LABORATORY TESTING PROGRAM................................... 32
3.1 SOILS TESTED........................................................................................................... 32
3.1.1 Sands ................................................................................................................ 323.1.2 Silt .................................................................................................................... 33
3.1.3 Clays................................................................................................................. 33
3.1.4 Soil Mixtures with Non-Plastic Fines .............................................................. 34
3.1.5 Soil Mixtures with Plastic Fines ...................................................................... 34
3.2 INDEX TESTING ........................................................................................................ 34
3.2.1 Grain Size Characteristics ................................................................................ 35
3.2.2 Maximum And Minimum Void Ratios ............................................................ 35
3.2.3 Specific Gravity................................................................................................ 37
3.2.4 Soil Plasticity.................................................................................................... 37
3.3 CYCLIC TRIAXIAL TESTING ...................................................................................... 37
3.3.1 Basic Theory Of Cyclic Triaxial Testing ......................................................... 383.3.2 The Differences Between Cyclic Triaxial And In-Situ Earthquake Loadings 39
3.3.3 Factors Affecting Cyclic Resistance ................................................................ 43
3.3.4 Definition of Liquefaction................................................................................ 48
8/8/2019 The Effects of Non-Plasticand Plastic Fines on the Liquefaction Of
http://slidepdf.com/reader/full/the-effects-of-non-plasticand-plastic-fines-on-the-liquefaction-of 7/288
vii
3.4 TESTING EQUIPMENT AND TEST METHODOLOGY ..................................................... 49
3.4.1 Testing Equipment ........................................................................................... 49
3.4.2 Test Methodology............................................................................................. 50
3.4.3 Calibration Of The Test Methodology............................................................. 57
3.5 CORRECTION OF CYCLIC STRESS RATIOS................................................................. 57
CHAPTER 4: THE EFFECTS OF NON-PLASTIC FINES....................................... 76
4.1 FINDINGS OF THE CURRENT STUDY .......................................................................... 77
4.1.1 Tests Evaluated In Terms Of Gross Void Ratio And Gross Relative Density.77
4.1.2 Tests Evaluated In Terms Of Sand Skeleton Void Ratio ................................. 79
4.1.3 Tests Evaluated In Terms Of Constant Soil Specific Relative Density ........... 82
4.2 FLOW LIQUEFACTION AND CYCLIC MOBILITY .......................................................... 83
4.2.1 Flow Liquefaction ............................................................................................ 84
4.2.2 Cyclic Mobility................................................................................................. 85
4.3 EVALUATION AND RECONCILIATION OF THE RESULTS OF PUBLISHED STUDIES ......86
4.3.1 Normalized Cyclic Resistance.......................................................................... 864.3.2 Changes In Soil Specific Relative Density With Increasing Silt Content........ 88
4.3.3 Decreasing Cyclic Resistance With Increasing Silt Content............................ 89
4.3.4 Decreasing And Then Increasing Cyclic Resistance With Increasing Silt
Content ...................................................................................................................... 90
4.3.5 Cyclic Resistance With Constant Sand Skeleton Void Ratio .......................... 91
4.3.6 Increasing Cyclic Resistance With Increasing Silt Content ............................. 94
4.4 CONCLUSIONS .......................................................................................................... 95
CHAPTER 5: THE EFFECTS OF PLASTIC FINES AND PLASTICITY BASED
LIQUEFACTION CRITERIA..................................................................................... 125
5.1 PREVIOUS STUDIES................................................................................................. 1255.2 TESTING PROGRAM ................................................................................................ 126
5.2.1 Soils Tested.................................................................................................... 126
5.2.2 Measurement of Plasticity.............................................................................. 127
5.3 RESULTS OF TESTING ............................................................................................. 128
5.3.1 Results Of All Tests Performed ..................................................................... 129
5.3.2 Results Of Tests Performed At A Constant Fines Content............................ 132
5.4 PLASTICITY BASED LIQUEFACTION CRITERIA ......................................................... 133
5.4.1 The Chinese Criteria....................................................................................... 135
5.4.2 Seed et al.’s Criteria ....................................................................................... 136
5.4.3 Finn, Ledbetter, and Wu’s Criteria................................................................. 137
5.4.4 Koester’s Criteria ........................................................................................... 138
5.4.5 Implications.................................................................................................... 139
5.5 A BEHAVIORAL HYPOTHESIS ................................................................................. 141
5.5 CONCLUSIONS ........................................................................................................ 142
8/8/2019 The Effects of Non-Plasticand Plastic Fines on the Liquefaction Of
http://slidepdf.com/reader/full/the-effects-of-non-plasticand-plastic-fines-on-the-liquefaction-of 8/288
viii
CHAPTER 6: PORE PRESSURE GENERATION................................................... 167
6.1 PORE PRESSURE DEVELOPMENT AS A FUNCTION OF LOADING ............................. 167
6.1.1 Clean Sands.................................................................................................... 167
6.1.2 Sands With Non-Plastic Fines........................................................................ 1686.1.3 Sands With Plastic Fines................................................................................ 170
6.2 PORE PRESSURE DEVELOPMENT AS A FUNCTION OF STRAIN ................................ 171
6.2.1 Clean Sands and Soils with Non-Plastic Fines............................................... 171
6.2.2 Sands with Plastic Fines................................................................................. 172
6.3 CONCLUSIONS ........................................................................................................ 176
CHAPTER 7: IMPLICATIONS OF FINDINGS....................................................... 202
7.1 IMPLICATIONS OF FINDINGS ABOUT SANDS WITH NON-PLASTIC FINES .................202
7.1.1 The Simplified Procedure............................................................................... 202
7.1.2 Implications of Findings On Soils Below The Limiting Silt Content............ 204
7.1.3 Implications Of Findings On Soils Above The Limiting Silt Content........... 2077.2 IMPLICATIONS OF FINDINGS ABOUT SANDS WITH PLASTIC FINES.......................... 208
7.3 IMPLICATIONS OF FINDINGS ABOUT PORE PRESSURE GENERATION ....................... 209
7.4 CONCLUSIONS ........................................................................................................ 209
CHAPTER 8: CONCLUSIONS AND RECOMMENDATIONS............................. 222
8.1 EFFECTS OF NON-PLASTIC FINES ........................................................................... 222
8.2 EFFECTS OF PLASTIC FINES AND PLASTICITY BASED LIQUEFACTION CRITERIA .....224
8.3 PORE PRESSURE GENERATION................................................................................ 227
8.4 IMPLICATIONS OF RESEARCH TO CURRENT PRACTICE ........................................... 229
REFERENCES.............................................................................................................. 234
APPENDIX A: CYCLIC TRIAXIAL TESTS - TEST PARAMETERS ................. 244
APPENDIX B: CYCLIC TRIAXIAL TESTS- LIQUEFACTION RESULTS ....... 254
APPENDIX C: INDEX DENSITY TESTING............................................................ 264
APPENDIX D: LIMITING SILT CONTENT ........................................................... 267
VITA............................................................................................................................... 274
8/8/2019 The Effects of Non-Plasticand Plastic Fines on the Liquefaction Of
http://slidepdf.com/reader/full/the-effects-of-non-plasticand-plastic-fines-on-the-liquefaction-of 9/288

8/8/2019 The Effects of Non-Plasticand Plastic Fines on the Liquefaction Of
http://slidepdf.com/reader/full/the-effects-of-non-plasticand-plastic-fines-on-the-liquefaction-of 10/288
x
List of Figures
Figure 2-1: Increase in cyclic resistance with increase in silt content............................... 26
(After Chang et al., 1982).................................................................................................. 26
Figure 2-2: Decrease in cyclic resistance with increase in silt content ............................. 27
(From Tronsco and Verdugo, 1985).................................................................................. 27
Figure 2-3: Decrease and then increase in cyclic resistance with increase in silt content.28
(From Koester, 1994) ........................................................................................................ 28
Figure 2-4: Increase in cyclic resistance with increase in plasticity index........................ 29
(From Ishihara and Koseki, 1989)..................................................................................... 29
Figure 2-5: Pore pressure generation characteristics for two sands .................................. 30
(From Lee and Albaisa, 1974)........................................................................................... 30
Figure 2-6: Pore pressure generation characteristics as a function of shear strain............ 31
(After Dobry et al, 1974)................................................................................................... 31
Figure 3-1: Grain size distributions for component soils .................................................. 63
Figure 3-2: Variation in index void ratios with silt content .............................................. 64
Figure 3-3: A cyclic resistance curve (After Silver et al. (1976)) ..................................... 65
Figure 3-4: Idealized stresses induced by seismic shaking on a soil element under......... 66
level ground (After Seed and Lee (1966))......................................................................... 66
Figure 3-5: Stress conditions during cyclic triaxial test (From Seed and Lee (1966))...... 67
Figure 3-6: Applied stresses and stress path for a soil element in the field ...................... 68
Figure 3-7: Applied stresses and stress path for a soil element in a cyclic triaxial test .... 69
Figure 3-8: Multiple components of earthquake motions ................................................. 70
Figure 3-9: The effect of wave shape on liquefaction resistance (From Silver et al. (1976))
................................................................................................................................... 71Figure 3-10: Effects of different frequencies of loading on Monterey sand ..................... 72
Figure 3-11: Definitions of single and double amplitude shear strain .............................. 73
Figure 3-12: Typical cyclic triaxial data sheet .................................................................. 74
Figure 3-13: Calibration of test methodology................................................................... 75
Figure 4-1: Variation in cyclic resistance with silt content for Monterey sand at constant
gross void ratio of 0.68.............................................................................................. 98
Figure 4-2: Variation in cyclic resistance with silt content for Yatesville sand at constant
gross void ratio of 0.76.............................................................................................. 99
Figure 4-3: Variation in cyclic resistance with gross void ratio for Monterey sand ....... 100
Figure 4-4: Variation in cyclic resistance with gross void ratio for Yatesville sand....... 101
Figure 4-5: Variation in cyclic resistance for Monterey sand specimens prepared to aconstant sand skeleton void ratio of 0.75................................................................ 102
Figure 4-6: Variation in cyclic resistance for Yatesville sand specimens prepared to
constant sand skeleton void ratios........................................................................... 103
Figure 4-7: Variation in cyclic resistance with sand skeleton void ratio for Monterey sand
................................................................................................................................. 104
8/8/2019 The Effects of Non-Plasticand Plastic Fines on the Liquefaction Of
http://slidepdf.com/reader/full/the-effects-of-non-plasticand-plastic-fines-on-the-liquefaction-of 11/288
xi
Figure 4-8: Variation in cyclic resistance with sand skeleton void ratio for Yatesville sand
................................................................................................................................. 105
Figure 4-9: Variation in cyclic resistance with soil specific relative density for Monterey
sand.......................................................................................................................... 106
Figure 4-10 - Variation in cyclic resistance with soil specific relative density forYatesville sand ........................................................................................................ 107
Figure 4-11 - Variation in cyclic resistance with silt fraction void ratio for soils with silt
contents above the limiting silt content................................................................... 108
Figure 4-12: Variation in cyclic resistance with silt content for Yatesville sand specimens
adjusted to 25% soil specific relative density ......................................................... 109
Figure 4-13: Example of a steady-state line.................................................................... 110
Figure 4-14: Typical strain behavior for a specimen susceptible to flow liquefaction ... 111
Figure 4-15: Typical strain behavior for a specimen susceptible to cyclic mobility....... 112
Figure 4-16: Variation in index void ratios and soil specific relative density for Yatesville
sand specimens prepared to a constant gross void ratio of 0.76.............................. 113
Figure 4-17: Variation in cyclic resistance and soil specific relative density for Monterey
sand specimens prepared to a constant gross void ratio of 0.68.............................. 114
Figure 4-18: Variation in cyclic resistance and soil specific relative density for Yatesville
sand specimens prepared to a constant gross void ratio of 0.76.............................. 115
Figure 4-19: Number of cycles to initial liquefaction versus cyclic stress ratio for
Yatesville sand and silt at 50 percent soil specific relative density ........................ 116
Figure 4-20: Comparison of variations in normalized cyclic resistance between data from
the current and published studies ............................................................................ 117
Figure 4-21: Comparison of variations in normalized cyclic resistance between data from
the current and published studies ............................................................................ 118
Figure 4-22: Variation in index void ratios and gross void ratio for Monterey sand
specimens prepared to a constant sand skeleton void ratio of 0.75......................... 119
Figure 4-23: Variation in cyclic resistance for Monterey sand specimens prepared to a
constant sand skeleton void ratio of 0.75................................................................ 120
Figure 4-24: Variation in cyclic resistance for Yatesville sand specimens prepared to
constant sand skeleton void ratios........................................................................... 121
Figure 4-25: Variation in index void ratios and gross void ratio for Yatesville sand
specimens prepared to a constant sand skeleton void ratio of 0.90......................... 122
Figure 4-26: Variation in cyclic resistance with soil specific relative density for Yatesville
sand specimens prepared to constant sand skeleton void ratios.............................. 123
Figure 4-27: Increase in normalized cyclic resistance with increasing silt content ........ 124
Figure 5-1: Variation in cyclic resistance with silty and clayey fines for specimensprepared to a constant soil specific relative density................................................ 150
Figure 5-2: Variation in cyclic resistance with fines content for specimens prepared to a
constant soil specific relative density...................................................................... 151
Figure 5-3: Variation in cyclic resistance with clay content for specimens prepared to a
constant soil specific relative density...................................................................... 152
8/8/2019 The Effects of Non-Plasticand Plastic Fines on the Liquefaction Of
http://slidepdf.com/reader/full/the-effects-of-non-plasticand-plastic-fines-on-the-liquefaction-of 12/288
xii
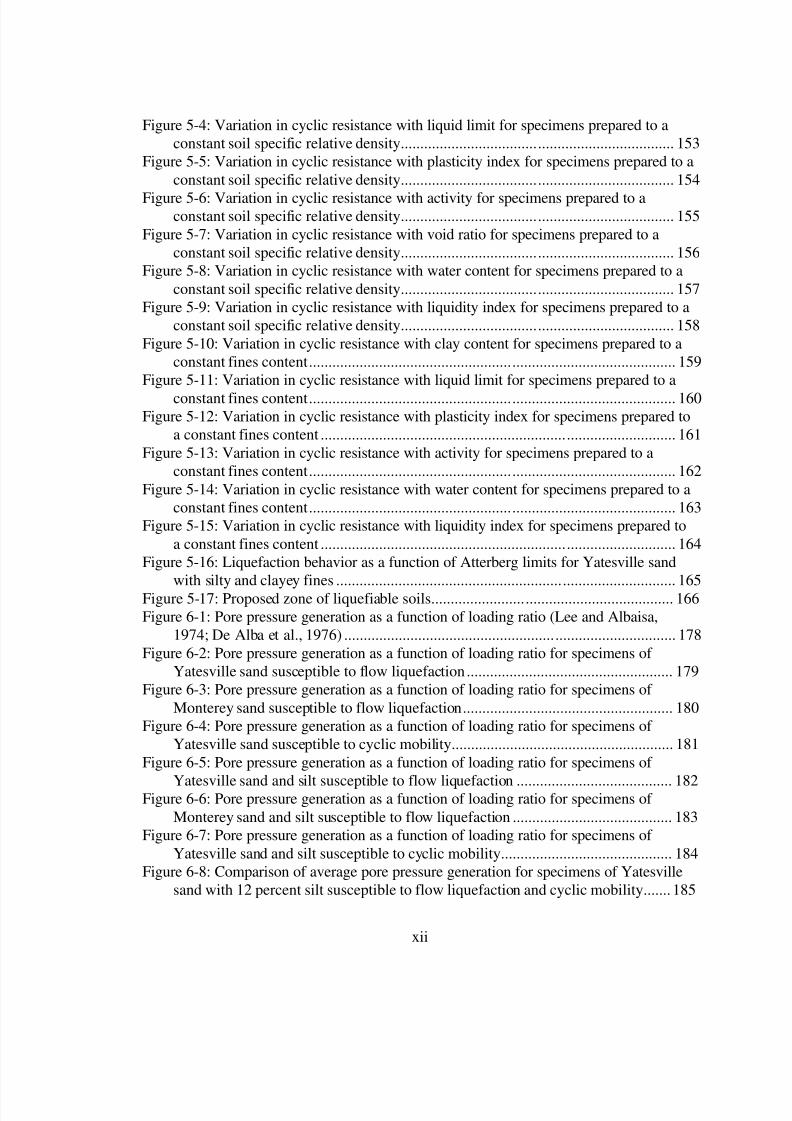
Figure 5-4: Variation in cyclic resistance with liquid limit for specimens prepared to a
constant soil specific relative density...................................................................... 153
Figure 5-5: Variation in cyclic resistance with plasticity index for specimens prepared to a
constant soil specific relative density...................................................................... 154
Figure 5-6: Variation in cyclic resistance with activity for specimens prepared to aconstant soil specific relative density...................................................................... 155
Figure 5-7: Variation in cyclic resistance with void ratio for specimens prepared to a
constant soil specific relative density...................................................................... 156
Figure 5-8: Variation in cyclic resistance with water content for specimens prepared to a
constant soil specific relative density...................................................................... 157
Figure 5-9: Variation in cyclic resistance with liquidity index for specimens prepared to a
constant soil specific relative density...................................................................... 158
Figure 5-10: Variation in cyclic resistance with clay content for specimens prepared to a
constant fines content.............................................................................................. 159
Figure 5-11: Variation in cyclic resistance with liquid limit for specimens prepared to a
constant fines content.............................................................................................. 160
Figure 5-12: Variation in cyclic resistance with plasticity index for specimens prepared to
a constant fines content ........................................................................................... 161
Figure 5-13: Variation in cyclic resistance with activity for specimens prepared to a
constant fines content.............................................................................................. 162
Figure 5-14: Variation in cyclic resistance with water content for specimens prepared to a
constant fines content.............................................................................................. 163
Figure 5-15: Variation in cyclic resistance with liquidity index for specimens prepared to
a constant fines content ........................................................................................... 164
Figure 5-16: Liquefaction behavior as a function of Atterberg limits for Yatesville sand
with silty and clayey fines ....................................................................................... 165
Figure 5-17: Proposed zone of liquefiable soils.............................................................. 166
Figure 6-1: Pore pressure generation as a function of loading ratio (Lee and Albaisa,
1974; De Alba et al., 1976) ..................................................................................... 178
Figure 6-2: Pore pressure generation as a function of loading ratio for specimens of
Yatesville sand susceptible to flow liquefaction..................................................... 179
Figure 6-3: Pore pressure generation as a function of loading ratio for specimens of
Monterey sand susceptible to flow liquefaction...................................................... 180
Figure 6-4: Pore pressure generation as a function of loading ratio for specimens of
Yatesville sand susceptible to cyclic mobility......................................................... 181
Figure 6-5: Pore pressure generation as a function of loading ratio for specimens of
Yatesville sand and silt susceptible to flow liquefaction ........................................ 182Figure 6-6: Pore pressure generation as a function of loading ratio for specimens of
Monterey sand and silt susceptible to flow liquefaction ......................................... 183
Figure 6-7: Pore pressure generation as a function of loading ratio for specimens of
Yatesville sand and silt susceptible to cyclic mobility............................................ 184
Figure 6-8: Comparison of average pore pressure generation for specimens of Yatesville
sand with 12 percent silt susceptible to flow liquefaction and cyclic mobility....... 185

8/8/2019 The Effects of Non-Plasticand Plastic Fines on the Liquefaction Of
http://slidepdf.com/reader/full/the-effects-of-non-plasticand-plastic-fines-on-the-liquefaction-of 13/288
xiii
Figure 6-9: Pore pressure generation as a function of plasticity for specimens of
Yatesville sand with kaolinite ................................................................................. 186
Figure 6-9: Pore pressure generation as a function of loading ratio for specimens of
Yatesville sand with 17 percent plastic fines .......................................................... 187
Figure 6-11: Effect of silt content on the strain required to achieve one percent residualpore pressure ratio for specimens of Yatesville sand with silt................................ 188
Figure 6-12: Variation in the strain required to achieve one percent residual pore pressure
ratio as a function of soil specific relative density for specimens of Yatesville sand
with silt below the limiting silt content................................................................... 189
Figure 6-13: Variation in the strain required to achieve one percent residual pore pressure
ratio as a function of the silt fraction void ratio for specimens of Yatesville sand with
silt above the limiting silt content ........................................................................... 190
Figure 6-14: Variation in the strain required to achieve one percent residual pore pressure
ratio as a function of the silt content for specimens of Yatesville sand with silt
prepared to a constant soil specific relative density................................................ 191
Figure 6-15: Variation in the strain required to achieve seventy percent residual pore
pressure ratio as a function of the silt content for specimens of Yatesville sand with
silt prepared to a constant soil specific relative density.......................................... 192
Figure 6-16: Variation in the strain required to achieve one percent residual pore pressure
ratio as a function of fines content for specimens of Yatesville sand with plastic fines
................................................................................................................................. 193
Figure 6-17: Variation in the strain required to achieve one percent residual pore pressure
ratio as a function of clay content for specimens of Yatesville sand with plastic fines
................................................................................................................................. 194
Figure 6-18: Variation in the strain required to achieve one percent residual pore pressure
ratio as a function of liquid limit for specimens of Yatesville sand with plastic fines
................................................................................................................................. 195
Figure 6-19: Variation in the strain required to achieve one percent residual pore pressure
ratio as a function of plasticity index for specimens of Yatesville sand with plastic
fines ......................................................................................................................... 196
Figure 6-20: Variation in the strain required to achieve one percent residual pore pressure
ratio as a function of activity for specimens of Yatesville sand with plastic fines . 197
Figure 6-21: Variation in the strain required to achieve one percent residual pore pressure
ratio as a function of clay content for specimens of Yatesville sand with 17 percent
plastic fines.............................................................................................................. 198
Figure 6-22: Variation in the strain required to achieve one percent residual pore pressure
ratio as a function of liquid limit for specimens of Yatesville sand with 17 percentplastic fines.............................................................................................................. 199
Figure 6-23: Variation in the strain required to achieve one percent residual pore pressure
ratio as a function of plasticity index for specimens of Yatesville sand with 17
percent plastic fines................................................................................................. 200

8/8/2019 The Effects of Non-Plasticand Plastic Fines on the Liquefaction Of
http://slidepdf.com/reader/full/the-effects-of-non-plasticand-plastic-fines-on-the-liquefaction-of 14/288
xiv
Figure 6-24: Variation in the strain required to achieve one percent residual pore pressure
ratio as a function of activity for specimens of Yatesville sand with 17 percent
plastic fines.............................................................................................................. 201
Figure 7-1: Liquefaction chart for the simplified procedure ........................................... 213
Figure 7-2: Cyclic resistance curves based on Seed et al.’s (1983) correction ............... 214Figure 7-3: Cyclic resistance curves based on Robertson and Wride’s (1997) correction
................................................................................................................................. 215
Figure 7-4: Cyclic resistance curves based on NCEER (1997) correction......................216
Figure 7-5: Cyclic resistance curves based on new, recommended correction............... 217
Figure 7-6: Variation in cyclic resistance above and below the limiting silt content ..... 218
Figure 7-7: Distribution of limiting silt contents ............................................................ 219
Figure 7-8: Variation in cyclic resistance with fines composition.................................. 220
Figure 7-9: Proposed zone of liquefiable soils................................................................ 221
Figure 8-1: Variation in cyclic resistance with silt content for Yatesville sand specimens
adjusted to 25% soil specific relative density ......................................................... 232
Figure 8-2: Proposed zone of liquefiable soils................................................................ 233

8/8/2019 The Effects of Non-Plasticand Plastic Fines on the Liquefaction Of
http://slidepdf.com/reader/full/the-effects-of-non-plasticand-plastic-fines-on-the-liquefaction-of 15/288
1
CHAPTER 1: INTRODUCTION
Derived from the Latin verb “liquefacere”, meaning to melt, to dissolve, or to weaken,
liquefaction is the term commonly used to describe the sudden, dramatic strength loss
which sometimes occurs in sands during seismic loading. While most frequently
associated with cohesionless soils and dynamic loadings, it has been reported in many
types of soils under both dynamic and static loadings.
The liquefaction of sands during earthquakes has occurred throughout recorded history,
and certainly before that, however it was not until the early 1960’s that scientific research
into the subject began in earnest. Since the 1964 Anchorage, Alaska, and Nigata, Japan
earthquakes, great strides have been made in understanding the mechanisms behind
liquefaction and the conditions that make soils susceptible to it.
1.1 Statement Of The Problem
It has been understood since the 1960's that the presence of silt and clay particles will in
some manner affect the resistance of a sand to liquefaction. However, a review of studies
published in the literature shows that no clear conclusions can be drawn as to in what
manner altering the fines content affects the liquefaction resistance of a sand under cyclic
loading. This is particularly true for soils containing non-plastic, i.e. silty, fines.
Numerous laboratory studies have been performed, and have produced what appear to be
conflicting results. Studies have reported that increasing the silt content in a sand will
increase the liquefaction resistance of the sand, decrease the liquefaction resistance of the
sand, or decrease the liquefaction resistance until some limiting silt content is reached,
and then increase its resistance. Additionally, several studies have shown that the
liquefaction resistance of a silty sand is more closely related to its sand skeleton void ratio
than to its silt content. The need to clarify the effects of non-plastic fines on the

8/8/2019 The Effects of Non-Plasticand Plastic Fines on the Liquefaction Of
http://slidepdf.com/reader/full/the-effects-of-non-plasticand-plastic-fines-on-the-liquefaction-of 16/288
2
liquefaction susceptibility of sandy soils forms the first major point of investigation in
this research.
The presence of plastic or clayey fines is generally considered to decrease the liquefaction
susceptibility of a soil. Numerous field studies have shown that soils with more than 10
or 15 percent fines do not liquefy during earthquakes. During the 1970’s, Engineers in
the Peoples Republic of China (PRC) developed a set of criteria in their building codes,
commonly referred to as the Chinese criteria, which deem certain soils as “non-
liquefiable” due to their plastic nature. How the introduction of clayey fines actually
affects the liquefaction susceptibility of a soil and the validity of plasticity based
liquefaction criteria form major points of investigation of this research.
The manner in which pore pressure generation varies as the quantity and type of
fine-grained material in a sand increases is an important aspect of this investigation. In
addition to affecting the liquefaction behavior of the soil, the rate and magnitude of pore
pressure generation during seismic loading has a profound effect on the strength of the
soil and the stability of structures constructed from, or founded on it. Pore pressure
generation during cyclic loading can be examined either in terms of the number of cycles
of loading that the soil has undergone or else in terms of the strain which that loading has
produced in the soil mass. Both criteria will be used to examine the effects of fines
content and plasticity on pore pressure generation.
Lastly, it is important to examine in what manner the findings of this study will affect the
manner in which working engineers perform simplified liquefaction analyses. Are the
charts currently in use adequately conservative, or are they overly so? Are the correctionscurrently made for non-plastic fines correct? Are new corrections needed for plastic
fines, or are the Chinese criteria valid and can be incorporated into current practices? A
summary of these issues will conclude this research program.
8/8/2019 The Effects of Non-Plasticand Plastic Fines on the Liquefaction Of
http://slidepdf.com/reader/full/the-effects-of-non-plasticand-plastic-fines-on-the-liquefaction-of 17/288
3
In summary, the problems under investigation in this research program can be broken
down into five separate issues:
1) The effects of non-plastic fines content on the liquefaction resistance of sandy soils
2) The effects of plastic fines content and plasticity on the liquefaction resistance of
sandy soils
3) The validity and applicability of plasticity based liquefaction criteria
4) The effects of plastic and non-plastic fines on pore pressure generation.
5) How do the findings on the first four issues affect the manner in which simplified
liquefaction analyses are performed by practicing engineers?
1.2 Scope Of The Research
In order to clarify the questions previously outlined, a program of research in the form of
a laboratory parametric study intended to clarify the effects which varying fines content
and plasticity have upon the liquefaction resistance of sandy sands was undertaken. The
program of research also examined the applicability of plasticity based liquefaction
criteria and the effects of fines content and plasticity on pore pressure generation. Lastly,
a review of how the findings of this study may affect the manner in which simplified
analyses are performed in engineering practice was made.
During the first portion of the study a series of cyclic triaxial tests were run in order to
study the effects of non-plastic silt content on the liquefaction resistance of sandy soils.
Tests were run on two sands in which silt content was varied while either the gross void
ratio, the sand skeleton void ratio, or the soil specific relative density was held constant.
For each combination of silt content and density, a minimum of three specimens were
tested at various cyclic stress ratios (CSR’s) in order to produce a series of curves which
plot cyclic stress ratio against the number of cycles required to cause liquefaction. From
these curves, the cyclic resistance of the soil was determined for each combination of silt

8/8/2019 The Effects of Non-Plasticand Plastic Fines on the Liquefaction Of
http://slidepdf.com/reader/full/the-effects-of-non-plasticand-plastic-fines-on-the-liquefaction-of 18/288
4
content and density. The variation in cyclic resistance with silt content was then
examined in terms of the gross void ratio, the sand skeleton void ratio, and the relative
density of the specimens tested.
During the second portion of the study a series of cyclic triaxial tests was run in order to
study the effects of plastic fines content and plasticity on the liquefaction resistance of a
clayey sand. Tests were run at a constant soil specific relative density for various
combinations of fines content and plasticity. The composition of the fines, and thus their
plasticity, was varied by combining different proportions of non-plastic silt, kaolinite, and
bentonite. The cyclic resistance was then examined in terms of the fines content, the clay
content, the liquid limit, the plasticity index, and the activity of the soil tested.
Jennings (1980) presents a listing of the parameters used by engineers in the People’s
Republic of China to separate soils which are considered liquefiable from those
considered non-liquefiable. Soils meeting the Chinese criteria or other plasticity based
liquefaction criteria are considered to be non-liquefiable. The results of the cyclic triaxial
testing program were used to examine the validity of these criteria and to determine if
there are any fundamental behavioral differences between soils meeting or not meeting
the criteria.
Data from the cyclic triaxial tests were analyzed to evaluate the effects of fines content
and plasticity on the pore pressure generation characteristics of silty and clayey sands.
Pore pressure generation was evaluated both in terms of the number of cycles of loading
required to cause a given rise in pore pressure and in terms of the amount of strain require
to achieve a certain level of pore pressure ratio.
Lastly, whether the findings of the current research will have any effect on the manner in
which simplified liquefaction analyses are currently performed in engineering practice
was examined.

8/8/2019 The Effects of Non-Plasticand Plastic Fines on the Liquefaction Of
http://slidepdf.com/reader/full/the-effects-of-non-plasticand-plastic-fines-on-the-liquefaction-of 19/288
5
1.3 Outline Of This Document
Following this introductory section, Chapter 2 of this document presents the results of a
literature review performed to learn what is currently understood about the effects of
non-plastic and plastic fines content and fines plasticity on the liquefaction of sandy soils.
Next, Chapter 3 consists of a discussion of the soils tested, a brief review of cyclic triaxial
testing and the factors which affect it, and a detailed review of the cyclic triaxial test
methodology used in this study. Chapter 4 presents the findings of the study on the
effects of non-plastic fines content on the liquefaction of sandy soils. One global theory
is presented and used to reconcile the differences found in the literature. Chapter 5
presents the findings of the effects of plastic fines content and plasticity on the
liquefaction of sandy soils, and examines the validity of the Chinese criteria and other
plasticity based liquefaction criteria and the mechanisms behind them. Chapter 6
examines the manner in which plastic and non-plastic fines affect pore pressure
generation in sands during cyclic loading. Chapter 7 examines how the findings of this
study may impact the manner in which simplified liquefaction analyses are performed in
engineering practice. Chapter 8 presents a summary of conclusions drawn from this study
and suggestions for further studies in this area. A series of appendices containing theparameters and data for the individual cyclic triaxial tests, data from the index density
testing program and information on the limiting silt content follow Chapter 9.
Table 1-1 contains a listing of some of the terms and equations used in this document and
their definitions.

8/8/2019 The Effects of Non-Plasticand Plastic Fines on the Liquefaction Of
http://slidepdf.com/reader/full/the-effects-of-non-plasticand-plastic-fines-on-the-liquefaction-of 20/288
6
Table 1-1: Definition of terms and appropriate equations
Parameter Applicable Equations and Definitions
Gross Void Ratio, eg egVvVs
=
Vv = Volume of voids
Vs = Volume of solids
Sand Skeleton Void Ratio, ess e
ss
VvssVss
=
Vvss = Volume of voids formed by the sand skeleton
Vss = Volume of sand solids
Silt Fraction Void Ratio, em em
VvVsm
=
Vsm = Volume of silt solids
Vvss = Volume of voids formed by the silt skeleton
Gross Relative Density, DrDr
emax,cs
eg
emax,cs
emin,cs
x100%=−
−
emax,cs = maximum index void ratio of the clean sand
emin,cs = minimum index void ratio of the clean sand
Soil Specific Relative
Density, DrsDr
emax,s
eg
emax,s
emin,s
x100%=−
−
emax,s = maximum index void ratio of the sand/silt mixture
emin, s = minimum index void ratio of the sand/silt mixture
Limiting Silt Content The percentage, by weight, of silt below which the soil
structure consists of silt contained in a sand matrix and
above which it consists of sand grains suspended in a silt
matrix.
Initial Liquefaction The point at which the pore pressure in the specimen firstbecomes equal to the cell pressure, creating a condition of
zero effective stress
8/8/2019 The Effects of Non-Plasticand Plastic Fines on the Liquefaction Of
http://slidepdf.com/reader/full/the-effects-of-non-plasticand-plastic-fines-on-the-liquefaction-of 21/288
7
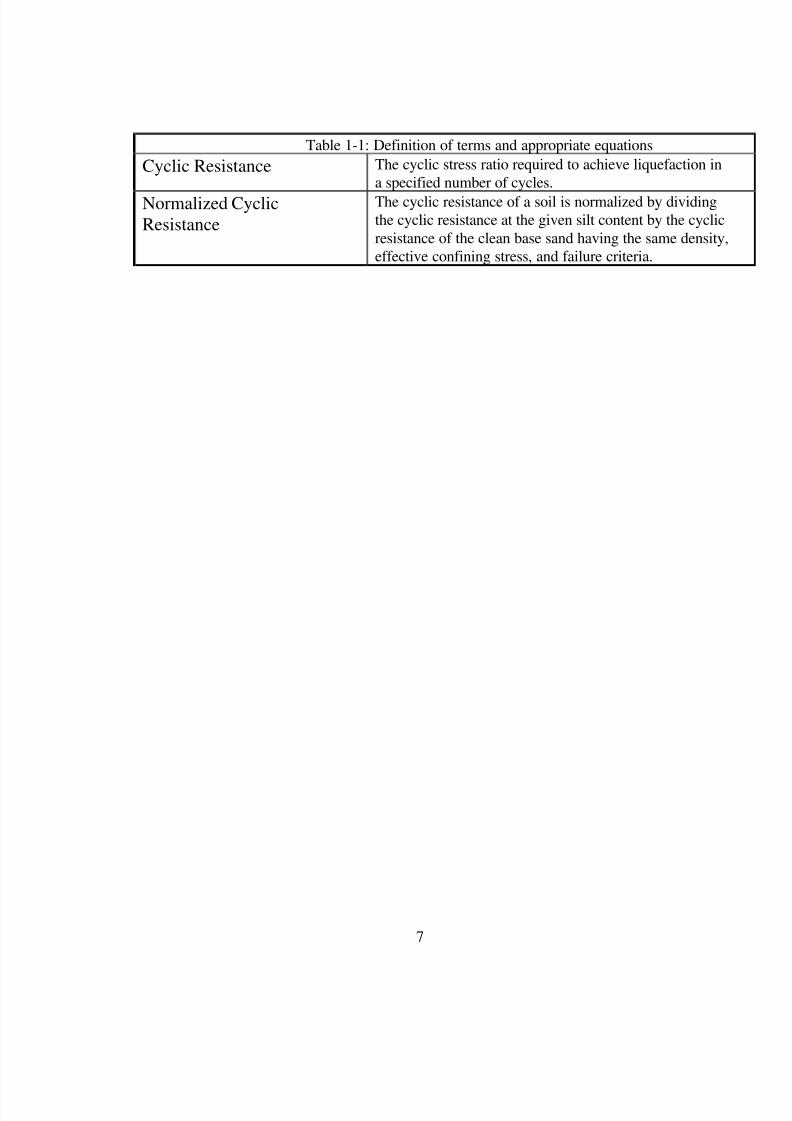
Table 1-1: Definition of terms and appropriate equations
Cyclic Resistance The cyclic stress ratio required to achieve liquefaction in
a specified number of cycles.
Normalized Cyclic
Resistance
The cyclic resistance of a soil is normalized by dividing
the cyclic resistance at the given silt content by the cyclic
resistance of the clean base sand having the same density,
effective confining stress, and failure criteria.

8/8/2019 The Effects of Non-Plasticand Plastic Fines on the Liquefaction Of
http://slidepdf.com/reader/full/the-effects-of-non-plasticand-plastic-fines-on-the-liquefaction-of 22/288
8
CHAPTER 2: LITERATURE REVIEW
The published results of geotechnical studies were examined in order to determine the
state of knowledge on the effects of fines content and plasticity on the liquefaction
resistance and pore pressure generation characteristics of sandy soils. Additionally, a
review of literature related to plasticity based liquefaction criteria was performed. The
results of this review are summarized in Table 2-1, and are presented herein.
2.1 The Effects of Fine Content and Plasticity on Liquefaction Resistance
Both clean sands and sands containing fines have been shown to be liquefiable in the
field (Mogami and Kubo (1953); Robertson and Campenella (1985); and Holzer et al.
(1989)) and in the laboratory (Lee and Seed (1967a); Chang et al. (1982); and Koester
(1994)). Additionally, non-plastic silts, most notably mine tailings, have also been found
to be susceptible to liquefaction (Dobry and Alvarez (1967); Okusa et al. (1980); and
Garga and McKay (1984)). A review of the literature, however, shows conflicting
evidence as to the effect which fines have on the liquefaction resistance or cyclic strength
of a sand. The main factors that are reviewed here are the effects of non-plastic fines
content and the effects of plastic fines content and plasticity on the liquefaction resistance
of sandy soils.
2.1.1 The Effects Of Non-Plastic Fine Content
There is no clear consensus in the literature as to the effect which increasing non-plastic
fines content has upon the liquefaction resistance of a sand. Both field and laboratory
studies have been performed, and the results of these studies indicate that increasing the
non-plastic fines content in a sand will either increase the liquefaction resistance of the
sand, decrease the liquefaction resistance of the sand, or decreases the liquefaction
resistance until some limiting fines content is reached, and then increases its resistance.

8/8/2019 The Effects of Non-Plasticand Plastic Fines on the Liquefaction Of
http://slidepdf.com/reader/full/the-effects-of-non-plasticand-plastic-fines-on-the-liquefaction-of 23/288
9
To further complicate issues, some researchers have shown that the liquefaction
resistance of silty sands is not a function of the silt content of the soil so much as it is a
function of the soil’s sand skeleton void ratio.
2.1.1.1 Field Studies
Field studies following major earthquakes have produced conflicting evidence as to the
effects of silt on the liquefaction resistance of sands. Based upon case histories of actual
soil behavior during earthquakes, there is evidence that soils with greater fines contents
are less likely to liquefy in a seismic event. Okashi (1970) observed that during the 1964
Nigata earthquake in Japan, sands were more likely to liquefy if they had fines content of
less than 10 percent. Additionally, Fei (1991) reports that for the 1976 Tangshan
earthquake in China the liquefaction resistance of silty soils increased with increasing
fines content. Finally, Tokimatsu and Yoshimi (1983) found in a study of 17 worldwide
earthquakes that 50 percent of the liquefied soil had fines contents of less than 5 percent.
They also found that sands with fines contents greater than 10 percent had a greater
liquefaction resistance than clean sands at the same SPT blowcount.
While some research has shown that an increase in fines content results in an increase inliquefaction resistance, other research has shown the opposite effect. Tronsco and
Verdugo (1985) report that mine tailings dams constructed of soils with higher silt
contents are more likely to liquefy than similar dams constructed of sands with lower silt
contents. Chang, Yeh, and Kaufman (1982) note that case studies reveal that most
liquefaction resulting from earthquakes has occurred in silty sands and sandy silts.
Dobry and Alverez (1967), Okusa, Anma, and Maikuma (1980), and Garga and McKay
(1984) each report cases of mine tailings dams constructed with up to one hundred
percent silt-sized particle liquefying during earthquakes in Chile and Japan. All of the
fines involved were either silts of low plasticity or non-plastic silts.

8/8/2019 The Effects of Non-Plasticand Plastic Fines on the Liquefaction Of
http://slidepdf.com/reader/full/the-effects-of-non-plasticand-plastic-fines-on-the-liquefaction-of 24/288
10
Field based methods for determining liquefaction susceptibility, such as methods based
on SPT blowcounts or CPT measurements, must account for the presence of fines in the
soil (Tatsuoka et al, 1980). Seed et al (1985) modified the cyclic stress ratio (CSR)
versus normalized SPT blow count curves originally proposed by Seed and Idriss (1971)
to account for the increase in liquefaction resistance provided by an increased fines
content. The revised chart provides a series of curves for 5 percent, 15 percent, and 35
percent fines. These curves indicate that, for a given blowcount, a larger CSR it required
to liquefy a soil with a higher fines content.
2.1.1.2 Laboratory Studies
As previously noted, there is a great discrepancy in the literature as to the effects which
increasing the non-plastic, i.e. silty, fines content has upon the liquefaction resistance of a
sandy soil. A brief review of these differing results follows.
Several investigators have found that the cyclic resistance of a sandy soil increases with
increasing silt content. For specimens prepared to a constant gross void ratio, Chang et
al. (1982) found that after a small initial drop, cyclic resistance increased dramatically
with increasing silt content. The cyclic resistance increased nearly linearly with siltcontent until a silt content of 60 percent was reached, increasing to a cyclic resistance
between 50 and 60 percent greater than that of the clean sand. Similarly, Dezfulian
(1982) reported a trend of increasing cyclic resistance with increasing silt content. Both
studies used silts with either some small level of plasticity or a measurable clay fraction.
This trend of increasing cyclic strength with increasing fines content can be seen in the
data for a sand tested at different fines contents by Chang et al (1982) which is plotted in
Figure 2-1.
Numerous authors have reported a decrease in cyclic resistance with increasing silt
content. Shen et al. (1977), Tronsco and Verdugo (1985), and Vaid (1994) have all
reported this trend for specimens prepared either to a constant gross void ratio or a

8/8/2019 The Effects of Non-Plasticand Plastic Fines on the Liquefaction Of
http://slidepdf.com/reader/full/the-effects-of-non-plasticand-plastic-fines-on-the-liquefaction-of 25/288
11
constant dry density. The decreases in cyclic resistance were marked, decreasing as much
as 60 percent from their clean sand values for an increase in silt content of 30 percent
(Tronsco and Verdugo, 1985). This trend of decreasing cyclic strength with increasing
fines content can be seen in the data for tailings sands tested by Tronsco and Verdugo
shown in Figure 2-2.
Rather than a simple decrease in cyclic resistance with increasing fines contents, several
investigators have reported that the cyclic resistance of the sand first decreased as the
fines content increased and then increased after crossing some threshold fines content.
Koester (1994) and Law and Ling (1992) found that for specimens prepared to a constant
gross void ratio, as silt content increased the cyclic resistance of the soil decreased until
some limiting silt content was reached, at which point the cyclic resistance began
increasing. Koester (1994) reported a decrease in cyclic resistance to less than one-
quarter of the clean sand cyclic resistance at a silt content of 20 percent, followed by an
increase in cyclic resistance to 32 percent of the clean sand value at a silt content of 60
percent. Unlike Chang et al. (1982), and Dezfulian (1982), neither of these studies
reported increases in cyclic resistance to levels greater than those determined for the clean
sand. This fluctuation of cyclic strength with increasing fines content is clearly shown in
Koester’s results, which are presented in Figure 2-3.
Several studies have shown that cyclic resistance is more closely related to sand skeleton
void ratio than it is to gross void ratio, gross relative density, or fines content. Finn,
Ledbetter, and Wu (1994) found that at the same gross void ratio, the cyclic strength of a
sand decreases with increasing fines content. They also found that at the same sand
skeleton void ratio, cyclic strength remains constant with increasing fine content, as longas the fines can be accommodated in the void spaces created by the sand skeleton.
Not all soils however, exhibit a constant cyclic resistance with a constant sand skeleton
void ratio. Shen et al. (1977), Kuerbis et al. (1988), and Vaid (1994) have shown that for
8/8/2019 The Effects of Non-Plasticand Plastic Fines on the Liquefaction Of
http://slidepdf.com/reader/full/the-effects-of-non-plasticand-plastic-fines-on-the-liquefaction-of 26/288
12
specimens prepared to constant sand skeleton void ratios, the cyclic resistance of a sand
does not remain constant, but increases with increasing silt content.
Clearly, based upon the conflicting evidence presented in the literature, the fines content
of a sandy soil does not alone provide a definitive measure of its liquefaction potential.
2.1.2 The Effects of Plastic Fines Content and Plasticity And Plasticity Based
Liquefaction Criteria
There is general agreement in the literature as to the effect which the quantity and
plasticity of the fine-grained material has on the liquefaction resistance of a sandy soil.
There is agreement that whether the fine grained material is silt or clay, or more
importantly, whether it behaves plastically or non-plastically, tends to make an important,
consistent difference in the cyclic strength of the soil. The majority of studies have
shown that the presence of plastic fines tend to increase the liquefaction resistance of a
soil.
2.1.2.1 Field Studies
The effect of clay content on the liquefaction resistance of sandy soils has also beenclearly established in field studies. Seed, Idriss, and Arango (1983) concluded that if a
soil has a clay content greater than 20 percent it will not liquefy. A study of worldwide
earthquakes by Tokimatsu and Yoshimi (1983) came to the same conclusion. The
increase in cyclic strength that accompanies an increase in plasticity index is shown in
Figure 2-4, from Ishihara (1996).
2.1.2.2 Laboratory Studies
Several laboratory studies have shown a strong correlation between an increased plasticity
of the fine-grained portion of the soil and the increased liquefaction resistance of that soil.
Ishihara and Koseki (1989) found that while there was no clear correlation between either
clay content or fines content and liquefaction resistance, increasing plasticity index
8/8/2019 The Effects of Non-Plasticand Plastic Fines on the Liquefaction Of
http://slidepdf.com/reader/full/the-effects-of-non-plasticand-plastic-fines-on-the-liquefaction-of 27/288
13
consistently increased liquefaction resistance. Yasuda, Wakamatsu, and Nagase (1994)
also found that increasing plasticity index increased liquefaction resistance.
Only Koester (1994) provides evidence that would appear to indicate that soil plasticity is
not a controlling factor in liquefaction resistance in soils with plastic fines. He found that
while at a given void ratio, fine type and plasticity play a minor role in liquefaction
resistance, they exert far less influence than the percentage of fines in the soil.
2.2.3 Plasticity Based Liquefaction Criteria
Jennings (1980) presents a listing of the “thresholds to liquefaction” used by engineers in
the People’s Republic of China to separate soils which are considered liquefiable from
those considered non-liquefiable. Soils meeting these criteria are considered to be non-
liquefiable and include those with plasticity indexes greater than 10, clay contents greater
than 10 percent, relative densities greater than 75 percent, and void ratios less than 0.80.
Other criteria presented are related to epicentral distance, intensity, grain size and
gradation, the depth of the sand layer, and the depth of the water table.
Seed et al. (1973) in their review of the slides that occurred in the Lower San Fernando
Dam during the February 1971 San Fernando earthquake presented a modified form of
the Chinese criteria. As reported by Marcuson et al. (1990), soils with greater than 15
percent material finer than 0.005 mm, liquid limits greater than 35 percent, and water
contents less than 90 percent of the liquid limit should be safe from liquefaction.
Finn, Ledbetter, and Wu (1994) recommended that changes to be made to the Chinese
criteria to account for uncertainty and differences in the liquid limit determination
between the ASTM and the Chinese standard. They recommended decreasing the fines
content by 5 percent, the liquid limit by 1 percent and the water content by 2 percent.
8/8/2019 The Effects of Non-Plasticand Plastic Fines on the Liquefaction Of
http://slidepdf.com/reader/full/the-effects-of-non-plasticand-plastic-fines-on-the-liquefaction-of 28/288
14
Koester (1994) recommend that a further change be made to the criteria proposed by
Finn, Ledbetter, and Wu (1994) to better account for differences in the liquid limit
determination between the ASTM and the Chinese standard. He suggested increasing the
liquid limit criteria to a value of 36 percent.
2.2 The Effects Of Fines Content And Plasticity On Pore Pressure Generation
The rate and magnitude of pore pressure generation may have important effects on the
shear strength, stability, and settlement characteristics of a soil mass, even if the soil does
not liquefy. Similarly, the peak pore pressure generated may affect the stability of
structure founded on, or in the soil mass.
2.2.1 Rate And Magnitude Of Pore Pressure Generation
There are two methods of examining the rate and magnitude of pore pressure generation
during cyclic loading which have been reported in the literature. The first is to examine
the pore pressures generated in relation to the ratio of the number of cycles of loading
applied to the number of cycles required to cause liquefaction. This is the method used
by Lee and Albaisa (1974). Pore pressures may also be measured in terms of the strain
required to generate them. This is the approached taken by Dobry et al (1982).
2.2.1.1 Lee and Albaisa’s Method
Lee and Albaisa (1974) performed a study of pore pressure generation during undrained
cyclic loading. They found that the pore pressure in the sample rose steadily as the
sample was loaded. They illustrated this behavior by plotting the ratio of pore pressure
generated to the initial effective confining pressure against the ratio of the cycle number
to the number of cycles required to cause initial liquefaction. As seen in Figure 2-5, the
pore pressure generation curves fall within a relatively small band for tests performed on
specimens prepared to a wide range of densities and consolidation pressures.

8/8/2019 The Effects of Non-Plasticand Plastic Fines on the Liquefaction Of
http://slidepdf.com/reader/full/the-effects-of-non-plasticand-plastic-fines-on-the-liquefaction-of 29/288
15
2.2.1.2 Dobry Et Al’s Method
Dobry et al (1982) examined pore pressure generation during undrained cyclic loading as
a function of shear strain. They found that for a constant number of loading cycles, the
relationship between pore pressure generation and shear strain is essentially identical over
a wide range of relative densities. Additionally, as can be seen in Figure 2-6, pore
pressure do not begin to increase until some level of cyclic strain, deemed the threshold
strain, is reached.
8/8/2019 The Effects of Non-Plasticand Plastic Fines on the Liquefaction Of
http://slidepdf.com/reader/full/the-effects-of-non-plasticand-plastic-fines-on-the-liquefaction-of 30/288
16
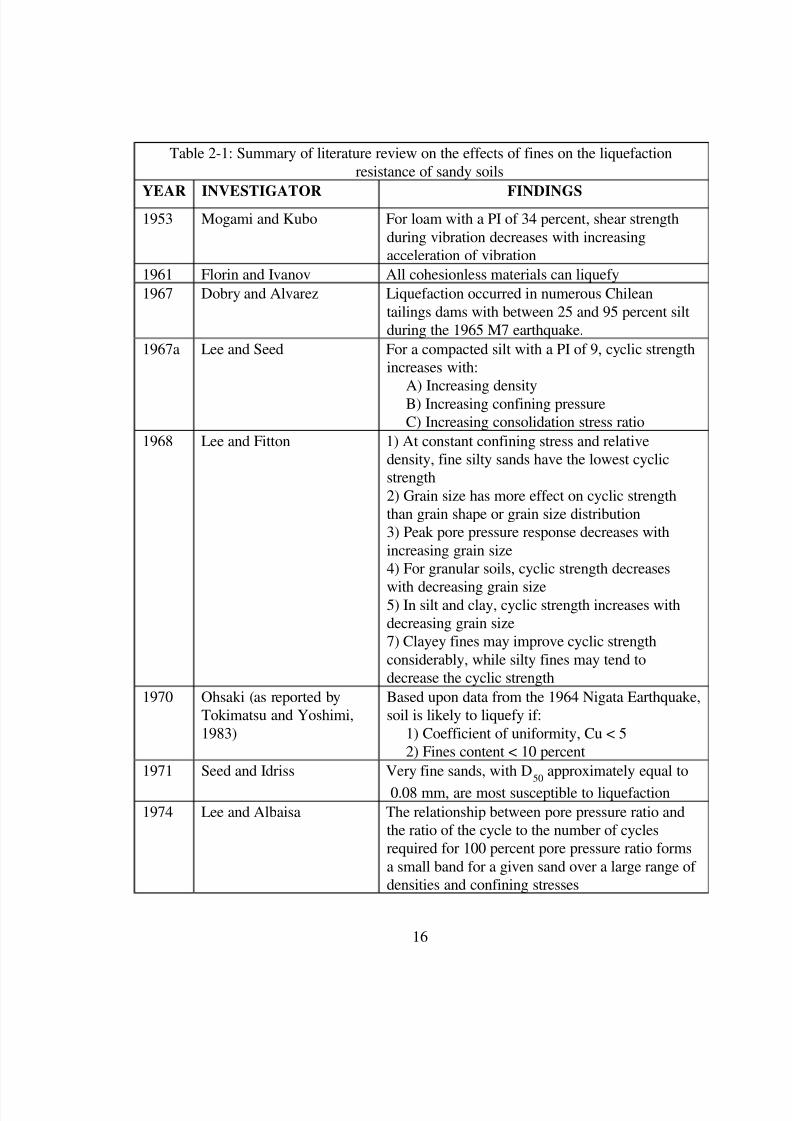
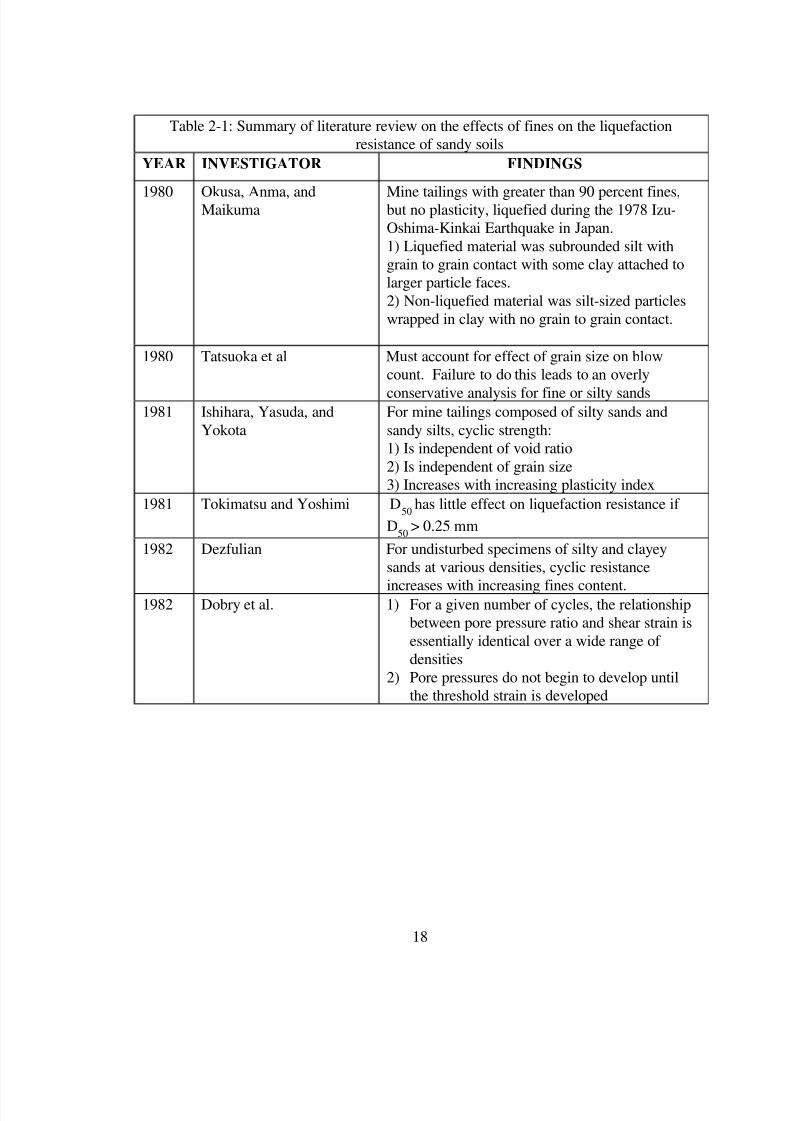
Table 2-1: Summary of literature review on the effects of fines on the liquefaction
resistance of sandy soils
YEAR INVESTIGATOR FINDINGS1953 Mogami and Kubo For loam with a PI of 34 percent, shear strength
during vibration decreases with increasing
acceleration of vibration
1961 Florin and Ivanov All cohesionless materials can liquefy
1967 Dobry and Alvarez Liquefaction occurred in numerous Chilean
tailings dams with between 25 and 95 percent silt
during the 1965 M7 earthquake.
1967a Lee and Seed For a compacted silt with a PI of 9, cyclic strength
increases with:
A) Increasing densityB) Increasing confining pressure
C) Increasing consolidation stress ratio
1968 Lee and Fitton 1) At constant confining stress and relative
density, fine silty sands have the lowest cyclic
strength
2) Grain size has more effect on cyclic strength
than grain shape or grain size distribution
3) Peak pore pressure response decreases with
increasing grain size
4) For granular soils, cyclic strength decreases
with decreasing grain size5) In silt and clay, cyclic strength increases with
decreasing grain size
7) Clayey fines may improve cyclic strength
considerably, while silty fines may tend to
decrease the cyclic strength
1970 Ohsaki (as reported by
Tokimatsu and Yoshimi,
1983)
Based upon data from the 1964 Nigata Earthquake,
soil is likely to liquefy if:
1) Coefficient of uniformity, Cu < 5
2) Fines content < 10 percent
1971 Seed and Idriss Very fine sands, with D50
approximately equal to
0.08 mm, are most susceptible to liquefaction
1974 Lee and Albaisa The relationship between pore pressure ratio and
the ratio of the cycle to the number of cycles
required for 100 percent pore pressure ratio forms
a small band for a given sand over a large range of
densities and confining stresses
8/8/2019 The Effects of Non-Plasticand Plastic Fines on the Liquefaction Of
http://slidepdf.com/reader/full/the-effects-of-non-plasticand-plastic-fines-on-the-liquefaction-of 31/288
17
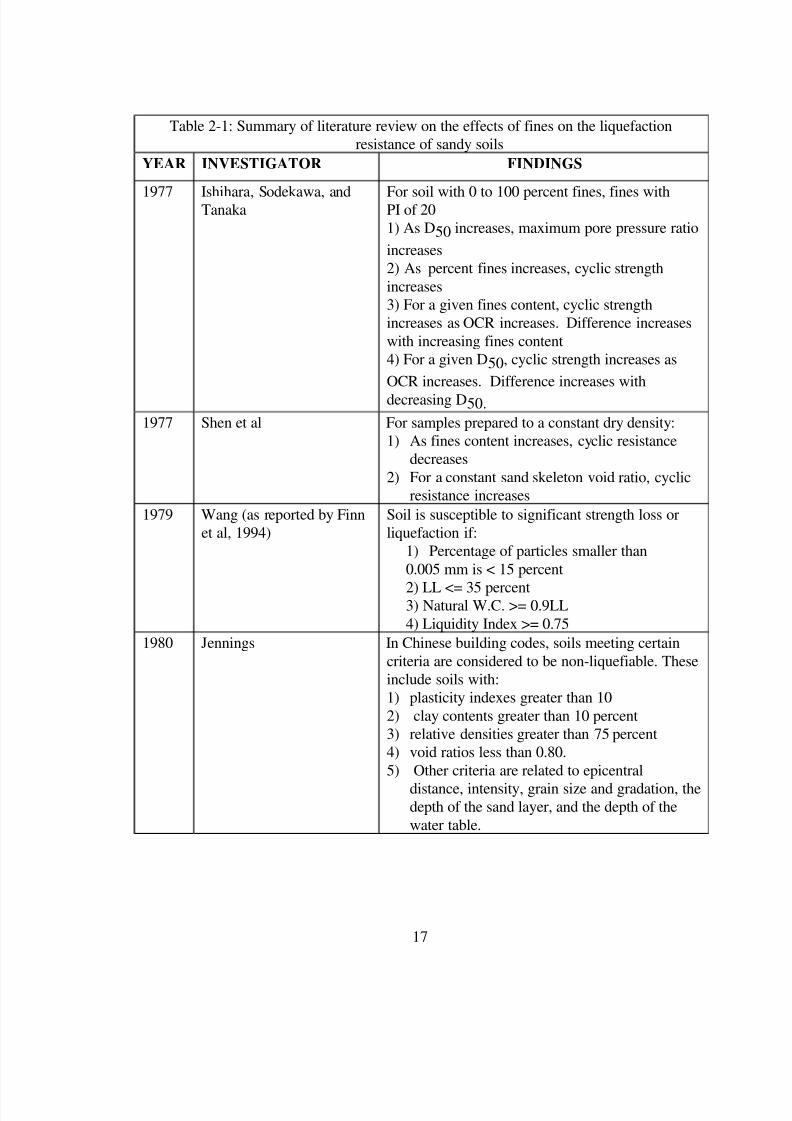
Table 2-1: Summary of literature review on the effects of fines on the liquefaction
resistance of sandy soils
YEAR INVESTIGATOR FINDINGS
1977 Ishihara, Sodekawa, andTanaka
For soil with 0 to 100 percent fines, fines withPI of 20
1) As D50 increases, maximum pore pressure ratio
increases
2) As percent fines increases, cyclic strength
increases
3) For a given fines content, cyclic strength
increases as OCR increases. Difference increases
with increasing fines content
4) For a given D50, cyclic strength increases as
OCR increases. Difference increases with
decreasing D50.
1977 Shen et al For samples prepared to a constant dry density:
1) As fines content increases, cyclic resistance
decreases
2) For a constant sand skeleton void ratio, cyclic
resistance increases
1979 Wang (as reported by Finn
et al, 1994)
Soil is susceptible to significant strength loss or
liquefaction if:
1) Percentage of particles smaller than
0.005 mm is < 15 percent
2) LL <= 35 percent3) Natural W.C. >= 0.9LL
4) Liquidity Index >= 0.75
1980 Jennings In Chinese building codes, soils meeting certain
criteria are considered to be non-liquefiable. These
include soils with:
1) plasticity indexes greater than 10
2) clay contents greater than 10 percent
3) relative densities greater than 75 percent
4) void ratios less than 0.80.
5) Other criteria are related to epicentral
distance, intensity, grain size and gradation, thedepth of the sand layer, and the depth of the
water table.
8/8/2019 The Effects of Non-Plasticand Plastic Fines on the Liquefaction Of
http://slidepdf.com/reader/full/the-effects-of-non-plasticand-plastic-fines-on-the-liquefaction-of 32/288
18
Table 2-1: Summary of literature review on the effects of fines on the liquefaction
resistance of sandy soils
YEAR INVESTIGATOR FINDINGS
1980 Okusa, Anma, andMaikuma
Mine tailings with greater than 90 percent fines,but no plasticity, liquefied during the 1978 Izu-
Oshima-Kinkai Earthquake in Japan.
1) Liquefied material was subrounded silt with
grain to grain contact with some clay attached to
larger particle faces.
2) Non-liquefied material was silt-sized particles
wrapped in clay with no grain to grain contact.
1980 Tatsuoka et al Must account for effect of grain size on blow
count. Failure to do this leads to an overly
conservative analysis for fine or silty sands1981 Ishihara, Yasuda, and
Yokota
For mine tailings composed of silty sands and
sandy silts, cyclic strength:
1) Is independent of void ratio
2) Is independent of grain size
3) Increases with increasing plasticity index
1981 Tokimatsu and Yoshimi D50
has little effect on liquefaction resistance if
D50
> 0.25 mm
1982 Dezfulian For undisturbed specimens of silty and clayey
sands at various densities, cyclic resistance
increases with increasing fines content.1982 Dobry et al. 1) For a given number of cycles, the relationship
between pore pressure ratio and shear strain is
essentially identical over a wide range of
densities
2) Pore pressures do not begin to develop until
the threshold strain is developed

8/8/2019 The Effects of Non-Plasticand Plastic Fines on the Liquefaction Of
http://slidepdf.com/reader/full/the-effects-of-non-plasticand-plastic-fines-on-the-liquefaction-of 33/288
19
Table 2-1: Summary of literature review on the effects of fines on the liquefaction
resistance of sandy soils
YEAR INVESTIGATOR FINDINGS
1982 Chang, Yeh, and Kaufman 1) Case studies reveal that most liquefactionevents have occurred in silty sands and sandy silts
2)The effect of gradation is less than the effect of
mean grain size
3) Cyclic strength of a silty sand decreases from 0
to 10 percent silt content then increases to a silt
content of 60 percent where it levels off.
4) At 10 percent silt content, sand grain to grain
contact still prevails
5) Above 60 percent silt content, sand grains are
merely floating in the silt matrix
6) As the number of cycles to failure increases, theeffects of D
50 and Cu become less important to
cyclic resistance
7) For clean sands, cyclic strength increases with
increasing D50
8) Fine sands more susceptible to liquefaction than
coarse sands
9) Differences in permeability due to differences in
silt content lead to differences in pore pressure
development
1982 W.L. Finn Based on Chinese criteria, soil is liquefiable if thePI<10 and the clay content <10 percent.
New seismic code proposed for soils with
D50
>0.05 mm and granular soil > 40 percent
1982 Prakash and Puri For loessial silts with 98 percent fines, PI<10, and
percent clay <3 percent
1) Undisturbed samples stronger than remolded
samples
2) It required significantly more cycles at a given
CSR to produce pore pressure equal to the
confining pressure than to produce 10 percent
double amplitude axial strain, possibly due tocohesion delaying pore pressure development.

8/8/2019 The Effects of Non-Plasticand Plastic Fines on the Liquefaction Of
http://slidepdf.com/reader/full/the-effects-of-non-plasticand-plastic-fines-on-the-liquefaction-of 34/288
20
Table 2-1: Summary of literature review on the effects of fines on the liquefaction
resistance of sandy soils
YEAR INVESTIGATOR FINDINGS
1983 Seed, Idriss, and Arango 1) For sands with D50 < 0.25 mm use standardCSR vs. N1,60 curves
2) For silty sands and silts plotting above the A-
Line with D50 < 0.15 mm use N1 = N1,measured +
7.5 and use standard CSR vs. Ν1,60
curves
3) Based upon Chinese criteria, clays may suffer
significant strength loss during seismic shaking if:
A) percent finer than 0.005 mm < 15 percent
B) Liquid limit < 35 percent
C) Water content > 0.9 x LL
D) If it plots above the A-Line on the Atterbergchart, run tests to determine the cyclic loading
characteristics of the soil
4) If clayey soil has clay content greater than 20
percent or a water content less than 90 percent of
the liquid limit, it will not liquefy
1983 Tokimatsu and Yoshimi 1) In 1923 Kanto Earthquake, the Old Arakama
bridge foundation settled more on clean sands than
on silty sands despite clean sands having higher N
values
2) In the same earthquake, sands with < 8 percent
fines settled more than sands with >20 percentfines
3) Based upon field investigation following 17
world-wide earthquakes:
A) 50 percent of liquefied soil had < 5 percent
fines
B) No liquefied soil had >20 percent clay
4) Sands with fines content > 10 percent have
greater liquefaction resistance at same SPT
blowcount
1984 EL Hosri, Biarez, and
Hicher
Cyclic strength of silty clay increases with
decreasing void ratio and increasing relative
density.
8/8/2019 The Effects of Non-Plasticand Plastic Fines on the Liquefaction Of
http://slidepdf.com/reader/full/the-effects-of-non-plasticand-plastic-fines-on-the-liquefaction-of 35/288

8/8/2019 The Effects of Non-Plasticand Plastic Fines on the Liquefaction Of
http://slidepdf.com/reader/full/the-effects-of-non-plasticand-plastic-fines-on-the-liquefaction-of 36/288
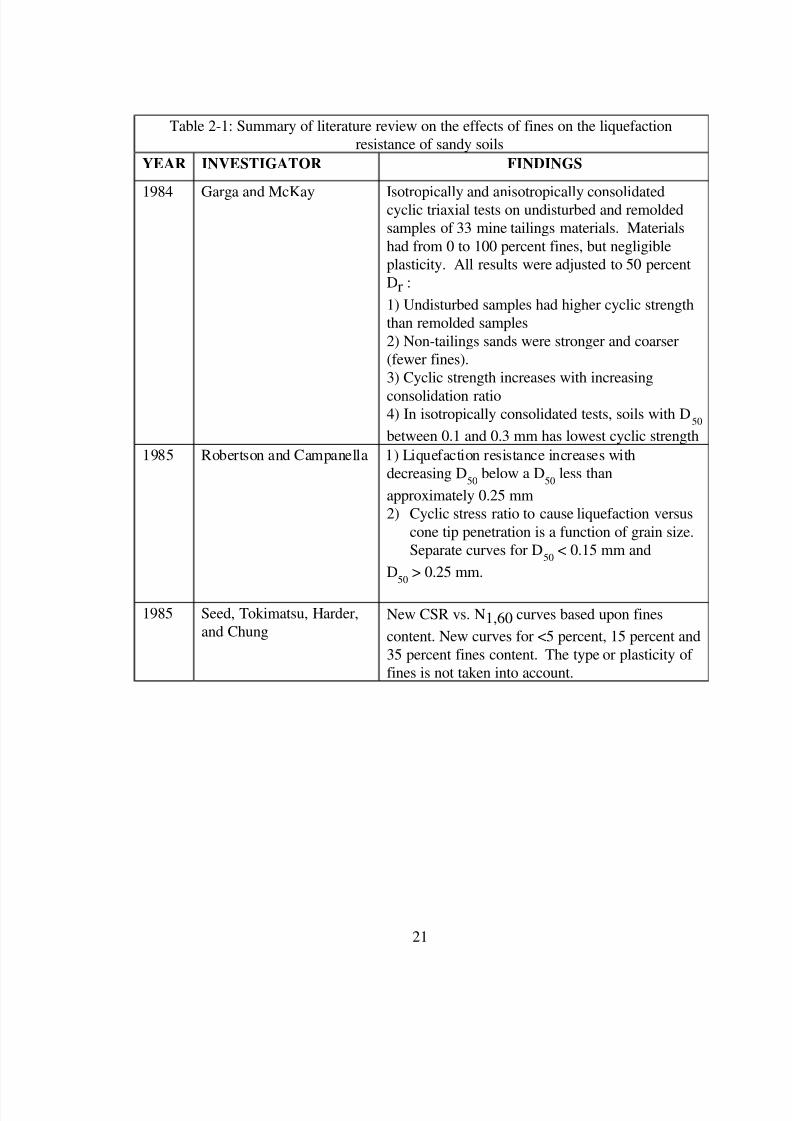
22
Table 2-1: Summary of literature review on the effects of fines on the liquefaction
resistance of sandy soils
YEAR INVESTIGATOR FINDINGS
1985 Tronsco and Verdugo 1) Tailings dams with low silt content are moreresistant to liquefaction than dams with higher silt
contents. Possibly because increasing silt content
decreases permeability and thus pore pressure
dissipation.
2) At a constant void ratio of approximately 0.9:
A) As silt content increases, soil becomes more
compressive, less dilative.
B) For a given shear strain, shear modulus, G,
decreases as silt content increases.
C) Cyclic strength increases by 270 percent as
silt content decreases from 30 percent to 0 percent.This effect is more noticeable in the 0 to 15
percent range than in the 22 to 30 percent range.
1987 Seed In liquefaction analysis of sands with fines, correct
for fines by adding a ∆Ν1,60 factor to the SPT
blowcount before entering CSR vs. blowcount
chart. The type or plasticity of fines is not taken
into account.
1988 Kuerbis, Negussey, and
Vaid
1) At constant silt content, resistance increases as
void ratio decreases
2) At constant void ratio, resistance decreases as
silt content increases
1988 Shibata and Temparaksa If qc,crit is the critical cone tip penetration
dividing liquefiable and non-liquefiable for a given
CSR:
1) For D50
> 0.25 mm, qc,crit is not a function
of D50
2) For D50
< 0.25 mm, qc,crit is a function of
D50. As D
50decreases, liquefaction potential
decreases
1989 Holzer et al During Imperial Valley earthquake of 1979
liquefaction occurred in silts with as little as 7
percent sand and up to 10 percent clay
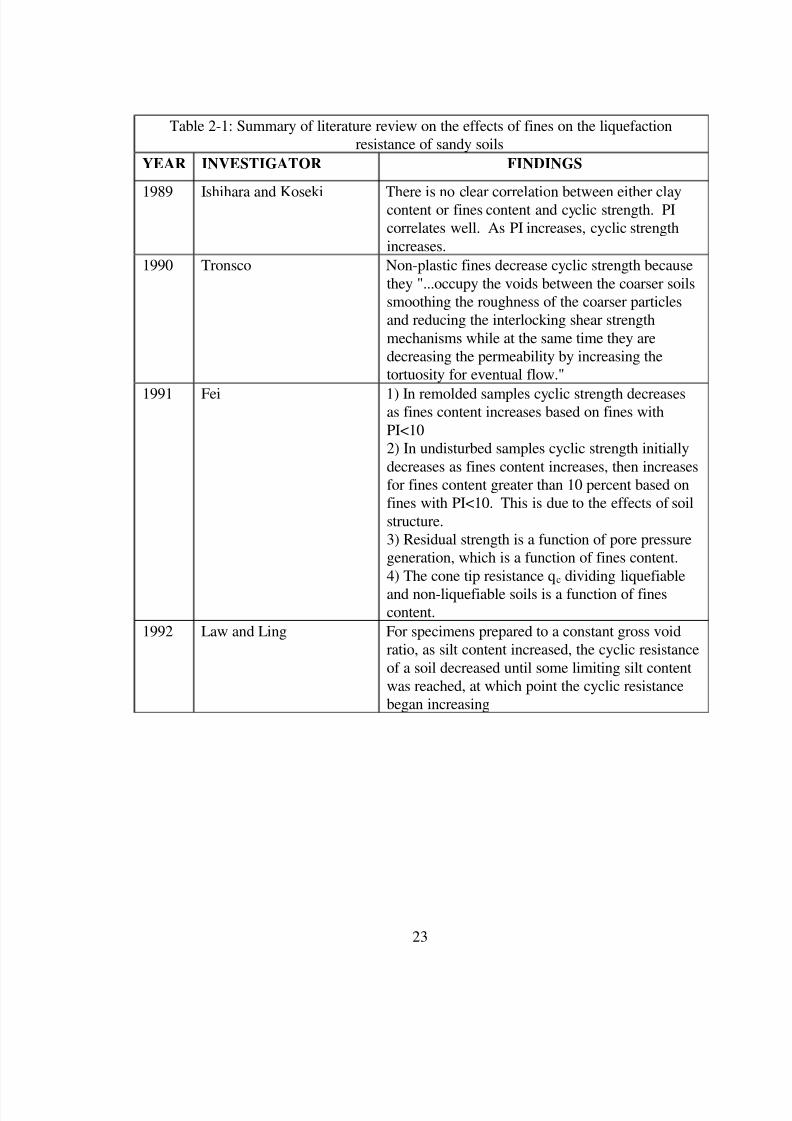
8/8/2019 The Effects of Non-Plasticand Plastic Fines on the Liquefaction Of
http://slidepdf.com/reader/full/the-effects-of-non-plasticand-plastic-fines-on-the-liquefaction-of 37/288
23
Table 2-1: Summary of literature review on the effects of fines on the liquefaction
resistance of sandy soils
YEAR INVESTIGATOR FINDINGS
1989 Ishihara and Koseki There is no clear correlation between either claycontent or fines content and cyclic strength. PI
correlates well. As PI increases, cyclic strength
increases.
1990 Tronsco Non-plastic fines decrease cyclic strength because
they "...occupy the voids between the coarser soils
smoothing the roughness of the coarser particles
and reducing the interlocking shear strength
mechanisms while at the same time they are
decreasing the permeability by increasing the
tortuosity for eventual flow."
1991 Fei 1) In remolded samples cyclic strength decreasesas fines content increases based on fines with
PI<10
2) In undisturbed samples cyclic strength initially
decreases as fines content increases, then increases
for fines content greater than 10 percent based on
fines with PI<10. This is due to the effects of soil
structure.
3) Residual strength is a function of pore pressure
generation, which is a function of fines content.
4) The cone tip resistance qc dividing liquefiable
and non-liquefiable soils is a function of finescontent.
1992 Law and Ling For specimens prepared to a constant gross void
ratio, as silt content increased, the cyclic resistance
of a soil decreased until some limiting silt content
was reached, at which point the cyclic resistance
began increasing

8/8/2019 The Effects of Non-Plasticand Plastic Fines on the Liquefaction Of
http://slidepdf.com/reader/full/the-effects-of-non-plasticand-plastic-fines-on-the-liquefaction-of 38/288
24
Table 2-1: Summary of literature review on the effects of fines on the liquefaction
resistance of sandy soils
YEAR INVESTIGATOR FINDINGS
1994 Finn, Ledbetter and Wu For non-plastic fines:1) At same N1,60, cyclic strength increases with
increasing fine content
2) At same gross void ratio, cyclic strength
decreases with increasing fines content
3) At same sand skeleton void ratio, cyclic strength
remains constant with increasing fine content as
long as they can be accommodated in the void
space
4) Modify the Chinese Criteria by decreasing the
fines content by 5 percent, the liquid limit by 1
percent, and the water content by 2 percent1994 Koester Based on results of 500 undrained cyclic triaxial
tests on samples with a sand skeleton void ratio
corresponding to a relative density of 50 percent:
1) Lowest cyclic strength occurs at 20 to 26
percent fines
2) Fine type (i.e. plasticity) is less important than
percentage
3) Cyclic strength decreases with increasing fines
content to approximately 20 percent fines, then
increases. Cyclic strength was still lower at 60
percent fines than at 12 percent fines.
4) Lowest lower bound strength occurred for well
graded sands at 20 to 30 percent fines
5) Residual strength of sand with 20 percent silt is
very low
6) Post-liquefaction monotonic loading leads to a
dilative response.
7) Liquefaction becomes inevitable at a pore
pressure ratio of 70 percent for clean sands and 80
percent for sands with fines. Once this threshold
pore pressure ratio is reached strain occurs morerapidly in sands with fines than in clean sands.
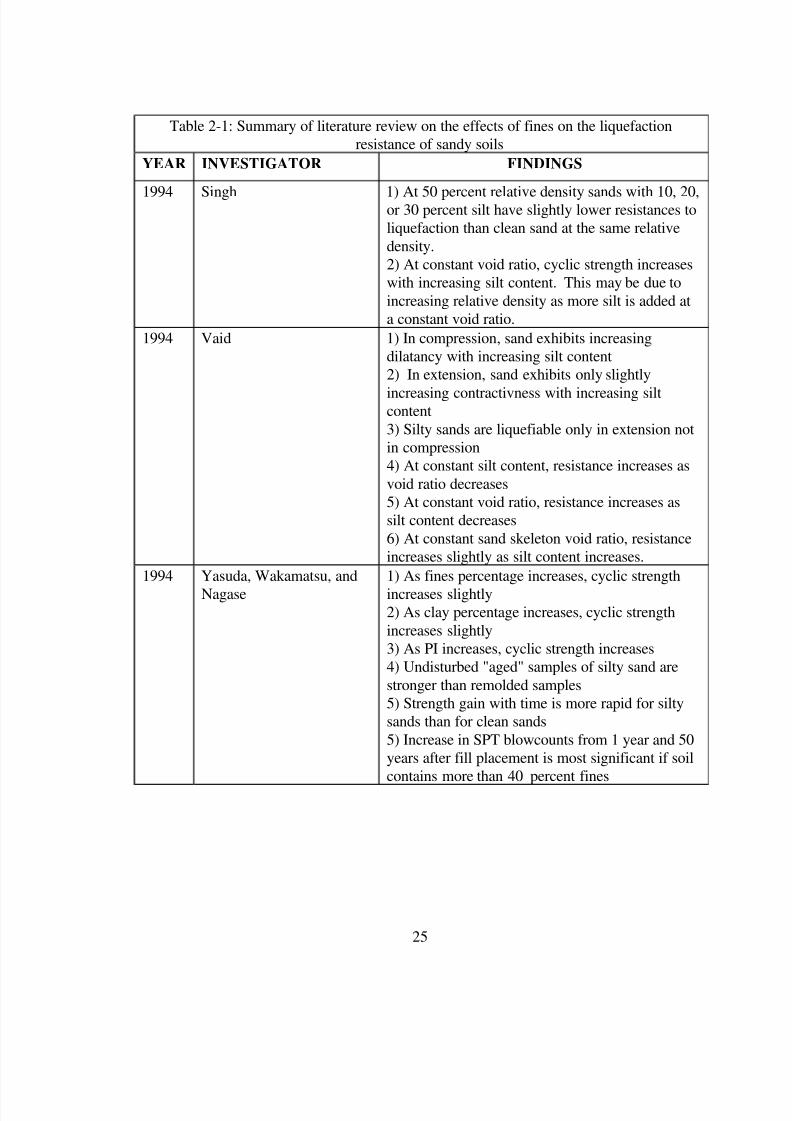
8/8/2019 The Effects of Non-Plasticand Plastic Fines on the Liquefaction Of
http://slidepdf.com/reader/full/the-effects-of-non-plasticand-plastic-fines-on-the-liquefaction-of 39/288
25
Table 2-1: Summary of literature review on the effects of fines on the liquefaction
resistance of sandy soils
YEAR INVESTIGATOR FINDINGS
1994 Singh 1) At 50 percent relative density sands with 10, 20,or 30 percent silt have slightly lower resistances to
liquefaction than clean sand at the same relative
density.
2) At constant void ratio, cyclic strength increases
with increasing silt content. This may be due to
increasing relative density as more silt is added at
a constant void ratio.
1994 Vaid 1) In compression, sand exhibits increasing
dilatancy with increasing silt content
2) In extension, sand exhibits only slightly
increasing contractivness with increasing siltcontent
3) Silty sands are liquefiable only in extension not
in compression
4) At constant silt content, resistance increases as
void ratio decreases
5) At constant void ratio, resistance increases as
silt content decreases
6) At constant sand skeleton void ratio, resistance
increases slightly as silt content increases.
1994 Yasuda, Wakamatsu, and
Nagase
1) As fines percentage increases, cyclic strength
increases slightly2) As clay percentage increases, cyclic strength
increases slightly
3) As PI increases, cyclic strength increases
4) Undisturbed "aged" samples of silty sand are
stronger than remolded samples
5) Strength gain with time is more rapid for silty
sands than for clean sands
5) Increase in SPT blowcounts from 1 year and 50
years after fill placement is most significant if soil
contains more than 40 percent fines

8/8/2019 The Effects of Non-Plasticand Plastic Fines on the Liquefaction Of
http://slidepdf.com/reader/full/the-effects-of-non-plasticand-plastic-fines-on-the-liquefaction-of 40/288
26
Figure 2-1: Increase in cyclic resistance with increase in silt content
(After Chang et al., 1982)
0.00
0.05
0.10
0.15
0.20
0.25
0 10 20 30 40 50 60
Silt Content (%)
C y c l i c R e s i s t a n c e

8/8/2019 The Effects of Non-Plasticand Plastic Fines on the Liquefaction Of
http://slidepdf.com/reader/full/the-effects-of-non-plasticand-plastic-fines-on-the-liquefaction-of 41/288
27
Figure 2-2: Decrease in cyclic resistance with increase in silt content
(From Tronsco and Verdugo, 1985)

8/8/2019 The Effects of Non-Plasticand Plastic Fines on the Liquefaction Of
http://slidepdf.com/reader/full/the-effects-of-non-plasticand-plastic-fines-on-the-liquefaction-of 42/288
28
Figure 2-3: Decrease and then increase in cyclic resistance with increase in silt content(After Koester, 1994)
0.00
0.05
0.10
0.15
0.20
0.25
0.30
0.35
0.40
0.45
0.50
0.1 1 10 100 1000
Cycles To Liquefaction
C y c l i c T r i a x i a l S t r
e s s R a t i o
0% Fines
5% Fines
12.5% Fines20% Fines
45% Fines
60% Fines

8/8/2019 The Effects of Non-Plasticand Plastic Fines on the Liquefaction Of
http://slidepdf.com/reader/full/the-effects-of-non-plasticand-plastic-fines-on-the-liquefaction-of 43/288
29
Figure 2-4: Increase in cyclic resistance with increase in plasticity index
(From Ishihara and Koseki, 1989)
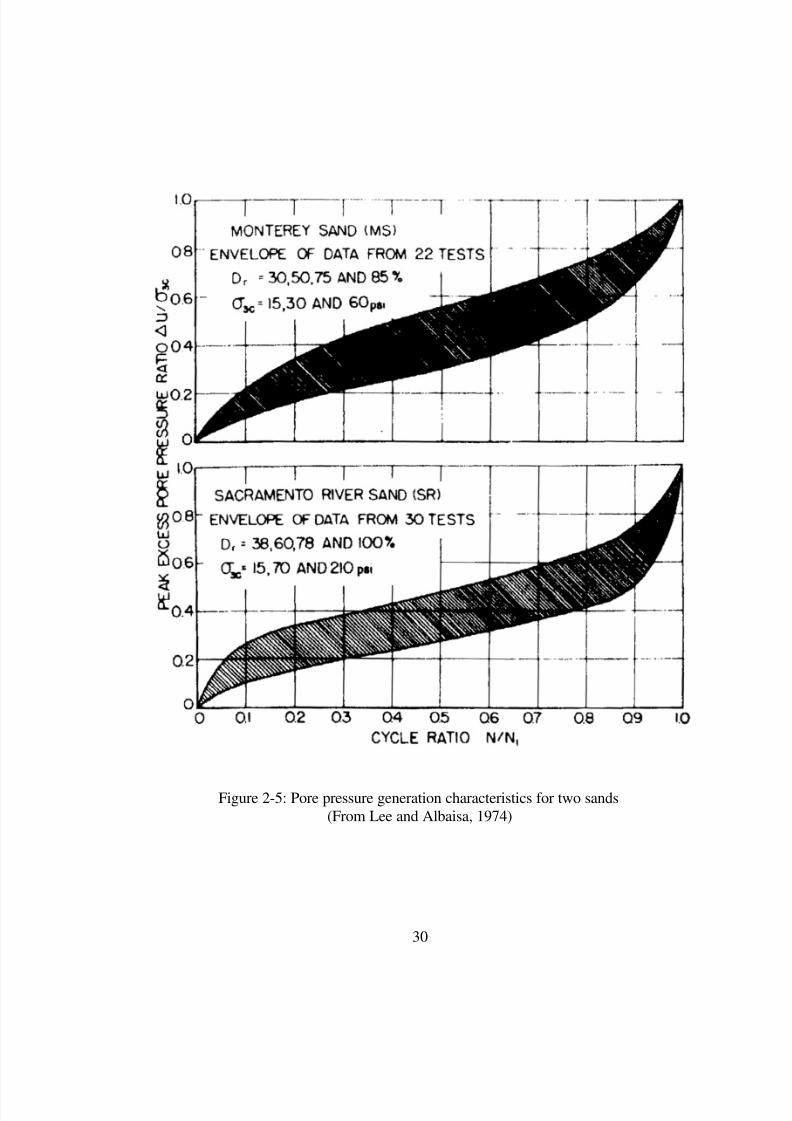
8/8/2019 The Effects of Non-Plasticand Plastic Fines on the Liquefaction Of
http://slidepdf.com/reader/full/the-effects-of-non-plasticand-plastic-fines-on-the-liquefaction-of 44/288
30
Figure 2-5: Pore pressure generation characteristics for two sands
(From Lee and Albaisa, 1974)
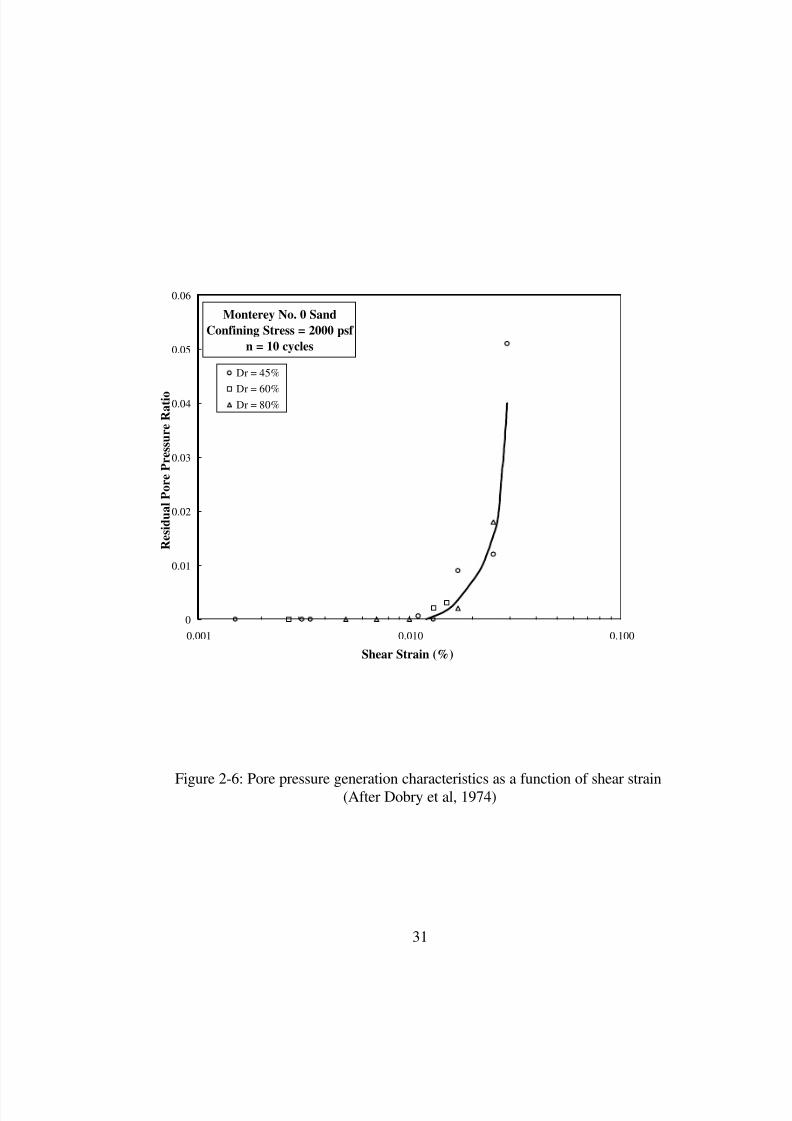
8/8/2019 The Effects of Non-Plasticand Plastic Fines on the Liquefaction Of
http://slidepdf.com/reader/full/the-effects-of-non-plasticand-plastic-fines-on-the-liquefaction-of 45/288
31
Figure 2-6: Pore pressure generation characteristics as a function of shear strain(After Dobry et al, 1974)
Monterey No. 0 Sand
Confining Stress = 2000 psf
n = 10 cycles
0
0.01
0.02
0.03
0.04
0.05
0.06
0.001 0.010 0.100
Shear Strain (%)
R e s i d u a l P o r e P r e s s u r e R a t i o
Dr = 45%
Dr = 60%Dr = 80%
8/8/2019 The Effects of Non-Plasticand Plastic Fines on the Liquefaction Of
http://slidepdf.com/reader/full/the-effects-of-non-plasticand-plastic-fines-on-the-liquefaction-of 46/288
32
CHAPTER 3: THE LABORATORY TESTING PROGRAM
This chapter discusses the details of the laboratory testing program performed to clarify
the manner in which fines content and plasticity affect the liquefaction susceptibility of
sandy soils. First, the component soils and soil mixtures tested are discussed. This
discussion focuses on the index testing program and the index properties of the soils.
Next, a brief review of cyclic triaxial testing is presented with an emphasis on the
differences between in-situ and laboratory conditions and loadings. Lastly, following an
explanation of some of the testing parameters, which affect cyclic strength, a detailed test
methodology is presented.
3.1 Soils Tested
In order to determine the effects of fines content and plasticity on the liquefaction
susceptibility of sandy soils, cyclic triaxial tests were performed on specimens formed
from various mixtures of sand, silt, and clay. These soil mixtures were formed by adding
fine-grained materials to one of the two base sands. The fine-grained material consisted
of
non-plastic silt, kaolinite, bentonite or various combinations thereof.
3.1.1 Sands
Two base sands were used in the study. The first was Yatesville sand, which consists of
the coarse fraction of Yatesville silty sand, which was obtained from a dam site in Louisa
County, Kentucky. It is a poorly graded, medium to fine sand, having approximately 99
percent passing the No. 20 sieve (0.84 mm), 45 percent passing the No. 100 sieve
(0.15 mm), and a mean grain size, D50, of 0.18 mm. It is light brown in color, has a
specific gravity of 2.72, and its grains are sub-angular to sub-rounded in shape.

8/8/2019 The Effects of Non-Plasticand Plastic Fines on the Liquefaction Of
http://slidepdf.com/reader/full/the-effects-of-non-plasticand-plastic-fines-on-the-liquefaction-of 47/288
33
The second base sand used in the testing program was Monterey No. 0/30 sand, a
commercially available sand from California. It has the same mineralogy and a similar
gradation to Monterey No. 0 sand, which has been used in numerous liquefaction studies
in the past (Silver et al., 1976). Monterey No. 0/30 sand is a poorly graded, medium to
fine sand, having over 98 percent passing the No. 20 sieve (0.84 mm) and retained on the
No. 100 sieve (0.15 mm). It has a mean grain size, D50, of 0.43 mm. It is brown in color,
has a specific gravity of 2.65, and its grains are sub-angular to sub-rounded in shape.
With a smaller percentage of material passing the Number 100 sieve and a larger mean
grain size, the Monterey No. 0/30 sand is somewhat coarser than the Yatesville sand.
3.1.2 Silt
The silt used in the study was derived from the fine-grained portion of the Yatesville silty
sand. It has a maximum grain size of 0.074 mm, a minimum grain size of 0.004 mm, and
a mean grain size, D50, of 0.03 mm. The silt is light brown in color, has a specific
gravity of 2.78, and, as it has no discernible liquid or plastic limit, classifies as a non-
plastic silt (ML).
3.1.3 Clays
The two clays used for the plastic portion of the fine-grained material consisted of
commercially available kaolinite and bentonite. The kaolinite used in this study had
been obtained by Virginia Tech prior to the beginning of this research program from a
commercial supplier in Georgia. It is white in color, has a specific gravity of 2.65, and
classifies as a highly plastic clay (CH) with a liquid limit of 58, a plastic limit of 27, and a
plasticity index of 31.
The bentonite used in this study was obtained from a commercial supplier for a study of
slurry walls concurrently on-going at Virginia Tech. It is light gray in color, has a specific
gravity of 2.65, and classifies as a highly plastic clay (CH) with a liquid limit of 385, a
plastic limit of 42, and a plasticity index of 343.

8/8/2019 The Effects of Non-Plasticand Plastic Fines on the Liquefaction Of
http://slidepdf.com/reader/full/the-effects-of-non-plasticand-plastic-fines-on-the-liquefaction-of 48/288
34
Complete index data for the component soils are presented in Table 3 -1. Grain size
distribution curves for the sands and silt are presented in Figure 3-1.
3.1.4 Soil Mixtures with Non-Plastic Fines
In order to study the effects of non-plastic fines content on the liquefaction resistance of
sands, eight combinations of sand and silt were created using each base sand. Silt
contents of the soil mixtures varied from 4 to 75 percent by weight. Additionally, tests
were performed using each of the clean base sands and the pure silt. A complete listing of
the soil mixtures tested, as well as information on their complete index properties, are
presented in Table 3-2 for the soil mixtures using Yatesville sand as the base sand and
Table 3-3 for the soil mixtures using Monterey No. 0/30 sand as the base sand.
3.1.5 Soil Mixtures with Plastic Fines
In order to study the effects of plastic fines content and fines plasticity on the liquefaction
resistance of sands, combinations of sand and fine-grained material were created using
the Yatesville sand. Fines contents of the soil mixtures varied from 4 to 37 percent by
weight, with clay contents varying from 2 to 37 percent. The fine-grained material
consisted of either pure kaolinite, pure bentonite, or a mixture of the two. Additional
tests were run with a combination of silt and clay as the fine-grained material. A
complete listing of the soils mixtures tested, as well as information on their plasticity, is
presented in Table 3-4.
3.2 Index Testing
A complete index testing program was performed on the two base sands, the Yatesville
silt, and on all soil mixtures in which the fines where non-plastic in nature. Index
properties including grain size distribution, specific gravity, and maximum and minimum
8/8/2019 The Effects of Non-Plasticand Plastic Fines on the Liquefaction Of
http://slidepdf.com/reader/full/the-effects-of-non-plasticand-plastic-fines-on-the-liquefaction-of 49/288
35
index void ratios were determined for each soil mixture. Additionally, plasticity tests
were performed on those soil mixtures that contained either kaolinite or bentonite.
Details of the index tests performed are presented below. The index properties of the
individual soil mixtures are summarized in Table 3-2 for the Yatesville sand and silt
mixtures, in Table 3-3 for the Monterey sand and silt mixtures and in Table 3-4 for the
Yatesville sand and plastic fines mixtures.
3.2.1 Grain Size Characteristics
The grain size distribution of each soil was determined in general accordance with ASTM
D 422, Standard Test Method for Particle Size Analysis of Soils. Both mechanical grain
size analyses and hydrometer tests were performed. The mean grain size D50, the
coefficient of uniformity, Cu, and the coefficient of curvature, Cc, for each sand, silt, and
mixture of silt and sand are presented in Tables 3-1 through 3-3.
3.2.2 Maximum And Minimum Void Ratios
There is no ASTM procedure for determining maximum density for cohesionless soils
which is applicable over the entire range of silt contents investigated. The vibratory table
method (ASTM D 4253, Standard Test Method For Maximum Index Density Of Soils
Using A Vibrating Table) is limited to soils with a maximum fines content of 15 percent,
while proctor tests do not always produce accurate, repeatable results for clean sands.
Therefore, vibratory table as well as both Standard and Modified Proctor tests were
performed upon each sand and silt mixture. In agreement with the findings of Lee and
Fitton (1968), the vibratory table tests yielded maximum dry densities similar to those
produced by the Modified Proctor test. Because the vibratory table tests were found to
give more repeatable results, they were used to define the maximum index densities and
minimum index void ratios used in this study.
8/8/2019 The Effects of Non-Plasticand Plastic Fines on the Liquefaction Of
http://slidepdf.com/reader/full/the-effects-of-non-plasticand-plastic-fines-on-the-liquefaction-of 50/288
36
Similarly, there is no ASTM procedure for determining minimum density for
cohesionless soils which is applicable over the entire range of silt contents investigated in
this study. The minimum density method (ASTM D- 4254, Standard Test Method For
Minimum Index Density Of Soils And Calculation Of Relative Density ) is limited to
soils with a maximum fines content of 15 percent. Despite this limitation, the maximum
index void ratio and corresponding minimum index density for each soil mixture was
determined in general accordance with the method presented in the specification. Both
Method B and Method C of this standard were performed and found to give similar
results. Method B consists of filling a tube, the base of which is sitting within a mold of
known weight and volume, with dry soil and then slowly lifting the tube so that the soil
flows out and fills the mold. The soil is then struck level with the top of the mold, the
mold and soil weighed, and the density determined. Method C consists of partially filling
a glass cylinder with a known weight of dry soil and slowly inverting it. The height of the
soil in the cylinder is then measured and the density determined. The values of minimum
index density and maximum index void ratio determined by these two methods were
similar. Those determined using Methods B were found to be slightly more consistent,
and were used in the study.
Complete results of the index density testing program perfromed on the Yatesville sand
and silt mixtures are included in Appendix C: Index Density Testing.
The maximum and minimum void ratios determined for the sand and silt mixtures were
assumed to remain essentially constant when the non-plastic silt was replaced with plastic
fines and thus were assumed to be applicable for the soils with corresponding plastic fines
contents. A plot of the maximum and minimum index void ratios versus silt content forboth the Monterey and Yatesville sand mixtures is presented in Figure 3-2.

8/8/2019 The Effects of Non-Plasticand Plastic Fines on the Liquefaction Of
http://slidepdf.com/reader/full/the-effects-of-non-plasticand-plastic-fines-on-the-liquefaction-of 51/288
37
3.2.3 Specific Gravity
Specific gravities were determined in general accordance with ASTM D 854, Standard
Test Method For Specific Gravity Of Soil for each sand silt and clay. The specific gravity
for each soil mixture was then determined based upon the percentage of each component
soil present the mixture. The specific gravities for each sand, silt, and mixture of silt and
sand are presented in Tables 3-1 through 3-3.
3.2.4 Soil Plasticity
The plasticity of the various soil mixtures with plastic fines was determined for the
fraction of the material passing the No. 40 sieve in general accordance with ASTM D
4318 Standard Test Method For Liquid Limit, Plastic Limit, And Plasticity Index Of
Soils.
First, the Yatesville silt, the bentonite, and the kaolinite were tested in their pure form to
determine their Atterberg Limits. For the silt it was impossible at any water content to
prevent the groove from closing in less than seven blows, therefore the silt was deemed
non-plastic in accordance with Section 11.4 of the standard. Both liquid and plastic
limits were determined for the bentonite and kaolinite.
Liquid and plastic limit tests were determined for each soil mixture containing plastic
fines. Some soils, most notably those with low clay contents, were found to have liquid
limits but not plastic limits and were thus identified as being non-plastic. Atterberg limit
data for the soil mixtures containing clayey fines are presented in Table 3-4.
3.3 Cyclic Triaxial Testing
Cyclic triaxial tests attempt to model the loads applied to a soil mass by an earthquake.
There are several differences between the loads applied to a soil mass in the field and
8/8/2019 The Effects of Non-Plasticand Plastic Fines on the Liquefaction Of
http://slidepdf.com/reader/full/the-effects-of-non-plasticand-plastic-fines-on-the-liquefaction-of 52/288
38
those applied to a specimen in a cyclic triaxial test. Additionally, numerous factors can
affect the resistance to liquefaction developed in a cyclic triaxial specimen and make it
differ from that which might be developed in the field. These include the method of
specimen preparation, the relative density of the specimen, the particle size and gradation
of the soil, the size of the specimen, the ratio of principal stresses during consolidation,
the shape of the loading function, the frequency of application of the loading function,
and the degree of saturation in the specimen.
Following a brief review of the basic theory behind cyclic triaxial testing, the differences
between cyclic triaxial and in-situ loadings will be discussed. Next, the factors that may
affect a cyclic triaxial specimen are summarized, and lastly a review of the definition of
liquefaction is presented.
3.3.1 Basic Theory Of Cyclic Triaxial Testing
The liquefaction resistance or cyclic strength of a soil is often measured in the laboratory
using reconstituted specimens tested in cyclic triaxial tests. The specimen is formed
within a latex membrane inside the triaxial cell, saturated, consolidated to some stress
condition and then loaded with a pulsating deviator load. As the deviator load cycles
between compression and tension, pore water pressures in the specimen increases, the
effective stress decreases, and the specimen undergoes axial straining. The specimen is
said to have liquefied when either the pore pressure becomes equal to the initial effective
confining stress (i.e. when the effective stress acting on the specimen becomes equal to
zero) or when some level of axial strain is achieved.
The cyclic stress ratio is the ratio of the applied shearing stress to the effective confining
stress. In a cyclic triaxial test, the applied shearing stress on the plane of interest is taken
to be one-half of the applied deviator stress. Therefore the cyclic stress ratio is simply the
ratio of the applied deviator stress to twice the initial effective confining stress. The

8/8/2019 The Effects of Non-Plasticand Plastic Fines on the Liquefaction Of
http://slidepdf.com/reader/full/the-effects-of-non-plasticand-plastic-fines-on-the-liquefaction-of 53/288
39
CSR is then plotted against the number of cycles of deviator stress required to cause
liquefaction. This process is repeated for several cyclic stress ratios and a cyclic
resistance curve is produced. A cyclic resistance curve for Monterey # 0 sand tested at a
relative density of 60 percent is shown in Figure 3-3 (Silver et al., 1976).
3.3.2 The Differences Between Cyclic Triaxial And In-Situ Earthquake Loadings
Cyclic triaxial tests are commonly used to measure the cyclic strength or liquefaction
resistance of soils. The manner in which the stresses are applied to an element of soil in
the field are quite different than the manner in which the stresses are applied in a cyclic
triaxial test. Seed and Lee (1966) present the actual shear conditions affecting a soil
element in the field under level ground, which consist of a series of horizontal, reversing
shear stresses acting on a horizontal planes in conjunction with a constant vertical stress.
These shear stresses result from the upward propagation of shear waves through the soil
column. An idealized representation of these stress conditions provided by Seed and Lee
(1966) are shown in Figure 3-4.
Cyclic triaxial tests attempt to model these stress conditions by applying a pulsating
deviatoric stress to the specimen while maintaining a constant confining stress on the
specimen and preventing drainage. The stresses on a plane inclined at 45 degrees to the
axis of the specimen are similar, though not identical, to the stresses acting on a
horizontal plane in the field.
3.3.2.1 Change in Total Confining Stress
The primary difference between the field conditions and those on an inclined plane within
the specimen is an increase or decrease in the all-around confining stress equal to one-
half the deviatoric stress. That is, in order to match the stress conditions experienced in
the field, it would be necessary to decrease or increase the cell pressure by one half the
deviator stress as the deviator stress is respectively increased or decreased. This
combination of stress conditions as originally presented by Seed and Lee (1966) is shown

8/8/2019 The Effects of Non-Plasticand Plastic Fines on the Liquefaction Of
http://slidepdf.com/reader/full/the-effects-of-non-plasticand-plastic-fines-on-the-liquefaction-of 54/288
40
in Figure 3-5. However, because the specimen is saturated, this change in cell pressure
would be mirrored by a corresponding change in pore pressure, and thus there would be
no change in effective stress within the specimen. Because the deformation of the
specimen is a function of the effective, not the total, stresses acting on it, the same
deformations will occur whether the cell pressure is cycled or not. The recorded pore
pressure will, however, be off by something between plus or minus one half the deviator
stress, dependent upon where in the cycle it is measured.
3.3.2.2 Stress Paths
Another major difference between the field and laboratory loadings can be seen in the
stress paths for the two conditions. As shown in Figure 3-6, because the field loading
consists of applying a component of pure shear to an anisotropically consolidated
element, the stress path is simply a vertical line which never crosses the zero shear stress
(i.e. q = 0) axis. This shows that at no point in the loading is the specimen in the ground
under a condition of zero shear stress. The stress path for the cyclic triaxial test however
can be seen in Figure 3-7 to cross the zero stress boundary twice during each cycle of
loading.
3.3.2.3 Rotation of Principal Stresses
Another difference in the loading patterns undergone by a soil element in the field and a
soil specimen in a cyclic triaxial test involves the rotation of principal stresses. Assuming
a level ground condition, the horizontal and vertical planes are the planes of principal
stress prior to loading for both an element in the field and a specimen in a triaxial cell.
For the element in the field, as a component of pure shear is added to the horizontal plane
(and a complimentary shear stress develops on the vertical plane), the orientation of the
planes of principal stress rotate smoothly to some new orientation which is dependent
upon the stresses applied.

8/8/2019 The Effects of Non-Plasticand Plastic Fines on the Liquefaction Of
http://slidepdf.com/reader/full/the-effects-of-non-plasticand-plastic-fines-on-the-liquefaction-of 55/288
41
For the triaxial specimen, only a rotation of zero or 90 degrees is possible due to the axial
nature of the loading. In other words, the principal stresses in a triaxial test will always
act vertically and horizontally and any rotation in principle stress that does occur, occurs
because of a reversal of the direction of the major and minor principle stresses. Such a
rotation of principle stresses occurs during the transition from the loading to the
unloading portion of the cycle during a test on an isotropically consolidated specimen.
As the axial load decreases to below the cell pressure, the major principle stress rotates
from the vertical to the horizontal direction. Similarly, at the transition from the
unloading to the loading portion of the cycle the major principle stress rotates from the
horizontal direction back to the vertical direction.
3.3.2.3 Intermediate Principal Stress
The stress conditions acting on a specimen in a triaxial cell also differ from those acting
on an element in the field with regard to the intermediate principal stress. For an
isotropically consolidated specimen in a triaxial test, the intermediate principal stress,
which always acts horizontally, is equal to the minor principal stress during the
compression portion of the cycle, when the major principle stress is acting vertically. It is
equal to the major principal stress during the extension portion of the cycle, when themajor principle stress is acting horizontally.
For anisotropically consolidated specimens, whether the intermediate principal stress
alternates between the major and minor principal stresses depends upon the deviator
stress applied during consolidation and the deviator stress applied during shear. If the
deviator stress applied during consolidation is larger than the deviator stress applied
during shear, the vertical stress never decreases to a value less than that of the horizontal
stress. Therefore, the axial stress is always the major stress and the intermediate principal
stress is always equal to the minor principal stress. If the deviator stress applied during
consolidation is smaller than the deviator stress applied during shear, the intermediate

8/8/2019 The Effects of Non-Plasticand Plastic Fines on the Liquefaction Of
http://slidepdf.com/reader/full/the-effects-of-non-plasticand-plastic-fines-on-the-liquefaction-of 56/288
42
principal stress will alternate between the major and minor principal stresses as occurs in
the isotropically consolidated specimen.
These differences in intermediate principal stress in turn affect the mean confining stress,
which is generally taken to be the average of the three principle stresses. Ishihara (1993)
has shown that the cyclic resistance of a soil is more closely related to its mean effective
confining stress than to either its vertical or horizontal effective confining stress.
3.3.2.4 Uniformity of Loadings
The loading that a soil element in the ground receives during an earthquake is
non-uniform, both in terms of its amplitude and their frequency. These variations would
be very hard to model in the laboratory. To overcome this difficulty the concept of
equivalent uniform cycles is applied (Seed and Idriss, 1971).
The loading applied to a specimen during a cyclic triaxial is essentially constant in both
amplitude and frequency and is most often applied in the form of a uniform, repeating
sine wave. The cyclic stress ratio applied is usually assumed to be a function of some
percentage (most frequently 65 percent) of the maximum acceleration of the designearthquake. Thus by assuming the applied stress (or acceleration) to be some percentage
of the peak stress (or acceleration) the loading can be converted from the non-uniform,
erratic loading seen in the field, to a uniform equivalent loading, easily applicable in the
laboratory.
3.3.2.5 Components of Loadings
An actual earthquake would apply stresses to a soil element in the field in several
directions simultaneously. This multi-directional loading can be seen in Figure 3-8 that
shows three components of the acceleration time history recorded at Yerba Buena Island
during the 1989 Loma Prieta earthquake. Two perpendicular horizontal and one vertical
components were recorded. A cyclic triaxial test, however, only employs one component

8/8/2019 The Effects of Non-Plasticand Plastic Fines on the Liquefaction Of
http://slidepdf.com/reader/full/the-effects-of-non-plasticand-plastic-fines-on-the-liquefaction-of 57/288
43
of loading. This is analogous to one horizontal component of the earthquake motion
acting on the plane inclined at 45 degrees within the specimen. Studies by Seed and Pyke
(1975) have shown that the difference in loading between the multi-component loading in
the field and the single component loading in the lab results in the laboratory specimens
failing at a stress which is approximately 10 percent higher than that required to cause
failure in the field.
3.3.2.6 Correction Factors
The net result of the differences between the stress conditions in the field and in the lab is
that specimens tested in the laboratory fail at cyclic stress ratios which are higher than
those which would be required to fail similar specimens in the field in the same number
of cycles. In order to apply the cyclic resistances obtained in the lab to soils in the field,
the cyclic resistances must be corrected before it is applied to the field conditions. This is
most commonly done by applying a reduction factor, Cr, to the CSR’s determined in the
lab. This reduction factor is commonly taken to be equal to 0.57 for soils with an at-rest
lateral earth pressure coefficient, Ko, of 0.4 and to be equal to 0.9 for soils with a Ko value
of 1.0 (Seed, 1979).
3.3.3 Factors Affecting Cyclic Resistance
Numerous factors affect the resistance to liquefaction measured in a cyclic triaxial
specimen. These factors include the mean grain size of the soil, the void ratio and the
relative density of the specimen, the method of specimen preparation, the size of the
specimen, the ratio of the principal stresses acting on the specimen during consolidation,
the shape of the loading function, the frequency of loading, and the degree of saturation in
the specimen. Silver et al. (1976) and Townsend (1978) have provided excellent reviews
of many of these factors.
For a given sand tested at a specified density, several of these factors, including mean
grain size, void ratio, and relative density, are beyond the control of the test operator. The
8/8/2019 The Effects of Non-Plasticand Plastic Fines on the Liquefaction Of
http://slidepdf.com/reader/full/the-effects-of-non-plasticand-plastic-fines-on-the-liquefaction-of 58/288
44
remaining factors are a function of the test methodology and can be controlled by the
operator. The operator-controlled factor that has the greatest effect on the liquefaction
susceptibility of a specimen is the method used to form the specimen. Other factors
include specimen size, the shape of the loading function, the frequency of loading, the
ratio of principle stresses during consolidation, the degree of saturation in the specimen,
and the membrane and area corrections applied to the test data. A brief discussion of the
effects of each of the operator dependent parameters and how they were handled in this
study follows.
3.3.3.1 Specimen Preparation Method
Moist tamping in multiple layers was chosen as the method of specimen preparation for
this project. While it does not mimic the deposition processes of natural deposits, it
offers several advantages over either pluviation or vibration. Moist tamping eliminates
the problems of particle segregation associated with pluviation through either air or water
and it is capable of producing specimens with consistent void ratios over a fairly wide
range of densities. These factors make it ideal for a parametric study such as this in
which the two main factors being evaluated are fines content and density.
The current study was not intended to exactly mirror field conditions, but to identify and
quantify the changes in liquefaction resistance which occur as the fines content of a sand
increases. While the moist tamping method of sample preparation does not mimic the
natural deposition processes of silty sands, it was selected because of the high level of
control over sample density it provides. Although the moist tamping method produces
somewhat different soil fabrics and cyclic resistances than might be found in natural soil
deposits (although not necessarily different than those found in man-made fills), because
a consistent method of sample preparation was used, these differences should affect all of
the specimens tested. Therefore, while the specific magnitudes of the parameters
measured may be different from those determined using other sample preparation

8/8/2019 The Effects of Non-Plasticand Plastic Fines on the Liquefaction Of
http://slidepdf.com/reader/full/the-effects-of-non-plasticand-plastic-fines-on-the-liquefaction-of 59/288
45
methods, because these differences occur in each specimen tested, they should not alter
the trends determined in this study.
In order to ensure that the specimens are consistent in density throughout the specimen,
the specimens were produced using the undercompaction technique recommended by
Ladd (1978) and modified by Chan (1985). As each layer is placed, not only the layer
being placed, but also the layers below it, are densified. This means that if an uniform
weight of soil and a uniform layer height were used throughout the compaction process,
the resulting specimen would be denser at the bottom than at the top. To compensate for
this, layers are placed at increasing density from bottom to top. Chan’s method calls for a
constant difference in relative density of one percent between each lift, with the lifts
below the middle lift placed at lower relative densities than the average, the middle lift
placed at the average relative density desired, and the lifts above the middle lift placed at
higher relative densities than the average. For example, if an overall relative density of
50 percent is desired and a difference of one percent relative density between layers is
selected, the seven layers would be placed from bottom to top at relative densities of 47,
48, 49, 50, 51, 52, and 53 percent respectively. Because the lift height was held constant,
the weight of soil in each layer was varied to achieve the desired relative density.
3.3.3.2 Specimen Size
Lee and Fitton (1969) prepared and tested coarse and fine sands with different specimen
diameters in order to determine the effects of specimen size on cyclic strength. The
specimens tested were either 1.4 inches or 2.8 inches in diameter, were prepared to a
constant relative density, and were tested at a constant confining pressure. They found
less than a 5 percent variation in liquefaction resistance between the two specimen
diameters with the larger specimens being slightly weaker. This variation, however, was
within the scatter in the data and was therefore not considered to be a significant effect.

8/8/2019 The Effects of Non-Plasticand Plastic Fines on the Liquefaction Of
http://slidepdf.com/reader/full/the-effects-of-non-plasticand-plastic-fines-on-the-liquefaction-of 60/288
46
For this study, all specimens were constructed with a diameter of 2.8 inches (71 mm)
using seven lifts with a constant lift height of 0.87 inches (22 mm). This produced
specimens with a pre-consolidation height of 6.06 inches (154 mm). The resulting height
to diameter ratio of 2.2 is within the range of 2 to 3 recommended by ASTM for triaxial
specimens.
3.3.3.3 Shape Of The Loading Pattern
Silver et al. (1976) and Mulilis, Townsend and Horz (1978) found that the cyclic strength
of a soil is strongly influenced by the shape of the loading pattern. Several waveforms
were examined including, in order of increasing cyclic strength produced, rectangular,
degraded rectangular or triangular, and sine waves. Sine waves were found to produce
cyclic strengths, which were 15 to 30 percent higher than those, produced under
rectangular waves of the same maximum amplitude do. This strength increase is due to
the severe velocity changes that occur during loading with the rectangular form and their
effect on pore pressure. Additionally, a sine wave applies a lower average load than a
rectangular wave with the same peak amplitude due to its longer rise time. This lower
average stress results in a higher cyclic strength. The effects of varying wave shapes on
cyclic stress can be seen in Figure 3-9 (after Silver et al. 1976) which plots cyclicresistance curves for Monterey #0 sand under various wave forms.
While the testing system offers several options as to the shape of the loading function, a
sinusoidal shaped function was used as recommended by Silver (1977).
3.3.3.4 Frequency Of Application Of Loading
Several investigators, including Lee and Fitton (1968) and Mulilis (1975), have examined
the effect of the frequency of loading on cyclic strength. Lee and Fitton found that slower
loading frequencies produced slightly lower cyclic strengths, while Mulilis found the
opposite to be true. As neither study found that varying the frequency between 1 and 60
hertz varied the strength by more than 10 percent, it would appear reasonable to assume

8/8/2019 The Effects of Non-Plasticand Plastic Fines on the Liquefaction Of
http://slidepdf.com/reader/full/the-effects-of-non-plasticand-plastic-fines-on-the-liquefaction-of 61/288
47
that small changes in frequency of loading, such as from 1/2 to 1 Hz, should not have any
measurable effect on the cyclic strength of the soil being tested. Tests performed by the
author on Monterey No. 0/30 sand show that this is indeed the case. The results of these
tests are shown in Figure 3-10, where it can be seen that for specimens tested at 1 Hz and
½ Hz there is no difference in the cyclic stress ratio required to cause initial liquefaction
in either 10 or 15 cycles.
Although some of the early tests on the Monterey sand and the Monterey sand and silt
mixtures were run at a period of 2 seconds (a frequency of 0.5 Hertz), a period of 1
second (a frequency of 1 Hertz) was used for the majority of the testing program.
3.3.3.5 Consolidation Ratio
Lee and Seed (1967b) tested specimens of a medium sand, a fine sand, and a compacted
silt consolidated to various principal stress ratios in order to determine the effect of
consolidation stress ratio on cyclic strength. They found that for a given density and
minor principle consolidation stress, the deviator stress required to produce 20 percent
double amplitude strain in 100 cycles increased with increasing consolidation ratio.
Ishihara (1996) has shown that this trend is due to the increase in mean consolidationstress that occurs with increasing consolidation ratio.
All specimens tested in this study were isotropically consolidated to an effective stress of
100 kilopascals (approximately 14.7 psi). As the consolidation ratio for the specimen
was unity, the effects of changing consolidation ratio and mean effective stress were not
encountered.
3.3.3.6 Degree Of Saturation
Mulilis, Townsend, and Horz (1978) examined the effect of the degree of saturation in a
specimen on its liquefaction characteristics. They found that in tests on Monterey sand
there was no significant differences in liquefaction tendencies in specimens with values

8/8/2019 The Effects of Non-Plasticand Plastic Fines on the Liquefaction Of
http://slidepdf.com/reader/full/the-effects-of-non-plasticand-plastic-fines-on-the-liquefaction-of 62/288
48
of Skempton’s pore pressure parameter B (Skempton 1954) varying between 0.91 and
0.97. Chaney (1976) however found that varying the B value between 0.91 and 0.99
could have a large effect on the cyclic strength of the specimen depending on soil type,
density and initial confining pressure. Therefor for this study a minimum acceptable B
value of 0.94 was chosen. This is in line with the recommendations of Silver et al. (1976)
and Ladd (1978), and is higher than the minimum value of 0.91 advocated by Mulilis,
Townsend, and Horz (1978).
3.3.3.6 Membrane And Area Corrections
The latex membranes used to isolate the soil from the cell water had a thickness of 0.0125
inches (0.32 mm). Due to the thinness of the membrane and in keeping with the standard
of practice (Silver, 1977), no membrane correction was applied to the measured data.
Additionally, no area correction was applied to the cyclic triaxial loading data in
accordance with standard practice as outlined by Chan (1985).
3.3.4 Definition of Liquefaction
The point at which liquefaction occurs during a cyclic triaxial test can be defined in
several ways. The most common definition used in laboratory testing is that liquefaction
has occurred when the pore pressure in the specimen first equals the initial effective
confining (or isotropic consolidation) stress. This results in a temporary condition of zero
effective stress in the specimen and is usually referred to as initial liquefaction.
Liquefaction is also often defined using some level of single or double amplitude axial
strain. Single amplitude axial strain is defined as the total strain that occurs during a half
cycle of loading, either in tension or compression. Double amplitude axial strain is
defined as the total strain that occurs between any two adjacent peak compressive and
tensile strains, as is shown in Figure 3-11. Values of 2.5 percent, 5 percent, 10 percent,
or 20 percent are commonly used to define liquefaction. For this study, the number of
cycles of loading required to cause initial liquefaction, 1 percent double amplitude axial

8/8/2019 The Effects of Non-Plasticand Plastic Fines on the Liquefaction Of
http://slidepdf.com/reader/full/the-effects-of-non-plasticand-plastic-fines-on-the-liquefaction-of 63/288
49
strain, and 2.5 percent double amplitude axial strain was determined for each test. Some
tests, most notably those with high relative densities, large silt contents, or a large
amounts of plastic fines, did not achieve 5 percent double amplitude axial strain. The
number of cycles of loading required to cause 5 percent double amplitude axial strain was
however determined for each test that achieved that strain level.
3.4 Testing Equipment And Test Methodology
3.4.1 Testing Equipment
The cyclic triaxial testing for this study was performed on an automated triaxial testing
system designed by Clarence Chan and built by the Soil Engineering Equipment
Company of San Francisco, CA. This systems uses closed-loop feedback systems to
control the loadings. A five-channel signal processor built by Paul Gross Associates of
Scottsdale, AZ controls both the data acquisition system and the closed loop feedback
system.
The equipment is controlled by software run on a dedicated personal computer. The
system software performs a wide variety of functions and tests automatically, including
backpressure saturation, isotropic and anisotropic, including Ko, consolidation, and
drained and undrained, monotonic and cyclic, triaxial tests. It also allows for translation
of the recorded data to ASCII format, and for the graphical plotting of the data.
During testing, five channels of data were measured by the system, transferred to the
dedicated computer via a data acquisition card, and stored a test specific data file. Axial
load was measured using a load cell, axial displacement was measured using an LVDT,
and cell pressure, effective pressure (cell pressure minus pore or back pressure), and
volume change were all measured using pore pressure transducers.
8/8/2019 The Effects of Non-Plasticand Plastic Fines on the Liquefaction Of
http://slidepdf.com/reader/full/the-effects-of-non-plasticand-plastic-fines-on-the-liquefaction-of 64/288
50
3.4.2 Test Methodology
The cyclic triaxial test procedure used during this study was closely based upon the
procedures recommended by M. L. Silver (1977) in his report to the U. S. Nuclear
Regulatory Commission. Slight modifications to these methodologies were made, most
notably in the details of the moist tamping method used in the specimen preparation.
3.4.2.1 Specimen Preparation
After the desired void ratio and density for the test had been determined, the soil was
prepared by weighing the proper weight of dry soil for each of the seven lifts into separate
containers. The appropriate amount of water was then added to the dry soil. The soil andwater were then mixed and the containers sealed to prevent changes in water content.
Soils with large fines contents were allowed to sit overnight to insure uniform water
content distribution throughout the soil.
The weight of water added to each lift was determined by the water content required to
achieve 50 percent saturation in the tamped lift. Fifty percent saturation was chosen
instead of the 70 percent recommended by Silver (1977), because it allowed for the
preparation of specimens over a greater range of densities.
Prior to the beginning specimen preparation, the volume change device was filled with
deaired water. The effective stress and the volume change transducers were then bled to
insure accurate measurements of their respective parameters.
Next the sides of the lower platen of the triaxial cell were coated with a water-based
lubricant, the end of the latex membrane slipped over the platen and secured in place with
two rubber O-rings. At this time, two rubber O-rings which were later used to secure the
membrane to the top platen were placed over the top of the forming jacket. Once the
membrane had been secured to the lower platen, a sheet of filter paper was wrapped
8/8/2019 The Effects of Non-Plasticand Plastic Fines on the Liquefaction Of
http://slidepdf.com/reader/full/the-effects-of-non-plasticand-plastic-fines-on-the-liquefaction-of 65/288
51
around the lower platen and the membrane. The specimen forming jacket was then
slipped over the membrane and platen and checked to assure that it was level. The filter
paper between the jacket and the membrane was used to ensure that the membrane did not
seal off the vacuum holes in the forming jacket, thus allowing for a uniform application
of the vacuum around the jacket. A vacuum was applied to the forming jacket by means
of a vacuum line, the membrane carefully pulled over the top of the jacket, and then
pulled tight against the jacket by the vacuum. At this time any wrinkles or loose spots in
the membrane were removed. The top jacket was again checked to ensure that it was
level, insuring a specimen with vertical sides which were perpendicular to the top and
bottom surfaces.
Once the membrane and jacket have been prepared, the tamper support arms used to
position and support the soil tamper cross bar during specimen preparation were attached
to the posts that support the top of the triaxial cell. The soil tamper was then zeroed by
setting the cross bar of the soil tamper on the tamper support arms and adjusting the two
sliding blocks on the tamper rod so that, when the tamping foot was resting on the lower
platen, the blocks were in contact with each other and the top of the cross bar. With the
soil tamper thus zeroed, the height of the tamping foot above the top of the lower platen,
which is the specimen height at any time during specimen construction, is simply the
distance between the two sliding blocks. This distance, and thus the height of the top of
the lift being constructed, was controlled through the use of a series of spacer bars
corresponding to the individual lift heights.
The soil for the first lift was spooned into the jacket and approximately leveled with the
spoon. The height of the tamper foot corresponding to the first layer was set using theappropriate spacer bar to locate the lower sliding block. The soil tamper was then set on
the support arms with the tamping foot pulled up above the level of the uncompacted soil.
With the edge of the tamper foot against the membrane, the soil was pressed down to its
correct height by moving the tamping foot around the inner edge of the jacket. This
8/8/2019 The Effects of Non-Plasticand Plastic Fines on the Liquefaction Of
http://slidepdf.com/reader/full/the-effects-of-non-plasticand-plastic-fines-on-the-liquefaction-of 66/288
52
tamping process requires several trips around the jacket, beginning lightly to allow the
soil to become uniformly distributed throughout the lift, and then with increasing pressure
to bring the soil to its final density. As the tamping foot was one-half the diameter of the
jacket, by moving the foot around the inner edge of the jacket, the soil was uniformly
compacted across the surface of the layer.
Once the layer had been compacted to its correct height, the tamper was removed and the
soil surface was scarified to a depth of approximately 2 millimeters. The soil for the next
lift was then spooned into the jacket and the process was repeated until the soil for the
uppermost layer had been spooned into the jacket. The uppermost layer was compacted
to a height approximately 1/64th of an inch greater than its final height, and the tamper
and the tamper support arms removed.
3.4.2.2 Final Specimen Preparation And Equipment Assemblage
The top of the triaxial cell (with the upper platen attached to the axial loading rod) was
then bolted into place. The sides of the upper platen were then coated with a water-based
lubricant, the upper drainage line attached, and the platen lowered onto the top of the
specimen. The top of the axial loading rod was then lightly tapped with a mallet until thedesired specimen height was achieved. This process assured both good contact between
the upper platen and the specimen and a correct specimen height. Once the axial loading
rod had been locked into place, the membrane was pulled off the forming jacket and onto
the top platen. It was then secured with the O-rings that had previously been placed
around the forming jacket.
At this point a small vacuum (approximately 3 psi.) was applied to the specimen through
the top drainage line to provide a positive effective stress on the specimen. Once this
internal vacuum had been applied, the external vacuum applied to the membrane during
specimen preparation was removed by disconnecting the vacuum hose. Next, the forming
jacket was removed from the specimen, the O-rings repositioned so that they were
8/8/2019 The Effects of Non-Plasticand Plastic Fines on the Liquefaction Of
http://slidepdf.com/reader/full/the-effects-of-non-plasticand-plastic-fines-on-the-liquefaction-of 67/288
53
securely fitted into the grooves in the sides of the platens and the specimen dimensions
measured and recorded. The diameter of the specimen was measured to the nearest 0.001
inch at three heights (approximately the quarter points of the specimen) using a Pi tape.
These values were then averaged and corrected for the membrane thickness. The height
of the specimen was again measured to the nearest 0.01 inches by measuring the height
that the axial loading rod protrudes above its locking collar. This measurement was then
converted to the specimen height by comparing it against a similar measurement made on
a specimen blank of known height, which had previously been recorded. These
measurements and other relevant parameters were recorded on a data sheet such as that
shown in Figure 3-12.
Once the specimen’s dimensions were known, the density, void ratio, relative density, and
initial degree of saturation of the specimen were calculated. If these values were within
the acceptable ranges, the acrylic cylinder that forms the walls of the triaxial cell was
lowered into place and the cell filled with water to within approximately one-half inch of
the top. This air gap was left at the top to allow the axial load rod attached to the upper
platen to move in and out of the cell without affecting the cell pressure.
The cell assembly was then placed into the loading frame and the axial loading rod was
attached to the load cell with a threaded coupling. The load frame cross bar was bolted
into place, the cell pressure line attached to the cell via a valve in the cell top, and the
LVDT roughly centered. This initial LVDT reading was recorded on the data sheet to
allow for the monitoring of the changes in specimen height which occur during back
pressure saturation and consolidation. The computer program TRIAXIAL that operates
the system was started at this time and when the pressure source was turned on a cellpressure of 20 kPa (2.9 psi.) was applied to the specimen. The drainage valves on the cell
were now closed and the vacuum removed from the specimen.
8/8/2019 The Effects of Non-Plasticand Plastic Fines on the Liquefaction Of
http://slidepdf.com/reader/full/the-effects-of-non-plasticand-plastic-fines-on-the-liquefaction-of 68/288
54
3.4.2.3 Initial Specimen Saturation
In order to improve the initial saturation of the specimen, carbon dioxide (CO2) was
allowed to flow through the specimen at a low pressure in order to replace the air in the
specimen pores. This was done because CO2 has a much higher solubility in water than
does air, allowing a higher degree of saturation to be reached at lower backpressures.
Once a stream of nearly pure CO2 was found to be flowing out of the specimen, which
normally took 7 to 10 minutes, the flow of CO2 was stopped, and a tank of deaired water
was attached to the drainage line on the bottom platen. The deaired water was then
allowed to flow upward through the specimen in order to increase the degree of
saturation. A gradient of less than 5 was used during this step in order to minimize
specimen disturbance. To insure that the gradient remained below 5, the gradient was
established by raising the tank containing the deaired water to an appropriate height. No
vacuum was used to draw the de-aired water through the specimen.
Once the desired volume of deaired water had flowed through the specimen, the drainage
valves on the cell were again closed and the vacuum and deaired water lines removed.
The drainage lines were then connected to the volume change device. At this time, the
next phase of the software was initiated, the cell pressure was automatically raised to 50
kPa, and the axial loading rod was unlocked.
3.4.2.4 Back Pressure Saturation
Backpressure saturation of the specimen was controlled to a large extent by the computer
software. Generally, the saturation process was performed under an effective stress of 50
kPa (7.3 psi.) with the operator controlling the level of the back pressure and the
computer applying the cell pressure require to maintain a constant effective stress on the
specimen. The backpressure was raised in small increments (less than 20 kPa) and the B
value periodically checked until a value of 0.94 or greater was achieved, indicating that
the specimen was essentially saturated.

8/8/2019 The Effects of Non-Plasticand Plastic Fines on the Liquefaction Of
http://slidepdf.com/reader/full/the-effects-of-non-plasticand-plastic-fines-on-the-liquefaction-of 69/288
55
3.4.2.5 Consolidation
Once an acceptable B value had been obtained, the specimens were isotropically
consolidated to an effective stress of 100 kPa (14.7 psi). Specimens were allowed to
consolidate for approximately one cycle of secondary compression. For the materials
with low fines contents this time was approximately 2 minutes, while for the pure silt a
consolidation time of 90 minutes was used.
Following consolidation, the changes in specimen volume and height that occurred during
backpressure saturation and consolidation were recorded. These changes were applied to
the respective initial values and the final specimen void ratios were calculated. These
post-consolidation void ratios were used to calculate the post-consolidation relative
densities reported elsewhere in this dissertation.
3.4.2.6 Cyclic Loading
Once consolidation was complete, the proper parameters were input into the computer,
the drainage lines were closed, and the specimen was loaded cyclically. The parameters
input into the computer include the peak to peak deviator stress corresponding to the
desired cyclic stress ratio, the period of the loading function (1 or 2 seconds), the shape of the loading function (sinusoidal), the number of cycles of loading (limited to 200 cycles
by the computer software), and the limiting single amplitude axial strain at which the test
will be terminated (typically 6 percent axial strain).
Once the necessary information had been input, any necessary adjustments to the LVDT
or steady pressure were made, and valve A was closed to prevent drainage and to allow
measurement of the pore pressure in the specimen. The test was then started and the
specimen cyclically loaded until failure.
If the specimen failed to achieve the limiting strain within the limit of 200 cycles, the
valve between the drainage line and the volume change device (valve B) was closed to

8/8/2019 The Effects of Non-Plasticand Plastic Fines on the Liquefaction Of
http://slidepdf.com/reader/full/the-effects-of-non-plasticand-plastic-fines-on-the-liquefaction-of 70/288
56
prevent drainage from the specimen and the valve connecting the pore pressure and
volume change transducers (valve A) was opened (this is required by the computer
program to initiate the testing process). The cyclic loading test procedure was then
repeated. Just before the initiation of loading, valve A was again closed and valve B
opened. Loading of the specimen was then repeated. If the limiting strain was not
reached in the following 200 cycles, this process was repeated until either the limiting
strain or an effective stress of zero was achieved.
When testing of the specimen had been completed, the system was shut down and the
pressure source turned off. Next, the triaxial cell was removed from the loading frame,
the pressure line replaced with a venting plug, the cell drained, and the acrylic cell wall
removed. The upper drainage line was then disconnected from the upper platen, the
membrane detached from the upper platen and the specimen and membrane removed. If
the specimen contained silty fines, the soil was the placed in a bowl and dried for reuse.
If the specimen contained clayey fines it was first soaked in a dispersing agent (sodium
metahexaphosphate), then the fine grained material was removed by washing the soil over
a No. 200 sieve, and the sand re-used. This prevented the plasticity of the clayey fines
being altered by drying in the oven and possibly altering the behavior of the soil.
3.4.2.7 Conversion of Data Files
In order to use the data in most DOS or windows based programs, it is necessary to
convert the data file to an ASCII format. The program CONVASC performed this
conversion. To execute the conversion, the command “convasc grdata\filename” where
“filename” is the actual name of the data file is entered following the C:\Triax> prompt.
This converts the original data file, which is denoted by a .dat suffix, to an space
delineated ASCII file denoted by a .prn suffix.

8/8/2019 The Effects of Non-Plasticand Plastic Fines on the Liquefaction Of
http://slidepdf.com/reader/full/the-effects-of-non-plasticand-plastic-fines-on-the-liquefaction-of 71/288
57
3.4.2.8 Graphical Examination of Data
A visual examination of the test data can be performed using the utility program
GRPLOT. To execute the program, the command “grplot grdata\filename” (where
“filename” is the actual name of the data file) is entered following the C:\Triax> prompt.
Numerous parameters such as total or effective stress, axial or volumetric strains, and
pore water pressures can each be plotted against time. This is very useful for
preliminary assessments of the number of cycles to initial liquefaction or to some strain
level. Additionally, the program can plot several varieties of stress paths, including
Cambridge and MIT types.
3.4.3 Calibration Of The Test Methodology
In order to ensure that the testing methods were producing reasonable cyclic strengths, a
series of calibration tests were first run using the proposed methodology on a sand with
know cyclic strength properties. The sand used was Monterey #0/30 which is very
similar to the Monterey #0 sand used in the standard sand testing program conducted by
Silver et al. (1976) in the 1970’s.
A series of calibration tests were performed using Monterey #0/30 sand. The results of
the standard sand testing program (Silver et al., 1976) are shown along with the results of
the calibration testing program in Figure 3-13. It can be seen from the figure that the test
methodology produces results that are in good agreement with the published data.
3.5 Correction Of Cyclic Stress Ratios
Following the completion of the laboratory portion of the study it was discovered that
some of the deviator stresses applied by the test equipment during the cyclic loading
portion of the test were incorrect, resulting in the application of cyclic stress ratios
different than those specified by the operator. While the peak amplitudes of the stresses
applied during each cycle were incorrect, the peak amplitude of stress applied remained

8/8/2019 The Effects of Non-Plasticand Plastic Fines on the Liquefaction Of
http://slidepdf.com/reader/full/the-effects-of-non-plasticand-plastic-fines-on-the-liquefaction-of 72/288
58
nearly constant from cycle to cycle. Additionally, the shape of the loading function
remained a sinusoid as specified, and the loading rate was correct at either 0.5 or 1 Hertz.
Although most of these differences in the specified and actual cyclic stress ratios were
small (less than 10 percent), a computer code was written to analyze the data files and
determine the CSR which was actually applied to the specimen based upon the peak
loadings applied during each cycle. All data presented in this report reflects the cyclic
stress ratios actually applied to the specimen.

8/8/2019 The Effects of Non-Plasticand Plastic Fines on the Liquefaction Of
http://slidepdf.com/reader/full/the-effects-of-non-plasticand-plastic-fines-on-the-liquefaction-of 73/288
59
Table 3-1: Index properties for component soils
Yatesville Monterey Yatesville
Sand Sand Silt Kaolinite Bentonite
USCS Classification Symbol SP SP ML CH CH
Maximum Grain Size (mm) 0.90 0.8 0.074 N.D. N.D.
Median Grain Size, D50 (mm) 0.18 0.43 0.03 N.D. N.D.
Minimum Grain Size (mm) 0.07 0.07 0.00 N.D. N.D.
Coefficient Of Uniformity, Cu 2.4 1.5 4.4 N.D. N.D.
Coefficient Of Curvature, Cc 0.77 1.04 0.93 N.D. N.D.
Specific Gravity, Gs 2.72 2.65 2.77 2.65 2.65
Minimum Index Density (pcf) 86.1 90.8 63.5 N.D. N.D.Maximum Index Void Ratio, e max 0.972 0.821 1.723 N.D. N.D.
Maximum Index Density (pcf) 102.5 101.4 100.4 N.D. N.D.
Minimum Index Void Ratio , e min 0.653 0.631 0.727 N.D. N.D.
Liquid Limit (%) 0 0 0 58 385
Plastic Limit (%) 0 0 0 27 41
Plasticity Index (%) 0 0 0 31 344
N.D. = Not Determined
8/8/2019 The Effects of Non-Plasticand Plastic Fines on the Liquefaction Of
http://slidepdf.com/reader/full/the-effects-of-non-plasticand-plastic-fines-on-the-liquefaction-of 74/288
60
Table 3-2: Index properties for mixtures of Yatesville sand with silt
8/8/2019 The Effects of Non-Plasticand Plastic Fines on the Liquefaction Of
http://slidepdf.com/reader/full/the-effects-of-non-plasticand-plastic-fines-on-the-liquefaction-of 75/288
61
Table 3-3: Index properties for mixtures of Monterey sand with silt

8/8/2019 The Effects of Non-Plasticand Plastic Fines on the Liquefaction Of
http://slidepdf.com/reader/full/the-effects-of-non-plasticand-plastic-fines-on-the-liquefaction-of 76/288
62
Table 3-4: Atterberg limit data for mixtures of Yatesville sand with silt and clay
Percent Percent Percent Percent LL PL PI Activity
Fines Silt Kaolinite Bentonite (%) (%) (%)
4 0 4 0 17 0 0 0.00
4 2 2 0 20 0 0 0.00
7 0 7 0 19 0 0 0.00
7 3.5 3.5 0 19 0 0 0.00
12 0 0 12 48 28 20 1.67
12 0 12 0 17 0 0 0.00
12 6 6 0 17 0 0 0.00
17 0 0 17 61 26 35 2.06
17 0 8.5 8.5 41 22 19 1.12
17 0 17 0 18 0 0 0.00
17 5.7 5.7 5.7 31 24 7 0.62
17 8.5 8.5 0 15 0 0 0.00
26 0 13 13 55 20 35 1.35
26 0 26 0 20 13 7 0.27
26 13 13 0 15 14 1 0.08
37 0 37 0 21 13 8 0.22
8/8/2019 The Effects of Non-Plasticand Plastic Fines on the Liquefaction Of
http://slidepdf.com/reader/full/the-effects-of-non-plasticand-plastic-fines-on-the-liquefaction-of 77/288
63
Figure 3-1: Grain size distributions for component soils
0
10
20
30
40
50
60
70
80
90
100
0.0010.0100.1001.000
Mean Grain Size (mm)
P e r c e n t F i n e r ( % )
Monterey Sand
Yatesville Sand
Yatesville Silt

8/8/2019 The Effects of Non-Plasticand Plastic Fines on the Liquefaction Of
http://slidepdf.com/reader/full/the-effects-of-non-plasticand-plastic-fines-on-the-liquefaction-of 78/288
64
Figure 3-2: Variation in index void ratios with silt content
0.00
0.20
0.40
0.60
0.80
1.00
1.20
1.40
1.60
1.80
0 10 20 30 40 50 60 70 80 90 100
Silt Content (%)
I n d e x V o i d R a t i o
Yatesville Sand - Max e
Yatesville Sand - Min e
Monterey Sand - Max e
Monterey Sand - Min e

8/8/2019 The Effects of Non-Plasticand Plastic Fines on the Liquefaction Of
http://slidepdf.com/reader/full/the-effects-of-non-plasticand-plastic-fines-on-the-liquefaction-of 79/288
65
Figure 3-3: A cyclic resistance curve (After Silver et al. (1976))
Summary Curve
Monterey Sand No. 0
Wet Compaction Method
Initial Liquefaction
0
0.1
0.2
0.3
0.4
0.5
0.6
0.7
0.8
1 10 100 1000
Cycles To Liquefaction
C y c l i c S t r e s s
R a t i o
8/8/2019 The Effects of Non-Plasticand Plastic Fines on the Liquefaction Of
http://slidepdf.com/reader/full/the-effects-of-non-plasticand-plastic-fines-on-the-liquefaction-of 80/288
66
Figure 3-4: Idealized stresses induced by seismic shaking on a soil element under
level ground (After Seed and Lee (1966))

8/8/2019 The Effects of Non-Plasticand Plastic Fines on the Liquefaction Of
http://slidepdf.com/reader/full/the-effects-of-non-plasticand-plastic-fines-on-the-liquefaction-of 81/288
67
Figure 3-5: Stress conditions during cyclic triaxial test (From Seed and Lee (1966))

8/8/2019 The Effects of Non-Plasticand Plastic Fines on the Liquefaction Of
http://slidepdf.com/reader/full/the-effects-of-non-plasticand-plastic-fines-on-the-liquefaction-of 82/288
68
Figure 3-6: Applied stresses and stress path for a soil element in the field
p
q
(a)
(b)
(c)
σσσσ1
σσσσ3
σσσσ1 σσσσ1
σσσσ3 σσσσ3
ττττ ττττ
(a) (b) (c)

8/8/2019 The Effects of Non-Plasticand Plastic Fines on the Liquefaction Of
http://slidepdf.com/reader/full/the-effects-of-non-plasticand-plastic-fines-on-the-liquefaction-of 83/288
69
Figure 3-7: Applied stresses and stress path for a soil element in a cyclic triaxial test
p
q
(b)
(c)
(a)
σσσσDev σσσσDev
σσσσ3333
σσσσ3333a
σσσσ3333
σσσσ3333b
σσσσ3333
σσσσ3333c

8/8/2019 The Effects of Non-Plasticand Plastic Fines on the Liquefaction Of
http://slidepdf.com/reader/full/the-effects-of-non-plasticand-plastic-fines-on-the-liquefaction-of 84/288
70
Figure 3-8: Multiple components of earthquake motions
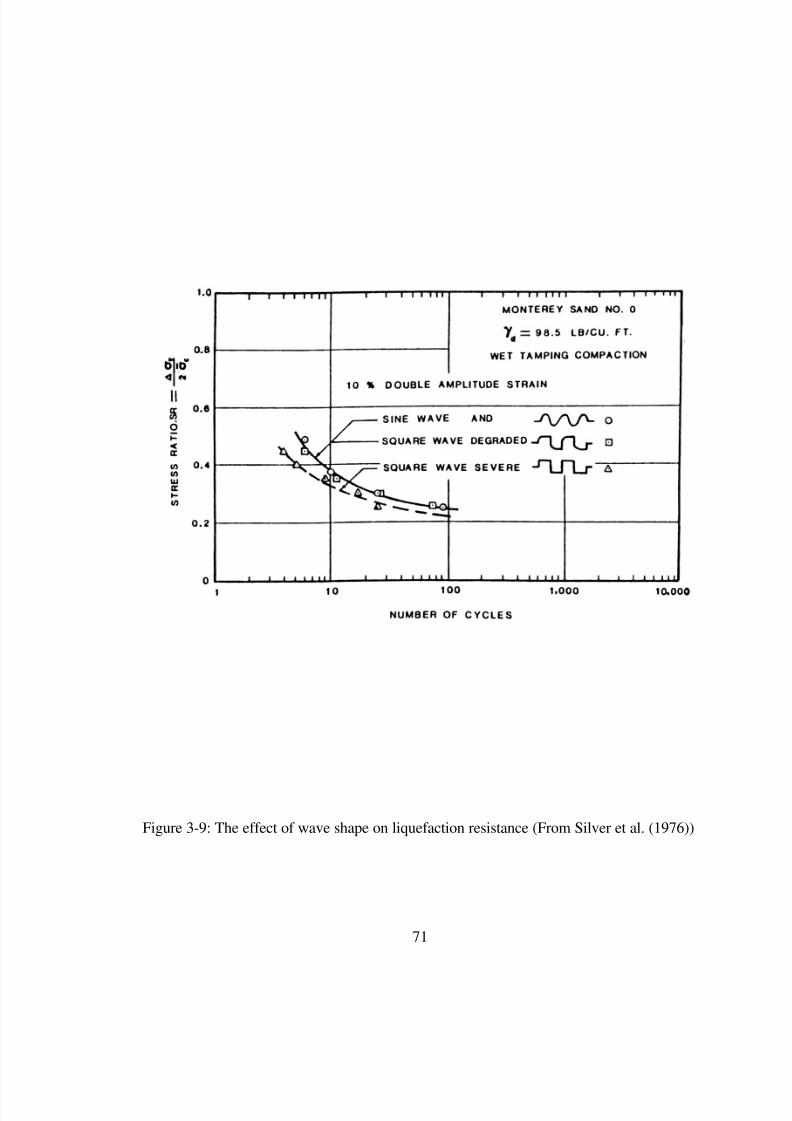
8/8/2019 The Effects of Non-Plasticand Plastic Fines on the Liquefaction Of
http://slidepdf.com/reader/full/the-effects-of-non-plasticand-plastic-fines-on-the-liquefaction-of 85/288
71
Figure 3-9: The effect of wave shape on liquefaction resistance (From Silver et al. (1976))
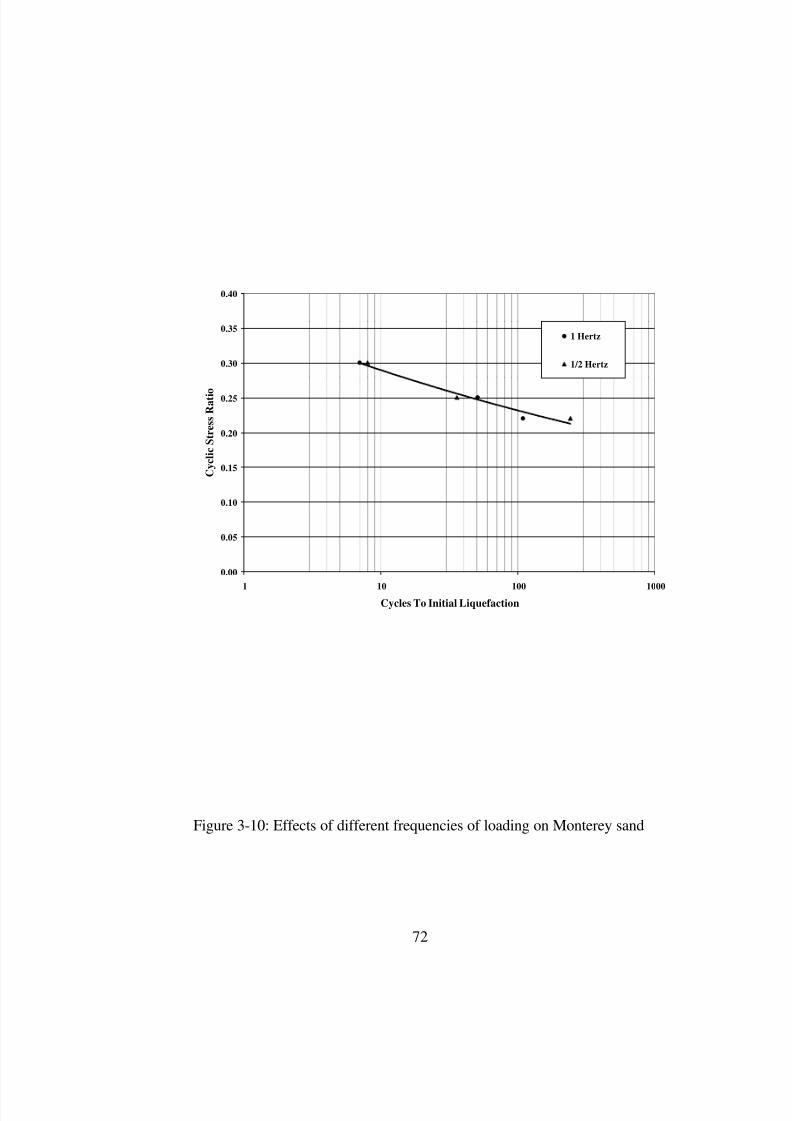
8/8/2019 The Effects of Non-Plasticand Plastic Fines on the Liquefaction Of
http://slidepdf.com/reader/full/the-effects-of-non-plasticand-plastic-fines-on-the-liquefaction-of 86/288
72
Figure 3-10: Effects of different frequencies of loading on Monterey sand
0.00
0.05
0.10
0.15
0.20
0.25
0.30
0.35
0.40
1 10 100 1000
Cycles To Initial Liquefaction
C y c l i c S t r e s s R a t i o
1 Hertz
1/2 Hertz
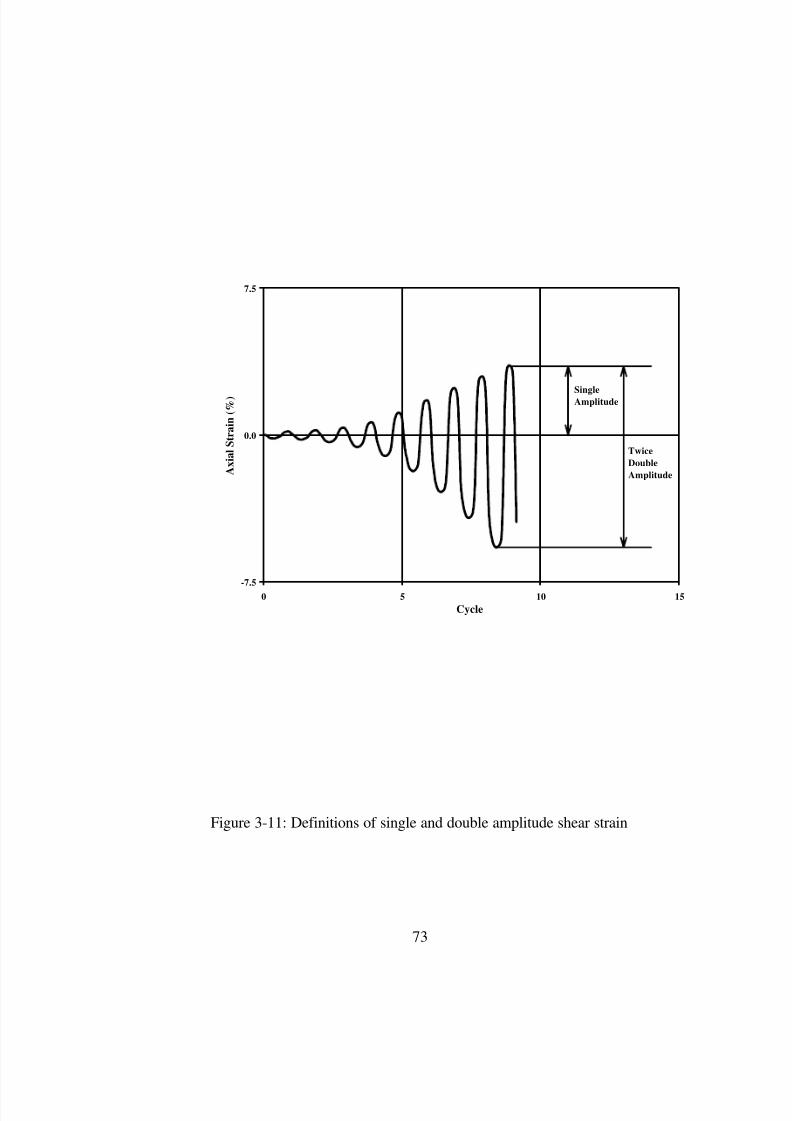
8/8/2019 The Effects of Non-Plasticand Plastic Fines on the Liquefaction Of
http://slidepdf.com/reader/full/the-effects-of-non-plasticand-plastic-fines-on-the-liquefaction-of 87/288
73
Figure 3-11: Definitions of single and double amplitude shear strain
-7.5
0.0
7.5
0 5 10 15
Cycle
A x i a l S t r a i n ( % ) Single
Amplitude
Twice
Double
Amplitude

8/8/2019 The Effects of Non-Plasticand Plastic Fines on the Liquefaction Of
http://slidepdf.com/reader/full/the-effects-of-non-plasticand-plastic-fines-on-the-liquefaction-of 88/288
74
Figure 3-12: Typical cyclic triaxial data sheet
Cyclic Triaxial Specimen Data Sheet
Date: 1/27/98
Soil Type: Yatesville Sand with 0% Silt Proposed CSR: 0.33
Goal e: 0.76 Actual e: 0.760
Goal Gammad: 15.16 kn/m̂ 3 Actual Gammad: 15.16 kn/m̂ 3
Goal Dr: 67.0 % Actual Dr: 67.1 %
Sample Prep:Max Void Ratio: 0.972
Wt Soil Wt Water Min Void Ratio: 0.656
Layer: (gm) (gm) Gs: 2.72
1 134.3 19.0
2 134.6 19.0
3 134.8 18.9
4 135.1 18.9
5 135.3 18.8
6 135.6 18.8
7 135.8 18.7
Water Content = 14.0 %
Initial Saturation = 48.7 %
Sample Data Membrane Thickness = 0.025 inches
Sample Height: 6.06 inches Sample Diameter: 2.825 inchesSample Volume: 611.48 cc 2.825 inches
Wt Dry Soil: 945.5 gm 2.825 inches
Gammad: 1.5462 gm/cc Diameter - Membrane: 2.800 inches
Saturate with CO2 And Deaired Water
Binitial= 0.82 Initial LVDT = 0.000 Bfinal= 0.97
CPfinal= 450 Kpa BPfinal= 400 Kpa
onsolidation Stress: 100 Kpa onsolidation Time: 2 minutes
LVDT initial = -0.084 volts Vol Trans initial = 1.426 volts
LVDT final = -0.104 volts Vol Trans final = 1.613 volts
Final Sample Volume = 37.09 cu in Change in Sample Volume = -3.61 cc
Final Sample Height = 6.048 inches
Final Sample Area = 6.1332 sq inches Post Consol e = 0.749
Post Consol Dr = 70.6
Shear at +/-: 66 Kpa CSR = 0.33
CPfinal= 500 Kpa BPfinal= 400 Kpa
Data File: y0e76c33
Failed in 12 Cycles
Comments:

8/8/2019 The Effects of Non-Plasticand Plastic Fines on the Liquefaction Of
http://slidepdf.com/reader/full/the-effects-of-non-plasticand-plastic-fines-on-the-liquefaction-of 89/288
75
Figure 3-13: Calibration of test methodology
0.00
0.05
0.10
0.15
0.20
0.25
0.30
0.35
0.40
0.45
0.50
1 10 100 1000Cycles To Liquefaction
C y c l i c S t r e s s R a t i o
Polito
Silver et al
8/8/2019 The Effects of Non-Plasticand Plastic Fines on the Liquefaction Of
http://slidepdf.com/reader/full/the-effects-of-non-plasticand-plastic-fines-on-the-liquefaction-of 90/288
76
Chapter 4: The Effects of Non-Plastic Fines
During the past 40 years the liquefaction of clean sands under seismic loads has been
studied and a sound understanding of its mechanisms and the parameters which affect it
has been developed. Unfortunately, the understanding of the liquefaction of sands
containing fine-grained material is less complete. A review of the literature shows that
there is no clear consensus as to what effect an increase in non-plastic silt content has
upon the liquefaction resistance of a sand.
This chapter is concerned with the effects of non-plastic, i.e. silty, fines content on the
liquefaction resistance of sands. The current study was undertaken in an attempt to clarify
the discrepancies found in the literature, and to find a single parameter which controls the
liquefaction resistance of silty sands and sandy silts. In order to achieve this goal, nearly
300 cyclic triaxial tests were run using two base sands with non-plastic silt contents
ranging from 0 to 100 percent. Tests were performed and evaluated using gross void
ratio, gross relative density, soil specific relative density, and sand skeleton void ratio as
measures of density.
Both clean sands and sands containing silt have been shown to be liquefiable in the field
(Mogami and Kubo, 1953; Seed and Lee, 1966; Youd and Bennett, 1983) and in the
laboratory (Lee and Seed, 1967a; Casagrande, 1975; Koester, 1994). Non-plastic silts,
most notably mine tailings, have also been found to be susceptible to liquefaction (Dobry
and Alvarez, 1967; Okusa et al., 1980; Garga and McKay; 1984). Numerous laboratory
studies have been performed, and have produced what appear to be conflicting results.
These studies report that increasing silt content in a sand will either increase the
liquefaction resistance of the sand (Chang et al., 1982; Dezfulian, 1982), decrease the
liquefaction resistance of the sand (Shen et al., 1977; Tronsco and Verdugo, 1985; Finn
et al., 1994; and Vaid, 1994), or decrease the liquefaction resistance until some limiting

8/8/2019 The Effects of Non-Plasticand Plastic Fines on the Liquefaction Of
http://slidepdf.com/reader/full/the-effects-of-non-plasticand-plastic-fines-on-the-liquefaction-of 91/288
77
silt content is reached, and then increase its resistance (Law and Ling, 1992; Koester,
1994). Additionally, several studies (Shen et al., 1977; Tronsco and Verdugo, 1985;
Kuerbis et al., 1988; and Vaid, 1994) have shown that the liquefaction resistance of a silty
sand is more closely related to its sand skeleton void ratio than to its silt content.
The results of the current study will be presented in terms of the various measures of
density examined. First, the results of the tests evaluated in terms of gross void ratio and
gross relative density will be presented, followed by the results of the tests evaluated in
terms of sand skeleton void ratio. Next, the results of the tests evaluated in terms of soil
specific relative density will be presented. Following the presentation of the test results, a
discussion on flow liquefaction and cyclic mobility will be presented. Lastly, the results
of the current study will be compared to the data presented in the literature and used to
explain and reconcile the seemingly differing trends.
4.1 Findings of the Current Study
Several measures of density were used to examine the results of the testing program.
They include gross void ratio, gross relative density, sand skeleton void ratio, and soil
specific relative density.
4.1.1 Tests Evaluated In Terms Of Gross Void Ratio And Gross Relative Density
The cyclic resistances measured were first examined in terms of their gross void ratios.
The gross void ratio of a specimen is simply the ratio of the volume of the voids in the
specimen to the volume of the solids, and is a function of the dry density of the specimen
and specific gravity of the soil. Except for the small effect that the amount of silt present
has on the specific gravity of the soil mixture, the gross void ratio of a specimen is
dependent solely upon the weight of soil used and the volume of the specimen, and is
independent of silt content.

8/8/2019 The Effects of Non-Plasticand Plastic Fines on the Liquefaction Of
http://slidepdf.com/reader/full/the-effects-of-non-plasticand-plastic-fines-on-the-liquefaction-of 92/288
78
The effects of holding the gross void ratio of the specimens constant while altering their
silt content was examined. For the Monterey sand, a void ratio of 0.68, which
corresponds to a relative density of 74 percent in the clean sand, was used. For the
Yatesville sand, a void ratio of 0.76, which corresponds to a relative density of 68 percent
in the clean sand, was used. These void ratios were chosen because they resulted in soil
specific relative densities that allowed specimens to be formed over the entire range of
silt contents investigated.
The results of the tests on Monterey and Yatesville sands prepared to a constant gross
void ratio are presented in Figures 4-1 and 4-2, respectively. The cyclic resistance can be
seen to decrease with increasing silt content until a minimum is reached between silt
contents of 35 and 50 percent at which time the cyclic resistance begins increasing as the
silt content continues to increase.
The cyclic resistance for each sand and silt combination tested during this study have
been plotted as a function of gross void ratio in Figures 4-3 and 4-4. These plots
represent the Monterey sand and Yatesville sand mixtures, respectively.
As can be seen in Figure 4-3, for the Monterey sand and silt mixtures there is no clear
correlation between gross void ratio and cyclic resistance. For example, at a gross void
ratio of 0.68 (i.e. the tests plotted in Figure 4-1), the cyclic resistance varies from a low of
0.14 for a mixture of 50 percent sand and 50 percent silt to a high of 0.40 for the both
clean sand and the pure silt. For a given silt content, however, there is a decrease in
cyclic resistance as the gross void ratio increases and the soil specific relative density
decreases.
Figure 4-4 shows that for the Yatesville sand and silt mixtures there is, again, little
correlation between gross void ratio and cyclic resistance. Similar to the Monterey sand
8/8/2019 The Effects of Non-Plasticand Plastic Fines on the Liquefaction Of
http://slidepdf.com/reader/full/the-effects-of-non-plasticand-plastic-fines-on-the-liquefaction-of 93/288
79
specimens, within each silt content there is a decrease in cyclic resistance with an
increase in gross void ratio and corresponding decreases in soil specific relative density.
As might be expected, the behavior of these soils are the same when examined in terms of
gross relative density as they are when examined in terms of gross void ratio. This is
because the gross relative density for a specimen is based upon the gross void ratio of the
specimen and the maximum and minimum index void ratios for the clean base sand.
Because the maximum and minimum index void ratios used do not vary with silt content,
the only term in the gross relative density equation which changes from specimen to
specimen is the gross void ratio. As a result, the changes in gross relative density simply
mirror the changes in gross void ratio.
In summary, there does not appear to be a unique relationship between silt content, gross
void ratio, and cyclic resistance for the mixtures of sand and silt. Instead, for specimens
prepared to a constant gross void ratio, cyclic resistance first decreases and then increases
after some limiting silt content is reached. As density is varied within a given silt
content, there is a decrease in cyclic resistance with an increase in gross void ratio and a
corresponding decrease in soil specific relative density. This decrease in cyclic resistance
with an increase in gross void ratio was observed in both the Monterey and Yatesville
sand mixtures and is similar to the behavior of clean sands. Similar trends were found
when the data was evaluated in terms of gross relative density due to its direct
dependence on gross void ratio.
4.1.2 Tests Evaluated In Terms Of Sand Skeleton Void Ratio
The cyclic resistances measured were next evaluated in terms of their sand skeleton void
ratios. Sand skeleton void ratio is the void ratio that would exist in the soil if all of the silt
and clay particles were removed, leaving only the sand grains to form the soil skeleton.
Several investigators (Shen et al., 1977; Tronsco and Verdugo, 1985; Kuerbis et al., 1988;
8/8/2019 The Effects of Non-Plasticand Plastic Fines on the Liquefaction Of
http://slidepdf.com/reader/full/the-effects-of-non-plasticand-plastic-fines-on-the-liquefaction-of 94/288
80
and Vaid, 1994) have suggested that as long as there is sufficient room for the silt grains
within the voids produced by the sand, the controlling factor in the cyclic resistance of a
sand-silt mixture is the sand skeleton void ratio.
The maximum amount of silt that can be contained in the voids created by the sand
without deforming the sand skeleton is referred to as the limiting silt content. The
limiting silt content is the transition point below which the soil structure is primarily one
of silt contained in a sand matrix and above which it is predominately sand grains
suspended in a silt matrix with little sand grain to sand grain contact.
The proposed idea that cyclic resistance is solely a function of sand skeleton void ratio
implies that, as long as the voids created by the sand skeleton are large enough to
accommodate all of the silt particles present, the amount of silt, and thus the gross void
ratio, has no effect on the cyclic resistance of the soil.
The limiting silt content was calculated for both the Monterey and Yatesville sands using
the method presented by Mitchell (1993). It was assumed in this analysis that the silt in
the voids was at its maximum index void ratio. This assumption provides an lower
bound value of limiting silt content. For the Monterey sand, the limit is approximately 32
percent silt by weight and for the Yatesville sand it is approximately 36 percent. These
silt contents were also found to correspond to the transition points at which the cyclic
resistance of the soils in this study became independent of the sand skeleton void ratio.
Below the limiting silt content, Monterey sand was found to maintain a nearly constant
cyclic resistance with increasing silt contents for specimens prepared to a constant sandskeleton void ratio. This is shown in Figure 4-5. Conversely, below the limiting silt
content, Yatesville sand was found to increase in cyclic resistance with increasing silt
contents for specimens prepared to constant sand skeleton void ratios. This is shown in
Figure 4-6. The cyclic resistances for each sand and silt combination tested during this
8/8/2019 The Effects of Non-Plasticand Plastic Fines on the Liquefaction Of
http://slidepdf.com/reader/full/the-effects-of-non-plasticand-plastic-fines-on-the-liquefaction-of 95/288
81
study have been replotted to show cyclic resistance as a function of sand skeleton void
ratio. These are shown for the Monterey and Yatesville base sands in Figures 4-7 and 4-
8, respectively.
For the Monterey sand and silt mixtures there is a strong correlation between sand
skeleton void ratio and cyclic resistance for silt contents of 35 percent and less. Cyclic
resistance decreases linearly with increasing sand skeleton void ratio. For silt contents of
50 percent and above, (that is, well above the limiting silt content) the cyclic resistance of
the soil is nearly constant, varying little with either increasing sand skeleton void ratio or
increasing silt content.
The Yatesville sand and silt mixtures exhibit a similar relationship between sand skeleton
void ratio and cyclic resistance to that found for the Monterey sand specimens although
there is considerably more scatter in the Yatesville sand data. Cyclic resistance again
decreases with increasing sand skeleton void ratio for silt contents 37 percent and less.
For silt contents of 50 percent and above, (that is, well above the limiting silt content), the
cyclic resistance of the soil is nearly constant, varying little with either increasing sand
skeleton void ratio or increasing silt content.
In summary, for soils with silt contents below the limiting silt content there is a
relationship between sand skeleton void ratio and cyclic resistance, with cyclic resistance
increasing with decreasing sand skeleton void ratio. Above the limiting silt content, the
cyclic resistance is relatively constant and is independent of both the silt content and the
sand skeleton void ratio.
8/8/2019 The Effects of Non-Plasticand Plastic Fines on the Liquefaction Of
http://slidepdf.com/reader/full/the-effects-of-non-plasticand-plastic-fines-on-the-liquefaction-of 96/288
82
4.1.3 Tests Evaluated In Terms Of Constant Soil Specific Relative Density
Finally, the data were evaluated in terms of their soil specific relative densities. The soilspecific relative density is the relative density of the specimen based upon its gross void
ratio and the maximum and minimum index void ratios for that particular mixture of sand
and silt. When the cyclic resistances are plotted in terms of the soil specific relative
density, clear patterns emerge. For specimens with silt contents below the limiting silt,
there is a linear trend between increasing soil specific relative density and increasing
cyclic resistance. These plots are presented for the Monterey and Yatesville base sands in
Figures 4-9 and 4-10, respectively.
For the soils with silt contents greater than the limiting silt content, there is a second
behavioral trend. For these soils the cyclic resistance is controlled by the silt fraction of
the soil and is lower, at the same soil specific relative density, than the cyclic resistance of
soils below the limiting silt content. Figure 4-11 plots the cyclic resistance of these soils
against the silt fraction void ratio of the specimen. The cyclic resistance can be seen to
vary with the silt fraction void ratio. Because cyclic resistance does not vary as a
function of the percentages of sand and silt in the mixture, it is independent of the amount
of sand, if any, which is present in the specimen. This indicates that as there is little sand
grain to sand grain contact in these specimens, with the sand present making little or no
contribution to the specimen’s ability to resist liquefaction.
The change in cyclic resistance which occurs when the soil changes from a sand
controlled matrix to a silt controlled matrix can be clearly seen in Figure 4-12 which
presents a plot of cyclic resistance versus silt content for specimens of Yatesville sand
and silt adjusted to 25 percent soil specific relative density. While a transition zone
appears to exist between silt contents of approximately 35 and 55 percent, the decrease in
8/8/2019 The Effects of Non-Plasticand Plastic Fines on the Liquefaction Of
http://slidepdf.com/reader/full/the-effects-of-non-plasticand-plastic-fines-on-the-liquefaction-of 97/288
83
cyclic resistance that occurs when the silt content reaches a level greater than the limiting
silt content can be clearly seen in this figure.
In summary, for soils with silt contents below the limiting silt content there is a nearly
linear relationship between soil specific relative density and cyclic resistance. Below the
limiting silt content, the cyclic resistance of the soil is independent of silt content,
increasing with increasing soil specific relative density. Above the limiting silt level, the
cyclic resistance varies with the silt fraction void ratio, increasing with decreasing silt
fraction void ratio, and is independent of the amount of sand present.
4.2 Flow Liquefaction and Cyclic Mobility
When a soil specimen is subjected to cyclic loading and reaches a state of zero effective
stress, it is often said to have liquefied. However, its post-liquefaction behavior can be
classified as one of two conditions, flow liquefaction or cyclic mobility.
Correspondingly, soil deposits subjected to earthquake loadings are also capable of these
two behaviors, flow liquefaction and cyclic mobility (Casagrande, 1975). These
behaviors are best considered in terms of steady-state soil mechanics (Casagrande, 1975;
Castro and Poulos, 1977). While a detailed essay on steady-state soil mechanics is
beyond the scope of this document, a brief summary is provided below.
When a soil is sheared to a large strain, often upwards of 25 percent, it approaches a
constant condition. This condition is referred to as the steady-state condition and is
characterized by displacement at a constant effective stress, a constant velocity, a constant
volume, and an absence of particle breakage and rearrangement. In order for this to
occur, the soil must be subjected to some driving shear stress such as a slope or a
building. In the field, a soil at steady-state will flow until the driving shear stresses
become less than the steady-state shear strength.
8/8/2019 The Effects of Non-Plasticand Plastic Fines on the Liquefaction Of
http://slidepdf.com/reader/full/the-effects-of-non-plasticand-plastic-fines-on-the-liquefaction-of 98/288
84
The steady-state strength of a soil is controlled by a combination of its critical void ratio
and critical effective confining stress. A plot of these critical void ratios and confining
stresses is referred to as the steady-state line. A sample steady-state line is shown in
Figure 4-13. Soils that plot above the steady-state line, such as Point A, are contractive
when sheared, and are susceptible to flow liquefaction. Soils that plot below the line,
such as Point B, are dilative when sheared, and are susceptible to cyclic mobility.
4.2.1 Flow Liquefaction
Flow liquefaction occurs in soils that are at void ratios larger than the critical void ratio
corresponding to the effective confining stress acting on the soil. Point A in Figure 4-13
represents such a condition. When sheared undrained, the soil will develop positive pore
pressures which reduce the effective stress on the specimen, which in turn decrease the
strength of the specimen. This lowered strength leads to increased strain that leads to
increased pore pressures, which results in lower strength. This self-perpetuating loss of
strength continues until a steady-state condition is achieved. Very large strains or
displacements typically accompany flow liquefaction.
A typical strain versus cycles of loading curve from a cyclic triaxial test performed on a
specimen exhibiting flow liquefaction is presented in Figure 4-14. Its behavior in
characterized by the very small strains throughout the loading until just before the on-set
of initial liquefaction at which time a large, sudden, compressive strain occurs. The
magnitude of the strain achieved is limited by the mechanisms of the test, not by the
behavior of the soil. If allowed, it would continue to deform indefinitely. If one were to
examine the specimen following the test, it would be found to bear no resemblance its
shape prior to loading. It would be found to be a soft mass of soil with very littlestrength, with only the rubber membrane preventing it from forming a shallow pile in the
floor of the cell.
8/8/2019 The Effects of Non-Plasticand Plastic Fines on the Liquefaction Of
http://slidepdf.com/reader/full/the-effects-of-non-plasticand-plastic-fines-on-the-liquefaction-of 99/288
85
4.2.2 Cyclic Mobility
Cyclic mobility occurs in soils which are at void ratios which are smaller than the critical
void ratio corresponding to the effective confining stress acting on the soil. Point B in
Figure 4-13 represents such a condition. When sheared undrained, the soil will initially
attempt to compress, thus developing positive pore pressures which reduce the effective
stress on the specimen, but as it continues to strain, the soil becomes dilative, the pore
pressures decrease, the effective stress increases, and the strength of the soil increases.
This dilative behavior and resulting strength gain prevents large displacements from
occurring.
A typical strain versus cycles of loading curve from a cyclic triaxial test performed on a
specimen exhibiting cyclic mobility is presented in Figure 4-15. Its behavior is
characterized by the nearly uniform development of bi-axial strains throughout the course
of loading and a return to essentially zero strain at the end of loading. Because the
specimen is weaker in “tension” (when minor principal effective stress acts in the vertical
direction) than in compression, there is a tendency for slightly greater strains to develop
when the minor principal effective stress acts in the vertical direction. If one were to
examine the specimen following the test, it would be found to be essentially the same as
it was prior to loading, that is, a rigid, uniform cylinder.
Due to limited test data it is difficult to determine at exactly what void ratio or relative
density the behavior of the soils in this study changed from flow liquefaction to cyclic
mobility. A possible future course of study would be to determine if the density required
to change the behavior of the soil from flow liquefaction to cyclic mobility is a function
of silt content.

8/8/2019 The Effects of Non-Plasticand Plastic Fines on the Liquefaction Of
http://slidepdf.com/reader/full/the-effects-of-non-plasticand-plastic-fines-on-the-liquefaction-of 100/288
86
4.3 Evaluation And Reconciliation Of The Results Of Published Studies
Numerous laboratory studies which have been reported in the literature have producedwhat appear to be conflicting results. These studies report that increasing the silt content
in a sand will either increase the liquefaction resistance of the sand (Chang et al., 1982;
Dezfulian, 1982), decrease the liquefaction resistance of the sand (Shen et al., 1977;
Tronsco and Verdugo, 1985; Finn et al., 1994; and Vaid, 1994), or decrease the
liquefaction resistance until some limiting silt content is reached, and then increase its
resistance (Law and Ling, 1992; Koester, 1994). Additionally, several studies (Shen et
al., 1977; Tronsco and Verdugo, 1985; Kuerbis et al., 1988; and Vaid, 1994) have shown
that the liquefaction resistance of a silty sand is more closely related to its sand skeleton
void ratio than to its silt content.
It was found that the majority of these seemingly contradictory trends reported in the
literature could be explained in light of the findings of this study. Following the
introduction of the concept of normalized cyclic resistance, the changes in soil specific
relative density which occur for specimens prepared to a constant gross void as silt
content increases will be discussed. Next, the results of the study will be used to explain
the behaviors identified in the literature. First, the trend of decreasing cyclic resistance
with increasing silt content will be explained, followed by the trend of decreasing and
then increasing cyclic resistance with increasing silt content. Next, the findings of
constant or increasing cyclic resistance with constant sand skeleton void ratio will be
examined. Lastly, the trend of increasing cyclic resistance with increasing silt content
will be discussed.
4.3.1 Normalized Cyclic Resistance
The majority of the published laboratory studies into the effects of silt content on
liquefaction resistance have been performed using cyclic triaxial tests. Unfortunately,

8/8/2019 The Effects of Non-Plasticand Plastic Fines on the Liquefaction Of
http://slidepdf.com/reader/full/the-effects-of-non-plasticand-plastic-fines-on-the-liquefaction-of 101/288
87
several factors make comparisons of cyclic triaxial data from different investigators
difficult. The first of these difficulties is that the results reported in these studies are from
tests performed on a variety of sands with differing silt contents, densities, confining
stresses, and cyclic loading levels. Secondly, different investigators have used different
criteria to define liquefaction. Liquefaction is often defined as occurring when the pore
water pressure in the specimen first equals the total confining stress and the effective
stress becomes equal to zero (i.e. initial liquefaction). Liquefaction, however, has also
been defined as occurring when some level of single or double amplitude axial strain,
such as 2.5 or 5 percent, is reached in the specimen. Lastly, cyclic resistance, which is a
measure of a soil’s ability to resist liquefaction, is defined as the cyclic stress ratio
required to achieve the defined liquefaction condition in a given number of cycles.
Different investigators have chosen different numbers of cycles, often 10, 15, or 30, in
defining their cyclic resistance.
The differences in soil type, testing conditions, and definitions of liquefaction and cyclic
resistance require that the data be normalized in some manner before a comparison of the
data from different studies can be made. In order to standardize both the published data
and the data from the current study, and to evaluate them on a consistent basis, the
concept of normalized cyclic resistance was created. To obtain the normalized cyclic
resistance of a soil at a given silt content, the cyclic resistance of that soil is divided by
the cyclic resistance of the clean base sand measured under the same conditions of
density, effective confining stress, and failure criteria. In this manner, the variation of
cyclic resistance with silt content within any study can be compared to the results of other
studies. In this report, when the results of multiple authors are plotted on a single graph,
the normalized cyclic resistance approach will be used.

8/8/2019 The Effects of Non-Plasticand Plastic Fines on the Liquefaction Of
http://slidepdf.com/reader/full/the-effects-of-non-plasticand-plastic-fines-on-the-liquefaction-of 102/288
88
4.3.2 Changes In Soil Specific Relative Density With Increasing Silt Content
The maximum and minimum index densities of a sand and silt mixture, which are anindication of the range of densities it can achieve, vary with silt content. When the silt
content of a sand is increased, the maximum and minimum void ratios initially decrease
as the soil becomes more well-graded. When the soil reaches the limiting silt content, the
maximum and minimum void ratios reach their lowest values. As the silt content of the
soil continues to increase, the maximum and minimum void ratios increase as the grain
size distribution of the soil becomes more uniform.
By holding the gross void ratio of the specimens constant as the silt content increases, the
soil specific relative density of the specimens first decreases and then increases as a result
of the corresponding changes in the maximum and minimum void ratios. This behavior
is shown in Figure 4-16, which plots the minimum and maximum void ratios for the
Yatesville sand and silt mixtures and the soil specific relative density for specimens
prepared to a gross preconsolidation void ratio of 0.76.
Because a specimen’s ability to resist liquefaction is directly related to its soil specific
relative density, a decrease in soil specific relative density produces a decrease in cyclic
resistance and an increase in soil specific relative density leads to an increase in cyclic
resistance. This pattern is shown for the Monterey and Yatesville base sands in Figures
4-17 and 4-18, which plot cyclic resistance and soil specific relative density against silt
content for the tests performed at constant gross void ratio.
It should be noted that the lowest cyclic resistance does not correspond precisely with the
limiting silt content or the lowest soil specific relative density. This occurs because, as
the silt content of the soil is increased, the soil transforms from a sand-controlled matrix
to a silt-controlled matrix. However, in the range of silt contents immediately above the

8/8/2019 The Effects of Non-Plasticand Plastic Fines on the Liquefaction Of
http://slidepdf.com/reader/full/the-effects-of-non-plasticand-plastic-fines-on-the-liquefaction-of 103/288
89
limiting silt content, the sand grains are still closely situated and exert an influence upon
one another. Due to the inherent difference in cyclic resistance between the sand and the
silt, as silt content increases, cyclic resistance continues to decrease, although the soil
specific relative density is actually increasing.
This inherent difference in cyclic resistance between the sand and silt can be seen in
Figure 4-16, which shows the curves of cyclic stress ratio versus the number of cycles to
initial liquefaction for both clean Yatesville sand and pure Yatesville silt corrected to 50
percent soil specific relative density. Despite having the same soil specific relative
density, the silt can be seen to have a much lower cyclic resistance. For cyclic resistance
define as initial liquefaction in 10 cycles, the cyclic resistances of the Yatesville sand and
the silt shown in Figure 4-19 are 0.24 and 0.07, respectively.
4.3.3 Decreasing Cyclic Resistance With Increasing Silt Content
Numerous authors have reported a decrease in cyclic resistance with increasing silt
content. Shen et al. (1977), Tronsco and Verdugo (1985), and Vaid (1994) have all
reported this trend for specimens prepared either to a constant gross void ratio or a
constant dry density. The decreases in cyclic resistance were marked, decreasing as much
as 60 percent from their clean sand values for an increase in silt content of 30 percent
(Tronsco and Verdugo, 1985).
The decrease of cyclic resistance with increasing silt content can be explained in terms of
the soil specific relative density. The specimens in these studies were all prepared to
constant gross void ratios or densities, and were at silt contents that were likely below the
limiting silt content. Because the specimens were prepared to constant gross void ratios,
their soil specific relative densities decreased with increasing silt contents, leading to a
decrease in cyclic resistance. Because the specimens were only tested at silt contents

8/8/2019 The Effects of Non-Plasticand Plastic Fines on the Liquefaction Of
http://slidepdf.com/reader/full/the-effects-of-non-plasticand-plastic-fines-on-the-liquefaction-of 104/288
90
below their limiting silt contents, the increase in cyclic resistance which would have
occurred at the higher silt contents were not detected.
Figure 4-20 presents the normalized cyclic resistances for both the Monterey and
Yatesville sands prepared to constant gross voids ratio at silt contents below their limiting
silt contents and for the studies which reported a decrease in cyclic resistance with
increasing silt content. These curves all show similar trends, confirming that this
behavior can be explained in terms of the soil specific relative density.
4.3.4 Decreasing And Then Increasing Cyclic Resistance With Increasing Silt Content
Rather than a simple decrease in cyclic resistance with increasing fines contents, several
investigators have reported a decrease and then an increase in cyclic resistance with
increasing silt content. Koester (1994) and Law and Ling (1992) found that, for
specimens prepared to a constant gross void ratio, as silt content increased the cyclic
resistance of a soil first decreased until some limiting silt content was reached, at which
point the cyclic resistance began increasing as silt content continued to increase. Koester
(1994) reported a decrease in cyclic resistance to less than one-quarter of the clean sand
cyclic resistance at a silt content of 20 percent, then an increase in cyclic resistance to 32
percent of the clean sand value at a silt content of 60 percent. Unlike Chang et al. (1982),
and Dezfulian (1982), neither Koester (1994) nor Law and Ling (1992) reported increases
in cyclic resistance to levels greater than those of the clean sand.
The decrease and then increase of cyclic resistance with increasing silt content can also be
explained in terms of the soil specific relative density. The specimens tested in these
studies were all prepared to constant gross void ratios, again creating soil specific relative
densities that vary with varying silt content. As the silt content of the specimens
increases, their soil specific relative density first decreases and then increases as the

8/8/2019 The Effects of Non-Plasticand Plastic Fines on the Liquefaction Of
http://slidepdf.com/reader/full/the-effects-of-non-plasticand-plastic-fines-on-the-liquefaction-of 105/288
91
maximum and minimum index void ratios vary. This variation in soil specific relative
density creates the reported variations in cyclic resistance.
Figure 4-21 presents the normalized cyclic resistances for both the Monterey and
Yatesville sand specimens prepared to constant gross void ratios and for the studies
which reported a decrease followed by an increase in cyclic resistance with increasing silt
content. These curves all show similar trends, confirming that this behavior can be
explained in terms of the soil specific relative density.
For specimens prepared to an approximately constant soil specific relative density, Singh
(1994) found that cyclic resistance underwent only small changes with increasing silt
content. Although a small decrease in cyclic resistance followed by a slight increase in
cyclic resistance with increasing silt content was measured, the changes in cyclic
resistance are much smaller than those occurring in the studies by Koester (1994) and
Law and Ling (1992). This difference in the magnitude of the changes in cyclic
resistance between the various studies can be seen in Figure 4-21. This nearly constant
cyclic resistance for samples prepared to different silt contents at a constant soil specific
relative density agrees well with the findings of the current study.
4.3.5 Cyclic Resistance With Constant Sand Skeleton Void Ratio
Several studies have shown that cyclic resistance is more closely related to sand skeleton
void ratio than it is to gross void ratio, gross relative density, or fines content. Tronsco
and Verdugo (1985) found that at a constant sand skeleton void ratio, the cyclic resistance
of a sand is constant with increasing silt content. Shen et al., (1977), Kuerbis et al.,
(1988), and Vaid, (1994) however, have shown that at a constant sand skeleton void ratio,
the cyclic resistance of a sand does not remain constant but increases with increasing silt
content. Both of these trends were noted in this study and can each be explained in terms
of soil specific relative density.
8/8/2019 The Effects of Non-Plasticand Plastic Fines on the Liquefaction Of
http://slidepdf.com/reader/full/the-effects-of-non-plasticand-plastic-fines-on-the-liquefaction-of 106/288
92
Sand skeleton void ratio is the void ratio that would exist in the soil if all of the silt and
clay particles were removed, leaving only the sand grains to form the soil skeleton. Finn
et al. (1994) report that as long as there is room for the silt within the voids produced by
the sand, the liquefaction resistance is independent of silt content.
As stated by Finn et al. (1994), the relationship between cyclic resistance and sand
skeleton void ratio is only applicable to soils which have sufficient room in the voids
created by the sand skeleton to accommodate all of the silt present: that is, soils below
their limiting silt contents. Above the limiting silt content, it has been seen that cyclic
resistance is controlled by the silt fraction and is independent of the sand skeleton. For
many sands, below the limiting silt content, the maximum and minimum index void
ratios decrease as silt is added not because the sand skeleton is altered but because the
voids in the sand skeleton are being filled, thereby decreasing the gross void ratio of the
soil. This behavior occurs in the Monterey sand, which has a nearly linear decrease in
index void ratio with an increase in silt content. This behavior may be seen in Figure 4-
22.
Also shown in Figure 4-22 is a curve representing the gross void ratios of several
Monterey sand and silt mixtures that correspond to a sand skeleton void ratio of 0.75. For
silt contents below 20 percent, the gross void ratio curve approximately parallels the
curves for both the maximum and minimum index void ratios. This parallel decrease
occurs because, for this soil, as the voids in the sand skeleton are filled, the gross void
ratio decreases at the same rate as the maximum and minimum void ratios. Because the
three different void ratios all decrease at approximately the same rate over this range of silt contents, the soil specific relative density remains nearly constant for a given sand
skeleton void ratio, which in turn produces nearly constant cyclic resistance.
8/8/2019 The Effects of Non-Plasticand Plastic Fines on the Liquefaction Of
http://slidepdf.com/reader/full/the-effects-of-non-plasticand-plastic-fines-on-the-liquefaction-of 107/288
93
The cyclic resistances of the Monterey sand specimens prepared at various silt contents to
a constant sand skeleton void ratio of 0.75 are shown in Figure 4-23. As expected for
soils with nearly constant soil specific relative densities, the cyclic resistances are
essentially constant with increasing silt content. This shows that for soils in which
constant sand skeleton void ratios produce constant soil specific relative densities, the
cyclic resistance remains constant. This matches the behavior reported by Tronsco and
Verdugo (1985).
Not all soils however, exhibit a constant cyclic resistance with for a constant sand
skeleton void ratio. Shen et al. (1977), Kuerbis et al. (1988), and Vaid (1994) have
shown that for specimens prepared to a constant sand skeleton void ratio, the cyclic
resistance of a sand does not remain constant, but increases with increasing silt content.
The soil mixtures formed using Yatesville sand exhibited this behavior. Figure 4-24
shows the increase in cyclic resistance with increasing silt content measured for
Yatesville sand specimens prepared to various silt contents at constant sand skeleton void
ratios of 0.90 and 1.00.
The increase in cyclic resistance measured for these soils at a constant sand skeleton void
ratio occurs because as their silt content increases, their maximum and minimum index
void ratios decrease less rapidly than their gross void ratios. As a result, although the
sand skeleton void ratio remains constant, the soil specific relative densities increases
with increasing silt content.
Figure 4-25 shows that the gross void ratio of specimens of Yatesville sand prepared to a
constant sand skeleton void ratio of 0.90 decreases more rapidly with increasing siltcontent than do the index void ratios. This results in an increase in soil specific relative
density with increasing silt content which, in turn, causes an increase in cyclic resistance.
This is confirmed in Figure 4-26 where the results presented in Figure 4-24 are replotted
in terms of their soil specific relative densities. These specimens of Yatesville sand,

8/8/2019 The Effects of Non-Plasticand Plastic Fines on the Liquefaction Of
http://slidepdf.com/reader/full/the-effects-of-non-plasticand-plastic-fines-on-the-liquefaction-of 108/288
94
despite having different sand skeleton void ratios and silt contents, exhibit the same
variation in cyclic resistance when examined in terms of their soil specific relative
densities.
From the studies of specimens prepared to a constant sand skeleton void ratios it can be
seen that some soils such as Monterey sand have a very strong link between their sand
skeleton void ratios and their cyclic resistances, while other soils such as Yatesville sand
are not as well correlated. Soils, such as Monterey sand, which exhibit constant cyclic
resistances with constant sand skeleton void ratio appear to do so because their soil
specific relative densities remain relatively constant with increasing silt content. Other
soils, such as Yatesville sand, which exhibit an increase in cyclic resistances with
constant sand skeleton void ratio appear to do so because their soil specific relative
densities increase with increasing silt content. Whether the cyclic resistance remains
constant or increases when the sand skeleton void ratio is held constant depends the rate
at which the maximum and minimum index void ratios change relative to the gross void
ratio as silt content increases.
4.3.6 Increasing Cyclic Resistance With Increasing Silt Content
Several investigators have found that cyclic resistance increases with increasing silt
content. For specimens prepared to a constant gross void ratio, Chang, et al. (1982),
found that after a small initial drop, cyclic resistance increased dramatically with
increasing silt content. The silt used in the study was slightly plastic, having a plasticity
index of 5. Results of these tests are presented in Figure 4-27 where the dramatic
increase in cyclic resistance can be seen. The normalized cyclic resistance increased
nearly linearly with silt content until a silt content of 60 percent is reached, increasing to a
cyclic resistance between 50 and 60 percent greater than that of the clean sand.
Similarly, Dezfulian (1982) also reported a trend of increasing cyclic resistance with
8/8/2019 The Effects of Non-Plasticand Plastic Fines on the Liquefaction Of
http://slidepdf.com/reader/full/the-effects-of-non-plasticand-plastic-fines-on-the-liquefaction-of 109/288
95
increasing silt content. Both studies used silts with some small level of plasticity or a
measurable clay fraction.
No evidence was found during the current study to either support or explain these large
increases in cyclic resistance with increasing silt content. One clue to the reason for this
behavior lies in the fact that it was only reported for studies that used silts with some
plasticity. As has been reported in the literature (Lee and Fitton, 1968; Ishihara and
Koeski, 1989; and Yasuda, et al.; 1994), an increase in the plasticity of the fine-grained
fraction will increase the cyclic resistance of a sand.
While it is possible that the increase in cyclic resistance reported by Chang, et al. (1982)
and Dezfulian (1982) is due to the plastic nature of the fine grained material, it should be
noted that Shen et al. (1977) studied soils with a higher plasticity index than those
reported by Chang, et al. (1982), yet reported no increase in cyclic resistance due to the
plasticity of the fines.
4.4 Conclusions
Numerous studies reported in the literature have produced varying answers to the
question of what effect increasing non-plastic silt content has upon the liquefaction
resistance of a sand. In order to answer this question and to reconcile the results of these
studies, a study utilizing nearly 300 cyclic triaxial tests was performed using two base
sands and 19 combinations of sand and non-plastic silt. Tests were run at varying silt
contents and the results interpreted in terms of gross void ratio, gross relative density, and
skeleton void ratio, and soil specific relative density. Several conclusions regarding the
effects of non-plastic fines on the liquefaction susceptibility of sandy soils were drawn
from this study.
8/8/2019 The Effects of Non-Plasticand Plastic Fines on the Liquefaction Of
http://slidepdf.com/reader/full/the-effects-of-non-plasticand-plastic-fines-on-the-liquefaction-of 110/288
96
From this study three distinct behavioral patterns were found for the cyclic resistance of
soils composed of sand and non-plastic silt. Which of these behaviors controls is
determined by whether there is sufficient room in the voids created by the sand skeleton
to contain the silt present without disturbing the sand structure. This silt content has been
called the limiting silt content and occurred between 30 and 40 percent for the sands used
in this study.
If the silt content of the soil is below the limiting silt content, there is sufficient room in
the voids created by the sand skeleton to contain the silt, and the soil can be described as
having silt contained in a sand matrix. The cyclic resistance of the soil is then controlled
by the soil specific relative density of the specimen, where the soil specific relative
density is calculated using the gross void ratio of the specimen and the maximum and
minimum index void ratios for that particular mixture of sand and silt. The cyclic
resistance for these soils is independent of silt content. Increasing the soil specific
relative density increases the soil’s cyclic resistance.
If the silt content is greater than the limiting silt content, the specimen’s structure consists
predominately of sand grains suspended within a silt matrix with little sand grain to sand
grain contact. Above the limiting silt content, the amount of sand present in the soil and
its soil specific relative density have little effect on its cyclic resistance. The cyclic
resistance for these soils is controlled by the silt fraction void ratio of the soil.
Decreasing the silt fraction void ratio increases the soil’s cyclic resistance.
There is a transition zone consisting of soils with silt contents at or slightly above the
limiting silt content. This zone occurs as a result of the structure of the soil changingfrom a predominately sand controlled fabric to a predominately silt controlled fabric as
silt content increases. Soils in this zone possess cyclic resistances intermediate to those
with greater or lesser silt contents.
8/8/2019 The Effects of Non-Plasticand Plastic Fines on the Liquefaction Of
http://slidepdf.com/reader/full/the-effects-of-non-plasticand-plastic-fines-on-the-liquefaction-of 111/288
97
The seemingly contradictory reports concerning the effects of non-plastic fines content on
the liquefaction resistance of sands that have appeared in the literature were reconciled in
light of the behavioral patterns found in this study. These behaviors were found to
depend primarily upon the limiting silt content of the soil and the soil specific relative
density of the specimen. It was shown that the trends of decreasing cyclic resistance or
decreasing and then increasing cyclic resistance with increases in silt content reported in
the literature could be explained in view of the results of this study. The concept that
cyclic resistance is controlled by the sand skeleton void ratio of the soil was also
reconciled with the results of this study. The trend of increasing cyclic resistance with
increasing silt content which has been reported in the literature does not appear to occur
in non-plastic silts and is likely due to the plasticity of the fines used in those studies.
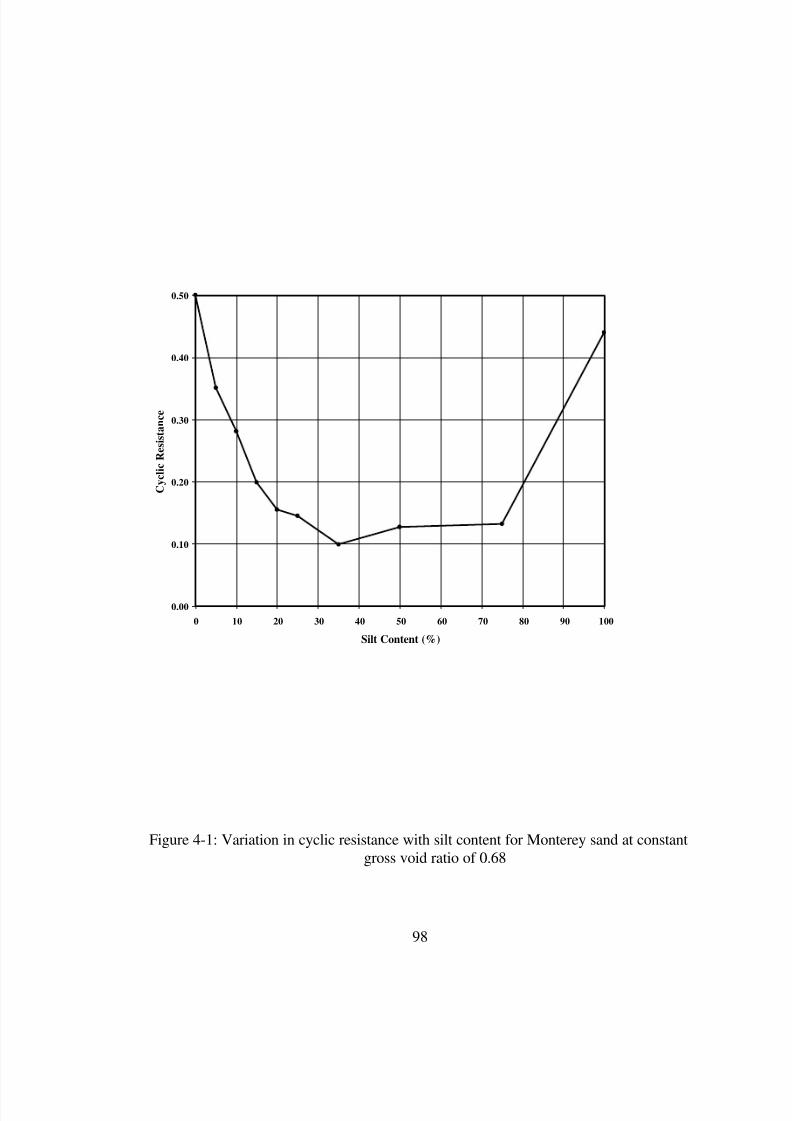
8/8/2019 The Effects of Non-Plasticand Plastic Fines on the Liquefaction Of
http://slidepdf.com/reader/full/the-effects-of-non-plasticand-plastic-fines-on-the-liquefaction-of 112/288
98
Figure 4-1: Variation in cyclic resistance with silt content for Monterey sand at constant
gross void ratio of 0.68
0.00
0.10
0.20
0.30
0.40
0.50
0 10 20 30 40 50 60 70 80 90 100
Silt Content (%)
C y c l i c R e s i s t a n c e

8/8/2019 The Effects of Non-Plasticand Plastic Fines on the Liquefaction Of
http://slidepdf.com/reader/full/the-effects-of-non-plasticand-plastic-fines-on-the-liquefaction-of 113/288
99
Figure 4-2: Variation in cyclic resistance with silt content for Yatesville sand at constant
gross void ratio of 0.76
0.00
0.10
0.20
0.30
0.40
0.50
0 10 20 30 40 50 60 70 80 90 100
Silt Content (%)
C y c l i c R e s i s t a n c e

8/8/2019 The Effects of Non-Plasticand Plastic Fines on the Liquefaction Of
http://slidepdf.com/reader/full/the-effects-of-non-plasticand-plastic-fines-on-the-liquefaction-of 114/288
100
0.00
0.10
0.20
0.30
0.40
0.50
0.60
0.40 0.50 0.60 0.70 0.80 0.90 1.00
Gross Void Ratio
C y c l i c R e s i s t a n c e
0% Silt
5% Silt
10% Silt
15% Silt
20% Silt
25% Silt
35% Silt
50% Silt
75% Silt
100% Silt
Figure 4-3: Variation in cyclic resistance with gross void ratio for Monterey sand
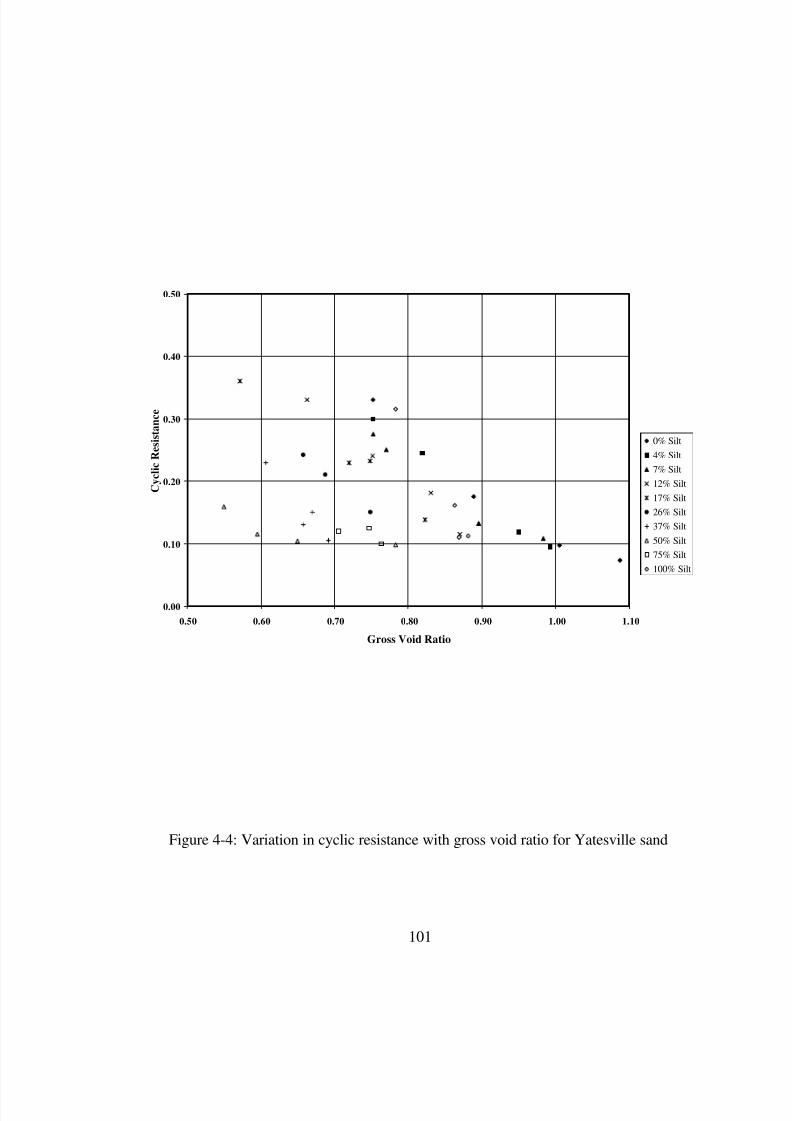
8/8/2019 The Effects of Non-Plasticand Plastic Fines on the Liquefaction Of
http://slidepdf.com/reader/full/the-effects-of-non-plasticand-plastic-fines-on-the-liquefaction-of 115/288
101
Figure 4-4: Variation in cyclic resistance with gross void ratio for Yatesville sand
0.00
0.10
0.20
0.30
0.40
0.50
0.50 0.60 0.70 0.80 0.90 1.00 1.10
Gross Void Ratio
C y c l i c R e s i s t a n c e
0% Silt
4% Silt
7% Silt
12% Silt
17% Silt
26% Silt
37% Silt
50% Silt
75% Silt
100% Silt
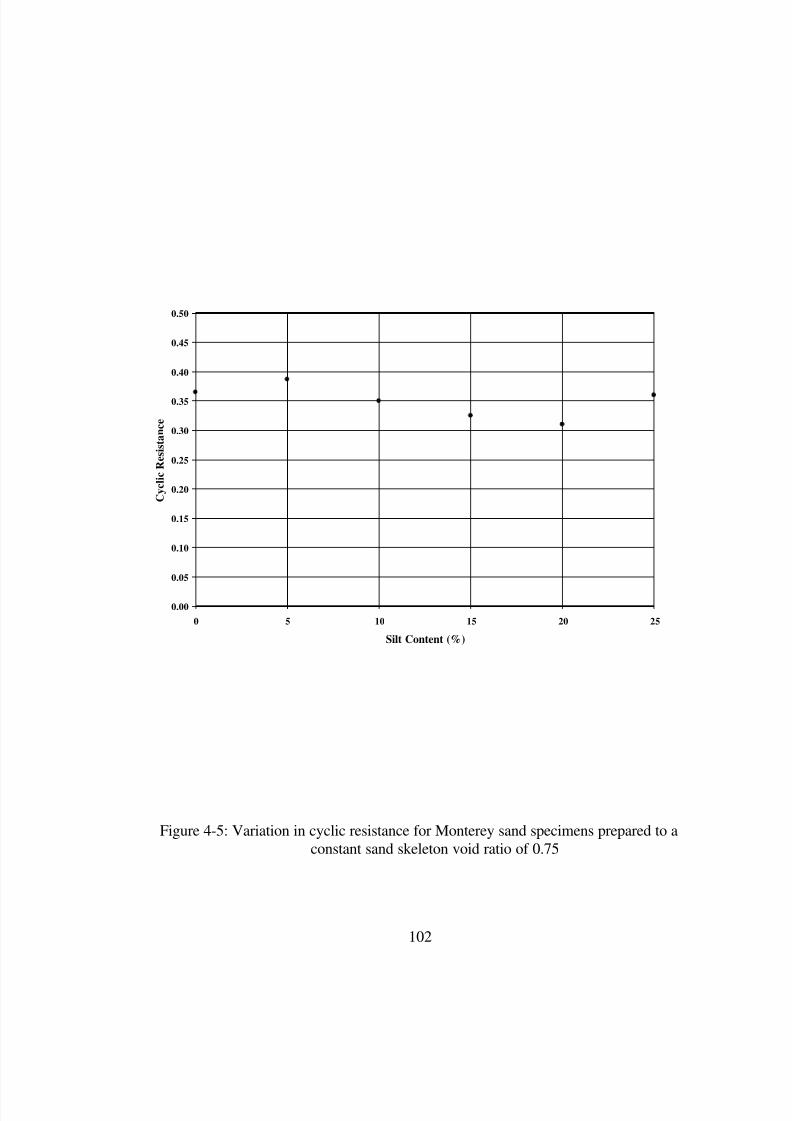
8/8/2019 The Effects of Non-Plasticand Plastic Fines on the Liquefaction Of
http://slidepdf.com/reader/full/the-effects-of-non-plasticand-plastic-fines-on-the-liquefaction-of 116/288
102
Figure 4-5: Variation in cyclic resistance for Monterey sand specimens prepared to a
constant sand skeleton void ratio of 0.75
0.00
0.05
0.10
0.15
0.20
0.25
0.30
0.35
0.40
0.45
0.50
0 5 10 15 20 25
Silt Content (%)
C y c l i c R e s i s t a n c e
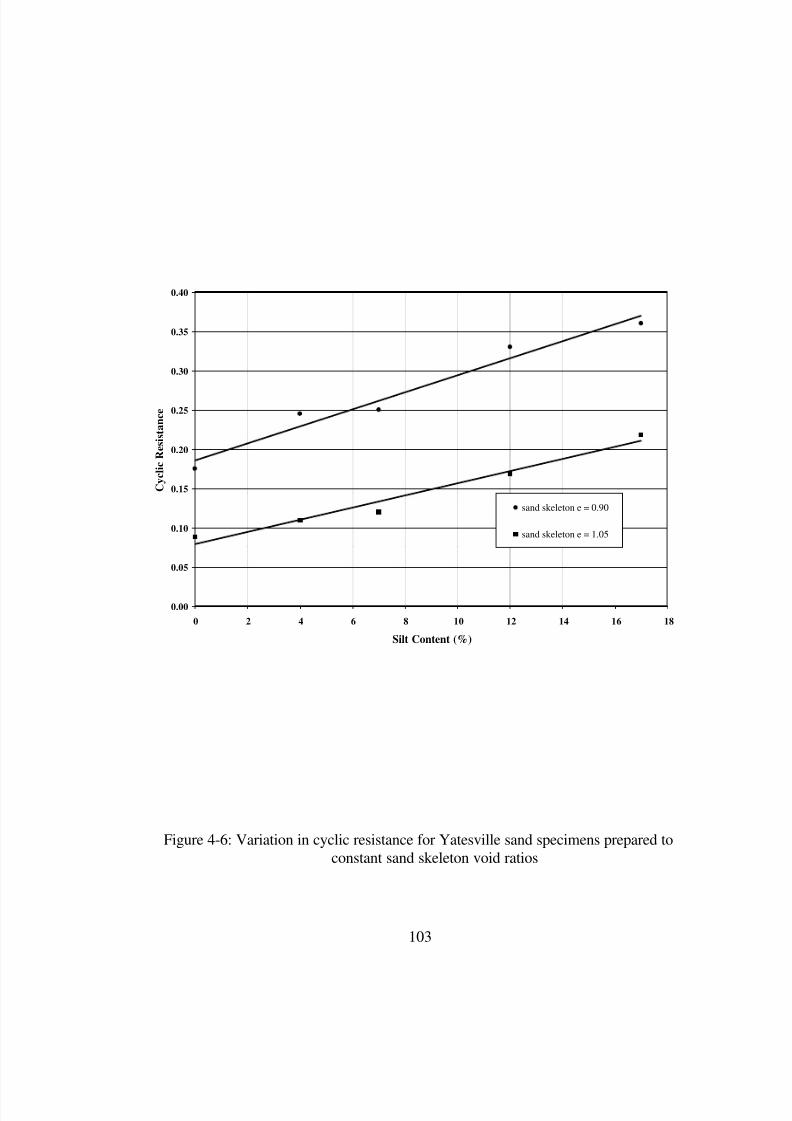
8/8/2019 The Effects of Non-Plasticand Plastic Fines on the Liquefaction Of
http://slidepdf.com/reader/full/the-effects-of-non-plasticand-plastic-fines-on-the-liquefaction-of 117/288
103
Figure 4-6: Variation in cyclic resistance for Yatesville sand specimens prepared to
constant sand skeleton void ratios
0.00
0.05
0.10
0.15
0.20
0.25
0.30
0.35
0.40
0 2 4 6 8 10 12 14 16 18
Silt Content (%)
C y c l i c R e s i s t a n c e
sand skeleton e = 0.90
sand skeleton e = 1.05
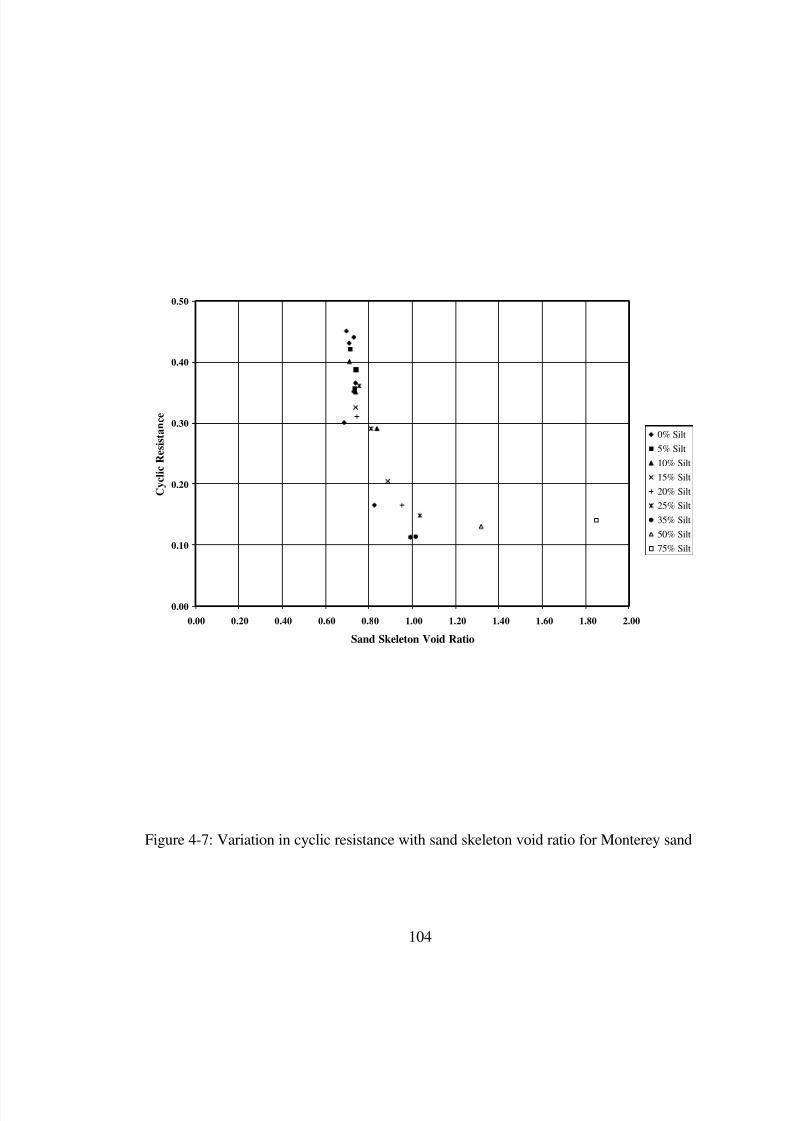
8/8/2019 The Effects of Non-Plasticand Plastic Fines on the Liquefaction Of
http://slidepdf.com/reader/full/the-effects-of-non-plasticand-plastic-fines-on-the-liquefaction-of 118/288
104
Figure 4-7: Variation in cyclic resistance with sand skeleton void ratio for Monterey sand
0.00
0.10
0.20
0.30
0.40
0.50
0.00 0.20 0.40 0.60 0.80 1.00 1.20 1.40 1.60 1.80 2.00
Sand Skeleton Void Ratio
C y c l i c R e s i s t a n c e
0% Silt
5% Silt
10% Silt
15% Silt
20% Silt
25% Silt
35% Silt
50% Silt
75% Silt

8/8/2019 The Effects of Non-Plasticand Plastic Fines on the Liquefaction Of
http://slidepdf.com/reader/full/the-effects-of-non-plasticand-plastic-fines-on-the-liquefaction-of 119/288
105
Figure 4-8: Variation in cyclic resistance with sand skeleton void ratio for Yatesville sand
0.00
0.10
0.20
0.30
0.40
0.50
0.00 1.00 2.00 3.00 4.00 5.00 6.00
Sand Skeleton Void Ratio
C y c l i c R e s i s t a n c e
0% Silt
4% Silt
7% Silt
12% Silt
17% Silt
26% Silt
37% Silt
50% Silt
75% Silt

8/8/2019 The Effects of Non-Plasticand Plastic Fines on the Liquefaction Of
http://slidepdf.com/reader/full/the-effects-of-non-plasticand-plastic-fines-on-the-liquefaction-of 120/288
106
Figure 4-9: Variation in cyclic resistance with soil specific relative density for Monterey
sand
0.00
0.10
0.20
0.30
0.40
0.50
0.60
0.70
-20 0 20 40 60 80 100 120
Soil Specific Relative Density (%)
C y c l i c R e s i s t a n c e
0% Silt
5% Silt
10% Silt
15% Silt
20% Silt
25% Silt
35% Silt
50% Silt
75% Silt
100% Silt
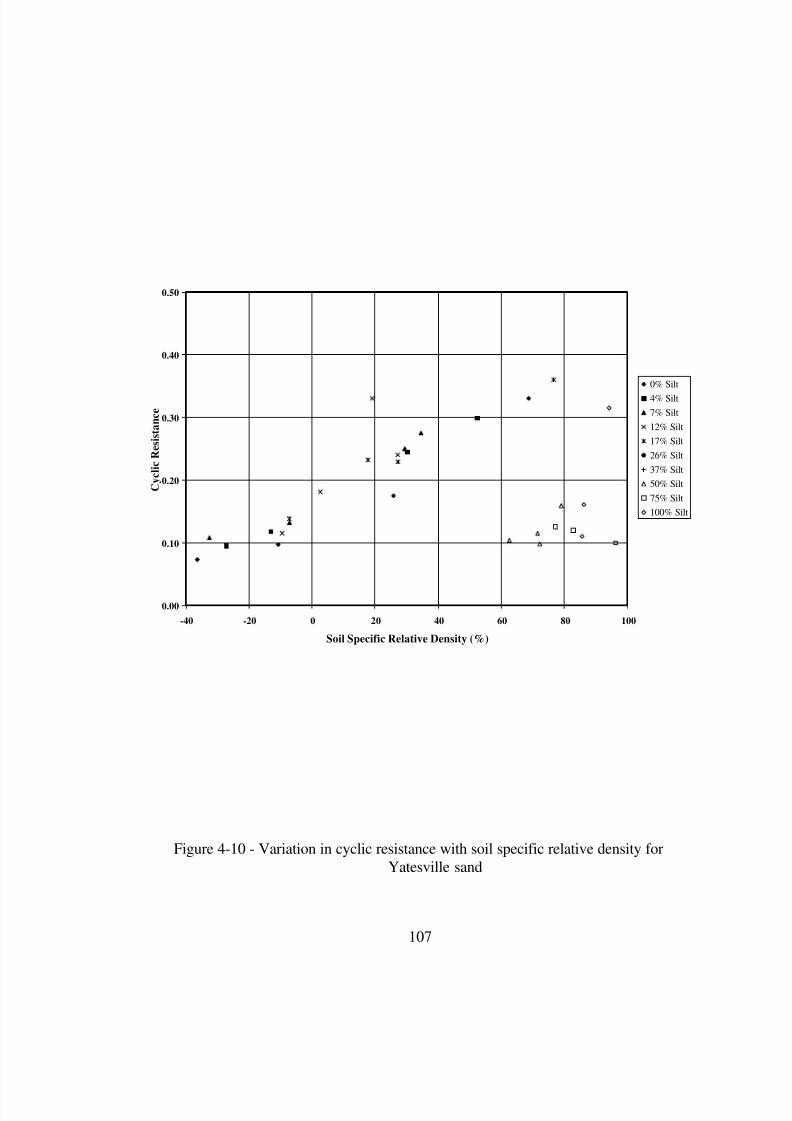
8/8/2019 The Effects of Non-Plasticand Plastic Fines on the Liquefaction Of
http://slidepdf.com/reader/full/the-effects-of-non-plasticand-plastic-fines-on-the-liquefaction-of 121/288
107
Figure 4-10 - Variation in cyclic resistance with soil specific relative density for
Yatesville sand
0.00
0.10
0.20
0.30
0.40
0.50
-40 -20 0 20 40 60 80 100
Soil Specific Relative Density (%)
C y c l i c R e s i s t a n c e
0% Silt
4% Silt
7% Silt
12% Silt
17% Silt
26% Silt
37% Silt
50% Silt
75% Silt
100% Silt
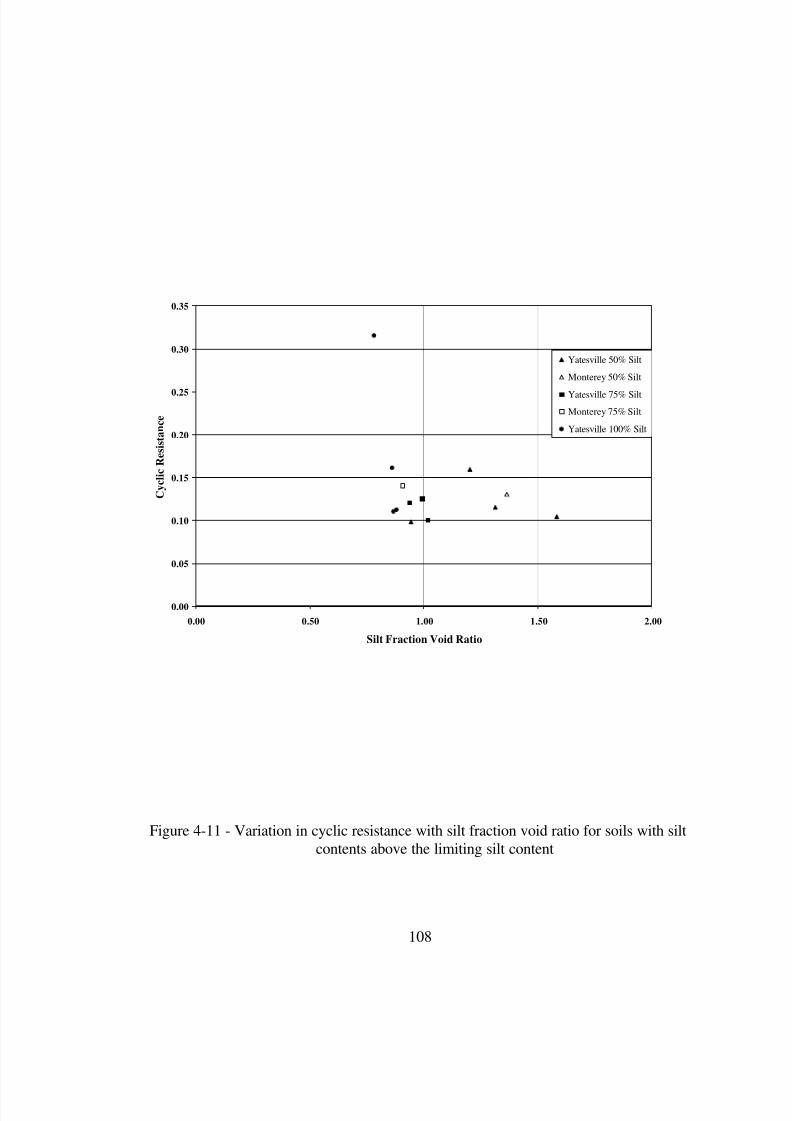
8/8/2019 The Effects of Non-Plasticand Plastic Fines on the Liquefaction Of
http://slidepdf.com/reader/full/the-effects-of-non-plasticand-plastic-fines-on-the-liquefaction-of 122/288
108
Figure 4-11 - Variation in cyclic resistance with silt fraction void ratio for soils with silt
contents above the limiting silt content
0.00
0.05
0.10
0.15
0.20
0.25
0.30
0.35
0.00 0.50 1.00 1.50 2.00
Silt Fraction Void Ratio
C y c l i c R e s i s t a n c e
Yatesville 50% Silt
Monterey 50% Silt
Yatesville 75% Silt
Monterey 75% Silt
Yatesville 100% Silt
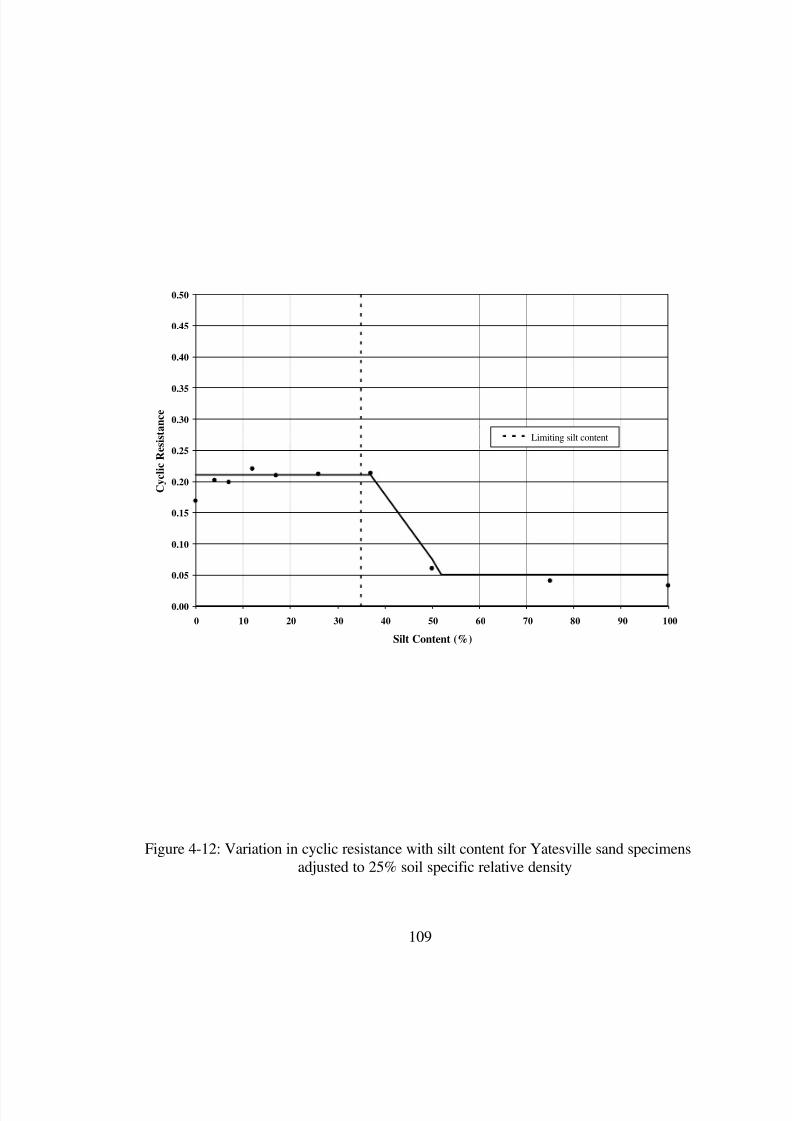
8/8/2019 The Effects of Non-Plasticand Plastic Fines on the Liquefaction Of
http://slidepdf.com/reader/full/the-effects-of-non-plasticand-plastic-fines-on-the-liquefaction-of 123/288
109
Figure 4-12: Variation in cyclic resistance with silt content for Yatesville sand specimens
adjusted to 25% soil specific relative density
0.00
0.05
0.10
0.15
0.20
0.25
0.30
0.35
0.40
0.45
0.50
0 10 20 30 40 50 60 70 80 90 100
Silt Content (%)
C y c l i c R e s i s t a n c e
Limiting silt content

8/8/2019 The Effects of Non-Plasticand Plastic Fines on the Liquefaction Of
http://slidepdf.com/reader/full/the-effects-of-non-plasticand-plastic-fines-on-the-liquefaction-of 124/288
110
Figure 4-13: Example of a steady-state line
0.4
0.6
0.8
1.0
10 100 1000
Effective Confining Stress
V o i d R a t i o
+ Point APoint B +

8/8/2019 The Effects of Non-Plasticand Plastic Fines on the Liquefaction Of
http://slidepdf.com/reader/full/the-effects-of-non-plasticand-plastic-fines-on-the-liquefaction-of 125/288
111
Figure 4-14: Typical strain behavior for a specimen susceptible to flow liquefaction
-7.5
-5.0
-2.5
0.0
2.5
0 5 10 15
Cycle Of Loading
A x i a l S t r a i n ( % )

8/8/2019 The Effects of Non-Plasticand Plastic Fines on the Liquefaction Of
http://slidepdf.com/reader/full/the-effects-of-non-plasticand-plastic-fines-on-the-liquefaction-of 126/288
112
Figure 4-15: Typical strain behavior for a specimen susceptible to cyclic mobility
-2.5
0.0
2.5
5.0
0 5 10 15
Cycle Of Loading
A x i a l S t r a i n ( % )
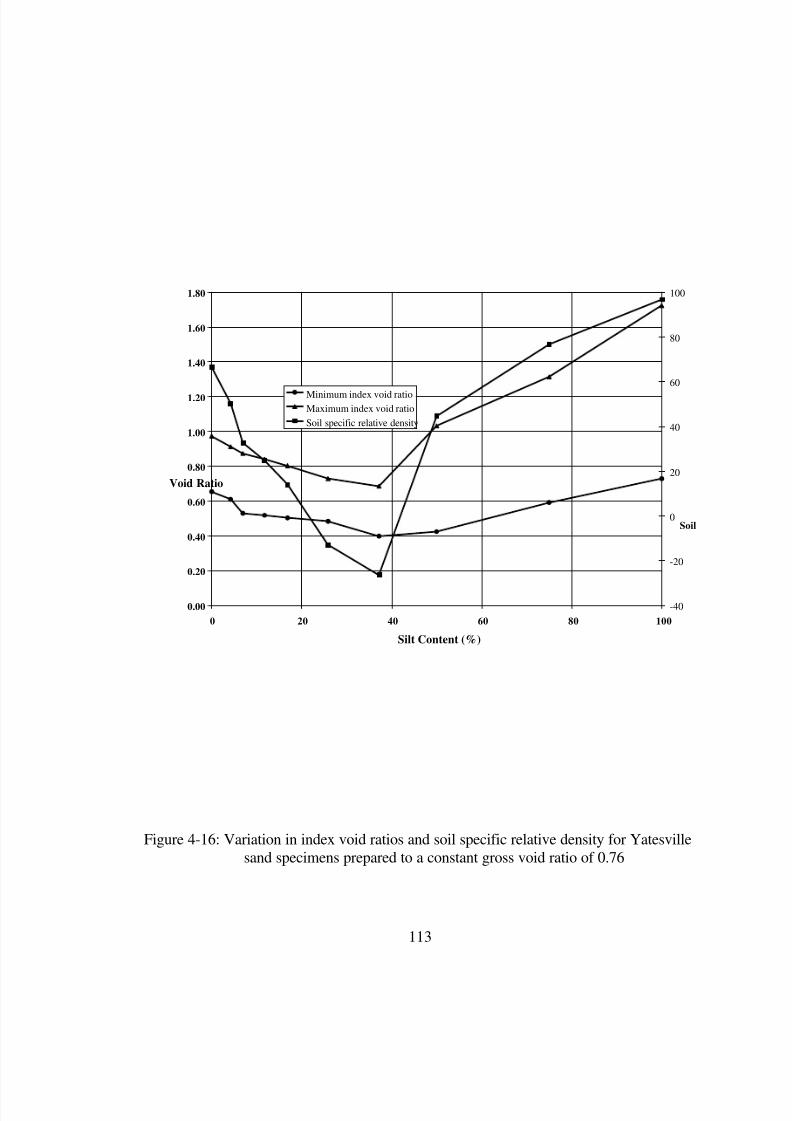
8/8/2019 The Effects of Non-Plasticand Plastic Fines on the Liquefaction Of
http://slidepdf.com/reader/full/the-effects-of-non-plasticand-plastic-fines-on-the-liquefaction-of 127/288
113
Figure 4-16: Variation in index void ratios and soil specific relative density for Yatesville
sand specimens prepared to a constant gross void ratio of 0.76
0.00
0.20
0.40
0.60
0.80
1.00
1.20
1.40
1.60
1.80
0 20 40 60 80 100
Silt Content (%)
Void Ratio
-40
-20
0
20
40
60
80
100
Soil
Minimum index void ratio
Maximum index void ratio
Soil specific relative density
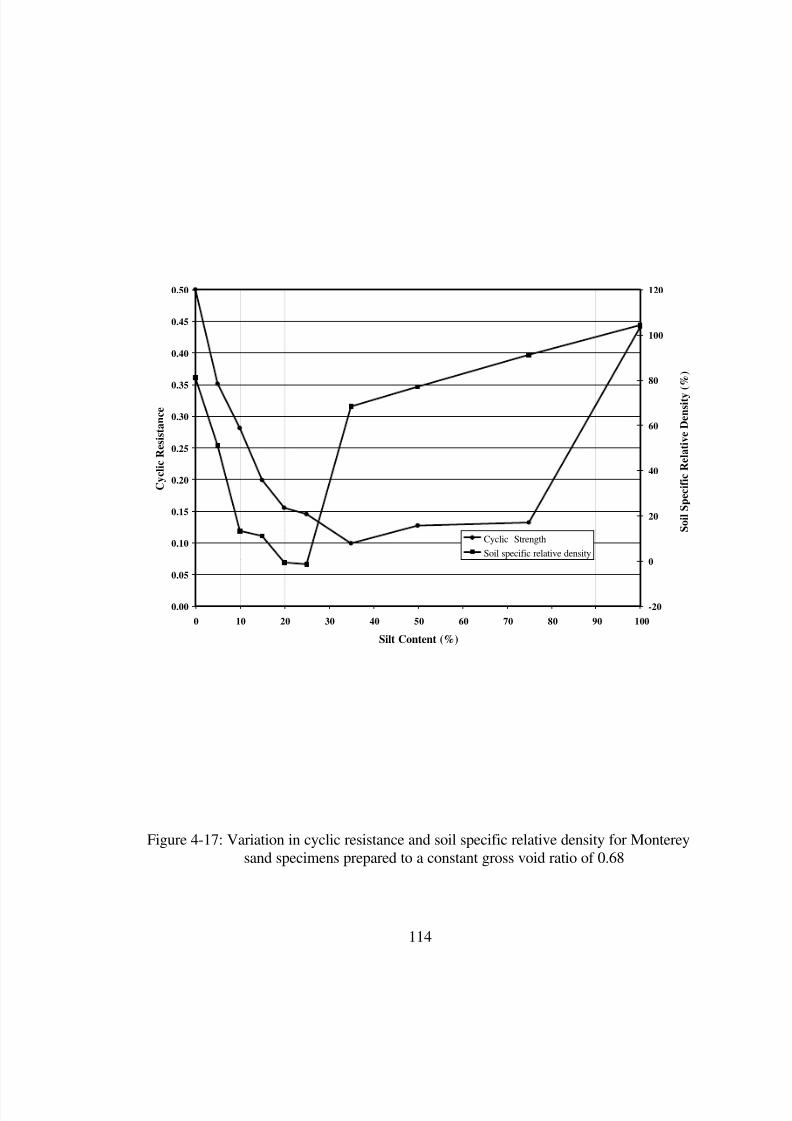
8/8/2019 The Effects of Non-Plasticand Plastic Fines on the Liquefaction Of
http://slidepdf.com/reader/full/the-effects-of-non-plasticand-plastic-fines-on-the-liquefaction-of 128/288
114
Figure 4-17: Variation in cyclic resistance and soil specific relative density for Monterey
sand specimens prepared to a constant gross void ratio of 0.68
0.00
0.05
0.10
0.15
0.20
0.25
0.30
0.35
0.40
0.45
0.50
0 10 20 30 40 50 60 70 80 90 100
Silt Content (%)
C y c l i c R e s i s t a n c e
-20
0
20
40
60
80
100
120
S o i l S p e c i f i c R e l a t i v e D e n s i t y
( % )
Cyclic Strength
Soil specific relative density

8/8/2019 The Effects of Non-Plasticand Plastic Fines on the Liquefaction Of
http://slidepdf.com/reader/full/the-effects-of-non-plasticand-plastic-fines-on-the-liquefaction-of 129/288
115
Figure 4-18: Variation in cyclic resistance and soil specific relative density for Yatesville
sand specimens prepared to a constant gross void ratio of 0.76
0.00
0.05
0.10
0.15
0.20
0.25
0.30
0.35
0 10 20 30 40 50 60 70 80 90 100
Silt Content (%)
C y c l i c R e s i s t a n c e
-20
0
20
40
60
80
100
S o i l S p e c i f i c R e l a t i v e D e n s i t y
( % )
Cyclic Strength
Soil specific relative density

8/8/2019 The Effects of Non-Plasticand Plastic Fines on the Liquefaction Of
http://slidepdf.com/reader/full/the-effects-of-non-plasticand-plastic-fines-on-the-liquefaction-of 130/288
116
Figure 4-19: Number of cycles to initial liquefaction versus cyclic stress ratio for
Yatesville sand and silt at 50 percent soil specific relative density
0.00
0.05
0.10
0.15
0.20
0.25
0.30
0.35
0.40
0.45
0.50
1 10 100
Cycles to Initial Liquefaction
C y c l i c S t r e s s R a t i o
Yatesville Sand
Silt
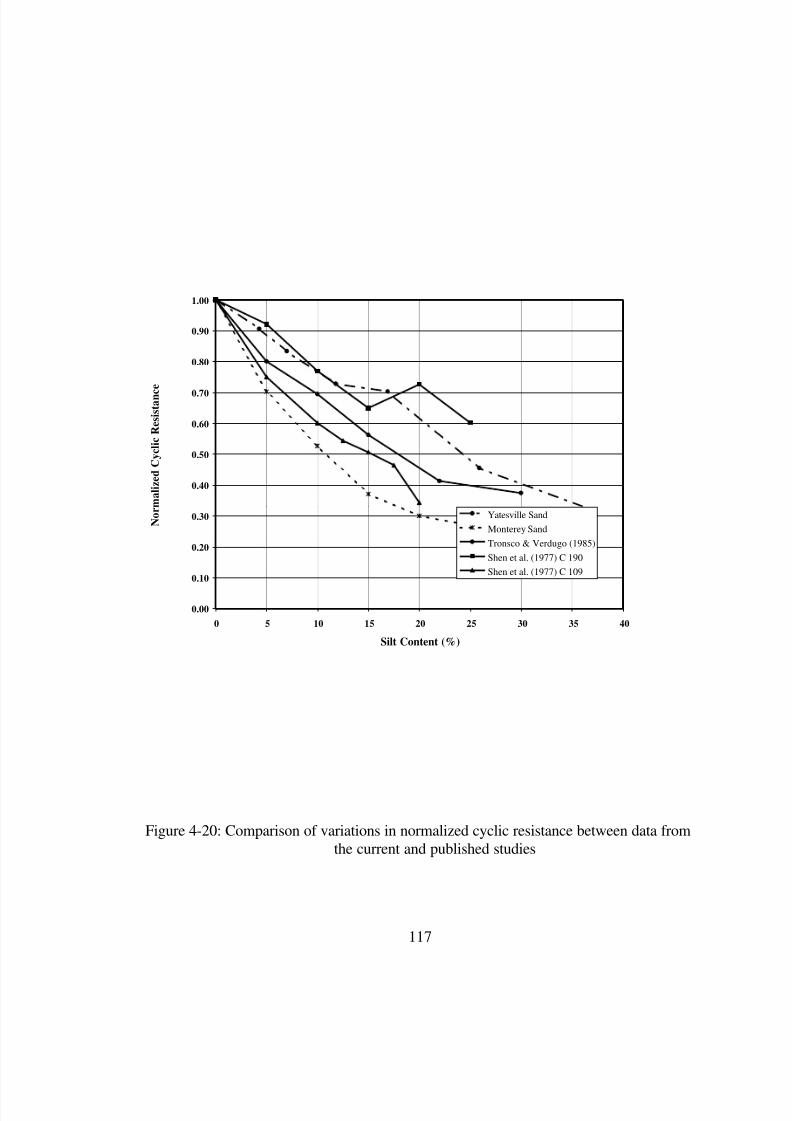
8/8/2019 The Effects of Non-Plasticand Plastic Fines on the Liquefaction Of
http://slidepdf.com/reader/full/the-effects-of-non-plasticand-plastic-fines-on-the-liquefaction-of 131/288
117
Figure 4-20: Comparison of variations in normalized cyclic resistance between data from
the current and published studies
0.00
0.10
0.20
0.30
0.40
0.50
0.60
0.70
0.80
0.90
1.00
0 5 10 15 20 25 30 35 40
Silt Content (%)
N o r m a l i z e d C y c l i c R e s i s t a n c
e
Yatesville Sand
Monterey Sand
Tronsco & Verdugo (1985)
Shen et al. (1977) C 190
Shen et al. (1977) C 109

8/8/2019 The Effects of Non-Plasticand Plastic Fines on the Liquefaction Of
http://slidepdf.com/reader/full/the-effects-of-non-plasticand-plastic-fines-on-the-liquefaction-of 132/288
118
Figure 4-21: Comparison of variations in normalized cyclic resistance between data from
the current and published studies
0.00
0.10
0.20
0.30
0.40
0.50
0.60
0.70
0.80
0.90
1.00
0 20 40 60 80 100
Silt Content (%)
N o r m a l i z e d C y c l i c R e s i s t a n c e
Monterey Sand
Yatesville Sand
Koester (1994) Med Sand
Law & Ling (1992)
Singh (1994)
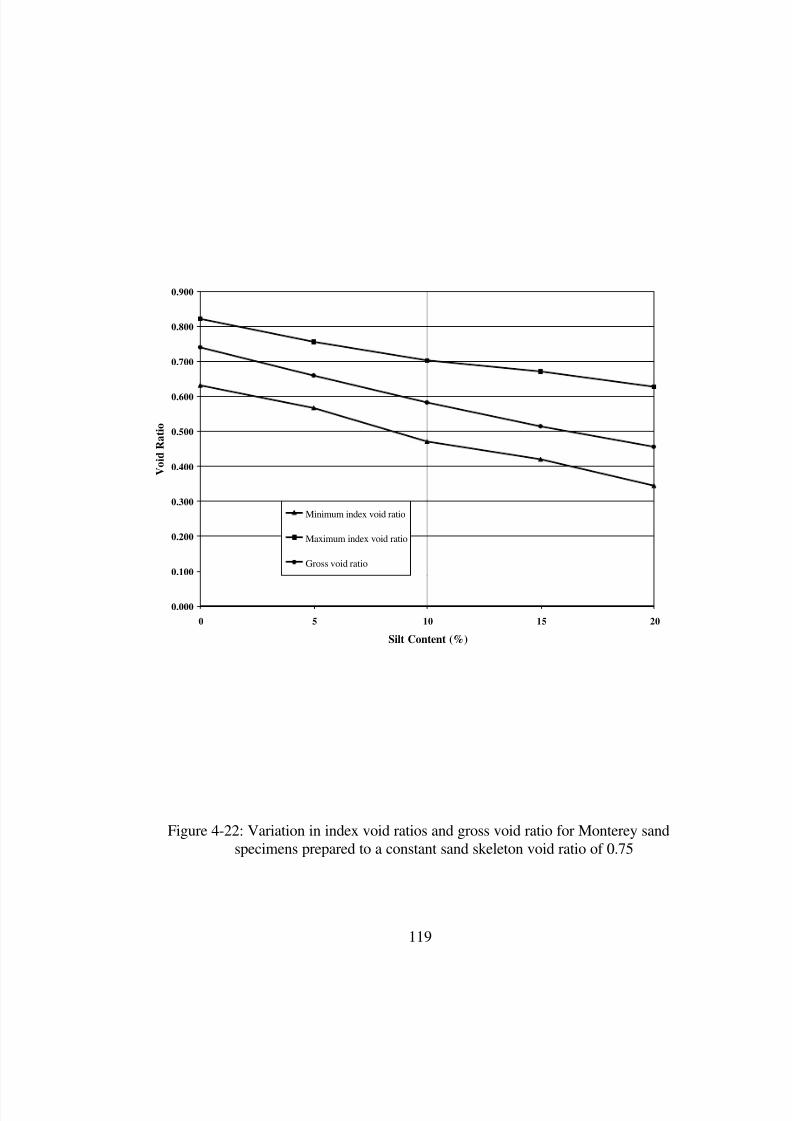
8/8/2019 The Effects of Non-Plasticand Plastic Fines on the Liquefaction Of
http://slidepdf.com/reader/full/the-effects-of-non-plasticand-plastic-fines-on-the-liquefaction-of 133/288
119
Figure 4-22: Variation in index void ratios and gross void ratio for Monterey sand
specimens prepared to a constant sand skeleton void ratio of 0.75
0.000
0.100
0.200
0.300
0.400
0.500
0.600
0.700
0.800
0.900
0 5 10 15 20
Silt Content (%)
V o i d R a t i o
Minimum index void ratio
Maximum index void ratio
Gross void ratio

8/8/2019 The Effects of Non-Plasticand Plastic Fines on the Liquefaction Of
http://slidepdf.com/reader/full/the-effects-of-non-plasticand-plastic-fines-on-the-liquefaction-of 134/288
120
Figure 4-23: Variation in cyclic resistance for Monterey sand specimens prepared to a
constant sand skeleton void ratio of 0.75
0.00
0.05
0.10
0.15
0.20
0.25
0.30
0.35
0.40
0.45
0.50
0 5 10 15 20
Silt Content (%)
C y c l i c R e s i s t a n c e

8/8/2019 The Effects of Non-Plasticand Plastic Fines on the Liquefaction Of
http://slidepdf.com/reader/full/the-effects-of-non-plasticand-plastic-fines-on-the-liquefaction-of 135/288
121
Figure 4-24: Variation in cyclic resistance for Yatesville sand specimens prepared to
constant sand skeleton void ratios
0.00
0.05
0.10
0.15
0.20
0.25
0.30
0.35
0.40
0 2 4 6 8 10 12 14 16 18
Silt Content (%)
C y c l i c R e s i s t a n c e
sand skeleton e = 0.90
sand skeleton e = 1.05

8/8/2019 The Effects of Non-Plasticand Plastic Fines on the Liquefaction Of
http://slidepdf.com/reader/full/the-effects-of-non-plasticand-plastic-fines-on-the-liquefaction-of 136/288
122
Figure 4-25: Variation in index void ratios and gross void ratio for Yatesville sand
specimens prepared to a constant sand skeleton void ratio of 0.90
0.000
0.100
0.200
0.300
0.400
0.500
0.600
0.700
0.800
0.900
1.000
0 5 10 15 20
Silt Content (%)
V o i d R a t i o
Minimum index void ratio
Maximum index void ratio
Gross void ratio

8/8/2019 The Effects of Non-Plasticand Plastic Fines on the Liquefaction Of
http://slidepdf.com/reader/full/the-effects-of-non-plasticand-plastic-fines-on-the-liquefaction-of 137/288
123
Figure 4-26: Variation in cyclic resistance with soil specific relative density for Yatesville
sand specimens prepared to constant sand skeleton void ratios
0.00
0.05
0.10
0.15
0.20
0.25
0.30
0.35
0.40
-20 0 20 40 60 80 100
Soil Specific Relative Density (%)
C y c l i c R e s i s t a n c e
sand skeleton e = 0.90
sand skeleton e = 1.05

8/8/2019 The Effects of Non-Plasticand Plastic Fines on the Liquefaction Of
http://slidepdf.com/reader/full/the-effects-of-non-plasticand-plastic-fines-on-the-liquefaction-of 138/288
124
Figure 4-27: Increase in normalized cyclic resistance with increasing silt content
0.00
0.20
0.40
0.60
0.80
1.00
1.20
1.40
1.60
1.80
0 10 20 30 40 50 60 70 80 90 100
Silt Content (%)
N o r m a l i z e d C y c l i c R e s i s t a n c e
Soil B-2
Soil B-3
8/8/2019 The Effects of Non-Plasticand Plastic Fines on the Liquefaction Of
http://slidepdf.com/reader/full/the-effects-of-non-plasticand-plastic-fines-on-the-liquefaction-of 139/288
125
Chapter 5: The Effects Of Plastic Fines And Plasticity Based
Liquefaction Criteria
A series of cyclic triaxial tests were run to determine the effects which the percentage and
plasticity of the fine-grained material have upon the cyclic resistance of clayey sands.
The specimens were prepared at a constant soil specific relative density at fines contents
below the limiting silt content. The fine-grained material consisted of various
combinations of Yatesville silt, kaolinite, and bentonite.
While the majority of the data in the literature would predict an increase in cyclic
resistance as the clay content of the specimen increased, the study found a different
behavior to occur. As the clay content increased, the cyclic resistance (as based upon
initial liquefaction) was found to decrease until some percentage of clay was present, at
which point the cyclic resistance began slowly increasing. Even at clay contents well
above those which previous studies would seem to indicate should make the soil non-
liquefiable, the soils was found to have a lower cyclic resistance than a comparable
specimen with non-plastic fines.
Following a brief discussion of the results found in the literature and the testing program,
this chapter will examine the effects which increasing clay content and plasticity have on
cyclic resistance when measured by several different parameters. Next, the results of an
evaluation of plasticity based liquefaction criteria, such as the Chinese criteria, are
discussed. Lastly, a possible explanation for the observed behaviors is presented.
5.1 Previous Studies
The addition of plastic or clayey fines is widely thought to increase the liquefaction
resistance of a sand. While the addition of even small amounts of fines is believed to
increases the liquefaction resistance of a sand, the addition of sufficient clayey fines is
8/8/2019 The Effects of Non-Plasticand Plastic Fines on the Liquefaction Of
http://slidepdf.com/reader/full/the-effects-of-non-plasticand-plastic-fines-on-the-liquefaction-of 140/288
126
even thought to make a soil non-liquefiable. Field studies by Tokimatsu and Yoshimi,
(1983), indicates that sands with more than 20 percent clay will not liquefy. Seed et al.
(1983) reached a similar conclusion. Ishihara (1993) reports two Japanese studies that
predict that soils with greater than 10 percent clay are non-liquefiable. Additionally,
laboratory studies by Ishihara and Koseki (1989) and Yasuda et al. (1994) found a strong
correlation between increased plasticity of the fines and increased cyclic resistance. Lee
and Fitton (1968) concluded that the addition of clay fines may increase the cyclic
resistance of a soil considerably.
5.2 Testing Program
A series of cyclic triaxial tests were performed in order to determine the effects which
increased plastic fines content and plasticity have upon the liquefaction resistance of
soils. During testing it was found that in order to obtain meaningful results the soil must
be examined in terms of its overall plasticity, not just the plasticity of the fine-grained
fraction.
5.2.1 Soils Tested
The testing program performed to examine the effects which the addition of plastic fines
have upon the liquefaction resistance of sand is similar to the testing program used to
study the effects of non-plastic fines. Approximately 45 cyclic triaxial tests were run on
14 combinations and percentages of kaolinite, bentonite, and Yatesville silt. Additionally,
the results of the tests performed on specimens prepared with non-plastic fines at similar
fines contents and densities were included in the evaluations.
As similar trends where found for the effects of non-plastic fines on both the Monterey
No. 0/30 sand and the Yatesville sand, it was decided to perform the investigation into the
effects of plastic fines using only the Yatesville sand.
8/8/2019 The Effects of Non-Plasticand Plastic Fines on the Liquefaction Of
http://slidepdf.com/reader/full/the-effects-of-non-plasticand-plastic-fines-on-the-liquefaction-of 141/288
127
All tests were run at soil specific relative densities of approximately 25 percent. This
density matches that used for a series of tests run with non-plastic fines, the results of
which were presented in Figure 4-12. Fines contents in this portion of the study varied
from 4 to 37 percent, with clay contents varying from 2 to 37 percent.
As in the study on non-plastic fines, a minimum of three tests were performed at varying
cyclic stress ratios for each combination of fines. The number of cycles to initial
liquefaction was then plotted against the applied CSR’s and the cyclic resistance of the
soil determined. Again, the cyclic resistance was defined as the cyclic stress ratio
required to cause initial liquefaction in 10 cycles.
5.2.2 Measurement of Plasticity
The plasticity of the soil mixtures were determined by Atterberg limits tests on the
portion of the soil passing the Number 40 sieve as specified by ASTM D 4318 Standard
Test Method For Liquid Limit, Plastic Limit, And Plasticity Index Of Soils. The
plasticity data reported herein is based on this test methodology.
Numerous studies performed in the past have analyzed the effects of plastic fines based
on the plasticity of the fine-grained material alone. This may lead to erroneous results as
it neglects the effects that the percentage of fines in the soil has upon the Atterberg Limits
of that soil. For example, the pure kaolinite used in this study has a liquid limit of 58 and
a plasticity index of 31, but Yatesville sand with 26 percent kaolinite has a liquid limit of
20 and a plasticity index of 7. In a more extreme example, Yatesville sand with 12
percent kaolinite classifies as non-plastic with a liquid limit of 17 and no plastic limit.
These three soils have activities of 0.31, 0.27, and 0 respectively.

8/8/2019 The Effects of Non-Plasticand Plastic Fines on the Liquefaction Of
http://slidepdf.com/reader/full/the-effects-of-non-plasticand-plastic-fines-on-the-liquefaction-of 142/288
128
5.3 Results Of Testing
The findings of the laboratory study performed during this research do not support theconclusions of the studies found in the literature. The current study does not indicate that
adding small amounts of clay to a sand increases its resistance to liquefaction, in fact, it
indicates that the addition of small amounts of clay to a sand actually decreases the sand’s
ability to withstand liquefaction. It is not until a significant amount of highly plastic fines
are added that the soil becomes less liquefiable than either the clean sand or a sand with a
similar amount of non-plastic fines. These trends may be seen in Figure 5-1 which plots
the cyclic resistances of soils prepared to a constant soil specific relative density as a
function of their fines content and composition.
In order to determine what effects of fines content and type have on cyclic resistance of
the soil, the cyclic resistances determined for each soil mixture were plotted against
various parameters. This was done for all of the specimens from a clean sand to a sand
with 37 percent fines. The fines ranged from pure silt to pure bentonite and pure
kaolinite. The parameters examined include fines content, clay content, liquid limit,
plasticity index, activity, void ratio, water content, and liquidity index.
Next, in order to isolate the effects of fines plasticity, cyclic resistances were plotted for
specimens prepared to a constant fines content of 17 percent with varying fines
composition. The fines ranged from non-plastic silt to a combination of half kaolinite
and half bentonite. The parameters examined include clay content, liquid limit, plasticity
index, activity, water content, and liquidity index.

8/8/2019 The Effects of Non-Plasticand Plastic Fines on the Liquefaction Of
http://slidepdf.com/reader/full/the-effects-of-non-plasticand-plastic-fines-on-the-liquefaction-of 143/288
129
5.3.1 Results Of All Tests Performed
The data from the entire plastic fines portion of the testing program and the results of
selected tests with non-plastic fines were used in order to determine the combined effects
of fines content and plasticity on the cyclic resistance of sandy soils. These effects were
evaluated using common soil parameters.
5.3.1.1 The Effect Of Fines Content
Based upon the current study there is little correlation between the fines content of a sand
and its cyclic resistance. As may be seen from Figure 5-2 there is little correlation
between the quantity of fines present and the cyclic resistance of the soil. At a fines
content of 17 percent for example, the cyclic resistance varies from a low of 0.11 to a
high of 0.23, an increase of more than 100 percent.
This lack of correlation between fines content and cyclic resistance agrees with the
findings of Ishihara and Koeseki (1989).
5.3.1.2 The Effect Of Clay Content
Similar to the effect of fines content, no clear correlation may be drawn regarding the
effect of clay content on liquefaction resistance. As may be seen in Figure 5-3, for clay
contents below 20 percent, there is a weak trend of decreasing cyclic resistance with
increasing clay contents. For specimens prepared to a constant soil specific relative
density of approximately 25 percent, it is interesting to note that specimens containing
non-plastic fines have the highest cyclic resistance. These cyclic resistances are higher
even than the specimen prepared with 37 percent kaolinite, when cyclic resistance is
measured in terms of initial liquefaction.
While this lack of correlation between clay content and cyclic resistance is also in
agreement with the findings of Ishihara and Koeseki (1989), it is in direct contrast with

8/8/2019 The Effects of Non-Plasticand Plastic Fines on the Liquefaction Of
http://slidepdf.com/reader/full/the-effects-of-non-plasticand-plastic-fines-on-the-liquefaction-of 144/288
130
the field studies. Several authors have reported that during earthquakes, soils with more
than 10 percent clay do not liquefy, clearly however from Figure 5-3, it may be seen that
sands with more than 30 percent clay would appear to be liquefiable under relatively low
cyclic stress ratios.
5.3.1.3 The Effect Of Liquid Limit
Unlike the effect of fines content and clay content, there appears to be some correlation
between liquid limit and liquefaction resistance. As may be seen in Figure 5-4, cyclic
resistance decreases as liquid limit increases until a liquid limit of approximately 17
percent is reached. For specimens with liquid limits greater than 17 percent there is a
trend of increasing cyclic resistance with increasing liquid limit.
5.3.1.4 The Effect Of Plasticity Index
Based on the current study there is a correlation between the plasticity index of a sand and
its cyclic resistance. As may be seen from Figure 5-5, there is a general trend of
increasing cyclic resistance with increasing plasticity index.
This correlation between plasticity index and cyclic resistance agrees with the findings of
Ishihara and Koeseki (1989), who found a strong agreement between these items.
5.3.1.5 The Effect Of Activity
Activity, which is the ratio of the plasticity index of a soil to its clay content, is a factor
that accounts for both the quantity of clay present and the plasticity of that clay. In a
sense it represents both the quantity and quality of the clay present.
For soils possessing a defined activity, there is a trend of increasing cyclic resistance with
increasing activity. This trend is nearly linear as may be seen in Figure 5-6. This trend of
increasing cyclic resistance with increasing activity is likely controlled by the plasticity
index of the soil, as cyclic resistance has previously been shown to be relatively
insensitive to clay content.
8/8/2019 The Effects of Non-Plasticand Plastic Fines on the Liquefaction Of
http://slidepdf.com/reader/full/the-effects-of-non-plasticand-plastic-fines-on-the-liquefaction-of 145/288
131
5.3.1.6 The Effect Of Void Ratio
Based upon the current study there is little correlation between the void ratio of a clayey
sand and its cyclic resistance. As may be seen from Figure 5-7 there is little correlation
between the void ratio of the soil and the cyclic resistance of the soil. This is because, as
seen for soils with non-plastic fines, the cyclic resistance is controlled by the relative
density of the soil rather than by its void ratio. The general clustering of the data points
results from the fact that although at different void ratios, they are all at the same soil
specific relative density. The scatter within each fines content would, however, seem to
indicate some effect of the changing composition of the fines.
5.3.1.7 The Effect Of Water Content
As may be seen from Figure 5-8, the relationship between water content and cyclic
resistance is very similar to that found between void ratio and cyclic resistance. This
similarity is logical because, for soils with a limited range of specific gravities, the water
content is nearly directly proportional to the void ratio.
5.3.1.8 The Effect of Liquidity Index
Liquidity index is a parameter used to express the water content of a soil relative to its
Atterberg limits. It is the ratio of the soil’s natural water content minus the plastic limit
to the plasticity index of the soil. Liquidity index is analogous to relative density, with
soils having liquidity indexes close to unity being near the liquid limit and those with
liquidity indexes close to zero being near the plastic limit
From the current study, there appears to be a trend of decreasing cyclic resistance with
increasing liquidity index, as may be seen in Figure 5-9. However, due to the relative
small database, it is difficult to draw any firm conclusions.
8/8/2019 The Effects of Non-Plasticand Plastic Fines on the Liquefaction Of
http://slidepdf.com/reader/full/the-effects-of-non-plasticand-plastic-fines-on-the-liquefaction-of 146/288
132
5.3.2 Results Of Tests Performed At A Constant Fines Content
In order to isolate the effects of fines plasticity on the cyclic resistance of sandy soils, a
series of tests were performed on specimens formed from soils with 17 percent fines. The
composition of the fines was varied to allow for the evaluation of the effects of changing
soil plasticity. These effects were again evaluated using common soil parameters.
5.3.2.1 The Effect Of Clay Content
For soils with 17 percent fine-grained material, no clear correlation may be drawn
regarding the effect of clay content on liquefaction resistance. As may be seen in Figure
5-10, there is a weak trend of decreasing cyclic resistance with increasing clay contents.
Although the scatter make it difficult to draw any firm conclusions, all of the soils tested
with 17 percent fines and clay fractions between 8.5 and 17 percent had lower cyclic
resistances than the soil with non-plastic fines at the same fines content and soil specific
relative density.
5.3.2.2 The Effect Of Liquid Limit
For soils with 17 percent fine-grained material, a correlation may be drawn between the
liquid limit of a soil and its cyclic resistance. As may be seen in Figure 5-11, cyclic
resistance first decreases as liquid limit increases until a liquid limit of approximately 17
percent is reached. For soils with liquid limits greater than 17 percent cyclic resistance
increases with increasing liquid limit. It should be noted that the soil with fines of 17
percent composed of half bentonite and half kaolinite, despite having a liquid limit of 41,
still has a cyclic resistance of only approximately three-quarters that of the soil with 17
percent non-plastic silt.

8/8/2019 The Effects of Non-Plasticand Plastic Fines on the Liquefaction Of
http://slidepdf.com/reader/full/the-effects-of-non-plasticand-plastic-fines-on-the-liquefaction-of 147/288
133
5.3.2.3 The Effect Of Plasticity Index
While the small quantity of data make it difficult to draw firm conclusions about the
effect of plasticity index on cyclic resistance, it may be seen in Figure 5-12 that increased
plasticity index appears to result in an increase in cyclic resistance.
5.3.2.4 The Effect Of Activity
While the small quantity of data make it difficult to draw firm conclusions, increased
activity appears to result in increased cyclic resistances for soils prepared to a constant
fines content, as may be seen in Figure 5-13.
5.3.2.5 The Effect Of Water Content
There is little correlation between the water content of a soil and its cyclic resistance, as
may be seen from Figure 5-14. For specimens with a nearly constant water content of
approximately 24 percent, the cyclic resistance varies from a low of 0.11 to a high of
0.18, an increase of approximately 50 percent.
5.3.2.6 The Effect Of Liquidity Index
While due to a lack of data points it is impossible to draw firm conclusions, an increase in
liquidity index does not appear to appreciably alter the cyclic resistance of a sandy soil
prepared to a constant fines content. This may be seen in Figure 5-15.
5.4 Plasticity Based Liquefaction Criteria
Since the early 1970’s, building codes in the People’s Republic of China have included a
listing of “thresholds to liquefaction” used to separate soils which are considered
liquefiable from those considered non-liquefiable (Jennings, 1980). This criteria,commonly referred to as the Chinese criteria, is based on the observed behavior of soils
during several major earthquakes in the P.R.C. Two of the key focuses of the criteria are
the percentage of “clay” (smaller than 0.005 mm) present and the plasticity index of the

8/8/2019 The Effects of Non-Plasticand Plastic Fines on the Liquefaction Of
http://slidepdf.com/reader/full/the-effects-of-non-plasticand-plastic-fines-on-the-liquefaction-of 148/288

8/8/2019 The Effects of Non-Plasticand Plastic Fines on the Liquefaction Of
http://slidepdf.com/reader/full/the-effects-of-non-plasticand-plastic-fines-on-the-liquefaction-of 149/288

8/8/2019 The Effects of Non-Plasticand Plastic Fines on the Liquefaction Of
http://slidepdf.com/reader/full/the-effects-of-non-plasticand-plastic-fines-on-the-liquefaction-of 150/288
136
clay content. Of the fourteen soils tested, ten would be considered non-liquefiable based
upon this requirement. Of these ten, five were found to be susceptible to flow
liquefaction.
5.4.1.3 Mean Grain Size
The requirement that requires that the mean grain size of the soil be between 0.2 and 1
millimeters in order to be liquefiable does not appear reasonable. All fourteen of the soils
tested met this requirement, and thus would be considered liquefiable under the Chinese
criteria. Of these, however, only nine were found to be susceptible to flow liquefaction.
5.4.1.4 Relative Density
All of the soils tested met this criteria, which requires that the relative density of the soil
be less than 75 percent in order to be liquefiable. Of the fourteen soils tested, all would
be considered liquefiable based upon the Chinese criteria. Of these, five were found to be
susceptible to cyclic mobility.
5.4.1.5 Void Ratio
The requirement that soils with void ratios smaller than 0.8 may be considered non-
liquefiable under the Chinese criteria does not appear valid. As discussed earlier in this
chapter, there appears to be little correlation between liquefaction susceptibility and void
ratio. Of the fourteen soils tested, twelve would be considered non-liquefiable based
upon this requirement. Of these twelve, seven were found to be susceptible to flow
liquefaction.
5.4.2 Seed et al.’s Criteria
Soils meeting the criteria suggested by Seed et al. (1983) include those with clay contents
greater than 15 percent, liquid limits greater than 35 percent, and water contents less than
90 percent of their liquid limit. The details of the evaluation of this criteria are
summarized in Table 5-4 and discussed below.

8/8/2019 The Effects of Non-Plasticand Plastic Fines on the Liquefaction Of
http://slidepdf.com/reader/full/the-effects-of-non-plasticand-plastic-fines-on-the-liquefaction-of 151/288
137
5.4.2.1 Clay Content
The requirement for soils with clay contents greater than 15 percent to be considered
non-liquefiable under this criteria, does not appear infallible. Of the fourteen soils tested,
five would be considered non-liquefiable based upon this requirement. Of these five, one
was found to be susceptible to flow liquefaction, while another was a borderline case.
5.4.2.2 Liquid Limit
The requirement that a soil possess a liquid limit greater than 35 percent in order to be
considered non-liquefiable under this criteria, appears conservative. For the two soils
tested which met this requirement, both underwent cyclic mobility failures. In fact, all of
the soils with liquid limit of 20 or greater were found to be susceptible to cyclic mobility,
rather than flow failures. The soil prepared with 26 percent kaolinite, which has a liquid
limit of 20, appears to be a borderline case.
5.4.2.3 Water Content
The criteria that soils with water contents less than 90 percent of their liquid limits may
be considered non-liquefiable, appears to be valid. Of the fourteen soils tested, three
would be considered non-liquefiable based upon this requirement. All three of these soils
were found to be susceptible to cyclic mobility.
5.4.3 Finn, Ledbetter, and Wu’s Criteria
Finn, Ledbetter, and Wu (1994) recommend that changes to be made to the Chinese
criteria to account for uncertainty and differences in liquid limit determination between
the ASTM and the Chinese standard. They recommend decreasing the fines content to 10
percent, the liquid limit to 34 percent, and the water content to 2 percent less than 90percent of the liquid limit. The details of the evaluation of this criteria are summarized in
Table 5-5 and discussed below.
8/8/2019 The Effects of Non-Plasticand Plastic Fines on the Liquefaction Of
http://slidepdf.com/reader/full/the-effects-of-non-plasticand-plastic-fines-on-the-liquefaction-of 152/288
138
5.4.3.1 Clay Content
As discussed for the Chinese criteria, the requirement that clay contents greater than 10
percent be considered non-liquefiable, does not appear reasonable. This is because there
appears to be little correlation between liquefaction susceptibility and clay content. Of the
fourteen soils tested, ten would be considered non-liquefiable based upon this
requirement. Of these ten, five were found to be susceptible to flow liquefaction.
5.4.3.2 Liquid Limit
Similar to the findings for Seed et al.’s criteria, the requirement that a soil possess a
liquid limit greater than 34 percent in order to be considered non-liquefiable appears
conservative. All of the soils with liquid limits of 20 or greater were found to be
susceptible to cyclic mobility, rather than flow liquefaction.
5.4.3.3 Water Content
The requirement that soils with water contents less than 2 percent below 90 percent of
their liquid limits may be considered non-liquefiable, appears to be valid. Of the fourteen
soils tested, three would be considered non-liquefiable based upon this requirement. All
three of these soils were found to be susceptible to cyclic mobility.
5.4.4 Koester’s Criteria
Koester (1994) recommend that a further change be made to Finn, Ledbetter, and Wu’s
criteria to account for differences in the determination of liquid limit between the ASTM
and the Chinese standard. He recommended increasing the liquid limit to 36 percent. The
details of the evaluation of this criteria are summarized in Table 5-6 and discussed below.
As has been shown for both Seed’s and to Finn, Ledbetter, and Wu’s criteria, the liquid
limit criteria appears to be conservative regardless of whether it is 34, 35, or 36 percent,
therefore this change would not appear to be of any major significance.
8/8/2019 The Effects of Non-Plasticand Plastic Fines on the Liquefaction Of
http://slidepdf.com/reader/full/the-effects-of-non-plasticand-plastic-fines-on-the-liquefaction-of 153/288
139
5.4.5 Implications
Three major implications may be made from this study of the effects of fines content and
plasticity on the liquefaction resistance of sandy soils. The first is that the addition of
plastic fines does not inherently increase the cyclic resistance of a sand. The second is
that the most viable component of the plasticity based liquefaction criteria is the criteria
involving the plasticity of the soil. Lastly, it may not be proper to evaluate the
liquefaction susceptibility of soils with significant amounts of plastic fines using the
commonly used definitions of liquefaction. Each of these implications is discussed
further below.
5.4.5.1 Clayey Sands With Low Plasticity
Loose sandy soils which contain plastic fines but whose plasticity does not meet the
requirements of the plasticity based liquefaction criteria (i.e. LL > 35 or PI >10) may
have cyclic resistances much lower than soils with a comparable percentage of non-
plastic (i.e. silty) fines. The addition of even a few percent of plastic fines mixed in with
the silty fine-grained material may cause the cyclic resistance to decrease by almost two-
thirds where cyclic resistance is measured as the cyclic stress ratio required to causeliquefaction in a given number of cycles. Thus the introduction of plastic fines may in
fact increase the susceptibility of a sand to liquefaction.
These soils are subject to flow liquefaction. Under cyclic loading, these soils initially
show very little straining, however as the pore pressure ratio approaches 100 percent (i.e.
the effective stress approaches zero) these soils will undergo sudden, almost spontaneous,
deformations which may be very large in magnitude.
5.4.5.2 Plasticity Criteria
Several sets of criteria have been proposed for separating liquefiable from non-liquefiable
sands based upon the clay content, soil plasticity, and density of the soil. A review of
8/8/2019 The Effects of Non-Plasticand Plastic Fines on the Liquefaction Of
http://slidepdf.com/reader/full/the-effects-of-non-plasticand-plastic-fines-on-the-liquefaction-of 154/288
140
these criteria has shown that the one parameter which consistently separates soils
susceptible to flow liquefaction from soils that tend to undergo cyclic mobility is the soil
plasticity. Whether measured in terms of plasticity index or liquid limit, soils that meet
some threshold level of plasticity tend to be safe from flow liquefaction failures.
While a threshold plasticity index of 10 seems to be appropriately conservative for
separating soils susceptible to flow liquefaction from soils which tend to undergo cyclic
mobility, the proposed threshold value of 35 for liquid limit may be overly conservative.
Although more study is clearly necessary due to the limited size of the database, this
investigation found that soils with liquid limits above 20 were not susceptible to flow
liquefaction. This may be seen in Figure 5-16, which shows the separation that occurs
between soils susceptible to flow liquefaction and soils susceptible to cyclic mobility
when they are plotted in terms of their Atterberg limits.
Based upon Figure 5-16, a proposed zone of liquefiable soils is indicated on the plasticity
chart shown in Figure 5-17, and includes soils with plasticity indexes less than 10 and
liquid limits less than 35. Although the findings of this study would appear to indicate
that soils with liquid limits greater than 20 percent are safe from flow liquefaction, the
upper bound of the zone was set at a liquid limit of 35 percent for the sake of
conservatism. Soils that plot in this region and contain plastic fines should be tested in
the laboratory to determine their liquefaction susceptibility.
5.4.5.3 Evaluation Of Liquefaction
If evaluated using the commonly used definitions of liquefaction such as initial
liquefaction or induced strain, soils containing plastic fines which meet the plasticity
requirement appear to have cyclic resistances lower than soils with comparable
percentages of non-plastic fines. However, this assessment is not necessarily meaningful,
as these soils are not subject to flow liquefaction.
8/8/2019 The Effects of Non-Plasticand Plastic Fines on the Liquefaction Of
http://slidepdf.com/reader/full/the-effects-of-non-plasticand-plastic-fines-on-the-liquefaction-of 155/288
141
Under cyclic loading, soils meeting the plasticity requirement generate pore pressures,
and thus decreases in effective stress, to the same extent as the soils not meeting the
plasticity requirement, however their deformation characteristics are very different.
Whereas soils not meeting the plasticity requirement are subject to spontaneous, very
large deformations at large pore pressure ratios, soils meeting the plasticity requirement
tend to deform in a gradual manner, straining in both compression and tension as the pore
pressure ratio increases. They never undergo a rapid, large strain, flow condition and in
fact do not undergo any deformation after the cessation of cyclic loading. This behavior
is akin to what people often call “cyclic mobility”.
For these reasons, it does not appear appropriate to define liquefaction for soils meeting
the plasticity criteria in terms of zero effective stress or some level of strain measured in a
lab test. Additionally, this behavior explains why field investigations have routinely
reported these soils do not liquefy during earthquakes. While they may have generated
pore pressures equal to their confining stresses (i.e. undergone initial liquefaction),
because they did not undergo significant deformations or eject sand boils, they left no
evidence of having liquefied.
5.5 A Behavioral Hypothesis
The decrease in cyclic resistance that occurs when small amounts of clay are added to a
sand may have an explanation on a mechanical basis. The decrease in liquefaction
resistance may result from the increased ease of movement among the sand grains
brought on by the presence of the slicker clay particles offsetting the increased resistance
to movement caused by the plasticity of the clay.
When small amounts of clay are added to the sand the clay particles may either adhere to
the surface of the sand particles or be located between the normal sand grain to sand grain
points of contact. Because the clay particles typically have lower friction angles than the
sand, the presence of these particles may make it easier for the sand grains to slide past

8/8/2019 The Effects of Non-Plasticand Plastic Fines on the Liquefaction Of
http://slidepdf.com/reader/full/the-effects-of-non-plasticand-plastic-fines-on-the-liquefaction-of 156/288
142
each other, thus requiring less work to liquefy the soil. This increased ease of movement
may not be compensated for until the soil has enough plasticity to prevent the sand grains
from sliding. This would explain why plasticity based criteria such as the Modified
Chinese criteria require relatively high levels of plasticity.
5.5 Conclusions
Several conclusions regarding the effects of plastic fines on the liquefaction of sandy soils
and the use of plasticity based liquefaction criteria may be drawn from this study.
The addition of even a moderate amount of plastic fines (up to 25 percent) may decrease
the liquefaction resistance of the soil if the fines are of low plasticity. The behavior of
sands with plastic fines appears to be relatively independent of fines content, clay content,
water content, and liquidity index. It is however dependent on the plasticity of the soil
(not just the plasticity of the fines) whether that plasticity is measured in terms of liquid
limit, plasticity index, or activity.
The key factor in the plasticity-based criteria is the requirement for the plasticity of the
soil. If this requirement, whether measured in terms of liquid limit or plasticity index, is
met, the soil does not appear to be susceptible to flow liquefaction. A plasticity index of
10 appears to be a reasonable threshold value, while the liquid limit values in the range of
34 to 36 which have been suggested, appear rather conservative.
The reason that the plasticity based criteria work is that they mirror a change in behavior
in the soil following the onset of initial liquefaction. Soils meeting the criteria tend to
undergo a cyclic mobility form of failure which results only in very small deformations of
the soils mass, while those not meeting the criteria tend to undergo flow liquefaction
which results in very large deformations.
8/8/2019 The Effects of Non-Plasticand Plastic Fines on the Liquefaction Of
http://slidepdf.com/reader/full/the-effects-of-non-plasticand-plastic-fines-on-the-liquefaction-of 157/288
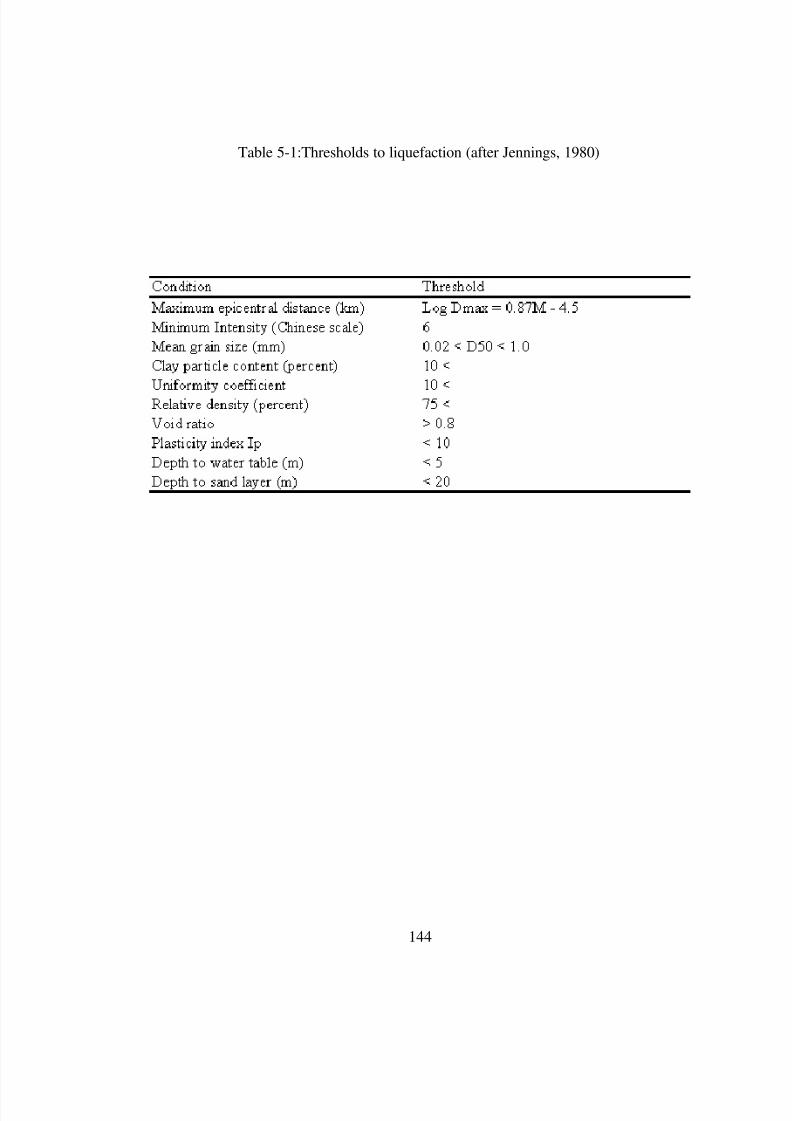
8/8/2019 The Effects of Non-Plasticand Plastic Fines on the Liquefaction Of
http://slidepdf.com/reader/full/the-effects-of-non-plasticand-plastic-fines-on-the-liquefaction-of 158/288

8/8/2019 The Effects of Non-Plasticand Plastic Fines on the Liquefaction Of
http://slidepdf.com/reader/full/the-effects-of-non-plasticand-plastic-fines-on-the-liquefaction-of 159/288
145
Table 5-2: Proposed modifications to the Chinese criteria

8/8/2019 The Effects of Non-Plasticand Plastic Fines on the Liquefaction Of
http://slidepdf.com/reader/full/the-effects-of-non-plasticand-plastic-fines-on-the-liquefaction-of 160/288
146
Table 5-3: Evaluation of the Chinese criteria
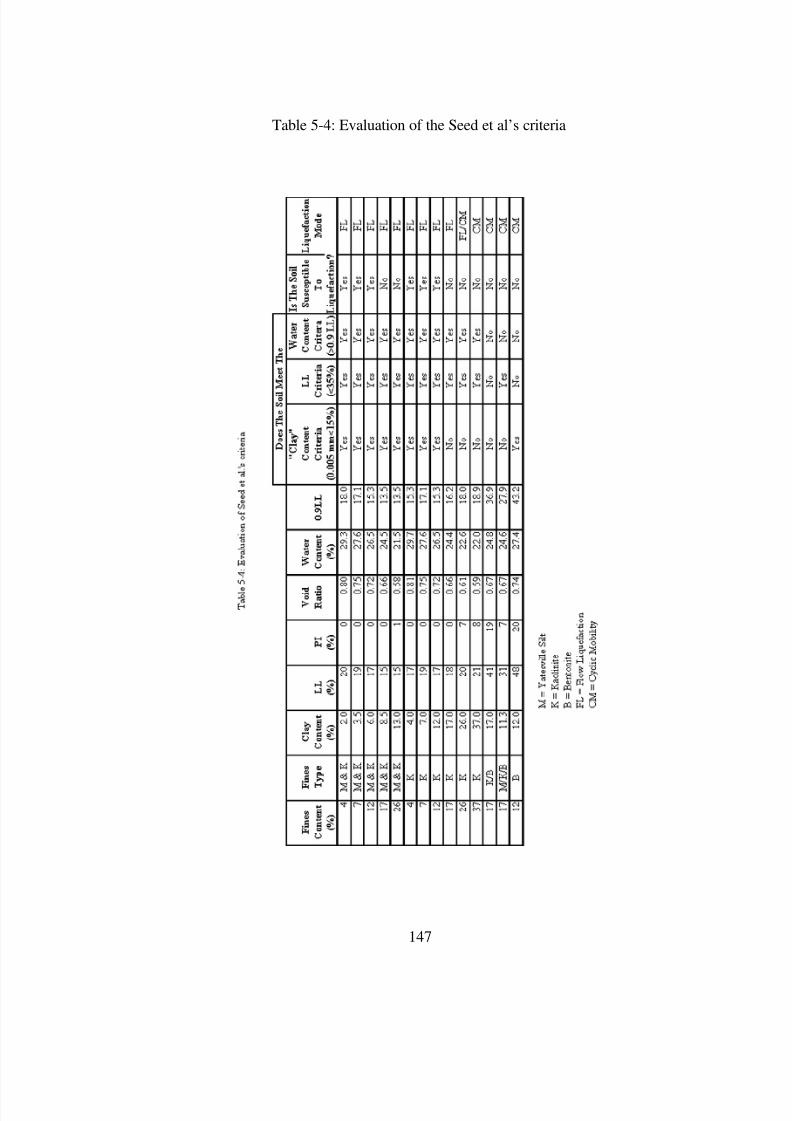
8/8/2019 The Effects of Non-Plasticand Plastic Fines on the Liquefaction Of
http://slidepdf.com/reader/full/the-effects-of-non-plasticand-plastic-fines-on-the-liquefaction-of 161/288
147
Table 5-4: Evaluation of the Seed et al’s criteria

8/8/2019 The Effects of Non-Plasticand Plastic Fines on the Liquefaction Of
http://slidepdf.com/reader/full/the-effects-of-non-plasticand-plastic-fines-on-the-liquefaction-of 162/288
148
Table 5-5: Evaluation of the Finn et al’s criteria
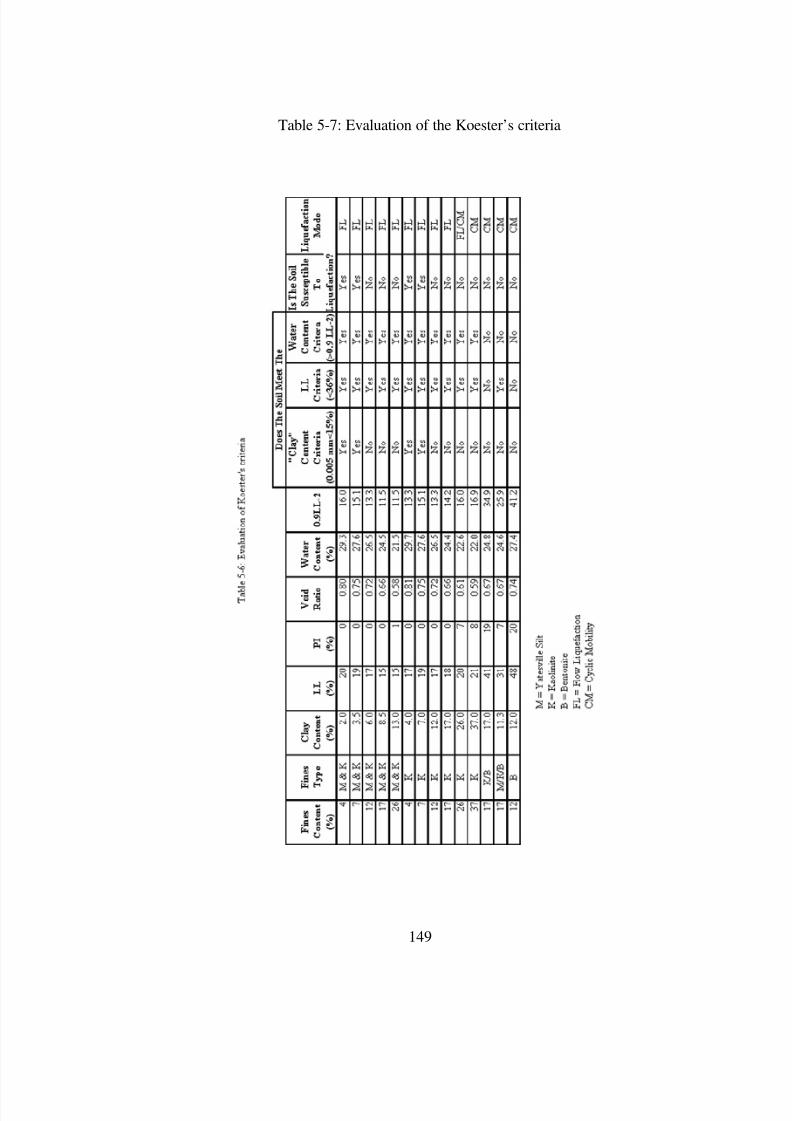
8/8/2019 The Effects of Non-Plasticand Plastic Fines on the Liquefaction Of
http://slidepdf.com/reader/full/the-effects-of-non-plasticand-plastic-fines-on-the-liquefaction-of 163/288
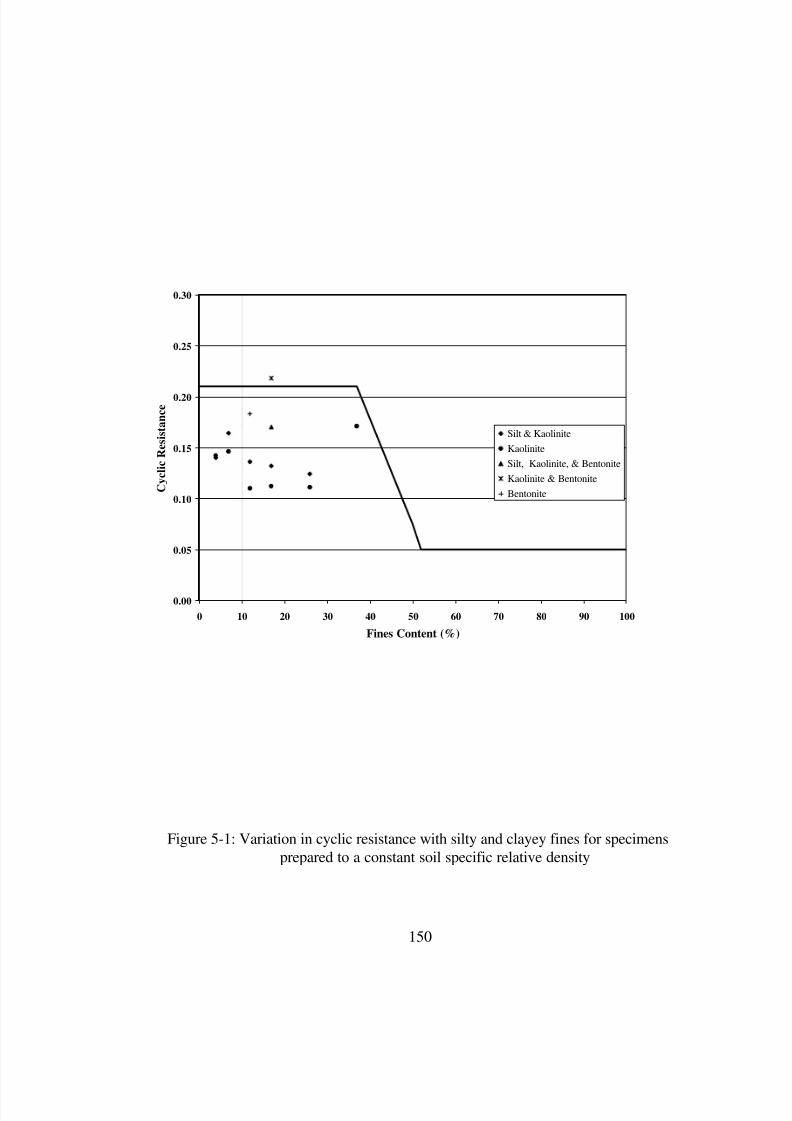
8/8/2019 The Effects of Non-Plasticand Plastic Fines on the Liquefaction Of
http://slidepdf.com/reader/full/the-effects-of-non-plasticand-plastic-fines-on-the-liquefaction-of 164/288
150
Figure 5-1: Variation in cyclic resistance with silty and clayey fines for specimens
prepared to a constant soil specific relative density
0.00
0.05
0.10
0.15
0.20
0.25
0.30
0 10 20 30 40 50 60 70 80 90 100
Fines Content (%)
C y c l i c R e s i s t a n c e
Silt & Kaolinite
Kaolinite
Silt, Kaolinite, & Bentonite
Kaolinite & Bentonite
Bentonite
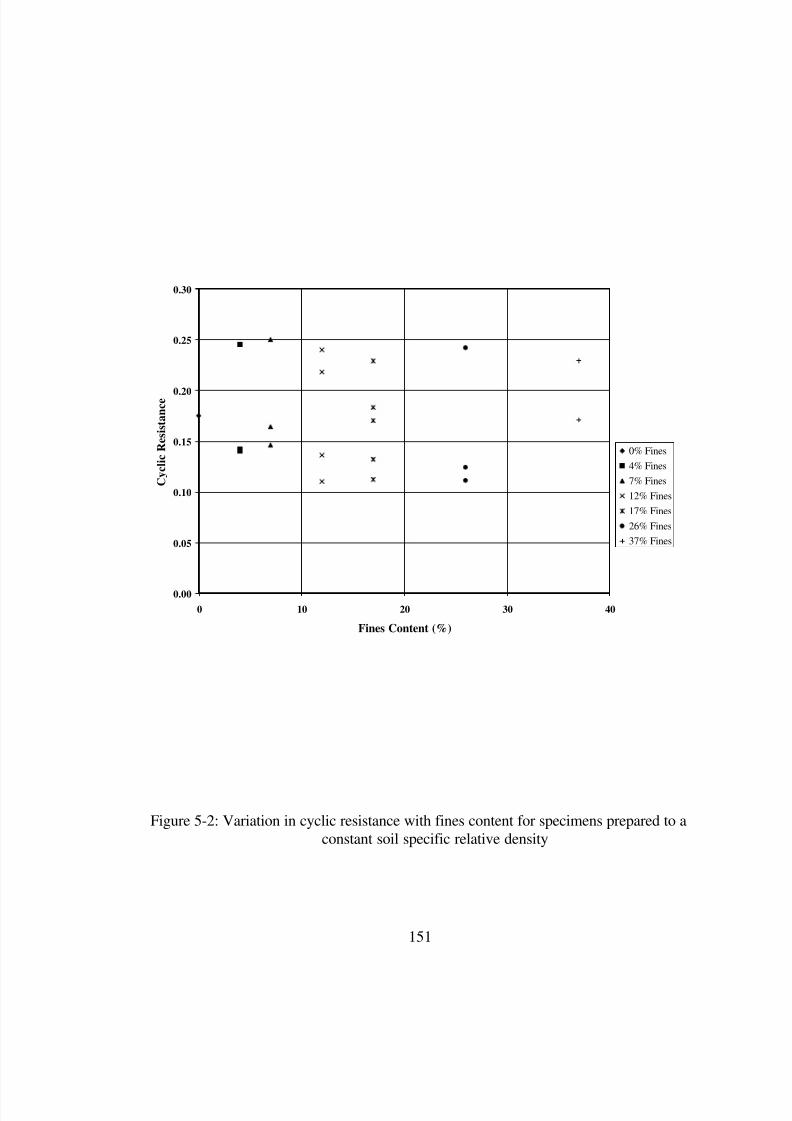
8/8/2019 The Effects of Non-Plasticand Plastic Fines on the Liquefaction Of
http://slidepdf.com/reader/full/the-effects-of-non-plasticand-plastic-fines-on-the-liquefaction-of 165/288

8/8/2019 The Effects of Non-Plasticand Plastic Fines on the Liquefaction Of
http://slidepdf.com/reader/full/the-effects-of-non-plasticand-plastic-fines-on-the-liquefaction-of 166/288
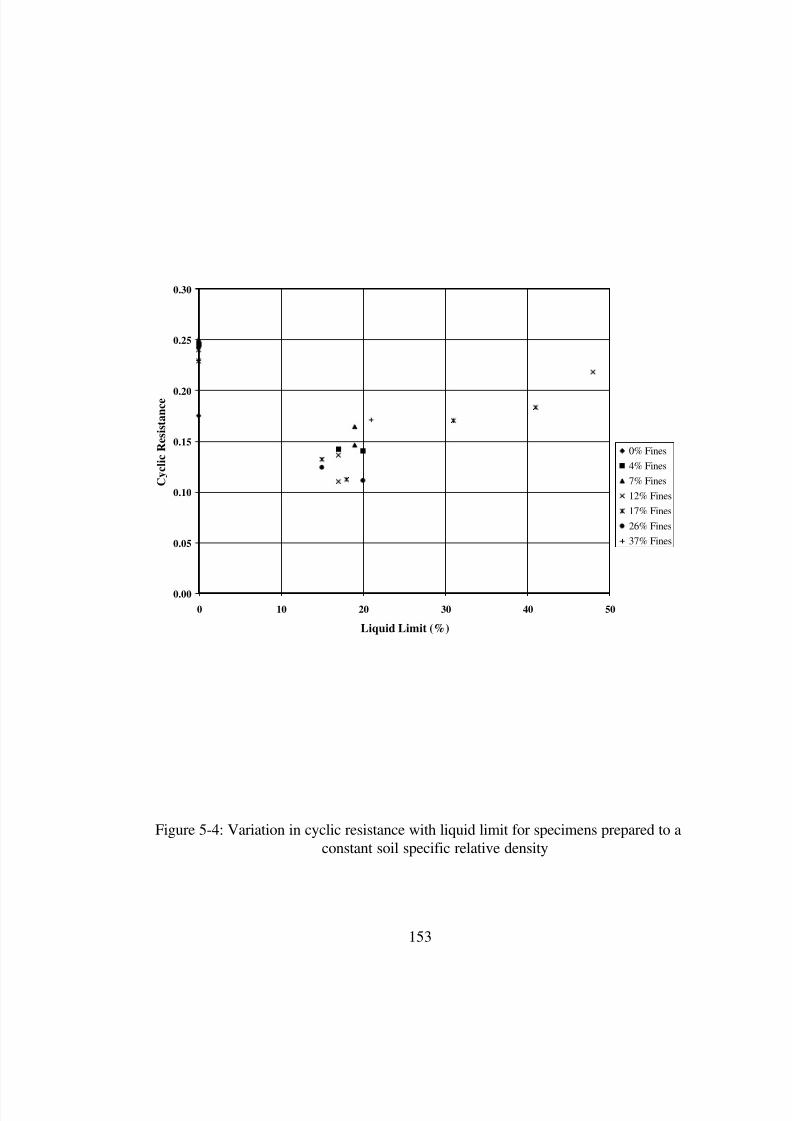
8/8/2019 The Effects of Non-Plasticand Plastic Fines on the Liquefaction Of
http://slidepdf.com/reader/full/the-effects-of-non-plasticand-plastic-fines-on-the-liquefaction-of 167/288

8/8/2019 The Effects of Non-Plasticand Plastic Fines on the Liquefaction Of
http://slidepdf.com/reader/full/the-effects-of-non-plasticand-plastic-fines-on-the-liquefaction-of 168/288
154
Figure 5-5: Variation in cyclic resistance with plasticity index for specimens prepared to a
constant soil specific relative density
0.00
0.05
0.10
0.15
0.20
0.25
0.30
0 5 10 15 20 25
Plasticity Index (%)
C y c l i c R e s i s t a n c e
0% Fines
4% Fines
7% Fines
12% Fines
17% Fines
26% Fines
37% Fines

8/8/2019 The Effects of Non-Plasticand Plastic Fines on the Liquefaction Of
http://slidepdf.com/reader/full/the-effects-of-non-plasticand-plastic-fines-on-the-liquefaction-of 169/288

8/8/2019 The Effects of Non-Plasticand Plastic Fines on the Liquefaction Of
http://slidepdf.com/reader/full/the-effects-of-non-plasticand-plastic-fines-on-the-liquefaction-of 170/288

8/8/2019 The Effects of Non-Plasticand Plastic Fines on the Liquefaction Of
http://slidepdf.com/reader/full/the-effects-of-non-plasticand-plastic-fines-on-the-liquefaction-of 171/288

8/8/2019 The Effects of Non-Plasticand Plastic Fines on the Liquefaction Of
http://slidepdf.com/reader/full/the-effects-of-non-plasticand-plastic-fines-on-the-liquefaction-of 172/288

8/8/2019 The Effects of Non-Plasticand Plastic Fines on the Liquefaction Of
http://slidepdf.com/reader/full/the-effects-of-non-plasticand-plastic-fines-on-the-liquefaction-of 173/288
159
Figure 5-10: Variation in cyclic resistance with clay content for specimens prepared to a
constant fines content
0.00
0.05
0.10
0.15
0.20
0.25
0.30
0 5 10 15 20
Clay Content (%)
C y c l i c R e s i s t a n c e
Silt
Silt & Kaolinite
Kaolinite
Silt, Kaolinite,& Bentonite
Kaolinite &
Bentonite

8/8/2019 The Effects of Non-Plasticand Plastic Fines on the Liquefaction Of
http://slidepdf.com/reader/full/the-effects-of-non-plasticand-plastic-fines-on-the-liquefaction-of 174/288

8/8/2019 The Effects of Non-Plasticand Plastic Fines on the Liquefaction Of
http://slidepdf.com/reader/full/the-effects-of-non-plasticand-plastic-fines-on-the-liquefaction-of 175/288

8/8/2019 The Effects of Non-Plasticand Plastic Fines on the Liquefaction Of
http://slidepdf.com/reader/full/the-effects-of-non-plasticand-plastic-fines-on-the-liquefaction-of 176/288

8/8/2019 The Effects of Non-Plasticand Plastic Fines on the Liquefaction Of
http://slidepdf.com/reader/full/the-effects-of-non-plasticand-plastic-fines-on-the-liquefaction-of 177/288
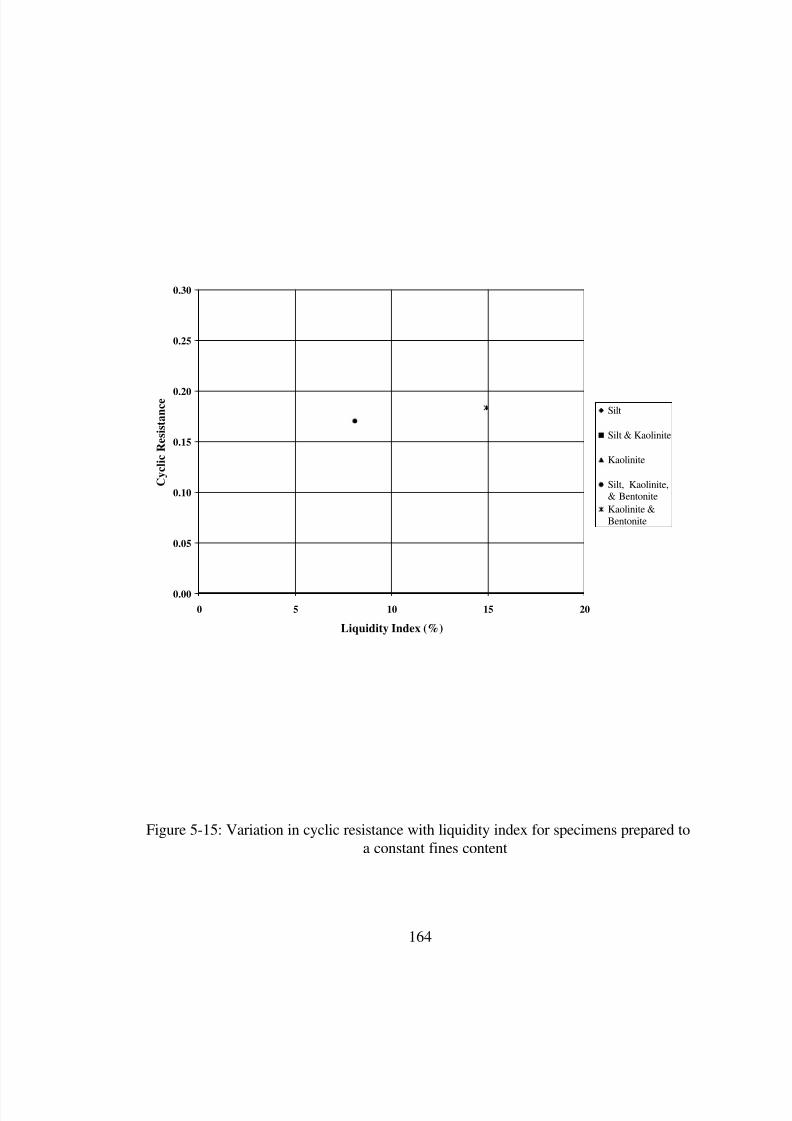
8/8/2019 The Effects of Non-Plasticand Plastic Fines on the Liquefaction Of
http://slidepdf.com/reader/full/the-effects-of-non-plasticand-plastic-fines-on-the-liquefaction-of 178/288
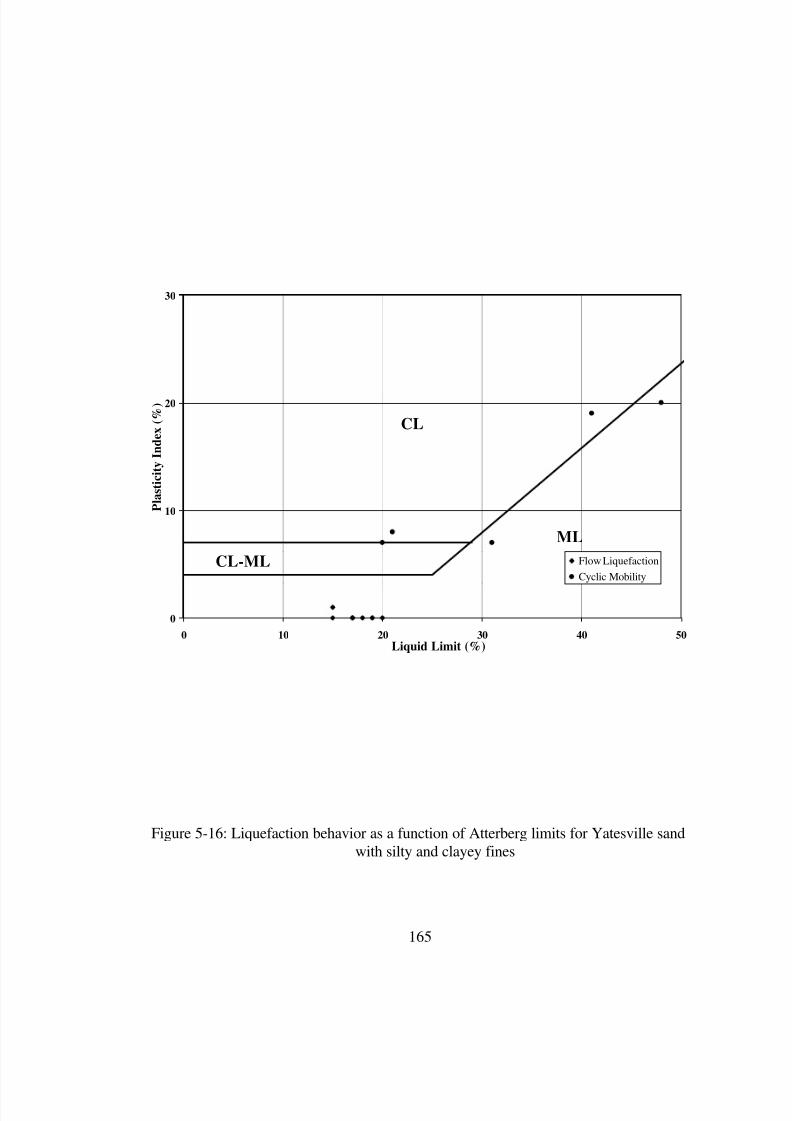
8/8/2019 The Effects of Non-Plasticand Plastic Fines on the Liquefaction Of
http://slidepdf.com/reader/full/the-effects-of-non-plasticand-plastic-fines-on-the-liquefaction-of 179/288
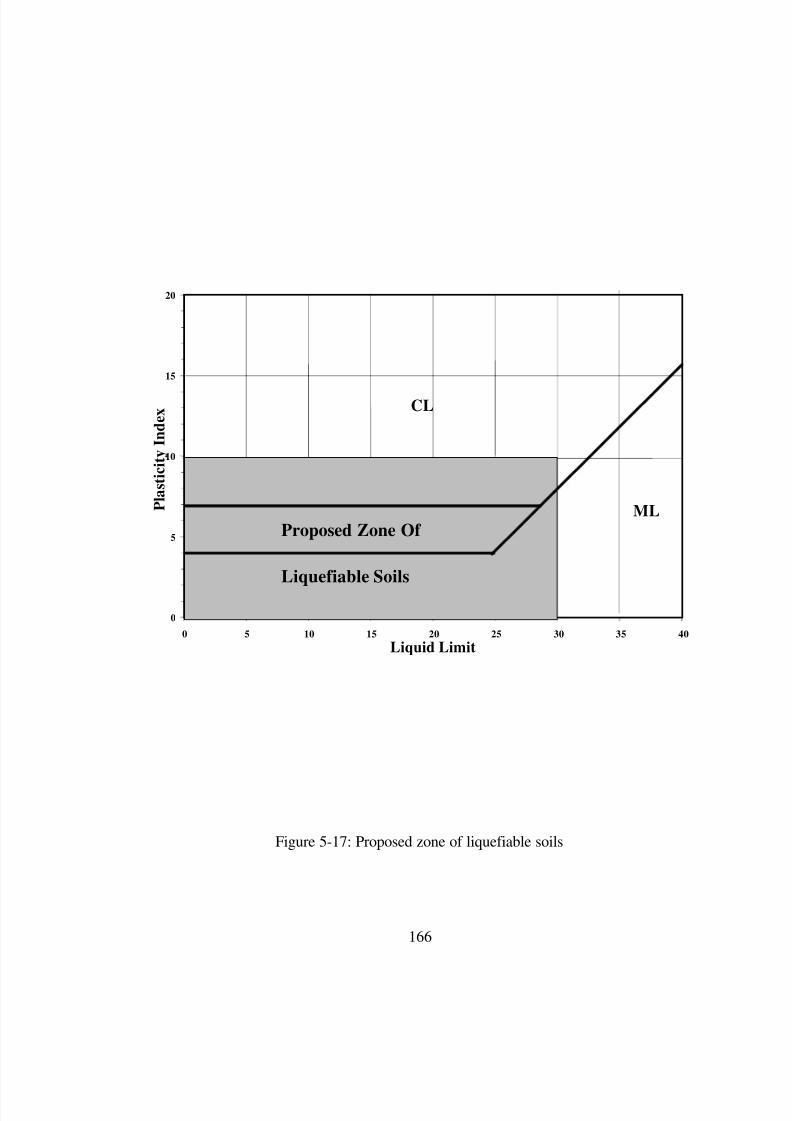
8/8/2019 The Effects of Non-Plasticand Plastic Fines on the Liquefaction Of
http://slidepdf.com/reader/full/the-effects-of-non-plasticand-plastic-fines-on-the-liquefaction-of 180/288
8/8/2019 The Effects of Non-Plasticand Plastic Fines on the Liquefaction Of
http://slidepdf.com/reader/full/the-effects-of-non-plasticand-plastic-fines-on-the-liquefaction-of 181/288

8/8/2019 The Effects of Non-Plasticand Plastic Fines on the Liquefaction Of
http://slidepdf.com/reader/full/the-effects-of-non-plasticand-plastic-fines-on-the-liquefaction-of 182/288
8/8/2019 The Effects of Non-Plasticand Plastic Fines on the Liquefaction Of
http://slidepdf.com/reader/full/the-effects-of-non-plasticand-plastic-fines-on-the-liquefaction-of 183/288

8/8/2019 The Effects of Non-Plasticand Plastic Fines on the Liquefaction Of
http://slidepdf.com/reader/full/the-effects-of-non-plasticand-plastic-fines-on-the-liquefaction-of 184/288

8/8/2019 The Effects of Non-Plasticand Plastic Fines on the Liquefaction Of
http://slidepdf.com/reader/full/the-effects-of-non-plasticand-plastic-fines-on-the-liquefaction-of 185/288
171
6.2 Pore Pressure Development As A Function Of Strain
Dobry et al (1982) examined of pore pressure generation during undrained cyclic loading
as a function of shear strain. They found, that for a constant number of loading cycles to a
constant shear strain, the relationship between pore pressure generation and shear strain is
essentially identical over a wide range of relative densities. Additionally, they found that
pore pressure do not begin to increase until some level of cyclic strain, deemed the
threshold strain, is reached.
While no constant strain tests were run during this study, the data was examined to see
what strain levels were required to achieve one percent and seventy percent residual pore
pressure ratios and how the presence of non-plastic and plastic fines affected these
strains. Residual pore pressure ratio is the pore pressure ratio calculated at the end of a
cycle or a half cycle when the deviator stress (and hence the applied shear stress) is equal
to zero.
6.2.1 Clean Sands and Soils with Non-Plastic Fines
The amount of axial strain required to reach residual pore pressure ratios of one andseventy percent were measured for both clean Yatesville and Monterey sands and
Yatesville and Monterey sands with silt . Unlike the loading ratio method used in the
previous section, the strain-based method seem to be independent of the liquefaction
mode of the specimen, whether it is flow liquefaction and cyclic mobility.
6.2.2.1 Effect Of Fines Content
The amount of axial strain required to achieve a residual pore pressure ratio of one
percent is independent of silt content as may be seen in Figure 6-11. While the data
presented in Figure 6-11 is for Yatesville sand with silt, Monterey sand and silt show a
similar distribution. Additionally, when examined at a residual pore pressure ratio of
seventy percent, the strain level is again independent of the silt content.

8/8/2019 The Effects of Non-Plasticand Plastic Fines on the Liquefaction Of
http://slidepdf.com/reader/full/the-effects-of-non-plasticand-plastic-fines-on-the-liquefaction-of 186/288
8/8/2019 The Effects of Non-Plasticand Plastic Fines on the Liquefaction Of
http://slidepdf.com/reader/full/the-effects-of-non-plasticand-plastic-fines-on-the-liquefaction-of 187/288
8/8/2019 The Effects of Non-Plasticand Plastic Fines on the Liquefaction Of
http://slidepdf.com/reader/full/the-effects-of-non-plasticand-plastic-fines-on-the-liquefaction-of 188/288

8/8/2019 The Effects of Non-Plasticand Plastic Fines on the Liquefaction Of
http://slidepdf.com/reader/full/the-effects-of-non-plasticand-plastic-fines-on-the-liquefaction-of 189/288

8/8/2019 The Effects of Non-Plasticand Plastic Fines on the Liquefaction Of
http://slidepdf.com/reader/full/the-effects-of-non-plasticand-plastic-fines-on-the-liquefaction-of 190/288

8/8/2019 The Effects of Non-Plasticand Plastic Fines on the Liquefaction Of
http://slidepdf.com/reader/full/the-effects-of-non-plasticand-plastic-fines-on-the-liquefaction-of 191/288
177
done by entering the chart at the point corresponding to the ratio of the number of cycles
in the design earthquake to the number of cycles required to liquefy the soil, moving up to
the average pore pressure generation curve, and determining the corresponding pore
pressure ratio.
When evaluated in terms of the strain required to reach some level of residual pore
pressure ratio, where the residual pore pressure ratio is the pore pressure ratio measured
during the point of zero deviator stress, behavior for soils with non-plastic fines is
governed by the soil’s silt content relative to the limiting silt content.
For soils with non-plastic fines below the limiting silt content, the strain required to
generate pore pressures is related to soil specific relative density and the pore pressure
level. For one percent residual pore pressure ratio, the strain required increases with
increasing soil specific relative density. Conversely, for seventy percent residual pore
pressure ratio, the strain required decreases with increasing soil specific relative density.
For soils with non-plastic fines above the limiting silt content the strain required to
generate pore pressures is related to void ratio of the silt fraction. For both one percent
and seventy percent residual pore pressure ratio, the strain required decreases with
increasing void ratio of the silt fraction.
When analyzed in terms of the strain required to achieve a specified level of residual pore
pressure ratio, pore pressure generation in sands with plastic fines is independent of fines
content and clay content. The strain required increases with increasing liquid limit,
plasticity index, and activity.

8/8/2019 The Effects of Non-Plasticand Plastic Fines on the Liquefaction Of
http://slidepdf.com/reader/full/the-effects-of-non-plasticand-plastic-fines-on-the-liquefaction-of 192/288

8/8/2019 The Effects of Non-Plasticand Plastic Fines on the Liquefaction Of
http://slidepdf.com/reader/full/the-effects-of-non-plasticand-plastic-fines-on-the-liquefaction-of 193/288
179
Figure 6-2: Pore pressure generation as a function of loading ratio for specimens of
Yatesville sand susceptible to flow liquefaction
0.0
0.1
0.2
0.3
0.4
0.5
0.6
0.7
0.8
0.9
1.0
0.0 0.2 0.4 0.6 0.8 1.0
Cycle/Cycles to Initial Liquefaction
P o r e P r e s s u r e R a t i o ,
R ue = 0.90
e = 1.05
e = 1.15

8/8/2019 The Effects of Non-Plasticand Plastic Fines on the Liquefaction Of
http://slidepdf.com/reader/full/the-effects-of-non-plasticand-plastic-fines-on-the-liquefaction-of 194/288

8/8/2019 The Effects of Non-Plasticand Plastic Fines on the Liquefaction Of
http://slidepdf.com/reader/full/the-effects-of-non-plasticand-plastic-fines-on-the-liquefaction-of 195/288
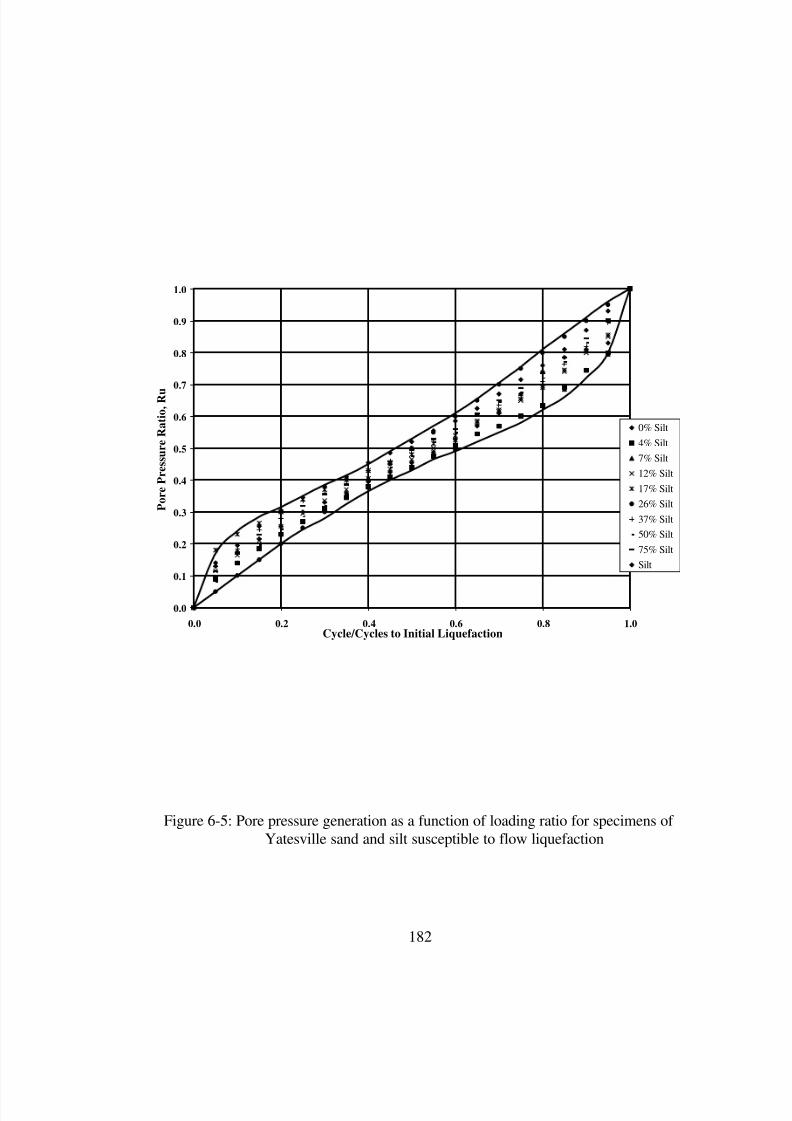
8/8/2019 The Effects of Non-Plasticand Plastic Fines on the Liquefaction Of
http://slidepdf.com/reader/full/the-effects-of-non-plasticand-plastic-fines-on-the-liquefaction-of 196/288

8/8/2019 The Effects of Non-Plasticand Plastic Fines on the Liquefaction Of
http://slidepdf.com/reader/full/the-effects-of-non-plasticand-plastic-fines-on-the-liquefaction-of 197/288
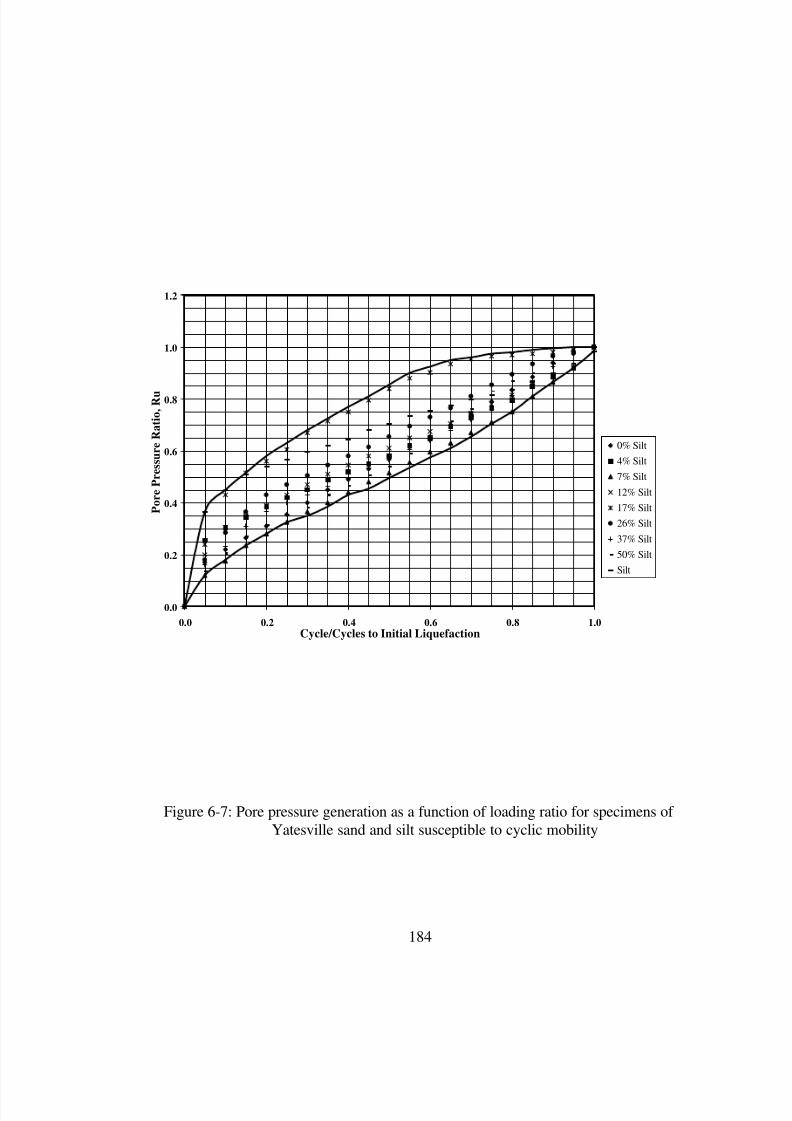
8/8/2019 The Effects of Non-Plasticand Plastic Fines on the Liquefaction Of
http://slidepdf.com/reader/full/the-effects-of-non-plasticand-plastic-fines-on-the-liquefaction-of 198/288
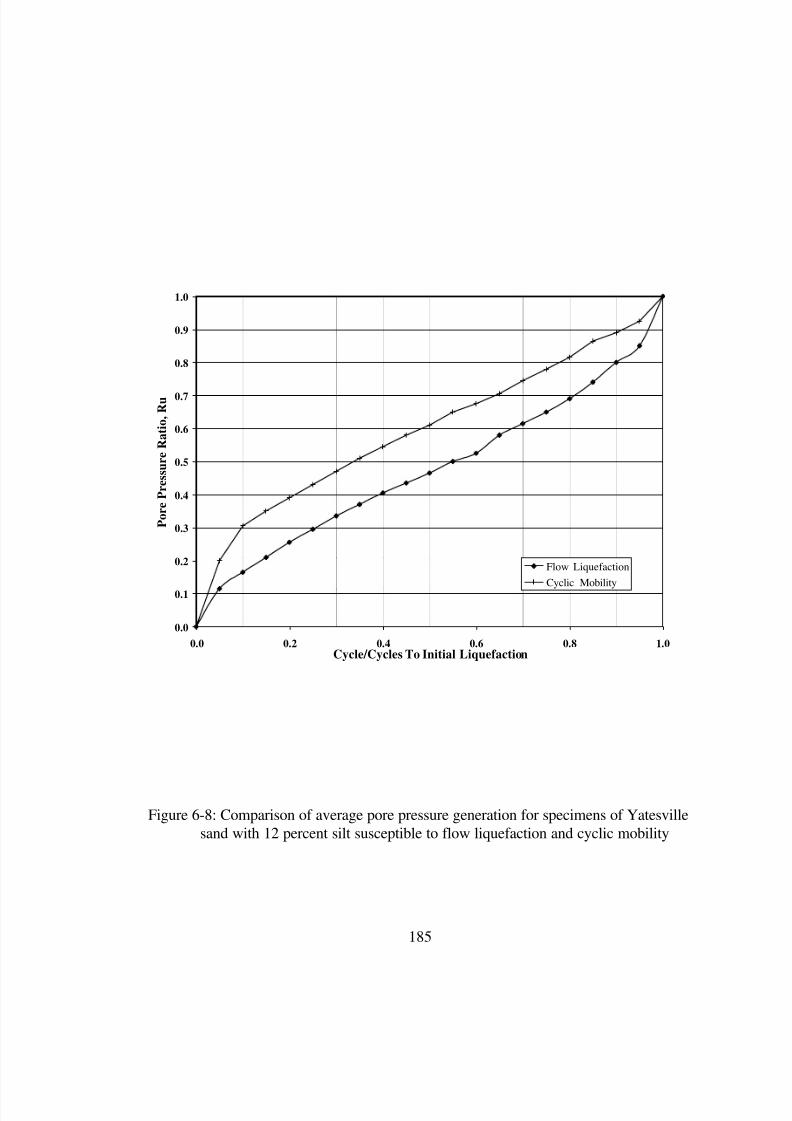
8/8/2019 The Effects of Non-Plasticand Plastic Fines on the Liquefaction Of
http://slidepdf.com/reader/full/the-effects-of-non-plasticand-plastic-fines-on-the-liquefaction-of 199/288
185
Figure 6-8: Comparison of average pore pressure generation for specimens of Yatesville
sand with 12 percent silt susceptible to flow liquefaction and cyclic mobility
0.0
0.1
0.2
0.3
0.4
0.5
0.6
0.7
0.8
0.9
1.0
0.0 0.2 0.4 0.6 0.8 1.0Cycle/Cycles To Initial Liquefaction
P o r e P r e s s u r e R a t i o ,
R u
Flow Liquefaction
Cyclic Mobility
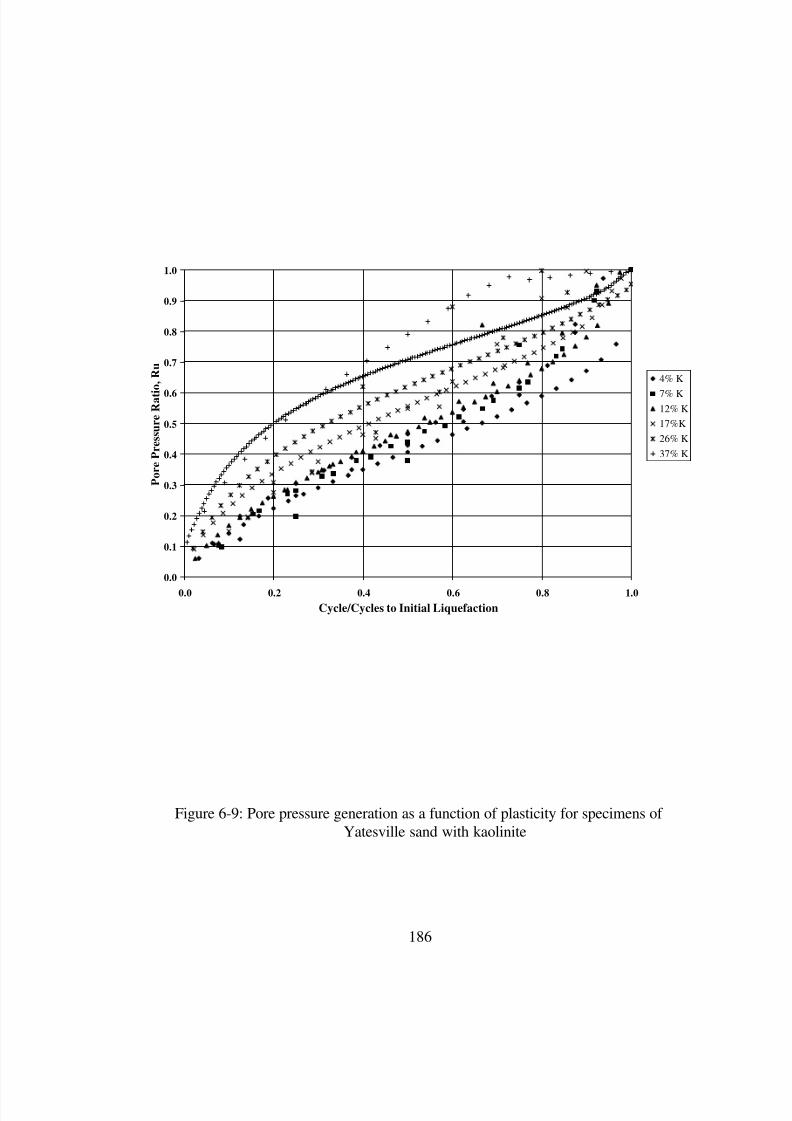
8/8/2019 The Effects of Non-Plasticand Plastic Fines on the Liquefaction Of
http://slidepdf.com/reader/full/the-effects-of-non-plasticand-plastic-fines-on-the-liquefaction-of 200/288
186
0.0
0.1
0.2
0.3
0.4
0.5
0.6
0.7
0.8
0.9
1.0
0.0 0.2 0.4 0.6 0.8 1.0
Cycle/Cycles to Initial Liquefaction
P o r e P r e s s u r e R a t i
o ,
R u
4% K
7% K
12% K
17%K
26% K
37% K
Figure 6-9: Pore pressure generation as a function of plasticity for specimens of
Yatesville sand with kaolinite
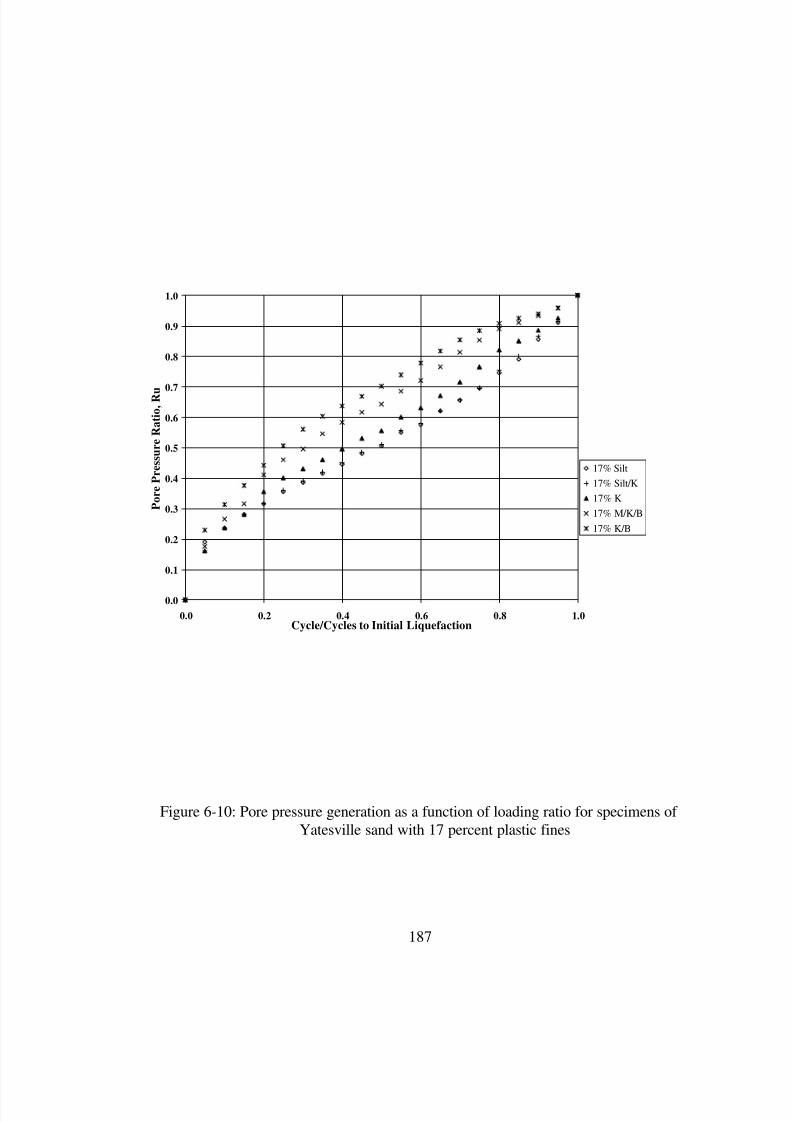
8/8/2019 The Effects of Non-Plasticand Plastic Fines on the Liquefaction Of
http://slidepdf.com/reader/full/the-effects-of-non-plasticand-plastic-fines-on-the-liquefaction-of 201/288
187
Figure 6-10: Pore pressure generation as a function of loading ratio for specimens of
Yatesville sand with 17 percent plastic fines
0.0
0.1
0.2
0.3
0.4
0.5
0.6
0.7
0.8
0.9
1.0
0.0 0.2 0.4 0.6 0.8 1.0Cycle/Cycles to Initial Liquefaction
P o r e P r e s s u r e R a t i o ,
R u
17% Silt
17% Silt/K
17% K
17% M/K/B
17% K/B

8/8/2019 The Effects of Non-Plasticand Plastic Fines on the Liquefaction Of
http://slidepdf.com/reader/full/the-effects-of-non-plasticand-plastic-fines-on-the-liquefaction-of 202/288
188
Figure 6-11: Effect of silt content on the strain required to achieve one percent residual
pore pressure ratio for specimens of Yatesville sand with silt
0.00
0.05
0.10
0.15
0.20
0 20 40 60 80 100
Silt Content (%)
S t r a i n T o 1 % P
o r e P r e s s u r e R a t i o ( % )
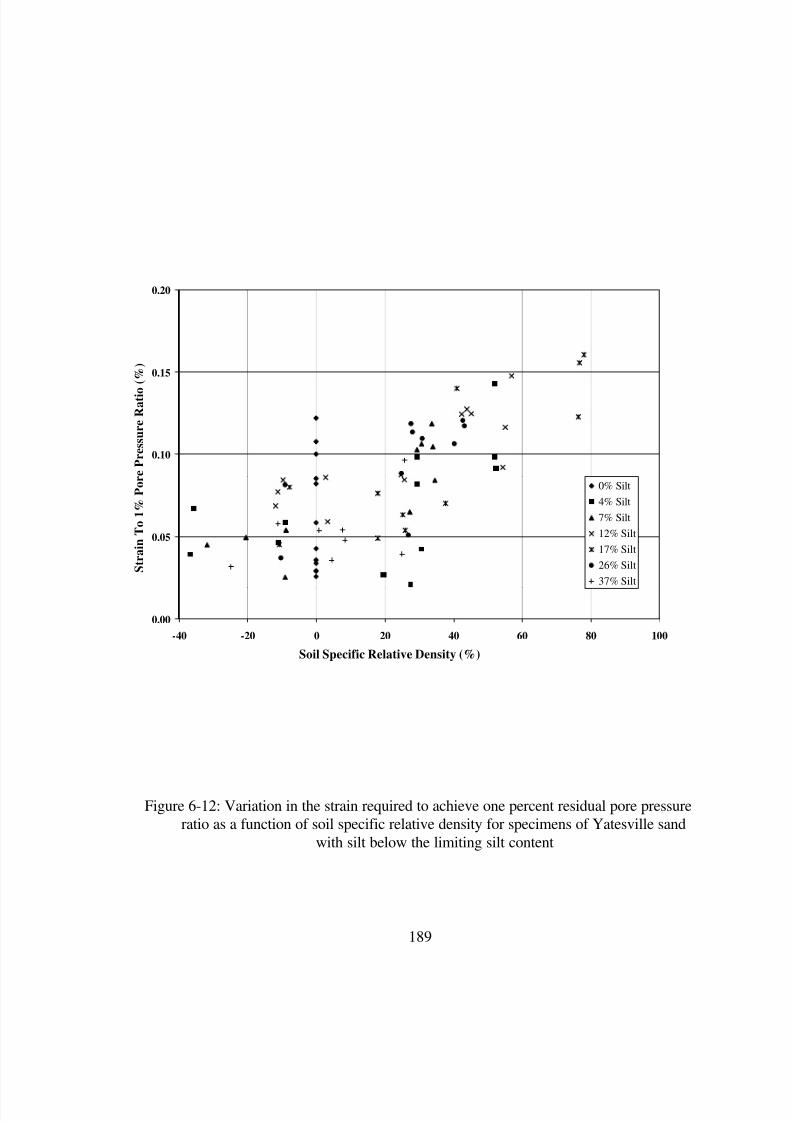
8/8/2019 The Effects of Non-Plasticand Plastic Fines on the Liquefaction Of
http://slidepdf.com/reader/full/the-effects-of-non-plasticand-plastic-fines-on-the-liquefaction-of 203/288
189
Figure 6-12: Variation in the strain required to achieve one percent residual pore pressure
ratio as a function of soil specific relative density for specimens of Yatesville sand
with silt below the limiting silt content
0.00
0.05
0.10
0.15
0.20
-40 -20 0 20 40 60 80 100
Soil Specific Relative Density (%)
S t r a i n T o 1 % P
o r e P r e s s u r e R a t i o
( % )
0% Silt
4% Silt
7% Silt
12% Silt
17% Silt
26% Silt
37% Silt

8/8/2019 The Effects of Non-Plasticand Plastic Fines on the Liquefaction Of
http://slidepdf.com/reader/full/the-effects-of-non-plasticand-plastic-fines-on-the-liquefaction-of 204/288
190
Figure 6-13: Variation in the strain required to achieve one percent residual pore pressure
ratio as a function of the silt fraction void ratio for specimens of Yatesville sand with
silt above the limiting silt content
0.00
0.05
0.10
0.15
0.20
0.5 1.0 1.5 2.0
Silt Fraction Void Ratio
S t r
a i n T o 1 % P
o r e P r e s s u r e R a t i o ( % )
50% Silt
75% Silt
100% Silt
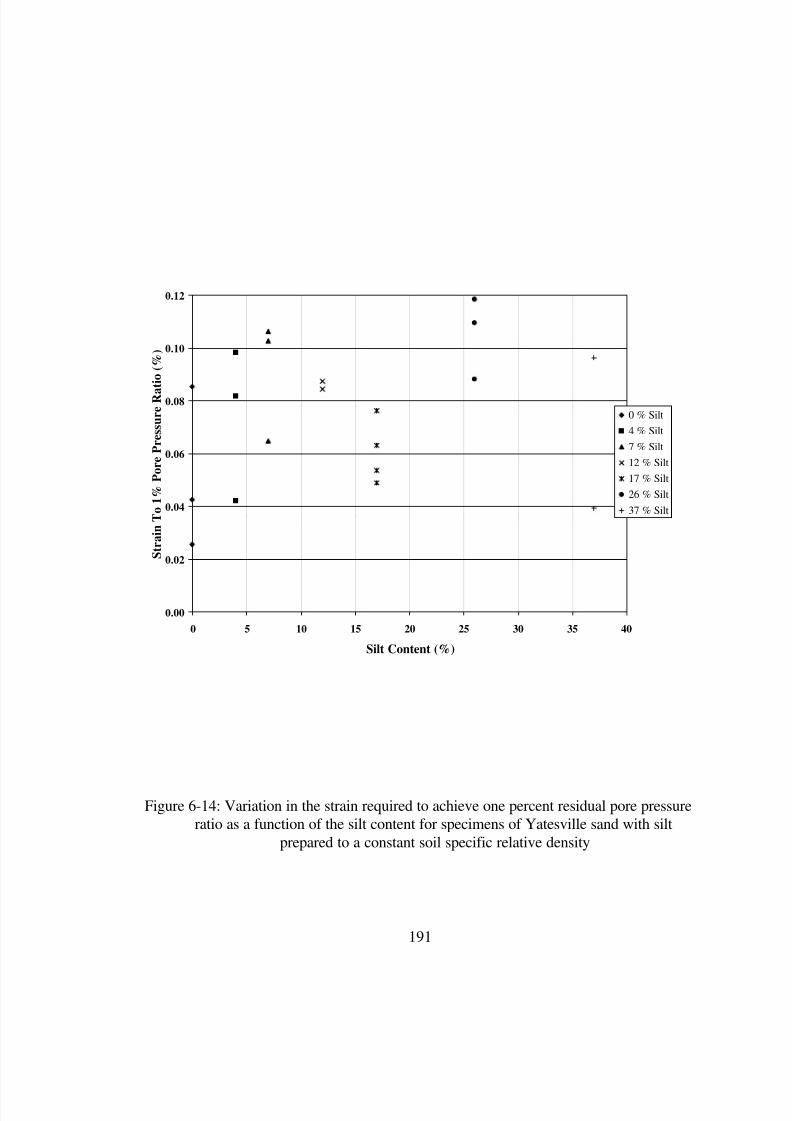
8/8/2019 The Effects of Non-Plasticand Plastic Fines on the Liquefaction Of
http://slidepdf.com/reader/full/the-effects-of-non-plasticand-plastic-fines-on-the-liquefaction-of 205/288
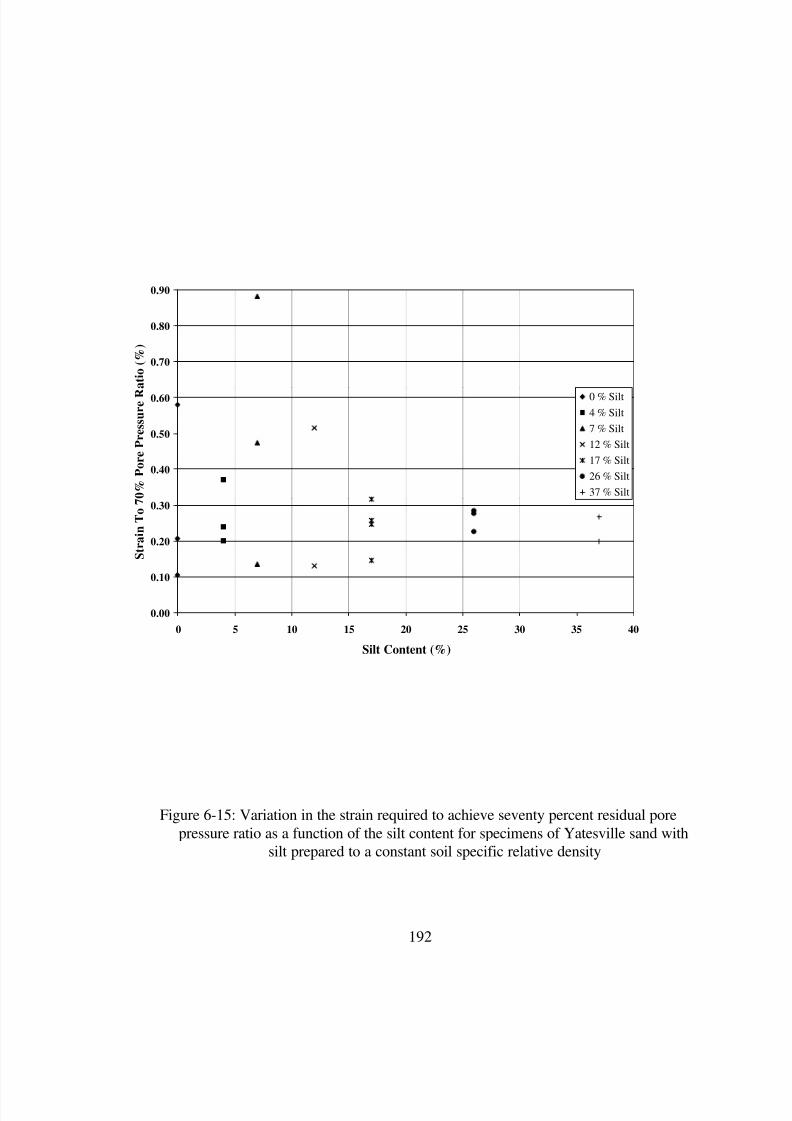
8/8/2019 The Effects of Non-Plasticand Plastic Fines on the Liquefaction Of
http://slidepdf.com/reader/full/the-effects-of-non-plasticand-plastic-fines-on-the-liquefaction-of 206/288
192
Figure 6-15: Variation in the strain required to achieve seventy percent residual pore
pressure ratio as a function of the silt content for specimens of Yatesville sand with
silt prepared to a constant soil specific relative density
0.00
0.10
0.20
0.30
0.40
0.50
0.60
0.70
0.80
0.90
0 5 10 15 20 25 30 35 40
Silt Content (%)
S t r a i n T o 7 0 % P
o r e P r e s s u r e R
a t i o ( % )
0 % Silt
4 % Silt
7 % Silt
12 % Silt
17 % Silt
26 % Silt
37 % Silt
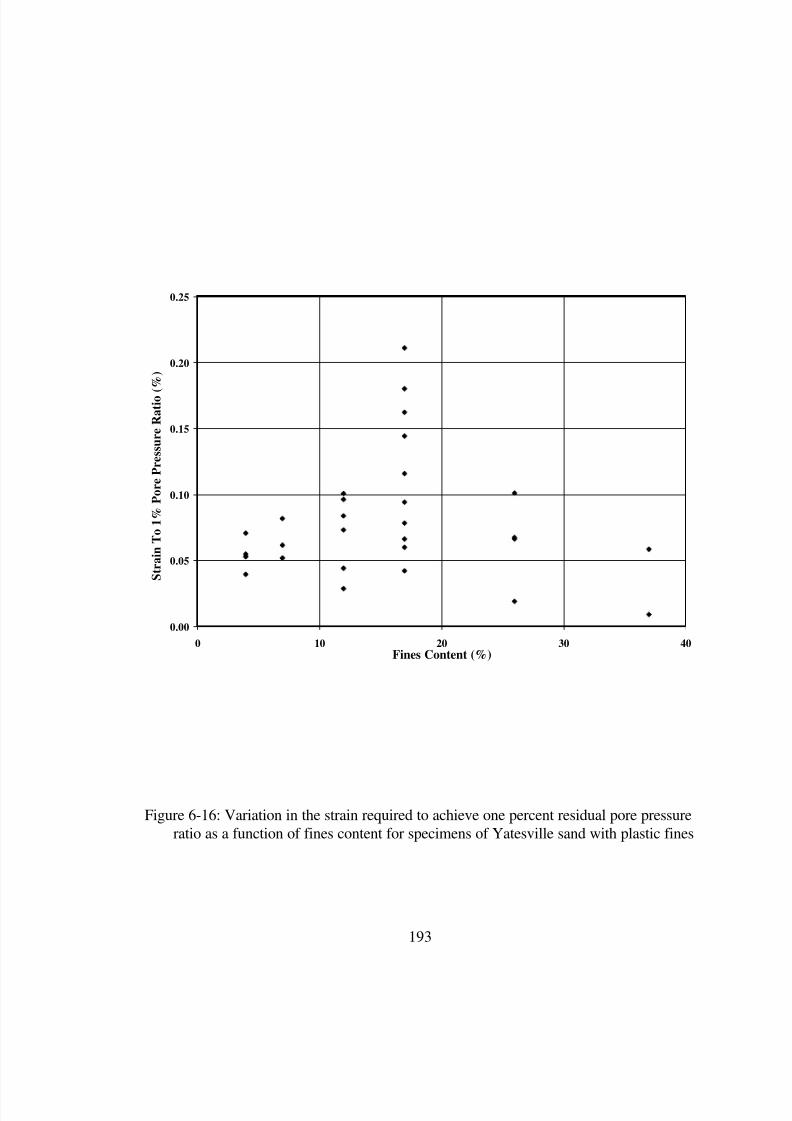
8/8/2019 The Effects of Non-Plasticand Plastic Fines on the Liquefaction Of
http://slidepdf.com/reader/full/the-effects-of-non-plasticand-plastic-fines-on-the-liquefaction-of 207/288
193
Figure 6-16: Variation in the strain required to achieve one percent residual pore pressure
ratio as a function of fines content for specimens of Yatesville sand with plastic fines
0.00
0.05
0.10
0.15
0.20
0.25
0 10 20 30 40Fines Content (%)
S t r a i n T o 1 % P
o r e P r e s s u r e R a t i o ( % )

8/8/2019 The Effects of Non-Plasticand Plastic Fines on the Liquefaction Of
http://slidepdf.com/reader/full/the-effects-of-non-plasticand-plastic-fines-on-the-liquefaction-of 208/288
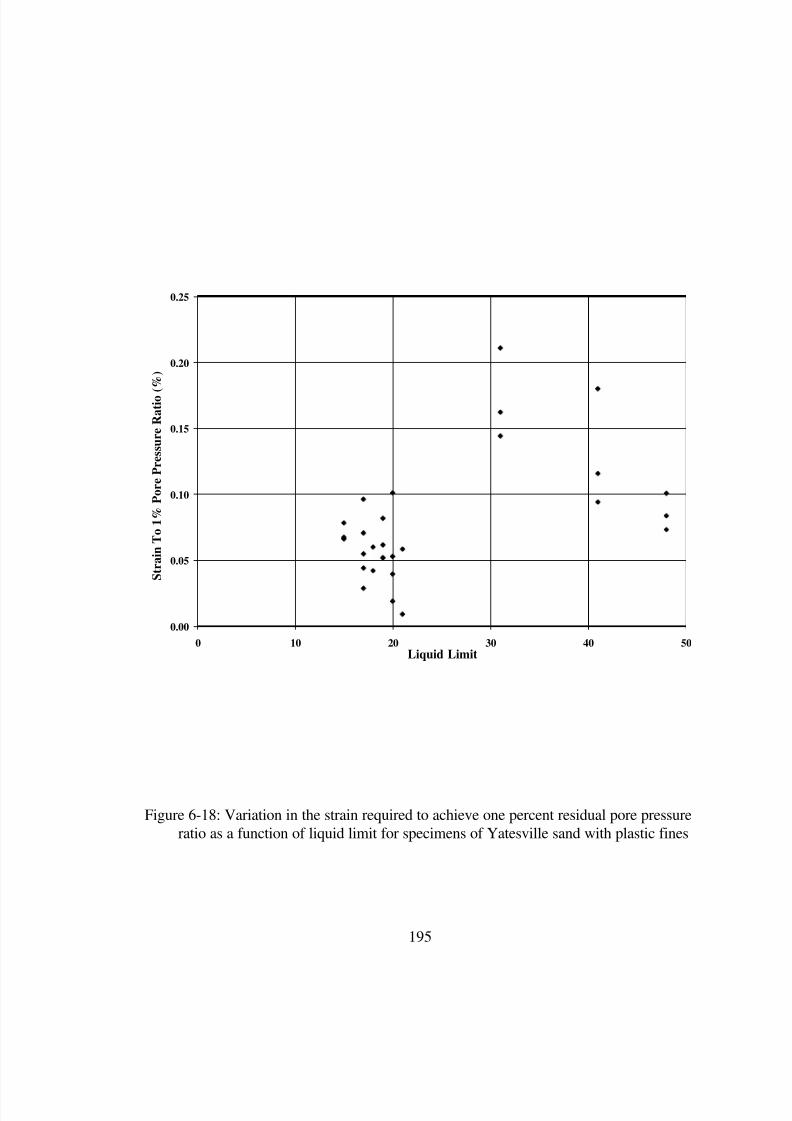
8/8/2019 The Effects of Non-Plasticand Plastic Fines on the Liquefaction Of
http://slidepdf.com/reader/full/the-effects-of-non-plasticand-plastic-fines-on-the-liquefaction-of 209/288
195
Figure 6-18: Variation in the strain required to achieve one percent residual pore pressure
ratio as a function of liquid limit for specimens of Yatesville sand with plastic fines
0.00
0.05
0.10
0.15
0.20
0.25
0 10 20 30 40 50Liquid Limit
S t r a i n T o 1 % P
o r e P r e s s u r e R a t i o ( % )
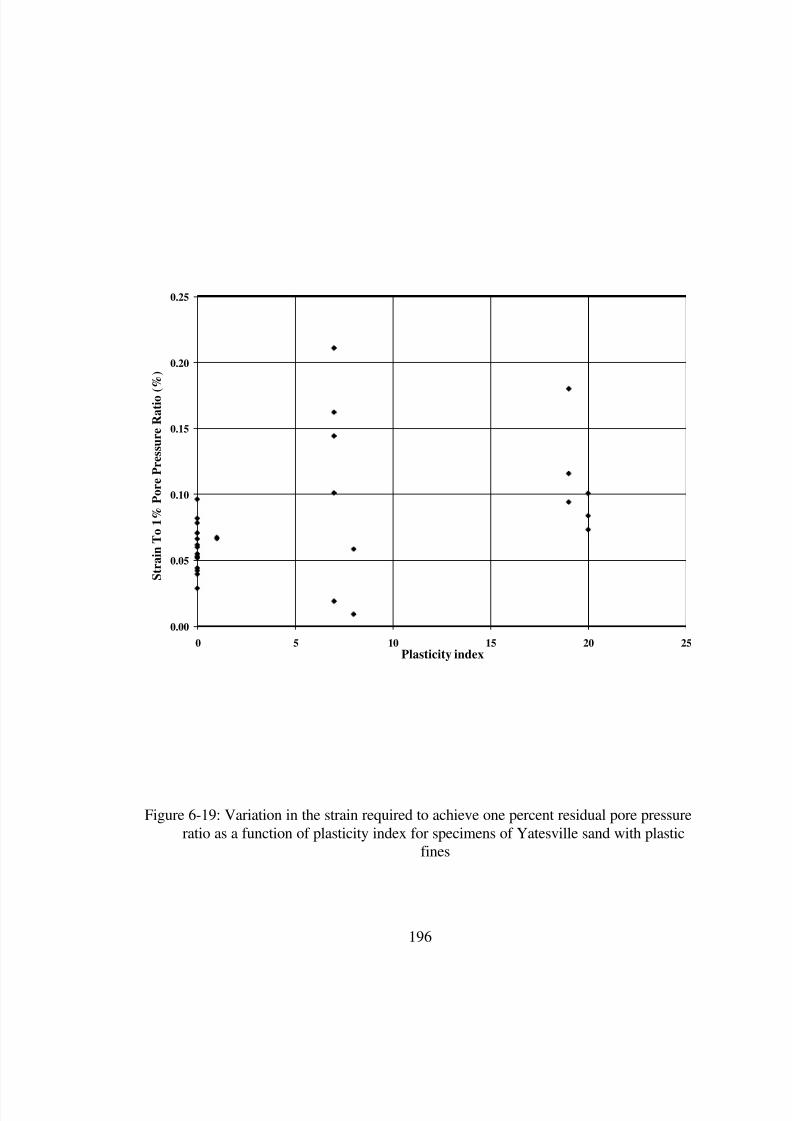
8/8/2019 The Effects of Non-Plasticand Plastic Fines on the Liquefaction Of
http://slidepdf.com/reader/full/the-effects-of-non-plasticand-plastic-fines-on-the-liquefaction-of 210/288
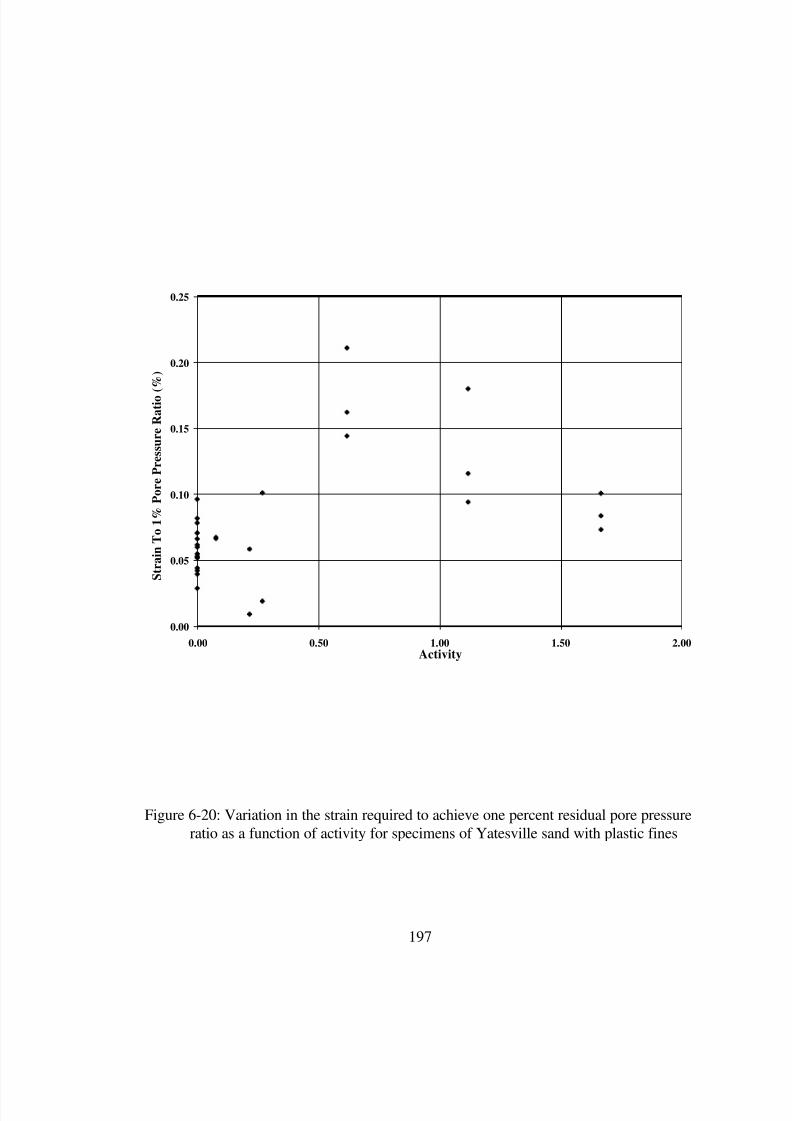
8/8/2019 The Effects of Non-Plasticand Plastic Fines on the Liquefaction Of
http://slidepdf.com/reader/full/the-effects-of-non-plasticand-plastic-fines-on-the-liquefaction-of 211/288
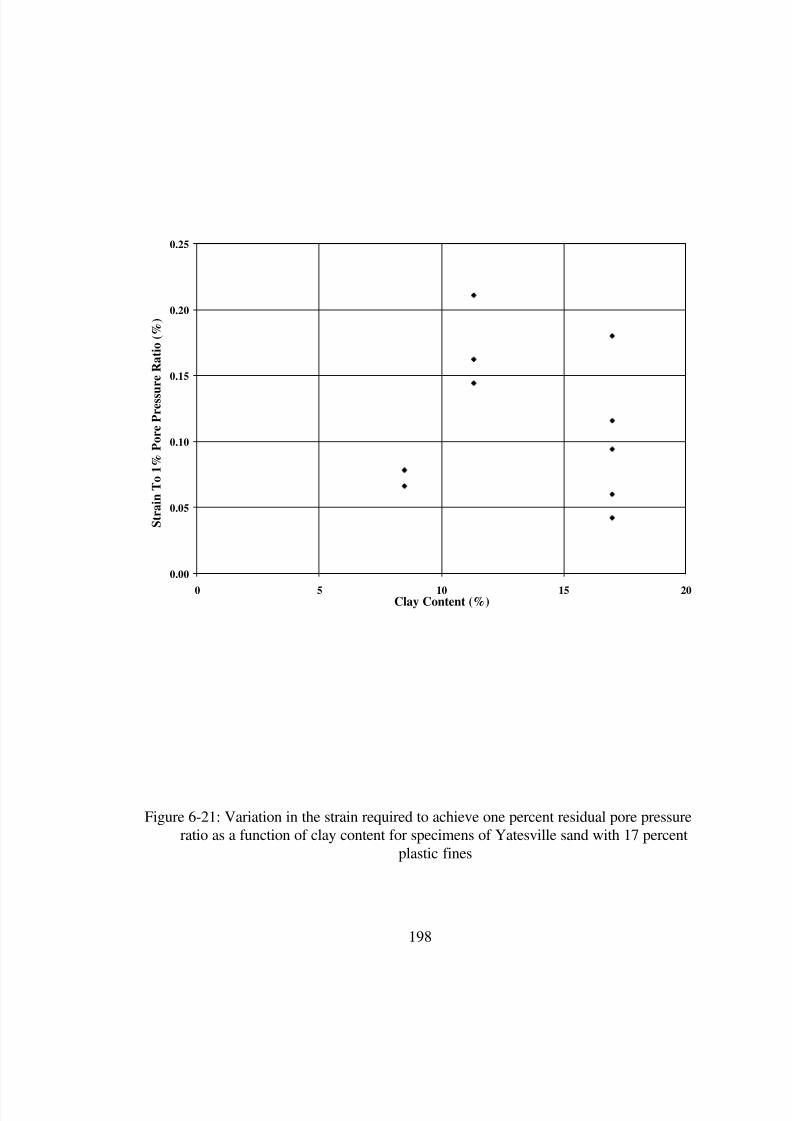
8/8/2019 The Effects of Non-Plasticand Plastic Fines on the Liquefaction Of
http://slidepdf.com/reader/full/the-effects-of-non-plasticand-plastic-fines-on-the-liquefaction-of 212/288

8/8/2019 The Effects of Non-Plasticand Plastic Fines on the Liquefaction Of
http://slidepdf.com/reader/full/the-effects-of-non-plasticand-plastic-fines-on-the-liquefaction-of 213/288
199
Figure 6-22: Variation in the strain required to achieve one percent residual pore pressure
ratio as a function of liquid limit for specimens of Yatesville sand with 17 percent
plastic fines
0.00
0.05
0.10
0.15
0.20
0.25
0 10 20 30 40 50Liquid Limit
S t r a i n T o 1 % P
o r e P r e s s u r e R a t i o ( % )
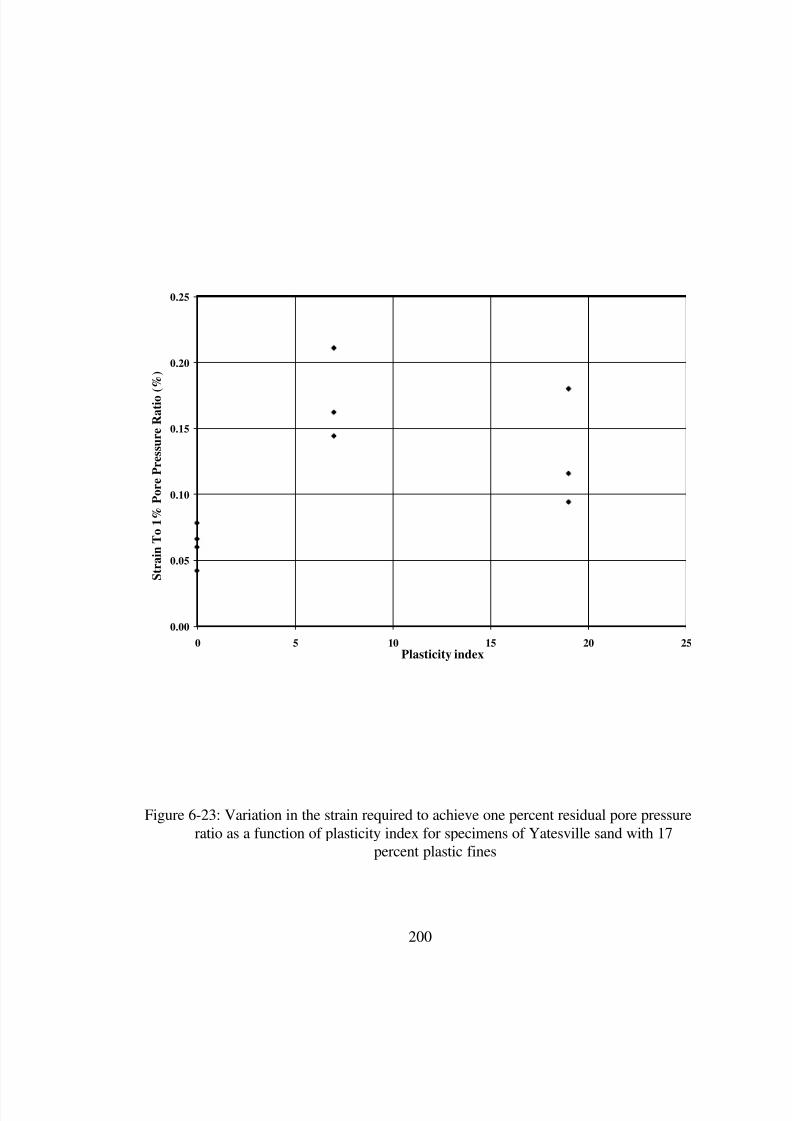
8/8/2019 The Effects of Non-Plasticand Plastic Fines on the Liquefaction Of
http://slidepdf.com/reader/full/the-effects-of-non-plasticand-plastic-fines-on-the-liquefaction-of 214/288
200
Figure 6-23: Variation in the strain required to achieve one percent residual pore pressure
ratio as a function of plasticity index for specimens of Yatesville sand with 17
percent plastic fines
0.00
0.05
0.10
0.15
0.20
0.25
0 5 10 15 20 25Plasticity index
S t r a i n T o 1 % P
o r e P r e s s u r e R a t i o ( % )

8/8/2019 The Effects of Non-Plasticand Plastic Fines on the Liquefaction Of
http://slidepdf.com/reader/full/the-effects-of-non-plasticand-plastic-fines-on-the-liquefaction-of 215/288
201
Figure 6-24: Variation in the strain required to achieve one percent residual pore pressure
ratio as a function of activity for specimens of Yatesville sand with 17 percent
plastic fines
0.00
0.05
0.10
0.15
0.20
0.25
0 0.5 1 1.5 2Activity
S t r a i n T o 1 % P
o r e P r e s s u r e R a t i o ( % )

8/8/2019 The Effects of Non-Plasticand Plastic Fines on the Liquefaction Of
http://slidepdf.com/reader/full/the-effects-of-non-plasticand-plastic-fines-on-the-liquefaction-of 216/288
202
Chapter 7: Implications Of Findings
The findings of the current study were examined to determine what effect they might
have on the methods of liquefaction analysis currently used in engineering practice. The
examination focused on the most commonly used method of liquefaction analysis, the
simplified method. The implications of the findings on pore pressure generation were
also examined.
7.1 Implications Of Findings About Sands With Non-Plastic Fines
During this research it was found that the cyclic resistance of sands with non-plastic fines
can be divided into two categories depending whether the silt content is above or below
the limiting silt content. The cyclic resistance of soils below the limiting silt content is
controlled by the soil specific relative density of the soil, while the cyclic resistance of
soils above the limiting silt content is controlled by the silt fraction void ratio of the soil.
The difference in behavior has a possible influence on the methodology commonly used
to assess the liquefaction susceptibility of sand soils. Following a brief review of the
simplified procedure used to analyze liquefaction susceptibility, the results of the current
study will be used to examine possible corrections to and recommendations for the
methodology for soils both above and below the limiting silt content.
7.1.1 The Simplified Procedure
The “simplified method” of liquefaction analysis, which was first introduced by Seed and
Idriss (1971) in the early 1970’s, compares the expected level of loading measured by a
cyclic stress ratio against the cyclic resistance of the soil. The cyclic resistance of the soil
is determined as function of either SPT blowcount or CPT tip resistance and fines
content. These parameters are plotted together in the form of a chart that is divided into

8/8/2019 The Effects of Non-Plasticand Plastic Fines on the Liquefaction Of
http://slidepdf.com/reader/full/the-effects-of-non-plasticand-plastic-fines-on-the-liquefaction-of 217/288
203
liquefiable and non-liquefiable zones. An example of this chart may be seen in Figure 7-
1.
The cyclic stress ratio is the ratio of the shear stress applied by the earthquake to the
vertical effective confining stress acting on the soil element. In the simplified method,
the CSR is taken as the product of the effective acceleration applied by the earthquake
(commonly taken as 65 percent of the peak acceleration measured as a fraction of
gravity), the ratio of total to effective vertical stresses acting on the soil element, and a
reduction factor, rd. This factor, rd, which is necessary because the soil mass is not a rigid
body, decreases from a value of one at the ground surface to a value of 0.9 at a depth of
approximately 30 feet.
The penetration resistance is normally corrected to an overburden pressure of one ton per
square foot, and in the case of the SPT blowcount, to a hammer energy of 60 percent.
Other corrections made to the SPT blowcount include corrections for borehole diameter,
rod length, and the presence or absence of a sampler liner.
The cyclic resistance of the soil is determined by entering the chart at the corrected
penetration resistance, going to the appropriate curve based on the fines content of the
soil and then reading the corresponding cyclic resistance off the vertical axis. Some
charts do not have multiple curves for the various fines contents but employ correction
factors for fines content.
For more information on the details of the simplified method and the corrections applied
within it, the reader is directed to “The Proceedings of the NCEER Workshop onEvaluation of Liquefaction Resistance of Soils” edited by Youd and Idriss (1997).

8/8/2019 The Effects of Non-Plasticand Plastic Fines on the Liquefaction Of
http://slidepdf.com/reader/full/the-effects-of-non-plasticand-plastic-fines-on-the-liquefaction-of 218/288
204
7.1.2 Implications of Findings On Soils Below The Limiting Silt Content
The cyclic resistance of soils with non-plastic fines below the limiting silt content hasbeen shown to be solely a function of the soil specific relative density and to be
independent of silt content. This may be seen in Figure 4- 12. Because the cyclic
resistance is independent of silt content for these soils, the differences which occur in the
cyclic resistance versus penetration resistance curves with fines content is due solely to
the differences in penetration resistance caused by the presence of the silty.
The presence of silt has long been known to lower the penetration of a loose sand because
it prevents full drainage of the soil. In order to correct for this lowering of the
penetration resistance, some correction factor must be applied to the penetration
resistance in order to make the use of the clean sands curve applicable. Because this
correction has been shown to be correcting only for penetration resistance and not for
cyclic resistance, the appropriate fines correction factors will cause the cyclic resistance
curves for different fines contents to collapse on top of the clean sands curve. This, of
course, is only the case when the soil under investigation has a limiting silt content of
greater than the non-plastic fines content for which the cyclic resistance curve was
intended.
Different fines correction factors have been suggested for analyses based upon the
Standard Penetration Test (SPT) and the Cone Penetration Test (CPT).
7.1.2.1 Analyses Using The Standard Penetration Test
Several proposed fines corrections were examined. First, the initial Seed et al (1983)
correction of simply adding 7.5 to the measured blowcount was examined. As may be
seen in Figure 7-2, this simple correction tends to be conservative, predicting cyclic
resistances which are too low at all adjusted blowcounts for soils with 15 percent fines
8/8/2019 The Effects of Non-Plasticand Plastic Fines on the Liquefaction Of
http://slidepdf.com/reader/full/the-effects-of-non-plasticand-plastic-fines-on-the-liquefaction-of 219/288
205
and at adjusted blowcounts less than 20 for soils with 35 percent fines. It is
unconservative for soils with 35 percent fines and adjusted blowcounts greater than 20.
Next, a new blowcount correction factor proposed by Robertson and Wride (1997) at the
recent NCEER workshop was investigated. The factor varies as a linear function of fines
content. Details of the factor are provided in Table 7-1.
The correction factor was applied to the standard curves and the results plotted in Figure
7-3. The correction is unconservative at blowcounts below about 20, because it predicts a
larger cyclic resistance than may be available. This is dangerous as this is the range in
which liquefaction is most likely. Above a blowcount of 20, the correction factor for 15
percent fines is rather conservative, while it works well for blowcounts above
approximately 25 for the 35 percent fines curve provided the soil is below the limiting silt
content.
Lastly, the fines correction factors recently recommended by NCEER (Youd and Idriss,
1997) were examined. These factors are a function of the fines content and consist of two
portions, α and β. Details of these factors are presented in Table 7-1. These corrections
were applied to the standard curves and the results plotted in Figure 7-4. The correction
factors for 35 percent fines is accurate because it causes the 35 percent fines and clean
sand curves to overlap for their full lengths. The 15 percent fines correction is
unconservative because for a given adjusted blowcount it assigns a larger cyclic
resistance than is assigned by the clean sand curve.
A new term is proposed to adjust the latest NCEER curves so that they becomecoincidental with the clean sands curve when the fines corrections are applied. This term,
γ , is to be used in conjunction with the NCEER α and β factors. It is a function of both
the fines content and the corrected SPT blow count, N1,60, and is detailed in Table 7-1.

8/8/2019 The Effects of Non-Plasticand Plastic Fines on the Liquefaction Of
http://slidepdf.com/reader/full/the-effects-of-non-plasticand-plastic-fines-on-the-liquefaction-of 220/288
206
The proposed correction factors were applied to the standard curves and the results
plotted in Figure 7-5. The cyclic resistance curves for 15 and 35 percent fines have
converged onto the clean sand curve. This indicates that, when applied to soils with silt
contents below the limiting silt content, for soils an identical cyclic resistance will be
determined regardless of the silt content. This reflects the fact that, for soils below the
limiting silt content, the cyclic resistance of these soils is independent of their silt
contents, and is only a function of their soil specific relative density.
7.1.2.2 Analyses Using The Cone Penetration Test
In recent years the performing of the simplified procedure using data from cone
penetration tests has become more popular as the data base of case histories has
increased. Cone penetration testing has the advantage of providing a continuous record
of penetration resistance versus depth, which allows for the detection of thin liquefiable
layers which might be missed during a SPT investigation.
The procedure for performing the simplified method based upon CPT results
recommended in the recent NCEER proceedings (Youd and Idriss, 1997) involves
correcting the penetration resistance for fines based upon the soil behavior type index, IC,proposed by Robertson and Wride (1997). The soil behavior type index is a function of
the determined based upon the tip resistance and normalized friction ratio recorded during
the cone penetration test.
Unfortunately, as actual cone testing was not performed during this study, it is not
possible to evaluate the accuracy of Robertson and Wride’s (1997) procedure for fines
correction. If accurate, it should provide constant corrected penetration resistances for
soils with constant soil specific relative densities below the limiting silt content. This is a
possible area of future study.
8/8/2019 The Effects of Non-Plasticand Plastic Fines on the Liquefaction Of
http://slidepdf.com/reader/full/the-effects-of-non-plasticand-plastic-fines-on-the-liquefaction-of 221/288
207
7.1.3 Implications Of Findings On Soils Above The Limiting Silt Content
For soils above the limiting silt content, a large decrease in cyclic resistance has beenseen in this study. Figure 7-6 plots the cyclic resistance curves for Monterey sand with 25
percent silt and Monterey sand with 35 percent silt adjusted to a soil specific relative
density of 50 percent. These silt contents represent conditions just above and below the
limiting silt content of 32 percent calculated for this sand. It may be seen in the figure
that in crossing the limiting silt the cyclic resistance decreases by approximately 300
percent from 0.24 to 0.08 when evaluated at 10 cycles.
If the 35 percent fines curve or the correction factors are applied to soils with limiting silt
contents below 35 percent, the predicted cyclic resistance may be grossly overpredicted.
This represents a very dangerous situation that may also occur in soils with fines contents
above 35 percent, if they are above their limiting silt content. The adequacy of the fines
corrections can not be fully evaluated for these situations as no penetration testing was
done on these soils.
In order to evaluate the typical range of limiting silt contents found in soils, a brief
analysis using 37 sands and 5 silts was performed. The details on the silts and sands are
provided in Appendix D: Limiting Silt Content. Figure 7-7 provides a histogram of the
distribution of limiting silt contents. From the histogram it can be seen that
approximately 15 percent of the sand and silt combinations examined had limiting silt
contents below 35 percent.
While it is possible to evaluate the limiting silt content of a soil based upon the results of
index tests upon it, the development of correlations between limiting silt content and such
parameters as fines content or mean grain size offer another area for future research.
Additionally, the evaluation of the liquefaction resistance of soils with fines contents
8/8/2019 The Effects of Non-Plasticand Plastic Fines on the Liquefaction Of
http://slidepdf.com/reader/full/the-effects-of-non-plasticand-plastic-fines-on-the-liquefaction-of 222/288
208
above the limiting silt content is another possible avenue of research. Whether the it is
possible to correct the penetration resistance using some fines correction or whether
actual laboratory testing is required, should be examined.
Appendix D also provides information on the calculation of the limiting silt content based
on index data.
7.2 Implications Of Findings About Sands With Plastic Fines
It has been shown in this research that, in contrast to much of the data shown in the
literature, the addition of plastic fines may increase the susceptibility of a sand to
liquefaction. This may be seen in Figure 7-8 which shows the difference in liquefaction
resistance which occurs between a sand with 17 percent silt and the same sand with 17
percent kaolinite when both are adjusted to a soil specific relative density of 25 percent.
The methods currently recommended by NCEER either do not account for the plasticity
of the fines (in the case of the SPT method) or account for it by its affect on the
resistances measured during a cone penetration test. As actual cone penetration recordsare not available it is impossible to evaluate the manner in which the plasticity of the
fines is taken into account. This is another possible area for further research.
For the SPT-based simplified method, the current NCEER guidelines do nothing to
account for the presence of plastic fines. The use of the current fines corrections for the
two soils shown in Figure 7-8 would produce the same cyclic resistance at the same
uncorrected blowcount. This would clearly be unconservative for the sand with 17
percent kaolinite as it would produce a cyclic resistance approximately 50 percent too
large if evaluated using the curves based on non-plastic fines.

8/8/2019 The Effects of Non-Plasticand Plastic Fines on the Liquefaction Of
http://slidepdf.com/reader/full/the-effects-of-non-plasticand-plastic-fines-on-the-liquefaction-of 223/288
209
Because the curves currently used in the simplified procedure are not accurate for sands
with plastic fines, an alternative method of evaluation should be used until adequate data
is available to make accurate fines corrections. A plasticity based liquefaction criteria is
therefore recommended. Based on the results of this study, the chart shown in Figure 7-9
is recommended for the evaluation of the liquefaction of sands with plastic fines. Soils
plotting outside the zone of potentially liquefiable soils (i.e. those with plasticity indexes
larger than 10, or liquid limits greater than 35) may be deemed not susceptible to flow
liquefaction, but only susceptible to cyclic mobility. Soils plotting with the zone of
potentially liquefiable soils may be considered susceptible to flow liquefaction, and
should be the subjected to a laboratory testing program to determine their actual
liquefaction resistance.
7.3 Implications Of Findings About Pore Pressure Generation
For soils with non-plastic fines, the generation of pore pressures was found to be
relatively insensitive to relative density, cyclic stress ratio, or silt content when plotted in
terms of pore pressure ratio versus the loading ratio. Therefore, if laboratory data is
available to plot such a curve, it may be used to predict the level of pore pressuregenerated in a soil mass if liquefaction does not occur. Separate curves are however
necessary for soils that are susceptible to flow liquefaction and for those which are
susceptible to cyclic mobility.
For soils with plastic fines, the generation of pore pressures was found to be dependent on
the plasticity of the soil when plotted in terms of pore pressure ratio versus the loading
ratio. Therefore, the laboratory data may only be used to predict the level of pore
pressure generated in a soil mass if laboratory data is available for that specific soil.7.4

8/8/2019 The Effects of Non-Plasticand Plastic Fines on the Liquefaction Of
http://slidepdf.com/reader/full/the-effects-of-non-plasticand-plastic-fines-on-the-liquefaction-of 224/288
210
7.4 Conclusions
The findings of the current study were examined to determine what effect they mighthave on the methods of liquefaction analysis currently used in engineering practice. The
examination focused on the most commonly used method of liquefaction analysis, the
simplified method.
It was first shown that for soils below the limiting silt content a constant cyclic resistance
should be obtained for a constant soil specific relative density when a proper fines
correction is applied. This is because the cyclic resistance below the limiting silt content
is independent of the silt content. Thus the separate curves for different fines content are
a result of the differences in penetration resistance brought about by the varying silt
content, not a difference in liquefaction resistance.
For soils with non-plastic fines, the fines correction factors currently used when the
simplified method is implemented using the results of standard penetration tests were
found to unconservative and were adjusted so as to produce a constant cyclic resistance
with a constant soil specific relative density.
No conclusions could be draw regarding the validity of analyses performed using the data
from cone penetration tests as no cone penetration test data was available for the soils
examined in this study.
The fines corrections currently recommended by NCEER (Youd and Idriss, 1997) were
deemed unconservative for soils with silt content above the limiting silt content. These
soils are known to have cyclic resistances lower than similar soils below the limiting silt
content. However as no penetration testing was performed, it was not possible to make
conclusive statements regarding the fines corrections.

8/8/2019 The Effects of Non-Plasticand Plastic Fines on the Liquefaction Of
http://slidepdf.com/reader/full/the-effects-of-non-plasticand-plastic-fines-on-the-liquefaction-of 225/288
211
For soils with plastic fines, the simplified procedure will not give accurate results with
the fines corrections currently in use. For this reason a plasticity based liquefaction
criteria was suggested. Soils meeting the criteria are assumed to be not susceptible to
flow liquefaction, but only to cyclic mobility. Soils not meeting the criteria are assumed
to be susceptible to flow liquefaction, and should have their liquefaction resistance
evaluated using laboratory testing.
The pore pressure generation data developed during the laboratory testing portion of a
study may be used to determine pore pressure development in soils not reaching full
liquefaction. For clean sands and sands with non-plastic fines, separate curves are
required for soils which are susceptible to flow liquefaction, and those that are susceptible
to cyclic mobility. For sands with plastic fines separate curves are required for each
specific soil due to the variation in pore pressure development with changing soil
plasticity.

8/8/2019 The Effects of Non-Plasticand Plastic Fines on the Liquefaction Of
http://slidepdf.com/reader/full/the-effects-of-non-plasticand-plastic-fines-on-the-liquefaction-of 226/288
212
Table 7-1: Review of fines correction factors
Source Fines Correction Applicable Range
Seed et al. (1983) (N1)60CS = N1,60+7.5
Robertson and Wride (1997) (N1)60CS = Ks(N1)60
Where:
Ks = 1 + [(0.75/30)(FC-5)]
NCEER
Youd and Idriss (1997)
(N1)60CS = α + β(N1)60
Where:
α = 0 For FC < 5%
α = exp[1.76-(190/FC2)] For 5% < FC < 35%
α = 5.0 For FC > 35%
β = 1.0 For FC < 5%
β = [0.99+(FC1.5
/1000)] For 5% < FC < 35%
β = 1.2 For FC > 35%
Polito (N1)60CS = α + β(N1)60 + γ
Where:
α and β as for NCEER
γ = 0.1 + 0.008((N 1)60-4)(FC-5) For all FC and (N 1)60
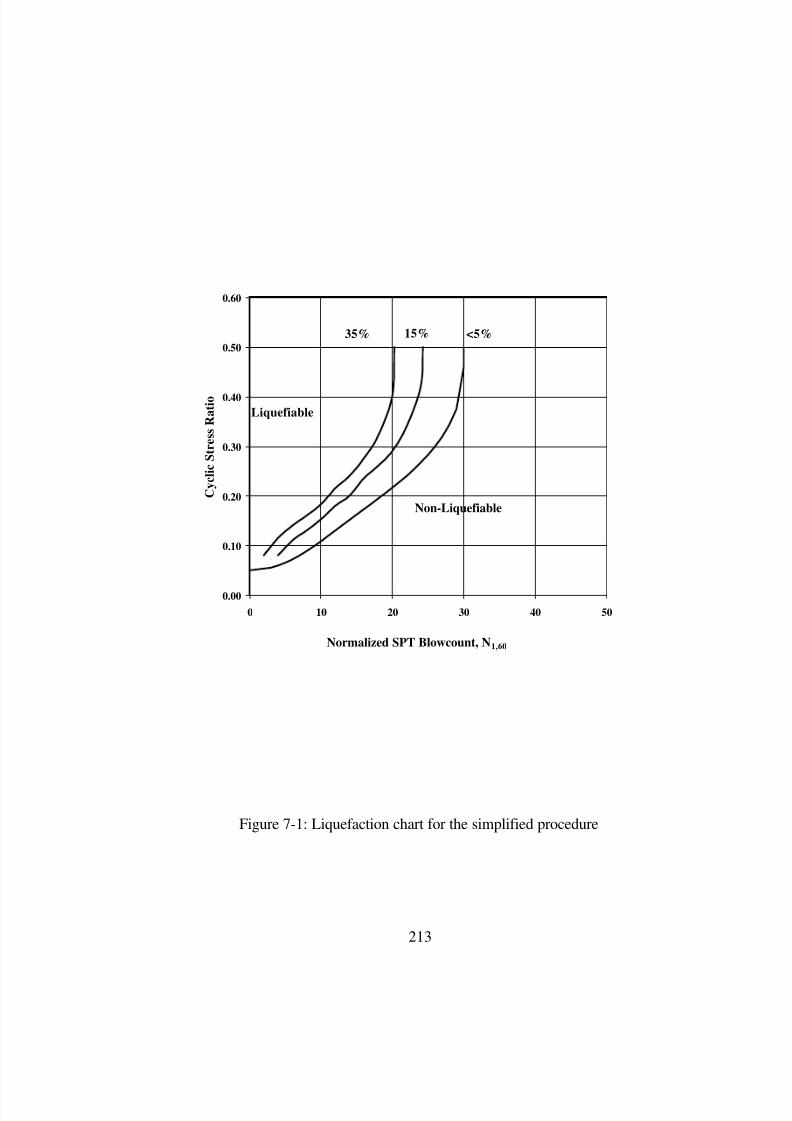
8/8/2019 The Effects of Non-Plasticand Plastic Fines on the Liquefaction Of
http://slidepdf.com/reader/full/the-effects-of-non-plasticand-plastic-fines-on-the-liquefaction-of 227/288
213
Figure 7-1: Liquefaction chart for the simplified procedure
0.00
0.10
0.20
0.30
0.40
0.50
0.60
0 10 20 30 40 50
Normalized SPT Blowcount, N1,60
C y c l i c S t r e s s R a t i o
<5%15%35%
Liquefiable
Non-Liquefiable
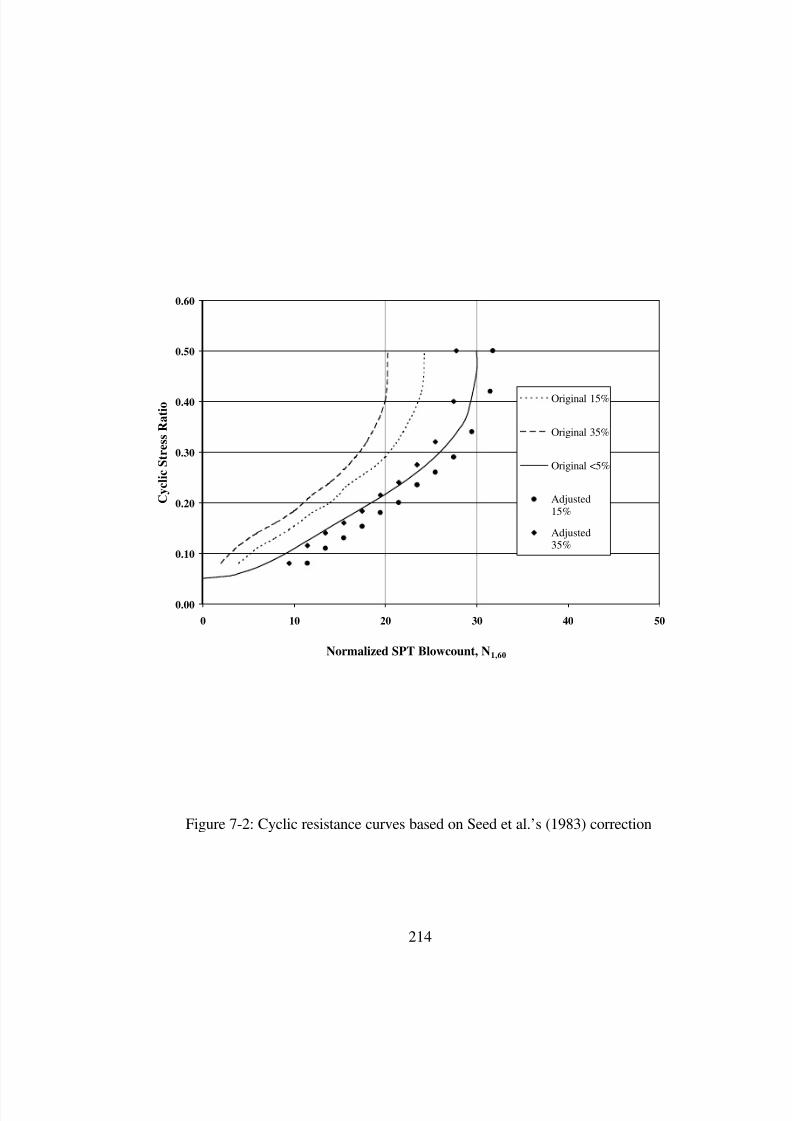
8/8/2019 The Effects of Non-Plasticand Plastic Fines on the Liquefaction Of
http://slidepdf.com/reader/full/the-effects-of-non-plasticand-plastic-fines-on-the-liquefaction-of 228/288
214
Figure 7-2: Cyclic resistance curves based on Seed et al.’s (1983) correction
0.00
0.10
0.20
0.30
0.40
0.50
0.60
0 10 20 30 40 50
Normalized SPT Blowcount, N1,60
C y c l i c S t r e s s R a t i o
Original 15%
Original 35%
Original <5%
Adjusted15%
Adjusted35%

8/8/2019 The Effects of Non-Plasticand Plastic Fines on the Liquefaction Of
http://slidepdf.com/reader/full/the-effects-of-non-plasticand-plastic-fines-on-the-liquefaction-of 229/288
215
Figure 7-3: Cyclic resistance curves based on Robertson and Wride’s (1997) correction
0.00
0.10
0.20
0.30
0.40
0.50
0.60
0 10 20 30 40 50
Normalized SPT Blowcount, N1,60
C y c l i c S t r e s s R a t i o
Original 15%
Original 35%
Original <5%
Adjusted 15%
Adjusted 35%

8/8/2019 The Effects of Non-Plasticand Plastic Fines on the Liquefaction Of
http://slidepdf.com/reader/full/the-effects-of-non-plasticand-plastic-fines-on-the-liquefaction-of 230/288
216
Figure 7-4: Cyclic resistance curves based on NCEER (1997) correction
0.00
0.10
0.20
0.30
0.40
0.50
0.60
0 10 20 30 40 50
Normalized SPT Blowcount, N1,60
C y c l i c S t r e s s R a t i o
Original 15%
Original 35%
Original <5%
Adjusted
15%
Adjusted35%

8/8/2019 The Effects of Non-Plasticand Plastic Fines on the Liquefaction Of
http://slidepdf.com/reader/full/the-effects-of-non-plasticand-plastic-fines-on-the-liquefaction-of 231/288
217
Figure 7-5: Cyclic resistance curves based on new, recommended correction
0.00
0.10
0.20
0.30
0.40
0.50
0.60
0 10 20 30 40 50
Normalized SPT Blowcount, N1,60
C y c l i c S t r e s s R a t i o
Original 15%
Original 35%
Original <5%
Adjusted 15%
Adjusted 35%
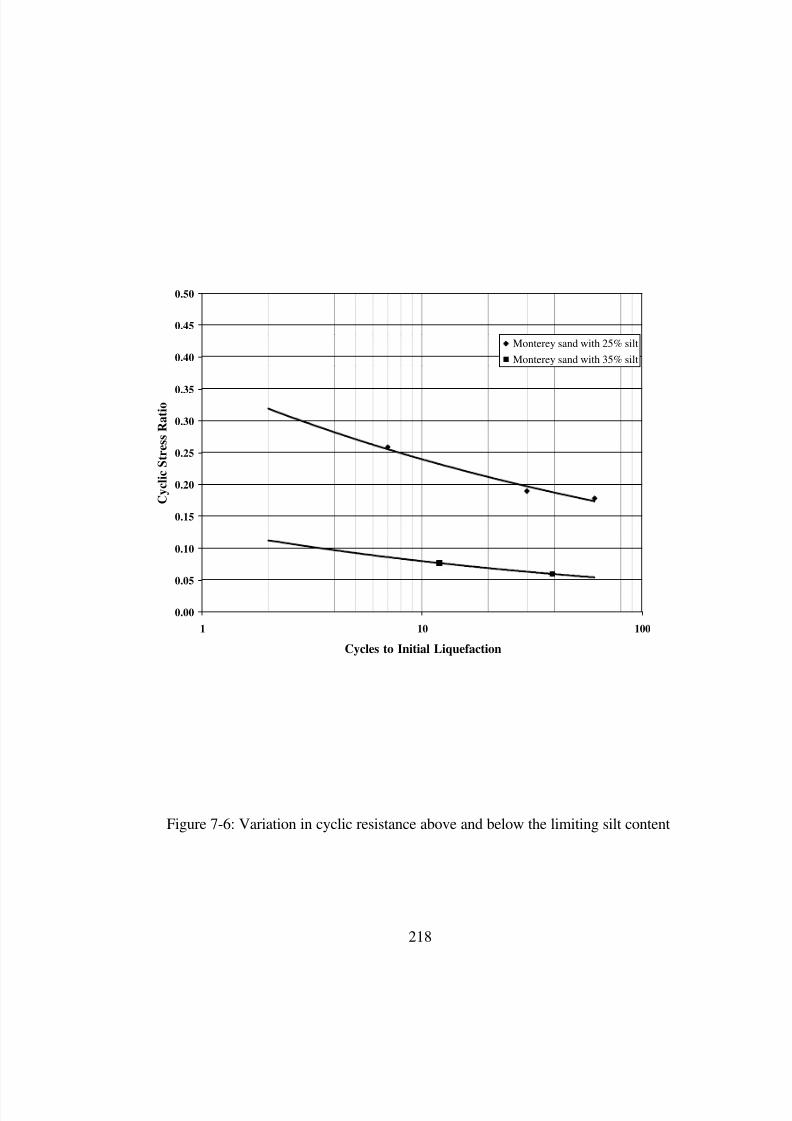
8/8/2019 The Effects of Non-Plasticand Plastic Fines on the Liquefaction Of
http://slidepdf.com/reader/full/the-effects-of-non-plasticand-plastic-fines-on-the-liquefaction-of 232/288
218
Figure 7-6: Variation in cyclic resistance above and below the limiting silt content
0.00
0.05
0.10
0.15
0.20
0.25
0.30
0.35
0.40
0.45
0.50
1 10 100
Cycles to Initial Liquefaction
C y c l i c S t r e s s R a t i o
Monterey sand with 25% silt
Monterey sand with 35% silt

8/8/2019 The Effects of Non-Plasticand Plastic Fines on the Liquefaction Of
http://slidepdf.com/reader/full/the-effects-of-non-plasticand-plastic-fines-on-the-liquefaction-of 233/288
219
Figure 7-7: Distribution of limiting silt contents
0
5
10
15
20
25
30
35
25 30 35 40 45 50 55 60 65
Limiting Silt Content (%)
P e r c e n t o f S p e c i m e n s i n R a n g e ( % )

8/8/2019 The Effects of Non-Plasticand Plastic Fines on the Liquefaction Of
http://slidepdf.com/reader/full/the-effects-of-non-plasticand-plastic-fines-on-the-liquefaction-of 234/288
220
Figure 7-8: Variation in cyclic resistance with fines composition
0.00
0.05
0.10
0.15
0.20
0.25
0.30
0.35
0.40
0.45
0.50
1 10 100
Cycles to Initial Liquefaction
C y c l i c S t r e s s R a t i o
Yatesville sand with 17% silt
Yatesville sand with 17% Kaolinite

8/8/2019 The Effects of Non-Plasticand Plastic Fines on the Liquefaction Of
http://slidepdf.com/reader/full/the-effects-of-non-plasticand-plastic-fines-on-the-liquefaction-of 235/288
221
Figure 7-9: Proposed zone of liquefiable soils
0
5
10
15
20
0 5 10 15 20 25 30 35 40
Liquid Limit
P l a s t i c i t y I n d e x
ML
CL
Proposed Zone Of
Liquefiable Soils

8/8/2019 The Effects of Non-Plasticand Plastic Fines on the Liquefaction Of
http://slidepdf.com/reader/full/the-effects-of-non-plasticand-plastic-fines-on-the-liquefaction-of 236/288
222
Chapter 8: Conclusions and Recommendations
A laboratory parametric study intended to clarify the effects which varying fines content
and plasticity have upon the liquefaction resistance of sandy sands was undertaken using
cyclic triaxial tests. The program of research also examined the applicability of plasticity
based liquefaction criteria and the effects of fines content and plasticity on pore pressure
generation. Lastly, a review was made of how the findings of this study may affect the
manner in which simplified analyses are performed in engineering practice.
The conclusions drawn from this study and recommendations with regard to
implementing these findings into engineering practice are summarized below.
8.1 Effects Of Non-Plastic Fines
The understanding of the liquefaction of sands containing non-plastic, fine-grained
material (i.e. silt) is less complete than the understanding of liquefaction in clean sands.
A review of the literature shows that there is no clear consensus as to what effect an
increase in non-plastic silt content has upon the liquefaction resistance of a sand. In fact,
seemingly contradictory behaviors are reported.
The current study was able to isolate two factors, soils specific relative density and
limiting silt content, which govern the liquefaction behavior of silty sands and sandy silts.
Using these factors, the majority of the seemingly contradictory behaviors reported in the
literature can be explained.
Several conclusions regarding the effects of non-plastic fines on the liquefaction
susceptibility of sandy soils were drawn from this study. These findings are summarized
below:
8/8/2019 The Effects of Non-Plasticand Plastic Fines on the Liquefaction Of
http://slidepdf.com/reader/full/the-effects-of-non-plasticand-plastic-fines-on-the-liquefaction-of 237/288
223
• Three distinct behavioral patterns were found for the cyclic resistance of soils
composed of sand and non-plastic silt. These three patterns may be seen in Figure 8-
1. Which of these behaviors controls is determined by whether there is sufficient
room in the voids created by the sand skeleton to contain the silt present without
disturbing the sand structure. This silt content has been called the limiting silt
content.
• If the silt content of the soil is below the limiting silt content, there is sufficient room
in the voids created by the sand skeleton to contain the silt, and the soil can be
described as having silt contained in a sand matrix. The cyclic resistance of the soil is
then controlled by the soil specific relative density of the specimen, where the soil
specific relative density is calculated using the gross void ratio of the specimen and
the maximum and minimum index void ratios for that particular mixture of sand and
silt. Increasing the soil specific relative density increases the soil’s cyclic resistance.
• If the silt content is greater than the limiting silt content, the specimen’s structure
consists predominately of sand grains suspended within a silt matrix with little sand
grain to sand grain contact. Above the limiting silt content, the amounts of sand
present in the soil and its soil specific relative density have little effect on its cyclic
resistance. The cyclic resistance for these soils is controlled by silt fraction void ratio
of the soil. Decreasing the silt fraction void ratio increases the soil’s cyclic resistance.
• There is a transition zone consisting of soils with silt contents at or slightly above the
limiting silt content. This zone occurs as a result of the structure of the soil changing
from a predominately sand controlled fabric to a predominately silt controlled fabric
as silt content increases. Soils in this zone possess cyclic resistances intermediate to
those with greater or lesser silt contents.

8/8/2019 The Effects of Non-Plasticand Plastic Fines on the Liquefaction Of
http://slidepdf.com/reader/full/the-effects-of-non-plasticand-plastic-fines-on-the-liquefaction-of 238/288
224
• The seemingly contradictory reports concerning the effects of non-plastic fines
content on the liquefaction resistance of sands that have appeared in the literature
were reconciled in light of the behavioral patterns found by the authors. These
behaviors were found to depend primarily upon the limiting silt content of the soil and
the soil specific relative density of the specimen. It was shown that the trends of
decreasing cyclic resistance or decreasing and then increasing cyclic resistance with
increases in silt content reported in the literature can be explained in view of the
results of this study. The concept that cyclic resistance is controlled by the sand
skeleton void ratio of the soil was also reconciled with results of this study. The
reports of increasing cyclic resistance with increasing silt content reported in the
literature can not be explained based upon the findings of this study.
8.2 Effects Of Plastic Fines And Plasticity Based Liquefaction Criteria
The presence of plastic or clayey fines is generally considered to decrease the liquefaction
susceptibility of a soil. Numerous field studies have shown that soils with more than 10
or 20 percent fines tend not to liquefy during earthquakes. Several investigators have
proposed criteria by which to deem certain soils as “non-liquefiable” based primarily ontheir plastic nature. How the introduction of clayey fines actually affects the liquefaction
susceptibility of a soil and the validity of the various plasticity based liquefaction criteria
formed a major portion of this research.
The effects of plastic fines content were analyzed by testing a series of specimens
prepared to a constant soil specific relative density with various fines content and
composition. The effects of fines plasticity were isolated by testing a series of specimens
prepared to a constant fines content and soil specific relative density with varying fines
composition and plasticity.

8/8/2019 The Effects of Non-Plasticand Plastic Fines on the Liquefaction Of
http://slidepdf.com/reader/full/the-effects-of-non-plasticand-plastic-fines-on-the-liquefaction-of 239/288
225
Several conclusions regarding the effects of plastic fines on the liquefaction susceptibility
of sandy soils and the validity of plasticity based liquefaction criteria were drawn from
this study. These findings are summarized below:
• The cyclic resistance of sands with plastic fines appears to be relatively independent
of fines content, clay content, water content, and liquidity index.
• The cyclic resistance of sands with plastic fines increases with increases in liquid
limit, plasticity index and activity.
• The cyclic resistance of sands with plastic fines is dependent on the plasticity of the
soil whether that plasticity is measured in terms of liquid limit, plasticity index, or
activity. It is important to determine the plasticity of the soil mixture and not just the
plasticity of the fines.
• If the plasticity of the fines is low, the addition of even a moderate amount of plastic
fines (up to 25 percent) may decrease the liquefaction resistance of the soil.
• The key factor in the plasticity based liquefaction criteria is the requirement for the
plasticity of the soil. If this requirement, whether measured in terms of liquid limit or
plasticity index, is met, the soil does not appear to be susceptible to flow liquefaction.
• The reason plasticity based criteria work is that they mirror a change in behavior in
the soil following the onset of initial liquefaction. Soils meeting the plasticity
requirement tend to undergo a cyclic mobility form of failure that results in only
minor strength loss and small deformations of the soils mass. Soils not meeting the
plasticity requirement tend to undergo flow liquefaction that results in significant
strength loss and very large deformations.

8/8/2019 The Effects of Non-Plasticand Plastic Fines on the Liquefaction Of
http://slidepdf.com/reader/full/the-effects-of-non-plasticand-plastic-fines-on-the-liquefaction-of 240/288
226
• Although zero effective stress and large values of strain may be achieved in a
laboratory test for soils undergoing cyclic mobility, these behaviors are transient and
the soil does not behave in any of the manners commonly associated with flow
liquefaction, such as significant strength loss or large deformations.
• The differences in behavior between flow liquefaction and cyclic mobility make it
inappropriate to evaluate liquefaction for soils meeting the plasticity requirements
using either initial liquefaction or some level of strain measured in a lab test.
• A plasticity index of 10 appears to be a reasonable threshold value between flow
liquefaction and cyclic mobility, while the liquid limit values in the range of 34 to 36
which have been suggested, appear rather conservative. A liquid limit value of 25
appears to ensure that a soil will fail in cyclic mobility rather than in flow
liquefaction.
• A proposed zone of liquefiable soils is indicated on the plasticity chart shown in
Figure 8-2, and includes soils with plasticity indexes less than 10 and liquid limits
less than 35. Soils that plot in this region and contain plastic fines should be tested to
determine their liquefaction susceptibility.
• This tendency towards cyclic mobility also explains why soils meeting the plasticity
based liquefaction criteria are frequently reported during field investigations as being
non-liquefiable. While they may develop a zero effective stress condition, their lack
of deformation and the absence of sand boil emission tend to hide this occurrence.

8/8/2019 The Effects of Non-Plasticand Plastic Fines on the Liquefaction Of
http://slidepdf.com/reader/full/the-effects-of-non-plasticand-plastic-fines-on-the-liquefaction-of 241/288
227
8.3 Pore Pressure Generation
Data from the cyclic triaxial tests were analyzed to evaluate the effects of
fines content and plasticity on the pore pressure generation characteristics of silty and
clayey sands. Pore pressure generation was evaluated both in terms of the number of
cycles of loading relative to the number of cycles of loading required to achieve initial
liquefaction and in terms of the amount of strain require to achieve a certain level of pore
pressure ratio.
Several conclusions regarding the effects of fines content and plasticity on pore pressure
generation were drawn from this study. These findings are summarized below:
• The loading ratio is defined as the number of cycles of loading relative to the number
of cycles of loading required to achieve initial liquefaction
• When analyzed in terms of loading ratio, pore pressure generation for each sand with
silt was found to fit into a narrow band. The shape and position of that band depends
on whether the soils is susceptible to flow liquefaction or cyclic mobility, and is
independent of silt content.
• At any given loading ratio the pore pressure ratio is larger for a soil susceptible to
cyclic mobility than it is for a soil susceptible to flow liquefaction.
• When analyzed in terms of the loading ratio, the pore pressure ratio for sands with
plastic fines varies as the plasticity of the soils varies. Soils with low plasticity
produced pore pressure generation curves similar to those produced for soils with
non-plastic fines susceptible to flow liquefaction. Soils with high plasticity produced

8/8/2019 The Effects of Non-Plasticand Plastic Fines on the Liquefaction Of
http://slidepdf.com/reader/full/the-effects-of-non-plasticand-plastic-fines-on-the-liquefaction-of 242/288
228
pore pressure generation curves similar to those produced for soils with non-plastic
fines susceptible to cyclic mobility.
• Because the pore pressures generated by these soils tend to fall into narrow bands
when plotted using the loading ratio, these curves may be used to estimate the pore
pressures generated in these soils if liquefaction does not occur. This analysis
requires knowledge of the number of cycles required to liquefy the soil at the stress
levels imposed by the design earthquake and the number of cycles in the design
earthquake.
• The residual pore pressure ratio is the pore pressure ratio measured during the point of
zero deviator stress
• When evaluated in terms of the strain required to reach some level of residual pore
pressure ratio, the behavior for soils with non-plastic fines is governed by the soil’s
silt content relative to the limiting silt content.
• For soils with non-plastic fines below the limiting silt content the strain required to
generate pore pressures is related to soil specific relative density and the pore pressure
level. For one percent residual pore pressure ratio, the strain required increases with
increasing soil specific relative density. Conversely, for seventy percent residual
pore pressure ratio, the strain required decreases with increasing soil specific relative
density.
• For soils with non-plastic fines above the limiting silt content the strain required to
generate some level of residual pore pressure ratio is related to the silt fraction void
ratio. The strain required decreases with increasing silt fraction void ratio.
8/8/2019 The Effects of Non-Plasticand Plastic Fines on the Liquefaction Of
http://slidepdf.com/reader/full/the-effects-of-non-plasticand-plastic-fines-on-the-liquefaction-of 243/288
229
• When analyzed in terms of the strain required to achieve a specified level of residual
pore pressure ratio, pore pressure generation in sands with plastic fines is independent
of fines content and clay content. The strain required increases with increasing liquid
limit, plasticity index, and activity.
8.4 Implications Of Research To Current Practice
The findings of the current study were examined to determine what effect they might
have on the methods of liquefaction analysis currently used in engineering practice. The
examination focused on the most commonly used method of liquefaction analysis, the
simplified method. These findings are summarized below:
• For soils below the limiting silt content, a constant cyclic resistance should be
obtained for a constant soil specific relative density when a proper fines correction is
applied. This is because the cyclic resistance below the limiting silt content is
independent of the silt content.
• The separate cyclic resistance curves used in the simplified method for different fines
content are a result of the differences in penetration resistance brought about by the
varying silt content, not a difference in liquefaction resistance.
• For soils with non-plastic fines below the limiting silt content, the fines correction
factors currently used with the SPT-based simplified method were found to
unconservative. They were adjusted to produce a constant cyclic resistance with a
constant soil specific relative density.
8/8/2019 The Effects of Non-Plasticand Plastic Fines on the Liquefaction Of
http://slidepdf.com/reader/full/the-effects-of-non-plasticand-plastic-fines-on-the-liquefaction-of 244/288
230
• No conclusions could be draw regarding the validity of analyses performed using the
data from cone penetration tests as no cone penetration test data was available for the
soils examined in this study.
• The fines corrections currently used were deemed potentially unconservative for soils
with silt content above the limiting silt content. These soils are known to have cyclic
resistances lower than similar soils below the limiting silt content, however as no
penetration testing was performed, it was not possible to make concrete conclusions
regarding the fines corrections.
• A small parametric study using data for 37 sands and 5 silts showed that
approximately 15 percent of the sands and silt combinations investigated had limiting
silt contents below 35 percent.
• For soils with plastic fines, the simplified procedure will not give accurate results
with the fines corrections currently in use.
• A plasticity based liquefaction criteria was suggested. It may be seen in Figure 8-2.
• Soils meeting the proposed criteria of either a plasticity index greater than 10 or a
liquid limit greater than 25 appear to be susceptible to cyclic mobility but not to flow
liquefaction.
• Soils not meeting the proposed criteria appear to be susceptible to flow liquefaction,
and should have their liquefaction resistance evaluated using laboratory testing.

8/8/2019 The Effects of Non-Plasticand Plastic Fines on the Liquefaction Of
http://slidepdf.com/reader/full/the-effects-of-non-plasticand-plastic-fines-on-the-liquefaction-of 245/288
231
• The pore pressure generation data developed during the laboratory testing portion of a
study may be used to determine pore pressure development in soils not reaching full
liquefaction.
• For clean sands and sands with non-plastic fines, separate curves are required for soils
which are susceptible to flow liquefaction, and those which are susceptible to cyclic
mobility.
• For sands with plastic fines separate curves are required for each specific soil due to
the variation in pore pressure development with changing soil plasticity.

8/8/2019 The Effects of Non-Plasticand Plastic Fines on the Liquefaction Of
http://slidepdf.com/reader/full/the-effects-of-non-plasticand-plastic-fines-on-the-liquefaction-of 246/288
232
Figure 8-1: Variation in cyclic resistance with silt content for Yatesville sand specimens
adjusted to 25% soil specific relative density
0.00
0.05
0.10
0.15
0.20
0.25
0.30
0.35
0.40
0.45
0.50
0 10 20 30 40 50 60 70 80 90 100
Silt Content (%)
C y c l i c R e s i s t a n c e
Limiting silt content

8/8/2019 The Effects of Non-Plasticand Plastic Fines on the Liquefaction Of
http://slidepdf.com/reader/full/the-effects-of-non-plasticand-plastic-fines-on-the-liquefaction-of 247/288
233
Figure 8-2: Proposed zone of liquefiable soils
0
5
10
15
20
0 5 10 15 20 25 30 35 40
Liquid Limit
P l a s t i c i t y I n d e x
ML
CL
Proposed Zone Of
Liquefiable Soils

8/8/2019 The Effects of Non-Plasticand Plastic Fines on the Liquefaction Of
http://slidepdf.com/reader/full/the-effects-of-non-plasticand-plastic-fines-on-the-liquefaction-of 248/288
234
References
Arman, A. and Thorton, S.I. (1973) “Identification Of Collapsible Soils In Louisiana”
Highway Research Record Number 426, Soil Classification, Highway Research Board,
National Research Council, Washington D.C.
Casagrande, A., (1975) “Liquefaction And Cyclic Mobility Of Sands. A Critical Review”
Proceedings of the 5th Pan American Conference on Soil Mechanics and Foundation
Engineering, Buenas Aires, Vol. 5, pp. 80-133
Castro, G. and Poulos, S.J., (1977) “Factors Affecting Liquefaction And Cyclic Mobility”
Journal of the Geotechnical Engineering Division, ASCE, Vol. 103(6), pp.501 - 516.
Chan, C. K., (1985) “Instruction Manual, CKC E/P Cyclic Loading Triaxial System Users
Manual” Soil Engineering Equipment Company. San Francisco, CA.
Chaney, R. C., (1976) “Deformations Of Earth Dams Due To Earthquake Loadings”
thesis presented to the University of California, at Los Angeles, California, in partial
fulfillment of the requirements for the degree of Doctor of Philosophy.
Chang, N.Y., Yeh, S.T., and Kaufman, L.P. (1982) “Liquefaction Potential Of Clean And
Silty Sands” Proceedings of the 3rd International Earthquake Microzonation
Conference, Seattle, USA, Vol. 2, pp. 1017-1032.
Clukey, E.C., Kulhawy, F.H., and Liu, P. (1983) “Laboratory and Field Investigation of
Wave-Sediment Interaction” Report to National Science Foundation, Geotechnical
Engineering Report 83-9, Cornell University, October.
8/8/2019 The Effects of Non-Plasticand Plastic Fines on the Liquefaction Of
http://slidepdf.com/reader/full/the-effects-of-non-plasticand-plastic-fines-on-the-liquefaction-of 249/288
235
Dezfulian, H., (1982) . “Effects of Silt Content on Dynamic Properties of Sandy Soils”
Proceedings of the Eighth World Conference on Earthquake Engineering, San Francisco,
USA, pp. 63-70.
De Alba, P., Seed,H., and Chan, C., (1976). “Sand Liquefaction In Large Simple Shear
Tests” Journal of the Geotechnical Engineering Division, ASCE, Vol. 102(9), pp.909-
927.
Dobry, R., and Alvarez, L., (1967). “Seismic Failures Of Chilean Tailings Dams” Journal
of the Soil Mechanics and Foundations Division, ASCE, Vol. 93(6), pp. 237-260.
Dobry, R., Ladd, R., Yokel, F., Chung, R., Powell, D., (1982). “Prediction Of Pore Water
Pressure Buildup And Liquefaction Of Sands During Earthquakes By The Cyclic Strain
Method” NBS Building Science Series 138, National Bureau of Standards, US
Department of Commerce.
El Hosri, M. S., Biarez, J., and Hicher, P.Y., (1982). “Liquefaction Characteristics Of
Silty Clay” Proceedings. of the Eighth World Conference on Earthquake Engineering,
San Francisco, USA, pp. 277-284.
Fei, H.C. (1991). “The Characteristics of Liquefaction Of Silt Soil” Soil Dynamics and
Earthquake Engineering V, Computational Mechanics Publications, Southhampton,
pp. 293-302.
Finn, W.L., (1982). “Soil Liquefaction Studies In The People’s Republic of China” SoilMechanics - Transient and Cyclic Loads, John Wiley and Sons, New York, pp. 609-626.
8/8/2019 The Effects of Non-Plasticand Plastic Fines on the Liquefaction Of
http://slidepdf.com/reader/full/the-effects-of-non-plasticand-plastic-fines-on-the-liquefaction-of 250/288
236
Finn, W.L., Ledbetter, R.H., and Wu, G., (1994). “Liquefaction In Silty Soils: Design
And Analysis” Ground Failures Under Seismic Conditions, Geotechnical Special
Publication No. 44, ASCE, pp. 51-76.
Florin, V.A., and Ivanov, P.L., (1961). “Liquefaction Of Saturated Sandy Soils”
Proceedings of the Fifth International Conference on Soil Mechanics and Foundation
Engineering, Paris, France, Vol. 1, pp.107-111.
Garga, V., and McKay, L., (1984). “Cyclic Triaxial Strength Of Mines Tailings” Journal
of Geotechnical Engineering, ASCE, Vol. 110(8), pp.1091- 1105.
Holzer, T. L., Youd, T. L., and Hanks, T. C. (1989). “Dynamics of Liquefaction During
the 1987 Superstition Hills, California, Earthquake” Science, Vol. 244, April 7,
pp. 56-59.
Ishihara, K. (1993). “Liquefaction And Flow Failure During Earthquakes” Géotechnique,
Vol. 43, No. 3, pp. 351-415.
Ishihara, K. (1996). “Soil Behaviour in Earthquake Geotechnics”, 1rst ed., Oxford,
Claredon Press, 350 pp.
Ishihara, K., and Koseki, (1989). “Discussion On The Cyclic Shear Strength Of Fines-
Containing Sands” Earthquakes Geotechnical Engineering, Proceedings of the Eleventh
International Conference on Soil Mechanics and Foundation Engineering, Rio De
Janiero, Brazil, pp. 101-106.
Ishihara, K., Sodewkawa, M., and Tanaka, Y. (1977). “Effects Of Overconsolidation On
Liquefaction Characteristics Of Sands Containing Fines” Dynamic Geotechnical Testing,
ASTM STP 654, American Society for Testing and Materials, pp. 246-264.
8/8/2019 The Effects of Non-Plasticand Plastic Fines on the Liquefaction Of
http://slidepdf.com/reader/full/the-effects-of-non-plasticand-plastic-fines-on-the-liquefaction-of 251/288
237
Jennings, P.C. (1980) “Earthquake Engineering and Hazards Reduction in China,
CSCPRC Report No. 8”, National Academy of Sciences, Washington, D.C., 1980
Koester, J.P. (1994) “The Influence Of Fine Type And Content On Cyclic Strength”
Ground Failures Under Seismic Conditions, Geotechnical Special Publication No. 44,
ASCE, pp. 17-33.
Kuerbis, R., Negussey, D., and Vaid, V. P. (1988). “Effect Of Gradation And Fines
Content On The Undrained Response Of Sand” Proceedings. Hydraulic Fill Structures,
Fort Collins, USA, pp. 330-345.
Ladd, R.S., (1978). “Preparing Test Specimens Using Undercompaction” Geotechnical
Testing Journal, GTJODJ, Vol. 1, No. 1, March 1978, pp.16-23.
Lade, P.V. and Lee, K.L. (1976) “Engineering Properties Of Soils, Report No.
UCLA-ENG-7652” Soil Mechanics Laboratory, UCLA, Los Angeles, CA, May.
Law, K.T. and Ling, Y.H. (1992). "Liquefaction Of Granular Soils With Non-Cohesive
and Cohesive Fines" Proceedings of the Tenth World Conference on Earthquake
Engineering, Rotterdam, pp. 1491-1496.
Lee, K.L., and Albaisa, A., (1974). “Earthquake Induced Settlements In Saturated Sands”
Journal of the Geotechnical Engineering Division, ASCE, Vol. 100(4), pp. 387 - 406.
Lee, K.L., and Fitton, J.A., (1968). “Factors Affecting The Cyclic Loading Strength Of
Soil,” Vibration Effects of Earthquakes on Soils and Foundations, ASTM STP 450,
American Society for Testing and Materials, pp. 71-95.

8/8/2019 The Effects of Non-Plasticand Plastic Fines on the Liquefaction Of
http://slidepdf.com/reader/full/the-effects-of-non-plasticand-plastic-fines-on-the-liquefaction-of 252/288
238
Lee, K.L., and Seed, H.B., (1967a). “Cyclic Stress Conditions Causing Liquefaction Of
sand” Journal of the Soil Mechanics and Foundations Division, ASCE, Vol. 93, SM1, pp.
47-70.
Lee, K.L., and Seed, H.B., (1967b). “Dynamic Strength Of Anisotropically Consolidated
Sand” Journal of the Soil Mechanics and Foundations Division, ASCE, Vol. 93, SM5,
pp. 169-190.
Lee, K., and Singh, A (1971) "Compaction of Granular Soils" Proceedings of the 7th
Annual Symposium on Engineering Geology, Boise Idaho, April 5-7, 1971
Marsuson, W.F., Hynes, M.E., and Franklin, A.G. (1990). “Evaluation and Use of
Residual Strength in Seismic Safety Analysis of Embankments” Earthquake Spectra,
EERI, Vol 6, No. 3, pp. 529-572.
Mitchell, J.K. (1993). “Fundamentals of Soil Behavior ”, 2nd ed., New York, John Wiley
& Sons, Inc., 450 pp.
Mogami, T., and Kubo, K., (1953). “The Behaviour Of Soil During Vibration”
Proceedings of the Third International Conference on Soil Mechanics and Foundation
Engineering, Vol. 1, pp. 152-153.
Mulilis, J. P., (1975). “The Effect Of Sample Preparation On The Cyclic Stress-Strain
Behavior Of Sands” thesis presented to the University of California, at Berkeley,
California, in partial fulfillment of the requirements for the degree of Doctor of Philosophy.
8/8/2019 The Effects of Non-Plasticand Plastic Fines on the Liquefaction Of
http://slidepdf.com/reader/full/the-effects-of-non-plasticand-plastic-fines-on-the-liquefaction-of 253/288
239
Mulilis, J. P., Townsend, F. C., and Horz, R. C., (1978). “Triaxial Testing Techniques
And Sand Liquefaction” Dynamic Geotechnical Testing, ASTM STP 654, American
Society for Testing and Materials, pp. 265-279.
Mullen, G.W., (1991) “Evaluation Of The Utility Of Four In-Situ Test Methods For
Transmission Line Foundation Design” thesis presented to the Faculty of Virginia
Polytechnic Institute and State University, in partial fulfillment of the requirements for
the degree of Doctor of Philosophy in Civil Engineering.
Okashi, Y. (1970) “Effects Of Sand Compaction On Liquefaction During Tokachioki
Earthquake” Soils and Foundations, JSSMFE, Vol. 10, No. 2, pp. 112-128.
Okusa, S., Anma, S., and Maikuma, H. (1980). “Liquefaction Of Mine Tailings In The
1978 Izu-Oshima-Kinkai Earthquake, Central Japan” Proceedings. of the Seventh World
Conference on Earthquake Engineering, Istanbul, Turkey, Vol. 3, pp. 89-96.
Polito, C.P., and Martin, J.R., (1999). “The Effects Of Non-Plastic Fines On the
Liquefaction Resistance Of Sands” Currently Under Review by Journal of Geotechnical
and Geoenvironmental Engineering.
Prakash, S., and Puri, V.K., (1982). “Liquefaction Of Loessial Soils” Proceedings. of the
3rd International Earthquake Microzonation Conference, Seattle, USA, Vol. 2,
pp.1101-1107.
Robertson, P.K., and Campanella, R.G., (1985). “Liquefaction Potential Of Sands UsingCPT” Journal of Geotechnical Engineering, ASCE, Vol. 111(3), pp. 384-403.

8/8/2019 The Effects of Non-Plasticand Plastic Fines on the Liquefaction Of
http://slidepdf.com/reader/full/the-effects-of-non-plasticand-plastic-fines-on-the-liquefaction-of 254/288
240
Robertson, P.K., and Wride, C.E.(1997). “Cyclic Liquefaction and its Evaluation based
on the SPT and CPT” Proceedings of the NCEER Workshop on Evaluation of
Liquefaction Resistance of Soils, Technical Report NCEER-97-0022, December, pp. 41-
87.
Seed, H.B., (1979). “Soil Liquefaction And Cyclic Mobility Evaluation For Level Ground
During Earthquakes” Journal of Geotechnical Engineering, ASCE, Vol. 105, GT2,
pp. 201-255.
Seed, H.B., (1987). “Design Problems In Soil Liquefaction” Journal of Geotechnical
Engineering, ASCE, Vol. 113(8), pp. 827-845.
Seed, H.B., and Idriss, I.M., (1971). “Simplified Procedure For Evaluation Soil
Liquefaction Potential” Journal of the Soil Mechanics and Foundations Division, ASCE,
Vol. 97(9), pp.1249-1273.
Seed, H.B., Idriss, I.M., and Arango, I., (1983). “Evaluation Of Liquefaction Potential
Using Field Performance Data” Journal of Geotechnical Engineering, ASCE, Vol.
109(3), pp. 458-482.
Seed, H.B., and Lee, K.L., (1966). “Liquefaction Of Saturated Sands During Cyclic
Loading” Journal of the Soil Mechanics and Foundations Division, ASCE, Vol. 92, SM6,
pp. 105-134.
Seed, H.B., Lee, K.L., Idriss, I.M., and Makdisi, F. (1973). “Analysis of the Slides in theSan Fernando Dams During the Earthquake of February 9, 1971.” Report No. UCB/
EERC 73-2, Earthquake Engineering Research Center, University of California, Berkeley,
Calif.
8/8/2019 The Effects of Non-Plasticand Plastic Fines on the Liquefaction Of
http://slidepdf.com/reader/full/the-effects-of-non-plasticand-plastic-fines-on-the-liquefaction-of 255/288
241
Seed, H.B., and Pyke, R.M., (1975). “Analysis of the Effect of Multi-Directional Shaking
on the Liquefaction Characteristics of Sands During Cyclic Loading” Report No. EERC
75-41, Earthquake Engineering Research Center, University of California, Berkeley,
Calif., Dec., 1975.
Seed, H.B., Tokimatsu, K., Harder, L., and Chung, R. (1985). “Influence Of SPT
Procedures In Soil Liquefaction Resistance Evaluations” Journal of Geotechnical
Engineering, ASCE, Vol. 111(12), pp.1425-1445.
Shen, C.K., Vrymoed, J.L., and Uyeno, C.K., (1977) “The Effects Of Fines On
Liquefaction Of Sands” Proceedings of the Ninth International Conference on Soil Mech.
and Found. Eng., Tokyo, Japan, Vol. 2, pp.381-385.
Shibata, T., and Teparaksa, W., (1988). “Evaluation Of Liquefaction Potentials Of Soils
Using Cone Penetration Tests” Soils and Foundations, JSSMFE, Vol. 28, No. 2,
pp. 49-60.
Silver, M. L., (1977). “Laboratory Triaxial Testing Procedures To Determine The Cyclic
Strength Of Soils” NUREG-0031, National Technical Information Service, Springfield,
VA.
Silver, M., Chan, C., Ladd, R., Lee, K., Tiedmann, D., Townsend, F., Valera, J.,
Wilson, J., (1976). “Cyclic Strength Of Standard Test Sand” Journal of the Geotechnical
Engineering Division, ASCE, Vol. 102(5), pp. 511-523.

8/8/2019 The Effects of Non-Plasticand Plastic Fines on the Liquefaction Of
http://slidepdf.com/reader/full/the-effects-of-non-plasticand-plastic-fines-on-the-liquefaction-of 256/288
242
Singh, S., (1994). “Liquefaction Characteristics Of Silt” Ground Failures Under Seismic
Conditions, Geotechnical Special Publication No. 44, ASCE, pp. 105-116.
Skempton, A.W., (1954). “The Pore-Pressure Coefficients A and B” Géotechnique,
Vol. IV, pp.143-147.
Tatsuoka, F., Iwasaki, T., Tokida, K., Yasuda, S., Hirose, M., Imai, T., and Kon-No, M.,
(1980). “Standard Penetration Tests And Soil Liquefaction Potential Evaluation” Soils
and Foundations, JSSMFE, Vol. 20, No. 4, pp. 95-111.
Tokimatsu, K., and Yoshimi, Y., (1981). “Field Correlation Of Soil Liquefaction With
SPT And Grain Size” Proceedings of the International Conference on Recent Advances
in Geotechnical Earthquake Engineering and Soil Dynamics, Rolla, USA, Vol.1, pp. 203-
208.
Tokimatsu, K., and Yoshimi, Y., (1983). “Empirical Correlation Of Soil Liquefaction
Based On SPT N-Value And Fines Content” Soils and Foundations, JSSMFE, Vol. 23,
No. 4, pp. 56-74.
Townsend, F., (1978). “A Review Of Factors Affecting Cyclic Triaxial Tests” Dynamic
Geotechnical Testing, ASTM STP 654, American Society for Testing and Materials,
pp. 356-383.
Tronsco, J.H., (1990). “Failure Risks Of Abandoned Tailings Dams” Proceedings. Int.
Symposium. on Safety and Rehabilitation of Tailings Dams, CIGB ICOLD, Sydney,Australia, pp. 34-47.
8/8/2019 The Effects of Non-Plasticand Plastic Fines on the Liquefaction Of
http://slidepdf.com/reader/full/the-effects-of-non-plasticand-plastic-fines-on-the-liquefaction-of 257/288
243
Tronsco, J.H., and Verdugo, R., (1985). “Silt Content And Dynamic Behavior Of Tailing
Sands” Proceedings. Twelfth International Conference on Soil Mech. and Found. Eng.,
San Francisco, USA, pp.1311-1314.
Vaid, V.P., (1994). “Liquefaction Of Silty Soils” Ground Failures Under Seismic
Conditions, Geotechnical Special Publication No. 44, ASCE, pp.1-16.
Yasuda, S., Wakamatsu, K., Nagase, H., (1994). “Liquefaction Of Artificially Filled Silty
Sands” Ground Failures Under Seismic Conditions, Geotechnical Special Publication No.
44, ASCE, pp. 91-104.
Youd, L., and Bennett, M.J. (1983). “Liquefaction Sites, Imperial Valley, California”
Journal of Geotechnical Engineering, ASCE, Vol. 109(3), pp. 440-457.
Youd, L., and Idriss, I. M.(1997). “Summary Report” Proceedings of the NCEER
Workshop on Evaluation of Liquefaction Resistance of Soils, Technical Report
NCEER-97-0022, December pp. 1-40.
Wang, W. (1979). “Some Findings in Soil Liquefaction” Water Conservancy and
Hydroelectric Power Scientific Research Institute, Beijing, China, August.
8/8/2019 The Effects of Non-Plasticand Plastic Fines on the Liquefaction Of
http://slidepdf.com/reader/full/the-effects-of-non-plasticand-plastic-fines-on-the-liquefaction-of 258/288
244
Appendix A: Cyclic Triaxial Tests - Test Parameters
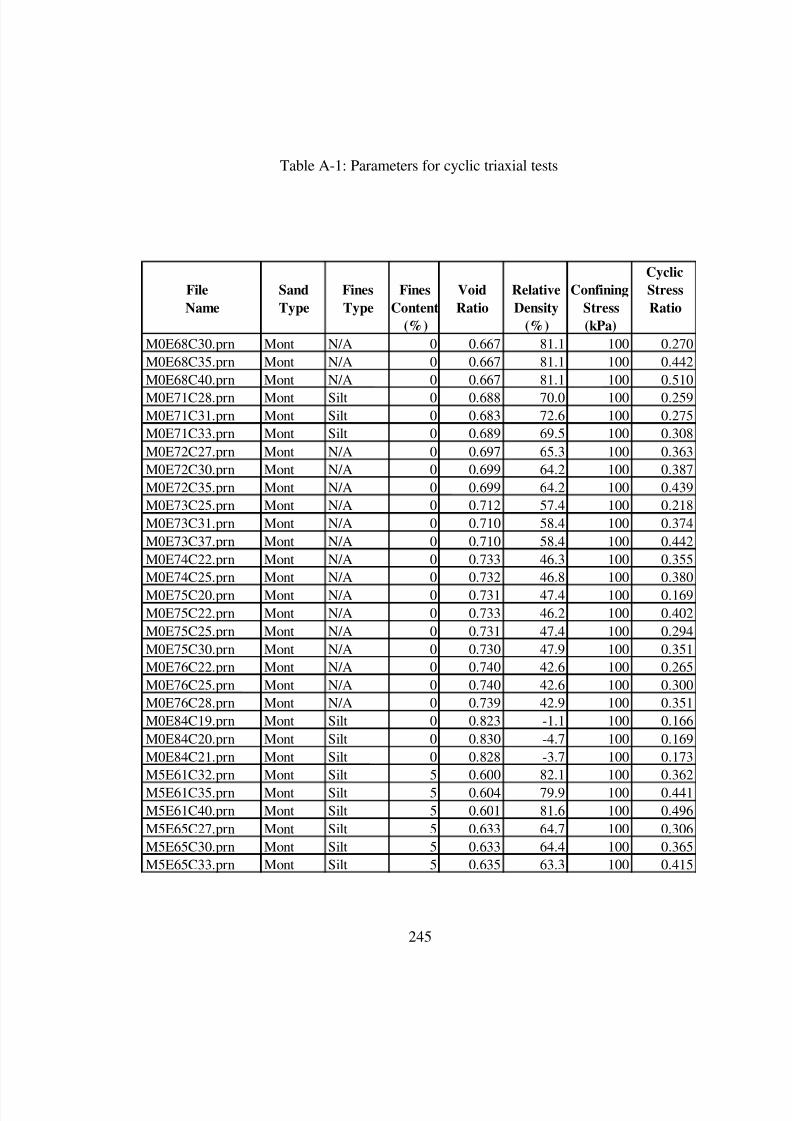
8/8/2019 The Effects of Non-Plasticand Plastic Fines on the Liquefaction Of
http://slidepdf.com/reader/full/the-effects-of-non-plasticand-plastic-fines-on-the-liquefaction-of 259/288

8/8/2019 The Effects of Non-Plasticand Plastic Fines on the Liquefaction Of
http://slidepdf.com/reader/full/the-effects-of-non-plasticand-plastic-fines-on-the-liquefaction-of 260/288
246
Table A-1: Parameters for cyclic triaxial tests (Continued)
Cyclic
File Sand Fines Fines Void Relative Confining Stress
Name Type Type Content Ratio Density Stress Ratio
(%) (%) (kPa)
M5E67C22.prn Mont Silt 5 0.654 53.4 100 0.198
M5E67C23.prn Mont Silt 5 0.653 54.0 100 0.288
M5E67C25.prn Mont Silt 5 0.652 54.5 100 0.307
M5E67C28.prn Mont Silt 5 0.650 55.6 100 0.348
M5E68C20.prn Mont Silt 5 0.661 49.7 100 0.171
M5E68C25.prn Mont Silt 5 0.661 49.7 100 0.289
M5E68C30.prn Mont Silt 5 0.654 53.4 100 0.379
M10E53C30.prn Mont Silt 10 0.514 81.0 100 0.351
M10E53C35.prn Mont Silt 10 0.517 79.7 100 0.441
M10E53C40.prn Mont Silt 10 0.515 80.6 100 0.512
M10E57C25.prn Mont Silt 10 0.556 62.9 100 0.295
M10E57C35.prn Mont Silt 10 0.556 62.9 100 0.403
M10E60C20.prn Mont Silt 10 0.581 52.2 100 0.252
M10E60C25.prn Mont Silt 10 0.582 51.7 100 0.289
M10E60C30.prn Mont Silt 10 0.582 51.7 100 0.361
M10E68C22.prn Mont Silt 10 0.673 12.5 100 0.276
M10E68C25.prn Mont Silt 10 0.670 13.8 100 0.298
M15E48C30.prn Mont Silt 15 0.465 81.7 100 0.339
M15E48C35.prn Mont Silt 15 0.464 82.1 100 0.426
M15E48C38.prn Mont Silt 15 0.465 81.7 100 0.472
M15E53C20.prn Mont Silt 15 0.515 61.8 100 0.250
M15E53C23.prn Mont Silt 15 0.513 62.5 100 0.269
M15E53C28.prn Mont Silt 15 0.512 62.9 100 0.330
M15E68C13.prn Mont Silt 15 0.643 10.8 100 0.184
M15E68C15.prn Mont Silt 15 0.642 11.2 100 0.163
M15E68C20.prn Mont Silt 15 0.643 10.8 100 0.217
M20E36C25.prn Mont Silt 20 0.353 96.8 100 0.424
M20E36C35.prn Mont Silt 20 0.351 97.5 100 0.491
M20E36C40.prn Mont Silt 20 0.353 96.8 100 0.220
M20E46C18.prn Mont Silt 20 0.455 60.8 100 0.233
M20E46C20.prn Mont Silt 20 0.454 61.1 100 0.295
M20E46C25.prn Mont Silt 20 0.455 60.8 100 0.323
M20E46C28.prn Mont Silt 20 0.456 60.4 100 0.146
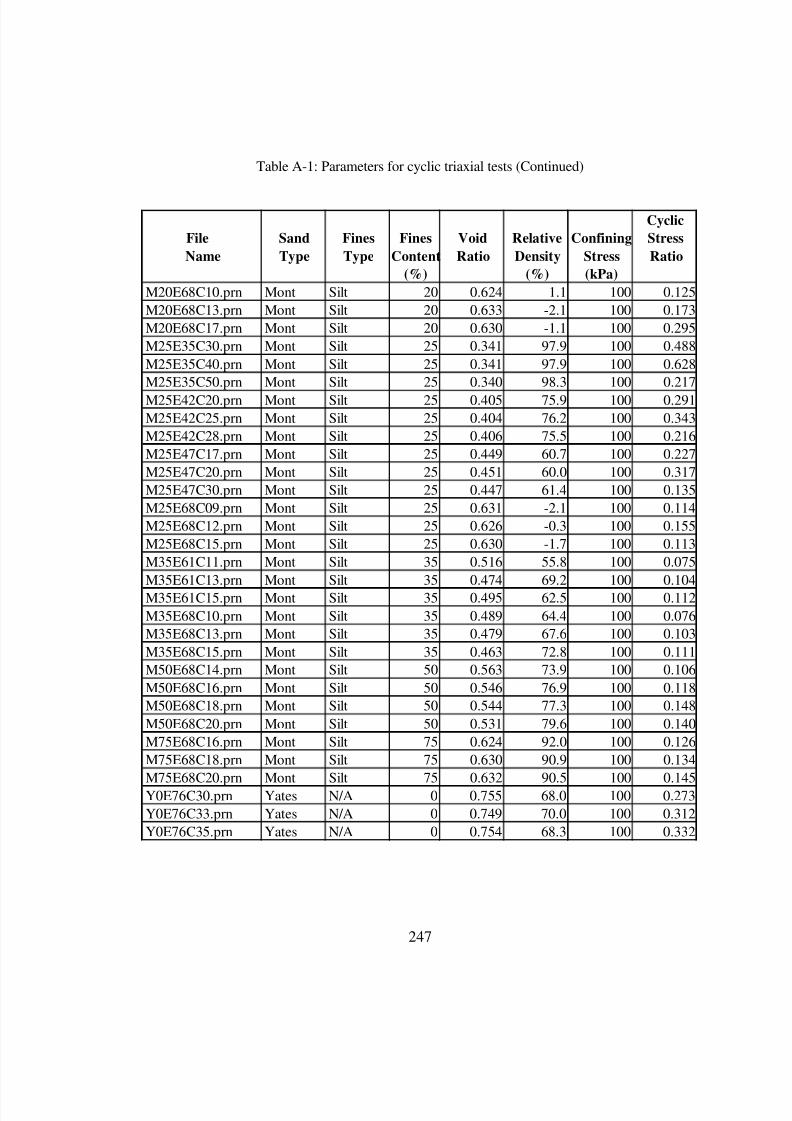
8/8/2019 The Effects of Non-Plasticand Plastic Fines on the Liquefaction Of
http://slidepdf.com/reader/full/the-effects-of-non-plasticand-plastic-fines-on-the-liquefaction-of 261/288
247
Table A-1: Parameters for cyclic triaxial tests (Continued)
Cyclic
File Sand Fines Fines Void Relative Confining Stress
Name Type Type Content Ratio Density Stress Ratio
(%) (%) (kPa)
M20E68C10.prn Mont Silt 20 0.624 1.1 100 0.125
M20E68C13.prn Mont Silt 20 0.633 -2.1 100 0.173
M20E68C17.prn Mont Silt 20 0.630 -1.1 100 0.295
M25E35C30.prn Mont Silt 25 0.341 97.9 100 0.488
M25E35C40.prn Mont Silt 25 0.341 97.9 100 0.628
M25E35C50.prn Mont Silt 25 0.340 98.3 100 0.217
M25E42C20.prn Mont Silt 25 0.405 75.9 100 0.291
M25E42C25.prn Mont Silt 25 0.404 76.2 100 0.343
M25E42C28.prn Mont Silt 25 0.406 75.5 100 0.216
M25E47C17.prn Mont Silt 25 0.449 60.7 100 0.227
M25E47C20.prn Mont Silt 25 0.451 60.0 100 0.317
M25E47C30.prn Mont Silt 25 0.447 61.4 100 0.135
M25E68C09.prn Mont Silt 25 0.631 -2.1 100 0.114
M25E68C12.prn Mont Silt 25 0.626 -0.3 100 0.155
M25E68C15.prn Mont Silt 25 0.630 -1.7 100 0.113
M35E61C11.prn Mont Silt 35 0.516 55.8 100 0.075
M35E61C13.prn Mont Silt 35 0.474 69.2 100 0.104
M35E61C15.prn Mont Silt 35 0.495 62.5 100 0.112
M35E68C10.prn Mont Silt 35 0.489 64.4 100 0.076
M35E68C13.prn Mont Silt 35 0.479 67.6 100 0.103
M35E68C15.prn Mont Silt 35 0.463 72.8 100 0.111
M50E68C14.prn Mont Silt 50 0.563 73.9 100 0.106
M50E68C16.prn Mont Silt 50 0.546 76.9 100 0.118
M50E68C18.prn Mont Silt 50 0.544 77.3 100 0.148
M50E68C20.prn Mont Silt 50 0.531 79.6 100 0.140
M75E68C16.prn Mont Silt 75 0.624 92.0 100 0.126
M75E68C18.prn Mont Silt 75 0.630 90.9 100 0.134
M75E68C20.prn Mont Silt 75 0.632 90.5 100 0.145
Y0E76C30.prn Yates N/A 0 0.755 68.0 100 0.273
Y0E76C33.prn Yates N/A 0 0.749 70.0 100 0.312
Y0E76C35.prn Yates N/A 0 0.754 68.3 100 0.332

8/8/2019 The Effects of Non-Plasticand Plastic Fines on the Liquefaction Of
http://slidepdf.com/reader/full/the-effects-of-non-plasticand-plastic-fines-on-the-liquefaction-of 262/288
248
Table A-1: Parameters for cyclic triaxial tests (Continued)
Cyclic
File Sand Fines Fines Void Relative Confining Stress
Name Type Type Content Ratio Density Stress Ratio
(%) (%) (kPa)
Y0E90C19.prn Yates N/A 0 0.885 27.3 100 0.130
Y0E90C22.prn Yates N/A 0 0.893 24.8 100 0.155
Y0E90C25.prn Yates N/A 0 0.890 25.6 100 0.200
Y0E11C10.prn Yates N/A 0 1.006 -10.6 100 0.076
Y0E11C12.prn Yates N/A 0 1.005 -10.4 100 0.088
Y0E11C14.prn Yates N/A 0 1.007 -10.9 100 0.104
Y0E12C09.prn Yates N/A 0 1.076 -32.7 100 0.023
Y0E12C10.prn Yates N/A 0 1.114 -44.5 100 0.060
Y0E12C11.prn Yates N/A 0 1.091 -37.2 100 0.063
Y0E12C13.prn Yates N/A 0 1.075 -32.3 100 0.085
Y0E12C14.prn Yates N/A 0 1.074 -32.0 100 0.103
Y4E76C27.prn Yates Silt 4 0.754 52.1 100 0.239
Y4E76C30.prn Yates Silt 4 0.753 52.4 100 0.274
Y4E76C35.prn Yates Silt 4 0.754 52.1 100 0.323
Y4E83C22.prn Yates Silt 4 0.822 29.5 100 0.184
Y4E83C25.prn Yates Silt 4 0.818 30.8 100 0.223
Y4E83C28.prn Yates Silt 4 0.822 29.5 100 0.234
Y4E86C17.prn Yates Silt 4 0.828 27.5 100 0.136
Y4E86C18.prn Yates Silt 4 0.842 22.9 100 0.142
Y4E86C20.prn Yates Silt 4 0.826 28.2 100 0.156
Y4E86C23.prn Yates Silt 4 0.852 19.6 100 0.207
Y4E97C12.prn Yates Silt 4 0.944 -10.9 100 0.096
Y4E97C14.prn Yates Silt 4 0.938 -9.0 100 0.109
Y4E97C15.prn Yates Silt 4 0.940 -9.6 100 0.123
Y4E11C10.prn Yates Silt 4 1.021 -36.5 100 0.080
Y4E11C12.prn Yates Silt 4 1.018 -35.5 100 0.076
Y4E11C14.prn Yates Silt 4 1.002 -30.2 100 0.105
Y7E76C26.prn Yates Silt 7 0.755 34.0 100 0.228
Y7E76C27.prn Yates Silt 7 0.753 34.6 100 0.240
Y7E76C30.prn Yates Silt 7 0.756 33.7 100 0.273
Y7E76C32.prn Yates Silt 7 0.756 33.7 100 0.296
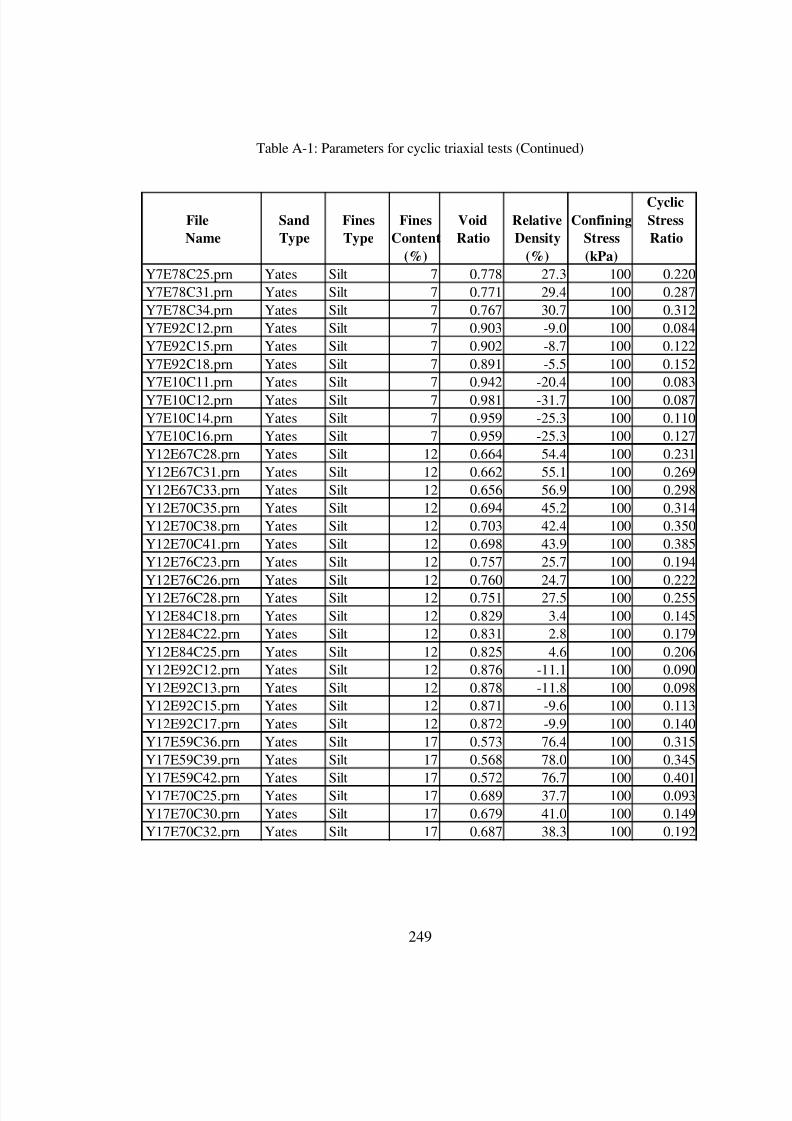
8/8/2019 The Effects of Non-Plasticand Plastic Fines on the Liquefaction Of
http://slidepdf.com/reader/full/the-effects-of-non-plasticand-plastic-fines-on-the-liquefaction-of 263/288
249
Table A-1: Parameters for cyclic triaxial tests (Continued)
Cyclic
File Sand Fines Fines Void Relative Confining Stress
Name Type Type Content Ratio Density Stress Ratio
(%) (%) (kPa)
Y7E78C25.prn Yates Silt 7 0.778 27.3 100 0.220
Y7E78C31.prn Yates Silt 7 0.771 29.4 100 0.287
Y7E78C34.prn Yates Silt 7 0.767 30.7 100 0.312
Y7E92C12.prn Yates Silt 7 0.903 -9.0 100 0.084
Y7E92C15.prn Yates Silt 7 0.902 -8.7 100 0.122
Y7E92C18.prn Yates Silt 7 0.891 -5.5 100 0.152
Y7E10C11.prn Yates Silt 7 0.942 -20.4 100 0.083
Y7E10C12.prn Yates Silt 7 0.981 -31.7 100 0.087
Y7E10C14.prn Yates Silt 7 0.959 -25.3 100 0.110
Y7E10C16.prn Yates Silt 7 0.959 -25.3 100 0.127
Y12E67C28.prn Yates Silt 12 0.664 54.4 100 0.231
Y12E67C31.prn Yates Silt 12 0.662 55.1 100 0.269
Y12E67C33.prn Yates Silt 12 0.656 56.9 100 0.298
Y12E70C35.prn Yates Silt 12 0.694 45.2 100 0.314
Y12E70C38.prn Yates Silt 12 0.703 42.4 100 0.350
Y12E70C41.prn Yates Silt 12 0.698 43.9 100 0.385
Y12E76C23.prn Yates Silt 12 0.757 25.7 100 0.194
Y12E76C26.prn Yates Silt 12 0.760 24.7 100 0.222
Y12E76C28.prn Yates Silt 12 0.751 27.5 100 0.255
Y12E84C18.prn Yates Silt 12 0.829 3.4 100 0.145
Y12E84C22.prn Yates Silt 12 0.831 2.8 100 0.179
Y12E84C25.prn Yates Silt 12 0.825 4.6 100 0.206
Y12E92C12.prn Yates Silt 12 0.876 -11.1 100 0.090
Y12E92C13.prn Yates Silt 12 0.878 -11.8 100 0.098
Y12E92C15.prn Yates Silt 12 0.871 -9.6 100 0.113
Y12E92C17.prn Yates Silt 12 0.872 -9.9 100 0.140
Y17E59C36.prn Yates Silt 17 0.573 76.4 100 0.315
Y17E59C39.prn Yates Silt 17 0.568 78.0 100 0.345
Y17E59C42.prn Yates Silt 17 0.572 76.7 100 0.401
Y17E70C25.prn Yates Silt 17 0.689 37.7 100 0.093
Y17E70C30.prn Yates Silt 17 0.679 41.0 100 0.149
Y17E70C32.prn Yates Silt 17 0.687 38.3 100 0.192
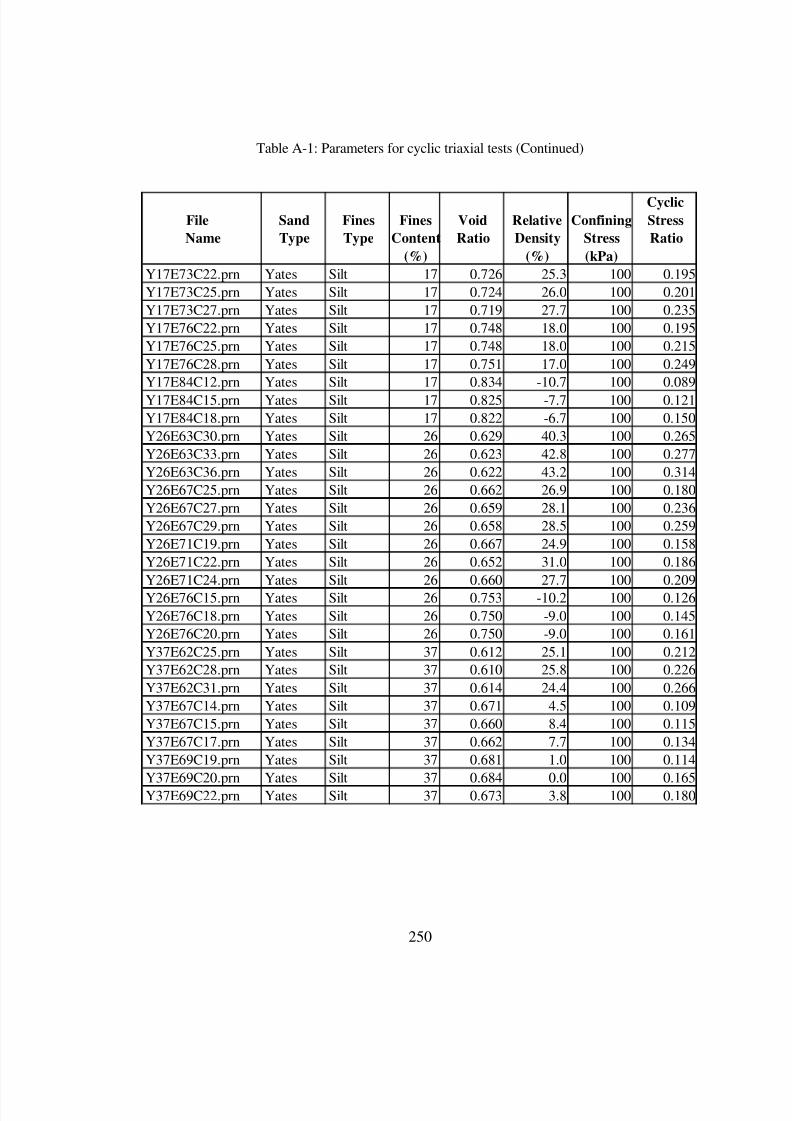
8/8/2019 The Effects of Non-Plasticand Plastic Fines on the Liquefaction Of
http://slidepdf.com/reader/full/the-effects-of-non-plasticand-plastic-fines-on-the-liquefaction-of 264/288
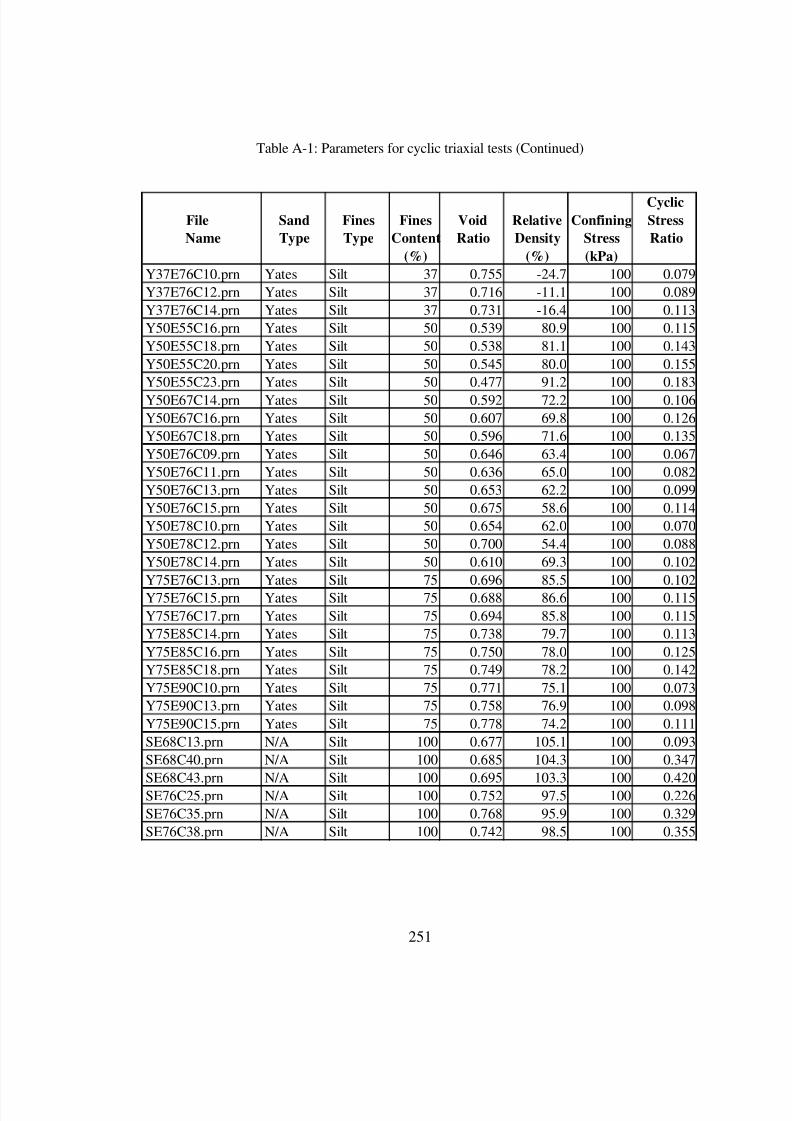
8/8/2019 The Effects of Non-Plasticand Plastic Fines on the Liquefaction Of
http://slidepdf.com/reader/full/the-effects-of-non-plasticand-plastic-fines-on-the-liquefaction-of 265/288
251
Table A-1: Parameters for cyclic triaxial tests (Continued)
Cyclic
File Sand Fines Fines Void Relative Confining Stress
Name Type Type Content Ratio Density Stress Ratio
(%) (%) (kPa)
Y37E76C10.prn Yates Silt 37 0.755 -24.7 100 0.079
Y37E76C12.prn Yates Silt 37 0.716 -11.1 100 0.089
Y37E76C14.prn Yates Silt 37 0.731 -16.4 100 0.113
Y50E55C16.prn Yates Silt 50 0.539 80.9 100 0.115
Y50E55C18.prn Yates Silt 50 0.538 81.1 100 0.143
Y50E55C20.prn Yates Silt 50 0.545 80.0 100 0.155
Y50E55C23.prn Yates Silt 50 0.477 91.2 100 0.183
Y50E67C14.prn Yates Silt 50 0.592 72.2 100 0.106
Y50E67C16.prn Yates Silt 50 0.607 69.8 100 0.126
Y50E67C18.prn Yates Silt 50 0.596 71.6 100 0.135
Y50E76C09.prn Yates Silt 50 0.646 63.4 100 0.067
Y50E76C11.prn Yates Silt 50 0.636 65.0 100 0.082
Y50E76C13.prn Yates Silt 50 0.653 62.2 100 0.099
Y50E76C15.prn Yates Silt 50 0.675 58.6 100 0.114
Y50E78C10.prn Yates Silt 50 0.654 62.0 100 0.070
Y50E78C12.prn Yates Silt 50 0.700 54.4 100 0.088
Y50E78C14.prn Yates Silt 50 0.610 69.3 100 0.102
Y75E76C13.prn Yates Silt 75 0.696 85.5 100 0.102
Y75E76C15.prn Yates Silt 75 0.688 86.6 100 0.115
Y75E76C17.prn Yates Silt 75 0.694 85.8 100 0.115
Y75E85C14.prn Yates Silt 75 0.738 79.7 100 0.113
Y75E85C16.prn Yates Silt 75 0.750 78.0 100 0.125
Y75E85C18.prn Yates Silt 75 0.749 78.2 100 0.142
Y75E90C10.prn Yates Silt 75 0.771 75.1 100 0.073
Y75E90C13.prn Yates Silt 75 0.758 76.9 100 0.098
Y75E90C15.prn Yates Silt 75 0.778 74.2 100 0.111
SE68C13.prn N/A Silt 100 0.677 105.1 100 0.093
SE68C40.prn N/A Silt 100 0.685 104.3 100 0.347
SE68C43.prn N/A Silt 100 0.695 103.3 100 0.420
SE76C25.prn N/A Silt 100 0.752 97.5 100 0.226
SE76C35.prn N/A Silt 100 0.768 95.9 100 0.329
SE76C38.prn N/A Silt 100 0.742 98.5 100 0.355

8/8/2019 The Effects of Non-Plasticand Plastic Fines on the Liquefaction Of
http://slidepdf.com/reader/full/the-effects-of-non-plasticand-plastic-fines-on-the-liquefaction-of 266/288
252
Table A-1: Parameters for cyclic triaxial tests (Continued)
Cyclic
File Sand Fines Fines Void Relative Confining Stress
Name Type Type Content Ratio Density Stress Ratio
(%) (%) (kPa)
SE91C18.prn N/A Silt 100 0.871 85.6 100 0.150
SE91C20.prn N/A Silt 100 0.864 86.2 100 0.158
SE91C22.prn N/A Silt 100 0.855 87.2 100 0.177
SE95C10.prn N/A Silt 100 0.851 87.6 100 0.078
SE95C13.prn N/A Silt 100 0.843 88.4 100 0.092
SE95C15.prn N/A Silt 100 0.854 87.2 100 0.113
SE99C10.prn N/A Silt 100 0.884 84.3 100 0.073
SE99C13.prn N/A Silt 100 0.881 84.6 100 0.096
SE99C15.prn N/A Silt 100 0.880 84.7 100 0.105
YMK4C15.prn Yates S/K 4 0.804 35.5 100 0.121
YMK4C16.prn Yates S/K 4 0.784 42.0 100 0.120
YMK4C17.prn Yates S/K 4 0.812 32.9 100 0.129
YMK4C18.prn Yates S/K 4 0.781 43.2 100 0.148
YMK7C18.prn Yates S/K 7 0.748 36.0 100 0.147
YMK7C20.prn Yates S/K 7 0.749 35.8 100 0.159
YMK7C22.prn Yates S/K 7 0.751 35.3 100 0.178
YMK12C15.prn Yates S/K 12 0.718 37.9 100 0.114
YMK12C18.prn Yates S/K 12 0.716 38.5 100 0.142
YMK12C20.prn Yates S/K 12 0.719 37.5 100 0.158
YMK17C14.prn Yates S/K 17 0.652 50.1 100 0.105
YMK17C16.prn Yates S/K 17 0.661 47.1 100 0.125
YMK17C18.prn Yates S/K 17 0.676 42.1 100 0.139
YMK26C14.prn Yates S/K 26 0.581 60.1 100 0.110
YMK26C16.prn Yates S/K 26 0.578 61.0 100 0.122
YMK26C18.prn Yates S/K 26 0.587 57.6 100 0.144
YK4C10.prn Yates K 4 0.798 37.3 100 0.070
YK4C17.prn Yates K 4 0.810 33.3 100 0.128
YK4C20.prn Yates K 4 0.809 33.7 100 0.151
YK7C17.prn Yates K 7 0.760 32.6 100 0.133
YK7C20.prn Yates K 7 0.744 37.2 100 0.148
YK7C22.prn Yates K 7 0.743 37.4 100 0.173
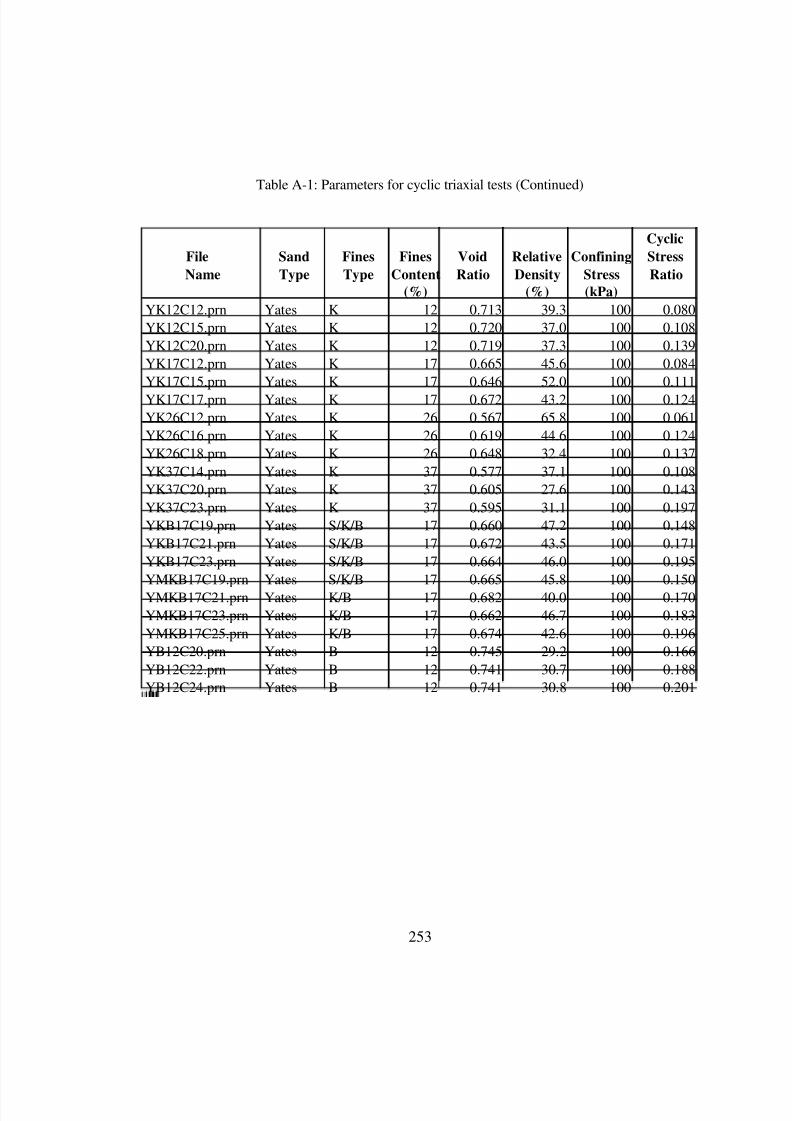
8/8/2019 The Effects of Non-Plasticand Plastic Fines on the Liquefaction Of
http://slidepdf.com/reader/full/the-effects-of-non-plasticand-plastic-fines-on-the-liquefaction-of 267/288
253
Table A-1: Parameters for cyclic triaxial tests (Continued)
Cyclic
File Sand Fines Fines Void Relative Confining Stress
Name Type Type Content Ratio Density Stress Ratio
(%) (%) (kPa)
YK12C12.prn Yates K 12 0.713 39.3 100 0.080
YK12C15.prn Yates K 12 0.720 37.0 100 0.108
YK12C20.prn Yates K 12 0.719 37.3 100 0.139
YK17C12.prn Yates K 17 0.665 45.6 100 0.084
YK17C15.prn Yates K 17 0.646 52.0 100 0.111
YK17C17.prn Yates K 17 0.672 43.2 100 0.124
YK26C12.prn Yates K 26 0.567 65.8 100 0.061
YK26C16.prn Yates K 26 0.619 44.6 100 0.124
YK26C18.prn Yates K 26 0.648 32.4 100 0.137
YK37C14.prn Yates K 37 0.577 37.1 100 0.108
YK37C20.prn Yates K 37 0.605 27.6 100 0.143
YK37C23.prn Yates K 37 0.595 31.1 100 0.197
YKB17C19.prn Yates S/K/B 17 0.660 47.2 100 0.148
YKB17C21.prn Yates S/K/B 17 0.672 43.5 100 0.171
YKB17C23.prn Yates S/K/B 17 0.664 46.0 100 0.195
YMKB17C19.prn Yates S/K/B 17 0.665 45.8 100 0.150
YMKB17C21.prn Yates K/B 17 0.682 40.0 100 0.170
YMKB17C23.prn Yates K/B 17 0.662 46.7 100 0.183
YMKB17C25.prn Yates K/B 17 0.674 42.6 100 0.196
YB12C20.prn Yates B 12 0.745 29.2 100 0.166
YB12C22.prn Yates B 12 0.741 30.7 100 0.188
YB12C24.prn Yates B 12 0.741 30.8 100 0.201
8/8/2019 The Effects of Non-Plasticand Plastic Fines on the Liquefaction Of
http://slidepdf.com/reader/full/the-effects-of-non-plasticand-plastic-fines-on-the-liquefaction-of 268/288
254
Appendix B: Cyclic Triaxial Tests- Liquefaction Results

8/8/2019 The Effects of Non-Plasticand Plastic Fines on the Liquefaction Of
http://slidepdf.com/reader/full/the-effects-of-non-plasticand-plastic-fines-on-the-liquefaction-of 269/288
255
Table B-1: Liquefaction results from cyclic triaxial
Cyclic Cycles Cycles Cycles Cycles Cycles
File Stress to to to to to
Name Ratio 1% DA 2.5% DA 5% DA Initial Ave Ru
Strain Strain Strain Liq'n of 1.00
M0E68C30.prn 0.270 167 173 N/A 167 N/A
M0E68C35.prn 0.442 25 31 33 31 31
M0E68C40.prn 0.510 8 13 16 13 13
M0E71C28.prn 0.259 37 39 40 39 39
M0E71C31.prn 0.275 10 12 13 12 12
M0E71C33.prn 0.308 10 12 13 12 12
M0E72C27.prn 0.363 72 75 77 74 74
M0E72C30.prn 0.387 56 59 61 58 58
M0E72C35.prn 0.439 10 13 14 13 13
M0E73C25.prn 0.218 351 353 N/A 352 N/A
M0E73C31.prn 0.374 14 16 17 16 16
M0E73C37.prn 0.442 8 12 13 12 12
M0E74C22.prn 0.355 109 110 112 109 109
M0E74C25.prn 0.380 51 52 N/A 51 51
M0E75C20.prn 0.169 457 458 N/A 456 N/A
M0E75C22.prn 0.402 241 243 244 241 N/A
M0E75C25.prn 0.294 34 35 36 36 36
M0E75C30.prn 0.351 7 8 8 8 8
M0E76C22.prn 0.265 87 88 N/A 87 N/A
M0E76C25.prn 0.300 36 37 37 36 37
M0E76C28.prn 0.351 12 13 13 13 13
M0E84C19.prn 0.166 31 31 N/A 30 30
M0E84C20.prn 0.169 5 5 5 4 4
M0E84C21.prn 0.173 6 6 N/A 6 6
M5E61C32.prn 0.362 39 49 53 47 47
M5E61C35.prn 0.441 22 31 35 29 29
M5E61C40.prn 0.496 9 17 21 16 16
M5E65C27.prn 0.306 80 82 87 83 83
M5E65C30.prn 0.365 19 24 26 24 24
M5E65C33.prn 0.415 6 11 13 11 11
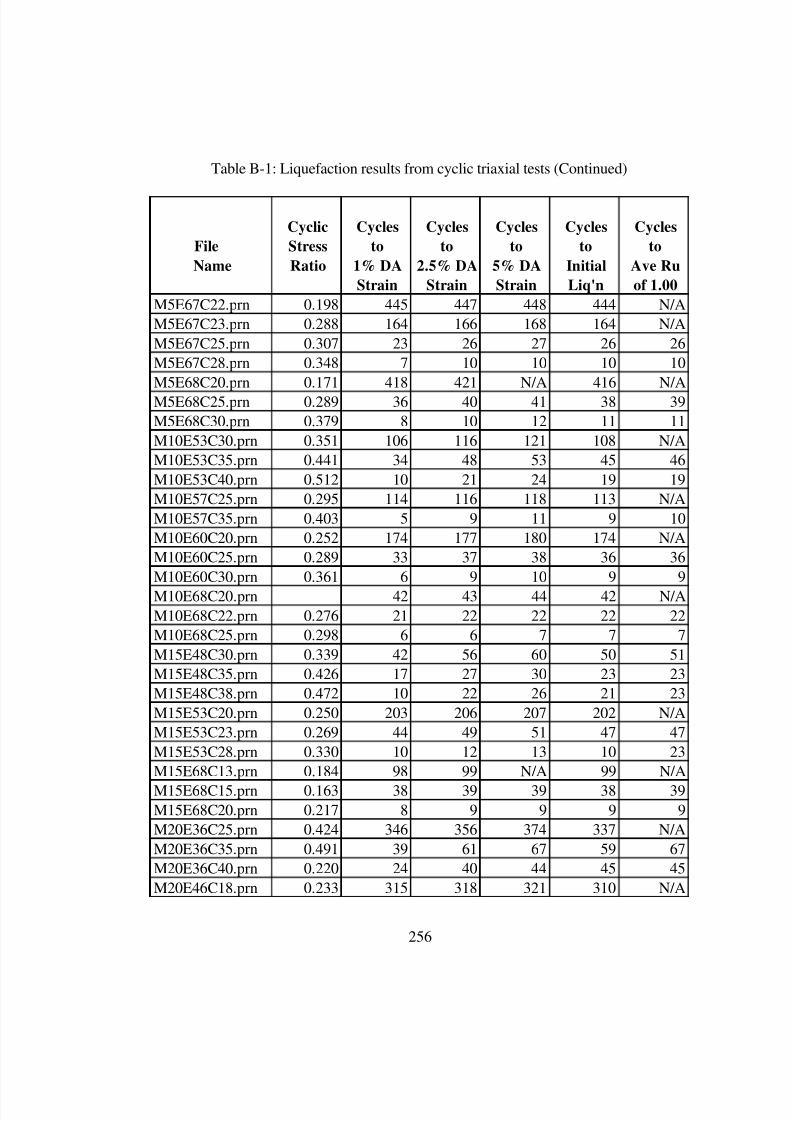
8/8/2019 The Effects of Non-Plasticand Plastic Fines on the Liquefaction Of
http://slidepdf.com/reader/full/the-effects-of-non-plasticand-plastic-fines-on-the-liquefaction-of 270/288
256
Table B-1: Liquefaction results from cyclic triaxial tests (Continued)
Cyclic Cycles Cycles Cycles Cycles Cycles
File Stress to to to to to
Name Ratio 1% DA 2.5% DA 5% DA Initial Ave Ru
Strain Strain Strain Liq'n of 1.00
M5E67C22.prn 0.198 445 447 448 444 N/A
M5E67C23.prn 0.288 164 166 168 164 N/A
M5E67C25.prn 0.307 23 26 27 26 26
M5E67C28.prn 0.348 7 10 10 10 10
M5E68C20.prn 0.171 418 421 N/A 416 N/A
M5E68C25.prn 0.289 36 40 41 38 39
M5E68C30.prn 0.379 8 10 12 11 11
M10E53C30.prn 0.351 106 116 121 108 N/A
M10E53C35.prn 0.441 34 48 53 45 46
M10E53C40.prn 0.512 10 21 24 19 19
M10E57C25.prn 0.295 114 116 118 113 N/A
M10E57C35.prn 0.403 5 9 11 9 10
M10E60C20.prn 0.252 174 177 180 174 N/A
M10E60C25.prn 0.289 33 37 38 36 36
M10E60C30.prn 0.361 6 9 10 9 9
M10E68C20.prn 42 43 44 42 N/A
M10E68C22.prn 0.276 21 22 22 22 22
M10E68C25.prn 0.298 6 6 7 7 7
M15E48C30.prn 0.339 42 56 60 50 51
M15E48C35.prn 0.426 17 27 30 23 23
M15E48C38.prn 0.472 10 22 26 21 23
M15E53C20.prn 0.250 203 206 207 202 N/A
M15E53C23.prn 0.269 44 49 51 47 47
M15E53C28.prn 0.330 10 12 13 10 23
M15E68C13.prn 0.184 98 99 N/A 99 N/A
M15E68C15.prn 0.163 38 39 39 38 39
M15E68C20.prn 0.217 8 9 9 9 9
M20E36C25.prn 0.424 346 356 374 337 N/A
M20E36C35.prn 0.491 39 61 67 59 67
M20E36C40.prn 0.220 24 40 44 45 45
M20E46C18.prn 0.233 315 318 321 310 N/A
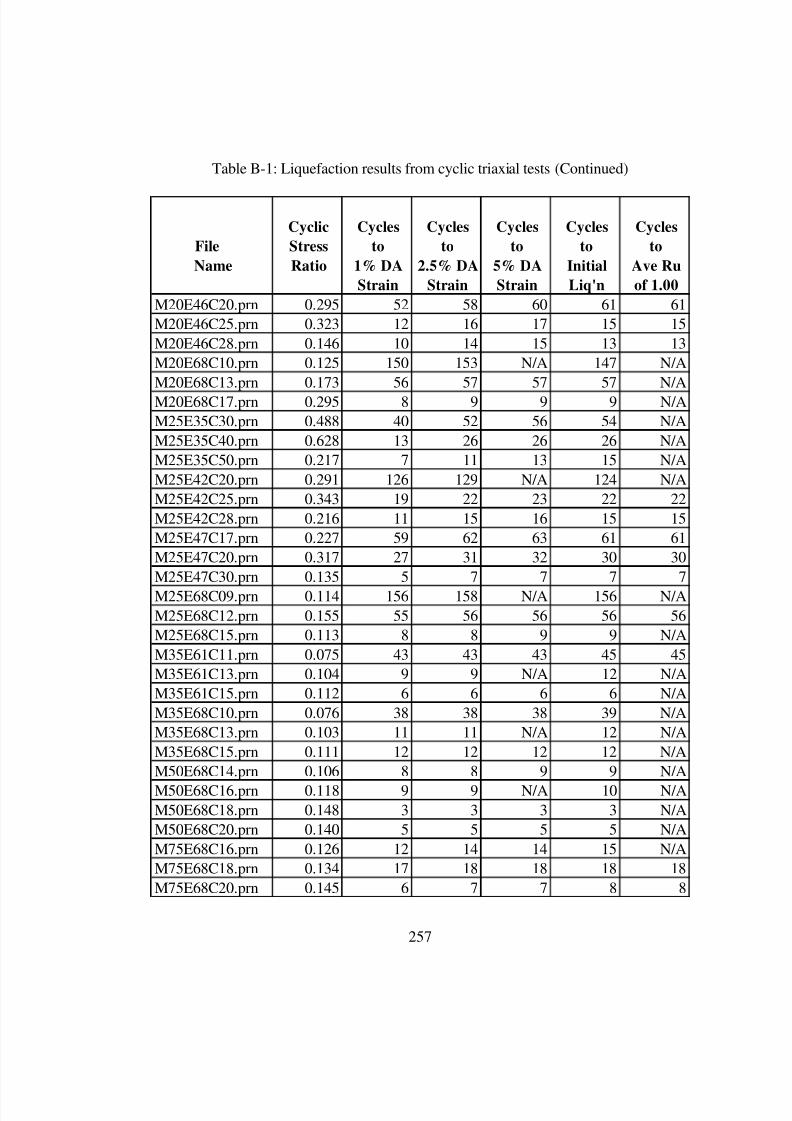
8/8/2019 The Effects of Non-Plasticand Plastic Fines on the Liquefaction Of
http://slidepdf.com/reader/full/the-effects-of-non-plasticand-plastic-fines-on-the-liquefaction-of 271/288
257
Table B-1: Liquefaction results from cyclic triaxial tests (Continued)
Cyclic Cycles Cycles Cycles Cycles Cycles
File Stress to to to to to
Name Ratio 1% DA 2.5% DA 5% DA Initial Ave Ru
Strain Strain Strain Liq'n of 1.00
M20E46C20.prn 0.295 52 58 60 61 61
M20E46C25.prn 0.323 12 16 17 15 15
M20E46C28.prn 0.146 10 14 15 13 13
M20E68C10.prn 0.125 150 153 N/A 147 N/A
M20E68C13.prn 0.173 56 57 57 57 N/A
M20E68C17.prn 0.295 8 9 9 9 N/A
M25E35C30.prn 0.488 40 52 56 54 N/A
M25E35C40.prn 0.628 13 26 26 26 N/A
M25E35C50.prn 0.217 7 11 13 15 N/A
M25E42C20.prn 0.291 126 129 N/A 124 N/A
M25E42C25.prn 0.343 19 22 23 22 22
M25E42C28.prn 0.216 11 15 16 15 15
M25E47C17.prn 0.227 59 62 63 61 61
M25E47C20.prn 0.317 27 31 32 30 30
M25E47C30.prn 0.135 5 7 7 7 7
M25E68C09.prn 0.114 156 158 N/A 156 N/A
M25E68C12.prn 0.155 55 56 56 56 56
M25E68C15.prn 0.113 8 8 9 9 N/A
M35E61C11.prn 0.075 43 43 43 45 45
M35E61C13.prn 0.104 9 9 N/A 12 N/A
M35E61C15.prn 0.112 6 6 6 6 N/A
M35E68C10.prn 0.076 38 38 38 39 N/A
M35E68C13.prn 0.103 11 11 N/A 12 N/A
M35E68C15.prn 0.111 12 12 12 12 N/A
M50E68C14.prn 0.106 8 8 9 9 N/A
M50E68C16.prn 0.118 9 9 N/A 10 N/A
M50E68C18.prn 0.148 3 3 3 3 N/A
M50E68C20.prn 0.140 5 5 5 5 N/A
M75E68C16.prn 0.126 12 14 14 15 N/A
M75E68C18.prn 0.134 17 18 18 18 18
M75E68C20.prn 0.145 6 7 7 8 8
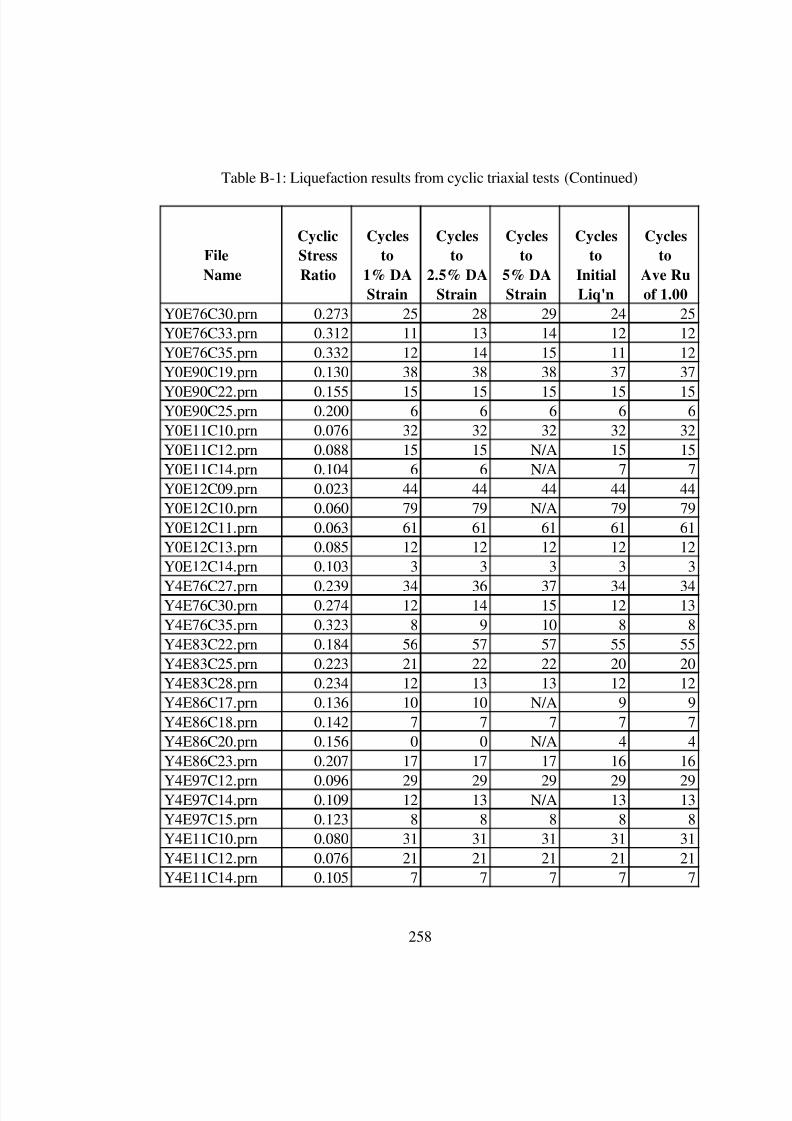
8/8/2019 The Effects of Non-Plasticand Plastic Fines on the Liquefaction Of
http://slidepdf.com/reader/full/the-effects-of-non-plasticand-plastic-fines-on-the-liquefaction-of 272/288
258
Table B-1: Liquefaction results from cyclic triaxial tests (Continued)
Cyclic Cycles Cycles Cycles Cycles Cycles
File Stress to to to to to
Name Ratio 1% DA 2.5% DA 5% DA Initial Ave Ru
Strain Strain Strain Liq'n of 1.00
Y0E76C30.prn 0.273 25 28 29 24 25
Y0E76C33.prn 0.312 11 13 14 12 12
Y0E76C35.prn 0.332 12 14 15 11 12
Y0E90C19.prn 0.130 38 38 38 37 37
Y0E90C22.prn 0.155 15 15 15 15 15Y0E90C25.prn 0.200 6 6 6 6 6
Y0E11C10.prn 0.076 32 32 32 32 32
Y0E11C12.prn 0.088 15 15 N/A 15 15
Y0E11C14.prn 0.104 6 6 N/A 7 7
Y0E12C09.prn 0.023 44 44 44 44 44
Y0E12C10.prn 0.060 79 79 N/A 79 79
Y0E12C11.prn 0.063 61 61 61 61 61
Y0E12C13.prn 0.085 12 12 12 12 12
Y0E12C14.prn 0.103 3 3 3 3 3
Y4E76C27.prn 0.239 34 36 37 34 34Y4E76C30.prn 0.274 12 14 15 12 13
Y4E76C35.prn 0.323 8 9 10 8 8
Y4E83C22.prn 0.184 56 57 57 55 55
Y4E83C25.prn 0.223 21 22 22 20 20
Y4E83C28.prn 0.234 12 13 13 12 12
Y4E86C17.prn 0.136 10 10 N/A 9 9
Y4E86C18.prn 0.142 7 7 7 7 7
Y4E86C20.prn 0.156 0 0 N/A 4 4
Y4E86C23.prn 0.207 17 17 17 16 16
Y4E97C12.prn 0.096 29 29 29 29 29Y4E97C14.prn 0.109 12 13 N/A 13 13
Y4E97C15.prn 0.123 8 8 8 8 8
Y4E11C10.prn 0.080 31 31 31 31 31
Y4E11C12.prn 0.076 21 21 21 21 21
Y4E11C14.prn 0.105 7 7 7 7 7
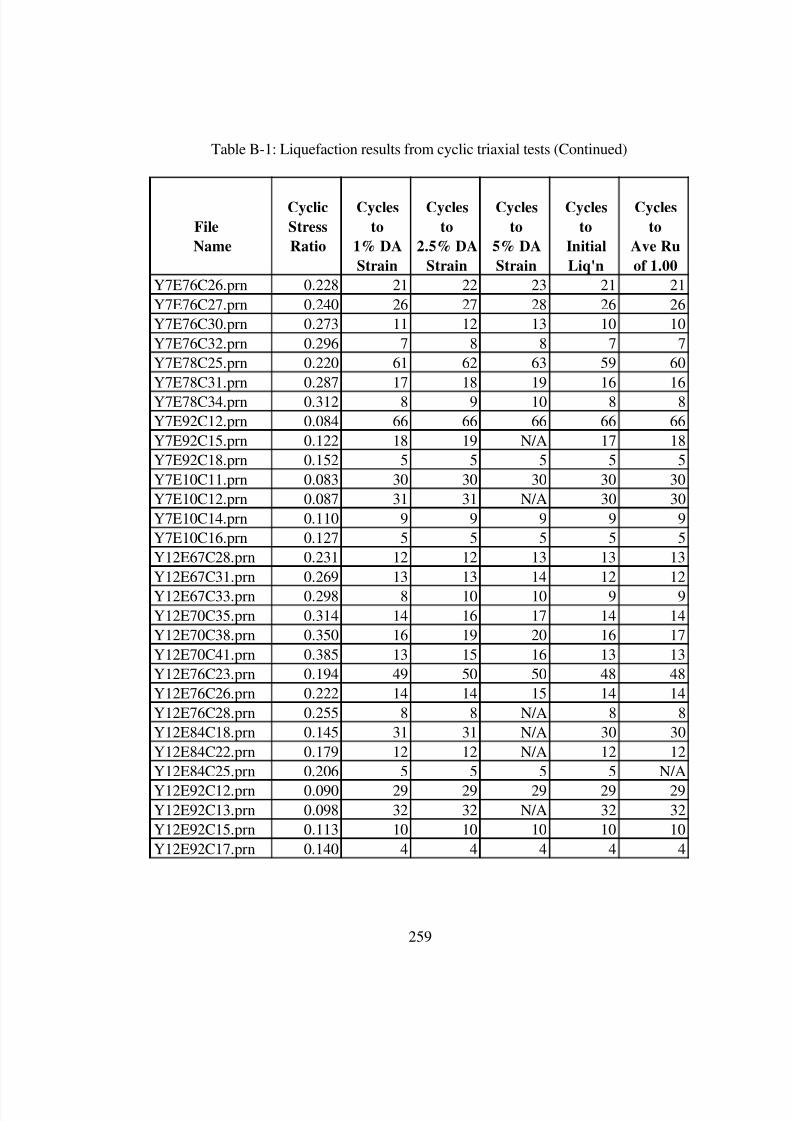
8/8/2019 The Effects of Non-Plasticand Plastic Fines on the Liquefaction Of
http://slidepdf.com/reader/full/the-effects-of-non-plasticand-plastic-fines-on-the-liquefaction-of 273/288
259
Table B-1: Liquefaction results from cyclic triaxial tests (Continued)
Cyclic Cycles Cycles Cycles Cycles Cycles
File Stress to to to to to
Name Ratio 1% DA 2.5% DA 5% DA Initial Ave Ru
Strain Strain Strain Liq'n of 1.00
Y7E76C26.prn 0.228 21 22 23 21 21
Y7E76C27.prn 0.240 26 27 28 26 26
Y7E76C30.prn 0.273 11 12 13 10 10
Y7E76C32.prn 0.296 7 8 8 7 7
Y7E78C25.prn 0.220 61 62 63 59 60
Y7E78C31.prn 0.287 17 18 19 16 16
Y7E78C34.prn 0.312 8 9 10 8 8
Y7E92C12.prn 0.084 66 66 66 66 66
Y7E92C15.prn 0.122 18 19 N/A 17 18
Y7E92C18.prn 0.152 5 5 5 5 5
Y7E10C11.prn 0.083 30 30 30 30 30
Y7E10C12.prn 0.087 31 31 N/A 30 30
Y7E10C14.prn 0.110 9 9 9 9 9
Y7E10C16.prn 0.127 5 5 5 5 5
Y12E67C28.prn 0.231 12 12 13 13 13
Y12E67C31.prn 0.269 13 13 14 12 12
Y12E67C33.prn 0.298 8 10 10 9 9
Y12E70C35.prn 0.314 14 16 17 14 14
Y12E70C38.prn 0.350 16 19 20 16 17
Y12E70C41.prn 0.385 13 15 16 13 13
Y12E76C23.prn 0.194 49 50 50 48 48
Y12E76C26.prn 0.222 14 14 15 14 14
Y12E76C28.prn 0.255 8 8 N/A 8 8
Y12E84C18.prn 0.145 31 31 N/A 30 30
Y12E84C22.prn 0.179 12 12 N/A 12 12
Y12E84C25.prn 0.206 5 5 5 5 N/A
Y12E92C12.prn 0.090 29 29 29 29 29
Y12E92C13.prn 0.098 32 32 N/A 32 32
Y12E92C15.prn 0.113 10 10 10 10 10
Y12E92C17.prn 0.140 4 4 4 4 4
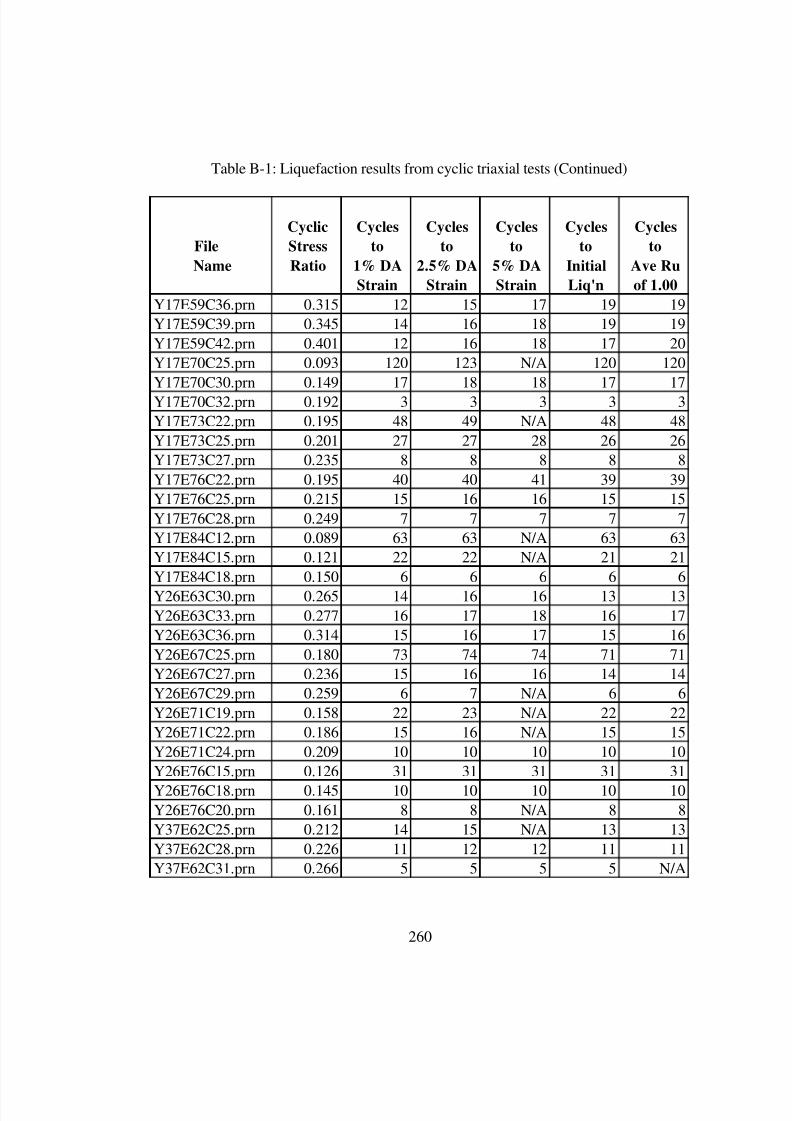
8/8/2019 The Effects of Non-Plasticand Plastic Fines on the Liquefaction Of
http://slidepdf.com/reader/full/the-effects-of-non-plasticand-plastic-fines-on-the-liquefaction-of 274/288
260
Table B-1: Liquefaction results from cyclic triaxial tests (Continued)
Cyclic Cycles Cycles Cycles Cycles Cycles
File Stress to to to to to
Name Ratio 1% DA 2.5% DA 5% DA Initial Ave Ru
Strain Strain Strain Liq'n of 1.00
Y17E59C36.prn 0.315 12 15 17 19 19
Y17E59C39.prn 0.345 14 16 18 19 19
Y17E59C42.prn 0.401 12 16 18 17 20
Y17E70C25.prn 0.093 120 123 N/A 120 120
Y17E70C30.prn 0.149 17 18 18 17 17
Y17E70C32.prn 0.192 3 3 3 3 3
Y17E73C22.prn 0.195 48 49 N/A 48 48
Y17E73C25.prn 0.201 27 27 28 26 26
Y17E73C27.prn 0.235 8 8 8 8 8
Y17E76C22.prn 0.195 40 40 41 39 39
Y17E76C25.prn 0.215 15 16 16 15 15
Y17E76C28.prn 0.249 7 7 7 7 7
Y17E84C12.prn 0.089 63 63 N/A 63 63
Y17E84C15.prn 0.121 22 22 N/A 21 21
Y17E84C18.prn 0.150 6 6 6 6 6
Y26E63C30.prn 0.265 14 16 16 13 13
Y26E63C33.prn 0.277 16 17 18 16 17
Y26E63C36.prn 0.314 15 16 17 15 16
Y26E67C25.prn 0.180 73 74 74 71 71
Y26E67C27.prn 0.236 15 16 16 14 14
Y26E67C29.prn 0.259 6 7 N/A 6 6
Y26E71C19.prn 0.158 22 23 N/A 22 22
Y26E71C22.prn 0.186 15 16 N/A 15 15
Y26E71C24.prn 0.209 10 10 10 10 10
Y26E76C15.prn 0.126 31 31 31 31 31
Y26E76C18.prn 0.145 10 10 10 10 10
Y26E76C20.prn 0.161 8 8 N/A 8 8
Y37E62C25.prn 0.212 14 15 N/A 13 13
Y37E62C28.prn 0.226 11 12 12 11 11
Y37E62C31.prn 0.266 5 5 5 5 N/A

8/8/2019 The Effects of Non-Plasticand Plastic Fines on the Liquefaction Of
http://slidepdf.com/reader/full/the-effects-of-non-plasticand-plastic-fines-on-the-liquefaction-of 275/288
261
Table B-1: Liquefaction results from cyclic triaxial tests (Continued)
Cyclic Cycles Cycles Cycles Cycles Cycles
File Stress to to to to to
Name Ratio 1% DA 2.5% DA 5% DA Initial Ave Ru
Strain Strain Strain Liq'n of 1.00
Y37E67C14.prn 0.109 37 37 37 36 36
Y37E67C15.prn 0.115 19 19 19 18 18
Y37E67C17.prn 0.134 10 10 10 10 10
Y37E69C19.prn 0.114 30 30 30 30 30
Y37E69C20.prn 0.165 8 8 8 8 8
Y37E69C22.prn 0.180 4 4 4 4 4
Y37E76C10.prn 0.079 47 47 47 47 47
Y37E76C12.prn 0.089 20 20 20 20 N/A
Y37E76C14.prn 0.113 8 8 8 8 N/A
Y50E55C16.prn 0.115 16 17 18 20 N/A
Y50E55C18.prn 0.143 18 19 19 19 20
Y50E55C20.prn 0.155 9 10 10 12 12
Y50E55C23.prn 0.183 4 4 5 6 N/A
Y50E67C14.prn 0.106 13 13 13 13 N/A
Y50E67C16.prn 0.126 8 8 8 8 N/A
Y50E67C18.prn 0.135 5 5 N/A 5 N/A
Y50E76C09.prn 0.067 48 49 49 50 50Y50E76C11.prn 0.082 28 28 28 28 N/A
Y50E76C13.prn 0.099 11 12 12 13 13
Y50E76C15.prn 0.114 6 6 N/A 7 N/A
Y50E78C10.prn 0.070 45 46 47 47 47
Y50E78C12.prn 0.088 15 16 16 17 17
Y50E78C14.prn 0.102 7 7 7 8 8
Y75E76C13.prn 0.102 27 28 28 27 28
Y75E76C15.prn 0.115 11 12 12 12 N/A
Y75E76C17.prn 0.115 14 14 14 15 15
Y75E85C14.prn 0.113 15 15 15 16 16Y75E85C16.prn 0.125 9 9 9 10 N/A
Y75E85C18.prn 0.142 5 5 5 6 N/A
Y75E90C10.prn 0.073 35 36 37 38 38
Y75E90C13.prn 0.098 9 10 10 11 12
Y75E90C15.prn 0.111 5 6 6 7 8
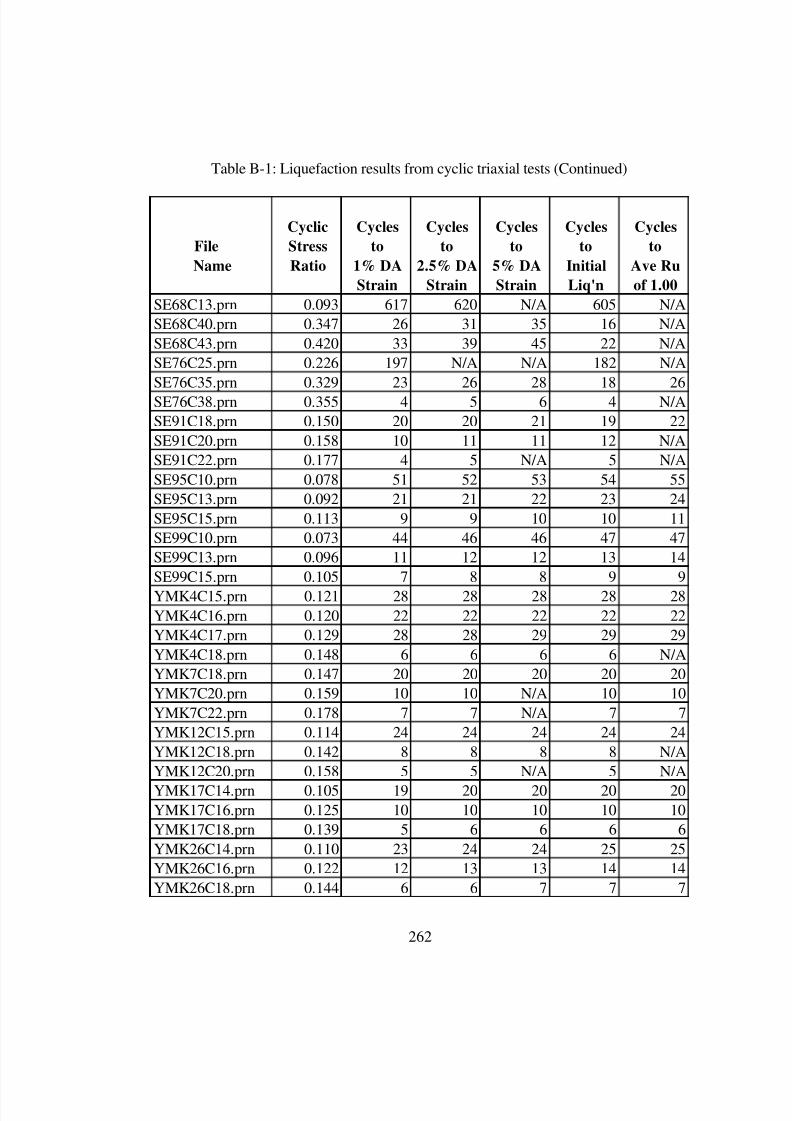
8/8/2019 The Effects of Non-Plasticand Plastic Fines on the Liquefaction Of
http://slidepdf.com/reader/full/the-effects-of-non-plasticand-plastic-fines-on-the-liquefaction-of 276/288
262
Table B-1: Liquefaction results from cyclic triaxial tests (Continued)
Cyclic Cycles Cycles Cycles Cycles Cycles
File Stress to to to to to
Name Ratio 1% DA 2.5% DA 5% DA Initial Ave Ru
Strain Strain Strain Liq'n of 1.00
SE68C13.prn 0.093 617 620 N/A 605 N/A
SE68C40.prn 0.347 26 31 35 16 N/A
SE68C43.prn 0.420 33 39 45 22 N/A
SE76C25.prn 0.226 197 N/A N/A 182 N/A
SE76C35.prn 0.329 23 26 28 18 26
SE76C38.prn 0.355 4 5 6 4 N/A
SE91C18.prn 0.150 20 20 21 19 22
SE91C20.prn 0.158 10 11 11 12 N/A
SE91C22.prn 0.177 4 5 N/A 5 N/A
SE95C10.prn 0.078 51 52 53 54 55
SE95C13.prn 0.092 21 21 22 23 24
SE95C15.prn 0.113 9 9 10 10 11
SE99C10.prn 0.073 44 46 46 47 47
SE99C13.prn 0.096 11 12 12 13 14
SE99C15.prn 0.105 7 8 8 9 9
YMK4C15.prn 0.121 28 28 28 28 28
YMK4C16.prn 0.120 22 22 22 22 22
YMK4C17.prn 0.129 28 28 29 29 29
YMK4C18.prn 0.148 6 6 6 6 N/A
YMK7C18.prn 0.147 20 20 20 20 20
YMK7C20.prn 0.159 10 10 N/A 10 10
YMK7C22.prn 0.178 7 7 N/A 7 7
YMK12C15.prn 0.114 24 24 24 24 24
YMK12C18.prn 0.142 8 8 8 8 N/A
YMK12C20.prn 0.158 5 5 N/A 5 N/A
YMK17C14.prn 0.105 19 20 20 20 20
YMK17C16.prn 0.125 10 10 10 10 10
YMK17C18.prn 0.139 5 6 6 6 6
YMK26C14.prn 0.110 23 24 24 25 25
YMK26C16.prn 0.122 12 13 13 14 14
YMK26C18.prn 0.144 6 6 7 7 7

8/8/2019 The Effects of Non-Plasticand Plastic Fines on the Liquefaction Of
http://slidepdf.com/reader/full/the-effects-of-non-plasticand-plastic-fines-on-the-liquefaction-of 277/288
263
Table B-1: Liquefaction results from cyclic triaxial tests (Continued)
Cyclic Cycles Cycles Cycles Cycles Cycles
File Stress to to to to to
Name Ratio 1% DA 2.5% DA 5% DA Initial Ave Ru
Strain Strain Strain Liq'n of 1.00
YK4C10.prn 0.070 30 30 30 30 30
YK4C17.prn 0.128 16 16 16 16 N/A
YK4C20.prn 0.151 8 8 8 8 N/A
YK7C17.prn 0.133 13 13 13 13 13
YK7C20.prn 0.148 12 12 12 12 12
YK7C22.prn 0.173 4 4 4 4 5YK12C12.prn 0.080 39 40 40 40 40
YK12C15.prn 0.108 12 13 13 13 14
YK12C20.prn 0.139 3 3 3 3 4
YK17C12.prn 0.084 44 46 46 46 46
YK17C15.prn 0.111 8 9 9 10 10
YK17C17.prn 0.124 7 7 7 7 7
YK26C12.prn 0.061 45 48 49 48 N/A
YK26C16.prn 0.124 6 7 7 7 7
YK26C18.prn 0.137 3 4 4 5 5
YK37C14.prn 0.108 165 173 N/A 167 N/AYK37C20.prn 0.143 11 12 13 22 22
YK37C23.prn 0.197 3 4 4 5 N/A
YKB17C19.prn 0.148 36 44 48 49 N/A
YKB17C21.prn 0.171 9 11 13 13 N/A
YKB17C23.prn 0.195 5 7 8 8 N/A
YMKB17C19.prn 0.150 14 16 17 19 N/A
YMKB17C21.prn 0.170 8 10 11 10 N/A
YMKB17C23.prn 0.183 4 5 5 6 N/A
YMKB17C25.prn 0.196 3 4 5 5 N/A
YB12C20.prn 0.166 23 26 27 23 25YB12C22.prn 0.188 14 17 18 14 17
YB12C24.prn 0.201 14 17 19 14 N/A
Y12E67C28.prn 0.224 12 12 13 13 N/A
N/A = Not Achieved

8/8/2019 The Effects of Non-Plasticand Plastic Fines on the Liquefaction Of
http://slidepdf.com/reader/full/the-effects-of-non-plasticand-plastic-fines-on-the-liquefaction-of 278/288
264
Appendix C: Index Density Testing

8/8/2019 The Effects of Non-Plasticand Plastic Fines on the Liquefaction Of
http://slidepdf.com/reader/full/the-effects-of-non-plasticand-plastic-fines-on-the-liquefaction-of 279/288
265
Table C-1: Minimum index density test data for Yatesville sand with silt
Silt Method A Method B Method C
Content Specific Minimum Maximum Minimum Maximum Minimum Maximum
(%) Gravity Density e Density e Density e
0 2.72 88.5 0.918 86.1 0.972 86.2 0.968
4 2.72 91.0 0.864 88.8 0.911 85.7 0.983
7 2.72 91.7 0.851 90.7 0.872 87.1 0.95111.8 2.73 93.3 0.819 92.2 0.840 88.9 0.913
16.9 2.73 95.3 0.782 94.1 0.802 90.5 0.882
25.9 2.73 97.8 0.741 98.6 0.728 92.9 0.835
37.2 2.74 99.1 0.719 101.1 0.684 94.9 0.801
50 2.75 N. P. N. P. 84.3 1.021 83.6 1.050
75 2.76 N. P. N. P. 74.3 1.312 77.0 1.234
100 2.77 N. P. N. P. 63.5 1.733 65.3 1.647
N. P. = Not Performed

8/8/2019 The Effects of Non-Plasticand Plastic Fines on the Liquefaction Of
http://slidepdf.com/reader/full/the-effects-of-non-plasticand-plastic-fines-on-the-liquefaction-of 280/288
266
Table C-2: Maximum index density test data for Yatesville sand with silt
Silt Vibrating Table Standard Proctor Modified Proctor
Content Maximum Minimum Maximum Minimum Maximum Minimum
(%) Opt WC GammaD e Opt WC GammaD e Opt WC GammaD e
0 19.7 102.5 0.656 6.0 100.5 0.689 13.0 103.8 0.635
4 19.0 105.4 0.612 5.8 101.8 0.668 8.0 103.5 0.641
7 17.8 111.0 0.531 13.7 101.6 0.673 8.8 105.0 0.618
11.8 16.1 111.9 0.519 11.5 102.0 0.668 10.9 107.4 0.584
16.9 15.9 113.2 0.505 6.6 107.2 0.588 6.5 109.6 0.554
25.9 13.7 116.2 0.468 5.9 109.6 0.556 6.8 111.8 0.525
37.2 12.8 122.1 0.400 7.2 114.2 0.496 7.6 116.9 0.46250 12.6 120.6 0.423 9.4 117.6 0.456 9.4 123.4 0.388
75 16.9 108.2 0.591 14.5 109.5 0.571 13.7 114.9 0.497
100 20.3 100.4 0.727 16.0 108.4 0.595 14.3 111.8 0.546

8/8/2019 The Effects of Non-Plasticand Plastic Fines on the Liquefaction Of
http://slidepdf.com/reader/full/the-effects-of-non-plasticand-plastic-fines-on-the-liquefaction-of 281/288
267
Appendix D: Limiting Silt Content
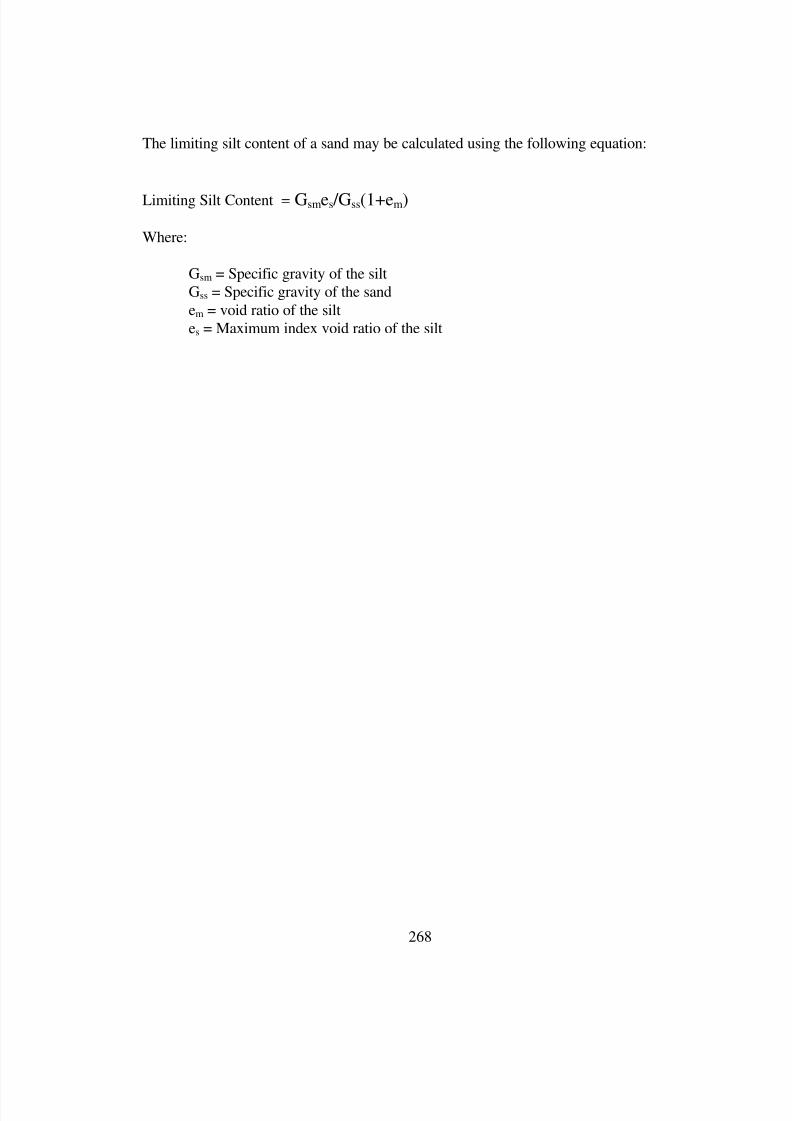
8/8/2019 The Effects of Non-Plasticand Plastic Fines on the Liquefaction Of
http://slidepdf.com/reader/full/the-effects-of-non-plasticand-plastic-fines-on-the-liquefaction-of 282/288
268
The limiting silt content of a sand may be calculated using the following equation:
Limiting Silt Content = Gsmes /Gss(1+em)
Where:
Gsm = Specific gravity of the silt
Gss = Specific gravity of the sand
em = void ratio of the silt
es = Maximum index void ratio of the silt

8/8/2019 The Effects of Non-Plasticand Plastic Fines on the Liquefaction Of
http://slidepdf.com/reader/full/the-effects-of-non-plasticand-plastic-fines-on-the-liquefaction-of 283/288
269
Table D-1: Limiting silt content based on Yatesville silt
Gamma Limiting
D60 D10 Cu Gs emax Dmin Silt
Soil mm mm (pcf) Content (%) Reference
Yatesville Silt 0.039 0.009 4.3 2.77 1.72 63.5 N.A. Polito and Martin (1999)
Medium Gravel 13.00 9.50 1.37 2.65 0.90 87.0 34.6 Lee and Singh (1971)
Pea Gravel 12.00 8.00 1.50 2.65 0.98 83.5 37.6 Lee and Singh (1971)
Coarse Sand 4.50 3.00 1.50 2.65 0.99 83.1 38.0 Lee and Singh (1971)
Medium Sand 0.84 0.70 1.20 2.65 1.05 80.7 40.3 Lee and Singh (1971)
Fine Sand 0.28 0.20 1.40 2.65 1.08 79.5 41.5 Lee and Singh (1971)
Silty Sand 0.12 0.08 1.50 2.65 1.17 76.2 44.9 Lee and Singh (1971)
Ottawa Std Sand 0.72 0.60 1.20 2.65 0.71 96.7 27.3 Lee and Singh (1971)
Loch Aline Sand 0.21 0.16 1.31 2.65 0.80 91.9 30.7 Lee and Singh (1971)
Folkstone Bed Sand 0.29 0.14 2.07 2.65 0.85 89.4 32.6 Lee and Singh (1971)
Fine Sand 0.16 0.06 2.67 2.74 0.85 92.4 31.6 Lee and Singh (1971)Fine Sand 0.85 0.65 1.31 2.65 0.79 92.4 30.3 Lee and Singh (1971)
Fine Sand 0.85 0.75 1.13 2.65 0.86 88.9 33.0 Lee and Singh (1971)
River Sand 0.18 0.12 1.50 2.65 0.90 87.0 34.6 Lee and Singh (1971)
Fine Sand 0.12 0.08 1.50 2.65 0.92 86.1 35.3 Lee and Singh (1971)
Medium Sand 0.45 0.15 3.00 2.65 1.05 80.7 40.3 Lee and Singh (1971)
Fine Gravel 4.50 1.20 3.75 2.65 1.10 78.7 42.2 Lee and Singh (1971)
Coarse Sand 0.90 0.10 9.00 2.65 0.85 89.4 32.6 Lee and Singh (1971)
Chattahooche River Sand 0.48 0.20 2.40 2.65 1.10 78.7 42.2 Lee and Singh (1971)
Crushed Granite Gneiss 125.00 50.00 2.50 2.62 0.77 92.4 29.9 Lee and Singh (1971)
Leighton Buzzard Sand 0.20 0.15 1.33 2.60 0.72 94.3 28.2 Lee and Singh (1971)
Leighton Buzzard Sand 0.90 0.15 6.00 2.70 0.85 91.1 32.0 Lee and Singh (1971)
Ham River Sand 0.45 0.35 1.29 2.70 0.83 92.1 31.3 Lee and Singh (1971)
Brasted Sand 0.30 0.14 2.14 2.70 0.79 94.1 29.8 Lee and Singh (1971)
Wing Beach Sand 0.20 0.07 2.86 2.65 0.93 85.7 35.7 Lee and Singh (1971)
Bolsa Island Sand 0.40 0.20 2.00 2.70 0.85 91.1 32.0 Lee and Singh (1971)
Silica Sand 45.00 30.00 1.50 2.65 1.08 79.5 41.5 Lee and Singh (1971)
Sacramento River Sand 0.24 0.15 1.60 2.68 1.03 82.4 39.1 Lee and Singh (1971)
Tarbella Dam Med Sand 0.40 0.10 4.00 2.86 0.83 97.5 29.5 Lee and Singh (1971)
Antioch Sand 0.24 0.15 1.60 2.74 1.14 79.9 42.3 Lee and Singh (1971)
Monterey Sand 0.66 0.54 1.22 2.64 0.83 90.0 32.0 Lee and Singh (1971)
Thumb Island Sand 0.55 0.22 2.50 2.70 0.91 88.2 34.3 Lee and Singh (1971)
Lake Michigan Sand 0.18 0.06 3.00 2.65 0.87 88.4 33.4 Lee and Singh (1971)
Marsa El Brega Sand 0.27 0.10 2.70 2.65 0.72 96.1 27.6 Lee and Singh (1971)
Marsa El Brega Sand 0.16 0.08 1.90 2.65 0.88 88.0 33.8 Lee and Singh (1971)
Uniform Spheres - - 1.00 2.65 0.91 86.6 34.9 Lee and Singh (1971)
Yatesville Sand 0.22 0.09 2.45 2.72 0.97 86.1 36.4 Polito and Martin (1999)
Montery #0/30 Sand 0.46 0.31 1.48 2.65 0.82 90.8 31.5 Polito and Martin (1999)
N.R. = Not ReportedN.A. = Not Applicable

8/8/2019 The Effects of Non-Plasticand Plastic Fines on the Liquefaction Of
http://slidepdf.com/reader/full/the-effects-of-non-plasticand-plastic-fines-on-the-liquefaction-of 284/288
270
Table D-2: Limiting silt content based on uniform inorganic silt
Gamma Limiting
D60 D10 Cu Gs emax Dmin Silt
Soil mm mm (pcf) Content (%) Reference
Uniform Inorganic Silt N.R. N.R. N.R. 2.67 1.10 79.3 N.A. Lade and Lee (1976)
Medium Gravel 13.00 9.50 1.37 2.65 0.90 87.0 43.2 Lee and Singh (1971)
Pea Gravel 12.00 8.00 1.50 2.65 0.98 83.5 47.0 Lee and Singh (1971)
Coarse Sand 4.50 3.00 1.50 2.65 0.99 83.1 47.5 Lee and Singh (1971)
Medium Sand 0.84 0.70 1.20 2.65 1.05 80.7 50.4 Lee and Singh (1971)
Fine Sand 0.28 0.20 1.40 2.65 1.08 79.5 51.8 Lee and Singh (1971)
Silty Sand 0.12 0.08 1.50 2.65 1.17 76.2 56.1 Lee and Singh (1971)
Ottawa Std Sand 0.72 0.60 1.20 2.65 0.71 96.7 34.1 Lee and Singh (1971)
Loch Aline Sand 0.21 0.16 1.31 2.65 0.80 91.9 38.4 Lee and Singh (1971)
Folkstone Bed Sand 0.29 0.14 2.07 2.65 0.85 89.4 40.8 Lee and Singh (1971)
Fine Sand 0.16 0.06 2.67 2.74 0.85 92.4 39.4 Lee and Singh (1971)Fine Sand 0.85 0.65 1.31 2.65 0.79 92.4 37.9 Lee and Singh (1971)
Fine Sand 0.85 0.75 1.13 2.65 0.86 88.9 41.3 Lee and Singh (1971)
River Sand 0.18 0.12 1.50 2.65 0.90 87.0 43.2 Lee and Singh (1971)
Fine Sand 0.12 0.08 1.50 2.65 0.92 86.1 44.1 Lee and Singh (1971)
Medium Sand 0.45 0.15 3.00 2.65 1.05 80.7 50.4 Lee and Singh (1971)
Fine Gravel 4.50 1.20 3.75 2.65 1.10 78.7 52.8 Lee and Singh (1971)
Coarse Sand 0.90 0.10 9.00 2.65 0.85 89.4 40.8 Lee and Singh (1971)
Chattahooche River Sand 0.48 0.20 2.40 2.65 1.10 78.7 52.8 Lee and Singh (1971)
Crushed Granite Gneiss 125.00 50.00 2.50 2.62 0.77 92.4 37.4 Lee and Singh (1971)
Leighton Buzzard Sand 0.20 0.15 1.33 2.60 0.72 94.3 35.2 Lee and Singh (1971)
Leighton Buzzard Sand 0.90 0.15 6.00 2.70 0.85 91.1 40.0 Lee and Singh (1971)
Ham River Sand 0.45 0.35 1.29 2.70 0.83 92.1 39.1 Lee and Singh (1971)
Brasted Sand 0.30 0.14 2.14 2.70 0.79 94.1 37.2 Lee and Singh (1971)
Wing Beach Sand 0.20 0.07 2.86 2.65 0.93 85.7 44.6 Lee and Singh (1971)
Bolsa Island Sand 0.40 0.20 2.00 2.70 0.85 91.1 40.0 Lee and Singh (1971)
Silica Sand 45.00 30.00 1.50 2.65 1.08 79.5 51.8 Lee and Singh (1971)
Sacramento River Sand 0.24 0.15 1.60 2.68 1.03 82.4 48.9 Lee and Singh (1971)
Tarbella Dam Med Sand 0.40 0.10 4.00 2.86 0.83 97.5 36.9 Lee and Singh (1971)
Antioch Sand 0.24 0.15 1.60 2.74 1.14 79.9 52.9 Lee and Singh (1971)
Monterey Sand 0.66 0.54 1.22 2.64 0.83 90.0 40.0 Lee and Singh (1971)
Thumb Island Sand 0.55 0.22 2.50 2.70 0.91 88.2 42.9 Lee and Singh (1971)
Lake Michigan Sand 0.18 0.06 3.00 2.65 0.87 88.4 41.7 Lee and Singh (1971)
Marsa El Brega Sand 0.27 0.10 2.70 2.65 0.72 96.1 34.5 Lee and Singh (1971)
Marsa El Brega Sand 0.16 0.08 1.90 2.65 0.88 88.0 42.2 Lee and Singh (1971)
Uniform Spheres - - 1.00 2.65 0.91 86.6 43.7 Lee and Singh (1971)
Yatesville Sand 0.22 0.09 2.45 2.72 0.97 86.1 45.4 Polito and Martin (1999)
Montery #0/30 Sand 0.46 0.31 1.48 2.65 0.82 90.8 39.4 Polito and Martin (1999)
N.R. = Not ReportedN.A. = Not Applicable

8/8/2019 The Effects of Non-Plasticand Plastic Fines on the Liquefaction Of
http://slidepdf.com/reader/full/the-effects-of-non-plasticand-plastic-fines-on-the-liquefaction-of 285/288
271
Table D-3: Limiting silt content based on Iowa silt
Gamma Limiting
D60 D10 Cu Gs emax Dmin SiltSoil mm mm (pcf) Content (%) Reference
Iowa Silt 0.004 0.003 1.37 2.67 1.12 78.6 N.A. Arman and Thorton (1973)
Medium Gravel 13.00 9.50 1.37 2.65 0.90 87.0 42.8 Lee and Singh (1971)
Pea Gravel 12.00 8.00 1.50 2.65 0.98 83.5 46.6 Lee and Singh (1971)
Coarse Sand 4.50 3.00 1.50 2.65 0.99 83.1 47.1 Lee and Singh (1971)
Medium Sand 0.84 0.70 1.20 2.65 1.05 80.7 49.9 Lee and Singh (1971)
Fine Sand 0.28 0.20 1.40 2.65 1.08 79.5 51.3 Lee and Singh (1971)
Silty Sand 0.12 0.08 1.50 2.65 1.17 76.2 55.6 Lee and Singh (1971)
Ottawa Std Sand 0.72 0.60 1.20 2.65 0.71 96.7 33.7 Lee and Singh (1971)
Loch Aline Sand 0.21 0.16 1.31 2.65 0.80 91.9 38.0 Lee and Singh (1971)
Folkstone Bed Sand 0.29 0.14 2.07 2.65 0.85 89.4 40.4 Lee and Singh (1971)
Fine Sand 0.16 0.06 2.67 2.74 0.85 92.4 39.1 Lee and Singh (1971)
Fine Sand 0.85 0.65 1.31 2.65 0.79 92.4 37.5 Lee and Singh (1971)
Fine Sand 0.85 0.75 1.13 2.65 0.86 88.9 40.9 Lee and Singh (1971)
River Sand 0.18 0.12 1.50 2.65 0.90 87.0 42.8 Lee and Singh (1971)
Fine Sand 0.12 0.08 1.50 2.65 0.92 86.1 43.7 Lee and Singh (1971)
Medium Sand 0.45 0.15 3.00 2.65 1.05 80.7 49.9 Lee and Singh (1971)
Fine Gravel 4.50 1.20 3.75 2.65 1.10 78.7 52.3 Lee and Singh (1971)
Coarse Sand 0.90 0.10 9.00 2.65 0.85 89.4 40.4 Lee and Singh (1971)
Chattahooche River Sand 0.48 0.20 2.40 2.65 1.10 78.7 52.3 Lee and Singh (1971)
Crushed Granite Gneiss 125.00 50.00 2.50 2.62 0.77 92.4 37.0 Lee and Singh (1971)
Leighton Buzzard Sand 0.20 0.15 1.33 2.60 0.72 94.3 34.9 Lee and Singh (1971)
Leighton Buzzard Sand 0.90 0.15 6.00 2.70 0.85 91.1 39.6 Lee and Singh (1971)
Ham River Sand 0.45 0.35 1.29 2.70 0.83 92.1 38.7 Lee and Singh (1971)
Brasted Sand 0.30 0.14 2.14 2.70 0.79 94.1 36.9 Lee and Singh (1971)
Wing Beach Sand 0.20 0.07 2.86 2.65 0.93 85.7 44.2 Lee and Singh (1971)
Bolsa Island Sand 0.40 0.20 2.00 2.70 0.85 91.1 39.6 Lee and Singh (1971)
Silica Sand 45.00 30.00 1.50 2.65 1.08 79.5 51.3 Lee and Singh (1971)
Sacramento River Sand 0.24 0.15 1.60 2.68 1.03 82.4 48.4 Lee and Singh (1971)
Tarbella Dam Med Sand 0.40 0.10 4.00 2.86 0.83 97.5 36.6 Lee and Singh (1971)
Antioch Sand 0.24 0.15 1.60 2.74 1.14 79.9 52.4 Lee and Singh (1971)
Monterey Sand 0.66 0.54 1.22 2.64 0.83 90.0 39.6 Lee and Singh (1971)
Thumb Island Sand 0.55 0.22 2.50 2.70 0.91 88.2 42.4 Lee and Singh (1971)
Lake Michigan Sand 0.18 0.06 3.00 2.65 0.87 88.4 41.3 Lee and Singh (1971)
Marsa El Brega Sand 0.27 0.10 2.70 2.65 0.72 96.1 34.2 Lee and Singh (1971)
Marsa El Brega Sand 0.16 0.08 1.90 2.65 0.88 88.0 41.8 Lee and Singh (1971)
Uniform Spheres - - 1.00 2.65 0.91 86.6 43.2 Lee and Singh (1971)
Yatesville Sand 0.22 0.09 2.45 2.72 0.97 86.1 45.0 Polito and Martin (1999)
Montery #0/30 Sand 0.46 0.31 1.48 2.65 0.82 90.8 39.0 Polito and Martin (1999)
N.R. = Not Reported
N.A. = Not Applicable

8/8/2019 The Effects of Non-Plasticand Plastic Fines on the Liquefaction Of
http://slidepdf.com/reader/full/the-effects-of-non-plasticand-plastic-fines-on-the-liquefaction-of 286/288
272
Table D-4: Limiting silt content based on Danby silt
Gamma Limiting
D60 D10 Cu Gs emax Dmin Silt
Soil mm mm (pcf) Content (%) ReferenceDanby Silt N.R. N.R. N.R. 2.67 0.86 89.6 N.A. Clukey et al. (1983)
Medium Gravel 13.00 9.50 1.37 2.65 0.90 87.0 48.8 Lee and Singh (1971)
Pea Gravel 12.00 8.00 1.50 2.65 0.98 83.5 53.1 Lee and Singh (1971)
Coarse Sand 4.50 3.00 1.50 2.65 0.99 83.1 53.6 Lee and Singh (1971)
Medium Sand 0.84 0.70 1.20 2.65 1.05 80.7 56.9 Lee and Singh (1971)
Fine Sand 0.28 0.20 1.40 2.65 1.08 79.5 58.5 Lee and Singh (1971)
Silty Sand 0.12 0.08 1.50 2.65 1.17 76.2 63.4 Lee and Singh (1971)
Ottawa Std Sand 0.72 0.60 1.20 2.65 0.71 96.7 38.5 Lee and Singh (1971)
Loch Aline Sand 0.21 0.16 1.31 2.65 0.80 91.9 43.3 Lee and Singh (1971)
Folkstone Bed Sand 0.29 0.14 2.07 2.65 0.85 89.4 46.0 Lee and Singh (1971)
Fine Sand 0.16 0.06 2.67 2.74 0.85 92.4 44.5 Lee and Singh (1971)
Fine Sand 0.85 0.65 1.31 2.65 0.79 92.4 42.8 Lee and Singh (1971)
Fine Sand 0.85 0.75 1.13 2.65 0.86 88.9 46.6 Lee and Singh (1971)
River Sand 0.18 0.12 1.50 2.65 0.90 87.0 48.8 Lee and Singh (1971)
Fine Sand 0.12 0.08 1.50 2.65 0.92 86.1 49.8 Lee and Singh (1971)
Medium Sand 0.45 0.15 3.00 2.65 1.05 80.7 56.9 Lee and Singh (1971)
Fine Gravel 4.50 1.20 3.75 2.65 1.10 78.7 59.6 Lee and Singh (1971)
Coarse Sand 0.90 0.10 9.00 2.65 0.85 89.4 46.0 Lee and Singh (1971)
Chattahooche River Sand 0.48 0.20 2.40 2.65 1.10 78.7 59.6 Lee and Singh (1971)
Crushed Granite Gneiss 125.00 50.00 2.50 2.62 0.77 92.4 42.2 Lee and Singh (1971)
Leighton Buzzard Sand 0.20 0.15 1.33 2.60 0.72 94.3 39.8 Lee and Singh (1971)
Leighton Buzzard Sand 0.90 0.15 6.00 2.70 0.85 91.1 45.2 Lee and Singh (1971)
Ham River Sand 0.45 0.35 1.29 2.70 0.83 92.1 44.1 Lee and Singh (1971)
Brasted Sand 0.30 0.14 2.14 2.70 0.79 94.1 42.0 Lee and Singh (1971)
Wing Beach Sand 0.20 0.07 2.86 2.65 0.93 85.7 50.4 Lee and Singh (1971)
Bolsa Island Sand 0.40 0.20 2.00 2.70 0.85 91.1 45.2 Lee and Singh (1971)
Silica Sand 45.00 30.00 1.50 2.65 1.08 79.5 58.5 Lee and Singh (1971)
Sacramento River Sand 0.24 0.15 1.60 2.68 1.03 82.4 55.2 Lee and Singh (1971)
Tarbella Dam Med Sand 0.40 0.10 4.00 2.86 0.83 97.5 41.7 Lee and Singh (1971)
Antioch Sand 0.24 0.15 1.60 2.74 1.14 79.9 59.7 Lee and Singh (1971)
Monterey Sand 0.66 0.54 1.22 2.64 0.83 90.0 45.1 Lee and Singh (1971)
Thumb Island Sand 0.55 0.22 2.50 2.70 0.91 88.2 48.4 Lee and Singh (1971)
Lake Michigan Sand 0.18 0.06 3.00 2.65 0.87 88.4 47.1 Lee and Singh (1971)
Marsa El Brega Sand 0.27 0.10 2.70 2.65 0.72 96.1 39.0 Lee and Singh (1971)
Marsa El Brega Sand 0.16 0.08 1.90 2.65 0.88 88.0 47.7 Lee and Singh (1971)
Uniform Spheres - - 1.00 2.65 0.91 86.6 49.3 Lee and Singh (1971)
Yatesville Sand 0.22 0.09 2.45 2.72 0.97 86.1 51.3 Polito and Martin (1999)
Montery #0/30 Sand 0.46 0.31 1.48 2.65 0.82 90.8 44.5 Polito and Martin (1999)
N.R. = Not Reported
N.A. = Not Applicable
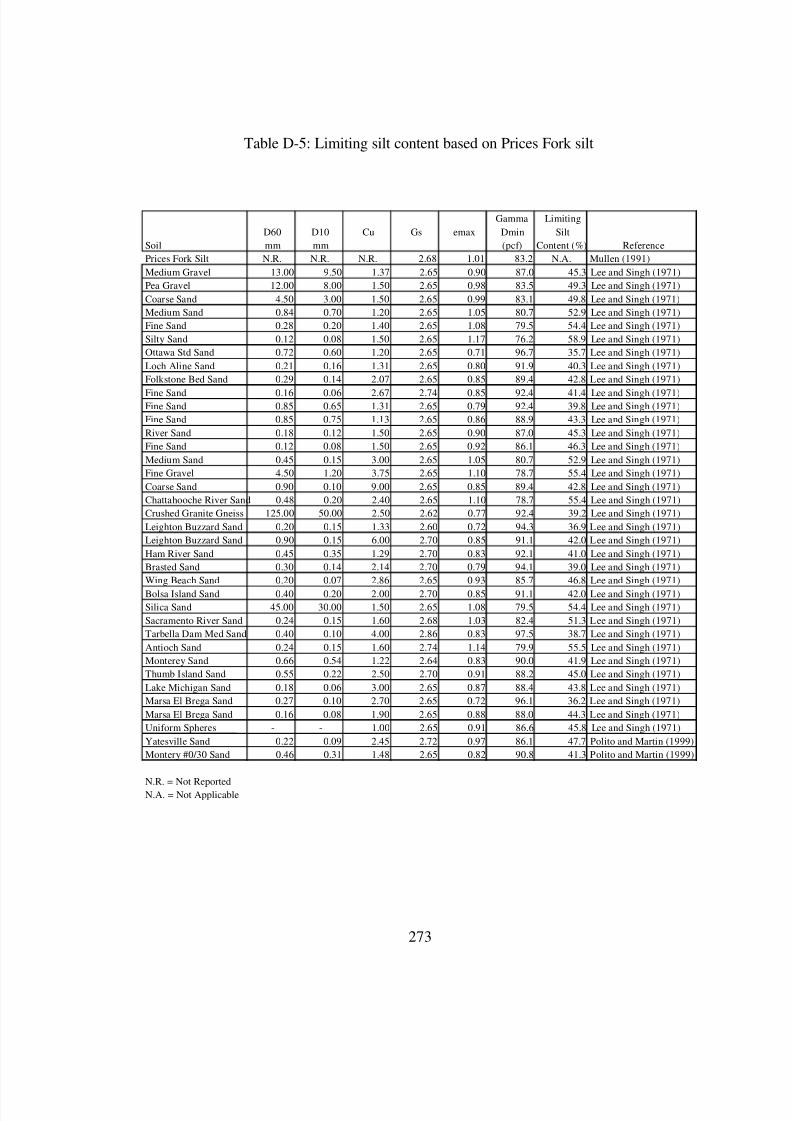
8/8/2019 The Effects of Non-Plasticand Plastic Fines on the Liquefaction Of
http://slidepdf.com/reader/full/the-effects-of-non-plasticand-plastic-fines-on-the-liquefaction-of 287/288
273
Table D-5: Limiting silt content based on Prices Fork silt
Gamma Limiting
D60 D10 Cu Gs emax Dmin Silt
Soil mm mm (pcf) Content (%) Reference
Prices Fork Silt N.R. N.R. N.R. 2.68 1.01 83.2 N.A. Mullen (1991)
Medium Gravel 13.00 9.50 1.37 2.65 0.90 87.0 45.3 Lee and Singh (1971)
Pea Gravel 12.00 8.00 1.50 2.65 0.98 83.5 49.3 Lee and Singh (1971)
Coarse Sand 4.50 3.00 1.50 2.65 0.99 83.1 49.8 Lee and Singh (1971)
Medium Sand 0.84 0.70 1.20 2.65 1.05 80.7 52.9 Lee and Singh (1971)
Fine Sand 0.28 0.20 1.40 2.65 1.08 79.5 54.4 Lee and Singh (1971)
Silty Sand 0.12 0.08 1.50 2.65 1.17 76.2 58.9 Lee and Singh (1971)
Ottawa Std Sand 0.72 0.60 1.20 2.65 0.71 96.7 35.7 Lee and Singh (1971)
Loch Aline Sand 0.21 0.16 1.31 2.65 0.80 91.9 40.3 Lee and Singh (1971)
Folkstone Bed Sand 0.29 0.14 2.07 2.65 0.85 89.4 42.8 Lee and Singh (1971)
Fine Sand 0.16 0.06 2.67 2.74 0.85 92.4 41.4 Lee and Singh (1971)Fine Sand 0.85 0.65 1.31 2.65 0.79 92.4 39.8 Lee and Singh (1971)
Fine Sand 0.85 0.75 1.13 2.65 0.86 88.9 43.3 Lee and Singh (1971)
River Sand 0.18 0.12 1.50 2.65 0.90 87.0 45.3 Lee and Singh (1971)
Fine Sand 0.12 0.08 1.50 2.65 0.92 86.1 46.3 Lee and Singh (1971)
Medium Sand 0.45 0.15 3.00 2.65 1.05 80.7 52.9 Lee and Singh (1971)
Fine Gravel 4.50 1.20 3.75 2.65 1.10 78.7 55.4 Lee and Singh (1971)
Coarse Sand 0.90 0.10 9.00 2.65 0.85 89.4 42.8 Lee and Singh (1971)
Chattahooche River Sand 0.48 0.20 2.40 2.65 1.10 78.7 55.4 Lee and Singh (1971)
Crushed Granite Gneiss 125.00 50.00 2.50 2.62 0.77 92.4 39.2 Lee and Singh (1971)
Leighton Buzzard Sand 0.20 0.15 1.33 2.60 0.72 94.3 36.9 Lee and Singh (1971)
Leighton Buzzard Sand 0.90 0.15 6.00 2.70 0.85 91.1 42.0 Lee and Singh (1971)
Ham River Sand 0.45 0.35 1.29 2.70 0.83 92.1 41.0 Lee and Singh (1971)
Brasted Sand 0.30 0.14 2.14 2.70 0.79 94.1 39.0 Lee and Singh (1971)
Wing Beach Sand 0.20 0.07 2.86 2.65 0.93 85.7 46.8 Lee and Singh (1971)
Bolsa Island Sand 0.40 0.20 2.00 2.70 0.85 91.1 42.0 Lee and Singh (1971)
Silica Sand 45.00 30.00 1.50 2.65 1.08 79.5 54.4 Lee and Singh (1971)
Sacramento River Sand 0.24 0.15 1.60 2.68 1.03 82.4 51.3 Lee and Singh (1971)
Tarbella Dam Med Sand 0.40 0.10 4.00 2.86 0.83 97.5 38.7 Lee and Singh (1971)
Antioch Sand 0.24 0.15 1.60 2.74 1.14 79.9 55.5 Lee and Singh (1971)
Monterey Sand 0.66 0.54 1.22 2.64 0.83 90.0 41.9 Lee and Singh (1971)
Thumb Island Sand 0.55 0.22 2.50 2.70 0.91 88.2 45.0 Lee and Singh (1971)
Lake Michigan Sand 0.18 0.06 3.00 2.65 0.87 88.4 43.8 Lee and Singh (1971)
Marsa El Brega Sand 0.27 0.10 2.70 2.65 0.72 96.1 36.2 Lee and Singh (1971)
Marsa El Brega Sand 0.16 0.08 1.90 2.65 0.88 88.0 44.3 Lee and Singh (1971)
Uniform Spheres - - 1.00 2.65 0.91 86.6 45.8 Lee and Singh (1971)
Yatesville Sand 0.22 0.09 2.45 2.72 0.97 86.1 47.7 Polito and Martin (1999)
Montery #0/30 Sand 0.46 0.31 1.48 2.65 0.82 90.8 41.3 Polito and Martin (1999)
N.R. = Not ReportedN.A. = Not Applicable
8/8/2019 The Effects of Non-Plasticand Plastic Fines on the Liquefaction Of
http://slidepdf.com/reader/full/the-effects-of-non-plasticand-plastic-fines-on-the-liquefaction-of 288/288