report christchurch liquefaction study - stage ii ecan...
TRANSCRIPT

§ report
Christchurch Liquefaction Study - Stage II ECan Report No. U02/22
3811859/010 Rev 1 ¦ R1:29166
§ report
Christchurch Liquefaction Study - Stage II ECan Report No. U02/22
Prepared for Environment Canterbury
By Beca Carter Hollings & Ferner Ltd
May 2002
Beca Carter Hollings & Ferner Ltd
119 Armagh St
PO Box 13960, Christchurch, New Zealand
Telephone +64-3-366 3521
Fax +64-3-366 3188
www.beca.co.nz
Environment Canterbury PO Box 345 CHRISTCHURCH Attention: Peter Kingsbury
17 May 2002 Our Ref: 3811859/010
R1:29166-SAC25R02.DOC
Dear Sir
Christchurch Liquefaction Study - Stage II ECan Report No. U02/22
Please find enclosed eleven final copies (one unbound and ten bound) of our report titled “Christchurch Liquefaction Study – Stage II”. Also enclosed is eleven copies (one unbound and ten bound) of our report titled “Liquefaction Borehole Database – User Guide”.
We thank you for the opportunity to be involved in this project and look forward to continuing work with you in the future. If you have any questions please do not hesitate to contact the undersigned.
Yours faithfully Beca Carter Hollings & Ferner Ltd
Steve Christensen Senior Geotechnical Engineer Direct Dial: +64-3-374 3152 Email: [email protected] SAC:sac
Christchurch Liquefaction Study - Stage II
3811859/010 Beca Carter Hollings & Ferner Ltd Page i R1:29166-SAC25R02.DOC Rev 1 13 May 2002
Executive Summary Earthquake induced liquefaction (where saturated soils lose their strength when shaken) is recognised as a potential hazard for some areas of Christchurch. Liquefaction maps have been previously published that show the hazard as a function of soil distribution but did not take into account the strength of soils. This would likely have exaggerated the hazard (as some soils liquefiable size may have been too dense to actually liquefy). This liquefaction study takes into account the recorded strengths of soils in Christchurch. The liquefaction study undertaken has included:
§ Research of records at Environment Canterbury that may include soil information (e.g. borelogs) other than that already contained in Environment Canterbury’s Well Database.
§ Research of property files and other general records at Christchurch City Council for soil information (primarily borelogs).
§ Scanning of the borelogs to create a digital record of all soil information encountered for Christchurch.
§ Creation of a liquefaction database to store key liquefaction information (such as soil type, soil strength and water table levels).
§ Transfer of the key information into the liquefaction database.
§ Calculation of the liquefaction hazard based on the information contained within the database via an automated program embedded in the database.
§ The creation of a Liquefaction Hazard Map and Ground Damage Map, both at scales of 1:25,000.
The processes undertaken to achieve the above work are described within this report.
Recommendations for more detailed studies are provided to improve the knowledge of liquefaction hazard in Christchurch. These items, presented below, are not listed in any order of importance.
S i t e I n v e s t i g a t i o n s
1. If a more accurate understanding of the lateral spreading hazard (i.e. amount of ground deformation) is required for Christchurch, then site investigations will need to be undertaken. It is probable that significantly more detail about lateral spreading, including lateral and vertical displacement, could be shown on the map if detailed investigations were to be undertaken. Utility operators may have already carried out such investigations. A search for such work, permission to release either its factual data, should be undertaken before new field investigations are scheduled. It is possible that while areas beside these rivers are liquefiable, lateral spreading that has been shown on the Ground Damage Map may not actually occur due to the
Christchurch Liquefaction Study - Stage II
3811859/010 Beca Carter Hollings & Ferner Ltd Page ii R1:29166-SAC25R02.DOC Rev 1 13 May 2002
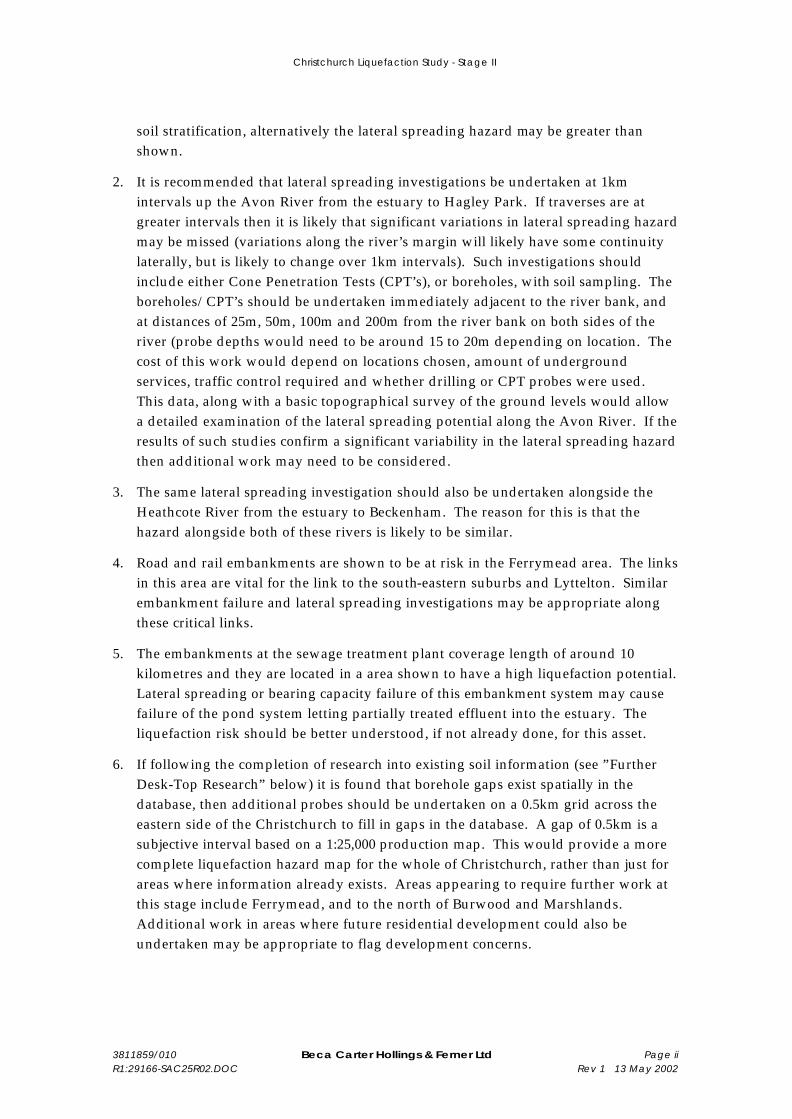
soil stratification, alternatively the lateral spreading hazard may be greater than shown.
2. It is recommended that lateral spreading investigations be undertaken at 1km intervals up the Avon River from the estuary to Hagley Park. If traverses are at greater intervals then it is likely that significant variations in lateral spreading hazard may be missed (variations along the river’s margin will likely have some continuity laterally, but is likely to change over 1km intervals). Such investigations should include either Cone Penetration Tests (CPT’s), or boreholes, with soil sampling. The boreholes/CPT’s should be undertaken immediately adjacent to the river bank, and at distances of 25m, 50m, 100m and 200m from the river bank on both sides of the river (probe depths would need to be around 15 to 20m depending on location. The cost of this work would depend on locations chosen, amount of underground services, traffic control required and whether drilling or CPT probes were used. This data, along with a basic topographical survey of the ground levels would allow a detailed examination of the lateral spreading potential along the Avon River. If the results of such studies confirm a significant variability in the lateral spreading hazard then additional work may need to be considered.
3. The same lateral spreading investigation should also be undertaken alongside the Heathcote River from the estuary to Beckenham. The reason for this is that the hazard alongside both of these rivers is likely to be similar.
4. Road and rail embankments are shown to be at risk in the Ferrymead area. The links in this area are vital for the link to the south-eastern suburbs and Lyttelton. Similar embankment failure and lateral spreading investigations may be appropriate along these critical links.
5. The embankments at the sewage treatment plant coverage length of around 10 kilometres and they are located in a area shown to have a high liquefaction potential. Lateral spreading or bearing capacity failure of this embankment system may cause failure of the pond system letting partially treated effluent into the estuary. The liquefaction risk should be better understood, if not already done, for this asset.
6. If following the completion of research into existing soil information (see ”Further Desk-Top Research” below) it is found that borehole gaps exist spatially in the database, then additional probes should be undertaken on a 0.5km grid across the eastern side of the Christchurch to fill in gaps in the database. A gap of 0.5km is a subjective interval based on a 1:25,000 production map. This would provide a more complete liquefaction hazard map for the whole of Christchurch, rather than just for areas where information already exists. Areas appearing to require further work at this stage include Ferrymead, and to the north of Burwood and Marshlands. Additional work in areas where future residential development could also be undertaken may be appropriate to flag development concerns.

Christchurch Liquefaction Study - Stage II
3811859/010 Beca Carter Hollings & Ferner Ltd Page iii R1:29166-SAC25R02.DOC Rev 1 13 May 2002
D a t a b a s e D e v e l o p m e n t & M a n a g e m e n t
The liquefaction database has been developed to enter data that is currently available and to generate results for a one-off liquefaction hazard map (it does not automatically predict liquefaction when new bore are entered, this is done via a batch process). It’s current stage of development was constrained by the budget available. Further modifications could be undertaken to improve its ability to store different types of data and generate liquefaction hazard information. These aspects are discussed below:
1. Where co-ordinates are missing for sites in the database, an attempt should be made to provide their co-ordinates. Many sites are without co-ordinates as they could not be initially ascertained by CCC. This may now be possible following the completion of the database. This will allow soil information that has been ignored in the current calculations to be analysed and reported.
2. Currently the database contains only a single borelog for each site scanned from the CCC property files. Approximately 2.5 times more information is still available for existing sites in the database. While this information could be added, it is unlikely that at the map scale of 1:25,000, that this information would add definition to the map.
3. The database is set up to accept data for borelogs, testpits, and augers, it is not set up to accept Cone Penetration Test data (which has a considerably different data format). It is known that there is a vast number (many hundreds indicated by CPT operators) of CPT’s undertaken within Christchurch and therefore, may quickly further populate the database with detailed information. If this information can be made available then it would prove to be a valuable resource. This data is usually collected in an electronic format and therefore a sensible addition to the liquefaction database would be to incorporate a function that allowed for automatic importation and storage of the data. The database would also need to be modified such that the prediction algorithm could analyse the CPT data.
4. Settlement prediction is not currently an automated process undertaken by the database. Such automated prediction could be added to the database system and this would enhance the database’s independence. Currently the settlement shown on the Ground Damage Map is weighted to account for the borehole depth analysed. Consideration could be given to reporting the actual settlement predicted as well as the settlement weighted as a fraction of the borehole depth analysed (e.g. 50mm settlement in a shallow 3m deep bore may be more significant than 100mm settlement in a 20m deep bore).
5. An idea that has been previously discussed, but has not been undertaken at this stage, is the incorporation of a feature into the database that automatically shows the original scanned borelog of a site when requested. Currently, the database only stores a reference to the scan number and its street address. This would be considered a low priority improvement as it would not improve liquefaction prediction.
Christchurch Liquefaction Study - Stage II
3811859/010 Beca Carter Hollings & Ferner Ltd Page iv R1:29166-SAC25R02.DOC Rev 1 13 May 2002
6. The liquefaction database is currently set up to process the liquefaction algorithm as a batch process by a specialist programmer (at this stage of the project this was a cost efficient way to produce a single map). An enhancement on this would be to modify the database such that an experienced database user can run the algorithm at any stage. With the addition of screens to input and modify earthquake parameters this could be achieved. However, a significant amount of further programming would be required to achieve this. If in the long-term it is anticipated that updates to the liquefaction maps will be made regularly then this may be a cost-effective approach.
F u r t h e r D e s k - T o p R e s e a r c h
1. The early stages of this liquefaction project recognised that a large pool of soil information exists in the community, but not all of it is directly available to the public. For example, geotechnical consultants, drilling contractors, utility operators and the University of Canterbury have collected information over the years that would be useful to the liquefaction database. While this information is privately owned, it would seem prudent to approach such organisations to determine if the information could be accessed and used to augment the liquefaction database. Such information is likely to cover areas not already within the current database as primarily only domestic sites are represented (the benefit from the search would flow from sites where the current database does not already contain information). Such information would be a significant and valuable resource.
2. A number of liquefaction reports exist for privately owned sites around Christchurch. If possible these reports should be collated and added to the database. This type of information is valuable as the investigations are specifically targeted for liquefaction analysis.
M a p M a i n t e n a n c e
1. Environment Canterbury has gone to significant expense to create the Liquefaction Database. Its value as a tool for Environment Canterbury and the wider community depends on it being maintained and kept up to date. The key components to the successful use of a database are the storage of quality data and the ability to maintain and update information on a regular basis. It is important that persons experienced in the use of the database undertake the entry of any new data and they also are experienced in soil information (e.g. a geotechnical engineer). Furthermore, it is recommended that a single person be in charge of the quality of the information entered in the database. Beca personnel are currently the most experienced in the entry of data and maintenance of this database.
2. Maps should be reproduced when greater than 10 per cent of the information that they are portraying may change (this is a subjective value based on perception of map accuracy). Furthermore, a liquefaction hazard map if used regularly as a regulatory device (e.g. during consenting processes) should be updated on at least a
Christchurch Liquefaction Study - Stage II
3811859/010 Beca Carter Hollings & Ferner Ltd Page v R1:29166-SAC25R02.DOC Rev 1 13 May 2002
yearly basis or whenever significant changes to the map are likely to occur due to the addition of a large amount of new information.
3. One of Environment Canterbury’s prime functions in terms of hazards is the distribution of information to the public. This could be achieved by publishing the map on Environment Canterbury’s Web Site. In doing this the most up to date information could be readily available to the public.
D i f f e r e n t M a p P r o d u c t i o n s
1. On the creation of a database, and more especially the automation of outputs such as liquefaction hazard, the opportunity exists to manipulate the data and plot information under differing conditions. For example it may be useful to plot maps of liquefaction that occurs in different depth ranges (e.g. 0-2m, 2-5m, 10-20m depth ranges). Presently, the map displays the worst liquefaction prediction within the soil column. This would allow a better understanding of the three dimension effects of liquefaction in Christchurch. For example, it may be that in certain suburbs the housing stock is single storey domestic dwellings and therefore liquefaction below 5m depth may be of little relevance and therefore could be eliminated from a map. This may help clarify the likely affects of the shallow liquefaction.
2. It would be useful to plot maps of soil types across Christchurch, both at the ground surface and at any depth range below the ground surface. While this is not a direct liquefaction tool, it may assist with other aspects of engineering and soil resources in Christchurch. Furthermore, variations in reported water table levels across Christchurch may also be useful in addition to the already published Brown & Weeber (1992) map.
Christchurch Liquefaction Study - Stage II
3811859/010 Beca Carter Hollings & Ferner Ltd Page vi R1:29166-SAC25R02.DOC Rev 1 13 May 2002
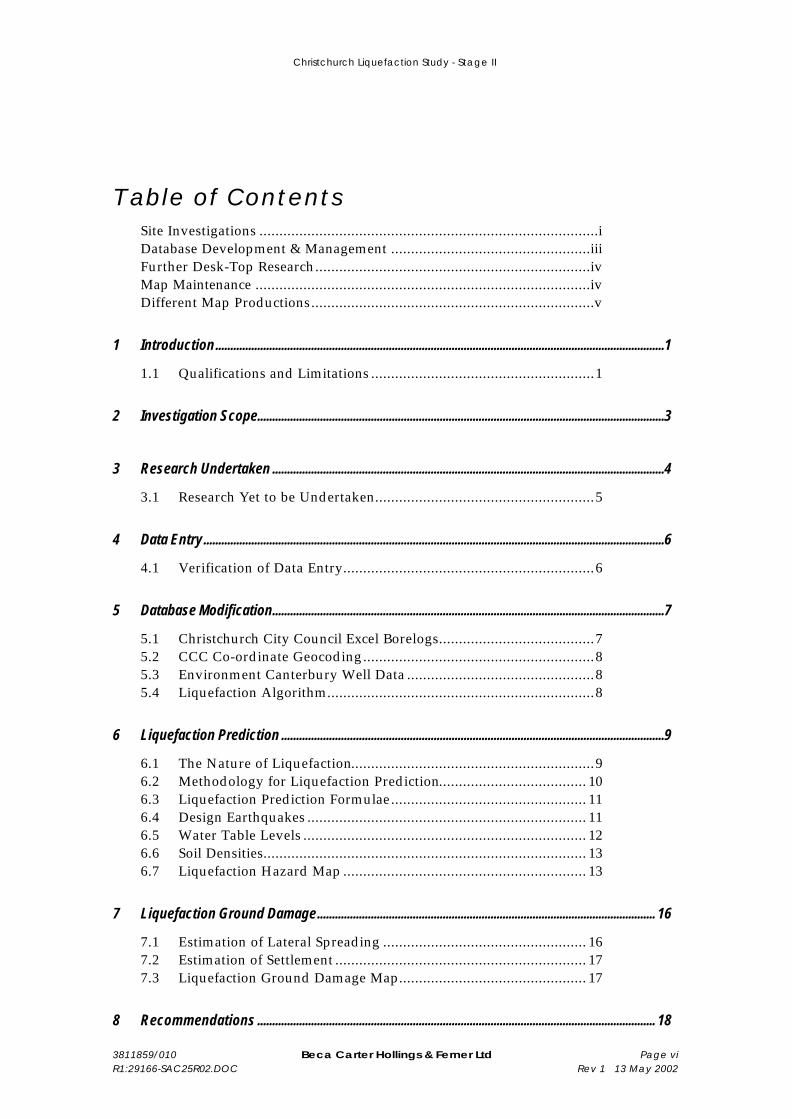
Table of Contents Site Investigations .....................................................................................i Database Development & Management ..................................................iii Further Desk-Top Research.....................................................................iv Map Maintenance ....................................................................................iv Different Map Productions.......................................................................v
1 Introduction......................................................................................................................................................1
1.1 Qualifications and Limitations ........................................................1
2 Investigation Scope........................................................................................................................................3
3 Research Undertaken ...................................................................................................................................4
3.1 Research Yet to be Undertaken.......................................................5
4 Data Entry..........................................................................................................................................................6
4.1 Verification of Data Entry...............................................................6
5 Database Modification...................................................................................................................................7
5.1 Christchurch City Council Excel Borelogs.......................................7 5.2 CCC Co-ordinate Geocoding..........................................................8 5.3 Environment Canterbury Well Data ...............................................8 5.4 Liquefaction Algorithm...................................................................8
6 Liquefaction Prediction ................................................................................................................................9
6.1 The Nature of Liquefaction.............................................................9 6.2 Methodology for Liquefaction Prediction..................................... 10 6.3 Liquefaction Prediction Formulae................................................. 11 6.4 Design Earthquakes ...................................................................... 11 6.5 Water Table Levels ....................................................................... 12 6.6 Soil Densities................................................................................. 13 6.7 Liquefaction Hazard Map ............................................................. 13
7 Liquefaction Ground Damage................................................................................................................. 16
7.1 Estimation of Lateral Spreading ................................................... 16 7.2 Estimation of Settlement ............................................................... 17 7.3 Liquefaction Ground Damage Map............................................... 17
8 Recommendations ..................................................................................................................................... 18
Christchurch Liquefaction Study - Stage II
3811859/010 Beca Carter Hollings & Ferner Ltd Page vii R1:29166-SAC25R02.DOC Rev 1 13 May 2002
9 Acknowledgements.................................................................................................................................... 18
10 References..................................................................................................................................................... 18
Methodology for Liquefaction Prediction........................................................................................................1
Design Earthquakes..................................................................................2 Background Documents ...........................................................................2 Desk-Top Study Results ...........................................................................3 Estimation of Lateral Spreading...............................................................7 Estimation of Settlement ..........................................................................7
Appendices
Appendix A – Liquefaction Maps
Appendix B – Liquefaction Prediction Formulae
Report Prepared By: Steve Christensen Signed………………………………………..
Report Reviewed By: DV Toan Signed………………………………………..
Christchurch Liquefaction Study - Stage II
3811859/010 Beca Carter Hollings & Ferner Ltd Page 1 R1:29166-SAC25R02.DOC Rev 1 13 May 2002
1 Introduction This report presents the results of a geotechnical study undertaken to evaluate the liquefaction hazard for Christchurch.
The investigation includes collation of available soil information, analysis to determine liquefaction hazard, and presentation of the hazard on liquefaction hazard maps at a scale of 1:25,000. No fieldwork has been undertaken to confirm, or otherwise, the soil information used in the liquefaction hazard assessment.
The scope of work to be undertaken by Beca Carter Hollings & Ferner Ltd is outlined in proposal to Environment Canterbury (ECan) dated 19 October 2001. Note that the research component of the study was performed under a separate commission dated 22 February 2001. The scope of the research and mapping was limited to the budget available to Environment Canterbury.
The report is the property of our client Environment Canterbury.
1 . 1 Q u a l i f i c a t i o n s a n d L i m i t a t i o n s
The following qualifications and limitations apply to this research study and have been presented on the maps provided in Appendix A.
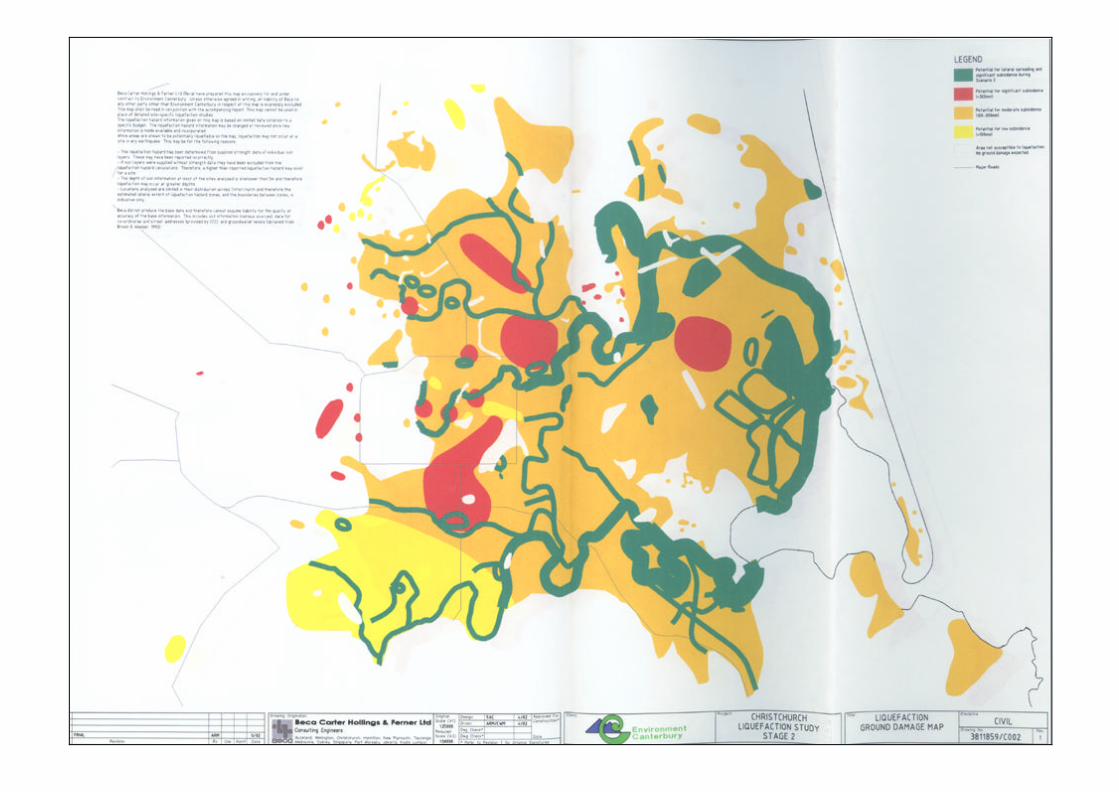
Beca Carter Hollings & Ferner Ltd (Beca) have prepared this map exclusively for and under contract to Environment Canterbury. Unless otherwise agreed in writing, all liability of Beca to any other party other than Environment Canterbury in respect of this map is expressly excluded. This map shall be read in conjunction with the accompanying report. This map cannot be used in place of detailed site-specific liquefaction studies.
The liquefaction hazard information given on this map is based on limited data collation to a specific budget. The liquefaction hazard information may be changed or reviewed once new information is made available and incorporated.
While areas are shown to be potentially liquefiable on the map, liquefaction may not occur at a site in any earthquake. This may be for the following reasons:
§ The liquefaction hazard has been determined from supplied strength data of individual soil layers. These may have been reported incorrectly.
§ If soil layers were supplied without strength data they have been excluded from the liquefaction hazard calculations. Therefore, a higher than reported liquefaction hazard may exist for a site.
§ The depth of soil information at most of the sites analysed is shallower than 5m and therefore liquefaction may occur at greater depths.
§ Locations analysed are limited in their distribution across Christchurch and therefore the estimated lateral extent of liquefaction hazard zones, and the boundaries between zones, is indicative only.
Christchurch Liquefaction Study - Stage II
3811859/010 Beca Carter Hollings & Ferner Ltd Page 2 R1:29166-SAC25R02.DOC Rev 1 13 May 2002
Beca did not produce the base data and therefore cannot assume liability for the quality or accuracy of the base information. This includes soil information (various sources), data for co-ordinates and street addresses (provided by CCC), and groundwater levels (obtained from Brown & Weeber, 1992).
Christchurch Liquefaction Study - Stage II
3811859/010 Beca Carter Hollings & Ferner Ltd Page 3 R1:29166-SAC25R02.DOC Rev 1 13 May 2002
2 Investigation Scope The scope of work for this project includes the following (abbreviated text from the project commission):
§ Data entry from the scans collected in Stage One of the Study. Only the borelogs located within the study area, i.e. Christchurch, will be transferred into the existing liquefaction database. Furthermore, as requested by ECan, where multiple borelogs have been collected for a residential section, only one typical borelog per section will be entered into the database. The borelog chosen would be the deepest.
It is expected that the data will contain some in consistencies and/or errors, due possibly to the various methods of measurement used or accidental data entry errors. A broad review area by area will hopefully identify the gross discrepancies and these will be verified and either corrected or discarded from the interpretation work that follows.
§ Modifications of the database to accept bulk loading of Christchurch City Council digital borelogs (from Excel files) and the bulk loading of ECan well logs.
§ Provision of batch-processing liquefaction assessment algorithm to allow the database to automatically analyse borelog data (in a single batch process). Liquefaction would be assessed using a single scenario earthquake defined by ECan. It will be assumed for the study area that the earthquake intensity will be the same for the entire study area (i.e. the earthquake scenario is that of a large distant earthquake that has similar site effects across Christchurch).
To simplify the modelling, the water table will match the levels presented by Brown & Weeber (Geology of the Christchurch Urban Area, 1992) for Christchurch.
Liquefaction hazards such as lateral spreading would be calculated for up to 100 sites across the study area using two lateral spread prediction formulae. The results from these sites would then be used to generalise the results at other sites within the study area on a subjective basis. The liquefaction ground damage coefficient would also be presented on a map.
§ Production of liquefaction hazard and ground damage maps. These maps would be presented at a scale of 1:25,000
Christchurch Liquefaction Study - Stage II
3811859/010 Beca Carter Hollings & Ferner Ltd Page 4 R1:29166-SAC25R02.DOC Rev 1 13 May 2002
3 Research Undertaken The Environment Canterbury consents database was searched for key words “gravel”, “sand” and “silt”, and the resulting consents reviewed for borelog information not already contained in the Environment Canterbury well database. Once new borelogs were encountered, the borelogs were digitally scanned for later inclusion into the specifically designed database. A further search for key words of “liquefaction” or “earthquake” was made but no matches were found.
Following the search of Environment Canterbury records, the Christchurch City Council (CCC) building consent records were reviewed. This occurred between mid March and the end of July 2001. The following searches were made:
§ Foundation hazard data files held at the Central Christchurch Service Centre (Tuam Street). The hazard folders were reported to contain all geotechnical information gathered for the central Christchurch area. Property files were not reviewed as this was considered to be of limited further benefit by both CCC and Environment Canterbury.
§ Nine reports (refer to the references) of major projects at that time held by John Taylor at CCC were reviewed and relevant information recorded.
§ The Fendalton Service Centre (now located at Tuam Street) hazard register was reviewed. This register noted properties that had “ground hazards” (e.g. soft ground) and therefore engineer’s reports were required for development. Individual property files were then examined and borelogs scanned where encountered. Where it was likely that the borelog only contained soils that were located above the water table (based on the Brown & Weeber water table depth map), then these logs were omitted as agreed with Environment Canterbury.
§ The above procedure was repeated for the Linwood and Sockburn Service Centres.
§ During the research project there has been around 9,100 digital scans (site plans and logs) made comprising around 3,700 sites. Furthermore, around 4,800 borelogs were also obtained from CCC in Excel format.
The contacts made during this research at CCC are as follows:
§ Main liaison with CCC: John Buchan - Building Control Manager
§ Fendalton Service Centre: Leo O’Louglin - Hazard Register Maintenance
§ Linwood Service Centre: Tony Murray - Area Development Officer
Bill Haase - Hazard Register Maintenance
§ Sockburn Service Centre: Geoff Stuart - Area Development Officer
George Marsh - Hazard Register Maintenance
Generally the file management systems are similar at each service centre although they do vary in the degree of detail recorded. Hazard Registers at Sockburn, which include hazards such as soft ground and flooding, indicate that the ‘soft ground’ hazard is not
Christchurch Liquefaction Study - Stage II
3811859/010 Beca Carter Hollings & Ferner Ltd Page 5 R1:29166-SAC25R02.DOC Rev 1 13 May 2002
the most prevalent hazard identified. Hazard Registers at Linwood and Fendalton, although not as detailed, have ‘soft ground’ as the most common hazard.
A search of the available soil data at City Design was requested. However, we were advised that third parties own the information that City Design hold and as such they are not at liberty to release the information. The extent of the information held by City Design is unknown to Beca.
3 . 1 R e s e a r c h Y e t t o b e U n d e r t a k e n
The following research could still be undertaken to recover existing soil records which would likely enhance the Christchurch Liquefaction Database (These research avenues were identified at the start of the project, but have not been pursued due to budgetary constraints):
§ Contact other utility companies to obtain any information that they have available.
§ Contact other consultants to obtain any information that they have available.
§ Contact University of Canterbury to obtain any information that they have available.
§ Obtain permission from City Design clients to use the borehole data that they hold.
Christchurch Liquefaction Study - Stage II
3811859/010 Beca Carter Hollings & Ferner Ltd Page 6 R1:29166-SAC25R02.DOC Rev 1 13 May 2002
4 Data Entry As indicated in the scope of work, data entry was limited to one borelog per (residential) site. The factual information contained from the scanned borelogs (and other report formats) was transferred to the database by a team of data entry operators over a two-month period. Some information, such as depths or strengths, was converted from imperial or non-standard units before entry to the database. Some information that was not pertinent to the liquefaction database was not entered (e.g. foundation details of the building to be constructed). However, this information is still available on the original scanned borelogs if required.
4 . 1 V e r i f i c a t i o n o f D a t a E n t r y
Verification of the data entry was undertaken in parallel with the data entry and was the responsibility of a single person. Initially the verification was a full check of the input of each of the data entry personnel (four data entry operators were engaged in the task). This involved checking that all the necessary data had been entered into the database. All errors noted in the data entry were referred back to the data entry operator to rectify. Checks were also made that the corrections were undertaken.
The verification process was at a full check of all entered data for the initial 60 per cent of data entry. Following this point the data entry verification then concentrated on the soil strengths and lithology (other errors noticed during the checking were still identified and corrected). The checks for the final 25 per cent of borelogs focused primarily on the lithology of each of soil layers, as this was the most critical item in terms of susceptibility to liquefaction.
Christchurch Liquefaction Study - Stage II
3811859/010 Beca Carter Hollings & Ferner Ltd Page 7 R1:29166-SAC25R02.DOC Rev 1 13 May 2002
5 Database Modification Summarised below are the modifications undertaken to the liquefaction database to incorporate the new data and add additional fields added to the database. The functionality of the features is more fully explained in the user manual for the database.
5 . 1 C h r i s t c h u r c h C i t y C o u n c i l E x c e l B o r e l o g s
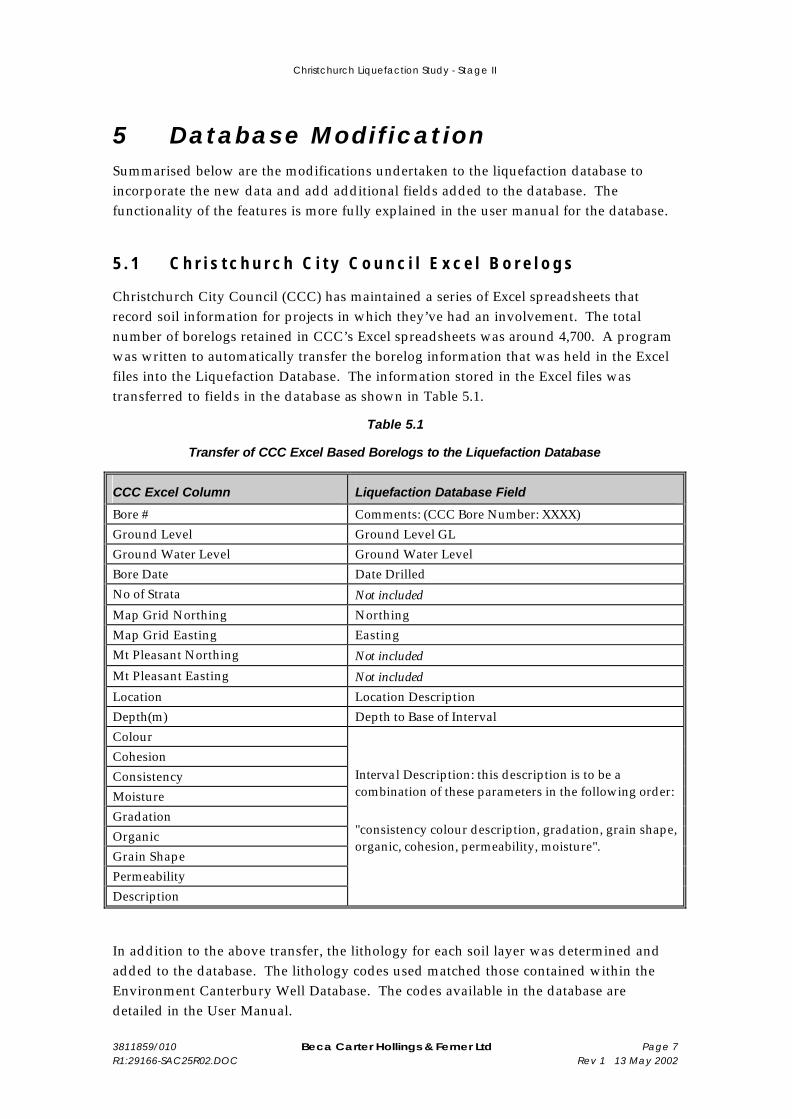
Christchurch City Council (CCC) has maintained a series of Excel spreadsheets that record soil information for projects in which they’ve had an involvement. The total number of borelogs retained in CCC’s Excel spreadsheets was around 4,700. A program was written to automatically transfer the borelog information that was held in the Excel files into the Liquefaction Database. The information stored in the Excel files was transferred to fields in the database as shown in Table 5.1.
Table 5.1
Transfer of CCC Excel Based Borelogs to the Liquefaction Database
CCC Excel Column Liquefaction Database Field
Bore # Comments: (CCC Bore Number: XXXX) Ground Level Ground Level GL Ground Water Level Ground Water Level Bore Date Date Drilled No of Strata Not included Map Grid Northing Northing Map Grid Easting Easting Mt Pleasant Northing Not included Mt Pleasant Easting Not included Location Location Description Depth(m) Depth to Base of Interval Colour Cohesion Consistency Moisture Gradation Organic Grain Shape Permeability Description
Interval Description: this description is to be a combination of these parameters in the following order: "consistency colour description, gradation, grain shape, organic, cohesion, permeability, moisture".
In addition to the above transfer, the lithology for each soil layer was determined and added to the database. The lithology codes used matched those contained within the Environment Canterbury Well Database. The codes available in the database are detailed in the User Manual.
Christchurch Liquefaction Study - Stage II
3811859/010 Beca Carter Hollings & Ferner Ltd Page 8 R1:29166-SAC25R02.DOC Rev 1 13 May 2002
5 . 2 C C C C o - o r d i n a t e G e o c o d i n g
The borelogs that were manually entered into the Liquefaction Database did not typically have their co-ordinates (i.e. Eastings and Northings) recorded on the original borelogs. Therefore co-ordinates were required for all of these boreholes. The CCC Excel borelogs (refer below) did have co-ordinates already assigned to them.
CCC’s Information Directorate has provided co-ordinates for the majority of the sites where they were missing. The co-ordinates that were supplied by CCC for each of the sites was the centroid of the property determined from the street addresses. In around 20 per cent of the sites an exact match between the recorded street address for borelogs (e.g. 20a & b Bealey Avenue) could not automatically be recognised by CCC’s GIS system. Further processing with manual manipulation provided co-ordinates for 99.7 per cent of the sites.
5 . 3 E n v i r o n m e n t C a n t e r b u r y W e l l D a t a
It was scoped that the Environment Canterbury Well Data would be incorporated into the Liquefaction Database. Initially it was scheduled that this would be undertaken as a single batch transfer process. However, ECan decided that greater benefit would be gained if the Well and Liquefaction Databases were linked, reducing duplication of data. This being a significant variation to the commission, and because liquefaction prediction is not directly possible from the ECan Well data, it was decided leave this link process until a later date. The reason why the ECan Well Data can not be directly used to predict the liquefaction hazard is because in situ soil strengths are not stored in the Well Database.
5 . 4 L i q u e f a c t i o n A l g o r i t h m
An algorithm has been incorporated in the database to undertake batch processing of the data and prediction of the liquefaction hazard (refer to Appendix B and Section 6 for equations used in the algorithm). The results of the prediction are shown in the viewing windows of the database. The details on the prediction methodology are explained in detail in Section 6 below. With the current amount of data in the database the algorithm takes approximately half an hour to calculate with Pentium III speed computer.
Christchurch Liquefaction Study - Stage II
3811859/010 Beca Carter Hollings & Ferner Ltd Page 9 R1:29166-SAC25R02.DOC Rev 1 13 May 2002
6 Liquefaction Prediction
6 . 1 T h e N a t u r e o f L i q u e f a c t i o n
Liquefaction is the process in which saturated soils lose strength when cyclically loaded by earthquake vibrations. This causes soils to temporarily behave like a fluid during liquefaction. A general overview of the liquefaction process is provided below.
1. Earthquake ground motions cause repeated shear deformations in the soils. This repeated deformation causes a tendency for compaction of the soils.
2. If immediate drainage is unable to occur, then an increase in pore water pressure results in soils below the water table.
3. Liquefaction occurs when the pore water pressure rises to the point at which it is equal to the overburden weight of the soil.
4. This causes sand to lose much of its inherent strength resulting in a near fluid state.
5. Once the shaking ceases the soil grains then settle to form a more compact configuration. The excess pore water pressure may be dissipated through vent holes formed at geological discontinuities in the overburden, resulting in water being ejected to the ground surface or above the ground water level. This excess pore water that is being dissipated through the vents may cause sufficient velocity to entrain sand particles. These processes result in the formation of mini volcano like “sand boils” on the surface of the ground.
Susceptibility to liquefaction requires certain conditions be met for liquefaction to occur, e.g.
§ The soil is non-cohesive and saturated.
§ Plastic fines within the soil are relatively low (i.e. less than 15 per cent).
§ Soils particles are relatively uniform in their grading (i.e. predominately one size of particles).
§ Sand deposits are recent (relatively old soils, earlier than Late Holocene, are less susceptible to liquefaction because they are more likely to be partially cemented together).
The above conditions usually mean that liquefaction occurs in recent sand and silty sand deposits. These deposits are often found near rivers and in coastal areas.
Liquefaction effects can be categorised according to their different failure mechanisms, such as:
Christchurch Liquefaction Study - Stage II
3811859/010 Beca Carter Hollings & Ferner Ltd Page 10 R1:29166-SAC25R02.DOC Rev 1 13 May 2002
§ Ground surface settlements – densification during liquefaction causes the ground surface to settle down. Variations in this settlement can cause damage to structures supported on or within the ground.
§ Lateral spreading – this is when surficial soils move down slopes or towards an unsupported edge on liquefied soils. This is most common along the margins of waterways and historical waterways. It is discussed in more detail in Section 7.1.
§ Loss of bearing capacity – this could cause a building, structure, or embankment to settle during liquefaction. If the structure is unevenly loaded then it is possible that the structure may tilt or break up due to the differential settlement across the foundations.
§ Buoyant Rise of Buried Structures – structures that require the weight of their overlying soils to keep them below the water table may be uplifted (possibly to the ground surface) during liquefaction due to their buoyant state in the liquefied soils. Such structures may include empty, or partly empty, tanks and pipelines.
§ Flow Failures – one of the most catastrophic liquefaction effects is that of flow failures. If soils beneath a slope become liquefied then the liquefied soils and any other overlying soils may flow down towards the base of the slope. This is a similar scenario to a landslide but has the ability to occur on slight slopes (less than 1 degree) and ground damage could cover a large area.
6 . 2 M e t h o d o l o g y f o r L i q u e f a c t i o n P r e d i c t i o n
The prediction of liquefaction is a quasi-empirical procedure that is continuing to develop from laboratory research and from studies of liquefaction following earthquakes. Many prediction procedures have been developed since the late 1960’s where liquefaction was first intensively studied. For this reason, it is appropriate in regional studies or detailed studies for significant structures to predict liquefaction by various techniques to understand the sensitivity of the results obtained.
In this study, liquefaction prediction is made from a database where individual data sets or results are not individually reviewed. Therefore, a sensitivity analysis becomes more important in this study. Methods for achieving the sensitivity analysis are outlined in Section 6.4.
The following methodology was used to predict liquefaction for soil layers within the database:
1. If soils did not have strength values assigned to them, then these soils are not analysed.
2. Soils that lay above the nominated water table level were not evaluated, as these soils will not be liquefiable, although they could compact and result in post earthquake settlements. Notwithstanding this, if the water table was higher than predicted then these soils could actually liquefy.
Christchurch Liquefaction Study - Stage II
3811859/010 Beca Carter Hollings & Ferner Ltd Page 11 R1:29166-SAC25R02.DOC Rev 1 13 May 2002
3. The following soils in the database were considered to be potentially liquefiable and were analysed for susceptibility to liquefaction: gravel when mixed with sand and/or silt; sand; silt; and mixtures of silt and sand. Sand and silt mixtures are reported to be most prone to liquefaction (Tsuchida & Hayashi, 1971). All other soils within the database were considered to be non-liquefiable and were not evaluated.
4. Soil strengths were converted from their reported units on the borelogs (e.g. shear strength or bearing capacity) to a common unit. The most common test result for prediction of liquefaction is either the Standard Penetration Test (SPT) N-value or Cone Penetrometer Test results (combined end bearing and sleeve friction parameters). In this study a number of the results on the borelogs were for SPT tests and therefore it was decided to convert all other results to SPT N-values. Furthermore, conversion relationships for SPT N-values were more readily available. Conversions from one test result to another were based on Stockwell (1977), Scala (1956), Austroads (1992) and NZ Geomechanics Society (1988). Where multiple strengths were reported for a single layer then the lowest strength value was used in calculations.
5. The liquefaction hazard was then predicted for each soil that complied for the above conditions. The method used to make the predictions is outlined in Appendix B. In order to access the sensitivity of these calculation three earthquake scenarios (refer Section 6.4) were calculated for each soil. The liquefaction hazard for a site, or borelog location, was then calculated to be the highest hazard for any particular layer within the soil column for any of the three earthquake scenarios.
6 . 3 L i q u e f a c t i o n P r e d i c t i o n F o r m u l a e
The sensitivity of a soil to liquefaction could be established by either using multiple prediction procedures to estimate liquefaction or to vary the earthquake parameters used in analysis. In this study the earthquake parameters were varied to establish a soil’s sensitivity to liquefaction. Therefore, a robust method of liquefaction prediction was required. The prediction method employed is based on the Simplified Seed procedure (refer to Appendix B), which is a widely used method.
6 . 4 D e s i g n E a r t h q u a k e s
A detailed discussion of the earthquake parameters used in this study is provided in Appendix B. In summary, an Alpine fault event has been used in liquefaction analyses. Two other scenario earthquakes, being a local and foothills earthquakes, are also discussed in Appendix B. The smaller local earthquake may not have sufficient strong ground motion cycles (5 No.) to cause liquefaction and therefore has not been adopted. The foothills earthquake scenario could have been chosen, but was not due to the return interval being around 2,000 years compared to the Alpine earthquake having a return period of around 300 to 500 years.
Christchurch Liquefaction Study - Stage II
3811859/010 Beca Carter Hollings & Ferner Ltd Page 12 R1:29166-SAC25R02.DOC Rev 1 13 May 2002
Three different ground accelerations, with peak ground accelerations of 0.12g, 0.20g and 0.34g (“g” is acceleration due to gravity), for the Alpine event have been used to obtain a sensitivity analysis for soil liquefaction. By choosing different levels of shaking, the trigger points for liquefaction can be determined. For example, where a soil liquefies due to a relatively low level of earthquake shaking, the liquefaction hazard is high as the soil has a low resistance to liquefaction. Likewise, if a soil liquefies at a threshold of 0.34g shaking and not the lesser values of 0.12g or 0.20g, then the soil has some resistance to liquefaction and is classified as “Low Susceptibility”.
6 . 5 W a t e r T a b l e L e v e l s
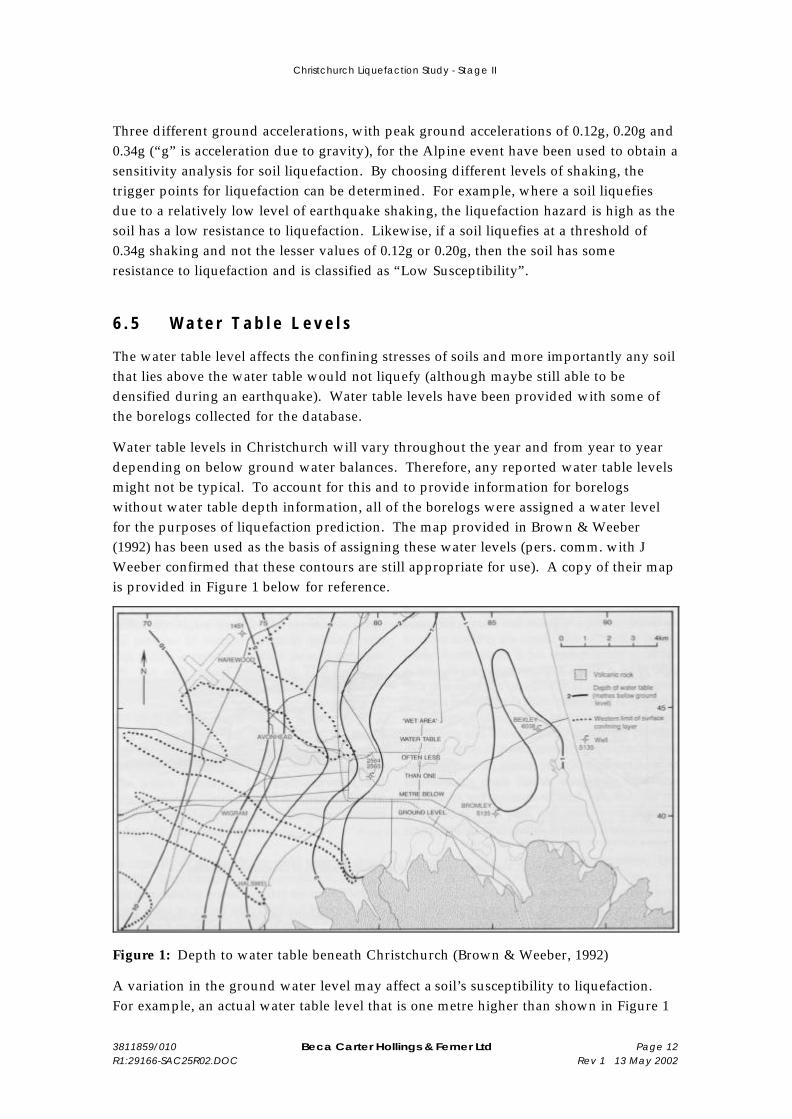
The water table level affects the confining stresses of soils and more importantly any soil that lies above the water table would not liquefy (although maybe still able to be densified during an earthquake). Water table levels have been provided with some of the borelogs collected for the database.
Water table levels in Christchurch will vary throughout the year and from year to year depending on below ground water balances. Therefore, any reported water table levels might not be typical. To account for this and to provide information for borelogs without water table depth information, all of the borelogs were assigned a water level for the purposes of liquefaction prediction. The map provided in Brown & Weeber (1992) has been used as the basis of assigning these water levels (pers. comm. with J Weeber confirmed that these contours are still appropriate for use). A copy of their map is provided in Figure 1 below for reference.
Figure 1: Depth to water table beneath Christchurch (Brown & Weeber, 1992)
A variation in the ground water level may affect a soil’s susceptibility to liquefaction. For example, an actual water table level that is one metre higher than shown in Figure 1
Christchurch Liquefaction Study - Stage II
3811859/010 Beca Carter Hollings & Ferner Ltd Page 13 R1:29166-SAC25R02.DOC Rev 1 13 May 2002
may increase the depth of liquefiable soils be one metre as well as increasing the severity of liquefaction. In the analyses it has been assumed that the area between the 1 and 2m contour has a ground water level of 1m, to provide a conservative approach (same approach also used between other contours). The water table depths are critical in liquefaction prediction, especially in the area near to the water table.
6 . 6 S o i l D e n s i t i e s
Soil densities will vary from site to site across Christchurch and also within boreholes. The soil density of peat, clay, silt, sand, gravel can vary from each other. Furthermore, one sand deposit may have a different density to an adjacent sand deposit, likewise for other soil types. As no laboratory tests are available in the database to define the actual soil densities, only predictions of the density can be made (usually based on soil strength). To simplify the prediction process, densities of 1.8t/m3 have been used for saturated soils and 1.65t/m3 for dry soils in the database (variations could be in the range of 1 to 2.2t/m3 depending on soil type). These densities are typical for many of the liquefiable soils within Christchurch.
This generalisation may potentially over or underestimate the confining stress of soil layers and therefore the liquefaction hazard for a site may be misrepresented. However, the difference between actual and estimated overburden pressure is likely to be small and therefore the estimation has a small effect on the prediction process. More complex estimation of the soil density could be undertaken based on the soil type and strength, but this is considered unwarranted for the scale of maps produced (1:25,000). For example, for a given soil type, the density could be estimated based on the soil strength measured during in situ testing.
6 . 7 L i q u e f a c t i o n H a z a r d M a p
Following the prediction procedure outlined in the above sections, a liquefaction hazard map was produced for Christchurch. The map has been reproduced at a scale of 1:50,000 in Appendix A. The compilation scale of the map is 1:25,000.
The map covers a large portion of Christchurch, but not all of it. The Port Hills, on the southern side of Christchurch, contains silt (loess) and volcanic rock that is deemed to be non-liquefiable for the purposes of this study. Therefore the map does not cover all of the Port Hills area that is contained within the Christchurch boundary. The part of Christchurch to the west of Christchurch Airport has not been mapped as it contains sites determined not to be liquefiable (mostly due to the deep water table levels).
Some borelogs were available for the area between the northern map boundary and the Christchurch boundary at Waimakariri River (further to the north). Some of these sites in Brooklands were identified as being liquefiable. However, the extension of the map to cover this isolated instance was not deemed justified as the amount of data in this area was limited.

Christchurch Liquefaction Study - Stage II
3811859/010 Beca Carter Hollings & Ferner Ltd Page 14 R1:29166-SAC25R02.DOC Rev 1 13 May 2002
The potential for liquefaction is shown on the Liquefaction Hazard Map for Christchurch and this potential has been divided into four classes:
§ High Liquefaction Potential: areas in which earthquake peak ground accelerations of 0.12g for a magnitude 8 Alpine fault earthquake potentially cause some of the soils to liquefy (Scenario 1). Note also that some other soils at the same location may not liquefy or could have a lesser susceptibility to liquefaction.
§ Moderate Liquefaction Potential: areas in which the higher earthquake peak ground accelerations of 0.20g for a magnitude 8 Alpine fault earthquake potentially cause some of the soils to liquefy (Scenario 2). Note also that some other soils at the same location may not liquefy or could have a lesser susceptibility to liquefaction.
§ Low Liquefaction Potential: areas in which only the highest earthquake peak ground acceleration of 0.34g for a magnitude 8 Alpine fault earthquake potentially cause some of the soils to liquefy (Scenario 3). Note also that some other soils at the same location may not liquefy or could have a lesser susceptibility to liquefaction.
§ No Liquefaction Potential: areas in which an earthquake ground acceleration of 0.34g failed to predict liquefaction (or alternatively no soil data was available on which to base predictions). However, it should be noted that due to the limited spatial extent of soil information in the database, these areas might contain liquefiable soils or could be subject to other forms of instability, for example, slope failure.
Note that borehole locations are shown as small blue dots on the Hazard Map.
Notwithstanding the above determinations, different soil layers at a site may have different susceptibilities to liquefaction. The liquefaction algorithm assigns the liquefaction hazard for a site based on the weakest liquefiable soil. Hence the variability within a soil column is not presented on the Liquefaction Hazard Map. The worst occurrence of liquefaction susceptibility is reported, as this is likely to be critical. However, reporting of the liquefaction ground settlement, where the cumulative settlement within a soil column is calculated, provides an averaging effect.
The Liquefaction Hazard Map generated is loosely similar to the existing liquefaction hazard maps previously presented by CAE (1997) and Brown & Weeber (1992). The most significant difference being the reported low hazard in this study for the most recent sand dune system along Brighton Beach and also to the north of the Avon River. This is likely due to the high density of the sands within the dune system. Elsewhere, prediction is similar to what was previously reported, with the hazard being predominately confined to the eastern side of Christchurch in the Christchurch Formation soils (refer to Brown & Weeber, 1992, for soil formation description). Notwithstanding this, the classifications are more specific and “mapping” of units are more detailed than previously reported due to the inclusion of the soil strength in prediction procedures.
Christchurch Liquefaction Study - Stage II
3811859/010 Beca Carter Hollings & Ferner Ltd Page 15 R1:29166-SAC25R02.DOC Rev 1 13 May 2002
In total, liquefaction hazard was calculated at 2,161 sites in the study area. This is from a database, which contains approximately 3,700 sites that have been manually entered (with and without strength data), and around 4,700 entered from CCC Excel files (without soil strength data). At the remainder of the sites there was insufficient information on soil strength to undertake liquefaction hazard predictions. One of the main reasons for this was that there was no strength information to match to soil layers, hence calculations could not be undertaken (estimates could be made in the future, but this would be best undertaken on a manual basis). Co-ordinates for 1,134 sites either not made available from the CCC geocoding process or addresses supplied could not be matched to the liquefaction database addresses.
Christchurch Liquefaction Study - Stage II
3811859/010 Beca Carter Hollings & Ferner Ltd Page 16 R1:29166-SAC25R02.DOC Rev 1 13 May 2002
7 Liquefaction Ground Damage As mentioned in Section 6.1, the process of liquefaction can lead to specific failure types of either the ground or structures reliant on the ground for support. Lateral spreading and ground settlement are discussed in more detail in Sections 7.1 and 7.2 respectively.
7 . 1 E s t i m a t i o n o f L a t e r a l S p r e a d i n g
The detailed prediction of lateral spreading and also the horizontal displacements that it causes is not possible given the scale of this investigation and the lack of detailed information at most locations. Detailed lateral spreading predictions are only possible following detailed site-specific studies where the soil environment is fully described in terms of strength, distribution and ground elevation. Nonetheless, the following could be expected to occur in general terms.
§ Lateral spreading is likely to occur adjacent to current rivers (e.g. Avon and Heathcote Rivers), streams and drains if the soils adjacent to these waterways are liquefiable. These types of soil are more prone to liquefaction because they tend to be younger and more prone to lateral spreading because they are unsupported along the river edge. Lateral Spreading could also be expected to occur along the margins of historical waterways such as those shown in Brown & Weeber, 1992 (“Black Maps”). The lateral spreading is likely to be greatest at locations where the soils are lying on slopes that dip down towards the waterways.
§ Spreading could also be expected to occur at sand dunes where failure beneath the sand dune would tend to reduce the crest height and push the toe of the dune laterally away from the sand dune.
§ Road, rail, and other stopbanks within Christchurch may undergo significant ground damage due to liquefaction and spreading processes.
Lateral spreading and its consequences will need to be investigated and quantified on a site-by-site basis once an individual site has been fully investigated (site topography as well as soil profile). However, the following generalisations could be made.
Dependent on geological conditions, the lateral spreading may occur, in extreme cases, up to a distance of a hundred metres or more inland from the waterway. The horizontal displacements are likely to decay logarithmically with distance from the waterway. At a distance of 20m from the edge of a waterway such as the Avon River, this lateral displacement could be in the region of one to four metres at the ground surface. Using the method of Bartlett & Youd (1995), refer to formulae below, it has been calculated that the lateral spreading may extend back from the riverbank by 200 to 300 metres along the lower reaches of the Avon and Heathcote Rivers depending on the site geology and severity of liquefaction. Refer to Appendix B for the prediction formulae.
Christchurch Liquefaction Study - Stage II
3811859/010 Beca Carter Hollings & Ferner Ltd Page 17 R1:29166-SAC25R02.DOC Rev 1 13 May 2002
7 . 2 E s t i m a t i o n o f S e t t l e m e n t
The same earthquake parameters, water levels and soil conditions used in the liquefaction prediction were used for liquefaction settlement prediction. However, these direct settlement results were not used on the Liquefaction Ground Damage Map (Appendix A). The reason for this is that the borehole depths varied amongst the 100 borelogs analysed and therefore the results were borelog depth dependent. The settlement results were weighted to reflect the borehole depth. These weighted results were then used to plot the settlement areas on the Liquefaction Hazard Map.
7 . 3 L i q u e f a c t i o n G r o u n d D a m a g e M a p
As indicated in Section 7.1 and 7.2 above, the Liquefaction Ground Damage Map has been compiled from calculations of lateral spreading and ground settlement following from liquefaction. The map has been reproduced at a scale of 1:50,000 in Appendix A. The compilation scale of the map is 1:25,000. This map covers the same area of Christchurch that the Liquefaction Hazard Map covers. The width of the lateral spread areas shown on the map is defined by the estimated inland (back from the river’s edge) extent of lateral spreading.
Other liquefaction hazards, apart from ground settlement and lateral spreading, such as buoyant rise of underground structures are highly variable and therefore not suitable for a map at this scale and require specific study.
Christchurch Liquefaction Study - Stage II
3811859/010 Beca Carter Hollings & Ferner Ltd Page 18 R1:29166-SAC25R02.DOC Rev 1 13 May 2002
8 Recommendations The full set of recommendations following from the study is contained in the Executive Summary at the front of this report.
9 Acknowledgements Beca wish to acknowledge the extensive assistance provided by Christchurch City Council during the research stage of the project and also to their staff for providing geocoding assistance for borehole locations. Beca wish to also thank the staff at Environment Canterbury for providing assistance during research at their offices.
10 References § Austroads (1992), “Pavement Design A Guide to the Structural Design of Road
Pavements”, Sydney.
§ Bartlett, S. F. and T. L. Youd (1992), ”Empirical Prediction of Lateral Spread Displacement“, Proc. 4th Japan-US Workshop on Earthquake Resistant Design of Lifeline Facilities, Honolulu, pp 351-366.
§ Bartlett, S. F. and T. L. Youd (1995), “Empirical Prediction of Liquefaction-Induced Lateral Spread” Jr. Geo. Eng., Vol 121, No. 4.
§ Beca Carter Hollings & Ferner Ltd (2000), “Liquefaction Study”, prepared for Waimakariri District Council & Environment Canterbury, EC Pub # U00/12, Beca Job # 3812731.
§ Beca Carter Hollings & Ferner Ltd (2002), “Liquefaction Borehole Database – User Guide”, prepared for Environment Canterbury, Beca Job # 3811859.
§ Bowles, J. E. (1996), “Foundation Analysis and Design”, 5th Edition, McGraw-Hill, New York.
§ Brown LJ and JH Weeber (1992), “Geology of the Christchurch Urban Area”, IGNS, Scale 1:25,000.
§ Christchurch City Council Program “Borelog.exe”, borelog files from #1 through to #4753.
§ Centre for Advanced Engineering CAE (1997), “Risk & Realities A Multi-disciplinary Approach to the Vulnerability of Lifelines to Natural Hazards based on the Work of the Christchurch Engineering Lifelines Group”, November 1997, University of Canterbury, Christchurch.
§ Draft Australian/New Zealand Standard DR 1170.4/PPC2, March 2002.
§ Environment Canterbury Well Database, February 2001.
Christchurch Liquefaction Study - Stage II
3811859/010 Beca Carter Hollings & Ferner Ltd Page 19 R1:29166-SAC25R02.DOC Rev 1 13 May 2002
§ Ishihara, K. and M. Yoshimine (1992), "Evaluation of Settlements in Sand Deposits Following Liquefaction During Earthquakes", Soils and Found., Vol. 32, No. 1, pp 173-188.
§ New Zealand Geomechanics Society (1988), “Guidelines for the Field Description of Soils and Rocks in Engineering Use”, Wellington, NZ.
§ NZS 4203:1992, “Code of Practice for General Structural Design and Design Loadings for Buildings”.
§ Scala, A.J. (1956), “Simple Methods of Flexible Pavement Design Using Cone Penetrometers”, Second Australia – New Zealand Soil Mechanics Conference Proceedings.
§ Seed, H.B, and Idriss, I.M., 1982, “Ground Motions and Soil Liquefaction During Earthquakes”.
§ Stirling, M, M Yetton, J Pettinga, K Berryman and G Downes (1999), “Probabilistic Seismic Hazard Assessment and Earthquake Scenarios for the Canterbury Region, and Historic Earthquakes in Christchurch: Stage 1 (Part B) of Canterbury Regional Council’s Earthquake Hazard and Risk Assessment Study” prepared for Canterbury Regional Council, IGNS, June 1999, CRC Report N° U99/18.
§ Stirling, M. et al (2000), “Probabilistic Seismic Hazard Assessment of New Zealand, New Active Fault Data, Seismicity Data, Attenuation Relationships and Methods”, GNS Report 2000/53, May 2000.
§ Stockwell, M.J. (1977), “Determination of allowable bearing pressure under small structures”, NZ Eng. (32/6), 15 June 1977.
§ Tsuchida, H & S. Hayashi (1971), “Estimation of Liquefaction Potential of Sandy Soils”, Third Joint Meeting U.S. Japan Panel on Wind and Seismic Effects, UJNR, Tokyo.
§ URS New Zealand Ltd, 2001, Brief of Evidence in the Matter of the Resource Management Act 1991 Between CRC and WDC – Pegasus Bay.
§ Youd, T. L. and I. M. Idriss (1997) “Proceedings of the NCEER Workshop on Evaluation of Liquefaction Resistance of Soils”, Technical Report NCEER-97-0022, Salt Lake City, Utah, December 1997.
§ Youd, T. L. and I. M. Idriss (2001) “Liquefaction Resistance of Soils : Summary Report from the 1996 NCEER and 1998 NCEER/NSF Workshops on Evaluation of Liquefaction Resistance of Soils”, Jr. Geotech. & Geoenviron. Eng., April 2001, pp 297-313.
§ Zhao, J.X., Dowrick, D.J., McVerry,, G.H., (1997), “Attenuation of Peak Ground Acceleration in New Zealand Earthquakes”, Bul. NZNSEE, Vol. 30, Nº 2
Christchurch Liquefaction Reports Collected During Investigation
Christchurch Liquefaction Study - Stage II
3811859/010 Beca Carter Hollings & Ferner Ltd Page 20 R1:29166-SAC25R02.DOC Rev 1 13 May 2002
§ City Design (1996), “Ferry Road Liquefaction Sketch Report”, prepared for City Streets Unit, Christchurch City Council.
§ Geotech Consulting (2000), “Letter re: 8 Edison Place – Liquefaction Hazard”, prepared for Chas Luney Ltd, 18 June.
§ Soils & Foundations (1992), “Christchurch Treatment Works, Liquefaction Assessment Report”, prepared for Christchurch City Council, Job Number 1885.
§ Soils & Foundations (1996), “Stormwater Pumping Stations, Liquefaction Hazard”, prepared for Christchurch City Council, Status Final, Job Number 92871.
§ Soils & Foundations (1998), “Lower River Avon Liquefaction Hazard”, prepared for Christchurch City Council, Status Final, Job Number 95255.
§ Soils & Foundations (1999), “Heathcote River Special Planning Zone, Liquefaction Potential”, prepared for Christchurch City Council, Status Final, Job Number 95404.
§ Soils & Foundations (1999), “Facsimile from Steven Woods (S&F) to Rodney Halliday (CCC) re Heathcote Special Planning Zone”, 21 April, Reference 95404.
§ Soils & Foundations (1999), “Lower Avon River Lateral Spread Damage Costs and Mitigation”, prepared for Christchurch City Council, Status Draft, Job Number 801/000015.
§ Soils & Foundations (2000), “City Outfall Drain – Linwood, Liquefaction Hazard”, prepared for Christchurch City Council, Status Final, Job Number 15/44.
§ Appendix A
Liquefaction Maps
§ Appendix B
Liquefaction Prediction Formulae
Christchurch Liquefaction Study - Stage II – Appendix B
3811859/010 Beca Carter Hollings & Ferner Ltd R1:29166-SAC25R02.DOC Rev 1 13 May 2002
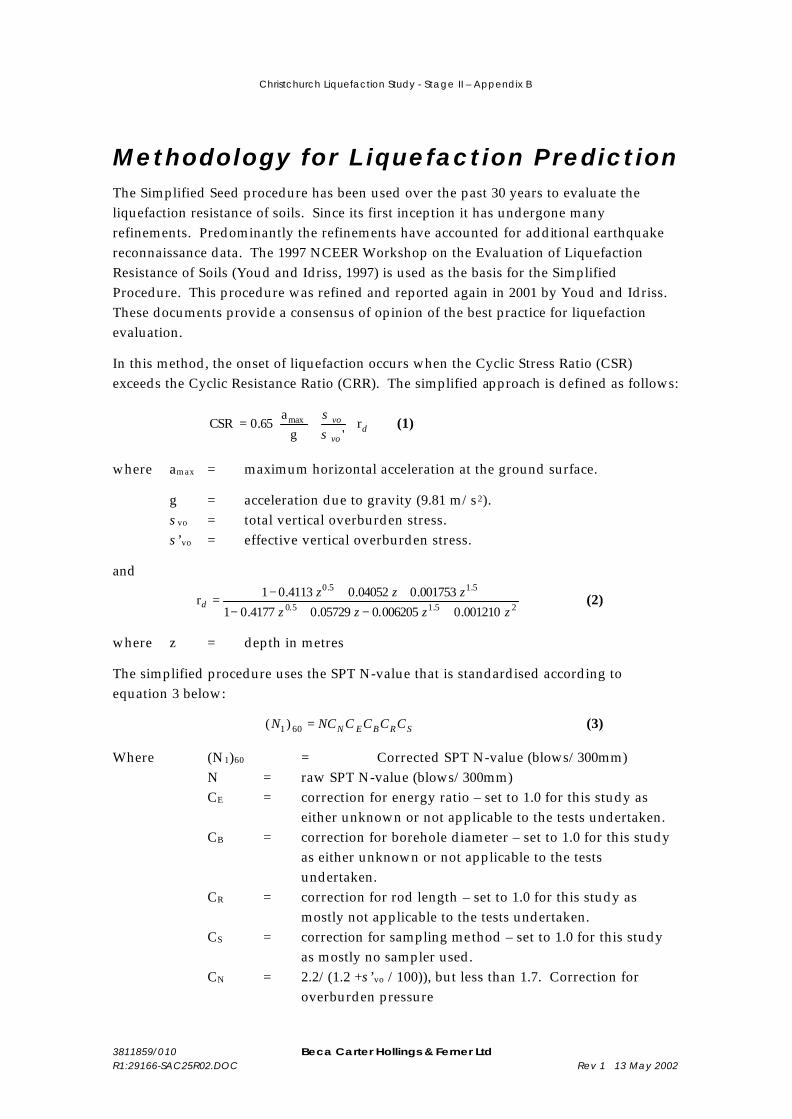
Methodology for Liquefaction Prediction The Simplified Seed procedure has been used over the past 30 years to evaluate the liquefaction resistance of soils. Since its first inception it has undergone many refinements. Predominantly the refinements have accounted for additional earthquake reconnaissance data. The 1997 NCEER Workshop on the Evaluation of Liquefaction Resistance of Soils (Youd and Idriss, 1997) is used as the basis for the Simplified Procedure. This procedure was refined and reported again in 2001 by Youd and Idriss. These documents provide a consensus of opinion of the best practice for liquefaction evaluation.
In this method, the onset of liquefaction occurs when the Cyclic Stress Ratio (CSR) exceeds the Cyclic Resistance Ratio (CRR). The simplified approach is defined as follows:
dvo
vo r 'g
a65.0CSR max
=
σσ
(1)
where amax = maximum horizontal acceleration at the ground surface.
g = acceleration due to gravity (9.81 m/s2). σvo = total vertical overburden stress. σ’vo = effective vertical overburden stress.
and
25.15.0
5.15.0
001210.0006205.005729.04177.01001753.004052.04113.01r
zzzzzzz
d+−+−
++−= (2)
where z = depth in metres
The simplified procedure uses the SPT N-value that is standardised according to equation 3 below:
SRBEN CCCCNCN =601 )( (3)
Where (N1)60 = Corrected SPT N-value (blows/300mm) N = raw SPT N-value (blows/300mm) CE = correction for energy ratio – set to 1.0 for this study as
either unknown or not applicable to the tests undertaken. CB = correction for borehole diameter – set to 1.0 for this study
as either unknown or not applicable to the tests undertaken.
CR = correction for rod length – set to 1.0 for this study as mostly not applicable to the tests undertaken.
CS = correction for sampling method – set to 1.0 for this study as mostly no sampler used.
CN = 2.2/(1.2 +σ’vo /100)), but less than 1.7. Correction for overburden pressure
Christchurch Liquefaction Study - Stage II – Appendix B
3811859/010 Beca Carter Hollings & Ferner Ltd R1:29166-SAC25R02.DOC Rev 1 13 May 2002
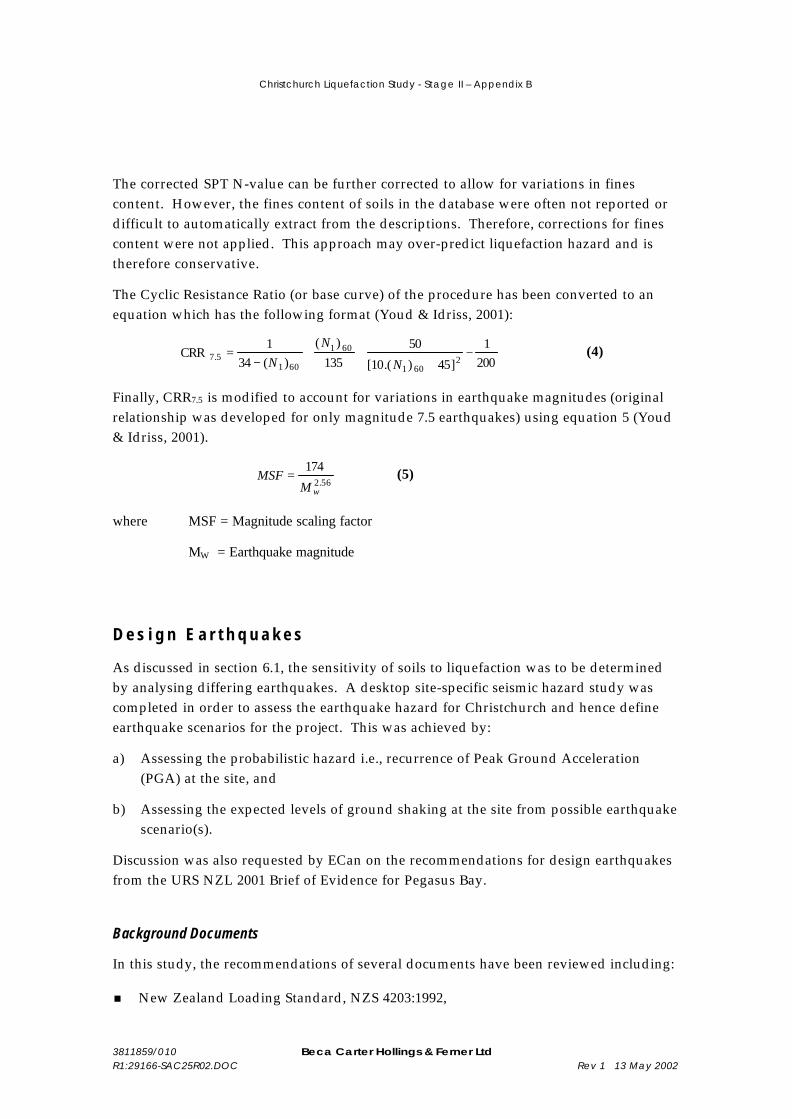
The corrected SPT N-value can be further corrected to allow for variations in fines content. However, the fines content of soils in the database were often not reported or difficult to automatically extract from the descriptions. Therefore, corrections for fines content were not applied. This approach may over-predict liquefaction hazard and is therefore conservative.
The Cyclic Resistance Ratio (or base curve) of the procedure has been converted to an equation which has the following format (Youd & Idriss, 2001):
200
1
]45).(10[
50135
)()(34
1CRR
2601
601
6015.7 −
+++
−=
N
NN
(4)
Finally, CRR7.5 is modified to account for variations in earthquake magnitudes (original relationship was developed for only magnitude 7.5 earthquakes) using equation 5 (Youd & Idriss, 2001).
56.2
174
wMMSF = (5)
where MSF = Magnitude scaling factor
MW = Earthquake magnitude
D e s i g n E a r t h q u a k e s
As discussed in section 6.1, the sensitivity of soils to liquefaction was to be determined by analysing differing earthquakes. A desktop site-specific seismic hazard study was completed in order to assess the earthquake hazard for Christchurch and hence define earthquake scenarios for the project. This was achieved by:
a) Assessing the probabilistic hazard i.e., recurrence of Peak Ground Acceleration (PGA) at the site, and
b) Assessing the expected levels of ground shaking at the site from possible earthquake scenario(s).
Discussion was also requested by ECan on the recommendations for design earthquakes from the URS NZL 2001 Brief of Evidence for Pegasus Bay.
Background Documents
In this study, the recommendations of several documents have been reviewed including:
§ New Zealand Loading Standard, NZS 4203:1992,
Christchurch Liquefaction Study - Stage II – Appendix B
3811859/010 Beca Carter Hollings & Ferner Ltd R1:29166-SAC25R02.DOC Rev 1 13 May 2002
§ The Draft Australian/New Zealand Loading Standard (2002),
§ Reports by Stirling, et. al. of the Institute of Geological and Nuclear Sciences Ltd (GNS) prepared for Canterbury Regional Council in June 1999 (Stirling et. al., 1999), and
§ Earthquake Commission Research Foundation in May 2000 (Stirling et. al., 2000). GNS was also involved in preparation of the two Standards referenced above.
Desk-Top Study Results
To simplify analysis, it was agreed by ECan that all sites within Christchurch would be assigned the same earthquake parameters and hence individual site amplification effects would be neglected.
(a) Probabilistic Hazard – Recurrence of Peak Ground Acceleration (PGA)
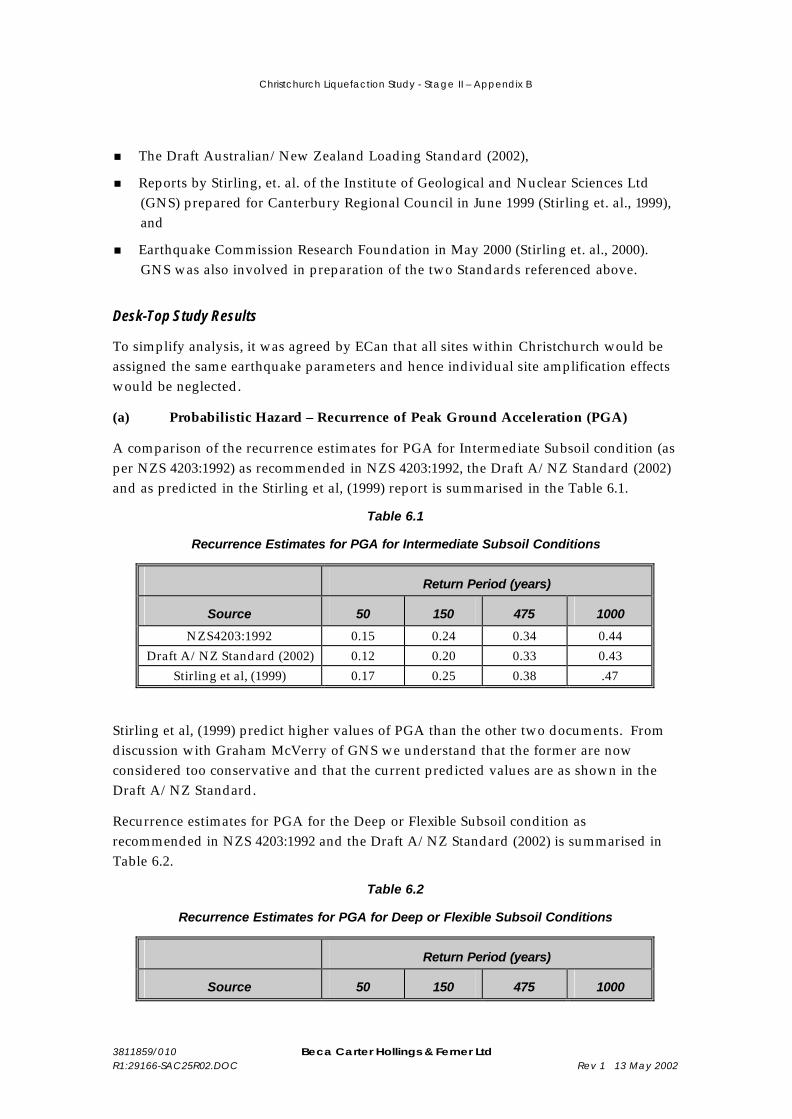
A comparison of the recurrence estimates for PGA for Intermediate Subsoil condition (as per NZS 4203:1992) as recommended in NZS 4203:1992, the Draft A/NZ Standard (2002) and as predicted in the Stirling et al, (1999) report is summarised in the Table 6.1.
Table 6.1
Recurrence Estimates for PGA for Intermediate Subsoil Conditions
Return Period (years)
Source 50 150 475 1000
NZS4203:1992 0.15 0.24 0.34 0.44 Draft A/NZ Standard (2002) 0.12 0.20 0.33 0.43
Stirling et al, (1999) 0.17 0.25 0.38 .47
Stirling et al, (1999) predict higher values of PGA than the other two documents. From discussion with Graham McVerry of GNS we understand that the former are now considered too conservative and that the current predicted values are as shown in the Draft A/NZ Standard.
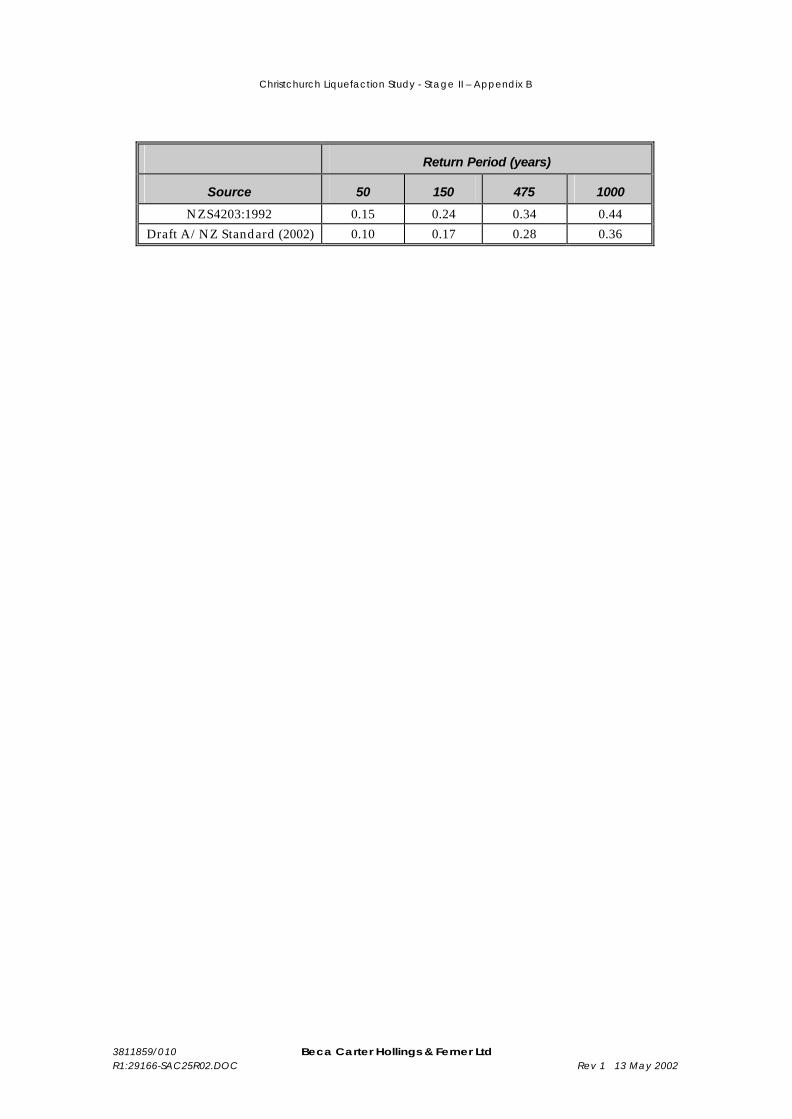
Recurrence estimates for PGA for the Deep or Flexible Subsoil condition as recommended in NZS 4203:1992 and the Draft A/NZ Standard (2002) is summarised in Table 6.2.
Table 6.2
Recurrence Estimates for PGA for Deep or Flexible Subsoil Conditions
Return Period (years)
Source 50 150 475 1000
Christchurch Liquefaction Study - Stage II – Appendix B
3811859/010 Beca Carter Hollings & Ferner Ltd R1:29166-SAC25R02.DOC Rev 1 13 May 2002
Return Period (years)
Source 50 150 475 1000
NZS4203:1992 0.15 0.24 0.34 0.44 Draft A/NZ Standard (2002) 0.10 0.17 0.28 0.36

Christchurch Liquefaction Study - Stage II – Appendix B
3811859/010 Beca Carter Hollings & Ferner Ltd R1:29166-SAC25R02.DOC Rev 1 13 May 2002
(b) Deterministic Hazard – Earthquake Scenario(s)
Stirling et. al. (1999) discuss in their report the relative contribution to the probabilistic hazard in the area from earthquakes of various magnitudes and epicentral distances. From the deaggregation plots shown in the report it was concluded that:
§ For short structural periods (T1 < 0.5 second) and short return periods (50 and 150 years) the hazard is mostly influenced by the distributed earthquake sources of magnitude less than 7 and at epicentral distances of up to 50 km.
§ For longer structural periods (T1 > 0.5 second) and longer return periods (475 and 1000 years) the hazard is strongly influenced by the large to great (Magnitude greater than 7) earthquakes from the fault sources. In the case of Christchurch these are in the foothills of the Alps.
Although Stirling et. al. (1999) show deaggregation plots only for structural periods of 0.2 and 2 seconds we would expect that the relative contribution of earthquakes making up the hazard at PGA would be similar to that for 0.2 second for the same return period. This was confirmed in the deaggregation plots for PGA for 475 and 1000 years return periods in Stirling et al (2000).
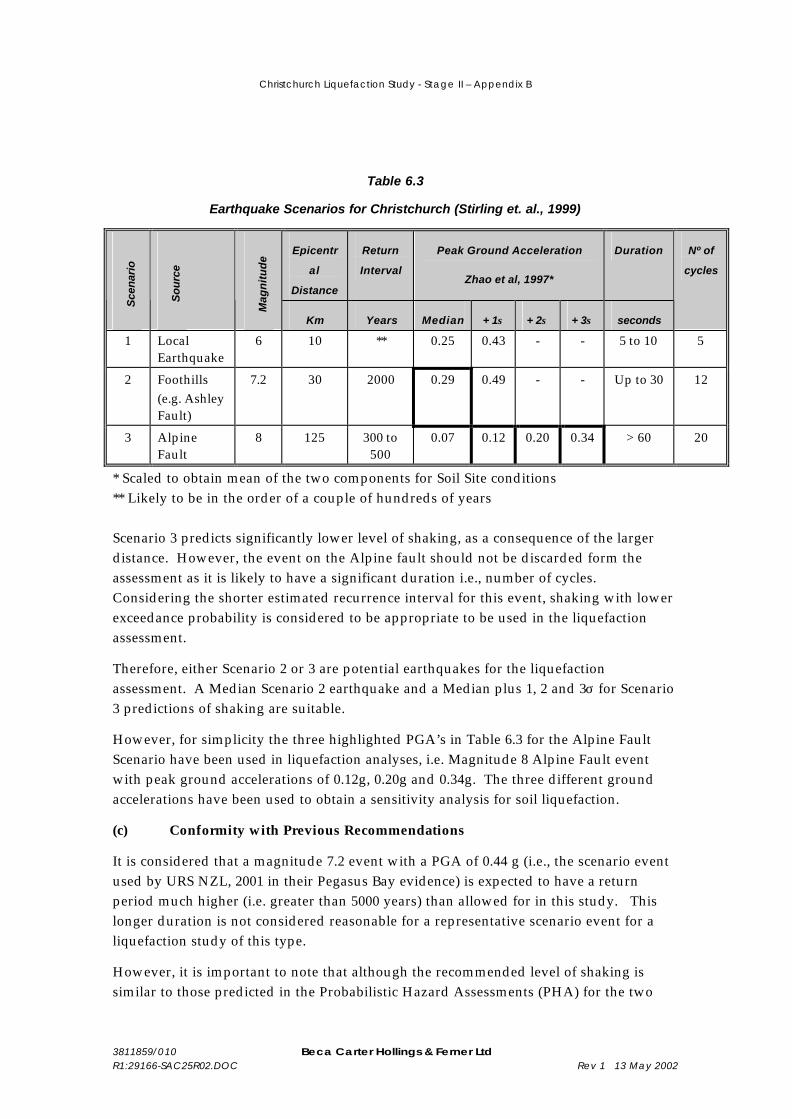
Based on the results of the deaggregation of the probabilistic hazard values Stirling et. al. (1999) developed three possible earthquake scenarios for Christchurch. These, along with the following, are summarised in Table 6.3 below.
§ Prediction of the number of shaking cycles (Seed and Idriss, 1982) for each of the events.
§ The predicted levels of ground shaking (Zhao, et al, 1997) for each of the scenarios.
§ Median (50% exceedance probability),
§ Median + 1 σ (16% exceedance probability),
§ Median + 2 σ (2% exceedance probability), and
§ Median + 3 σ (0.1% exceedance probability).
It can be seen, from Table 6.3, that Scenarios 1 and 2 predict similar level of ground shaking at the site but with the significantly different return period for each event. Scenario 1 is, however, not likely to be critical for the assessment of susceptibility to liquefaction due to the short duration of shaking i.e., small number of cycles characteristic for this size of event.
Christchurch Liquefaction Study - Stage II – Appendix B
3811859/010 Beca Carter Hollings & Ferner Ltd R1:29166-SAC25R02.DOC Rev 1 13 May 2002
Table 6.3
Earthquake Scenarios for Christchurch (Stirling et. al., 1999)
Epicentr
al
Distance
Return
Interval
Peak Ground Acceleration
Zhao et al, 1997*
Duration
Sce
nari
o
So
urc
e
Mag
nit
ud
e
Km Years Median + 1σ + 2σ + 3σ seconds
Nº of
cycles
1 Local Earthquake
6 10 ** 0.25 0.43 - - 5 to 10 5
2 Foothills (e.g. Ashley Fault)
7.2 30 2000 0.29 0.49 - - Up to 30 12
3 Alpine Fault
8 125 300 to 500
0.07 0.12 0.20 0.34 > 60 20
* Scaled to obtain mean of the two components for Soil Site conditions ** Likely to be in the order of a couple of hundreds of years
Scenario 3 predicts significantly lower level of shaking, as a consequence of the larger distance. However, the event on the Alpine fault should not be discarded form the assessment as it is likely to have a significant duration i.e., number of cycles. Considering the shorter estimated recurrence interval for this event, shaking with lower exceedance probability is considered to be appropriate to be used in the liquefaction assessment.
Therefore, either Scenario 2 or 3 are potential earthquakes for the liquefaction assessment. A Median Scenario 2 earthquake and a Median plus 1, 2 and 3σ for Scenario 3 predictions of shaking are suitable.
However, for simplicity the three highlighted PGA’s in Table 6.3 for the Alpine Fault Scenario have been used in liquefaction analyses, i.e. Magnitude 8 Alpine Fault event with peak ground accelerations of 0.12g, 0.20g and 0.34g. The three different ground accelerations have been used to obtain a sensitivity analysis for soil liquefaction.
(c) Conformity with Previous Recommendations
It is considered that a magnitude 7.2 event with a PGA of 0.44 g (i.e., the scenario event used by URS NZL, 2001 in their Pegasus Bay evidence) is expected to have a return period much higher (i.e. greater than 5000 years) than allowed for in this study. This longer duration is not considered reasonable for a representative scenario event for a liquefaction study of this type.
However, it is important to note that although the recommended level of shaking is similar to those predicted in the Probabilistic Hazard Assessments (PHA) for the two
Christchurch Liquefaction Study - Stage II – Appendix B
3811859/010 Beca Carter Hollings & Ferner Ltd R1:29166-SAC25R02.DOC Rev 1 13 May 2002
soil conditions for the 475 year return period (Tables 1 and 2) it does not have the same probability of occurrence (i.e. return period) as those of the PHA (i.e., 475 years) or the Scenario event itself. This is the main reason why Beca disagree with the methodology presented in URS NZL, 2001, in particular their Table 6.
In order to provide an approximate return period for the recommended earthquake scenario for the liquefaction study, we have assessed the probability of occurrence of a PGA, greater than or equal to 0.26g from all events greater than or equal to M 7.2 in the area (which effectively includes the events on the foothills and the one on the Alpine Fault). For this we have used the deaggregation plot for PGA in Christchurch for 475 years return period from Stirling et al, (2000). The assessed return period is approximately 1500 years. (Note that if events of all magnitudes were included in the assessment the return period would be, of course, 475 years.)
E s t i m a t i o n o f L a t e r a l S p r e a d i n g
Using the estimation method outlined by Bartlett & Youd (this paper also outlines the 1986 Hamada Method that was also used for prediction), areas where lateral spreading is possible are shown on the Liquefaction Ground Damage Map shown in Appendix A.
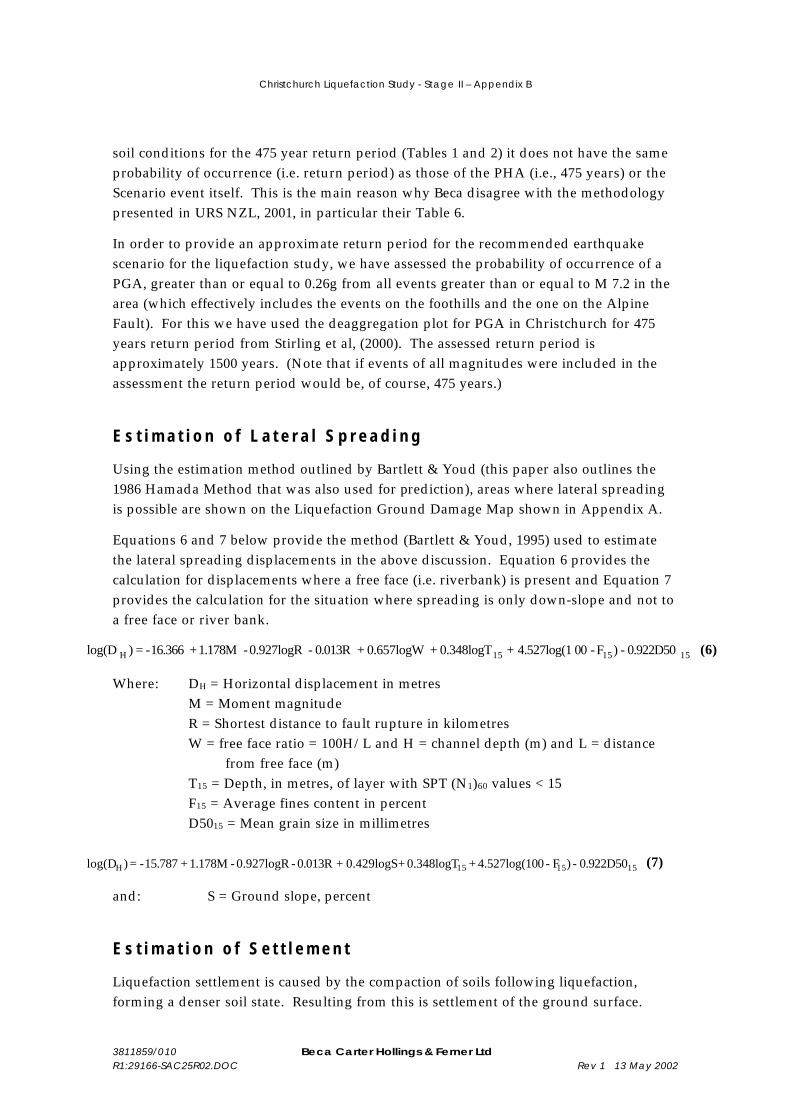
Equations 6 and 7 below provide the method (Bartlett & Youd, 1995) used to estimate the lateral spreading displacements in the above discussion. Equation 6 provides the calculation for displacements where a free face (i.e. riverbank) is present and Equation 7 provides the calculation for the situation where spreading is only down-slope and not to a free face or river bank.
151515H 0.922D50 - )F-004.527log(1 + 0.348logT +0.657logW + 0.013R - 0.927logR - 1.178M + 16.366- = )log(D (6)
Where: DH = Horizontal displacement in metres M = Moment magnitude R = Shortest distance to fault rupture in kilometres W = free face ratio = 100H/L and H = channel depth (m) and L = distance
from free face (m) T15 = Depth, in metres, of layer with SPT (N1)60 values < 15 F15 = Average fines content in percent D5015 = Mean grain size in millimetres
151515H 0.922D50 - )F-004.527log(1 + 0.348logT + 0.429logS + 0.013R - 0.927logR - 1.178M + 15.787- = )log(D (7)
and: S = Ground slope, percent
E s t i m a t i o n o f S e t t l e m e n t
Liquefaction settlement is caused by the compaction of soils following liquefaction, forming a denser soil state. Resulting from this is settlement of the ground surface.
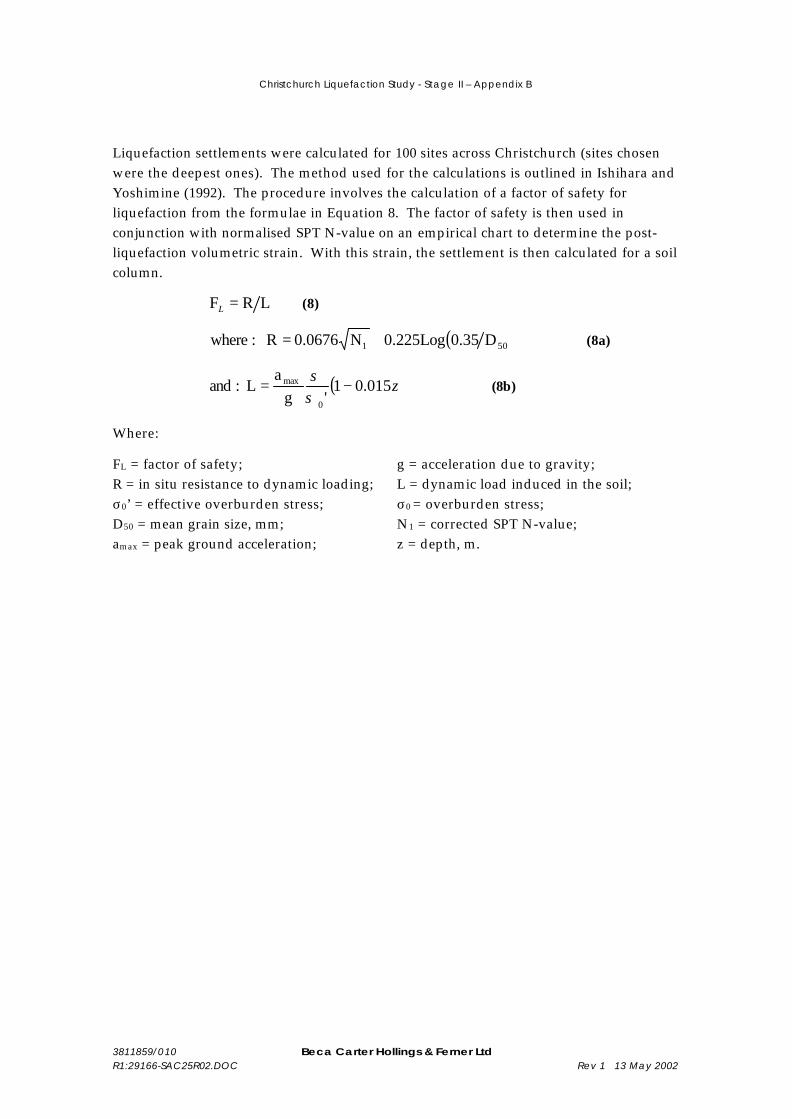
Christchurch Liquefaction Study - Stage II – Appendix B
3811859/010 Beca Carter Hollings & Ferner Ltd R1:29166-SAC25R02.DOC Rev 1 13 May 2002
Liquefaction settlements were calculated for 100 sites across Christchurch (sites chosen were the deepest ones). The method used for the calculations is outlined in Ishihara and Yoshimine (1992). The procedure involves the calculation of a factor of safety for liquefaction from the formulae in Equation 8. The factor of safety is then used in conjunction with normalised SPT N-value on an empirical chart to determine the post-liquefaction volumetric strain. With this strain, the settlement is then calculated for a soil column.
LRF =L (8)
( )501 D35.0Log225.0N0676.0R :where += (8a)
( )z015.01'g
aL :and
0
max −=σσ
(8b)
Where:
FL = factor of safety; g = acceleration due to gravity; R = in situ resistance to dynamic loading; L = dynamic load induced in the soil; σ0’ = effective overburden stress; σ0 = overburden stress;
D50 = mean grain size, mm; N1 = corrected SPT N-value; amax = peak ground acceleration; z = depth, m.