the effects of different cutting heights, mulching and
TRANSCRIPT

Faculty of Science and Engineering
Muresk Institute
The Effects of Different Cutting Heights, Mulching and
Burning on the Control of Bellyache bush
(Jatropha gossypifolia L.) Applicable in East
Timor
Acacio da Costa Guterres
This thesis is presented for the Degree of Master of Science (Agriculture)
of Curtin University of Technology
May 2008

i
Declaration
To the best of my knowledge and belief this thesis contains no material previously published by
any other person except where due acknowledgement has been made. This thesis contains no
material which has been accepted for the award of any other degree or diploma in any
university.
Signature : -----------------------------------------------------------------------------------
Date :

ii
Acknowledgements
First of all I would like to express my gratitude to my supervisors, Associate Professor John
Janes, Muresk Institute, Curtin University of Technology; Dr Penny Wurm, Charles Darwin
University, Dr Pippa Michael, Muresk Institute, Curtin University of Technology, Dr Dick
Williams, Senior researcher of fire management at CSIRO, Northern Territory, and Tania Paul,
Charles Darwin University, for their excellent supervision, constant guidance, moral support
and encouragement whilst undertaken this research. From them I have learnt so many things
especially the techniques and methods to control bellyache bush.
Special thanks also go to Dr Dick Williams and Mr Robert Eager, CSIRO Darwin, for their
excellent guidance on the research undertaken to investigate the effect of fire on bellyache bush
infestations. From them I also learnt many things such as how to use thermocouple devices to
estimate fire intensity.
My sincere thanks also go to Professor Peter Batt, Head of Muresk Institute, Curtin University
of Technology, for not only organising my administration documents, but also for his moral
support and valuable advice whilst undertaking my research. Many thanks go to the Muresk
Institute Research Unit for their outstanding technical support and for helping me in many ways.
I would like to express my sincere thanks to Prof. Lionel Martin and Dr. Gaye Krebs, Unit
Coordinator for project design, Muresk Institute, Curtin University of Technology, for their
assistance with the first draft proposal of this study.
My sincere thanks also go to Professor Chris Austin, Head of School of Science and Primary
Industries, Charles Darwin University, Neil Ludvigsen, Laboratory Chief Technical Officer,
Charles Darwin University, for their kindness and enthusiasm in helping to organise logistics
and other equipment to support my operational activities whilst I conducted my research in
Darwin. Many Thanks go to Dr. Keith McGuinnes for helping to analysed data. Many thanks
also go to Mr. Andrew Spiers and his students for helping to establish the burning plots at
Acacia. Many thanks go to laboratory technicians especially for Ms. Claire Costello and Ms.
Janine Ings, Ken Scott for their outstanding technical support and for helping me in many ways.
I would like to express my sincere thanks to Tahnee, Bianca, Mr Pedro, Mr Fernando, Anthony
and Cesar for volunteering while I was conducting my research.
My sincere thanks also go to Professor John Janes and Mrs. Tania Paul for their
recommendation to the Australian Centre for International Agriculture Research (ACIAR) to
award me a John Allwright Fellowship Scholarship. I am also grateful to the National
University of East Timor for granting me study leave to undertake this study.
I would also like to thank Jim Bourke for his permission to use his land at Acacia. I also thank
N.T. PAWA for their permission to use the site at Channel Island, and Charles Darwin

iii
University for use of the Katherine site. Thanks also to Wendy Coghlan and Danie Luttig (both
of Charles Darwin University, Katherine Campus) and Christine Corney (N.T Bushfires
Service) for providing fire management expertise during the burns.
Finally, I would like to express my deep gratitude to my loving wife Julia, for her love, care,
encouragement and field support. Last, but not least, many thanks go to my daughters, Novelia
and Liliana, inspiration of my life, for tolerating many inconveniences during my study and for
giving me the determination to complete this study.

iv
Abstract
Since bellyache bush invaded to East Timor it has significantly reduced crop and animal
production and consequential loss of income from farm enterprises. Methods of control of
bellyache bush chosen should be appropriate to the poor economic position of the farmers. An
integrated method of controlling bellyache bush involving slashing combined with mulching
and or burning is low cost and is widely used by the Timorese farmers. Although these practices
are commonly used to control weeds, there are still many problems that appear in the field
during and after weed control. For instance, rapid regeneration of cut stems and production of
less fuel than mixed stands to support burning management.
Therefore, the objective of this study is to investigate mechanical control such as cutting stems
at different heights and cutting stems at different heights in combination with mulch, hand-
pulling and mulching of small plants and mulching of seedlings. This study also investigates
bellyache bush properties as a fuel for burning management in the late dry season to control its
infestations.
Mechanical control of bellyache bush plants was undertaken south of Darwin at Acacia
(12045’S, 131009’E) which has an annual average rainfall of 1588.1 mm and Channel Island
(12º33’S, 130º51’E) which has annual rainfall of 1713.9 mm. This study was conducted from
January 2007 to February 2008. All bellyache bush plants were cut off at different heights
according to treatment 0cm (ground level), 10cm, 20cm, 30cm, 40cm and uncut plants
considered as a control.
The results indicated that all cutting treatments achieved 100% mortality under low canopy
cover, irrespective of season. While, under high canopy cover bellyache bush plants only
achieved 100% mortality if cut at 0cm and 10cm height. Stems cut at 20cm, 30cm and 40cm
heights re-sprouted in the dry season. Hand-pulling completely killed small plants while
mulching did not. Mulching achieved a partial kill of seedlings however it stimulated seedling
emergence in the wet season, irrespective of site.
The use of bellyache bush as a fuel for burning management was studied. The study was
undertaken at Channel Island, Acacia and Katherine (14º22’S, 132º09’E). The latter has a mean
annual rainfall of 875 mm. All bellyache bush plants in the plot were cut in May. Five 1m x 1m
quadrat samples were selected within a 10m x 10m plot to measure wet weight and dry weight
for the curing rate calculation. In addition, 15 of the cut stems were randomly selected to
measure re-sprouting. From five randomly selected 25cm x 25 cm quadrat samples were taken
to calculate the weight of fine fuel (less than 6mm in diameter), medium (6mm-25mm) and
coarse (greater than 25mm). Heat yield of fuel combustion of this material was calculated by
using a bomb calorimeter (As 10-38.5 leco 350 calorimeters).

v
The results indicated that cut stems of bellyache bush from a low canopy cover site had 7
percent moisture content while stems from a high canopy cover site had a 66 percent moisture
content by the end of the dry season. The proportion of these stems in the site with low canopy
cover re-sprouted significantly less than those in the high canopy cover site. The fuel load at
bellyache bush monoculture had less fine, medium and coarse fuel compared with tropical
savanna fuel. However, results from this study indicated that it had a similar heat yield of
combustion to other plants in the tropical savanna.
A study of the use of fire as a control tool for bellyache bush was undertaken at Acacia and
Katherine from May 2007 to February 2008. This study was carried out on established plants of
bellyache bush. The experiment was undertaken in three 10m X 10m plots at each of the two
sites. The experiment consisted of three treatments namely: cutting stems at 30 cm and followed
by burning, uncut plants plus burning and unburnt plants considered as a control. Each of 20
pieces of bellyache bush stems were randomly selected for fine 0-6 mm, medium 6-25 mm and
coarse 25 mm fuel. All these pieces were weighed before and after fire to calculate fuel
consumption. Fire intensity was calculated by using Byram’s fire intensity equation. Fifteen soil
temperature sensors were buried under uncut plants before burning. After burning all soil
temperature sensors were dug out the temperature read and used to calculate fire temperature.
Plant mortality was calculated by counting live bellyache bush plants before and after fire. Seed
germination and seed recruitment was calculated by counting all seedlings within five 1m x 1m
randomly chosen quadrats.
The results show that fire consumed all bellyache bush stems in the late dry season burning. Fire
intensity of bellyache bush fuels was quite low compared to other tropical savanna fuel. Soil
temperatures ranged between 54.170C to 126.130C. All bellyache bush plants were completely
killed by the fire treatment, but fire stimulated seedling emergence in the following wet season.
It was concluded from the results of the experiments that mechanical control slashing system
may provide a suitable fuel for the burning management if cut early in the dry season. By late in
the dry season bellyache bush plants cut early in the dry season have a low moisture content are
completely cured and able to support fire spread of adequate intensity to destroy the plants.

vi
Table of Contents
Declaration ....................................................................................................................... i
Acknowledgements ......................................................................................................... ii
Abstract .......................................................................................................................... iv
Table of Contents ........................................................................................................... vi
List of Tables .................................................................................................................. ix
List of Figures.................................................................................................................. x
List of Plates…………………………………………………………………..……….xii
List of Symbols and Abbreviations ............................................................................ xiii
Chapter 1 – General Introduction................................................................................. 1
Chapter 2 – Review of Literature.................................................................................. 4 2.1 The description of bellyache bush .....................................................................................4
2.1.1 The history of the spread of bellyache bush to East Timor ..........................5 2.1.2 Biology and ecology of spread .....................................................................7 2.1.3 Habit ..............................................................................................................7 2.1.4 Dispersal ........................................................................................................7 2.1.5 Phenology......................................................................................................8 2.1.6 Reproduction .................................................................................................8
2.1.6.1 Seed production and dispersal ..........................................................9 2.1.6.2 Seed germination ..............................................................................9 2.1.6.3 Seed longevity .................................................................................10 2.1.6.4 Seedling establishment and mortality ............................................10
2.2 The impact of bellyache bush in East Timor ...................................................................11 2.2.1 Economy and social impact.........................................................................11 2.2.2 The environmental impact ...........................................................................11
2.3 Integrated management of bellyache bush ......................................................................12 2.3.1 Preventative strategies .................................................................................12 2.3.2 Physical strategies .......................................................................................12 2.3.3 Cultural strategies .......................................................................................13 2.3.4 Biological control ........................................................................................14 2.3.5 Chemical control .........................................................................................14
2.4 Conclusion and research objectives.................................................................................15

vii
Chapter 3 - Experiment I. Mechanical Control ......................................................... 12 3.1 Introduction .....................................................................................................................17 3.2 Materials and methods.....................................................................................................18
3.2.1 Site description ............................................................................................18 3.2.2 Measurement of canopy density...................................................................20 3.2.3 Mechanical treatments and experimental design .........................................20 3.2.3.1 Cutting of established plants ....................................................................20 3.2.3.2 Cutting and mulching of established plants .............................................21 3.2.3.3 Hand pulling and mulching of small plants ..............................................21 3.2.3.4 Mulching of seedlings ..............................................................................21 3.2.4 Statistical analysis .......................................................................................22
3.3 Results .............................................................................................................................23 3.3.1 Canopy cover……………………………………………………………...23 3.3.2 Cutting treatment of established plants ........................................................23 3.3.3 Cutting in combination with mulching of established plants... ....................28 3.3.4 Hand-pulling and mulching of small plants .................................................32 3.3.5 Mulching treatment of seedlings…………………………………………..34
3.4 Discussion........................................................................................................................37 3.5 Conclusions .....................................................................................................................39
Chapter 4 - Experiment II. Bellyache Bush Properties as a Fuel............................. 40 4.1 Introduction .....................................................................................................................40 4.2 Materials and methods.....................................................................................................42
4.2.1 Site description ............................................................................................42 4.2.2 Measurement of canopy cover ....................................................................43 4.2.3 Curing rate of bellyache bush......................................................................43 4.2.4 Measurement re-sprouts of cut stems ..........................................................43 4.2.5 Characterising fuel size (texture).................................................................44 4.2.6 Heat yield of fuel .........................................................................................44
4.2.7 Statistical analysis .......................................................................................44 4.3 Results .............................................................................................................................45
4.3.1 Canopy cover ..............................................................................................45 4.3.2 Curing rate of bellyache bush stems..……………………………………..45 4.3.3 Measurement of re-sprouting of cut stems ..................................................45 4.3.4 Characterising fuel texture ..........................................................................46 4.3.5 Heat yield of fuel .........................................................................................47
4.4 Discussion .......................................................................................................................48 4.5 Conclusions .....................................................................................................................50
Chapter 5 - Experiment III. Fire as a Control Tool for Bellyache Bush ................. 51 5.1 Introduction .............................................................................................................…...51 5.2 Materials and methods.....................................................................................................52 5.2.1 Site description ……………………………………………………………52
5.2.2 Fuel load and consumption..........................................................................53

viii
5.2.3 Fire characteristics ………………………………………………………...53 5.2.4 Measurement of soil temperature …………………………………………54 5.2.5 Impact of burning on plant survival ……………………………………....55 5.2.6 Post-fire seed germination and seedling establishment …………………...55 5.2.7 Statistical analysis …………………………………………………………55
5.3 Results .............................................................................................................................56 5.3.1 Fuel load and consumption ..........................................................................56 5.3.2 Fire characteristics………...……………………………………………….56 5.3.3 Soil temperature …………………………………………………………...57 5.3.4 Plant mortality……………………………………………………………..61 5.3.5 Seed germination and seedling establishment……………………………..61 5.4 Discussion........................................................................................................................65 5.5 Conclusions .....................................................................................................................68
Chapter 6. General Discussion and Recommendations ........................................... 69
References ..................................................................................................................... 73
Appendices..................................................................................................................... 85

ix
List of Tables Table 3.1. Model designs for analysis of variance of the four mechanical treatment
experiments.
…22
Table 3.2. Canopy cover (mean + S.E.) at the study sites in 2007. …23
Table 3.11. Mean proportion of small plants alive on control plots compared to plots
where a hand pulling and mulch treatments were applied
…32
Table 4.1. Canopy cover and re-sprouting (mean + S.E.) of cut stems. The influence
of canopy cover on proportion of stems re-sprouting of cut stems while lying on soil
surface during the dry season. Stems were cut in May and monitored at October
(2007). Values with same letter are not significantly different (p< 0.5).
…46
Table 4.2. Combustion heat yield of bellyache bush stems analysed in 2007. …47
Table 5.1. Fire intensity (kW/m), heat of combustion (kJ/kg), fuel consumption
(kg/m2) and rate of spread (m/sec) at each plot at Acacia and Katherine.
…57
Table 5.2. Summary soil temperature – time profiles at Acacia and Katherine. …60
Table 5.3. Summary of fuel load, soil temperature, rate of spread and fire intensity at
Acacia and Katherine.
…60
Table 5.4. Bellyache bush plant survival after late dry season fire. Fire was
implemented in October. Plant survival was monitored in November (2007).
…61

x
List of Figures Figure 3.1: The location of experimental site for bellyache bush study. …19
Figure 3.2: Recorded monthly rainfall (mm/month) at Acacia and Channel Island
(2007). During the wet and dry season there were scattered rainfall events at both
sites.
…20
Figure 3.3. Proportion alive each month of established plants following cutting
treatments at (A) Acacia and (B) Channel Island.
…24
Figure 3.4. Interaction plot for plant alive at cutting treatments of established plants at
Acacia and Channel Island (February 2008).
…25
Figure 3.5. Total new shoots each month for established plants following cutting
treatment at (A) Acacia and (B) Channel Island.
…26
Figure 3.6. Interaction plot for new shoots per plant at cutting treatments of
established plants at Acacia and Channel Island in February 2008.
…27
Figure 3.7. Proportion alive of established plants following cutting in combination
with mulching treatments at (A) Acacia and (B) Channel Island.
…28
Figure 3.8. Interaction plot for plant alive for cutting in combination with mulch for
established plants at Acacia and Channel Island (February 2008).
…29
Figure 3.9. Total number of re-sprouts per plant for established plants following
cutting in combination with mulch at (A) Acacia and (B) Channel Island.
…30
Figure 3.10. Interaction plot for new shoots per plant at cutting in combination with
mulch of established plants at Acacia and Channel Island in February 2008.
…31
Figure 3.11. Mean proportion alive at cutting treatments in combination with mulch of
small plants at Acacia and Channel Island (February 2008).
…32
Figure 3.12. Proportion of small plants alive following hand-pulling and mulching
treatments at (A) Acacia and (B) Channel Island.
…33
Figure 3.13. Proportion of seedlings alive following mulching treatment at (A) Acacia
and (B) Channel Island.
…34
Figure 3.14. Mean proportion alive for mulching treatment of seedlings at Acacia and …35

xi
Channel Island (February 2008).
Figure 3.15. Total number of new seedlings each month (per m2) in mulch and control
treatments at (A) Acacia and (B) Channel Island.
…36
Figure 4.1. Monthly rainfall data at Katherine (2007). …43
Figure 4.2. Curing of bellyache bush fuel. Moisture (% content) from early dry season
to late dry season (2007).
…45
Figure 4.3. Fine fuel (<6 mm), medium (>6 mm-25 mm) and coarse (>25 mm). Mean
(+ S.E) of fuel dry weight at the time of experimental fires at Acacia and Katherine in
October 2007.
…46
Figure 5.1. Fuel consumption (tonnes/ha) at Acacia and Katherine after imposing fire
treatment.
…56
Figure 5.2. Soil temperature – time profiles at Acacia. …58
Figure 5.3. Soil temperature – time profiles at Katherine. …59
Figure 5.4. Bellyache bush seedling emergence (m-2) before and after fire at Acacia
and Katherine.
…62
Figure 6.1. Mechanical and burning model based on reproductive phenology and
vegetative phenology.
…71

xii
List of Plates Plate 1.1. Land invaded by bellyache bush plants in West of Dili, East Timor (2002). …3
Plate 5.1. Thermocouple timers used at Acacia and Katherine to measure rate of
spread during fire.
…54
Plate 5.2. The cut stems of bellyache bush monoculture at Acacia before and after
burning in October 2007.
…63
Plate 5.3. The cut stems of bellyache bush monoculture at Katherine before and after
burning in October 2007.
…64

xiii
List of Symbols and Abbreviations , Minutes
< less than
> greater than
˚ degrees
% percent
˚C degree Celsius
ANOVA analysis of variance
C control
BB bellyache bush plants
EP established plants
cm centimetre (s)
E East
et al. et alia
FAO Food and Agriculture Organisation
Fig. Figure
g gram (s)
h hour(s)
H heat yield of the fuel (kJ/kg)
ha hectare
i.e. that is
I fire intensity (kW/m)
kg kilogram(s)
kJ kilojoules
kW kilowatts
kW/m kilowatts per metre
m metre(s)
m2 square metre(s)
min minute

xiv
mm millimetre
NS not significant
NSW New South Wales
NT Northern Territory
QLD Queensland
r rate of fire spread (m/sec).
s south
SA South Australia
T tonnes
t/ha tonnes per hectare
TL Timor Leste
U.K. United Kingdom
UNTL East Timor National University
U.S.A. United States of America
w fuel consumption (kg/m2)
WA Western Australia

1
Chapter 1 - General Introduction
The intervention of the invasive shrub bellyache bush (Jatropha gossypifolia L.) into the
agricultural land and grassland of East Timor went unheralded sometime before the 1912
(Metzner, 1977; Parsons and Cuthbertson, 1992; Pit and Miller, 1991). It is reported to have
been introduced to East Timor either as a garden ornamental or as a medicinal plant by the
Portuguese government before 1912 (Metzner, 1977). The lack of weed knowledge and
effective quarantine measures at that time meant that the East Timor was exposed to invasion by
a range of exotic and noxious pests and weeds, including bellyache bush. It has significant
adverse implications for the sustainable agricultural production and livelihoods of local
Timorese near-subsistence farming communities.
The plant grows freely in agricultural land and grassland and produces thousands of established
plants, small plants and seedlings every year (Metzner, 1977). The detrimental impact of
bellyache bush in these specific areas soon became evident with some farmers being forced to
abandon their land and shift to new land for their agricultural activities. Bellyache bush is a
highly invasive perennial shrub that thrives in open land areas used for the agricultural
production. It grows rapidly and produces a dense mass of leaf matter that gradually out shades
out other competition.
Bellyache bush is now a dominant plant species over extensive areas of East Timor. In many
villages up to 60% or more of the arable land is now covered by bellyache bush, which is able
to thrive over a wide range of soil types and altitudes (Wilson, 1995). While it is still early in
the process of the bellyache bush infestation in some parts of East Timor, there are clear
indications of potentially substantial adverse impacts on the economy and livelihoods of local
Timorese farming communities.
The presence of bellyache bush also has a major impact on animal production in East Timor. In
1912, the Portuguese government in East Timor began introducing Bali cattle onto the island to
promote commercial livestock production (Metzner, 1977). The animals proved highly
adaptable to the island’s seasonal drought conditions and their capacity to produce consistent
annual calving rates. During the twenty-five years of the Indonesian occupation in East Timor,
the numbers of livestock exported increased to serve markets in Indonesia, particularly in Java
(Kantor Statistik Propinsi, 1996). For the majority of rural Timorese communities, cattle
represent the primary store of a family’s wealth. In addition, cattle are a vital and necessary part
of the intricate social relationships which link households to one another in complex ties of
interdependency. All major ritual events, for example, including marriages, funerals, and
collective rituals of the clan, require cattle for feasting and generating the social capital that
ensures continuing mutual cooperation and obligation (McWilliam, 1995). The rearing and

2
management of cattle and the conduct and fortunes of the household economy of rural East
Timor are therefore closely interrelated. However, the immediate impact of the rapid spread of
bellyache bush has been the significant loss of available feed stocks for free grazing herds of
cattle and buffalo. Bellyache bush is unpalatable and even very toxic (Kingsbury, 1964). Heavy
shading of the plants and the expansion of bellyache bush is in direct proportion to the decline
stock feed across the rangelands of East Timor.
The presence of bellyache bush in farming systems can also reduce crop yields through
competition with crops for moisture, light and nutrients (Miller, 1982). Heavy infestations of
bellyache bush can cause complete crop failures and in some cases the land cannot be used for
crop production (Chandhokar, 1978). Sweet potato, cassava, pumpkin, taro and maize are grown
as monsoon crops and can be severely affected during the monsoon season when the conditions
are also ideal for abundant growth of bellyache bush. Crops are very sensitive to bellyache bush
competition, especially in their early stages of development and often result in failed harvest
(Labradal et. al, 1994).
Despite bellyache bush being a major problem in East Timor there is a lack of research into this
weed, particularly for control methods suitable to East Timorese farmers. Therefore, the
objective of this study was to investigate mechanical and burning methods to control bellyache
bush infestations. Mechanical control such as slash and burn systems have been adopted in East
Timor for a long period. Regular slashing, burning and hand weeding are the most common and
cheapest methods to control bellyache bush infestations in East Timor. However, there are still
many problems encountered by using these methods such as controlling re-sprouting from
mechanical control and post-fire emergence after burning. The plants produce new growth
immediately after the first rains and maintain dense cover during the wet season. The merit of
these traditional methods is that they can reduce the plant’s rate of spread and control mature
plants in the short term. To achieve a satisfactory control of bellyache bush, the combination of
several methods into an integrated management strategy needs to be considered.

3
Plate 1.1. Land invaded by bellyache bush plants in West of Dili, East Timor.
Sources: Colin Wilson, 2002.

4
Chapter 2 - Review of Literature
2.1 Description of Bellyache Bush
In Australia and America, Jatropha gossypifolia L. is most commonly known as bellyache bush
(Everist, 1974; Deghan, 1982; Parsons and Cuthbertson, 2001). Bellyache bush is a major weed
of the family Euphorbiaceae. It is known by many names throughout the world such as cotton-
leaf physic nut, castor been (Queensland) (Kleinschmidt and Johnson, 1987), red physic nut
(Burkill, 1994), cotton leaved Jatropha, purging nut, Spanish physic nut tree, American purging
nut, wild cassava (BoDD, 2004) red pig-nut flower (Africa), Damar merah (Indonesia) and
castor oil plant (Csurhes, 1999). The taxonomy and nomenclature of bellyache bush is shown
below (The PLANTS Database, 1996).
Kingdom : Plantae
Subkingdom : Tracheobionta
Division : Magnoliophyta
Class : Magnoliopsida
Subclass : Rosidae
Order : Euphorbiales
Family : Euphorbiaceae
Genus : Jatropha L.
Species :gossypifolia
Bellyache bush is a sub-tropical perennial shrub typically 2.5 m tall and up to 4 m in areas close
to watercourse (Jeffrey, 1998; Parsons and Cuthbertson, 2001; Bebawi and Campbell, 2002a;
Vitelli and Madigan, 2004). It demonstrates huge leaf, flower and stem diversity in the wet
season. The stems are quite soft and bulky, and roughly hairy and produce a watery sap when
cut (Parsons and Cuthbertson, 2001). Each plant can produce one to two or more stems
(Csurhes, 1999; Parsons and Cuthbertson, 2001). Young stems are usually green but turn bright
crimson red at flowering and grey at maturity.
Its leaves have three to five deep lobes with either purple or glossy green coloration (Pitt and
Miller, 1991) with leaf colour dependent on biotype and leaf maturity (Pitt and Miller, 1991;
Burkill, 1994; Persons and Cuthbertson, 2001; Bebawi et al., 2005b). The leaf cutting edges are
palmately 3 to 5 lobes, usually 45-90 x 50-130 mm in size (Bebawi and Campbell, 2002a).

5
The lamina of bellyache bush is glabrous and the leaf boundary is denticulate with venations
finishing in stipitate glandular hairs. In the green biotypes the leaves venation is white but under
shade situation it is red (Bebawi et al, 2007).
The flowers are red with yellow centres and produced in clusters on branched stalks in the upper
leaf axils. Flowers are monoecious with both female and male flowers are on the same
inflorescence with approximately 2-8 females and 27-54 males per inflorescence (Reddi and
Reddi, 1983). Fruits are round (12 x 10 mm) and comprise of three lobes (locules) per capsule.
Capsules are dehiscent and each contains three seeds that are approximately 8 mm in length
(Wheeler, 1992). It is globose, pedicellate, generally bright green and woody at maturity before
turning pale green when ripe (Berg, 1975; Deghan and Webster, 1979; Burkill, 1994; Parrotta,
2001).
Bellyache bush seeds have caruncle which attracts ants, soft, slippery and glossy. The caruncle
is a pale, spongy outgrowth rich in lipids, protein, and carbohydrates (Bebawi and Campbell,
2004).
2.1.1 The history of the spread of bellyache bush
Bellyache bush originates from tropical America, most likely from an area encompassing the
Caribbean and Mexico to South Brazil and Paraguay (Kingsbury, 1964). From this region it has
spread widely to the other parts of the world (Kingsbury, 1964). It is commonly reported that
bellyache bush was introduced by Europeans people to the other parts of the world as a garden
ornamental and a medicinal plant (Parsons and Cuthbertson, 1992; Csurhes and Edwards, 1998;
Swarbrick, 1997; Das and Das, 1994).
Although there is no published information regarding the first introduction of bellyache bush in
East Timor, it has been listed as a weed in 1990’s and has formed extensive, dense growth in
almost all pasture areas of the Northern Coastal Zone (Wilson, 1995; Waterhouse, 1998). The
plant has subsequently become naturalised in dry climates and has invaded native habitats at
between the 400 and 1200 mm average annual rainfall zone (Wilson, 1995). According to
Wilson (1995) and Waterhouse (1998), bellyache bush has become East Timor’s worst weed
second only to siam weed (Chromolaena odorata).
Since bellyache bush invaded East Timor, it has adversely affected crops, pasture and animal
production. Bellyache bush competes with crops for light, water and nutrients. All parts of
bellyache bush are unpalatable and toxic to livestock (MAFF, 2001). The leaves, seeds and
stems contain purgative oil and pyrrolizidine alkaloids which are very poisonous to most
herbivorous animals (Kingsbury, 1964). Therefore, when animals feed on some parts of the
bellyache bush it can cause gastro-enteritis and even death (Kingsbury, 1964). Bellyache bush

6
seed contains 40% of pinheon oil. The oil contains small amounts of an irritant curcanoleic acid,
which is related to ricinoleic acid and crotonoleic acid, the principle active ingredients of
bellyache bush and castor oil (Joubert et al., 1984). Other toxins contained in bellyache bush are
hydrocyanic acid, an alkaloid, and a glycoside which produce cardiovascular and respiratory
depression in animals feeding on bellyache bush (Anon, 1996; Pit and Miller, 1991).
Toxalbumins are the largest chemical structures contained in bellyache bush. They are complex
protein molecules of high toxicity. They resemble bacterial toxins in structure and physiological
effects. Phytotoxins are highly irritating to animals (Kingsbury, 1964). It seems that the
presence of bellyache bush in East Timor is likely to cause animal losses. In Queensland, in
1998 312 animal deaths in the Dalrymple shire of north Queensland were attributed to the
consumption of bellyache bush (Jeffrey, 1998).
Many grassland savannas in Australia and East Timor which are used to grow pastures have
been invaded by dense stands of bellyache bush. The plant’s shallow root system precludes
growth of other plants under its canopy (McGiffen, 1997). Pure stands of bellyache bush
prevent the growth of pasture species. As a consequence, it reduces the overall productivity of
land used to graze cattle, buffalo, goats and ponies.
The leaves, seeds and stems contain growth inhibitors, which have been found to be allelopathic
to crops. Phenolics, alkaloids and amino acids produced by bellyache bush are the main
allelochemicals which are very toxic for crop growth (Labrada et al, 1994). Besides the
allelopathic effects it competes heavily with crops for moisture, light and nutrients (Anon, 1996;
Bebawi et al., 2002a; Pit and Miller, 1991). Heavy infestations of bellyache bush can cause
complete crop failures and in some cases the land cannot be used for crop production
(Chandhokan, 1978).
Bellyache bush is grown as an ornamental plant and is often found in gardens and public areas
and are easily accessible. The plants are particularly attractive to children and therefore can pose
some risk to human safety, especially if the fruits are eaten. Whilst bellyache bush is not usually
eaten by animals, however during drought when there is an acute shortage of grass animals may
be forced to consume the plants (Swarbrick, 1997)
Although excessive consumption may cause problems, the roots, stems, leaves, seeds and fruits
of the plant have been widely used in traditional folk medicine in many parts of West Africa and
Asia including West Timor and East Timor. The seeds have been used as a purgative,
antihelminthic and abortifacient as well as for treating ascites, gout, paralysis and skin diseases
(Kingsbury, 1964). The seed oil of the plant has been used as an ingredient in the treatment of
rheumatic conditions, itch and parasitic skin diseases as well as in the treatment of fever
(Ogbobe and Akano, 1993; Taylor et at., 1983).

7
2.1.2 Biology and ecology of the spread of bellyache bush
2.1.3 Habitat
Bellyache bush is a tropical weed that grows well in regions with a pronounced dry season
(Dehgan and Webster, 1979). It can persist in coastal and monsoonal areas where the average
annual rainfall is between 400 and 1200 mm per annum. The annual rainfall is a very important
factor to which the biota of the region has had to adapt (Ridpath and Corbett, 1983). However,
bellyache bush is most prevalent in drier areas with an average annual rainfall of 600 to 700
mm. Tothill and Mott (1983) commented that bellyache bush grows extensively in tropical
savanna, an area where the natural vegetation is predominantly open woodland and grassland,
traversed by meandering creeks and rivers. It also grows in the banks of watercourses which are
associated with sandy loam soils (Dehgan, 1982). Bellyache bush disperses into disturbed areas
such as channel or overgrazed land (Bebawi et al., 2007). Its potential range includes the whole
tropical savannas (Thorp and Lynch, 2000, in Bebawi et al., 2007).
2.1.4 Dispersal
Bellyache bush can be dispersed by both biotic and abiotic means, but predominantly it is
disseminated by human and animal movement, particularly in the mud on the hooves of cattle
and buffalos (Smith, 1995; Das and Das, 1994). Dispersal of bellyache bush seeds can also
occur via water. When the water flows to the rivers it facilitates pod dispersal over long
distances (Ashley, 1995; Henning, 1996). In addition, bellyache bush seeds are also susceptible
to dispersal by ants. Ants generally disperse bellyache bush seeds for their structural building
materials and for food (Bebawi and Campbell, 2002a). Bellyache bush seeds are dispersed as
ant food because of attached food bodies called elaiosomes (caruncles) that are rich in lipid
(Ogbobe and Akano, 1993). Ants drag seeds bearing elaiosomes to their nests to feed the larvae
and remaining parts of the seed accumulate in their refuse piles or middens outside the nests
(Beattie, 1985). Seed dispersal may provide the plant with escape from predation (Reddi and
Reddi, 1983), escape from competition (Berg, 1975), and enhanced germination (Culver and
Beattie, 1980; Horvitz, 1981).

8
2.1.5 Phenology
Bellyache bush looses most of its leaves during the dry season. Those that remain are generally
quite small and concentrated at the apices of stems (Bebawi and Campbell, 2005b). The plants
are either in full leaf or almost leaf-less and the transition between the two stages is fairly rapid
(Bebawi and Campbell, 2005b). An average of 17 and 20 leaves per stems have been recorded
during the wet season (November-April) on plants growing within sub-riparian and riparian
habits, respectively (Bebawi et al., 2005b). On an average there is one leaf per stem in the dry
season (June-August). However, along watercourses bellyache bush plants may retain most of
their leaves levels all year (Liogier, 1990; Howard, 1989; Bukill, 1994; Parrotta, 2001).
Bellyache bush flowers during the wet season, but in some areas it can also flower during the
dry season. In addition, it seems that bellyache bush flower production also depends on
moisture availability. Moreover, temperature is also an important influence on timing and
duration of flowering (Bebawi et al., 2005b; Wheeler, 1992).
2.1.6 Reproduction
Under favorable conditions bellyache bush can reach reproductive maturity very quickly. The
time to first flowering averages 74 days in cleared areas, 294 days in rocky sites, and 454 days
in grazed pastures (Bebawi et al., 2005b). Once bellyache bush plants reach reproductive
maturity, they have definite pattern of flowering within inflorescences. More female than male
flowers mature on the first day, with female flowering slowing a declining trend thereafter over
a five day period (Reddi and Reddi, 1983). In contrast, the number of male flowers gradually
increases by the twelfth day, after which their frequency gradually decrease (Reddi and Reddi,
1983; Deghan and Webster, 1979).
The ratio of male to female flowers is an average of 11:1 (Reddi and Reddi, 1983; Wild, 2003).
Males prefer to flower on the short days compared to female which flowers in long day periods
(Deghan, 1983). Female flowers produce nearly 1.6 times more nectar then male flowers (Reddi
and Reddi, 1983). Bellyache bush nectar consists of glucose, sucrose, fructose amino acids and
proteins (Reddi and Reddi, 1983). The nectar is attractive to insects, which is essential for
normal seed set (Reddi and Reddi, 1983; Wild, 2003). Pollination may occur through self
pollinating or can be through insects (Deghan and Webster, 1979).
Many insect species have been observed foraging on the nectar of bellyache bush in Queensland
(Reddi and Reddi, 1983). Most insects are beneficial to bellyache bush due they perform vital
roles such as pollination and dispersal.

9
2.1.6.1 Seed production and dispersal
Seed production of bellyache bush is generally prolific being particularly supported by suitable
factors such as environmental conditions, plant biotype, plant density and the location of seeds
produced. Adult plants normally produce 2000 to 12000 seeds per hectare (Bebawi and
Campbell, 2002d). For dense infestations of bellyache bush growing in a relatively dry location
it is four seeds m-2 during the dry season compared to 343 seed m-2 in the wet season (Vogler
and Keir, 2005). Plants produce fewer seeds at high density with more than 40 plants m2 causing
seed production per plant to decline (Bebawi et al., 2005b).
2.1.6.2 Seed germination
Fresh bellyache bush seeds exhibit high viability, but low germinability. Fresh intact seed
collected in North Queensland was 88% viable but only 10% of these were readily germinable
(Bebawi and Campbell, 2004). A similar study in Puerto Rico found only 4% of fresh seeds is
able to germinate (Ellis et al., 1985). Seed type, seed weight, geographical location,
temperature, control technique, and ants affect the germinability of bellyache bush seed
(Liogier, 1990; Bebawi and Campbell, 2004). Seeds commence germination at the start of the
wet season (Ashley, 1995) but can also germinate at any times of the year if environmental
conditions are favorable.
Ants play a significant role in the germination of bellyache bush seeds (Bebawi and Campbell,
2004). Results show that 98% of ant-discarded seeds were viable and readily germinable at
100%, compared to intact seeds with 88% viability and only 8% germination (Bebawi and
Campbell, 2004). The caruncles were not present in seeds that were dispersed by ants.
Optimal germination temperatures for intact bellyache bush seeds occur between 24 and 310C.
Germination generally commences five days after the imposition of favorable environmental
conditions and reaches a maximum between days 11 and 12 (Bebawi et al., 2007). Burial depth
and litter cover also affect germination and viability following fire (Bebawi and Campbell,
2002c).
Germination and viability of bellyache bush seeds were negatively correlated with peak fire
temperature, which was affected by litter cover (Bebawi and Campbell, 2002c). No viable seeds
remained under litter cover, but more than 80% of seeds placed on bare ground (2 cm depths)
remained viable (Bebawi and Campbell, 2002c). Fire reduced germination and viability of
bellyache bush seeds within capsules by 31% and 35% respectively when compared with
unburnt seeds (Bebawi and Campbell, 2002d).

10
2.1.6.3 Seed longevity
Bellyache bush seeds can remain viable in the soil for several years with 3% of ant-dispersed
seeds (seed without a caruncle) found to be viable even after 4 years in the soil under natural
rainfall conditions (Bebawi and Campbell, 2002c). Conversely, no intact seeds (seeds with a
caruncle) exhumed after four years remained viable under natural rainfall conditions. Seedling
emergence was still observed after four years at a rocky site away from a watercourse; however,
no emergence occurred after three years at a heavy clay soil site within the same period (Bebawi
et al., 2007). The differences in seed bank depletion were attributed to differences in soil
moisture conditions between the two sites.
2.1.6.4 Seedling establishment and mortality
Seedling densities of bellyache bush can be very high under favorable environmental
conditions. On an average 247, 126, and 90 seedlings m-2 were measured within sub-riparian
and riparian infestation of bellyache bush (Bebawi et al., 2007). Higher seedling densities were
recorded under dense canopies of bellyache bush (300-400 seedlings m-2) (Vogler and Keir,
2005).
Removal of bellyache bush infestations can stimulate massive recruitment of seedlings through
increased light for ungerminated seeds (Bebawi and Campbell, 2002a; Bebawi and Campbell,
2002c; Vitteli and Madigan, 2002; Bebawi et al., 2004). For instance, bellyache bush spraying
with foliar herbicides resulted in increase in the seedling density from 5 plants m-2 to 400 plants
m2 (Vitteli and Madigan, 2002). Similarly, for each plant killed by foliar spraying, slashing, and
burning as part of integrated research experiment there was an additional 20, 97 and 69
seedlings which emerged in the same location, respectively (Bebawi et al., 2004). Treatments
that caused the greatest soil disturbance appeared most conductive for seedling recruitment.
High seedling mortality normally occurs if rainfall is limited and in high competition with other
plants (Bebawi and Campbell, 2002d; Vitteli and Madigan, 2002). For instance, seedling
density in burnt plots reached a peak of 390 seedlings m-2 in December and declined to 30
seedlings in the late dry season. However, in unburnt plots seedling density peaked at 200 m-2
before declining to 5 m-2 in the late dry season (Bebawi and Campbell, 2002c). Even though
mortality of seedlings is very high in the dry season, recruitment for re-infestation in treated
sites and expansion of infestations occurs in the absence of follow up control treatments. Once
seedlings reach about 20 cm in size they are very hardy and will generally tolerate extreme
environmental conditions (Bebawi and Campbell, 2002d; Vitteli and Madigan, 2002).

11
2.2. The impact of bellyache bush in East Timor
2.2.1. Economic and social impact
The economy of East Timor deteriorated during the struggle against the Indonesian occupation
and has not yet recovered in the few years since independence (Wilson, 1995). The population
of East Timor is less than one million of which 80% are farmers with their livelihood dependent
on the farm (Da Costa et al., 2002). Crop and animal production are the main sources of
income, however, the increasing presence of bellyache bush has become a significant obstacle
to farmers in their attempt to increase their production because the weed is unpalatable and toxic
to livestock (MAFF, 2001). The toxins are thought to be caused by high amounts of
toxabulbumin and pyrrolizidine alkaloids contained in the plant which if consumed can cause
gastro-enteritis and even death (Kingsbury, 1964).
Bellyache bush can also reduce crop yields through competition with crops for moisture, light
and nutrients (Miller, 1982). Heavy infestations of bellyache bush can cause complete crop
failures and in some cases the land cannot be used for crop production the following year
(Chandhokar, 1978). Sweet potato, cassava, pumpkin, taro and maize are grown as monsoon
crops and can be severely affected during the monsoon season when the conditions are also
ideal for abundant growth of bellyache bush. These crops are very sensitive to weed
competition, especially in their early stages of development and the end result is often reduced
yields (Labrada et al, 1994; Jeffrey, 1998).
Based on literature presented above, it seems that the presence of bellyache bush has become a
significant constraint to economic growth in East Timor as the majority of the population are
farmers heavily dependent on animal and crop production. The losses in farm production caused
by the bellyache bush weed will have a significant impact on the economic income and social
aspects of many East Timorese (Wilson, 1995).
2.2.2. Environmental impact
According to Smith (1995), the biggest concern with the infestation of bellyache bush in
riparian habitats is that it directly competes with native plants in the early stages of
development. Bellyache bush replaces native colonizers and prevents subsequent invasion by
secondary species of native shrubs and trees (Wilson, 1997). Parrots, possums, bats and
macropods seem incapable of utilizing the plant in any way (Anon, 1996; Pit and Miller, 1991)
and based on its effect on livestock; it is highly likely to be also toxic to native animals.
Furthermore, bellyache bush obscures fence lines (Webb, 1948) hindering mustering (Smith,
1995). Therefore, it is likely that extensive thickets of the bellyache bush could degrade wildlife
habitat and reduce biodiversity in East Timor.

12
2.3 Integrated management of bellyache bush in East Timor
2.3.1 Preventative strategies
Preventative strategies are the most important method of preventing the introduction of weeds
from one country to another country (Hughes and Madden, 2002). However, in East Timor this
has proved difficult due to previous conflict and political decisions. Since Portuguese military
was invaded into East Timor in 1556 (Metzner, 1977), many Portuguese people introduced
bellyache bush as garden ornamental and medicinal plant. Also, vehicles and machinery used
by various military organisations probably contributed to the spread of weeds into East Timor in
recent times.
When the weeds are spread by natural agents it is difficult to control, but at least some steps can
be taken to reduce and control weed spread caused by human movement. For instance, all seeds
which are introduced to East Timor must be certified free of weed seeds (MAFF, 2001) and all
vehicles and machinery must be cleaned before entering East Timor. Efforts can also be made to
control weed seeds in feed and bedding. This is important as many bellyache bush seeds can
pass through the animal’s digestive tract intact and still remain viable (Smith, 1995).
2.3.2 Physical strategies
One of the most common methods of controlling bellyache bush is by the slashing and clearing
system. This is the cheapest method and is used widely in East Timor, particularly in the sloping
farm areas (Metzner, 1977). Farmers use a machete to slash the stems then dig out the roots
using a hoe. The disadvantage of this practice is that it is only feasible for small areas and
causes rapid regeneration unless followed by other methods that act to suppress the seedlings
(Labrada et al, 1994). The merit of this method is that the hand tools required are locally made
and easily available to farmers.
Another physical control used in East Timor is the slashing and burning system. This involves
slashing using a machete then allowing the cut plants to dry before burning the vegetation and
subsequently planting crops in the ashes. Where there is insufficient vegetation for an efficient
burn, the slashed vegetation is left to decompose and is cultivated into the soil after a long
fallow (Jeffrey, 1998). This method has been used by farmers for centuries to improve soil
fertility and manage pests.
In Australia, Bebawi and Campbell (2002b) found cutting stems at 0 cm height completely
killed bellyache bush plants compared with cutting treatments at 10cm, 20cm, and 40 cm height.
The majority of plants cut in the dry season at 10, 20, and 40 cm height were able to regenerate,
whilst plants cut during the wet season could only regenerate after being cut at 20 and 40 cm.

13
Thus bellyache bush plants are more likely to regenerate when cut during the wet season rather
than the dry season (Bebawi and Campbell, 2002b).
Burning is an effective control technique against bellyache bush where there is sufficient fuel to
carry a fire (Bebawi and Campbell, 2002c). In a two year study, burning killed 76% of plants in
the first year and 92% in the second year with air temperatures reaching up to 6400C at ground
level. Small plants and seedlings were more susceptible to fire than established plants (Bebawi
and Campbell, 2002c).
Although bellyache bush plants can be controlled by burning, a large proportion of the seed
bank is still able to survive resulting in large scale recruitment (Bebawi and Campbell, 2002d).
For example, 540 seedlings m-2 emerged from burnt plots compared with 190 seedlings m-2 in
control plots. Seedling density in burnt plots averaged 37 seedlings m-2 over two years,
compared with four seedlings m2 in control plots (Bebawi and Campbell, 2002d). Therefore,
using fire as a control technique could exacerbate the bellyache bush problem if follow up
treatments are not undertaken. Furthermore, fire can only be used effectively for weed control
when there is enough fuel available to burn (Vitteli, 2000). In drier areas, burns can only occur
following several years of above average rainfall that enables plan biomass to reach adequate
levels for burning. There are also substantial costs incurred by the farmers when using fire as
animals will need to be excluded during and after burning.
The use of heavy machinery in suitable terrain, such as a roller, consistently controls established
plants, small plants and seedlings (Bebawi and Campbell, 2002b).
2.3.3 Cultural strategies.
Bellyache bush is seldom found on land that is well and regularly cultivated for fodder. Ashley
(1995) suggested that improved management of pasture areas is an important factor in
smothering and suppressing bellyache bush.
Mulching is another method which is often used to control weeds effectively and has been
recognized as a beneficial practice in both agronomic and forestry systems (Haywood, 1999).
The function of mulches is to change the microclimate surrounding the plant, including
temperature, light intensity, relative humidity, vapour pressure deficit, CO2 concentration and
wind (Bellot et al., 2002). Mulching reduces the growth of weed stems (Van Lenteren, 1992;
Burger et al., 1996; Mayhead and Boothman, 1997).
Preliminary results from a field investigation on the impact of grazing on bellyache bush
population densities suggest that bellyache bush grows best in areas void of pasture (Bebawi et
al., 2007). Where there is a grass cover, its seedling recruitment is reduced and plants grow
more slowly.

14
2.3.4 Biological control
Biological control is defined as the use of natural agents such as insects, nematodes, fungi and
viruses for the control of weeds (Harley and Forno, 1992). Biological control is considered to be
the most effective weed management method (Tomley, 2003) as once the biological agent is
established and feeding on the bellyache bush plants, they will continue to attack the weeds
month after month and year after year. The merit of biological control is it could be integrated
with other methods to control weeds (Van Lenteren et al., 1992). After agents are released
herbicides can still be used in the field, if desired, provided it is not harmful to the agent.
Bellyache bush has been a target for biological control in Australia since 1996 (Wilson, 1997).
Over 170 locations in nine countries (Mexico, Venezuela, Dominican Republic, Puerto Rico,
Nicaragua, Netherlands Anttiles, Guatemala, Trinidad and Cuba) were investigated for potential
agents and more than 1000 specimens were collected and their suitability determined.
Pachycoris kluggi Burmeister (Scutelleridae) was the most damaging herbivore of plantations of
Jatropha curcas in Nicaragua, but unfortunately it did not develop on J. gossypifolia
Preliminary studies on the rust fungus, Phakopsora jatrophicola Cummis are promising but
limited funds in East Timor have prevented further host testing.
Until recently, only the seed feeding jewel bug Agonosoma trilineatum has been approved for
release in Australia for the control of bellyache bush. The potential impact of jewel bugs on the
bellyache bush has been quantified in greenhouse experiments (Bebawi et al. 2005a).
The leaf mining moth (Epicephalo sp) and the castor oil looper (Achaea janat L.) cause minor
defoliation of bellyache bush. The tenebrionids beetles, Lyphia australis Blackburn and
Platycotylus nilidulus Macleay and the nilidulid beetles Carpophilus marginellus Motschulsky
and C. obsoletus Erichson have been observed attacking the stems in the Northern Territory
(Wilson, 1997).
Soil borne fungus (Scytalidium dimidiatum) can cause stem end rot of bellyache bush stems in
North Queensland. It is a very common soil-borne fungus associated with a wide range of hosts
such as crop species and eucalypts (Tomley, 2003). However overall there is as yet no effective
biological control agent that can replace other control methods.
2.3.5 Chemical control
Chemical control is another option to use to eradicate bellyache bush infestations. Repeated
herbicide application is very successful in killing seedlings and preventing flowering and seed
production (Vitelli, 1998). A study conducted by Tropical Weeds Research Centre (TWRC)
found that 90-100% of mortality was achieved when herbicides were used to control bellyache
bush (Biological Branch Annual Report, 1988). The following herbicides have been used to

15
control bellyache bush plants: metsulfuron methyl (Brushoff®), imazaphyr (Arsenal®),
glyphosate, 2, 4-D (ethyl ester, amine, acid and DP acid), fluroxypyr (Starane®) and picloram
or triclopyr (Grazon®). Brushoff® and Starane® are registered for bellyache bush control in the
crop and grassland areas (Jeffrey, 1998). In addition, Access®, Garlon®, Af Rubber vine (2, 4-
D) spray® and Starane are use as basal-bark or cut-stump application. Finally, Velpar®,
Graslan®, Simazine®, Oust®, and Atrazine® are used as root-absorbed herbicides.
There are, however, some herbicides which do not appear to give satisfactory control in the
field. For instance, experiments conducted by Northern Territory Department of Primary
Industries and Fisheries on three rates of metsulfuron methyl (50, 75 and 100 g active
ingredient/ha) and three rates of glyphosate mixed with simazine (1.5 + 2.0, 1.5 +4 .0 and 3.0 +
4.0 kg active ingredient/ha) applied by helicopter showed these chemicals did not affect the
dense growths of bellyache bush after 12 months of application. It seems that the chemicals
should be used separately rather than mixed together (Pitt and Smith, 1990). Information given
by authorities at the TWRC is that metsulfuron methyl can kill 100% of bellyache bush
(Biological Branch Annual Report, 1988).
2.4. Conclusion and research objectives
Only limited research has been undertaken on determining bellyache bush control options that
could be adopted by farmers in East Timor. Economically the country is very poor and cannot
adopt expensive methods such as chemical and biological control is not yet proven. In order to
use chemicals, farmers need to buy both the chemical and appropriate equipment for
application. For biological control money is needed for research and to establish appropriate
laboratory facilities to test the agents before release.
One of the most widely used methods of controlling bellyache bush is the use of mechanical and
burning control. Slashing in combination with burning is the cheapest method and it is used
widely in East Timor (Metzner, 1977). Farmers only need a simply machete to slash bellyache
bush stems and then follow up by burning (Lavabre, 1991). This practice is commonly used for
land cultivation in sloping areas like East Timor. The merit of this method is that all types of
hand tools are available for the farmers and these are made locally rather than imported.
Although these practices are commonly used in East Timor to control weeds, there are still
many problems that appear in the field during and after control. For instance, the slashing
system is only feasible for small areas and in addition it may not significantly reduce
regeneration from the cut stems. Another problem is that bellyache bush monoculture is very

16
hard to burn due to high moisture content of stems and low fuel load. Moreover, burning
stimulates post-fire seedling emergence which may re-establish again in the wet season.
Therefore the objective of this study is to:
1. Investigate different cutting heights and different cutting heights in combination with
mulch on the control of established bellyache bush plants.
2. To examine the effectiveness of hand-pulling and mulching on the control of small
plants and mulching on the control of seedlings.
3. To determine bellyache bush properties as a fuel and the efficacy of fire as a tool for
bellyache bush control.

17
Chapter 3 – Experiment I. Mechanical Control
3.1. Introduction
In East Timor, the most common practices used to control bellyache bush infestations are
mechanical controls such as cutting, hand-pulling and mulching. It is the only option for
landholders in recent years due in part to the deterioration of the national economy since
independence. As a result many farmers do not have money to buy herbicides such as
metsulfuron-methyl and fluroxypyr that are registered for control of bellyache bush in Australia.
These herbicides are very expensive and not available locally.
Mechanical control is considered the cheapest and most common method used by farmers in
East Timor (Metzner, 1977). Farmers use a simple machete, which can be made locally, to cut
the stems of bellyache bush plants. This method is typically used in undulating areas that are
unsuitable for the operation of large machinery. Although mechanical control is the most
common technique used in East Timor, it is not without its disadvantages. For instance, the
cutting and hand-pulling system is only feasible for small areas because of time and labour
constraints. An additional disadvantage of cutting is that there is rapid regeneration from cut
stems unless the methods is combined with treatments (Labradal et al, 1994) such as digging
out the roots with a hoe or burning the regenerating bellyache bush. However these methods are
time-consuming and require a high amount of labor.
An alternative mechanical technique to the labor intensive cutting method is mulching. In the
recent years many farmers in East Timor are using mulch to control weed infestations. Mulch is
considered a cheap method and easily applied by the landholders to control weed infestations
without the need for any specific training of farmers (Wilson, 1995). However, the use of mulch
can lower the evaporation of moisture from soil by the sun and wind (Watson, 1957). It keeps
residual water in the soil which encourages bellyache bush plant growth (Adams, 1997). On the
other hand, excessive water in the soil may cause small plants and seedlings to rot (Okigbo,
1965, 1969; Lal, 1975; Dayanand et al., 1977; Lal et al., 1978; Lee et al., 1978). Several forms
of mulch have been used to suppress weeds in many parts of the tropics such as China, Vietnam,
Thailand and Indonesia (Watson, 1957; Lawson and Lal, 1979).
To optimize mechanical control of bellyache bush farmers need to cut the plants in the wet
season to prevent flower and seed development in the dry season thereby reducing seed
production and the subsequent increase in the number of new seedlings in the following wet
season (Dehgan and Webster, 1979). Cutting bellyache bush plants in the wet season increases
the curing time of felled stems and improves the efficiency of a burn in the late dry season (See
Chapter 4 for further information). Cutting bellyache bush plants in the wet season and allowing

18
them to cure until the late dry season can achieve 100% plant mortality if they have been cut
close to ground level (Bebawi and Campbell, 2002b).
Cutting close to the ground may control established plants of bellyache bush but small plants
and seedlings may establish in large numbers in the next wet season (Bebawi and Campbell,
2002b). It is common that there are three different stratum of bellyache bush plants growing
together at one place; established plants, small plants and seedlings. Therefore the use of
cutting, hand-pulling and mulching needs to be integrated to control these three strata of an
infestation.
The objective of this study is to investigate different cutting heights and different cutting heights
in combination with mulch to control established plants of bellyache bush. To investigate the
effect of hand-pulling and mulching on small plants and mulching on seedlings of bellyache
bush. In addition, the effect of burning on controlling bellyache bush infestations growing as a
monoculture was also investigated. The mechanical control measures on established plants,
small plants and seedlings were compared with burning of cut and uncut plants as a means of
controlling bellyache bush where it occurs in monoculture.
3.2. Materials and Methods
3.2.1. Study site description
This research was conducted from January 2007 to February 2008. The 900 -1000 m² areas at
two study sites at Acacia site (12º45’S, 131º09’E) and Channel Island (12º33’S, 130º51’E)
south of Darwin were located within a dense infestation of bellyache bush with average density
of 90,000 plants/ha. The mean annual rainfall is 1588.1 mm at Acacia and 1713.9 mm at
Channel Island with 94% of the rainfall occurring in the wet season between November and
March. Average monthly minimum and maximum temperatures at both the sites were 23ºC and
34ºC (Bureau of Meteorology, 2004).
At the Acacia site the soils are a mixture of alluvial sandy loam and clay of moderate fertility
with a pH of 6.5 (Fogarty et al., 1984). Beneath the canopy of established bellyache bush plants,
the vegetation consists of a few grass and herbaceous vegetation, such as feathertop rhodes
grass (Chloris virgata) and gamba grass (Andropogan gayanus) at the edges. The shrub stratum
was dominated by 2m bellyache bush with scattered turkey bush (Calytrix exstipulate), neem
tree (Azadirachta indica), Acacia spp, Owenia vernicosa and emergent to 10m scattered
Eucalyptus miniata and E. tetradonta trees. This vegetation indicates past disturbance of the
Acacia site.

19
The soil at Channel Island varies from sandy loam to sandy clay (Day et al. 1979; Fogarty et al.
1984). The herbaceous vegetation was dominated by Tacca leontopetaloides, flame weed
(Corchorus sidoides) and rock fern (Drynaria quercifolia). The shrub stratum was dominated by
bellyache bush, Bridelia tomentose, weeping fig (Ficus benjamina), Owenia reticulate and
Ardisias. While a mixture of Eucalyptus miniata and Acacia spp, river tea tree (Melaleuca
linariifoilia) and white wood (Atalaya hemiglauca) dominated the tree stratum.
Figure 3.1. The location of experimental sites for this study.

20
0
100
200
300
400
500
600
700
800
Jan Feb Mar Apr May Jun Jul Aug Sep Oct Nov Dec
Monthly
Rain
fall
(mm
)Channel IslandAcacia
Figure 3.2. Recorded monthly rainfall (mm) at the study sites in 2007. During the wet and dry season there were scattered rainfall events at both sites. For further information regarding weather conditions at the Acacia and Channel Island sites refer to Appendix B, Table 1 and Table 2.
3.2.2 Measurement of canopy density
Canopy density at the two study sites was measured by using a standard densiometer, taking
four replicate measurements at each of three experimental plots within the study sites.
3.2.3 Mechanical treatments and experimental design
This experiment was imposed on three different size classes of bellyache bush: established
plants, small plants and seedlings. There were four experiments undertaken in three 10m X 10m
plots at each of two sites. The treatments in the experiments included:
• Cutting of established plants (>50 cm),
• Cutting in combination with a mulch of established plants (>50 cm),
• Mulching and hand-pulling of small plants (<50 cm and >10 cm), and
• Mulching of seedlings (<10 cm).
3.2.3.1 Cutting of established plants
Fifteen established plants were randomly selected from within each 10m x 10m plot and then
cut off according to five different height treatments. The cutting treatments were at heights of 0
cm, 10 cm, 20 cm, 30 cm, and 40 cm. A further 15 plants were left uncut as a control treatment.

21
Treatments were implemented in a randomised block design. One replicate of each cutting
treatment was grouped into each of the 15 clusters (blocks) within each 10m X 10m plot. The
locations of plant clusters were chosen using a random numbers table. All plants were cut with
secateurs. The location of each plant was marked with tags to facilitate monitoring after cutting.
Plant height and total branch number were counted before cutting. Measurements were recorded
every six weeks on the number of plants alive, number of new shoots on live plants, height and
reproductive status (bud, flowers or fruits present).
3.2.3.2 Cutting and mulching of established plants
There were three treatments for the cutting and mulching consisting of cutting at 0 cm and then
covering with straw mulch, cutting at 30 cm and covering with straw mulch and untreated as the
control plot. The height and number of branches of all plants in each of three replicate 1m X 1m
quadrats were recorded before imposing the treatment. Secateurs were used to cut the plants,
before mulch was applied. The straw mulch was applied at 1 kg per 1m X 1m quadrat. The
location of each plant was marked with tags to facilitate monitoring after cutting. This rate of
mulch application is equivalent to 10 tonnes/ha which is similar to savanna fuel loads and easily
manageable in term of logistics and weighing under field conditions. Measurements were
recorded every six weeks on the number of plants alive, number of new shoots on live plants,
height and reproductive status (bud, flowers or fruits present).
3.2.3.3 Hand pulling and mulching of small plants (< 50 cm and > 10 cm)
There were three treatments applied to small plants: hand pulling, mulching and control. Three
replicate 1m X 1m quadrats of each treatment were randomly located within the 10m X 10m
plots. However, in some cases 1m X 1m quadrats were chosen from outside 10m X 10m plots
because of a lack of small plants in a plot. The height of all small plants within 1m X 1m
quadrats were recorded and then located with tags in order to facilitate monitoring after hand
pulling and mulching. Control treatment plants were just measured and tagged. Measurements
were recorded every six weeks on the number of plants alive, new plants, new shoots, height of
the tallest shoots and of the plants.
3.2.3.4 Mulching seedlings (< 10 cm)
There were two treatments for seedlings: mulching and control. Three replicate 1m X 1m
quadrats were randomly located within 10m X 10m plots. However, in some circumstances the
quadrats 1m X 1m quadrats were chosen from outside of 10m X 10m plots, because of a lack of
seedlings. All seedlings within each 1m X 1m were counted and their height measured and

22
marked with tags to facilitate monitoring after mulching. Finally all seedlings except those in
control quadrats were covered with straw mulch at a rate of 1 kg per 1m X 1m plot.
Measurements were recorded every six weeks on the number of plants alive, new plants and
plant height.
3.2.4. Statistic analysis
Only data from February 2008 was analysed to evaluate whether treatments successfully killed
individual plants by the next wet season after treatment. Models for the analysis of variance are
presented in Table 3.1, where Treatment and Site are fixed factors and Plot is random. Data
were check for normality and transformed to Arcsin (square root (proportion alive)). Full results
of ANOVA are presented in Appendix A, P values are presented in the text of results. Data in
tables and figures is presented as mean + S.E.
Table 3.1. Model designs for analysis of variance of the four mechanical treatment experiments.
Experiment Model for ANOVA Data transformation
Cutting of
established plants
SITE+TREATMENT+SITE*TREATMENT Arcsin(square root(
proportion alive))
Cutting + mulch of
established plants
SITE+TREATMENT+PLOT(SITE)+
TREATMENT*SITE+TREATMENT*PLOT
Arcsin(square root(
proportion alive))
Small plants SITE+TREATMENT+PLOT(SITE)+
TREATMENT*SITE+TREATMENT*PLOT
None
Seedlings SITE+TREATMENT+PLOT(SITE)+
TREATMENT*SITE+TREATMENT*PLOT
Arcsin(square root(
proportion alive))

23
3.3. Results
3.3.1. Canopy cover
ANOVA (Appendix A, Table 1) of canopy cover at wet season and dry season indicated
significantly (P = < 0.001) more shade at Channel Island than at Acacia (Table 3.2).
Table 3.2. Canopy cover at the study sites in 2007
Site Canopy (%) in wet season Canopy (%) in dry season
Channel Island 88.8 + 2.2 63.6 + 8.9
Acacia 48.5 + 4.7 18.8 + 4.9
3.3.2. Cutting treatment of established plants
One month after imposing cutting treatments on one plant at each cutting height in each of 15
clusters, there was a sharp decline in the proportion of plants alive over the wet season at Acacia
site. By the onset of the dry season all cutting treatments achieved 100% mortality (Figure 3.3
A). By contrast at Channel Island there was a gradual decline in the proportion of plants alive
throughout the wet season (Figure 3.3 B). At Channel Island there were some plants still alive
over the following dry season on treatments cut at 20 cm to 40 cm above ground level. There
was a significant (Appendix A, Table 2) effect of site (P = < 0.001), treatment (P = < 0.001) and
interaction between site and treatment (P = 0.002). The cutting treatments at Acacia and
Channel Island achieved 100% mortality at cutting heights 0cm and 10cm by August 2007
while at Channel Island plants cut higher than this survived in the dry season until February
2008 (Figure 3.3A, 3.3 B and 3.4).

24
(A)
0
0.2
0.4
0.6
0.8
1
1.2
Feb-07 Mar May Jun Aug Oct Nov Jan Feb-08
Prop
ortio
n al
ive/
plan
t
Control 0cm 10cm 20cm 30cm 40cm
(B)
0
0.2
0.4
0.6
0.8
1
1.2
Feb-07 Mar May Jun Aug Oct Nov Jan Feb-08
Prop
ortio
n al
ive/
plan
t
Control 0cm 10cm 20cm 30cm 40cm
Figure 3.3. Proportion of plants alive in each month following the application of cutting treatments at (A) Acacia and (B) Channel Island.

25
Control403020100
1.0
0.8
0.6
0.4
0.2
0.0
Cutt ing treatments (cm)
Mea
n pr
opor
tion
aliv
e
A cac iaC hann el
S ITE
Figure 3.4. Proportion of plants alive at each site in February 2008, at Acacia and Channel Island, for each cutting treatment.
There was some re-sprouting over the wet season at Acacia and Channel Island. However no re-
sprouting was found at the Acacia site in the dry season (Figure 3.5 A). By contrast, at Channel
Island there were a number of plants alive and re-sprouting in the dry season although numbers
gradually declined over time (Figure 3.5 B). There was a significant (Appendix A, Table 3)
impact of site on the re-sprouting of established plants (P = 0.025) and treatment (P = < 0.001).
The interaction between cutting height and site on re-sprouting of plants is shown in Figure 3.6
where plants were cut at 0 cm and 10 cm did not re-sprout at either site, while the other
treatments plants still remained alive until February 2008 at Channel Island (Figure 3.6).

26
(A)
02468
10121416
Feb-07 Mar May Jun Aug Oct Nov Jan Feb-08
New
sho
ots
per p
lant
Control 0cm 10cm 20cm 30cm 40cm
(B)
02468
101214161820
Feb-07 Mar May Jun Aug Oct Nov Jan Feb-08
New
sho
ots
per p
lant
Control 0cm 10cm 20cm 30cm 40cm
Figure 3.5. Total new shoots each month on established plants following cutting treatment at (A) Acacia and (B) Channel Island.

27
Control403020100
18
16
14
12
10
8
6
4
2
0
Cutting treatments (cm)
Mea
n ne
w s
hoot
s/pl
ant
AcaciaChannel
SITE
Figure 3.6. Number of new shoots per plant in February 2008, at Acacia and Channel Island, for each cutting treatment.

28
3.3.3. Cutting in combination with mulching of established plants
Similarly to the results of the cutting treatments, cutting in combination with mulch resulted in a
sharp decline in proportion of live plants over the wet season at the Acacia site. All plants cut 0
cm and 30 cm above ground in combination with mulch were killed by the end of the wet
(Figure 3.7 A). However, the proportion plants alive at Channel Island gradually declined over
the wet season. In addition, at this site some plants cut at 30 cm in combination with mulch
remained alive over the dry season (Figure 3.7 B). ANOVA (Appendix A, Table 4) indicated
that there was a significant effect of different cutting treatments in combination with mulch of
site (P = < 0.001), treatment (P = < 0.001) and interaction between site and treatment (P =
0.030) but not plot (P = 0.380), or interaction between treatment and plot (P = 0.398). These
results show that stems cut at 0 cm and 30 cm in combination with mulch resulted in 100%
mortality at Acacia while at Channel Island only those cut at 0 cm in combination with mulch
did not sprout. At the latter site plants remained alive on the 30 cm cutting treatment in
combination with mulch at the February 2008 observation (Figure 3.8).
(A)
0
0.2
0.4
0.6
0.8
1
1.2
Feb-07
Mar May Jun Aug Oct Nov Jan Feb-08
Prop
ortio
n al
ive/
plan
t
Control 0 + M 30 + M
(B)
0
0.2
0.4
0.6
0.8
1
1.2
Feb-07
Mar May Jun Aug Oct Nov Jan Feb-08
Prop
ortio
n al
ive/
plan
t
Control 0 + M 30 + M
Figure 3.7. Proportion of established plants alive in each month following cutting in combination with mulching treatments at (A) Acacia and (B) Channel Island.

29
Control30 + M0 + M
1.0
0.8
0.6
0.4
0.2
0.0
Cutting treatments in combination with mulch
Mea
n pr
opor
tion
aliv
eAcaciaChannel Island
Site
Figure 3.8. Proportion of established plants alive in February 2008, at Acacia and Channel Island, following cutting in combination with mulch treatments.

30
There was no re-shooting of cut plants in combination with mulch at Acacia due to plants
having been killed (Figure 3.9 A). While at Channel Island, where plants were cut at 30 cm in
combination with mulch application the number of new shoots per plant moderately increased
over the first two months after the cutting. This was followed at this site by a gradual decline in
new shoots over the dry season (Figure 3.9 B). There was no significant (Appendix A, Table 5)
impact of cutting treatments in combination with mulch on the re-shooting of established plants
due to site (P = 0.097) and treatment (P = 0.065). This is due to nil re-sprouting of the stems cut
at 0cm and 30cm in combination with mulch at Acacia and 0cm in combination with mulch at
Channel Island. While some re-sprouting was still found in the stems cut at 30cm in
combination with mulch under the high canopy cover by February 2008 at Channel Island
(Figure 3.10).
(A)
02468
101214
Feb-07
Mar-07
Apr-07
May-07
Jun-07
Jul-07
Aug-07
Sep-07
Oct-07
Nov-07
Dec-07
Jan-08
Feb-08
New
sho
ots
per p
lant
Control 0 + M 30 + M
(B)
02468
101214161820
Feb-07
Mar-07
Apr-07
May-07
Jun-07
Jul-07
Aug-07
Sep-07
Oct-07
Nov-07
Dec-07
Jan-08
Feb-08
New
sho
ots
per p
lant
Control 0 + M 30 + M
Figure 3.9. Total number of new shoots per plant for established plants in each month following cutting in combination with mulch at (A) Acacia and (B) Channel Island.

31
Control30 + M0 + M
1.0
0.8
0.6
0.4
0.2
0.0
Cutting in combination with mulch
Mea
n n
ew s
ho
ots
/pla
nt
AcaciaChannel Island
Site
Figure 3.10. Number of new shoots per plant in February 2008, at Acacia and Channel Island, following cutting in combination with mulch.

32
3.3.4. Hand pulling and mulching treatment of small plants
There was a significant (Appendix A, Table 6) effect of hand-pulling and mulching treatments
of small plants between sites (P = < 0.001) and treatment (P = < 0.001) but there was not a
significant interaction between treatment and plot (P = 0.279). Hand-pulling completely killed
small plants; irrespective of season and site at the both study sites (Figure 3.11). When the small
plants were pulled out by the hand in the early wet season, they were immediately killed and did
not recover as shown by the 100% mortality recorded in the observation conducted in the
following month (Figure 3.12 A) and (Figure 3.12 B).
Mulching treatment reduced the survival of small plants at Acacia and Channel Island. At
Acacia there was a sharp decline in the proportion of plants alive after one month in the
mulching treatment. After that it remained stable (Figure 3.12 A). However, the use of mulch at
Channel Island did not control small plants and the proportion alive remained constant
throughout the year (Figure 3.12 B).
0
0.2
0.4
0.6
0.8
1
1.2
Control Hand-pull Mulch
Mea
n pr
opor
tion
aliv
e
Acacia Channel Island
Figure 3.11. Mean proportion of small plants alive on control plots compared to plots where a hand pulling and mulch treatments where applied at Acacia and Channel Island (February 2008).

33
(A)
0
0.2
0.4
0.6
0.8
1
1.2
Feb-07
Mar-07
Apr-07
May-07
Jun-07
Jul-07
Aug-07
Sep-07
Oct-07
Nov-07
Dec-07
Jan-08
Feb-08
Prop
ortio
n al
ive
per m
2
Control Hand-pulling Mulching
(B)
0
0.2
0.4
0.6
0.8
1
1.2
Feb-07 Mar-07 Apr-07 May-07
Jun-07 Jul-07 Aug-07
Sep-07
Oct-07 Nov-07
Dec-07
Jan-08 Feb-08
Prop
ortio
n al
ive
per m
2
Control Hand-pulling Mulching
Figure 3.12. Proportion of small plants alive following hand-pulling and mulching treatments in each month at (A) Acacia and (B) Channel Island.

34
3.3.5. Mulching treatment of seedlings
There was a gradual decline in the proportion of seedlings alive after imposing mulching
treatments (Figure 3.13 A, B). Seedling mortality following mulching treatment significantly
increased during the dry season. However there are differences in seedling mortality achieved at
Acacia and Channel Island. Seedling mortality at Acacia is high compared to Channel Island.
There was a significant (Appendix A, Table 7) effect of mulching on seedlings mortality of site
(P = < 0.001) and treatment (P= < 0.001) but no significant on plot (P = 0.053), interaction
between site and treatment (P = 0.226) and interaction between treatment and plot (P = 0.252).
At Acacia no seedlings survived the mulch treatment while at Channel Island just under 20%
survived by February 2008 (Figure 3.14).
(A)
0
0.2
0.4
0.6
0.8
1
1.2
Feb-07
Mar-07
Apr-07
May-07
Jun-07
Jul-07
Aug-07
Sep-07
Oct-07
Nov-07
Dec-07
Jan-08
Feb-08
Prop
ortio
n al
ive
per p
lot
Control Mulch
(B)
0
0.2
0.4
0.6
0.8
1
1.2
Feb-07
Mar-07
Apr-07
May-07
Jun-07
Jul-07
Aug-07
Sep-07
Oct-07
Nov-07
Dec-07
Jan-08
Feb-08
Prop
ortio
n al
ive
per p
lot
Control Mulch
Figure 3.13. Proportion of seedlings alive following mulching treatment at (A) Acacia and (B) Channel Island.

35
-3
-2
-1
0
1
2
3
4
5
Control Mulch
Treatment
Mea
n m
orta
lity/
m2
Acacia Katherine
Figure 3.14. Proportion of seedlings alive in February 2008, at Acacia and Channel Island following mulching treatment.

36
There was no significant (Appendix A, Table 8) effect of site (P = 0.445), treatment (P = 0.124),
or interaction between site and treatment (P = 0.777) and interaction between treatment and plot
(P = 0.132), but there was a significant effect of plot (P = < 0.001). The use of mulching
generally stimulated the emergence of new seedlings in the early wet season in both sites. This
could be due to conditions being improved for germination and seedling emergence under
mulch. Within the mulching treatment massive numbers of new seedlings were found compare
to uncontrolled (Figure 3.15 A, B).
(A)
0
2
4
6
8
10
1214
16
18
Feb-07
Mar-07
Apr-07
May-07
Jun-07
Jul-07
Aug-07
Sep-07
Oct-07
Nov-07
Dec-07
Jan-08
Feb-08
Tota
l see
dlin
gs p
er m
2
Control Mulch
(B)
0
2
4
6
8
10
12
14
Feb-07
Mar-07
Apr-07
May-07
Jun-07
Jul-07
Aug-07
Sep-07
Oct-07
Nov-07
Dec-07
Jan-08
Feb-08
Tota
l see
dlin
gs p
er m
2
Mulch Control
Figure 3.15. Total number of new seedlings each month (m-2) in mulch and control treatments at (A) Acacia and (B) Channel Island.

37
3.4. Discussion
This study has confirmed the results of previous studies which also found cutting of stems can
be used to kill established bellyache bush plants (Bebawi and Campbell, 2002b). However this
study also found that mechanical control is only partially successful in killing established plants
and is dependent on shade levels and cutting heights. The differences of canopy cover and
possibly rainfall at the study sites appear to be the main factors influencing plant mortality as
stated by Pyne et al. (1996) and Anderson (1985). They argued that cutting plants opened the
areas exposure to direct solar radiation which results in higher evaporation lower average soil
moisture content and greater amplitude to the soil moisture content cycle which may affected to
plant growth compared with plants in adjacent plots under canopy cover. The study also found
that under low canopy cover such as at Acacia, the site temperature may be higher, humidity
lower and this may cause the release of moisture from soil and cut stems to the free atmosphere
which may reduce plant growth. Under these conditions plants may be completely killed in dry
season. In addition, under low canopy cover the mean maximum temperature tends to increase
which may also contribute to high plant mortality at all cutting heights (Anderson, 1985;
Trollope, 1980; Pyne et al., 1996). By contrast, where there is high canopy cover such as that at
the Channel Island site, radiation may be hindered and wind speed reduced temperature and
evaporation lowered, and atmospheric moisture content raised which may promote plant growth
(Anderson, 1985; Pyne et al., 1996; Goudriaan, 1977; Norman and Campbell, 1983).
Cutting heights of 10 cm or lower killed all bellyache bush plants, irrespective of canopy cover.
Cutting below 10 cm could be an option for the landholders treating bellyache bush infestations
occurring under higher canopy cover. However, under low canopy cover stems may only need
to be cut to 40 cm; which may mean less manual effort for the landholder.
Cutting established plants higher than 20 cm still resulted in 100% mortality under low canopy
cover. This is because bellyache bush plants that were cut at 20cm-40cm under low canopy
cover may experience high temperature, excessive heat and low humidity (Anderson, 1985;
Pyne et al., 1996). As a consequence of these inappropriate environmental conditions cut
bellyache bush plants may be completely killed (Mohr and Schopfer, 1994). In contrast,
mortality of cut stems under high canopy cover was very poor unless cut at ground level
(Bebawi and Campbell, 2002b). This could explain the re-shooting and re-growth from cutting
treatments above 20 cm under high canopy cover. The marked difference in efficacy between
the cutting treatments lower than 10 cm and cutting treatment higher than 20 cm under different
canopy cover may be associated with carbohydrate reserves and physiological stress of the cut
stems (Kramer and Kozlowski, 1979; Bebawi and Campbell, 2002b; Wilkins, 1984).

38
Mulching generally did not contribute to the plant mortality of established plants. This is shown
in all results obtained in the cutting treatments in combination with mulch are no significant
different to the cut only treatments.
Hand-pulling of small plants achieved 100% mortality within one month, irrespective of canopy
cover. Although hand-pulling treatment completely killed small plants in the short term, the cost
of this method must be considered. Hand-pulling is considered a common practice, effective and
widely used to control weed infestations, but it is highly labor intensive, particularly in dense
infestation (De Datta and Barker, 1975). Moreover, in some circumstances bellyache bush small
plants are very hard to pull in dry soil condition and also depending on plant maturity at the
hand-pulling time.
The use of straw mulch 1 kg/m2 did not effect the kill of small plants at the Acacia and Channel
Island sites. This is due to height of small plant being approximately 25-30 cm at the time of
application so the mulch applied at 1kg/m2 did not cover the plants sufficiently to smoother all
the small plants. Furthermore the mulch it may have lowered evaporation from the soil which
would have resulted in higher soil water content which would promote growth rather than kill
small plants of bellyache bush (Watson, 1957; Lawson and Lal, 1979).
The application of mulch increased the mortality of seedlings present in treated plots. Mohler
and Teasdale (1993) also found that mulch smothered and killed seedlings.
By contrast to seedling mortality, the use of straw mulch is likely to promote new seedling
emergence in the wet season. The increase of seed germination and new seedlings emerging in
the wet season was probably due to ability of mulch to trap heat or moisture in the dry season
enhancing the breakdown seed dormancy (Bebawi and Campbell, 2002d). It may also show the
capacity of the bellyache bush seeds to germinate and emerge under different canopy cover
(Csurhes, 1999; Teasdale, 1999).
Although mechanical control is a practicable method for East Timorese farmers to control
bellyache bush infestations, there are still many problems associated with this method. For
instance, re-sprouting may occur from some cut stems and or small plants and new seedlings
may re-establish stands of this weed. Therefore, the East Timorese farmers need to incorporate
good management strategies with other methods to control re-sprouting from cut stems and new
seedlings that might be establish again following mechanical control.

39
3.5. Conclusion
To conclude that mechanical control is partially successful in killing established bellyache bush
plants and the success is dependent on shade levels and cutting heights. Under low canopy
cover cutting treatments at 0-40 cm completely killed established plants by the end of the dry
season. This may be due to higher temperature and lower humidity expected under the lower
canopy at Acacia. By contrast, under high canopy cover some plants were still found alive,
particularly cutting heights of 20-40 cm. This is due to lower temperature; higher humidity and
lower evaporation experienced under high canopy cover which reduces the impact of dry season
conditions. Cutting higher than 20 cm may provide a substantial carbohydrate reserve to
promote growth under suitable soil moisture temperature and humidity such at Channel Island.
Hand-pulling techniques completely killed small plants within one month but the labor
requirement is high, particularly in dense infestation. In addition, in some circumstances
bellyache bush small plants cannot be pulled out due to dry soil condition.
The use of straw mulch generally did not contribute to plant mortality of established and small
plants of bellyache bush. This is due to the use of straw mulch 1 kg/m2 being insufficient to
cover and smoother established and small plants of bellyache bush. However, the use of straw
mulch 1 kg/m significantly reduced seedling surviving in the dry season, irrespective of site.
This is due to the use of straw mulch at the rate of 1 kg/m² was sufficient to suppress or smother
seedling growth. The mulch stimulated new emergence in the wet season which can result in
more plants surviving. This treatment would need to be followed with other methods to control
reshooting of established plants and new seedlings.

40
Chapter 4 – Experiment II. Bellyache Bush Properties as a Fuel
4.1. Introduction
The most common practice used in East Timor to control weed infestations is by slashing and
burning. The slash and burn system has been used traditionally by the East Timorese farmers for
land preparation since 1912 (Metzner, 1977). It is the only option available for landholders in
recent years due to financial and resource constrains suffered by farmers. As a result many
farmers still use this method to control weeds and to clean land. The system of slash and burn is
considered the cheapest method of land preparation for cropping and is used widely by the East
Timorese farmers (Metzner, 1977). Farmers use a simple machete to slash weed and other
plants in the early dry season in order to provide enough fuel for burning. This method is
typically used in undulating areas that are unsuitable for the operation of large machinery.
Although the slash and burn system is the most common technique used in East Timor for weed
control and land cultivation, it is not without its disadvantages. For instance, if slashing is
carried out close to the start of the wet season bellyache bush will retain high moisture content
and provides a less suitable fuel for fire (Metzner, 1977). As a consequence of the difficulty of
burning at the start of the wet season many farmers in East Timor abandoned their land and
shifted to new places to settle their agricultural activities.
An alternative technique to solve this problem is to identify the properties of bellyache bush for
optimal burning management. A slashing and burning system is a method of clearing target
vegetation (Metzner, 1977) and the effectiveness of fire depends on the duration and intensity of
heat produced and the dryness of the slashed stems (Bowman and Wilson., 1988; Pitt 1998).
The drying of the slashed stems (curing) is an essential factor that needs to be taken into
consideration when dealing with fire management to control bellyache bush. Curing refers to
the degree of drying of the slashed stems and it indicates the moisture content of the fuel, its
flammability and thus the potential rate of fire spread. According to Williams et al. (2001),\ the
grass curing starts as soon as a fuel is greatly accelerated by the sudden onset of the dry season.
On the other hand, they also argued that fuel curing can be vary greatly across the landscape
according to position in the landscape, canopy cover, plant species, land types weather
condition and the season. For instance, grasses such as annual sorghum on sandy soils will cure
rapidly than perennial grasses on cracking clay (Williams et al, 2001; Dyer et al, 2001). The
curing of grasses usually takes about one to one and half months to complete. As grasses fuel
dries off over the dry season fuel becomes more cured and may produces higher fire intensity
(McArthur and Cheney, 1972).

41
However, there are other factors which need to be taken into consideration during the curing
period. For instance, the consistent rainfall during the curing period in the dry season can cause
grass fuels to stay green longer and produce fresh growth on the slashed stems, thus reducing
the fuel flammability (Australian Fire Authorities Council, 2002). The greenness and re-
sprouting on the cut stems in the dry season tends to reduce fuel flammability as a fire season
progresses.
If the fuel moisture content is greater than 20% then it is mostly unable to burn in the dry season
(Australian Fire Authorities Council, 2002; McArthur and Cheney, 1972). The higher the
moisture content, the more energy required to combust the fuel, and consequently fire may be
less intense (Geoffrey et al., 2003). In addition, Johnson (2002) stated that, the greenness and
moisture content of fuel affects ignition potential, fire intensity and rate of fire spread. Plant
moisture acts as a heat sink and thus influences fire behavior by increasing the specific fire
required for the fuel to combust. As plant moisture decreases to 20%, fire intensity and potential
ignition increase (Australian Fire Authorities Council, 2002; Johnson, 2002).
The second important thing dealing with fire management is fuel characteristics and fuel
texture. Fuel availability and fuel load affects fire intensity (McArthur and Cheney, 1972). Fuel
loads can be expressed in different units, for instance tones per hectare, kilogram per hectare,
kilograms or grams per square meter (Williams et al., 2001). Most savanna fuels are fine fuels
and less than 6 mm in diameter. Annual inputs of fine fuel from grass growth and litter fall
between about 2-8 tonnes of dry matter per hectare. Under annual burning, fuel loads generally
remain at these levels in both higher rainfall and semi-arid savannas. If country remains
unburnt, the fuel loads rise but do not generally increase above the equivalent of a few years’
grass growth and leaf fall because the litter breaks down quickly during each wet season
(Williams et al., 2001).
The volume of available dead fine and heavy fuels will change with the seasons. Usually the dry
season brings about an increase in the total volume of dead litter fuels as trees shed leaf and
bark material in response to moisture stress. Also the dry litter bed decomposes or composts
more slowly. In time of drought this can amount to an increase of up to 8 tonnes per hectare of
dead fine fuel (Stinson and Wright, 1969). .
During the wet season, heavy dead fuels and deep litter beds of fine fuels in forest become
saturated. As the dry season commences, these fuels slowly dry out providing increasing
quantities of available fuel. These fuels may take one to two months or more of drying weather
to fall to minimum moisture contents to support fire (Australian Fire Authorities Council, 2002;
McArthur and Cheney, 1972).
42
The third important factor needing to be considered in the fire management is heat yield during
combustion. The measurement is related to the ability of fuel to produce heat, and correlates
with factors such as scorch height of vegetation. Total energy released per unit area is more
closely related to the completeness of combustion and the post fire state of the site (Byram,
1959).
Although fire is a common tool used to manage weeds in East Timor, it has proven difficult to
control bellyache bush due to its high moisture content and dense monoculture habitat. By
growing as a monoculture, bellyache bush produces less fine fuel and medium fuel to support
management burns than where it occurs in mixed stands where there is more fine and medium
fuel. The objective of this study was to determine the properties of cut bellyache bush stems
required for successful management of fire. It is expected that stems, if allowed to cure can
form a suitable fuel bed for fire management in the late dry season.
4.2. Materials and Methods
4.2.1. Site description
This study was conducted from May to October 2007 at three locations in northern Australia
and investigated curing rate, re-sprouting, fuel texture and heat yield combustion of bellyache
bush. Channel Island was used for the curing and re-sprouting studies only. Acacia was used for
curing, re-sprouting, fuel texture, fuel consumption and heat yield combustion studies.
Katherine was used for the fuel texture study.
The Channel Island and Acacia sites are described in Chapter 3. The Katherine site (14º22’S,
132º09’E) had a mean annual rainfall of 875 mm (Figure 4.1), mean annual maximum
temperature 34.4ºC, minimum temperature 19.4ºC and mean relative humidity 67%. The soil
type at the Katherine site was a sandy loam to sandy clay (Day et al., 1979; Fogarty et al.,
1984). At this site there was almost a monoculture of bellyache bush situated on limestone
outcrops that were surrounded by dense mission grass (Pennisetum sp) 1.5 m tall, with
Eucalyptus confertiflora, E.tectifica, E.latifoli, and Ficus platipoda present in small numbers.
There were three plots in this study. The first plot was located in the heart of the limestone
outcrop on a flat soil sheet surrounded by rock. The second plot was located amongst shallow
soil lenses amongst a limestone outcrop. And the third plot was a long narrow plot located
between two rocky ridges.

43
0100200300400500600700800
Jan Feb Mar Apr May Jun Jul Aug Sep Oct Nov Dec.
Monthly
Rai
nfal
l (m
m)
Channel Island Acacia Katherine
Figure 4.1. Monthly rainfall data at the study sites during 2007.
4.2.2. Measurement of canopy cover
The experiment was undertaken in three randomly selected of 10m x 10m plots at all sites.
Canopy cover was measured using a standard densitometer, taking four replicate measurements
at each plot within the study sites, as per 3.2.2.
4.2.3. Curing rate of bellyache bush
This measurement was undertaken on plots of cut bellyache bush stems at the Acacia and
Channel Island sites. At each site one 10m x 10m was divided into 100 quadrats each measuring
1m x 1m. All bellyache bush in the plot was cut in May, when biomass is maximum after the
proceeding wet season. Every four weeks, five 1m x 1m quadrats at each study site were
randomly selected and all fuel in the quadrat was collected. These fuel samples were then
quickly sealed in plastic bags, and transported to laboratory for wet weight measurement.
Samples were then oven-dried in paper bags at 70ºC until the weight was constant to obtain dry
weight. The moisture was calculated as a percentage using the dry weight relative to the total
wet biomass.
4.2.4. Measuring re-sprouting of cut stems
This measurement was undertaken on the plot of cut bellyache bush stems at Channel Island and
the plot of cut bellyache bush stems for the burning experiment at Acacia and Katherine. At
each site one 10m x 10m plot was used for this study. In each of these plots 51 previously cut
stems of bellyache bush were randomly selected within each of 10m x 10m plots in September

44
2007. Total length of the each stem and the length from the tip (meristem) at which shoots were
appearing and still green were recorded.
4.2.5. Characterising fuel size classes before burning
This measurement was carried out at the Acacia and Katherine sites. At each site three 10m x
10m plots ware used for this study. These plots were subsequently burned in the fire study
(Chapter 5). Five 25cm x 25cm quadrats were randomly selected within each of the three plots
and all fuel collected and sorted according to texture and weight. Size classes were fine (less
than 6mm in diameter), medium (between 6mm-25mm in diameter) and coarse (greater than
25mm in diameter). Samples were placed back in the field after measurements were taken.
There was so little grass in the plots that it was not possible to identify it separately.
4.2.6. Heat yield of fuel (J/g)
The samples for this measurement were collected from the Acacia site. Two stems of each size
class were randomly selected and then sealed into bags. Samples were then ground and
homogenised using a wooding vessel. A 0.8-1g sample was analysed for heat yield by using a
bomb calorimeter (AS 1038.5 leco 350 calorimeter). This was done at HRL Technology Pty
Ltd, Victoria laboratory, New South Wales.
4.2.7. Statistical Analysis
Data collected for this chapter was of a descriptive nature and therefore did not require
statistical analysis such as an ANOVA. Mean and standard error were determined using
descriptive statistics in Minitab. However, the proportion of whole stems length alive and
number of shoots per stem was analysed to evaluate whether curing was effected by canopy
cover. A model for the analysis of variance is one factor, where site is fixed factor and stems are
random. Data were checked for normality and transformed to Arcsin (square root (proportion
alive). Full results of ANOVA are presented in Appendix A, while P values are presented in the
text of results.

45
4.3 Result
4.3.1. Canopy cover
Canopy cover differed between sites and seasons. There was less canopy cover present during
the dry season for all three sites. Channel Island had higher cover than Acacia and Katherine for
both seasons (Table 4.1).
4.3.2. Curing rate of bellyache bush stems
Bellyache bush stems had the highest moisture content at the start of the dry season (May) at
both sites (Figure 4.2). During the first two months moisture content decreased by only 10 %,
however, after the three months moisture content of stems at Acacia site dropped sharply. After
five months all stems at Acacia site contained less than 10% moisture content and were well
cured. In contrast, the moisture content of cut bellyache bush stems at Channel Island site still
remained high (>55%).
Figure 4.2. Curing of bellyache bush fuel. Moisture (% content) from early dry season to late dry season 2007.
4.3.3. Measuring re-sprouting of cut stems
A considerable number of cut stems were still alive and had re-sprouted at the end of the dry
season (P = < 0.001) (Table 4.1). Channel Island had the largest proportion of live stems present
(0.76) in addition to the highest number of re-sprouted shoots (7), in comparison to Acacia (0.13
and 3.8) and Katherine (0.15 and 3.3) which has similar results.

46
Table 4.1. Canopy cover and re-sprouting (mean + S.E.) of cut stems. The influence of canopy cover on proportion of stems re-sprouting of cut stems while lying on soil surface during the dry season. Stems were cut in May and monitored at October (2007). Values with same letter are not significantly different (p < 0.5).
Canopy cover % Site
Wet Dry
Proportion
of cut
stems alive
Whole stem
length for
alive stems
(cm)
Proportion of
whole stem
length alive
Number of
shoots per
stem
Channel
Island
88.8 + 2.2 63.6 +
8.9
0.76 198.3 + 9.8 0.93 + 0.04 a 7.0 + 0.7 a
Acacia 48.5 + 4.7 18.8 +
4.9
0.13 183.3 +
12.7
0.25 + 0.02 b 3.8 + 0.8 b
Katherine 46.2 + 4.3 14.2 +
3.3
0.15 247.0 +
12.2
0.27 + 0.03 b 3.3 + 0.4 b
4.3.4. Characterizing fuel size classes before burning
Fuel load was greater at Acacia (5.95 t/ha) than Katherine (5.40 t/ha) (Figure 4.3). Acacia also
had higher amounts of fine and medium sized stems. There were differences of total biomass
and land cover types at the both sites. At Acacia bellyache bush grew with some grasses, herbs
and other plants. By contrast bellyache bush grew as a monoculture at the Katherine and less
fine and medium fuel occurred with greater coarse fuel.
0 1 2 3 4 5 6 7 8
Litter = < 6 mm
Medium z> 6 and< 25 mm
Coarse = > 25 mm
Total
Tonn
es/h
a
Acacia Katherine

47
Figure 4.3. Fine fuel (<6 mm), medium (>6 mm and <25 mm) and coarse (>25 mm). Mean (+ S.E) of fuel dry weight at the time of experimental fires at Acacia and Katherine in October 2007.
4.3.5. Combustion heat yield of bellyache bush
The average combustion heat yield of bellyache bush stems did not differ between textures 16.8
+ 0.2 j/g (Table 4.2).
Table 4.2. Combustion heat yield of bellyache bush stems analysed in 2007.
Sample Description Gross Calorific Value kJ/kg
Fine 17,000 + 400
Medium 17,000 + 100
Coarse 16,600 + 300
Average 16,800 + 200

48
4.4. Discussion
This study has determined that curing ability and re-sprouting properties of bellyache bush is
dependent on environmental conditions and other factors such as canopy cover, weather
conditions and season. Low canopy cover and more open areas such as that found at Acacia and
Katherine sites are likely to experience more direct heat and radiation during the dry season
such as stated by Anderson, 1985; Trollope, 1980 and Pyne et al., 1996. This condition may
create greater evaporation, releasing more moisture from the stems and increasing curing rate
(Anderson, 1985; Arno and Ottmar, 1994; Pyne et al., 1996). In addition, the weather conditions
such as the mean maximum temperatures tend to increase at Acacia and Katherine in the dry
season compare to the minimum air temperatures (Pyne et al., 1996). Given this pattern the
variation in humidity is very low at Acacia and Katherine sites compare to Channel Island.
Therefore, it seems that the meteorological conditions at Acacia and Katherine produce a higher
rate of curing compared to Channel Island (Trollope, 1980).
Curing process of bellyache bush cut stems was very slow in the early part the dry season. This
is due to highly moisture content of bellyache bush stems (70%) at the time of cutting and
subsequent influence of dry season showers in May and June. As a consequence of these factors
cut stems of bellyache bush takes two to six months to cure. By contrast, the grasses cure
rapidly with the onset of the dry season. It just takes one to one and half months for grasses to
completely cure. In forests land the fuel takes one to two months to completely cure (Williams
et al., 2001; McArthur and Cheney, 1972; Bowman and Wilson., 1988).
From the results obtained at the curing study plots it indicated that all cut stems from bellyache
bush under the low canopy cover site at Acacia cured completely after six months. However,
stems cut from bellyache bush under high canopy cover at the Channel Island did not cure. This
may be due to the high density canopy cover at that site reducing radiation and wind speed that
resulted in lower temperatures and lower evaporation from cut stems (McArthur and Cheney,
1972; Arno and Ottmar, 1994).
Although cutting of all bellyache bush plants in the early dry season and later burning is an
alternative on fire management, the effect of dry season showers should be taken into account
during the curing period. The consistent dry season showers in May, June, August, September
and October in this study may have contributed to the delayed of curing process. As a
consequence, it caused bellyache bush fuel to stay green during the dry season (Australian Fire
Authorities Council, 2002). The greenness trait is likely to be linked to the high moisture
content of the cut bellyache bush stems. The greenness on the bellyache bush cut stems tends to
reduce fuel flammability in the late dry season burning as stated by Geoffrey et al., 2003;
Burrows, 1994; McArthur and Cheney, 1972). Moisture retention of cut bellyache bush stems

49
may mean it is not a suitable fuel for burning at some sites (Geoffrey et al., 2003) such at
Channel Island site.
The total bellyache bush fuel load at Acacia site was 5.95 t ha-1 of dry matter. The fuel at this
site consisted of 2.7 t ha-1 of fine, 2.1 t ha-1 of medium and 1.1 t ha-1 of coarse stems. Total
bellyache bush fuel at Katherine was 5.4 t ha-1 of dry matter which was made up of 2.5 t ha-1 of
fine, 1.5 t ha-1 of medium and 1.4 t ha-1 of coarse textured material. From this it can be seen that
bellyache bush fuel texture at both study sites is not significantly different from fuels in native
savanna. According to Williams et al. (2001) most savanna fuels are fine fuels less than 6 mm
in diameter and in the range of 2-8 t ha-1 of dry matter per hectare.
High available fuel levels and low fuel moisture levels are likely to result in greater fire
intensity (Cheney, 1981; Sneeuwjagt and Peet, 1985; Burrows, 1994). Therefore, at Acacia and
Katherine higher fire intensity may be expected than could occur at Channel Island. Also, the
difference in land habit at both study sites contributed to the large differences in fuel texture and
load availability. The fuel texture at Acacia was relatively high in fine and medium component
which was likely to cause fire to spread relatively quickly (Burrows, 1994). In contrast, the
Katherine site had a larger proportion of coarse textured stems and a lower fuel load that may
result in a slower rate of fire spread.
The combustion heat yield of bellyache bush cut stems is similar to that found in other plant
materials such as grass and forest fuel in Australia (16,830 kJ/kg) (Luke and McArthur, 1978)
and forest fuel in the US (18,640 kJ/kg) Albini (1976). Therefore it can be concluded that
bellyache bush has the necessary fuel properties that are required to produce a satisfactory fire if
other conditions are favorable.
Although fuel loads differed between Acacia and Katherine, the combination of lengthy curing
time, the low moisture content of the cut stems, the mix of the different of fuel sizes at the sites
and its availability is likely to result in satisfactory burns at both sites. Delaying burning until
late in the dry season when the conditions are hot and the fuel has low moisture will result in
fire of sufficient intensity to achieve a high level of fuel consumption.

50
4.5. Conclusion
Cut stems of bellyache bush monocultures under low canopy cover is more likely to possess
fuel properties that support a successful burn. In addition, approximately half of the fuel at the
study sites was less than 6 mm in texture, with a load of 2-3 t ha-1, which is an ample amount to
support fire during the dry season, especially the late dry season, in northern Australia
(Williams et at. 2001).
However, bellyache bush cut stems under high canopy cover are not likely to be a suitable fuel
for fire if it is still green. Leaf production and re-sprouting of cut stems are indicators to land
managers that stems may still be very moist. Cut stems under this condition may be too moist
for the burning management.
Therefore, the land managers need to cut down a large enough proportion of bellyache bush
plants in the early dry season in order to provide enough fuel biomass, reduce canopy cover to
allow curing and gives longest time to create fuel curing under hot condition. Maximum
temperatures and low humidity during curing period may increase rate of curing in the late dry
season.

51
Chapter 5 – Experiment III. Fire as Control Tool for Bellyache Bush 5.1. Introduction Fire has been traditionally used to control invading woody plant species in East Timor since
1912 (Metzner, 1977) and elsewhere in the world (Hensel, 1923; West, 1965; Kayll, 1974;
Trollope, 1980). Fire has been suggested as a useful tool, either alone or in combination with
other methods, for the control of woody weeds (Bebawi and Campbell, 2002c; Miller et al.,
1981; Miller, 1988). However, East Timorese farmers tend to abandon rather than burn
bellyache bush monoculture (personal observations). The aim of this chapter is to evaluate the
potential for fire, in combination with cutting, for controlling bellyache bush.
According to Bebawi and Campbell (2002c) and Vitelli and Madigan (2004), the effect of fires
on bellyache bush plants depends on the susceptibility of the age structure of the stand. Bebawi
and Campbell (2002c) found fire significantly reduced bellyache bush plant density by 76% in
the first year after burning. The relative sensitivity to fire was found to be seedlings greater than
small plants, and small plants greater than established plants. In addition, West (1965),
Hodgkinson and Harrington (1985) and Lonsdale and Miller (1993) found that fire generally
kills most woody seedlings, but its effect on adult plants varies. Bebawi and Campbell (2002c)
reported that mature bellyache bush plants were quite resistant to fire, the majority of plants re-
growing from the base or stems.
Fire causes plant mortality and stem death due to indirect metabolic changes, and also directly
causing protein denaturation which can alter lipid mobility or chemical decomposition
(Alexandrov, 1964; Levitt, 1972). Burning around the entire circumference of plants may be
effective in destroying the vascular cambium and rupturing cell walls, leading to plant death
(Hare, 1961; Vaster, 1988; Parish et al., 1997). The cambium layer and cell walls are normally
destroyed when the cambium and cells are exposed to temperatures of 60˚C or more (Hare,
1961; Fahnestock and Hare, 1964).
High temperatures generated by the heat of the fire may not be experienced in the soil at depths
of more than 2 cm. Temperatures above 600C occur only between the soil surface and depths of
2 cm. Seeds are protected at greater soil depths, therefore post-fire seedling recruitment occurs
from depths greater than 2 cm (Bradstock and Auld, 1995). In addition, Bebawi and Campbell
(2002d) conducted research on the riparian habitat in the tropics to quantify the effects of late
dry season burning on the seed bank of the bellyache bush infestations. They found “seed
viability was nil for seed under litter cover, but > 80% of seeds placed on bare ground or 2 cm
below ground remained viable”.

52
The impact of fire on plants depends upon fire intensity. Weather conditions during the fire, fuel
load and fuel texture are important determinants of fire intensity (Cheney, 1981). Dense stands
of bellyache bush that have little or no understorey (Braithwaite et al., 1989), do not burn easily.
Wildfires have been observed to go out soon after passing from scattered infestations, where
there was dry understorey fuel, into dense infestations where fuel was disconnected (Miller,
1982).
Although it has been practicable for the East Timorese farmers to use fire to control weed
infestations for a long time, there are also disadvantages of using fire. Burning cannot
completely control the weed, because it re-shoots from some stems, and fire at the beginning of
the wet season can stimulate seed germination.
Therefore, the East Timorese farmers need to incorporate a range of management strategies to
control the seeds that might have survived post-fire treatment. These methods may include
cutting down all bellyache bush trees early in May to prevent flowering, fruiting, seeding and
seed maturation. In addition, burning should be implemented in the late dry season to generate
high fire intensity. The advantages of this combination of treatments are to produce hot fire in
order to kill seeds and new re-shooting plants after cutting. If any plants still survive, then
farmers could use a second fire, weeding and hand-pulling treatments until all seedlings and
surviving plants have been eliminated.
There is a major knowledge gap in the relationship between fire intensity, and subsequent
impact on mature bellyache bush plants, and the effect of fire on seedling emergence. The
objectives of this study therefore were to investigate the intensity of fire that can result from a
fuel bed consisting of mainly cut bellyache bush stems (and relatively little grass) and to
investigate the impact of single late dry season fire of known intensity on plant mortality and
post-fire seedling emergence.
5.2. Material and Methods
5.2.1 Site description
This experimental fire took place in the late dry season in October 2007 at Acacia and
Katherine. The two study sites at Acacia site (12º45’S, 131º09’E) and Katherine (14º22’S,
132º09’E) were located within a dense infestation of bellyache bush, with an average density of
90,000 plants/ha. The Acacia and Katherine sites are described in Chapter 3 and 4, respectively.
The soil type at Katherine site is a sandy loam to sandy clay loam (Day et al., 1979; Fogarty et
al., 1984). The monoculture of bellyache bush was situated amongst a limestone outcrop. The
outcrop was surrounded by dense mission grass (Pennisetum sp) 1.5 m tall, with emergent

53
Eucalyptus confertiflor, E.latifolia, E.tectifica, and Ficus platipoda scattered among the rocks.
There were three plots at Katherine. The first plot was located in the heart of the limestone
outcrop on a flat soil sheet surrounded by rock. The second plot was located amongst shallow
soil lenses amongst limestone outcrop. And the last was a long thin plot located between two
rocky ridges.
5.2.2 Fuel load and consumption.
Fuel loads and fuel texture classes (fine less than 6mm, medium between 6mm-25mm and
coarse greater than 25mm) at both sites have been presented in Chapter 4 (Figure 4.3). For fuel
consumption, 20 pieces of each fine litter (0-6 mm in diameter), medium litter (6-25 mm in
diameter) and coarse litter greater than (25 mm in diameter) were selected from within each
plot. The length of each piece varied between 15 and 25 cm. Each piece of litter was numbered
individually and weighed immediately before burning.
The labelled pieces of litter were retrieved and reweighed immediately after the fires. The
average proportions by weight consumed for the 20 replicate coarse, medium and fine pieces of
litter were then used to calculate the average proportion of biomass consumed for each plot for
each texture class. This value was then used to calculate fuel consumption (t ha-1).
5.2.3 Fire characteristics
Fire intensity was determined using Byram’s fire intensity equation (Byram, 1995), I = Hwr,
where I is fire intensity (kW/m), H is heat yield of fuel (kJ/kg), w is fuel consumed (kg/m²) and
r is rate of fire spread (m/sec).
Samples (0.1 g) of representative dry fuel of each texture class were sent to HRL Technology
Ply Ltd New South Wales for analysis of heat yield using bomb calorimeter (AS 1038.5 leco
350 calorimeter).
Rate of spread was determined using temperature activated time recorders, as described by
Moore et al. (1994). The timers are essentially thermocouples attached to stop watches. Timers
were positioned at three different point sites within each 10m x 10m plot. Thermocouples sense
passing of the fire front and when the fire moves over the particular points and the temperature
exceeds 200°C a small current is generated, which automatically stops the internal stopwatch.
All timers were synchronised before each fire and each one stops as the fire front moves over its
location. The differences in these times were used to calculate the rate of fire spread according
to the trigonometric triangulation formulae of Simard et al., (1994).

54
Plate 5.1. Thermocouple timers used at Acacia and Katherine to measure rate of spread during fire.
5.2.4 Measurement of soil temperature
Soil temperature was measured using iButton programmable temperature sensors (Maxim
Integrated Products Inc, Sunnyvale, California). These sensors record to a maximum of 125oC,
and in this study were programmed to start recording temperatures above 39oC, then buried
several hours prior to the experimental fires (Refer to Appendix C Table 1 and 2).
This measurement of soil temperature was undertaken in the three replicate 10m X 10m fire
plots at each of two sites. Before the fire was ignited, five established plants were selected
randomly within each plot. The iButtons were buried in the soil, beneath the canopy of the five
plants, at 1 to 2 cm depth. All iButtons were retrieved from the soil within 1 – 2 hours after the
passage of the fire.
5.2.5 Impact of burning on plant survival
Within each of the six 10m x 10m plots, 15 individual established plants were cut 30 cm above
the ground and tagged. Another 15 individual plants were tagged and left uncut. Three plots

55
were burnt and three remained unburnt for the control. The location of each plant was marked
with metal tags to facilitate monitoring after burning. Plant height and number of branches were
recorded before imposing the cutting treatment. In the fire plots, all other bellyache bush stems
were cut down and allowed to dry out for several months in order to serve as a fuel. After
burning all individual tagged plants were revisited after three weeks (November 2007) and three
months (February 2008). Surviving individuals, number of re-sprouts, reproductive status and
their heights were recorded during of these visits.
5.2.6. Post fire seed germination and seedling establishment
In order to monitor post-fire seed germination and seedling establishment five 1m x 1m
quadrats (within the 10m x 10m plots) were randomly selected before burning. Seedling
establishment was measured in November 2007 and February 2008 in both burnt and control
plots.
5.2.7. Statistical analysis
Plant survival data did not require analysis due to 100% mortality. Seedling emergence data was
analysed using 3-Factor ANOVA. Factors were: Site (n=2, fixed), Treatments (n=2, fixed) and
Plot (n=3, random, nested in site). The model for analysis of variance is
SITE+TREATMENT+PLOT (SITE) +TREATMENT*SITE+TREATMENT*PLOT. Data were
checked for normality. Full results of ANOVA are presented in Appendix A, while P values are
presented in the text of results.

56
5.3. Results
5.3.1. Fuel load and consumption
Fuel loads ranged from 1.5 to 5.9 t/ha at each plot. There were a high proportion of fine fuels
(almost 50% by mean) at both Acacia and Katherine sites. The fires supported by these fuels
resulted in almost total fuel consumption (Figure 5.1). For fine litter between 86 – 100% of
samples were consumed, for medium 79 – 100% and for coarse 76 – 98% of samples were
consumed.
Figure 5.1. Fuel Consumption (tonnes/ha) at Acacia and Katherine after imposing fire treatment. 5.3.2. Fire characteristics
Despite similar fuel loads (Figure 4.3), fire intensity at Katherine was greater than at Acacia site
(Table 5.1). Rate of spread was also variable within the sites. Rate of spread at Acacia ranged
from 0.0038 - 0.1896 m/sec, while at Katherine ranged from 0.0046 - 0.05932 m/sec (Table
5.1).
Fire intensity varied by one order of magnitude, from a low of 35 kW/m on plot 1 at Acacia, to
1369 kW/m on plot 3 at Acacia.
0 1 2 3 4 5 6 7 8
Litter = < 6 mm
Medium = > 6 to < 25 mm
Coarse = >25 mm
Total
Tonn
es/h
a
Acacia Katherine

57
Table 5.1. Heat of combustion (kJ/kg), fuel consumption (kg/m2), rate of spread (m/s) and fire intensity (kW/m) at each plot at Acacia and Katherine.
SITE Plot H (kJ/kg) w (kg/m2) r (m/s) I (kW/m)
Acacia 1 16800 0.55 0.0038 35
2 16800 0.69 0.0314 366
3 16800 0.43 0.1896 1369
Average for Acacia All 16800 0.56 0.0749 703
Katherine 1 16800 0.56 0.0046 44
2 16800 0.55 0.05932 548
3 16800 0.38 0.0202 128
Average for Katherine All 16800 0.50 0.02610 240
5.3.3. Soil temperature
Soil temperature recorded during burning varied among the study plots. Maximum soil
temperature at Acacia varied from 540C to 1260C (Figure 5.2). Maximum soil temperature at
Katherine varied from 630C to 1260C (Figure 5.3).
Within the sites there was a range of periods for which temperature remained elevated after the
fire (Table 5.2). For example at Acacia temperature remained elevated for between 12.2 minutes
to 22.1 minutes after the fire. At Katherine temperature remained elevated for between 3.3
minutes to 22.6 minutes after the fire.
There was no relationship between Byram’s fire intensity and maximum temperature change
(Table 5.3). No relationship between fuel load, rate of spread and maximum temperature change
was found.

58
Plot 1
0
20
40
60
80
100
120
140
1 621 1241 1861 2481 3101 3721 4341 4961 5581 6201 6821 7441
Time (sec)
Tem
pera
ture
(0C
)
iButton a iButton b iButton c iButton d
Plot 2
0
20
40
60
80
100
120
140
1 551 1101 1651 2201 2751 3301 3851 4401 4951 5501 6051 6601
Time (sec)
Tem
pera
ture
(0C
)
iButton a iButton b iButton c iButton d
Figure 5.2. Soil temperature - time profiles at Acacia. Note that there were original 5 iButtons at each plot, but some iButtons failed.
Plot 3
0 20 40 60 80
100 120 140
1 835 1669 2503 3337 4171 5005 5839 6673 7507 8341
Time (sec)
Tem
pera
ture
(0C
)
iButton a iButton b iButton c iButton d iButton e

59
Plot 1
0
20
40
60
80
100
120
140
1 317 633 949 1265 1581 1897 2213 2529 2845 3161 3477
Time (sec)
Tem
pera
ture
(0C
)
iButton a iButton b
Plot 2
0
20
40
60
80
100
120
140
1 337 673 1009 1345 1681 2017 2353 2689 3025 3361 3697 4033
Time (sec)
Tem
pera
ture
(0C
)
iButton a iButton b iButton c iButton d
Plot 3
0
20
40
60
80
100
120
140
1 330 659 988 1317 1646 1975 2304 2633 2962 3291 3620 3949
Time (sec)
Tem
pera
ture
(0C
)
iButton a iButton b iButton c
Figure 5.3. Soil temperature – time profiles at Katherine. Originally there were 5 iButtons in each plot but some failed.

60
Table 5.2. Summary soil temperature – time profiles at Acacia and Katherine.
Site Plot
Pre-fire
temperature
(1.00pm) Max temp
5% below max
temp (ºC).
Duration at 5%
of max (minute)
Acacia 1 45.0 104.7 99.4 15.3
2 47.3 98.8 93.9 22.2
3 41.5 94.9 90.2 12.2
All plots 44.6 99.5 94.5 16.6
Katherine 1 19.4 53.3 50.6 3.3
2 36.7 81.7 77.6 13.5
3 36.1 97.5 92.6 22.6
All plots 30.7 77.5 73.6 13.1
Table 5.3. Summary of fuel load consumption, soil temperature, rate of spread and fire intensity at Acacia and Katherine.
Site Plot Fuel load
consumption
Soil temperature Rate of
spread
Fire intensity
1 5.5 t/ha 104.7 0C 0.003 m/sec 35 kW/m
2 6.9 t/ha 98.8 0C 0.031 m/sec 366 kW/m
Acacia
3 4.3 t/ha 94.9 0C 0.189 m/sec 1369 kW/m
1 5.6 t/ha 53.3 0C 0.005 m/sec 44 kW/m
2 5.5 t/ha 81.7 0C 0.0593 m/sec 548 kW/m
Katherine
3 3.8 t/ha 97.5 0C 0.020 m/sec 128 kW/m

61
5.3.4. Plant mortality
Fire treatments completely killed all established plants, small plants and seedlings at both sites
(Table 5.4). In comparison, mortality in control plots for established plants was just 3%, small
plants 12% and seedlings 67% at Acacia and 0% of established plants, 10% of small plants and
30% of seedlings at Katherine. There was no recovery of plants post-fire when monitored in
February 2008.
Table 5.4. Bellyache bush plant survival after late dry season (October) fire. Plant survival was monitored in November 2007.
Site Established plants Small plants Seedlings
Treatment Fire Control Fire Control Fire Control
Acacia 0 0.97 + 0.01 0 0.88 + 0.05 0 0.33 + 0.10
Katherine 0 1.000 + 0 0 0.90 + 0.09 0 0.70 + 0.10
5.3.5. Seed germination and seedling establishment
ANOVA of seedling emergence post fire (February 2008) detected no significant effect of site
(P = 0.675) or treatment (P= <0.927), but there were significant effects of plot (P = <0.001), the
interaction between site and treatment (P= <0.001) and the interaction between treatment and
plot (P= 0.008) (Appendix A, Table 10). This was due to seedling emergence being higher in
the burnt plots at Acacia, while at Katherine it was higher in the control plots (Figure 5.4). Also,
on one burnt plot at Acacia seedling emergence was significantly higher than all other plots in
both treatments. In summary, there was no simple relationship detected between burning and
seedling emergence.

62
(A)
0
5
10
15
20
25
30
35
October. 2007 November. 2007 February. 2008
Mea
n se
edlin
g em
erge
nce
(m-2
)
Fire Control
(B)
0
5
10
15
20
25
30
35
40
October. 2007 November. 2007 February. 2008Mea
n se
edlin
g em
erge
nce
(m-2
)
Fire Control
Figure 5.4. Bellyache bush seedling emergence (m-2) before and after fire at (A) Acacia and (B) Katherine. Seedling emergence was monitored before burning in October 2007 and after burning in November 2007 and February (2008).
Fire
Fire

63
Plate 5.2. Top picture: The cut stems of bellyache bush monoculture at Acacia before burning in October 2007. Lower picture: Bellyache bush monoculture in the same plot was completely replaced by grass four months after burning, February 2008.

64
Plate 5.3. Top picture: The cut stems of bellyache bush monoculture at Katherine before burning in October 2007. Lower picture: Bellyache bush monoculture in the same plot was completely replaced by grass four months after burning, February 2008.

65
5.4. Discussion
All bellyache bush fuels in the treated plots were completely consumed by the experimental
fires. This was due to a combination of sufficient curing time, low moisture content of the cut
stems, the mix of the different of fuel sizes at the burning plots (particularly the proportion of
fine fuels) and its compactness which supported the management fire and the fire weather at the
time of burning. During the late dry season, midday temperatures are 35-400C and mean relative
humidities 10-20%. Furthermore, winds, especially midday and afternoon winds are on average
faster in the late dry season than in the early dry season (Williams et al., 1998). This
combination of factors may contribute to the suitable condition for the fire to consume most
bellyache bush fuels, even that in large stem size classes.
Although bellyache bush fuel was completely consumed, fire intensity of bellyache bush fuel
was low, compared with other studies in the tropical savanna. This may have been due to woody
fuels from the cut bellyache bush stem impeding rate of spread compared with grass fuels
(Bradstock and Auld, 1995). In addition, the dense stands of bellyache bush, with little or no
understorey do not burn easily as stated by Braithwaite et al. (1989). Therefore, fire intensity at
Acacia and Katherine was only702 kW/m and 240 kW/m respectively. In contrast to this study,
fire intensity reported in tropical savanna regions is very high in the late dry season, for instance
7700 k/W/mhas been reported (Williams et al., 1998).
Soil temperature recorded during burning varied among the study plots. Maximum soil
temperature varied from 54.170C to 126.130C. Within a site there was a range of periods for
which temperature remained elevated after the fire between 3.3 minutes to 22.6 minutes. There
was no relationship established between Byram’s fire intensity maximum temperature changes,
nor between fuel load, rate of spread and maximum temperature in this study. The results of this
study differed from that of Bradstock and Auld (1995). According to Aston and Gill, 1976;
Auld, 1986; Hodgkinson and Oxley, 1990; Dimitrako-Poulous and Martin, 1990; Steward et al,
there are positive relationship between fuel consumption on the ground and soil temperature.
Generally, where more fuel was consumed on the ground it significantly influenced soil
temperature to increase (Aston and Gill, 1976; Dimitrako-Poulous and Martin, 1990). By
contrast in this study, although bellyache bush fuels were completely consumed but soil
temperature was low compared to other fires reported in tropical savanna. This is probably due
to the texture of woody fuels typical of bellyache bush at the study site having a lower
proportion of fine fuel and medium fuel than the sites reported by other authors. In addition, in
some plots bellyache bush fuel was patchy which reduces the intensity of the fire and the heat of
the fire which results in lower effect on soil temperature (Bradstock and Auld, 1995).
Although fire intensity was generally low at the study plots, established plants, small plants and
seedlings were completely killed. The important information revealed in this study was, 100%

66
plant mortality was achieved where there was 5.95 t/ha of bellyache bush fuel, compared to 9.5
t/ha of fuel load in the study of Bebawi and Campbell (2002c). Although fuel load of bellyache
bush monoculture was only 5.95 t/ha, it produced a maximum soil temperature almost 1000C
compared to 930C reported by at the Bebawi and Campbell study.
In contrast to the deleterious impact on established plants, small plants and seedlings, fire
stimulated post fire seedling emergence at Acacia. Markedly more seedlings emerged in burnt
plots than in the unburnt plots. This is may be due to the influence of the fire may not be
experienced in the soil at the depths of more than 2 cm. Seeds laid more than 2 cm deep may be
protected as stated by Bebawi and Campbell, 2002d) in their study. No viable remained under
litter cover, but more than 80% of bellyache bush seeds placed on bare ground or 2 cm below
ground remained viable (Bebawi and Campbell, 2002d). As a consequence, more seedling
emergence was present in the greater number in the burnt plots compared to the unburnt plots
(Bradstock and Auld, 1995).
Statistical analysis in this study indicated seedling emergence was higher in the unburnt plots at
Katherine, while at Acacia it was greater in the burnt plots. This may have been due to
bellyache bush plants growing as a monoculture at Katherine, with and no grass beneath
bellyache bush canopy to compete with seedlings. As a consequence, seedling emergence at
unburnt plots was higher than at burnt plots. This finding was similarly to the Vogler and Keir
(2005) observation, “Higher seedling densities (300-400 seedlings m-2) were recently recorded
under dense canopies of bellyache bush”. In contrast, bellyache bush at Acacia growing mixture
with other exotic grass and plants in the burnt and unburnt plots. This unsuitable condition and
environment may suppress and smother seedlings, therefore it was less present at Acacia site
(Roche et al., 1998).
In addition, Bebawi and Campbell (2002d) also reported that fire stimulated seedling emergence
in their burnt plots. They recorded density of 368000 seedlings per hectare compared with 2700
seedlings per hectare in this study. Although the density of seedlings reported in the study of
Bebawi and Campbell (2002d) was much higher compared to this study, 2700 seedlings per
hectare is still may reestablish again. This level of establishment could be more than enough to
cause rapid re-infestation of a site.
The reason for the increased seedling emergence of bellyache bush in burnt plots remains to be
clarified. Possible contributing factors include direct effects that stimulate seed germination and
there are indirect effects that provide a more favorable environment for germination to occur,
such as the removal of competition or shading. Direct effects following burning are generally
attributed to the exposure of seeds to high temperature (Roche et al., 1998).
In this study it was found that grass establishment dominated in the burnt plots. Bellyache bush
monoculture was completely changed to grassland after fire, particularly gamba grass

67
(Andropogon gayanus) and mission grass (Pennisetum polystachin). The presence of gamba
grass and mission grass in the burnt plots may viewed as a positive or a negative depending on
the perspectives. The greater proportion of new gamba grass and mission grass post fire may be
viewed as a tool (mulch) in the agricultural sector in East Timor to suppress and smother other
weeds includes bellyache bush seedlings. In addition, gamba grass growth builds up fuel
biomass which will allow follow up management fires to be used. Moreover, in East Timor
grazing can be provided by gamba grass to cattle following the burning of bellyache bush.
However, new gamba grass and mission grass may alter all three determinants of savanna
function namely: nutrient and water availability and fire regime (Rossiter, 2007). In addition,
the presence of new gamba grass and mission grass may become problems with management of
new suites of weed species (Rossiter, 2007).

68
5.5. Conclusion
Bellyache bush is amenable to management by cutting and burning, when it is sufficiently cured
by the late dry season, and then completely consumed during burning. The effectiveness of this
control method is enhanced by late dry season conditions such as midday temperatures of 35-
400 C and mean relative humidities 10-20% at the time of burning.
Fire intensity of bellyache bush fires in this study was low compared with other studies in the
tropical savanna at Acacia 702 kW/m and Katherine 240 kW/m compared to 7700 kW/m in late
dry season burning reported at the Kapalga study site (Williams et al., 1998).
Maximum soil temperature does not seem to depend on Byram’s fire intensity and rate of
spread, possibly due to the completeness of fuel consumption.
Bellyache bush plants as established plants, small plants and seedlings were all susceptible to
fire although the soil temperature and fire intensity was low at the study sites. However, fire
stimulated post-fire seedling emergence. Significant seedling emergence was found in the burnt
plots compared with the controlled plots. Even though the majority of these seedlings died
within two months, 2700 seedlings per hectare remained in February, enough to cause re-
infestation in following years.
Therefore, managers need to plan for the post burning management of seedling emergence. This
could include second and subsequent burning treatments. Further research is needed to
determine how long bellyache bush seeds persist in the soil under different canopy cover
conditions for extended periods after burning. Such studies will provide a better understanding
of the management effort that is needed to prevent re-infestation in low and high canopy cover,
after cutting and burning.

69
Chapter 6 – General Discussion and Recommendations
6.1. Model for bellyache bush management
The common practice to control bellyache bush infestations in East Timor is by using
mechanical and burning control. Mechanical control such as cutting and cutting in combination
with mulching of established plants, hand pulling and mulching of small plants and mulching of
seedlings are traditional methods and are the cheapest to apply. The merits of these control
methods are that the land managers do not rely on the chemical, biological and modern
machinery. This is due to chemicals being very expensive and farmers need to buy both the
chemical and appropriate equipment for application. Money is needed for biological control to
establish appropriate laboratory facilities to test the agents before release onto bellyache bush
infestations. Biological control trials are underway, but are not yet proven.
Although mechanical and burning controls are considered as the cheapest control methods, there
are problems associated with these methods for example they may not achieve a complete kill.
Therefore, the objectives of this study were to define the strength and weaknesses of using these
control methods. From understanding these strength and weaknesses the managers can build up
a better model to control bellyache bush in the future.
The results of this study revealed that, the use of a simple machete to cut bellyache bush plants
at 0cm and 10cm height from ground level completely killed established plants irrespective of
canopy cover. In addition, under low canopy cover plants were also completely killed by the
20cm, 30cm and 40cm cutting treatments. These higher cutting treatments involve less effort for
the land manager than cutting at ground level. The use of straw mulch at 1 kg per m2 did not
alter the kill rate for cut stems. Hand pulling immediately killed all small plants. The use of
mulch was significant in killing seedlings in the end of the dry season, although some seedlings
persisted.
This study has confirmed that, bellyache bush can be used as a fuel for management fires to
control bellyache bush plants. Bellyache bush fuel was completely cured after six months of the
imposed cutting treatment and this fuel was able to carry a suitable fire. The fire treatment
completely consumed the bellyache bush fuel in the burn. The established plants, small plants
and seedlings of bellyache bush were all completely killed by the fire fuelled by cured bellyache
bush.
Although mechanical control completely killed established plants where cutting was used under
low canopy cover, where hand pulling of small plants and burning on all stratums of bellyache
bush, there are still many disadvantages of using these methods. For example, mechanical
control is highly laboured intensive and only feasible for small areas. Only cutting stems at 10

70
cm completely killed established plants, but under shaded conditions cut stems still re-sprout if
cut above 10 cm heights.
Bellyache bush fuel had high moisture content (70%), particularly at the time of cutting stems;
therefore it needs to be cut early in the dry season (May) to ensure time for the fuel to cure.
Some stems under shade still remained green and moist throughout the dry season.
The results of this study shows that fire fuelled by cut bellyache bush only produced low soil
temperatures, rate of spread and fire intensity. As a consequence of low soil temperatures, fire
did not kill seeds, which Bebawi and Campbell (2002d, 2007) found were buried 2 cm deep in
the soil. Therefore post-fire, seedlings emerged in great numbers. The use of fire may not solve
this problem for the landholders as seeds can remain viable in the soil for up to 4 years (Bebawi
and Campbell, 2002d).
From the findings it seems that cutting in combination with burning could be implemented in
agro-environmental conditions in East Timor due to climate similarity to the Northern Territory,
particularly at study sites such as Acacia and Katherine (See East Timor’s Weather at Appendix
B, Table 4). In addition, most land in East Timor includes open areas and experiences more
direct heat and radiation during the dry season, therefore allowing fuel curing for the burning
implementation.
To obtain best results for the control of bellyache bush the following is a mechanical and
burning model based on reproductive and vegetative phenology which will be suggested to
landholders to use to control bellyache bush monoculture in the first and second management
burns (Figure 6.1).

71
Figure 6.1. A schedule of bellyache bush phenology and a model for management actions
Jan Feb Mar Apr May Jun Jul Aug Sep Oct Nov Dec.
Rainfall (Bureau of meteorology 2007)
Bellyache bush phenology
Flowering and fruiting (Hussey et al. 1997; Vitelli, 1998).
Fruit ripening, seed shed and maturing (APB Infone 1994)
Seedling recruitment (Parson and Cuthbertson, 1992).
Established plants leaf flush (Personal observation, 2007)
Established plants leaf defoliation (Personal Observation, 2007).
Management actions - First Year
Slash bellyache bush plants
Curing
First burning
Seed emergence after burning
Management actions - Second Year
Seed emergence after burning
BB monoculture replaced by grasses
Second burning
Note: First and second burning depends on the curing development and its dryness of cut stems.

72
6.2. Future research
It has been postulated in this study that cutting established plants before flowering and seed
production, followed by burning after cut stems have cured will lead to some depletion of the
seed bank by the germination in the next wet season. The question remaining is how the seed
bank and seedling emergence will be managed after the removal of established plants by fire.
Therefore, future research will need to address the subsequent management of seed bank
persistence, including gaining information on how long bellyache bush seeds persist in the soil
under different canopy cover after cutting, hand-pulling, and fire. Possible solutions are
managing seedling emergence by either suppressing to prevent establishment or by encouraging
seed bank depletion.
Cover may be manipulated to promote or reduce seedling emergence, for example cover crops
such as macuna bean or other scrambling crops may be able to be used to return land to
productivity while suppressing bellyache bush seedling establishment.
Establishment of other vegetation after fire, for example, grass cover as occurred after burning
in this study. The grass may provide a valuable fodder for cattle and small ruminants in East
Timor but would need to be managed to prevent overgrazing which frequently results in woody
weed invasion.
Further work is required investigating other fire regimes. For example cooler fires (i.e. earlier
time of burns, lower fuel loads) may be sufficient to manage bellyache bush infestation.
Finally, the results of this study as well as these proposed studies must be evaluated on the
ground in East Timor in collaboration with East Timorese land managers.

73
References
Adams, J. S. (1997). ‘Mulching improving early growth of four oak species in plantation
establishment’, Southern Journal of Applied Forestry 21, 44-46.
Albini, F. A. (1976). Estimating Wildland Fire Behaviour and Effects, USDA Forest Service,
General Technical Report, GTR-INT 30.
Alexandrov, V. Y. (1964). Cytophysiological and cytoecological investigations of heat
resistance of plant cells toward the action of high and low temperature, Quarterly Review of
Biology 39: 35-77.
Anderson, H. E. (1985). Moisture and fire forest fuel response, pp. 192-199, in Proceedings of
8th Conference on Fire and Forest Meteorology (American Meteorology Society).
Anon, (1994). Rubber Vine and Noxious Weeds, Mitchell River Watershed Management Short
Report No.3. Rural Lands Protection Board Agenda paper (Weeds in the Mitchell River
Catchments), July 1994. pp. 54-63.
Anon, (1996). ‘Field day warns of bellyache bush danger’, ‘Bowen Independent’ newspaper
report. 18 October 1996, p.7.
APB Infonote. (1994). Agriculture Protection Board of Western Australia Infonote 11/94
AGDEX 647.
Arno, S. F., and Ottmar, R. D. (1994). Reintroduction of fire into forest of eastern Oregon and
Washington. In: Everett, R. L. (Comp), Vol. IV: Restoration of Stressed Sites and
Processes. USDA For. SERV. Gen. Tech. Rep. PNW-GTR-330, pac. Northwest Res. Stn.,
Portland, pp. 65-67.
Ashley, M. (1995). ‘The biology and management of Jatropha gossypifolia’, In: (ed. C.
Wilson), Northern Territory Department of Primary Industries and Fisheries Technical
Bulletin No. 234. Weed identification and control workshop Nusa Cendana University.
Aston, A. R. and Gill, A.M. (1976). Coupled soil moisture, heat and water vapour transfers.
Australian Journal of Soil Research, 14, 55-66.
Auld, T. D. (1986). Population dynamics of the shrubs Acacia suaveolens (Sm.). Fire and the
transition to seedlings. Australian Journal of Ecology, 11, 373-386.
Australian Fire Authorities Council. (2002). Wildfire Behaviour 3. Prepared by Australian Fire
Authorities Council.
Beattie, A. J. (1985). The Evaluation Ecology of Ant-Plant Mutualisms, Cambridge University
Press, London.

74
Bebawi, F. F. and Campbell, S. D. (2002a,). ‘Seed dispersal of a myrmecochorous weed,
bellyache bush (Jatropha gossyiifolia) in riparian landscapes of northern and central
Queensland’, In Proceedings of the Royal Society of Queensland, Landscape Health in
Queensland Symposium, 17-18 November 2000, Brisbane.
Bebawi, F. F. and Campbell, S. D. (2002b). The response of bellyache bush (Jatropha
gossypifolia) plants cut off at different heights and seasonal times. Tropical Grasslands 36,
65-68.
Bebawi, F. F. and Campbell, S. D. (2002c). Impact of fire on bellyache bush (Jatropha
gossypifolia) plant mortality and seedling recruitment. Tropical Grasslands 36, 129-137.
Bebawi, F. F. and Campbell, S. D. (2002d). Effects of fire on germination and viability of
bellyache bush (Jatropha gossypifolia) seeds. Australian Journal of Experimental
Agriculture 42, 1063-9.
Bebawi, F. F. and Campbell, S. D. (2004). Interaction between meat ants (Iridomyrmex spadius)
and bellyache bush (Jatropha gossypifolia). Australian Journal of Environmental
Agriculture 44, 1157-64.
Bebawi, F. F., Davis, K. and Lockett, C. (2005a). Bellyache bush (Jatropha gossypifolia)
biocontrol potential- preliminary results. Proceedings of the 8th Queensland Weed
Symposium. Weed Management-Making a Difference, ed, W.D. Vogler, pp. 78. (Weed
Society of Queensland, Brisbane).
Bebawi, F. F., Mayer, R. J.and Campbell, S. D. (2005b). Flowering and capsule production of
bellyache bush (Jatropha gossypifolia) in northern Queensland. Plant Protection Quarterly
20, 129-32.
Bebawi, F. F., Vitelli, J., Campbell, S. D. and Madigan, M. (2004). Integrated control methods
for bellyache bush (Jatropha gossypifolia) in northern Queensland: Preliminary results.
Proceedings of the 14th Australian Weed Conference, eds B.M. Sindel and S.B. Johnson, pp.
150-152. (Weed Society of New South Wales, Sydney).
Bebawi, F. F., Vitelli, J. S., Campbell, S. D., Vogler, W. D., Lockett C. J., Grace, B. S.,
Lukitsch, B., and Hear, T. A. (2007). The biology of Australian weeds 47. Jatropha
gossypifolia L. Tropical Weeds Research Centre, Department of Natural Resources and
Water, Charters Towers, Queensland 4820. Australia.
Bellot, J., Ortiz de Urbina, J. M., Bonet, A. and Sanchez, J. R. (2002). ‘The effect of tree
shelters on the growth of Quercus coccifera L. seedlings in a semiarid environment’,
Forestry 75, 89-106.

75
Berg, R. (1975). Myrmecochorous plants in Australia and their dispersal by ants. Australian
Journal of Botany 23, 475-508.
Biological Branch Annual Report. (1988). Edited by B. J. Wilson and N.Riding. Queensland
Department of Lands.
BoDD. (2004). Euphorbiaceae. Botanical Dermatology Database, http:// bodd.cf.ac.uk.
Bowman, D. M. J. S. & Wilson, B. A. (1988). Fuel characteristics of coastal monsoon forests,
Northern Territory, Australia, Journal of Biogeography 15: 807-817.
Bradstock, R. A., and Auld. (1995). Soil temperatures after the passage of a fire- do they
influence the germination of buried seeds. Australian Journal of Ecology. 21, 106-109.
Braithwaite, R. W., Lonsdale, W. M. and Estbergs, J. A. (1989). Alien vegetation and native
biota in tropical Australia: the spread and impact of Mimosa pigra. Biological Conservation
48, 189-210.
Bureau of Meteorology. (2004). Annual Report on Rainfall Bulletin, Northern Territory
Department of Primary Industries and Fisheries 453, 89-98.
Burger, D. W., Forister, G. W. and Kiehl, P. A. (1996). ‘Height, calliper growth, and biomass
response of 10 shade tree species to tree shelters’, Journal of Arboriculture 22, 161-166.
Burkill, H. M. (1994). The useful plants of West Tropical Africa. Volume 2, pp. 636. (Royal
Botanic Gardens, Kew, UK).
Burrows, N. D. (1994). Experimental development of a fire management model for jarrah
(Eucalyptus marginata) forest. Ph.D. Thesis. Australian National University, Canberra.
Byram, G. M. (1959). Combustion of forest fuels. In Forest Fire: Control and Use, ed. Davis,
K. P., pp. 61-89. New York: McGraw-Hill.
Chadhoker, F. A. (1978). Weed problems in grazing lands and control of some problem weeds
in the Markham valley of Papua New Guinea. PANS 24, 63-6.
Cheney, N. P. (1981). Fire behaviour. In: Gill, A. M., Groves, R.. H., and Noble, I. R. (Eds.),
Fire and the Australia Biota. Australian Academy of Science, Sydney, pp. 151-176.
Csurhes, S. and Edwards, R. (1998). Potential Environmental Weeds in Australia; candidate
species for preventative control. Biodiversity Group (National Weeds program),
Environmental Australia, Canberra.
Csurhes, S. M. (1999). Bellyache bush (Jatropha gossypifolia) in Queensland, Pest Status
Review Series – Land Protection Branch, Queensland Department of Natural Resources and
Mines, Brisbane.

76
Culver, D. C. and Battie, A. J. (1980). The fate of viola seeds dispersed by ants. American
Journal of Botany. 67, 710-714.
Da Costa, H., Piggin, C., Da Cruz, C. J, and James, Fox, J. (2002). Agriculture: New Directions
for a New Nation East Timor (Timor-Leste), Proceedings of a Workshop 1-3 October 2002,
Dili, East Timor. ACIAR Proceedings No. 113.
Das, B. and Das, R. (1994). Medicinal properties and chemical constituents of Jatropha
gossypifolia Linn. Indian Drugs 31, 562-570.
Datta, N. (1967). In IOPD chromosome number reports XII. Taxon 16, 341-50.
Day, K. J, Harrison, C. J and Van Cuylenburg. (1979). Land resources of the Wildman River
Station, Northern Territory, Land Conservation Unit, Territory Parks and Wildlife
Commission, Darwin.
Dayananad, Singh, K. N. and Agrawal, K. N. (1977). Effect of varieties, soil covers, forms of
nitrogen and seed soaking on the uptake of major nutrients (N, P, K) in late sown wheat.
Indian Journal Agronomy, 22: 96-98.
De Datta, S. K., and Barker, R. (1975). Economic evaluation of modern weed control
techniques in rice. In: Symposium on the Integrated Control of Weeds, Tokyo, Japan.
Dehgan, B. and Webster, G. L. (1979). ‘Morphology and infragenic relationship of the Genus
Jatropha (Euphorbiacea)’, Botany, vol. 74, pp 1-73.
Dehgan, B. (1982). Novel Jatrophas for Florida landscapes. Proceedings of the Florida State
Horticultural Society 95, pp. 277-280.
Deghan, B. (1983). Propagation and growth of Cycads. A conservation strategy. Proceedings
Florida Sate Horticultural Society 96, 137-9.
Dimitrako-Poulous, A. P. and Martin, R. E. (1990). Measuring and modelling soil temperature
profiles during simulated wildland fire conditions. Proceedings of the International
Conference on Forest Fire Research, Coimbra, Portugal, B.21-1-15.
Dyer, R., Jacklyn, P., Partridge, I., Russell-Smith, J. & Williams, R. (2001). Savanna burning:
understanding and using fire in northern Australia, p.19. Tropical Savannas CRC, Darwin.
Ellis, R. H., Hong, T. D. and Roberts, E. H. (1985). Handbooks for Genebanks No.3.
Handbooks for Seed Technology for Genebanks, Volume II. Compendium of Specific
Germination Information and Test Recommendations. International Board for Plant Genetic
Resources, Rome.
Everist, S. L. (1974). Poisonous plants of Australia. (Angus Robertson, Sydney).

77
Fahnestock, G. R. and Hare, R. C. (1964). Heating of Tress Trunks in Surface Fires, Journal of
Forestry November, 1964.
Fogarty, P. J, Lynch, B, and Wood March, B. (1984). The Land Resources of the Elizabeth,
Darwin and Blackmore Rivers, Land Conservation Unit of the Northern Territory, Darwin.
Geoffrey, C., David, L., Stephen, D. (2003). Australian Burning: Fire Ecology, Policy and
Management Issues. CSIRO, Collingwood Victoria.
Goudriaan, J. (1977). Crop Micrometeorology: A Simulation Study, Center for Agriculture
Publication Documentation, Wageningen, The Netherlands.
Hare, R. C. (1961). Heat Effects on Living plants. United States Forest Service Occasional
Paper 183.
Harley, K. L. S. and Forno, I. W. (1992). Biological Control of Weeds: A Handbook for
Practitioners and Students, Inkata Press, Melbourne.
Haywood, J. D. (1999). ‘Durability of selected mulches, their ability to control weeds, influence
growth of loblolly pine seedlings’, New Forests, vol. 18, pp 263-277.
Henning, R. (1996). Combating desertification: the Jatropha project of Mali, West Africa (from:
Arid Lands Newsletter, No. 40 (Fall/Winter), Part 1: Africa and the Mediterranean).
Hensel, R. L. (1923). Recent studies on the effect of burning on grassland vegetation. Ecology
4, 183-188.
Hodgkinson, K. C. and Harrington, G. N. (1985). The case for prescribed burning to control
shrubs in eastern semi-arid woodlands. Australian Rangeland Journal 7, 64-74.
Hodgkinson, K. C. and Oxley, R. E. (1990). Influence of fire and edaphic factors on
germination of the arid zone shrubs Acacia aneura, Cassia nemophila and Dodonaea
viscose. Australian Journal of Botany, 38, 269-279.
Horviz, C. C. (1981). Analysis of how ant behaviours affect germination in tropical
myrmecochore Calathea microencephala (P. and E.) Koernicke (Marantaceae): microsite
selection and aril removal by neotropical ants, Odontomachus, pachychondyla and
solenopsis (Formicidae) Oecologia 51, 47-52.
Howard, R.A. (1989). Flora of the Lesser Antilles, Leeward and Windward Islands,
Dicotyledoneae. Part 3. Vol. 6. Arnold Arboretum, Harvard University, Jamaica Plain, MA.
P. 658.
Hughes, G. and Madden, L. V. (2002). Evaluating predictive models with application in
regulatory policy for invasive weeds. School of Biological Sciences, University of
Edinburgh, West Mains Road, Edinburgh EH9 3JG, UK.

78
Hussey, B. M. J., Keighery, G. J., Cousens, R. D., Dodd, J. and Lloyd, S. G. (1997). Western
Weeds: a guide to the weeds of Western Australia. The Plant Protection Society of Western
Australia Inc. Victoria Park, Western Australia, Perth.
Jeffrey, P. (1998). Declared Plant Control Handbook, 5th edn., Miscellaneous Publication 4/98,
Agriculture Western Australia, Perth.
Johnson, A. (2002). North Australian Grassland Fuel Guide. The Bushfires Council Northern
Territory, the TS-CRC, and the Northern Territory Department of Business, Industry and
Resource Development, Darwin.
Joubert, P. H., Brown, J. M. M., Hay, I. T. and Sebata, P. D. B. (1984). Acute poisoning with
Jatropha curcas (purging nut tree) in children’, South African Medical Journal, vol. 5, pp.
729-730.
Kantor Statistik Propinsi (Provincial Statistics Office) (1996). Indikator Ekonomi: Timor-Timur,
Kerjasma Kantor Statistik Propinsi dan Bappeda Tk1 Tim-Tim. Dili.
Kayll, A.J. (1974). Use of fire in land management. In Fire and Ecosystems, (T.T. Kozlowski
and C. E. Ahlgren eds), pp. 483-511. New York: Academic Press.
Kingsbury, J. M. (1964). Poisonous Plants in the United States and Canada, Prentice-Hall, Inc.,
Englewood Cliffs, NJ, pp. 182-197.
Kleinschmith, H. E. and Johnson, R. W. (1987). ‘Weeds of Queensland’. (Queensland
Department of Primary Industries, Bribane).
Kramer, P. J. and Kozlowski, T. T. (1979). Physiology of Woody Plants, Academic Press, New
York.
Labradal, R., Caseley, J. C. and Parker, C. (1994). Weed Management for Developing
Countries, FAO, Rome.
Lal, R. (1975). Role of mulching techniques in tropical soil and water management. Tech. Bull.
1, IITA, Ibadan, p.38.
Lal, R., Wilson, G. F., and Okigbo, B. N. (1978). No-till farming after various grasses and
leguminouse cover crops in tropical Alfisol. I. Crop performance. Field Crop research. 1,
71-84.
Lavabre, E. M. (1991). Weed Control, London (United Kingdom): Macmillan. Tropical
Agriculturalist 90, 6156.
Lawson, T. L and Lal, R. (1979). Response of maize to surface and buried straw mulch on a
tropical Alfisol. In: Lal, R (ed). Soil Tillage and Crop Production. Proceedings Series 2, 63-
74. IITA, Ibadan, Nigeria.

79
Lee, S. S., Estes, G. O. and Wells, O. S. (1978). Effects of slitted polythene mulches on soil
temperature and yield of sweet corn. Canada Journal Plant Science 58, 55-61.
Levitt, J. (1972). Response of Plants to Environmental Stresses, New York: Academic, 306-398.
Liogier, H. A. (1990). Descriptive flora of Puerto Rico and adjacent islands. Spermatophyta 2,
481.
Lonsdale, W. M and Miller, I. L. (1993). Fire as a Management Tool for a Tropical Woody
Weed: Mimosa pigra in Northern Australia. Journal of Environmental Management 39, 77-
87.
Luke, R. H, and McArthur, A. G. (1978). Bush Fires in Australia. Australian Govt. Pub. Serv.
Canberra.
Metzner, J. K. (1977). Man and Environment in Eastern Timor, The Australian National
University, Canberra.
Miller, I. L. (1988). Aspects of the biology and control of mimosa pigra L. M.Sc.Agr. thesis.
University of Sydney.
McWilliam, A. (1995). Rhetoric and reticence: Notes on the anthropology of development in
West Timor. Journal of African and Asian Studies 2 (1): 138-150.
Miller, I. L., Nemestothy, L. and Pickering, S. E. (1981). Mimosa pigra in the Northern
Territory. Technical Bulletin No. 51. Department of Primary Production Division of
Agriculture and Stock.
Miller, I. L. (1982). Weeds in Northern Territory: current situation and future directions.
(Northern Territory Department of Primary production, Division of Agriculture and Stock,
Darwin).
Minister for Agriculture, Fisheries and Forestry (MAFF). 2001. Australia signs quarantine
agreement with East Timor, Media Release AFFA01/212WT, 9 August 2001.
Mayhead, G. J. and Boothman, I. R. (1997). ‘The effect of tree shelter height on the early
growth of sessile oak (Quercus petraea (matt) Liebl.)’, Forestry, vol. 70, pp. 151-155.
McArthur, A. G., Cheney, N. P. (1972). Source notes on forest fire control. Unpublished
Report. Canberra: Forest Research Institute, Australia Forest and Timber Bureau, Canberra.
McGiffen, M. E. (1997). Weed Management in Horticultural Crops, ASHS Press, Alexandria.
Mohler, C. L,. and Teasdale, J. R. (1993). Response of weed emergence to rate of Vicia villosa
Roth and Secale cereale L. residue. Weed Research. 33, 487-499.
Mohr, H. and Schopfer. (1994). Plant Physiology. Biochemistry and Physiology Department.
Harpenden, UK.

80
Moore, H. R., Richard, J., Williams, A., Malcolm Gill and Peter. (1994). Fire in Tropical
Savanna. Ecological Studies Analysis and Synthesis 169, 33-46.
Norman, J. M. and Campbell, G. S. (1983). Application of a plant environmental model to
problems in irrigation. In Advances in Irrigation (ed. D. Hillel), Academic Press, New
York, Vol. 2, 155-188.
Ogbobe, O. and Akano, V. (1993). The physico-chemical properties of the seed and seed oil of
Jatropha gossypifolia. Plant Foods for Human Nutrition 43, 197-200.
Okigbo, B. N. (1965). Effects of mulching and frequency of weeding on the performance and
yield of maize. Nigeria Agriculture Journal., 2: 7-9.
Okigbo, B. N. (1969). Maize experiments in the Nsukka Plains: III. Effects of different kinds of
mulches on the yield of maize in the humid tropics. Agronomy Tropics., 28: 1036-1047.
Parish, R. L., Porter, W. C. and Vidrine, P. R. (1997). ‘Flame cultivation as a complement to
mechanical and herbicidal control of weeds’, Journal of Vegetable Crop Production, vol. 3,
65-83.
Parsons, W. T. and Cuthbertson, E. G. (1992). Noxious Weeds of Australia, Inkata Press,
Melbourne.
Parsons, W. T. and Cuthbertson, E. G. (2001). Noxious weeds of Australia, 2nd edition, 429-30.
(CSIRO Publishing, Collingwood, Victoria).
Parrotta, J. A. (2001). Healing plants of peninsular India. (CABI Publishing, Wallingford, UK).
Peacock, J. L., Burnside, O. C., Lavy, T. L., Hanway, D. G. and Kittock, D. L. 1965, ‘Flaming,
intertillage, and chemical weed control in castrobeans’, Weed, 13, 290-292.
Pitt, J. L. and Miller, I. L. (1991).‘The pest status and chemical control of Jatropha gossypifolia
L, in the Northern Territory, Australia’, Proceedings of the 13th Asian-Pacific Weed Science
Society Conference, Jakarta 1991.
Pitt, J. L. (1998). ‘Jatropha gossypifolia aerial spraying trial’, Australian Weeds Research
Newsletter No. 39, 74.
Pitt, J. L. and Smith, R. A. (1990). Jatropha gossypifolia aerial spraying trial. Australian Weeds
Research Newsletter No. 39, 74.
Pyne, S, J., Patricia, L. A., and Richard, D. L. (1996). Introduction to Wildland Fire (2nd. ed),
John Wiley and Sons, INC. Brisbane.
Reddi, E.U.B. and Reddi, C.S. (1983). ‘Pollination ecology of Jatropha
gossypifolia(Euphorbiaceae)’, Proceedings of the Indian Academy of Sciences (Plant
Sciences) 92, 215-231.

81
Ridpath, M. G., and Corbett, L. K. (1983). ‘Ecology of the wet-dry tropics’, Proceedings of a
joint symposium with the Australian Mammal Society in Association with the Darwin
Institute of Technology, held at Darwin, 15-17 May 1983, Proceedings of the Ecological
Society of Australia 13, 3–20.
Roche, S., Dixon, K.W. and Pate, J. S. (1998). For everything a season: smoke induced seed
germination and seedling recruitment in a Western Australian Banksia woodland.
Australian Journal of Ecology 23, 111-120.
Rossiter, N. (2007). The impacts of invasive grasses on ecosystem processes in Australia’s
savannas. PhD Thesis. Charles Darwin University. Northern Territory.
Simard, A. J., Einizenberg, J. E., Adams, K. A., Nissen, R. L. and Deacon, A. G. (1994).
General Procudure for sampling and analysing wildland fire spread. Forest Science 30, 51-
64.
Smith, N. M. (1995). Weeds of Natural Ecosystems: A Field Guide to Environmental Weeds of
Northern Territory, Environmental Centre, Darwin.
Sneeuwjagt, R. J., and Peet, G. B. (1985). Forest Fire Behaviour Tables for Western Australia.
Department of Conservation and land management, Western Australia, Perth.
Steward, F. R., Peter, S. and Richon, J. B. (1990). A method for predicting the depth of lethal
heat penetration into mineral soil exposed to fires of varies intensities. Canadian Journal of
Forest Research, 20, 919-926.
Stinson, K. J, Wright, H. A. (1969). Temperature and head fires in the southern mixed prairie of
Texas. Journal of Rangeland Management 22: 169-174.
Swarbrick, J. T. (1980). The Australian Weed Control Handbook, Cranbrook Press Pty, Ltd,
Queensland.
Swarbrick, J. T. (1997). Weeds of the Pacific Islands, Technical Paper No. 209, South Pacific
Commission, Noumea, New Caledonia.
Taylor, M. D., Smith, A. B., Furst, G. T., Gunasekara, S. P., Bevell, E. C. A., Cordell, G. A.,
Fransworth, N. R., Kupchan, S. M., Uchida, H., Branfman, A. R., Dailey, R. G. and Sneden,
A. T. (1983). Plant anticancer agents 28. New antileukemic jatrophone derivatives from
Jatropha gossypifolia: structural and stereochemical assignment through nuclear magnetic
resonance spectroscopy. Journal of the American Chemical Society 105, 3177-3183.
Teasdale, J. (1999). Influence of hairy vetch residue on atrazine and metolachlor soil solution
concentration and weed emergence. Weed Science 51, Issue 4 (July 2003).
The PLANTS Database, database (version 4.0.4). (1996). National Plant Data Center, NRCS,
USDA. Baton Rouge, LA 70874-4490 USA. http://plants.usda.gov.

82
Thorp, J. R., and Lynch, R. (2000). The Determination of Weeds of National Significance.
National Weeds Strategy Executive Committee, Launceston, Tasmania.
Tomley, A. (2003). Bellyache bush (Jatropha gossypifolia) infection by Scylalidium
dimidiatum. Queensland Department of Natural Resources and Mines Office Memo.
Tothill, J. C. and Mott, J. J. (1983). ‘Australian savannahs and their stability under grazing,
Proceedings of the Ecological Society of Australia 13, 317-322.
Trollope, W. S. W. (1980). Unpublished data. Department of Agriculture, University of Fort
Hare, Alice.
Van Lenteren, J. C., Minks, A. K. and de Ponti, O. M. B. (1992). Biological Control and
Integrated Crop Protection: Towards Environmentally Safer Agriculture, Pudoc Scientific
Publishers, Wageningen.
Vaster, J. (1988). ‘Flame cultivation for weed control- 2 years of results’, In Proceedings of a
Meeting of the EC Experts’ Group, Weed Control in Vegetable Production’, November
1988, Stuttgart, Germany, pp. 153-167.
Vitelli, J. S. (1998). ‘Options for effective weed management’, Tropical Grasslands 32, 280-
294.
Vitelli, J. S. (2000). Option for effective weed management. Tropical Grasslands 34, 280-94.
Vitelli, J. S. and Madigan, B. A. (2002). Is aerial control of bellyache bush effective?
Proceedings of the 13th Australian Weed Conference, eds H. spafford Jacob, J. Dodd and
J.H. Moore, pp. 169-172. (Plant Protection Society of Western Australia, Perth).
Vitelli, J. S. and Madigan, B. A. (2004). ‘Evaluation of a hand-held burner for the control of
woody weeds by flaming’, In Australian Journal of Experimental Agriculture, 44, 75-81.
Vogler, W. and Keir, A. (2005). The rate of spread of bellyache bush (Jatropha gossypifolia) in
northern Queensland. Proceedings of the 8th Queensland Symposium, ed. W.D. Vogler, p.
102. (Weed Society of Queensland, Townsville).
Waterhouse, D.F. (1994). Biological Control of Weeds: Southeast Asian Prospects, ACIAR,
Canberra.
Watson, G. A. (1957). Cover plants in rubber cultivation. Journal Rubber Research Institution.
Malays., 15:2-18.
Webb, L. J. (1948). Guide to the medicinal and poisonous plants of Queensland, CSIRO
Bulletin 232, 51-58

83
West, O. M. (1965). Fire in Vegetation and its use in Pasture Management with Species
Reference to Tropical and Subtropical Africa. Mimeographed Publication No.1/1965.
Commonwealth Bureau of Pastures and Field Crops, Hurley.
Wheeler, J. R. (ed.). (1992). Flora of the Kimberley Region, Western Australia Herbarium,
Department of Conservation and Land Management, Perth.
Wild, K. L. (2003). Understanding the flowering and seeding behaviour of bellyache bush
(Jatropha gossypifolia). A report submitted as a requirement for the degree of Bachelor of
Agricultural Science (Rural Technology) in the University of Queensland, Gatton,
Queensland).
Wilkins, M. B. (1984). Advanced Plant Physiology, Pitman Publishing Ing, London.
Williams, R. J., Gill, A. M. & Moore, P. H. R. (1998). Seasonal changes in fire behaviour in a
tropical savanna in northern Australia. International Journal of Wildland Fire 8: 227-239.
Williams, D., Smith, J. R., Partrige, I., Jacklyn, P., and Dyer, R. (2001). Savanna Burning:
Understanding and using fire in northern Australia, Tropical Savannas CRC, Northern
Territory, Darwin.
Wilson, C. G. (1995). Possibilities for further collaboration in weed management between
Australia and Timor. Northern Territory Department of Primary Industries and Fisheries
Technical Bulletin No. 234. Weed identification and control workshop Nusa Cendana
University 1995, Ed. C. Wilson.
Wilson, C. G. (1997). Photophagous insect fauna of two weeds, Hyplis suaveolens (L) Poit. And
Jatropha gossypifolia L., in Australia’s Northern Territory. Australian Entomologist 24, 55-
60.
Every reasonable effort has been made to acknowledge the owners of copyright material. I
would be pleased to hear from any copyright owner who has been omitted or incorrectly
acknowledged.

84
Appendix A
Following are tables outlining the design of analyses of variance used to test for effects of site,
treatment and plot on plant mortality, survivorship and new recruitment of established plants,
small plants and seedlings.
Table 1: Results of 2-Factor ANOVA of the canopy cover taken at wet and dry season at Acacia and Channel Island (2007/2008).
Factor Df Seq SS Adj SS Adj MS F P
Site 1 15 693.0 15 693.0 15 693.0 54.79 0.000
Season 1 7176.1 7176.1 7176.1 25.06 0.000
Site x Season 1 79.0 79.0 79.0 0.28 0.603
Table 2. Results of 2-Factor ANOVA of the proportion alive after cutting treatments of established plants from the data collected at February 2008. Factors were: Site (n=2, fixed) and Treatments (n=6, fixed). Transformed data (x’= arcsin [square root x]) were used.
Factor Df Seq SS Adj SS Adj MS F P
Site 1 0.38236 0.38236 0.38236 49.87 0.000
Treatment 5 9.48005 9.48005 1.89601 247.30 0.000
Site x Treatment 5 0.21059 0.21059 0.04212 5.49 0.002
Table 3. Results of 2-Factor ANOVA of the new shoots on the cutting treatments of established plants from the data collected at February 2008. Factors were: Site (n=2, fixed) and Treatments (n=6, fixed). Transformed data (x’= arcsin [square root x]) were used.
Factor Df Seq SS Adj SS Adj MS F P
Site 1 10.251 10.251 10.251 5.72 0.025
Treatment 5 933.213 933.213 186.643 104.19 0.000
Site x Treatment 5 26.039 26.039 5.208 2.91 0.034

85
Table 4. Results of 3-Factor ANOVA of the proportion alive on the cutting treatments in combination with mulch of established plants from the data collected at February 2008. Factors were: Site (n=2, fixid), Treatments (n=3, fixed) and Plot (n=3, random, nested in site). Transformed data (x’= arcsin [square root x]) were used.
Factor Df Seq SS Adj SS Adj MS F P
Site 1 0.2727 0.2727 0.2727 14.82 0.000
Treatment 2 23.7495 23.7495 11.8748 645.49 0.000
Plot 4 0.0796 0.0796 0.0199 1.08 0.380
Site x Treatment 2 0.1423 0.1423 0.0712 3.87 0.030
Treatment x Plot 8 0.1592 0.1592 0.0199 1.08 0.398
Table 5. Results of 3-Factor ANOVA of the new shoots on the cutting treatments in combination with mulch of established plants from the data collected at February 2008. Factors were: Site (n=2, fixid), Treatments (n=3, fixed) and Plot (n=3, random, nested in site). Transformed data (x’= arcsin [square root x]) were used.
Factor Df Seq SS Adj SS Adj MS F P
Site 1 0.15766 0.14498 0.14498 2.91 0.097
Treatment 2 0.28954 0.29410 0.14705 2.95 0.065
Plot 4 0.15821 0.14654 0.03664 0.74 0.574
Site x Treatment 2 0.28909 0.29410 0.14705 2.95 0.065
Treatment x Plot 8 0.29636 0.29636 0.03704 0.74 0.652

86
Table 6. Results of 3-Factor ANOVA of the proportion alive on the hand-pulling and mulching treatments of small plants from the data collected at February 2008. Factors were: site (n=2, fixid), Treatments (n=3, fixed) and Plot (n=3, random, nested in site). Transformed data (x’= arcsin [square root x]) were used.
Factor Df Seq SS Adj SS Adj MS F P
Site 1 0.85462 0.85462 0.85462 37.89 0.000
Treatment 2 7.48824 7.48824 3.74412 165.99 0.000
Plot 4 0.33450 0.33450 0.08362 3.71 0.013
Site x Treatment 2 1.04092 1.04092 0.52046 23.07 0.000
Treatment x Plot 8 0.23301 0.23301 0.02913 1.29 0.279
Table 7. Results of 3-Factor ANOVA of the proportion alive of seedlings after treated with mulch. Data collected at February 2008 used for this analysis. Factors were: Site (n=2, fixid), Treatments (n=2, fixed) and Plot (n=3, random, nested in site). Transformed data (x’= arcsin [square root x]) were used.
Factor Df Seq SS Adj SS Adj MS F P
Site 1 1.31077 1.31077 1.31077 18.53 0.000
Treatment 1 1.08061 1.08061 1.08061 15.27 0.001
Plot 4 0.77274 0.77274 0.19318 2.73 0.053
Site x Treatment 1 0.10916 0.10916 0.10916 1.54 0.226
Treatment x Plot 4 0.40702 0.40702 0.10176 1.44 0.252

87
Table 8. Results of 3-Factor ANOVA of the seed mergence in the early wet season from data collected at February 2008. Factors were: Site (n=2, fixid), Treatments (n=2, fixed) and Plot (n=3, random, nested in site). Transformed data (x’= arcsin [square root x]) were used.
Factor Df Seq SS Adj SS Adj MS F P
Site 1 10.03 10.03 10.03 0.60 0.445
Treatment 1 42.25 42.25 42.25 2.54 0.124
Plot 4 850.89 850.89 212.72 12.78 0.000
Site x Treatment 1 1.36 1.36 1.36 0.08 0.777
Treatment x Plot 4 130.89 130.89 32.72 1.97 0.132
Table 9. Results of 1-Factor ANOVA of the whole stems length (cm) of felled alive of bellyache bush plants. Factor was site (n=3, fixed).
Factor Df Seq SS Adj SS Adj MS F P
Site 2 33309 33309 16655 8.18 0.001
Table 10. Results of 3-Factor ANOVA of the seedling emergence after burning in February 2008. Factors were: Site (n=2, fixed), Treatments (n=2, fixed) and Plot (n=3, random, nested in site). Transformed data (x’= arcsin [square root x]) were used.
Factor Df Seq SS Adj SS Adj MS F P
Site 1 8.82 8.82 8.82 0.18 0.675
Treatment 1 0.42 0.42 0.42 0.01 0.927
Plot(Site) 4 1860.27 1860.27 465.07 9.38 0.000
Site*Treatment 1 714.15 714.15 714.15 14.40 0.000
Treatment*Plot 4 780.53 780.53 195.13 3.93 0.008

88
Appendix B
Table 1: Monthly meteorological data for the weather station at Darwin Airport (12.42 ˚S, 130.89 ˚E) the closes to Channel Island. Precipitation averages were recorded from 1941 to 2008. Sunlight from 1951 to 2008. Sources: Australian Government Bureau of Meteorology (2008).
Rainfall (mm) Temperature (C°) Month Aver. max. min. Aver. Max. Min
Mean 9am Rel. Hum. (%)
Mean 9am Wind speed (Km/h)
Mean Daily Eva-trans. (mm)
JAN FEB MAR APR MAY JUNE JULY AUG SEPT OCT NOV DEC Annual
420.4 358.1 324.7 101.7 21.0 2.0 1.3 5.4 15.3 68.5 140.4 246.2 1709.1
940.4 814.5 1013.6 396.2 298.9 50.6 26.6 83.8 129.8 338.7 370.8 664.5 2776.6
136.1 103.3 88.0 0.6 0.0 0.0 0.0 0.0 0.0 0.0 17.2 18.8 1024.7
31.8 31.4 31.9 32.7 32.0 30.6 30.5 31.3 32.5 33.2 33.2 32.6 32.0
35.6 36.0 36.0 36.7 36.0 34.5 34.8 36.0 37.7 38.9 37.3 37.0 38.9
25.7 25.6 25.7 24.6 22.7 22.7 21.1 25.1 27.6 24.7 26.2 24.0 21.1
81 83 82 74 65 60 60 65 68 69 72 76 71
11.2 10.9 8.8 10.3 13.4 14.5 12.7 10.5 8.9 8.7 8.6 9.8 10.7
6.0 5.7 5.8 6.4 6.8 6.9 6.9 7.2 7.7 8.0 7.5 6.7 6.8

89
Table 2: Monthly meteorological data for the weather station at Middle Point (12.58 ˚S, 131.31 ˚E) the closes weather station to Acacia site. Precipitation averages were recorded from 1957 to 2008. Relative humidity from 1967 to 2008. Sources: Australian Government Bureau of Meteorology (2008).
Rainfall (mm) Temperature (C°) Month Aver. max. min. Aver. Max. Min
Mean 9am Rel. Hum. (%)
Mean 9am Wind speed (Km/h)
Mean Daily Evapo. (mm)
JAN FEB MAR APR MAY JUNE JULY AUG SEPT OCT NOV DEC Annual
338.2 271.8 252.2 79.8 21.1 1.7 0.8 2.5 12.2 57.4 129.6 221.0 1388.9
865.8 522.5 552.9 488.2 298.4 30.0 22.4 38.5 67.8 162.6 235.6 484.3 2185.7
135.0 70.0 0.0 0.8 0.0 0.0 0.0 0.0 0.0 0.0 29.0 19.0 774.9
32.6 32.0 32.4 33.1 32.5 31.3 31.3 32.9 34.7 35.6 35.1 33.8 33.1
38.2 36.2 37.5 39.0 35.9 34.9 35.5 37.1 38.8 40.3 40.2 38.7 40.3
25.2 24.5 26.1 25.8 22.2 25.3 19.9 18.6 27.6 24.5 26.5 25.4 18.6
84 87 85 79 72 68 65 68 70 70 76 80 75
5.9 5.3 5.1 6.1 8.0 8.2 7.4 6.5 6.3 5.7 5.1 5.2 6.2
4.7 4.5 4.7 5.2 5.2 5.2 5.5 6.1 6.8 7.1 6.3 5.2 5.5
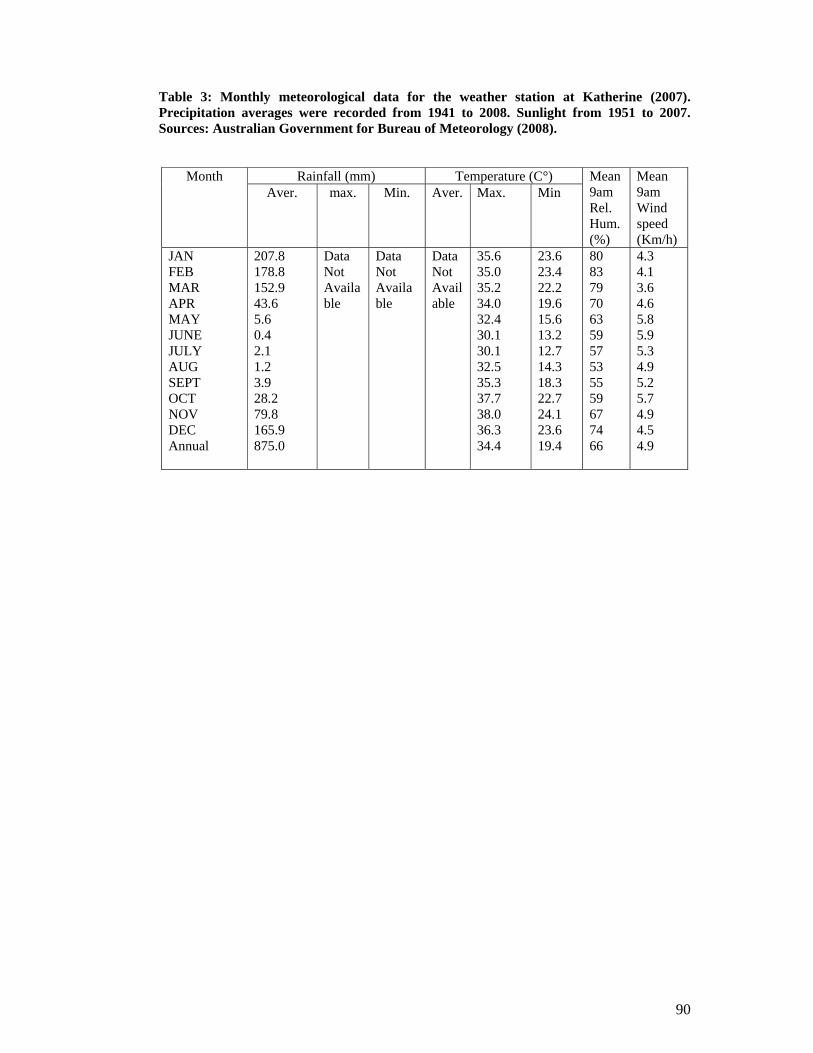
90
Table 3: Monthly meteorological data for the weather station at Katherine (2007). Precipitation averages were recorded from 1941 to 2008. Sunlight from 1951 to 2007. Sources: Australian Government for Bureau of Meteorology (2008).
Rainfall (mm) Temperature (C°) Month Aver. max. Min. Aver. Max. Min
Mean 9am Rel. Hum. (%)
Mean 9am Wind speed (Km/h)
JAN FEB MAR APR MAY JUNE JULY AUG SEPT OCT NOV DEC Annual
207.8 178.8 152.9 43.6 5.6 0.4 2.1 1.2 3.9 28.2 79.8 165.9 875.0
Data Not Available
Data Not Available
Data Not Available
35.6 35.0 35.2 34.0 32.4 30.1 30.1 32.5 35.3 37.7 38.0 36.3 34.4
23.6 23.4 22.2 19.6 15.6 13.2 12.7 14.3 18.3 22.7 24.1 23.6 19.4
80 83 79 70 63 59 57 53 55 59 67 74 66
4.3 4.1 3.6 4.6 5.8 5.9 5.3 4.9 5.2 5.7 4.9 4.5 4.9

91
Table 4: Monthly meteorological data at Automatic weather station at Dili Airport (East Timor) 2008. Altitude 25m, Latitude -8.53237 and Longitude 126.00514. Precipitation averages were recorded from 2000 to 2008.
Rainfall (mm) Temperature (C°) Month Aver. max. min. Aver. Max. Min
Mean 9am Rel. Hum. (%)
Mean 9am Wind speed (Km/h)
Mean Daily Eva-trans. (mm)
JAN FEB MAR APR MAY JUNE JULY AUG SEPT OCT NOV DEC Annual
411.0 328.0 322.1 100.2 20.2 2.0 1.0 4.4 13.3 65.5 120.1 233.2 109.1
910.4 804.5 1113.6 376.0 288.0 40.6 22.0 81.1 120.8 311.7 370.8 664.5 2576.0
131.1 100.3 83.0 0.6 0.0 0.0 0.0 0.0 0.0 0.0 15.2 14.8 1014.7
32.2 32.8 32.9 33.7 32.0 30.6 30.5 31.3 32.5 33.2 33.2 32.6 32.0
36.6 36.0 36.0 36.7 36.0 36.5 36.8 36.0 37.7 38.9 37.3 37.0 38.9
26.7 26.6 26.7 25.6 22.7 22.7 21.1 24.1 26.6 24.7 26.2 25.0 22.1
84 83 84 73 67 62 61 65 68 70 73 76 73
12.2 11.9 8.8 10.3 13.4 15.5 12.7 10.5 9.9 8.7 9.6 9.8 11.7
7.0 5.7 6.8 6.4 6.8 6.9 7.9 7.2 7.7 8.0 7.5 7.7 6.8

92
Appendix C The following is summary table of soil temperature after imposing fire treatment at Acacia and
Katherine site in 2007.
Table 1. Summary of soil temperature at Acacia site.
Site Block Button
Pre-fire temperature
(2.00pm) Max temp
5% of max
Temperature 5% below
max.
Duration within 5% of
max (s) Acacia 1 1 46.585 112.3 5.62 106.681 234Acacia 1 3 47.086 126.13 6.3065 119.8235 522Acacia 1 4 44.079 126.13 6.3065 119.8235 672Acacia 1 5 42.146 54.17 2.7085 51.4615 2241 Mean 44.974 104.6825 5.234125 99.448375 917.25Acacia 2 1 46.075 76.067 3.80335 72.26365 471Acacia 2 2 46.067 126.096 6.3048 119.7912 1629Acacia 2 4 51.079 67.077 3.35385 63.72315 1587Acacia 2 5 46.067 126.096 6.3048 119.7912 1629 Mean 98.834 4.9417 93.8923 1329Acacia 3 1 43.15 88.069 4.40345 83.66555 285Acacia 3 2 43.1 126.35 6.3175 120.0325 699Acacia 3 3 42.648 79.123 3.95615 75.16685 426Acacia 3 4 39.521 55.033 2.75165 52.28135 723Acacia 3 5 39.134 126.13 6.3065 119.8235 1533 Mean 94.941 4.74705 90.19395 733.2
Table 2. Summary of soil temperature at Katherine site.
Site Block Button
Pre-fire temperature
(3.00pm) Max temp
5% of max
Temperature 5% below
max.
Duration within 5% of max (s)
Katherine 1 1 39.063 87.012 4.3506 82.6614 246Katherine 1 3 38.561 126.131 6.30655 119.824 144 Mean 19.406 53.2858 2.66429 50.6215 195Katherine 2 1 36.632 63.202 3.1601 60.0419 405Katherine 2 2 34.057 70.074 3.5037 66.5703 591Katherine 2 3 38.565 126.38 6.319 120.061 858Katherine 2 5 37.539 67.072 3.3536 63.7184 1386 Mean 81.682 4.0841 77.5979 810Katherine 3 1 32.601 96.997 4.84985 92.1472 255Katherine 3 2 37.088 69.105 3.45525 65.6498 2955Katherine 3 3 38.565 126.38 6.319 120.061 858Mean 97.494 4.8747 92.6193 1356