the effectiveness of various structural systems …
TRANSCRIPT

THE EFFECTIVENESS OF VARIOUS STRUCTURAL SYSTEMS IN
REDUCING TALL BUILDING RESPONSE DUE TO WIND
ROSLIDA BT. ABD. SAMAT
A thesis submitted in fulfilment of the
requirements for the award of the degree of
Doctor of Philosophy (Civil Engineering)
Faculty of Civil Engineering
Universiti Teknologi Malaysia
JULY 2008

iv
ABSTRACT
Recently, many tall building structural systems have been innovated in order to reduce the building responses due to wind loading. However, there are no systematic study conducted on the effectiveness of the different tall building systems in minimizing the responses of the building due to wind load. The objective of this research is to study the effectiveness of five tall building structural systems: core wall, outrigger, belt wall, tube-in-tube and megacolumns in minimizing the building responses due to wind. Reinforced concrete buildings with 64 stories and the ratio of height to the breadth of 6:1 were analysed for their responses to wind load. The buildings that were analysed have five different structural systems. The natural frequencies and eigenvectors of the buildings in the along-wind, across-wind and torsional mode are computed by a structural engineering software. The along-wind responses are determined by employing the procedures from the ASCE 7-02 while the across-wind and torsional responses of the buildings are calculated based on the procedures and wind tunnel data available in a data base of aerodynamic load. The database is comprised of high-frequency base balance measurements on a host of isolated tall building models. It is found that increasing the size of the core wall is more effective to reduce the building responses than increasing the thickness of the core wall. As for the outriggers, the most optimum position to construct the outriggers is between one quarter to two third of the height of the building. However, outrigger system is effective to reduce only the along-wind and across-wind responses. The torsional responses cannot be reduced by the addition of the outriggers. Interestingly, the addition of the belt walls will reduce the torsional response of the buildings which otherwise cannot be lessened by the outriggers. The belt walls also further reduce the building responses in the along-wind and across-wind directions. Moreover, the most optimal tube-in-tube structure is achieved when the spacing of the exterior columns is 4 metre, while the addition of megacolumns to the structural systems reduces the building responses drastically in all the three directions.

v
ABSTRAK
Kini banyak sistem struktur bangunan tinggi telah diperkenalkan bagi mengurangkan kelakunan bangunan terhadap beban angin. Namun begitu, tidak ada kajian yang sistematik dilakukan bagi menentukan keberkesanan sistem bangunan tinggi yang berbeza dalam mengurangkan kelakunan bangunan terhadap beban angin. Objektif penyelidikan ini adalah untuk mengkaji keberkesanan lima sistem struktur bangunan tinggi: dinding teras, rasuk sangga, dinding perimeter, tiub-dalam-tiub dan tiang mega bagi mengurangkan kelakunan bangunan akibat angin. Bangunan-bangunan konkrit bertetulang setinggi 64 tingkat dengan nisbah tinggi dan lebar 6:1 dikaji bagi mendapatkan kelakunan terhadap angin. Bangunan-bangunan yang dikaji ini mempunyai lima sistem struktur yang berbeza. Nilai frekuensi tabii dan eigenvektor dalam mod selari-angin, seranjang-angin dan puntiran bagi bangunan diperolehi dengan menggunakan perisian komputer kejuruteraan struktur. Kelakunan selari-angin ditentukan dengan menggunakan tatacara dari kod amalan ASCE 7-02, sementara kelakunan seranjang-angin dihitung dengan menggunakan tatacara dan data terowong angin dalam pengkalan data beban aerodinamik. Pengkalan data ini mengandungi bacaan alat imbangan asas berfrekuensi tinggi bagi model-model bangunan tinggi tunggal. Kajian menunjukkan penambahan saiz dinding teras adalah lebih berkesan untuk mengurangkan kelakunan bangunan dibandingkan dengan penambahan ketebalan dinding teras. Kedudukan paling optima untuk membina rasuk sangga pula ialah di antara satu perempat dan dua pertiga dari ketinggian bangunan. Namun begitu, rasuk sangga hanya berkesan untuk mengurangkan kelakunan selari-angin dan seranjang-angin. Kelakunan puntiran tidak boleh dikurangkan dengan penambahan rasuk sangga pada bangunan. Selanjutnya, penambahan dinding perimeter boleh mengurangkan kelakunan puntiran yang pada asalnya tidak boleh dikurangkan apabila rasuk sangga ditambah kepada sistem dinding teras. Selain itu, dinding perimeter juga boleh mengurangkan kelakunan bangunan selari-angin dan seranjang-angin. Struktur tiub-dalam-tiub yang optima boleh dicapai apabila jarak di antara tiang luaran adalah empat meter, manakala penambahan tiang mega adalah sangat berkesan dalam mengurangkan kelakunan bangunan pada semua tiga arah.
vi
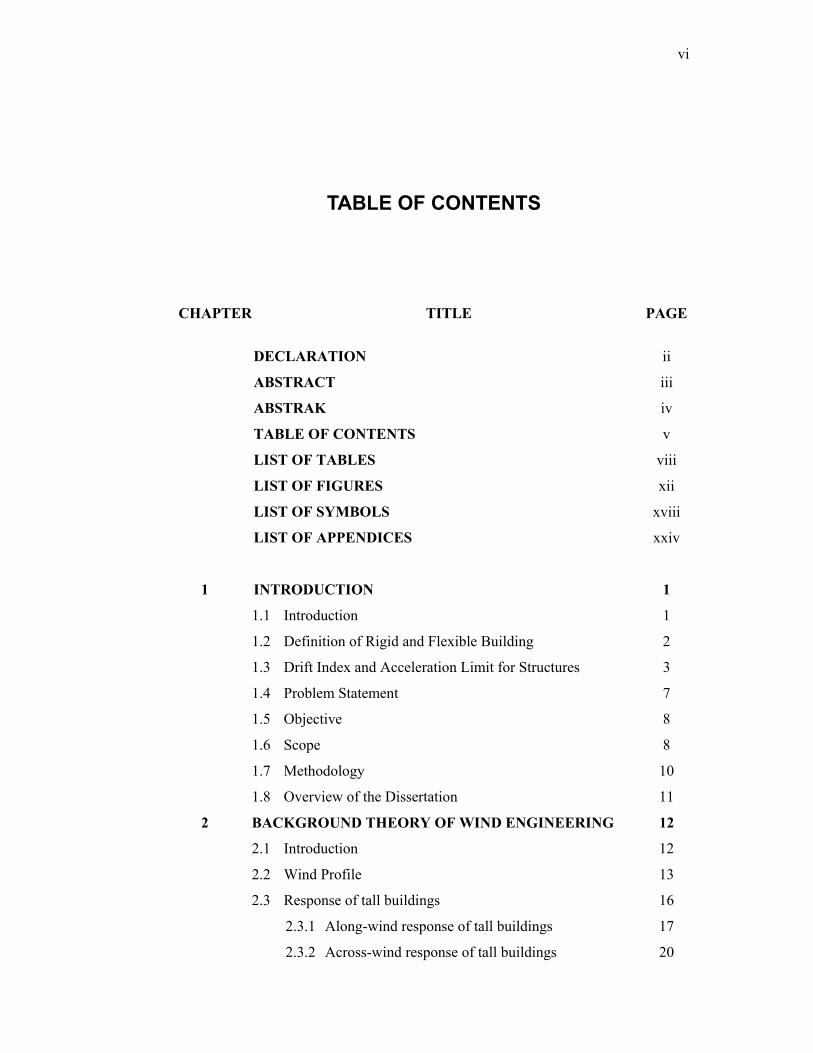
TABLE OF CONTENTS
CHAPTER TITLE PAGE
DECLARATION ii
ABSTRACT iii
ABSTRAK iv
TABLE OF CONTENTS v
LIST OF TABLES viii
LIST OF FIGURES xii
LIST OF SYMBOLS xviii
LIST OF APPENDICES xxiv
1 INTRODUCTION 1
1.1 Introduction 1
1.2 Definition of Rigid and Flexible Building 2
1.3 Drift Index and Acceleration Limit for Structures 3
1.4 Problem Statement 7
1.5 Objective 8
1.6 Scope 8
1.7 Methodology 10
1.8 Overview of the Dissertation 11
2 BACKGROUND THEORY OF WIND ENGINEERING 12
2.1 Introduction 12
2.2 Wind Profile 13
2.3 Response of tall buildings 16
2.3.1 Along-wind response of tall buildings 17
2.3.2 Across-wind response of tall buildings 20

vii
2.3.3 Torsional response of tall buildings 22
2.4 Gust Loading Factor 22
2.5 Full Scale Measurement 25
2.6 Wind Tunnel 27
2.7 Analysis of Tall Building in Resisting Wind Load 31
3 METHODOLOGY 35
3.1 Introduction 35
3.2 General procedure 35
3.3 Building Studied 38
3.4 Tall Building Systems Studied 40
3.5 Modeling of the Building 42
3.6 Output from GTSTRUDL 49
3.7 Wind Speed 51
3.8 Along Wind Response 55
3.9 Across Wind and Torsional Response 59
3.9.1 Validation of the Procedure 59
3.9.2 Calculation of the Across Wind and Torsional
Response 63
4 RESULTS AND DISCUSSION: CORE WALL, OUTRIGGER AND BELT WALL SYSTEM 67
4.1 Introduction 67
4.2 Why some data are not available? 69
4.3 Core wall system 70
4.4 Outrigger system 79
4.4.1 One-story deep outriggers 79
4.4.2 Two-floor deep outriggers 91
4.4.3 The Effects of Outriggers to Torsional Response 101
4.5 Belt wall system 103
4.6 Tube-in-tube system 159
4.7 Megacolumn system 163

viii
5 RESULTS AND DISCUSSION: TUBE-IN-TUBE AND MEGACOLUMN SYSTEM 113
6.1 Introduction 113
6.2 Tube-in-tube system 114
6.3 Megacolumns 124
6 CONCLUSION 139
6.1 Introduction 139
6.2 Parameters at Issue 139
6.3 Conclusion 140
6.4 Efficiency of the Tall Building System 142
6.5 Further Study and Recommendation 144
REFERENCES 210
Appendices A – G 219 -244

ix
LIST OF TABLES
TABLE NO. TITLE PAGE 1.1 Serviceability problems at various deflection or drift
Indices 3 1.2 Human perception level 5 1.3 Acceleration limits for different perception level 5 2.1 Values of α recommended in the reference 13 2.2 Roughness lengths and surface drag coefficients for various types of terrain 15 3.1 Wide flange section used as spandrel beams 39 3.2 Size of columns of the building studied 39 3.3 Comparisons of the values of frequency of a core wall
structure modeled by various size of isoparmetric quadratic solid elements 45
3.4 Difference of frequency and run-time for a framed building with 12 m x 12m x 500 mm thickness core wall having consistent mass and lumped mass definition 48 3.5 Eigenvectors of the selected joints 51 3.6 The conversions used to calculate one-hour averaging time, 10-year return period wind speeds 54
3.7 Comparison of calculated peak and RMS along-wind accelerations from international codes and standards with
wind tunnel data (Kijewski and Kareem, 1998) 59
x
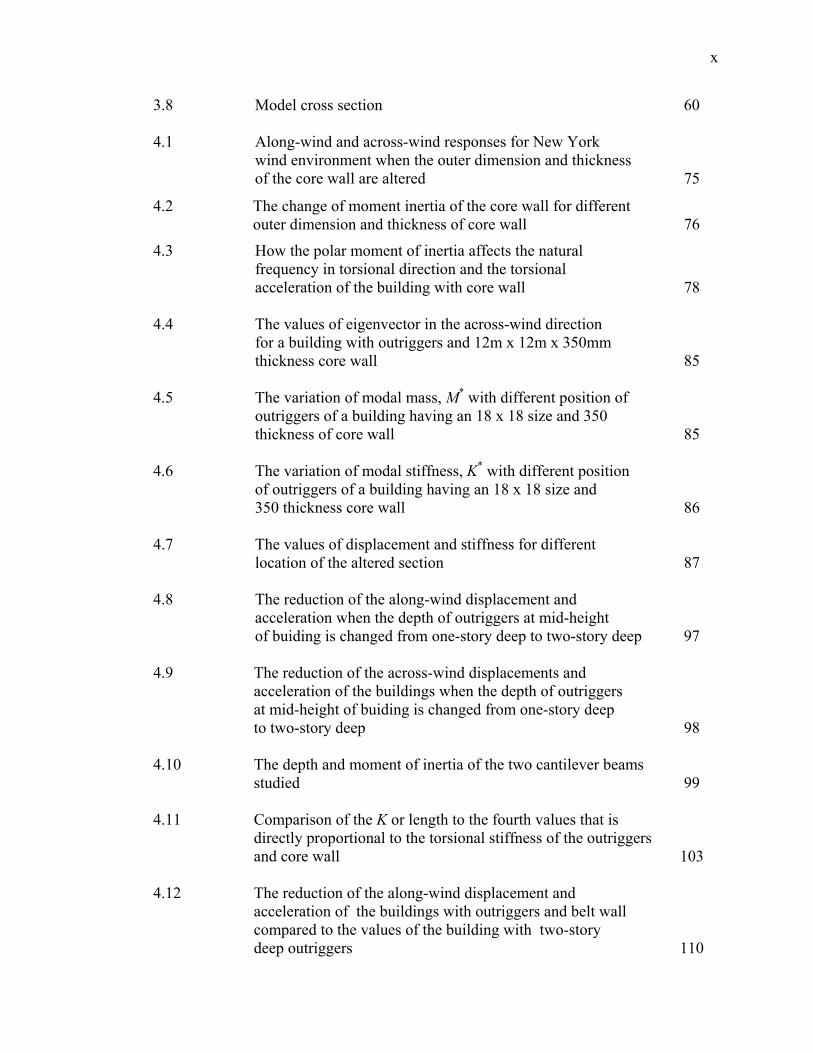
3.8 Model cross section 60 4.1 Along-wind and across-wind responses for New York wind environment when the outer dimension and thickness of the core wall are altered 75
4.2 The change of moment inertia of the core wall for different outer dimension and thickness of core wall 76
4.3 How the polar moment of inertia affects the natural frequency in torsional direction and the torsional acceleration of the building with core wall 78 4.4 The values of eigenvector in the across-wind direction for a building with outriggers and 12m x 12m x 350mm thickness core wall 85 4.5 The variation of modal mass, M* with different position of outriggers of a building having an 18 x 18 size and 350 thickness of core wall 85 4.6 The variation of modal stiffness, K* with different position of outriggers of a building having an 18 x 18 size and 350 thickness core wall 86 4.7 The values of displacement and stiffness for different location of the altered section 87 4.8 The reduction of the along-wind displacement and acceleration when the depth of outriggers at mid-height of buiding is changed from one-story deep to two-story deep 97 4.9 The reduction of the across-wind displacements and acceleration of the buildings when the depth of outriggers at mid-height of buiding is changed from one-story deep to two-story deep 98 4.10 The depth and moment of inertia of the two cantilever beams studied 99 4.11 Comparison of the K or length to the fourth values that is directly proportional to the torsional stiffness of the outriggers and core wall 103 4.12 The reduction of the along-wind displacement and acceleration of the buildings with outriggers and belt wall compared to the values of the building with two-story deep outriggers 110
xi
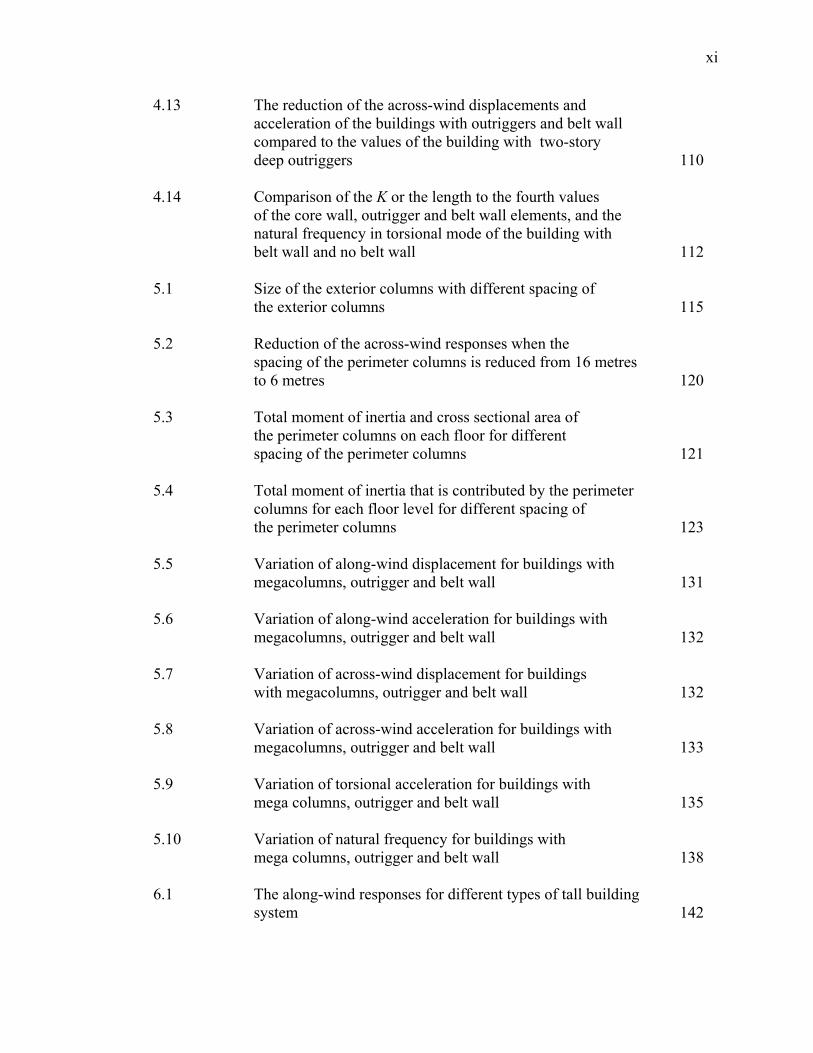
4.13 The reduction of the across-wind displacements and acceleration of the buildings with outriggers and belt wall compared to the values of the building with two-story deep outriggers 110 4.14 Comparison of the K or the length to the fourth values of the core wall, outrigger and belt wall elements, and the natural frequency in torsional mode of the building with belt wall and no belt wall 112 5.1 Size of the exterior columns with different spacing of the exterior columns 115 5.2 Reduction of the across-wind responses when the
spacing of the perimeter columns is reduced from 16 metres to 6 metres 120
5.3 Total moment of inertia and cross sectional area of the perimeter columns on each floor for different spacing of the perimeter columns 121 5.4 Total moment of inertia that is contributed by the perimeter columns for each floor level for different spacing of the perimeter columns 123 5.5 Variation of along-wind displacement for buildings with megacolumns, outrigger and belt wall 131 5.6 Variation of along-wind acceleration for buildings with megacolumns, outrigger and belt wall 132 5.7 Variation of across-wind displacement for buildings with megacolumns, outrigger and belt wall 132 5.8 Variation of across-wind acceleration for buildings with megacolumns, outrigger and belt wall 133 5.9 Variation of torsional acceleration for buildings with mega columns, outrigger and belt wall 135 5.10 Variation of natural frequency for buildings with mega columns, outrigger and belt wall 138 6.1 The along-wind responses for different types of tall building system 142
xii
6.2 The across-wind responses for different types of tall building system 143 6.3 The torsional response for different types of tall building system 143

xiii
LIST OF FIGURES
FIGURE NO. TITLE PAGE 1.1 Design standard on peak acceleration for 10-year return period 6 1.2 A flow chart showing the steps taken in the calculation of the responses of the buildings due to wind 10 2.1 Ratio of probable maximum speed averaged over period t to averaged over one hour 16 2.2 The random vibration (frequency domain) approach to resonant dynamic response (Davnport, 1963) 17 3.1 The procedure in the analysis of buildings in this research 37 3.2 Typical plan view of the building studied 38 3.3 Typical floor for building with 24 m x 24 m core wall 40 3.4 Typical plan of core wall and mega column building studied 42 3.5 (a) Core wall system; (b) Outrigger and core wall system; (c) Beltwall, outrigger and core wall system; (d) tube-in-tube system; (e) Mega column, outrigger and core wall system. 43 3.6 Mode shape of the frequency considered in (a) isometric view (b) y-z plane view. 45 3.7 (a) A cantilever beam with a point load, P at its tip; (b) Mode Shape of the lowest frequency 46 3.8 Eigenvalue output provided by GTSTRUDL 49 3.9 Deformation shape of the structure in (a) mode 1 in isometric view; (b) mode 2 in y-z plane view (c) mode 3 in x-z plane view 50 3.10 Sample output of the eigenvectors values from GTSTRUDL dynamic analysis 50

xiv
3.11 The flowchart of the FOTRAN program to calculate the along-wind displacement and acceleration by using the formulae provided in the ASCE7-02 57 3.12 Model building used for comparison of international standard 58 3.13 Balsa models tested 60 3.14 Comparison of torsional load spectra utilizing pneumatic averaging and force balance techniques (Kareem, 1990) 62 3.15 The flowchart for the FOTRAN program written to calculate the across-wind and torsional acceleration 65 3.16 The flowchart for the FOTRAN program written to calculate The across-wind displacement 66 4.1 Deformation of building with (a) core wall; (b) outrigger; (c) belt wall and outrigger systems in the along-wind across-wind and torsional mode. 68 4.2 Natural frequency for different thickness and outer dimension of a core wall in the (a) along-wind, (b) across-wind, (c) torsional direction 71 4.3 Along-wind displacement that corresponds to different thickness and outer dimension of core wall for wind environment in (a) Malaysia, (b) New York, and (c) Hong Kong 72 4.4 Along-wind acceleration that corresponds to different thickness and outer dimension of core wall for wind environment in (a) Malaysia, (b) New York, and (c) Hong Kong 72
4.5 Across-wind displacement that corresponds to different thickness and outer dimension of core wall for wind environment in (a) Malaysia, (b) New York, and (c) Hong Kong 73 4.6 Across-wind acceleration that corresponds to different thickness and outer dimension of core wall for wind environment in (a) Malaysia, (b) New York, and (c) Hong Kong 74
4.7 Torsional acceleration that corresponds to different thickness and outer dimension of core wall for wind environment in (a) Malaysia, (b) New York, and (c) Hong Kong 74
4.8 The natural frequency in (a) along-wind, (b) across-wind and (c) torsional direction for different of position of 1-storey deep outriggers 80
4.9 The along-wind displacement for different of position of 1-storey deep outriggers that corresponds to the wind environment in (a) Malaysia (b) New York (d) Hong Kong 81

xv
4.10 The along-wind acceleration for different of position of 1-storey deep outriggers that corresponds to the wind environment in (a) Malaysia (b) New York (d) Hong Kong 81
4.11 The across-wind displacement for different of position of 1-storey deep outriggers that corresponds to the wind environment in (a) Malaysia (b) New York (d) Hong Kong 82
4.12 The across-wind acceleration for different of position of 1-storey deep outriggers that corresponds to the wind environment in (a) Malaysia (b) New York (d) Hong Kong 83
4.13 The torsional acceleration for different of position of 1-storey deep outriggers that corresponds to the wind environment in (a) Malaysia (b) New York (d) Hong Kong 83
4.14 The properties of the beams for trial 1, 2, and 3. 87
4.15 M/EI diagram for the cantilever beam in Trial 2 when the Altered section is located at (a) 25%; (b) 33%; (c) 50%; (d) 75% ;( e) 97.9% (f) M/EI diagram when there is no altered section at all. 89 4.16 Comparison of the natural frequency between 1 storey deep outriggers with the one corresponds to the 2 storey deep outriggers in the (a) along-wind, (b) across- wind and (c) torsional direction 92
4.17 Comparison of the along-wind displacement between 1 storey deep outriggers with the one corresponds to the 2 storey deep outriggers in (a) Malaysia (b) New York (d) Hong Kong wind environment 93
4.18 Comparison of the along-wind acceleration between 1 storey deep outriggers with the one corresponds to the 2 storey deep outriggers in (a) Malaysia (b) New York (d) Hong Kong wind environment 94
4.19 Comparison of the across-wind displacement between 1 storey deep outriggers with the one corresponds to the 2 storey deep outriggers in (a) Malaysia (b) New York (d) Hong Kong wind environment 95
4.20 Comparison of the across-wind acceleration between 1 storey deep outriggers with the one corresponds to the 2 storey deep outriggers in (a) Malaysia (b) New York (d) Hong Kong wind environment 96 4.21 Comparison of the torsional acceleration between 1 storey Deep outriggers with the one corresponds to the 2 storey deep outriggers in (a) Malaysia (b) New York (d) Hong Kong wind environment 97
xvi
4.22 M/EI diagram without the altered section for (a) Trial 1; (b) Trial 2. M/EI diagram when the altered section is at position 50% for the cantilever beam (c) in Trial 1 (d) in Trial 2 100
4.23 View at the floor where outriggers are located 101
4.24 Comparison of the value of the natural frequency in the along-wind, across-wind and torsional direction for a
building with two-storey deep outriggers and a building with both two-storey deep outriggers and belt walls 104
4.25 Comparison of the value of the along-wind displacement for (a) Malaysia, (b) New York and, (c) Hong Kong wind environment for a building with two-storey deep outriggers and a building with both two-storey deep outriggers and belt walls 105
4.26 Comparison of the value of the along-wind acceleration for (a) Malaysia, (b) New York and, (c) Hong Kong wind environment for a building with two-storey deep outriggers and a building with both two-storey deep outriggers and belt walls 106
4.27 Comparison of the value of the across-wind displacement for (a) Malaysia, (b) New York and, (c) Hong Kong wind environment for a building with two-storey deep outriggers and a building with both two-storey deep outriggers and belt walls 107
4.28 Comparison of the value of the across-wind acceleration for (a) Malaysia, (b) New York and, (c) Hong Kong wind environment for a building with two-storey deep outriggers and a building with both two-storey deep outriggers and belt walls 108
4.29 Comparison of the value of the torsional displacement for (a) Malaysia, (b) New York and, (c) Hong Kong wind environment for a building with two-storey deep outriggers and a building with both two-storey deep outriggers and belt walls 109
4.30 A view of a floor where the belt wall is located 111
5.1 Deformation of building with (a) tube-in-tube; (b) megacolumn systems in the along-wind, across-wind and torsional mode 114
5.2 The natural frequency in the (a) along-wind, (b) across-wind, (c) torsional direction for different spacing of the perimeter columns for tube-in-tube system 115

xvii
5.3 The along-wind displacement for different spacing of the perimeter columns for tube-in-tube system in (a) Malaysia, (b) New York, (c) Hong Kong wind environment 116
5.4 The along-wind acceleration for different spacing of the perimeter columns for tube-in-tube system in (a) Malaysia, (b) New York, (c) Hong Kong wind environment 117
5.5 The across-wind displacement for different spacing of the perimeter columns for tube-in-tube system in (a) Malaysia, (b) New York, (c) Hong Kong wind environment 117
5.6 The across-wind acceleration for different spacing of the perimeter columns for tube-in-tube system in (a) Malaysia, (b) New York, (c) Hong Kong wind environment 118
5.7 The torsional acceleration for different spacing of the perimeter columns for tube-in-tube system in (a) Malaysia, (b) New York, (c) Hong Kong wind environment 119
5.8 Percentage of the reduction of the along-wind (a) displacement (b) acceleration for different spacing of the perimeter columns compared to the ones of the original spacing of the perimeter columns 120 5.9 Natural frequencies in the along-wind, across-wind and torsional direction for different spacing of the perimeter columns when the total cross sectional area is kept constant 122
5.10 The natural frequency in the (a) along-wind (b) across-wind (c) torsional direction, for different combination of structural elements with the megacolumn building 125
5.11 The along-wind displacement for different combination of structural elements with the megacolumn building in (a) Malaysia, (b) New York (c) Hong Kong wind environment 126
5.12 The along-wind acceleration for different combination of structural elements with the megacolumn building in (a) Malaysia, (b) New York (c) Hong Kong wind environment 127
5.13 The across-wind displacement for different combination of structural elements with the megacolumn building in (a) Malaysia, (b) New York (c) Hong Kong wind environment 128
5.14 The across-wind acceleration for different combination of structural elements with the megacolumn building in (a) Malaysia, (b) New York (c) Hong Kong wind environment 129
5.15 The torsional acceleration for different combination of structural elements with the megacolumn building in (a) Malaysia, (b) New York (c) Hong Kong wind environment 130
xviii
5.16 Plan view of the mega columns and perimeter frame of the Building 136

xix
LIST OF SYMBOLS
A - projected area of the structure loaded by the wind
a - length of the side of the square section
B,b - horizontal dimension of building measured normal to wind
direction
C - coefficient of viscous damping
c - damping matrix,
cc - critical damping
CD - drag coefficient
fC - mean along-wind force coefficient; *
ic - generalized damping in the i-th mode of vibration.
CM - non-dimensional moment coefficient
d - height of zero-plane above the ground where the velocity is zero D - dynamic matrix
E - modulus of elasticity
E - the load effect due to mean wind.
ei - error for each mode shape i
f - cyclic frequency
( )tf D - the mean parts of the drag force
f~ - flexibility matrix
if - mean generalized force
( )tfD′ - the fluctuating parts of the drag force
G - modulus of rigidity;

xx
Gf - gust factor
Gr - gradient velocity τG - gust factor τqG - gust factor (GF) for wind velocity pressure.
vzG - gust velocity factor
TYG - GLF for displacement
g, gD - peak factor gB - background peak factor
Rg - resonant peak factor gv - peak factor for upwind velocity fluctuations H, h - average height of structure H(n) - frequency response function
( ) 21 fH - structural transfer function of the first mode
I - moment of inertia I - N x N identity matrix and
Ih - turbulence intensity I(z) - mass moment of inertia per unit height IH - turbulent intensity evaluated at the top of the building; K - length to the power of fourth
K , [ ]K , k - stiffness matrix of the structure K - surface drag coefficient
*ik - generalized stiffness in the i-th mode of vibration
kT - torsional stiffness L - horizontal dimension of a building measured parallel to the wind
direction xuL ,
yuL ,
zuL - integral scale
BM - background base moment and base torque
RM - resonant base moment or base torque response M - expected mean of the moment or torque response
'M - reference moment or torque
M - expected extreme value of the moment or torque response *im - generalized mass in the i-th mode of vibration.

xxi
1m - modal mass
m - mass matrix,
meff - effective mass,
m - mass per unit length along the beam
0n , nc - natural frequency of the structure in the across-wind direction
in - frequency in the i-th mode
P - load
( )zPBˆ
- equivalent static wind load for the background part
( )zRP - resonant component of the equivalent static wind loading
*P - generalized force
*1P - generalized load of the first mode; τ
P - mean wind force with averaging time τ .
( )zPTˆ - peak ESWL at height z during observation time T *ip - generalized force in the i-th mode of vibration.
p - load matrix.
Q - non-dimensional quantities representing the normalized mean
background responses
q1 - deflected shape
q(z) - mean wind velocity pressure
qi - the i-th normal coordinate.
zq - peak dynamic pressure,
R - resonant response factor
r - resultant wind-induced response of interest
r , Br , Rr - mean, peak beackground, and peak resonant response components
r - distance
xxii
S - Strouhal number
SM(f) - power spectral density of force-balance-measured fluctuating base
bending moment
*ip
S - spectral density of the generalized force
SP(z1,z2;f) - cross spectral density of the aerodynamic load per unit height at z1,
z2 and frequency f,
qiS - power spectrum of the response
Su - spectrum or spectral density of velocity
Su1u2 - cross spectrum of velocity
( )fSv*
- normalized wind velocity spectrum with respect to the mean-
square fluctuating wind velocity,
T - observation time
T0 - average time
Tmax - maximum kinetic energy
t - time
U(z) - mean wind speed at z height
UH - wind speed at the building height in the urban terrain
Umax - maximum potential energy,
Ut - wind speed averaged over t seconds
U - mean wind speed at height z above the ground
critU - critical wind speed
u, v, w - fluctuating components of the gust in x, y, z
*u - shear velocity or friction velocity
Vdes - maximum site wind speed multiplied by the importance factor
Vn - reduced velocity
zV - mean hourly wind speed at height z
xxiii
refV - 3 s gust in exposure C at reference height
zV - peak wind velocity at height z
WE - virtual work of the external force
Wi - virtual work of the internal force
IWδ - virtual work of the inertial forces per unit of length
Xmax - maximum along-wind displacement
maxX&& - maximum along-wind acceleration
x - mean displacement
x&& - mean acceleration
( )zY - the mean deflection
( )zY&& - peak along wind or across wind acceleration in the sway mode
Y - deflection
( )xy2&& - accelerations would be developed along its length
( )zy - maximum fluctuating deflection in the direction of the mean wind
Z - amplitude ( )1Z - first-cycle generalized-coordinate mode shapes and
Z - height above the surface,
refz - reference height normally taken to be 10 m
z0 - roughness length,
z - reference height;
α - power law exponent
β - mode shape exponent.
βι - normalizing factor for iteration i
( )nχ - aerodynamic admittance function
δ - gradient height

xxiv
ε − error for all modes,.
Φ - complete set of N normalized mode shapes
Φ − N modes of vibration matrix
φ - eigenvector matrix.
Λ , λ - diagonal matrix of the eigenvalues
θ - phase angle
ρ - air density
iBqσ - non-resonating root mean square response of the i-th normal
coordinate
iDqσ - resonating root mean square response of the i-th normal coordinate
Mσ - root mean square (RMS) of the fluctuating base moment or base
torque response
( )zx&&σ - rms along-wind acceleration
( )zyσ - root mean square value of the fluctuating deflection
τ - averaging time used to evaluate the mean wind velocity 21Ω - first-cycle generalized-coordinate mode frequencies
ω - natural frequency of vibration.
ωd - damped natural frequency
2iω - eigenvalues
ξ − damping ratio
v - mean up-crossing rate
ψ - shapes of amplitude
ξ - mode exponent;
iζ - damping ratio in the i-th mode

xxv
LIST OF APPENDICES
APPENDIX TITLE PAGE A Numerical results for model 1: core wall system 154
B Numerical results for model 2: single floor deep deep outrigger system 158
C Numerical results for model 2: two floor deep outrigger system 164
D Numerical results for model 3: belt wall system 167
E Numerical results for model 4: tube-in-tube system 169
F Numerical results for model 5: megacolumn system 176
G Formulas for torsional deformation 179
H An Example from the aerodynamic website to calculate the along-wind, across-wind and torsional acceleration 180
I An example given in Section C6 in the ASCE7-02 182
CHAPTER 1
INTRODUCTION 1.1 Introduction
New structural systems including the composite one have allowed concrete
high rises to reach new heights during the last four decades. There are a wide range
of structural systems available for tall concrete buildings such as shear walls, core
supported structures, tube in tube and bundled tubes.
During the design process, engineers must ensure the system is not only
capable of resisting all loads, but also efficient, economic and satisfy the basic
serviceability requirements. The design of tall building system is primarily
dominated by the effects of wind. A tall flexible structure which is subjected to
lateral or torsional deflections under the action of fluctuating wind loads may have
oscillatory movements that can induce a wide range of responses in the building’s
occupants, ranging from mild discomfort to acute nausea. In fact, large
displacements of these structures can cause improper drainage and damage of the
windows and finishes of the building. Hence, the motions of the building that
produce effects which is intolerable by the occupants may result in an otherwise
acceptable structure becoming an undesirable or even unrentable building.
Therefore, it is important for engineers to compare a tall building response to
wind forces with published data which describe on how the different values of the
accelerations and displacements affecting human and the building itself. In order,
2
to use these data, dynamic analysis is required to allow the predicted response of the
building to be compared with the threshold limits.
1.2 Definition of Rigid and Flexible Building
A rigid structure is a structure which has the first few natural frequencies
relatively high. The structure will tend to follow any fluctuating wind forces
without appreciable amplification or attenuation. The dynamic deflections will not
be significant, and the main design parameter to be considered is the maximum
loading to which the structure will be subjected during its lifetime. Such a structure
is termed “static” and it may be analyzed under the action of static equivalent wind
forces (Stafford and Coull, 1991).
In contrast, a flexible structure has the first few natural frequencies relatively
low. If the frequencies of the fluctuating wind are below the first natural frequency,
the structure will tend to follow closely the fluctuating force actions. The dynamic
response will be attenuated at frequencies above the natural frequency, but will be
amplified at frequencies at or near the natural frequency. Consequently the dynamic
deflections may be appreciably greater than the static values. The lateral deflection
of the structure then becomes an important design parameter, and the structure is
classified as “dynamic.” Such structures require not only the dynamic stresses but
also the acceleration induced by wind load to be determined during the design
process (Stafford and Coull, 1991).
ASCE 7-02 defines flexible building or structure as slender building and
other structures that have a fundamental natural frequency less than 1 Hz, while
rigid building or other structures are defined as a building or other structure whose
fundamental frequency is greater than or equal 1 Hz. The previous version of ASCE
wind code, ASCE 7-98 also considers buildings that have a height, h, in excess of
four times the least horizontal dimension as flexible buildings. As ASCE 7-02, both
the Australian code (AS 1170.2) and Malaysian code (MS 1553:2002) also define a
building as flexible or dynamic when its first fundamental natural frequency is less
than 1 Hz
3
1.3 Drift Index and Acceleration Limit for Structures
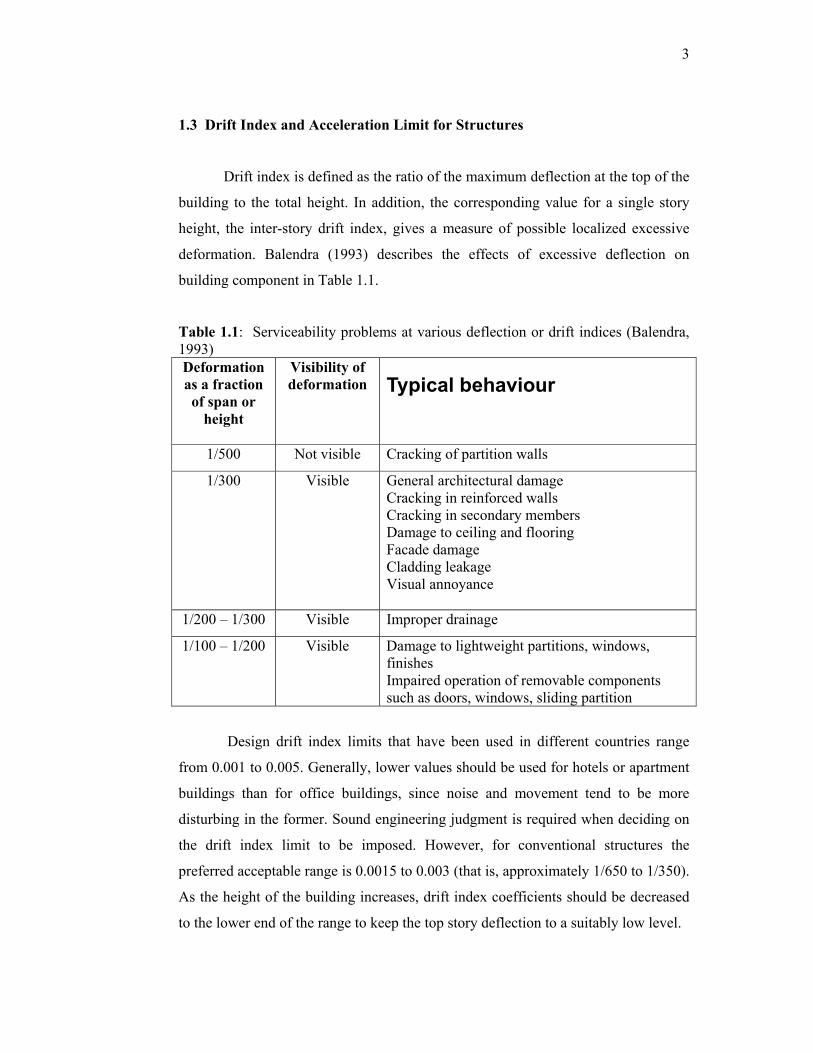
Drift index is defined as the ratio of the maximum deflection at the top of the
building to the total height. In addition, the corresponding value for a single story
height, the inter-story drift index, gives a measure of possible localized excessive
deformation. Balendra (1993) describes the effects of excessive deflection on
building component in Table 1.1.
Table 1.1: Serviceability problems at various deflection or drift indices (Balendra, 1993) Deformation as a fraction of span or
height
Visibility of deformation Typical behaviour
1/500 Not visible Cracking of partition walls
1/300 Visible General architectural damage Cracking in reinforced walls Cracking in secondary members Damage to ceiling and flooring Facade damage Cladding leakage Visual annoyance
1/200 – 1/300 Visible Improper drainage
1/100 – 1/200 Visible Damage to lightweight partitions, windows, finishes Impaired operation of removable components such as doors, windows, sliding partition
Design drift index limits that have been used in different countries range
from 0.001 to 0.005. Generally, lower values should be used for hotels or apartment
buildings than for office buildings, since noise and movement tend to be more
disturbing in the former. Sound engineering judgment is required when deciding on
the drift index limit to be imposed. However, for conventional structures the
preferred acceptable range is 0.0015 to 0.003 (that is, approximately 1/650 to 1/350).
As the height of the building increases, drift index coefficients should be decreased
to the lower end of the range to keep the top story deflection to a suitably low level.

4
The National Building Code of Canada (1990) limits the drift to 1/500 of the
height in order to limit the cracking of the masonary and interior finishes unless
detailed analysis is made and precautions are taken to permit larger movements.
Malaysian code (MS 1553:2002) also limits the total drift of wind force resisting
system to 1/500 of the height, and the inter-story drift to 1/750 of the height.
Furthermore, Clause B.1 .2 in the ASCE7-02 requires the lateral deflection
or drift of structures and deformation of horizontal diaphragms and bracing systems
due to wind effects not to impair the serviceability of the structure. However, Clause
CB.1.2 in the ASCE7-02 states that the drift limits in common usage for building
design are on the order of 1/600 to 1/400 of the building or story height (ASCE Task
Committee on Drift Control, 1988). These limits generally are sufficient to minimize
damage to cladding and nonstructural walls and partitions. Smaller drift limits may
be appropriate if the cladding is brittle. Clause CB.1.2 in the ASCE7-02 also
indicates that an absolute limit on inter-story drift may also need to be imposed in
light of evidence that damage to nonstructural partitions, cladding and glazing may
occur if the inter-story drift exceeds about 10 mm (3/8 in) unless special detailing
practices are made to tolerate movement (Freeman 1977; Cooney and King 1988).
However, many components can accept deformations that are significantly larger.
There are as yet no generally accepted international standards for comfort
criteria, although they are under active consideration. In recent years, a considerable
amount of research has been carried out into the important physiological and
psychological parameters that affect human perception to motion and vibration in
the low frequency range of 0-1 Hz encountered in tall buildings. It is now generally
agreed that acceleration is the predominant parameter in determining the nature of
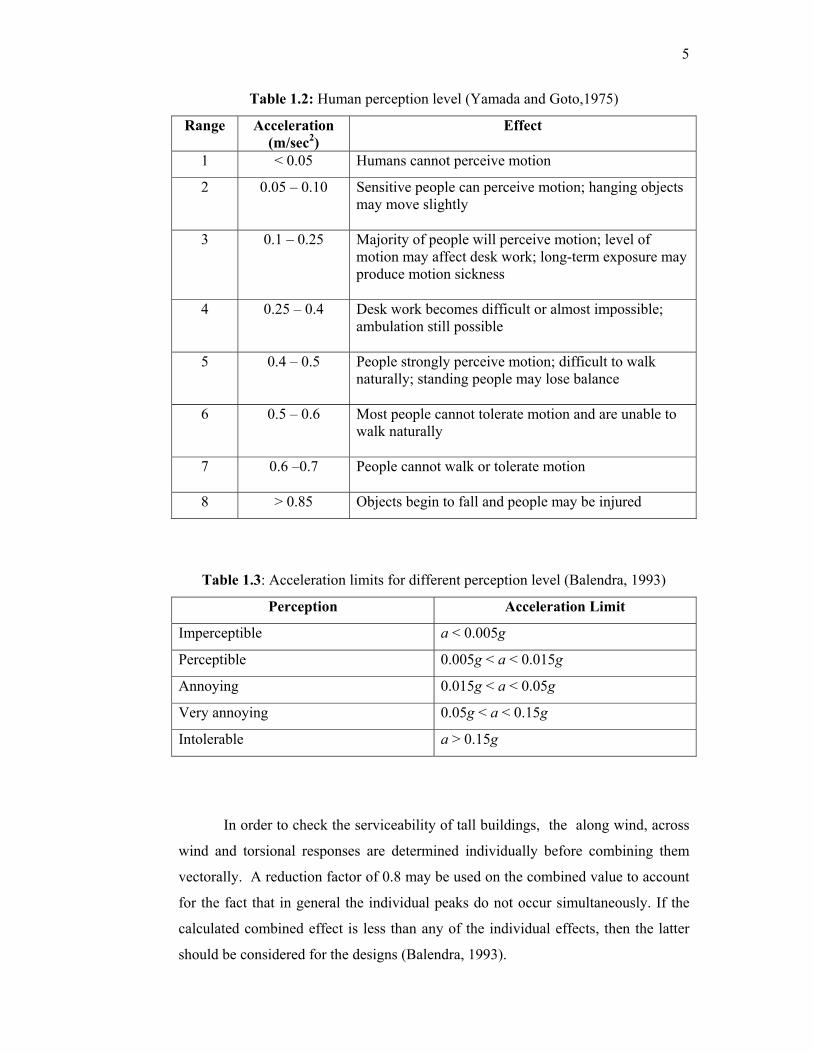
human response to vibration (Irwin, 1986). Table 1.2 and Table 1.3 illustrate how
human behaviour and motion perception are affected by different ranges of
acceleration.
5
Table 1.2: Human perception level (Yamada and Goto,1975)
Range Acceleration (m/sec2)
Effect
1 < 0.05 Humans cannot perceive motion
2 0.05 – 0.10 Sensitive people can perceive motion; hanging objects may move slightly
3 0.1 – 0.25 Majority of people will perceive motion; level of motion may affect desk work; long-term exposure may produce motion sickness
4 0.25 – 0.4 Desk work becomes difficult or almost impossible; ambulation still possible
5 0.4 – 0.5 People strongly perceive motion; difficult to walk naturally; standing people may lose balance
6 0.5 – 0.6 Most people cannot tolerate motion and are unable to walk naturally
7 0.6 –0.7 People cannot walk or tolerate motion
8 > 0.85 Objects begin to fall and people may be injured
Table 1.3: Acceleration limits for different perception level (Balendra, 1993)
Perception Acceleration Limit
Imperceptible a < 0.005g
Perceptible 0.005g < a < 0.015g
Annoying 0.015g < a < 0.05g
Very annoying 0.05g < a < 0.15g
Intolerable a > 0.15g
In order to check the serviceability of tall buildings, the along wind, across
wind and torsional responses are determined individually before combining them
vectorally. A reduction factor of 0.8 may be used on the combined value to account
for the fact that in general the individual peaks do not occur simultaneously. If the
calculated combined effect is less than any of the individual effects, then the latter
should be considered for the designs (Balendra, 1993).

6
Since the tolerable acceleration levels increase with period of building, the
recommended design standard for peak acceleration for 10-year wind in commercial
and residential buildings is as depicted in Figure 1.1 (Griffis,1993). Lower
acceleration levels are used for residential buildings for the following reasons:
1. Residential buildings are occupied for longer hours of the day and night and
are therefore more likely to experience the design wind storm
2. People are less sensitive to motion when they are occupied with their work
than when they relax at home.
Figure 1.1: Design standard on peak acceleration for 10-year return period (after, Griffis, 1993)
The National Building Code of Canada (1990) recommends the acceleration
limit to be 1-3% of gravity (0.09 to 0.27 m/sec2) once in every 10 years, the two
figures being more appropriate for apartment and office blocks respectively.
Malaysian wind code , MS 1553:2002 requires the acceleration of a building due to
wind-induced motion not exceed 1.0% of gravity for residential structures and 1.5%
of gravity for other structures, of the acceleration due to gravity.
Clause CB1.3 in the ASCE7-02 states that excessive structural motion is
mitigated by measures that limit building or floor accelerations to levels that are not
disturbing to the occupants or do not damage service equipment. Perception and
tolerance of individuals to vibration is dependent on their expectation of building
performance (related to building occupancy) and to their level of activity at the time
the vibration occurs (ANSI 1983). Individuals find continuous vibrations more
objectionable than transient vibrations. Continuous vibrations (over a period of
minutes) with acceleration on the order of 0.005 g to 0.01 g are annoying to most

7
people engaged in quiet activities, whereas those engaged in physical activities or
spectator events may tolerate steady-state acceleration in the order of 0.02g to 0.05g.
Thresholds of annoyance for transient vibrations (lasting only a few seconds ) are
considerable higher and depend on the amount of structural damping present
(Murray, 1991). A typical finished floor will have 5% damping or more and peak
transient accelerations of 0.05 g to 0.1 g may be tolerated.
1.4 Problem Statement
Despite the importance of analyzing the building responses (displacement
and acceleration) as explained in Section 1.3, there are no systematic study that has
been conducted on the effectiveness of the different tall building systems in
minimizing the responses of the building due to wind. There are several tall building
systems available such as outriggers, belt wall, tube-in-tube, core wall and mega
columns. However, no study has been performed to determine on how effective
these tall building systems are in reducing the displacements and accelerations of tall
buildings that are being exerted by wind forces. It is not known which tall building
system is the most effective system to reduce the responses of the buildings due to
wind.
Research on the effect of certain parameters such as dimension and location
of the structural systems in the effectiveness of the systems in reducing the building
responses has also not been performed. Is increasing the thickness of the core wall or
increasing the dimension of the core wall is better in reducing the responses of the
building due to wind? Where is the best location to place the outriggers so that the
responses of the building due to wind can be minimized? How effective is the belt
wall in reducing the responses of the building due to wind compared to outrigger
system? What is the optimum spacing of the parameter columns of the tube-in-tube
systems in reducing the responses of the buildings due to wind? How effective is
megacolumn system in minimizing the responses of the buildings due to wind?

8
1.5 Objective
The objective of this research is to study the effectiveness of five tall
building structural systems: core wall, outrigger, belt wall, tube-in-tube and mega
column in minimizing the building response (displacement and acceleration) to
wind. There are different objectives to be accomplished for each different tall
building structural studied. The objective of studying :
• the core wall is to determine whether increasing the thickness or
increasing the dimensions of the core wall is more effective in reducing the
responses of the building due to wind;
• the outrigger is to determine the best location to construct the
outrigger so that the responses of the building due to wind can be minimized;
• the belt wall is to study the effectiveness of the belt wall in reducing
the responses of the building due to wind compared to the outrigger system;
• the tube-in-tube system is to find the optimal spacing of the perimeter
columns in minimizing the responses of the building due to wind;
• the megacolumn system is to study the effectiveness of this system
and combination of megacolumn and other structural elements such as outriggers
and belt wall in reducing the responses of the building due to wind.
Another objective of this research is to determine which tall building system among
the five systems: core wall, outriggers, belt wall, tube-in-tube and mega columns
studied that is the most effective system in minimizing the responses of the building
due to wind.
1.6 Scope
The building studied is a tall flexible building which has a square plan. A tall
flexible building must have the ratio of height to the lateral dimension more than 1:4
and natural frequency less than 1 Hz as explained in Section 1.2. Thus, the
buildings studied has the ratio of height to the lateral dimension of the building 1:6
and their natural frequencies will be less than 1 Hz. The reason of choosing the ratio
of height to the lateral dimension of the building 1:6 is because the ratio 1:6 is the
largest ratio of height to the lateral dimension of the building available in the

9
aerodynamic data base. It is impossible to obtain the values of the across-wind and
torsional responses for buildings if the ratio of height to the lateral dimension of the
building is more than 1:6 as experimental data for these buildings are not available.
Note that currently, no formula is available in calculating the across-wind responses
and torsional responses. The formulae that are available such as from the Australian
Code (AS 1170.80), Japanese code (RLB-AIJ-1993), Canadian code (NBC-1995),
the aerodynamic data base of University of Notre Dame, United States of America
and other literatures are empirical formulae that are based on experimental
data(Simiu and Scanlan, 1996).
The lateral system of the tall building is reinforced concrete. Five types of
tall building systems will be analyzed are:
• Core wall
• Outrigger
• Outrigger with belt wall
• Tube-in-tube
• Megacolumn
The manipulated variables for each system are presented in detail in Chapter 3.
The building will be exerted by wind loading for three different wind
environments which are:
• Malaysia (benign wind environment)
• New York (aggressive wind environment)
• Hong Kong (one of the most aggressive wind environment in the
world)
According to Holmes (2003), the extreme wind classification for Malaysia, New
York and Hong Kong is I, III and IV, respectively. Holmes has developed
classification systems to ‘grade’ any country or region in terms of its general level of
wind speed. Level I has the lowest wind speed while Level V has the highest wind
speed. Chapter 3 will describe further, about the values of wind speed used and the
calculation of wind speed for different averaging time.

10
1.7 Methodology
The methodology of this project is as shown in the flowchart in Figure 1.2, and is described in detail in Chapter 3.
Figure 1.2: A flow chart showing the steps taken in the calculation of responses of
the buildings due to wind.
Obtain the value of CM and σCM from the aerodynamic database
Calculate the along-wind responses by using the FOTRAN program written based on the method in ASCE7-02. Three wind speeds which correspond to Malaysian, New York and Hong Kong wind environment are used.
Extract the eigenvectors needed. The eigenvectors are the displacements in the across-wind direction of the joints located nearest to the longitudinal axis of the building.
Model the building by using the structural finite element software, GTSTRUDL
Analyse the building model to obtain the eigenvalues and eigenvectors in the along-wind, across-wind and torsional mode by using GTSTRUDL .
Calculate the value of fB/U where f = frequency in the across-wind or torsional mode, B = breadth of building, U = wind speed. Note that fB/U is calculated for the three wind speeds which correspond to Malaysian, New York and Hong Kong wind environment.
Calculate the across-wind and torsion acceleration by using the FOTRAN program written based on formula provided in the aerodynamic database of University of Notre Dame, U.S. A.
Calculate across-wind displacement.
Choose the dimension of the structural elements, such as the size and thickness of core wall.
Repeat for different dimension or location of the structural element for each different structural tall building system: core wall, outriggers, belt wall, tube-in-tube, and megacolumn.

11
1.8 Overview of the Thesis
Chapter 2 is a literature review. It will discuss about the development of the
research of the effects of wind to tall building. It also explains briefly about the
important subjects in wind engineering such as averaging wind speed, wind profile,
along-wind, across-wind and torsional response of tall buildings.
Chapter 3 will describe about the methodology used in the research in
depth. Not only will it discuss on how the building is modeled in order to obtain
the natural frequency and eigenvector, but it will also discuss about the problems
in performing eigenvalue analysis by using the finite element methods. This
chapter will also describe the procedure to determine the along-wind responses
in ASCE 7-02 and across-wind and torsional responses in the University of
Notre Dame aerodynamic database.
Chapter 4 will present the results obtained from the study for three tall
building systems: core wall, outriggers and belt wall systems. These results are
discussed in detail in this chapter.
Chapter 5 will provide results from the study for the other two building
systems: tube-in-tube and megacolumns. The results are also discussed in depth in
this chapter.
Finally, Chapter 6 will draw the conclusions on this project. Suggestions for
further study in this area will also be proposed.

146
REFERENCE
American National Standards Institute (1982). Minimum Design Loads for Buildings and Other Structures, New York , American National Standard A58.1-1982
American National Standards Institute (ANSI). (1983). American National Standard Guide to the Evaluation of Human Exposure to Vibration in Buildings. ANSI S3.29-1983, New York.
American Society of Civil Engineers (2002). Minimum Design Loads for Buildings and Other Structures, New York, ASCE 7-02
ASCE Task Committee on Drift Control of Steel Building Structures. (1988). Wind Drift Design of Steel-framed Buildings: State of the Art. J. Struct. Div., ASCE 114(9):2085-2108.
Associate Committee on the National Building Code and National Research Council of Canada. Canadian Structural Design Manual, Supplement. Ottawa, No. 4. 1975
Bailey, A., Vincent, N.D.G. (1943). Wind Pressures on Buildings Including Effects of Adjacent Buildings. Journal of Civil Engineering, 20(8):243-275.
Baker, W.F., Brown, C.D., Sinn, R.C. (1998). Belt Wall / Core Interacting System for 77-Story Plaza Rakyat Tower. Structural Engineering World Wide. T114-3.
Balendra, T. (1993). Vibration of Buildings to Wind and Earthquake Loads, Springer-Verlag.
Bathe, K.J. (1996). Finite Element Procedures in Engineering Analysis. New Jersey: Prentice-Hall.
Boggs, D.W. (1989). Aerodynamic Model Tests of Tall Buildings. Journal of Engineering Mechanics, 115(3):618-635.
Boggs,D.W., Peterka,J.A., (1989). Aerodynamic Model Tests of Tall Buildings. Journal of Engineering Mechanics ASCE 115:618-635.
Breuer, P., Chmielewski, T., Gorski,P., Konopka, E. (2002). Application of GPS Technology to Measurements of Displacements of High-rise Structures Due to Weak Winds. Journal of Wind Engineering and Industrial Aerodynamics. 90:223-230
Brown M.W.J., Ang, C.K. (1998). Full-scale Dynamic Response of High-rise
Building to Lateral Loading. Journal of Performance of Constructed Facilities. 12(1):33-
40.
Buchholdt, H.A. (1997). Structural Dynamics for Engineers, London: Thomas Telford
Publications.
Campbell, S., Kwok, K.C.S., Hitchcock, P.A. (2005). Dynamic Characteristics and
Wind-Induced Response of Two High-rise Residential Building During Typhoons. Journal
of Wind Engineering and Industrial Aerodynamics. 93:461-482.

147
Cermak, J.E. (1952). Application of Modeling Techniques to Mass Transfer and
Evaporation Studies, Paper Presentation, Centennial of Engineering, Chicago, IL:15 pp.
Cermak, J.E. (2003). Wind-tunnel Development and Trends in Application to Civil
Engineering, Journal of Wind Engineering and Industrial Aerodynamics 91:355-370
Chan, C.M. (2001). Optimal Lateral Stiffness Design of Tall Buildings of Mixed Steel
and Concrete Construction. The Structural Design of Tall Buildings. 10:155-177.
Chen, X. and Kareem, A. (2005). Validity of Wind Load Distribution based on High
Frequency Force Balance Meaurements. Journal of Structural Engineers. 131(6):984-987
Chen, X., Kareem, A. (2004). Equivalent Static Wind Loads on Buildings: New
Model. Journal of Structural Engineering. 130(10):1425-1435.
Chen,X., Kareem, A. (2005). Coupled Dynamic Analysis and Equivalent Static Wind
Loads on Buildings with Three-Dimensional Modes. Journal of Structural Engineering.
131(7):1071-1082.
Cochran,L.S., Peterka,J.A., (2001). On Breached Building Envelopes and Increased
Internal Pressure. Proceedings of the International Conference on Building Envelopes
Systems and Technologies. 2001. Ottawa,Canada:83-87
Cook, R.D. (1995). Finite Element Modeling for Stress Analysis. Canada: John Wiley
& Sons.
Cooney, R.C. and King, A.B. (1988). Serviceability Criteria for Buildings. BRANZ
Report SR14, Building Research Association of NewZealand, Porirua, New Zealand
Coyle, D.C. (1931). Measuring the Behaviour of Tall Buildings. Engineering News-
Record. :310-313
Csanady, G.T. (1967). On the Resistance Law of a Turbulent Ekman Layer. J. Atmos.
Sci., 24:467-471
Davenport, A.G. (1961). The Application of Statistical Concepts to the Wind Loading
of Structures. Proc. Inst. Civil Eng., 19:449-472
Davenport, A.G. (1963). The buffeting of structures by gusts. Proceedings,
International conference on Wind Effects on Buildings and Structures, Teddington U.K. 26-
8 June: 358-91
Davenport, A.G. (1964). Note on the Distribution of the Largest Value of a Random
Function with Application to Gust Loading. Proc. Inst. Civil Eng. 28:187-196

148
Davenport, A.G. (1965). The Relationship of Wind Structure to Wind Loadingl
Proceedings of the Symposium on Wind Effects on Buildings and Structures, National
Physical Laboratory. Teddington, U.K. : Her Majesty’s Stationery Office. London, 53 – 102
Davenport, A.G. (1967). Gust Loading Factors. J. Struct. Div., ASCE . 93:11-34
Davenport, A.G. (1968). The Dependence of Wind Load upon Meteorological
Parameters. Proc. Intl. Res. Sem. Wind Effects on Buildings and Structures, Toronto:
University of Toronto Press, 19-82
Department of Standards Malaysia. (2002). Code of Practice on Wind Loading for
Building Structure. Shah Alam, MS 1553:2002.
Dryden, H.L. and Hill, G.C. (1933). Wind Pressure on a Model of the Empire State
Building. Journal of Research of the National Bureau of Standards. 10:493-523
Durst, C.S. (1960). Wind Speeds Over Shor Periods of Time. Meteorol. Mag. 89:181-
186
ESDU. (1976). The Response of Flexible Structures to Atmospheric Turbulence.
London. Item 76001, Engineering Sciences Data Unit.
Freeman, S. (1977). Racking Tests of High Rise Building Partitions. J. Struct. Div.,
ASCE 103(8):1673-1685.
Greig, G.L. (1980). Toward an Estimate of Wind-Induced Dynamic Torque on
TallBuildings. University of Western Ontario: Master’s Thesis
Griffis, L.G. (1993). Serviceability Limit States Under Wind Load. Eng. J., AISC:1-16.
Gu, M., Quan, Y. (2004). Across-Wind Loads of Typical Tall Buildings. Journal of
Wind Engineering and Industrial Aerodynamics. 92:1147-1165.
Hart, G.C., DiJulio, R.M., Lew,M. (1975). Torsional Response of High Rise Buildings.
J. Struct. Div., ASCE, 101:397-416
Hellman, G. (1916). Über die Bewegung der Luft in den untersten Schichten der
Atmosphäre, Meteoroll Z., 34:273
Ho,T.C.E., Lythe,G.R.,Isyumov,N., (1999). Structural Loads from the Integration of
Simultaneously Measured Pressures. Proceedings of the International Conference on Wind
Engineering. 1999. Copenhagen, Denmark.
Hoenderkamp, J.C.D. (2002a). Critical Loads of Lateral Load Resisting Structures for
Tall Buildings. The Structural Design of Tall Buildings. 11(3):221-232
149
Hoenderkamp, J.C.D. (2002b). Simplified Analysis of Asymmetric high-rise Structures
with Cores. The Structural Design of Tall Buildings. 11:93-107
Holmes, J.D. (2001). Wind Loading of Structures. London: Spon Press.
Irwin, A.W. (1986). Motion in Tall Buildings. Proc. Conf. On Tall Buildlings. Second
Century of the Skyscraper, Chicago: 759-778
Isyumov, N. and Poole, M. (1984). Wind-Induced Torque on Square and Rectangular
Building Shapes, Proceedings Sixth International Conference on Wind Engineering,
Amsterdam: Elsevier.
Jain, A., Srinivasan, M. and Hart, G.C. (2001). Performance Based Design Extreme
Wind Loads on a Tall Building. The Structural Design of Tall Buildings. 10:9-26.
Jensen, M. (1958). The Model-law for Phenomena in Natural Wind, IngeniNren,
2(4):121-128.
Kaimal, J.C. et al. (1972). Spectral Characteristics of Surface-Layer Turbulence. J.
Royal Meteorol. Soc., 98:563-589
Kareem, A. (1985). Lateral-Torsional Motion of Tall Buildings to Wind Loads.
Journal of Structural Engineering. 111(11):2479-2496.
Kareem, A. (1990). Measurements of Pressure and Force Fields on Building Models in
Simulated Atmospheric Flows. Journal of Wind Engineering and Industrial Aerodynamics.
36:589-599.
Kareem, A. (1985). Lateral –torsional Motion of Tall Buildings. Journal of Structural
Engineering. 111(11):2479-2496.
Kareem, A. (1989). Mapping and Synthesis of Random Pressure Fields. Journal of
Engineering Mechanics, ASCE 115(10).
Kareem, A. and Kijewski, T. (2002). Time-frequency Analysis of Wind Effects on
Structures. Journal of Wind Engineering and Industrial Aerodynamics. 90:1435-1452
Kareem, A., Kijewski, T. and Tamura, Y., (1999). Mitigation of Motions of Tall
Buildings with Specific Examples of Recent Applications. Wind & Structures. 2(3):201-
251.
Kareem,A., and Cheng, C.M. (1984). Acrosswind Response of Towers and Stacks of
Circular Cross-section. Rep. No. UHCE 84-5, Dept. of Civil Engineering, Univ. of
Houston, Houston.
150
Kijewski,T., Haan, F., Kareem, A. (2001). Wind-Induced Vibrations. In: Braun, S.G.,
Ewins, D.J. and Rao, S.S. Encyclopedia of Vibration. Academic, New York, 1578-1587
Kijewski,T., Kareem,A. (1998). Dynamic Wind Effects: A Comparative Study of
Provisions in Codes and Standards with Wind Tunnel Data. Wind and Structure. 1(1):77-
109
Kwok, K.C.S. and Melbourne, W.H. (1988). Dynamic Analysis of Wind Sensitive
Buildings and Structures to Wind Action- a Codified Approach. Prod. 4th Int. Conf. on Tall
Buildings, Hong Kong and Shanghai, April/May, 1988. Vol.1:424-430.
Lanczos, C. (1950). An Iteration Method for the Solution of the Eigenvalue Problem of
Linear Differential and Integral operators. Journal of Research of the National Bureau of
Standards. 45:255-282.
Leger, P. (1986). Numerical Techniques for the Dynamic Analysis of Large Structural
Systems, University of California, Berkeley: Ph. D. Dissertation.
Li,Q.S., Fang,J.Q., Jeary,C.K., Wong,C.K. (1998). Full Scale Measurements of Wind
Effects on Tall Buildings. Journal of Wind Engineering and Industrial Aerodynamics. 74-
76:741-750.
Liepmann, H.W. (1952). On the Application of Statistical Concepts to the Buffeting
Problem. Journal of Aeronautical Science. 19(12):793-800,822.
Lin, N., Letchford, C., Tamura, Y., Liang, B., Nakamura, O. (2005). Characteristics of
Wind Forces Acting on Tall Buildings. Journal of Wind Engineering and Industrial
Aerodynamics. 93:217-242.
Millikan, C.B. (1938). A Critical Deiscussion of the Turbulent Flows in Channels and
Circular Tubes. Proceeding of the Fifth International Congress of Aplied Mechanics,
Cambridge, MA.
Murray, T. (1991). Building floor vibrations. Engrg. J., AISC 28(3):102-109
National Research Council of Canada (1990). National Building Code of Canada.
Ottawa, Canada.
Oosterhout,G.P.C. (1996). The Wind-induced Dyanmic Response of Tall Buildings, a
Comparative Study. Journal of Wind Engineering and Industrial Aerodynamics. 64:135-
144.
Peterka, J.A., Cochran, L.S., Boggs, D.W., Hosoya, N., Downing, M. (1994).
Simultaneous Peak Pressure Measurements in the Wind Tunnel. Proceedings of the
151
International Conference on Building Envelope Systems and Technology. 1994. Singapore:
354-359.
Rathbun, J.C. (1940). Wind Forces on a Tall Building. Transactions, American
Society of Civil Engineers. 105: 1- 41
Reinhold, T.A. and Sparks, P.R. (1980). The Influence of Wind Direction on the
Response of a Square-Section Tall Building, Proceedings Fifth International Conference on
Wind Engineering. July. Elmsford, NY: Pergamon Press.
Robson, J.D. (1963). An Introduction to Random Vibration. Scotland: Edinburgh
University Press.
Rosati, P.A. (1968). An Experimental Study of the Response of a Square Prism to Wind
Load, Faculty of Graduate Studies, BLWT II-68, University of Western Ontario, London,
Ontario, Canada.
Saunders, J.W. and Melbourne, W.H. (1975). Tall Rectangular Bulding Response to
Cross-Wind Excitation. Proc. 4th Int. Conf. on Wind Effects on Buildings and Structures,
London: University of Cambridge Press, Cambridge.
Schubauer G.B. and Tchen, C.M. (1961). Turbulent Flow, Princeton Univ. Press,
Princeton, NJ.
Simiu, E. (1980). Revised Procedure for Estimating Along-Wind Response. Journal of
Structural Division, ASCE. 106(ST1):1-10
Simiu, E., Scanlan, R .H. (1996). Wind Effects on Structures: Fundamentals and
Appllications to Design. 3rd ed. New York: John Wiley & Sons.
Solari, G. (1982). Along-Wind Response Estimation: Closed Form Solution, Journal
of Structural Division, ASCE 108(ST1):225-244
Solari, G. (1993a). Gust Buffeting I: Peak Wind Velocity and Equivalent Pressure. J.
Struct. Eng., 119(2):383-397
Solari, G. (1993b). Gust Buffeting II: Dynamic Along wind Response. J. Struct. Eng.
ASCE. 119(2):383-398
Solari, G. and Kareem, A. (1998). On the Formulation of ASCE 7-95 Gust Effect
Factor. J. Struct. Eng. Ind. Aerodyn., 77 and 78:673-684
Stafford Smith, B. and Nwaka, I. O. (1980). Behaviour of Multioutrigger Braced Tall
Buildings, ACI Special Publication SP-63:515-541
Stafford Smith, B and Coull, A. (1991). Tall Building Structures: Analysis and Design.
New York: John Wiley & Sons.

152
Steckley,A., Accardo,M., Gamble, S.L., Irwin, P.A (1992). The Use of Integrated
Pressures to Determine Overall Wind-induced Response. Journal of Wind Engineering and
Industrial Aerodynamics 41-44:1023-1034.
Taranath, B.S. (1988). Structural Analysis and Design of Tall Buildings, New York:
McGraw-Hill
Thepmongkorn, S. and Kwok, K.C.S. (2002). Wind-induced Responses of Tall
Buildings Experiencing Complex Motion. Journal of Wind Engineering and Industrial
Aerodynamics. 90:515-526
Tschanz, T. (1983). The Base Balance Measurement Technique and Applications to
Dynamic Wind Loading of Structures. The University of Western Ontario: Ph. D. Thesis.
Vickery, B.J. (1970). On the Reliability of Gust Loading Factors, Proc. Tech. Meet.
Concerning Wind Loads on Buildings and Structures, National Bureau of Standards,
Building Science Series 30, Washington D.C.
Vickery, B.J. (1995). The Response of Chimneys and Tower-like Structures to Wind
Loading. A State of the Art in Wind Engineering, Proc. , 9th Int. Conf. On Wind
Engineering, New Delhi, India, Wiley Eastern :205 - 233
Vickery, B.J. (1970). On the Reliability of Gust Loading Factors, Proc. Tech. Meet.
Concerning Wind Loads on Buildings and Structures. Washington D.C. National Bureau of
Standards, Building Science Series 30.
Vickery, B.J. (2004). Wind Loads and The Wind-Induced Response of Tall Buildings
and Towers. State-of-the-art Wind Tunnel Modelling and Data Analysis Techniques for
Infrastructure and Civil Engineering Applications. December 6-10. Hong Kong University
of Science and Technology, Kowloon, Hong Kong: Croucher Advanced Study Institute, 1-
29
Yamada,M. and Goto,T. (1975). The Criteria to Motions in Tall Buildings. Proc. Pan-
Pacificic Tall Buildings Conference, Hawaii, 233-244
Young,W.C., Budynas,G.R. (2002). Roark’s Formulas for Stress and Strain. 7th ed.
New York: McGraw-Hill.
Zhou, Y., and Kareem, A. (2003). Gust Loading Factor – Past, Present and Future.
Journal of Wind Engineering and Industrial Aerodynamics. 91:1301 – 1328
Zhou, Y., Gu, M., Xiang, H.F. (1999). Along-wind Static Equivalent Wind Loads and
Response of Tall Buildings. Part II: Effects of Mode Shape. J. wind. Eng. Ind. Aerodyn.,
79(1-2):151–158

153
Zhou, Y., Kareem, A. (2003). Aeroelastic Balance. Journal of Engineering Mechanics
ASCE. 129(3):283-292
Zhou, Y., Kareem,A. (2001). Gust Loading Factor: New Model. Journal of Structural
Engineering. 127(2):168-175
Zhou, Y., Kareem,A. (2002). Definition of Wind Profiles in ASCE 7. Journal of
Structural Engineering. 128(8):1082-1086
Zhou,Y., Kijewski,T., Kareem,A. (2002). Along-Wind Load Effects on Tall Buildings:
Comparative Study of Major International Codes and Standards. Journal of Structural
Engineering.128(6):788-796.
Zhou,Y., Kijewski,T., Kareem,A. (2003). Aerodynamic Loads on Tall Buildings:
Interactive Database. Journal of Structural Engineering. 129(3):394-404.