the effectiveness of advertisements using the social norms
TRANSCRIPT

The Effectiveness of Advertisements using the Social Norms Theory versus Guilt Appeals to
Motivate College Students
Erin Caruso
Joe Dreyer
Caroline Jacobs
Ashley Porcuna
Tori Ward
Louisiana State University

1
In today’s society, many people associate college as a time of unhealthy choices that
involve binge drinking, tobacco use and unprotected sex. These behaviors have negative
consequences that affect students, communities and families. For example, excessive binge
drinking can lead to a number of problems: car accidents, academic problems, depression, health
issues and even death (NIAAA, n.d.). Statistics show that 50 percent of college students, who
drink, also consume alcohol through binge drinking (NIAAA, n.d.). Tobacco can also lead to a
long line of health issues, including addiction, cancer, increased risk of many diseases and
infertility (CDC, 2013). In 2011, 18.9 percent of adults aged 18-24 were smokers (CDC, 2013).
Many universities and other organizations aim to reduce these unhealthy behaviors by creating
advertising campaigns to encourage prevention and healthy habits.
In order for prevention campaigns to resonate with college students, organizations need
to understand how to effectively communicate with their intended audience. While trying to
understand how to communicate adequately to the specific audience many questions arose. How
can you communicate a message to college students regarding the concerns of drinking and
smoking in ways that will promote action and change? What is the most effective way to
communicate the concerns of drinking and smoking to college students that will generate
positive results in awareness and action? Questions such as these will be instrumental in creating
an effective questionnaire to gauge college students’ perceptions and understand effective ways
to communicate with the audience.
Two strategies of communication will be discussed and analyzed in this experiment:
social norms theory and the use of guilt appeals. Both approaches are derived from different
views on how behaviors are influenced. It is important to understand why college students
participate in these unhealthy behaviors in order to create prevention strategies and promote

2
healthy habits. This topic is important in trying to discover which theory is more effective in
changing attitudes and behaviors about college alcohol consumption and tobacco use.
Our main objective for this experiment is to analyze and measure the amount of
motivation students have to process each advertisement. We hope that the results will help us
determine which technique LSU students feel more motivated by. We believe that LSU students
will process the advertisements that use a guilt appeal more than the social norms theory
advertisements. Support for this expectation comes from the previous use of guilt appeals in
advertisements. This method appeals to emotions and stimulates feelings of remorse (Dillard &
Pfau, 2002). We believe that a stronger reaction will be achieved by appealing to emotions
rather than by providing objective information on the actual norm.
Literature Review
Social Norms Theory
Social norms theory states that human behaviors are influenced by misperceptions of
peers’ attitudes and actions. This theory is mostly used to promote health related messages
regarding college student’s behaviors; this includes, but is not limited to, alcohol consumption,
sex, tobacco use and driving habits (Boston University, 2013). In recent years, many campaigns
have been used to change what students perceive as the social norm for different issues. This
theory aims to understand peer influences on individuals in order to correct their perception of an
issue and, ultimately, change their behaviors (Boston University, 2013). These influences create
two societal norms: the perceived norm and the actual norm. The perceived norm is what we
think it is that others do or believe. The actual norm is what they actually do and what they truly

3
believe. The gap between what is perceived and actual is a misperception, and this forms the
foundation for the social norms approach (Boston University, 2013).
Alan D. Berkowitz and H. Wesley Perkins, the first two researchers to propose this
theory, developed the social norms theory from an analysis they did on student alcohol use
patterns in 1986. The study showed that students on average overestimated the amount of their
peers who participated in unhealthy drinking habits (1986). They also concluded that this
misperception correlated with individuals’ drinking habits. The social norms theory tries to
correct the common misconceptions people place on certain matters by giving factual
information. The correction of this perception is hypothesized to lessen peer influences and in
effect change behaviors (1986).
Reactions to Social Norming Theory
A reaction is defined as the way someone acts or feels in response to something that
happens, is said, etc. (Gerrig & Zimbardo, 2002). Students have reacted to the social norms
approach in several different ways. While audiences have received and responded to some social
norms campaigns, other campaigns were doubted and ineffective. Often, due to misperceptions,
audiences are resistant to accept the information that is presented as being accurate (Berkowitz,
2004). This causes the campaign to be ineffective in correcting the misperceptions and,
furthermore, achieving any change in attitude or behavior.
Social Norm Theory: Attitudes and Opinions
An attitude is a tendency to respond to people, concepts, and events in an evaluative way
(Gerrig & Zimbardo, 2002). Similarly, an opinion is a view, judgment, or appraisal formed in the
mind about a particular matter (Gerrig & Zimbardo, 2002). Social norms theory describes three

4
common types of misperceptions that may have an affect on people’s attitudes and opinions.
Pluralistic ignorance is the most common misperception. Pluralistic ignorance occurs when the
majority of individuals falsely presume that most of their peers behave or think differently from
them when in actuality their attitudes and/or behavior are similar (Berkowitz, 2004). The second
misperception, false consensus, occurs when the minority of people with unhealthy attitudes
and/or behaviors incorrectly thinks that they are in the majority (Berkowitz, 2004). Finally, false
uniqueness occurs when individuals who are in the minority assume that their behavior is more
unique than it actually is (Berkowitz, 2004). These misperceptions can significantly influence a
person’s attitudes and opinions, which, in turn, affect a person’s behavior.
Social Norm Theory: Behaviors
A behavior is defined as one’s actions or the manner of conducting oneself (Gerrig &
Zimbardo, 2002). Social norms theory aims to understand influences that change people’s
behaviors. The theory states that behavior is influenced by perceptions of how other members of
social groups think or act. Social norms theory views peer influence as the primary source that
affects how people behave. (Berkowitz, 2004). This theory implies that due to pluralistic
ignorance, most college students drink moderately or not at all. They incorrectly assume that
other college students drink more than themselves and also more than they do in reality. This
causes individuals to stifle healthy attitudes and behaviors and encourages them to engage in the
unhealthy behaviors that are seen incorrectly as normative (Berkowitz, 2004).
Guilt Appeals
Guilt appeals influence a person’s beliefs or actions based on a feeling of remorse for a
particular behavior that the person has taken part in. Guilt appeals have been a method of

5
persuasion used for quite some time by organizations or advocates wishing to promote a cause or
a call to action for their message (Dillard & Pfau, 2002). The purpose of the guilt appeal is to
evoke emotions from a person, causing them to feel remorseful and in return change their
behavior or attitude and take action. Examples of this can be seen in advertisements that ask for
charitable donations. Some use video or pictures to display sickly individuals who are suffering
from starvation and offering a message that refers to the amount of food the viewer eats per day
compared to how much the people in the advertisement eat. Another example would be an
advertisement that advocates against cigarettes by targeting smokers and the effects second hand
smoke has on the population of non-smokers around them. The goal of guilt appeal is to trigger
an emotional response from persons generating a feeling of regret. In turn, the response would
ideally cause an individual to rethink his or her actions and react inversely to past actions (Block,
2006).
Reactions to Guilt Appeals
Guilt is an ideal emotion to manipulate in order to influence social behaviors. People
typically react to guilt by feeling remorseful, feeling responsible for the wrongdoing and wishing
they could take back their actions (Dillard & Pfau, 2002). There are two different ways that
people react when trying to eliminate the unwanted feeling of guilt. They will either try to reduce
the guilt or avoid the guilt. When an individual attempts to reduce the guilt they are more likely
to be persuaded than an individual who seeks to avoid the guilt. This is because higher levels of
perceived guilt facilitate persuasion in guilt reduction, where higher levels of perceived guilt
undermine persuasion in guilt avoidance (Block, 2006).
Guilt Appeals: Attitudes and Opinions

6
A person’s attitude about a certain value can affect how they respond to guilt appeals. If
an individual does not accept the norm or value that their behavior went against, then they may
accept responsibility for the action without experiencing guilt. When an action is inconsistent
with an individual’s typical standards, they are more likely to feel guilt and motivation to make
amends for the wrongdoing (Dillard & Pfau, 2002).
Guilt Appeals: Behaviors
Anticipated emotions have the ability to influence an individual’s intentions and actions.
Since the anticipation of guilt has the power to affect behavior, there is a possibility for
persuasion. A persuader can use guilt appeals to target the anticipated feeling in the audience in
order to sway their behaviors (Block, 2006). An individual’s behavior is ultimately what enables
the guilt appeal to work. When a person’s actions violate their standards, they feel guilty which
motivates them to change their behaviors. Guilt has a distinctive action-motivating aspect,
making it ideal for persuasion in advertisements (Dillard & Pfau, 2002).
Current research for both methods identifies responses and opinions from subjects that
have been exposed to each approach individually. In our study, we will examine the social norms
theory and the guilt appeal approach and their overall effectiveness in communicating messages
to the LSU student body. Our research will focus on the motivation LSU students have to
process each advertisement.
We speculate that aid guilt appeal approach will resonate with LSU students better.
Though we think both techniques will prove to be effective to a certain extent, we believe that
LSU students will feel more motivated to process guilt appeals. We hypothesize that correcting a
misperception about a social norm is not an appropriate method to connect with the students.

7
Approaching prevention campaigns with a guilt appeal will inspire and advocate changes in
unhealthy behaviors, particularly binge drinking and tobacco use.
Methods
Experiments are useful to demonstrate that something is true, to examine the validity of a
hypothesis, to discover new information, but most importantly to find out whether a cause and
effect relationship exists between variables. If an experiment is successfully performed, the
researcher will find an effect on the independent variable (Moore-Copple, 2013).
Design
This experiment is a one-shot case study. In a one-shot case study, there is no control.
The experiment is only performed once to find if the independent variable had an effect on the
dependent variable. The one-shot case study allows us to see why each participant chose the
pictures they did. Examples of prior research show that this method allows the researcher to see
if there is an effect on the independent variables. For example, one study wanted to see the
effects on if praising primary school children would help them do better in mathematics. To test
this, the researcher chose two pupils, praised them with a motivational class and then gave them
a math test. The results showed that praising the primary school children raised their math scores
(StatPac, 2004). The one-shot case study is the best type of experiment that will help researchers
find the best results and prove their hypothesis correct (Moore-Copple, 2013).
A questionnaire was used in this experiment. The questionnaire allowed us to show each
advertisement followed by scale questions. The questionnaire also allows us to control what
order the participant’s see the advertisements in.

8
Participants
The participants in this study were meant to be LSU students ages 18-24. We used this
sample because there is research that adults in this age group are more prone to regularly using
tobacco products and drinking excessively (Lee & Ferguson, 2002; Rigotti, 2000). This age
group was also chosen because the advertisements made by the LSU Student Health Center were
designed for members of the LSU student body. There were 70 participants who completed the
questionnaire. A frequency distribution was created for all discrete variables to show the
distribution of participants’ demographics in different categories. The test showed that females
(58, 81.7%) were more frequent than males (12, 16.9%). Caucasians (60, 84.5%) showed a
higher frequency than African Americans/Africans (3, 4.2%), Asian/Asian America/Pacific
Islander (3, 4.2%), Hispanic/Latino (2, 2.8%) or other ethnicities (2, 2.8%). Full-time students
proved to be the most frequent (60, 84.5%), as well as sophomores (19, 6.8%) and seniors (19,
26.8%). Mass communication majors were the most frequent (31, 43.7%) followed by
humanities and social sciences majors (15, 21.1%) and business majors (6, 8.5%).
Setting and Apparatus
We posted the questionnaire on our personal social media sites and under LSU’s Media
Effects Lab database. The survey was posted on the Qualtrics website on Nov. 14, 2013 and
reached 70 participants by Nov. 22, 2013. The data was then exported out of Qualtrics and was
entered into the student version of Statistical Software SPSS version 21.
Independent Variables
In this experiment, the independent variables were the two different types of
advertisements we manipulated. We wanted to determine whether social norms theory, the
exaggerated beliefs about the normal frequency and consumption habits of other students, or the

9
guilt appeal, making students feel guilty about their current consumption habits, motivated
participants to change their habits (Boston University School of Public Health, 2013). There was
no control group or manipulation checks in this experiment because the entire sample saw both
advertisements.
Dependent Variables
Our dependent variable that was measured was motivation to process each advertisement.
Testing this variable is important because it provides better understanding to which
advertisement is more effective in relating to college students. Determining if college students
are willing to process each different type of advertisement is important because processing the
advertisement is necessary for attitudes and behaviors to eventually be changed. In order to
measure this variable, we used a preexisting scale.
The scale used was the Involvement (Ad Message) original to Baker and Lutz in their
2000 research, “An Empirical Test of an Updated Relevance-Accessibility Model of Advertising
Effectiveness.” The scale is composed of seven different items to measure a person’s level of
motivation to understand the advertisement. Their scale was 1-7 but we adjusted it to a 1-5 scale.
We also took the existing scale and altered it to “strongly agree” and “strongly disagree” rather
than different the original anchors for each question. We removed one of the scale items, this
was the “I explicitly compared the content of the three advertisements as I listened to them.” The
alpha of Baker and Lutz’s scale was .90.
Procedure
This questionnaire was placed on Qualtrics and was accessible for eight days. A
convenient sample was gathered through word of mouth, personal social media platforms and the
Media Effects Lab database. When participants reached the first page they were presented a

10
consent form that was provided by Jensen Moore-Copple. It outlined the purpose of the
questionnaire and who was conducting it. It also informed the participants that there was no risk
in taking it and that all answers would be confidential. All participants in the sample are being
exposed to both the social norms theory advertisements and the guilt appeal advertisements.
The directions informed the participant that the survey would take approximately 15
minutes and asked each participant to fill out the questionnaire in its entirety. Advertisements
were shown in a specific order. The social norms advertisement about smoking was shown first
(Appendix A), the guilt appeal and smoking advertisement second (Appendix B), the social
norms advertisement about drinking was third (Appendix C), and the guilt appeal and drinking
advertisement was last (Appendix D). After each advertisement, the exact same six scale
questions were asked. The last section included questions about participant’s demographics.
Each set of questions will be placed on different pages of the survey and will include instructions
directing the participant to complete the survey to the best of their knowledge.
Results
This experiment was guided by the overall question of which advertisement approach, the
social norms theory or guilt appeal, will be more effective in motivating the participants to
process each advertisement. The hypothesis that was being tested in this experiment was that
guilt appeal advertisements would have a greater effect on motivating participants than the social
norms theory advertisements. In terms of analyzing data for the research question and
hypothesis, the statistical methods employed were a factor analysis, a reliability analysis and a
paired samples t-test.

11
Following recoding, a factor analysis was conducted to provide evidence of construct
validity and to confirm that some variables "hang together" statistically in order to create a new
scale. The factor analysis was conducted on six continuous variables using the principle
components method with Varimax rotation. The factor analysis produced two factors with
qualifying eigenvalues (over 1.0). Factor loadings were considered significant at .50 (p<.05).
Items that either did not load or loaded similarly on two or more factors were dropped.
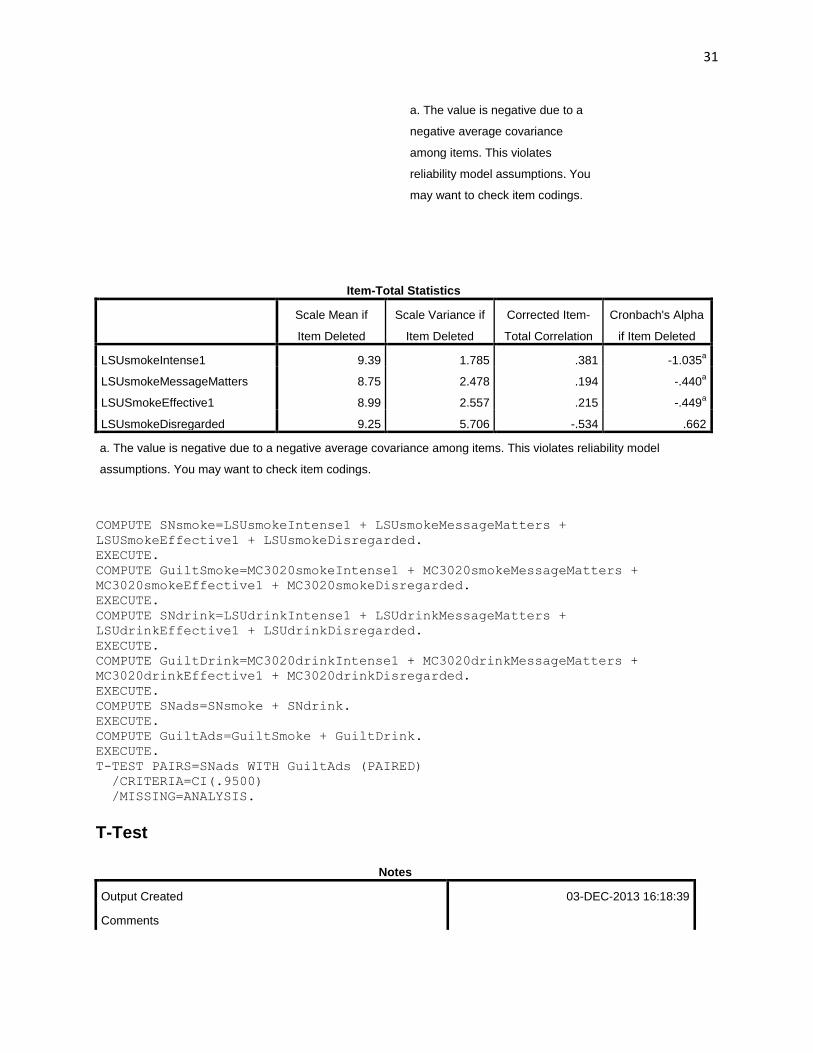
A reliability analysis was run on the first factor (i.e., “Motivation”), which accounted for
38.95 percent of variance and included four items: intense, message matters, effective and
disregarded (Cronbach’s Alpha = -.033). A measure is considered reliable with an Alpha over
.70. The reliability analysis shows that the scale is not considered reliable, which is due to the
scale measuring for four separate independent variables. The scale would not be considered any
more reliable if any of the items were deleted.
A paired samples t-test is used when every participant is exposed to all levels of the
independent variable. In this case, all participants were exposed to two different types of
advertisements, which were the independent variables of the experiment. A paired samples t-test
was used to examine the differences in the dependent variable of motivation between the social
norms advertisements and the guilt advertisements. Results indicated that there is a significant
difference between the two sets of advertisements, t (70) = -4.63, p < .05. The guilt
advertisements showed higher motivation among the participants (M = 27.32, SD = 2.98) as
compared to the social norms advertisements (M = 22.69, SD = 3.22). All tables and charts can
be seen in Appendix F.

12
Based on the findings from the paired-samples t-test, our hypothesis that guilt appeal
advertisements would have a greater effect on motivating participants than social norms theory
advertisements was supported. From this experiment, it can be generalized that college students
respond more strongly to advertisements that embrace guilt appeals with intense images and
wording than social norming advertisements that use primarily statistics and logic. This is
possibly due to the idea that college students are more likely to respond to emotion rather than
logic. In the future, we hope to find if guilt appeals work when used in advertisements that
contain messages other than smoking and drinking warnings. Also, we would like to see if an
emotional appeal, such as a guilt appeal, would be as effective on an older audience.
Discussion
Our overall research question for this experiment was a simple comparison: Which
advertisement approach, the social norms theory or guilt appeals, will be more effective in
motivating the participants to process each advertisement? The results show that the social norms
approach and emotional appeals both independently appear to have been successful in changing
attitudes on average. We hypothesized that the emotional appeal, more specifically a guilt
appeal, would have more of an influence on college students.
In this experiment, we saw that guilt appeal advertisements generated higher motivation
among college students than social norms theory advertisements. This may be because people are
typically more likely to be persuaded by emotional appeals rather than logical appeals (Dillard &
Pfau, 2002). The use of images and captions that embraced the idea of parental disappointment
could have also played a part in the guilt advertisements having higher motivation. Many college
students seek to make their parents proud, and if their actions are inconsistent with their parents’
standards, then they may experience guilt and react by being motivated to alter their behaviors

13
(Dillard & Pfau, 2002). Another possible reason that guilt appeals were more effective in
motivating college students is that the guilt appeal advertisements used strong, attention-
grabbing images, whereas the social norms advertisements had no strong visuals. Due to the lack
of existing information on guilt appeals, we found no previous research that addressed the
effectiveness of guilt appeals versus social norms theory. However, our experiment results were
consistent with our research that guilt appeals have a distinct action- motivating aspect (Dillard
& Pfau, 2002).
Our experimental methods had many strengths. The first is that it was easy and
convenient to distribute the questionnaire and gain a larger sample. Our questionnaire was also
simple and easy to understand. The strength of our results is supported by the results of the
paired samples t-test. Results indicated that there is a significant difference between the two sets
of advertisements, t (70) = -4.63, p < .05. The guilt advertisements showed higher motivation
among the participants (M = 27.32, SD = 2.98) as compared to the social norms advertisements
(M = 22.69, SD = 3.22). The significant difference between the motivation to process the two
sets of advertisements could potentially have theoretical implications regarding which type of
advertisement would be more effective in changing attitudes and behaviors.
Our findings are important because many universities and other organizations aim to
reduce unhealthy behaviors, like smoking and binge drinking, by creating advertising campaigns
to encourage prevention and healthy habits. In order for prevention campaigns to resonate with
college students, organizations need to understand how to effectively communicate with their
intended audience. Our research shows in this particular instance that LSU students better
processed the guilt appeal advertisements. This knowledge will allow the LSU Student Health
Center to create better advertisements that will effectively communicate their message to their

14
intended audience.
The design of our study is a within subjects design involving a one-shot case study.
Limitations that arose with this type of study include the inability to measure a comparison since
there is only one group. Since there is only one group, there is no basis for comparison of those
exposed and those not exposed to the stimuli (Connaway & Powell, 2010). We were unable to
determine if one stimulus was favored over another based on exposure or perceived notions
toward an appeal prior to exposure. Limitations for collecting data in this study were restricted to
each participant’s interpretation of the questions asked. While participants were able to identify
whether he or she agrees/disagrees more or less with a motivation, we did not determine the
reasons why each participant agreed or disagreed with each stimulus as we were unable to obtain
qualitative dat. Potential biases are difficult to eliminate in this experiment due to the fact that
the researchers performing the experiment are similar to the sample being tested. Since the
researchers are a part of the population being tested, we are able to tailor a message that we
believe is more appealing to our population. While it does not ensure a biased favor for the
researchers’ ads, it does present the potential possibility. Limitations for generalizing our
findings cannot extend outside the LSU community, as all participants involved in the
experiment are students of LSU.
If this experiment were to continue extended findings, one may suggest using focus
groups. Focus groups can help you discover the real issues that concern people, and they
normally provide researchers with open-ended, free responses (Paine, 2011). Additionally, focus
groups would allow us to explain the message we are trying to convey rather than a survey where
the participants may not understand what point we are trying to get across. All four ads would be
shown for the participants to see, along with a series of questions. There would be a discussion

15
among the students to determine which ad affected the students more and which ads they
preferred, either the guilt appeal or the social norms theory. Due to the fact that the participants
took the questionnaire online, there was no control of the participants’ environment, which could
have been a distraction from the experiment.
A way to improve the study is to get more participants for the experiment. Another
improvement would be to have a more diverse sample. This would give us the ability to have
more accurate results. This would allow us to generalize the results on a broader spectrum. Also,
working on the experiment for a longer amount of time would have given us the ability to “pilot”
or pretest our questionnaire before exposing it to the experimental sample.

16
Appendix
Appendix A

17
Appendix B

18
Appendix C

19
Appendix D

20
Appendix E
Instructions for Questionnaire
Students from MC 3020 are conducting the following questionnaire. This questionnaire will take
10-15 minutes to complete.
You will be shown four individual advertisements. Please view each advertisement carefully,
examining all elements, and then respond to the following questions as quickly and accurately as
possible. Be sure to fill these questions out completely.
There will be a section of demographic questions at the end of the questionnaire. Please fill out
all questions of this section.
Questionnaire
1. This ad affected my opinion of the topic.
Strongly agree Strongly disagree
1 2 3 4 5
1. This ad motivates me to stop participating in the activity.
Strongly disagree Strongly agree
1 2 3 4 5
2. The message in this ad was intense.
Strongly agree Strongly disagree
1 2 3 4 5
3. The message of this advertisement mattered to me.
Strongly disagree Strongly agree
1 2 3 4 5
4. I think this advertisement is effective.
Strongly agree Strongly Disagree
1 2 3 4 5
5. I disregarded this advertisement.
Strongly disagree Strongly agree
1 2 3 4 5

21
Demographics:
Gender:
1. Male
2. Female
Ethnicity:
1. African American/African
2. Asian/Asian American/Pacific Islander
3. Caucasian
4. Hispanic/Latino
5. Middle Eastern/Indian/Arabian
6. Native American/Alaskan Indian
7. Other
LSU affiliation:
8. Part-time student
9. Full-time student
10. Alumni
11. Other
College/Major (if applicable):
1. Agriculture
2. Art and Design
3. Business
4. Coast and Environment
5. Engineering
6. Human Sciences and Education
7. Humanities and Social Sciences
8. Mass communication
9. Music and Dramatic Arts
10. Science
Classification (if applicable):
1. Freshman
2. Sophomore
3. Junior
4. Senior

22
Thank you for completing this survey. Two of the advertisements you saw were produced by the
LSU Student Health Center and the other two guilt appeal advertisements were produced by the
student’s of a public relations research class. Your participation will aid in determining which
types of advertisements are more effective.

23
Appendix F
Frequencies
27.32
22.69
0
5
10
15
20
25
30
Guilt Ads Social Norms Ads
Motivation
Motivation
Notes
Output Created 23-NOV-2013 23:31:48
Comments
Input
Data
C:\Users\Owner\Documents\SOPH-
Semester
1\PR\Experiment\AdComparisonRe
sults.sav
Active Dataset DataSet1
Filter <none>
Weight <none>
Split File <none>
N of Rows in Working
Data File
71
Missing Value Handling
Definition of Missing User-defined missing values are
treated as missing.
Cases Used Statistics are based on all cases with
valid data.

24
Statistics
Gender Ethnicity LSUaffiliation Major Classification
N Valid 70 70 70 68 65
Missing 1 1 1 3 6
Mean 1.83 3.01 2.17 6.96 2.66
Median 2.00 3.00 2.00 8.00 3.00
Mode 2 3 2 8 2a
Std. Deviation .380 .843 .613 1.988 1.079
Skewness -1.782 2.517 2.220 -1.275 -.125
Std. Error of Skewness .287 .287 .287 .291 .297
Kurtosis 1.209 14.405 4.900 1.577 -1.266
Std. Error of Kurtosis .566 .566 .566 .574 .586
a. Multiple modes exist. The smallest value is shown
Frequency Table
Ethnicity
Frequency Percent Valid Percent Cumulative
Percent
Syntax
FREQUENCIES
VARIABLES=Gender Ethnicity
LSUaffiliation Major Classification
/STATISTICS=STDDEV MEAN
MEDIAN MODE SKEWNESS
SESKEW KURTOSIS SEKURT
/ORDER=ANALYSIS.
Resources Processor Time 00:00:00.02
Elapsed Time 00:00:00.02
Gender
Frequency Percent Valid Percent Cumulative
Percent
Valid
male 12 16.9 17.1 17.1
female 58 81.7 82.9 100.0
Total 70 98.6 100.0
Missing System 1 1.4
Total 71 100.0

25
Valid
African American/African 3 4.2 4.3 4.3
Asian/Asian
American/Pacific Islander
3 4.2 4.3 8.6
Caucasian 60 84.5 85.7 94.3
Hispanic/Latino 2 2.8 2.9 97.1
other 2 2.8 2.9 100.0
Total 70 98.6 100.0
Missing System 1 1.4
Total 71 100.0
LSUaffiliation
Frequency Percent Valid Percent Cumulative
Percent
Valid
Part-time student 2 2.8 2.9 2.9
Full-time student 60 84.5 85.7 88.6
Alumni 2 2.8 2.9 91.4
other 6 8.5 8.6 100.0
Total 70 98.6 100.0
Missing System 1 1.4
Total 71 100.0
Major
Frequency Percent Valid Percent Cumulative
Percent
Valid
Agriculture 2 2.8 2.9 2.9
Business 6 8.5 8.8 11.8
Engineering 4 5.6 5.9 17.6
Human Sciences and
Education
5 7.0 7.4 25.0
Humanities and Social
Sciences
15 21.1 22.1 47.1
Mass communication 31 43.7 45.6 92.6
Science 5 7.0 7.4 100.0
Total 68 95.8 100.0

26
Missing System 3 4.2
Total 71 100.0
Classification
Frequency Percent Valid Percent Cumulative
Percent
Valid
Freshman 11 15.5 16.9 16.9
Sophomore 19 26.8 29.2 46.2
Junior 16 22.5 24.6 70.8
Senior 19 26.8 29.2 100.0
Total 65 91.5 100.0
Missing System 6 8.5
Total 71 100.0
FACTOR
/VARIABLES LSUsmokeChangedOpinion LSUsmokeParticipating LSUsmokeIntense1
LSUsmokeMessageMatters LSUSmokeEffective1 LSUsmokeDisregarded
/MISSING LISTWISE
/ANALYSIS LSUsmokeChangedOpinion LSUsmokeParticipating LSUsmokeIntense1
LSUsmokeMessageMatters LSUSmokeEffective1 LSUsmokeDisregarded
/PRINT INITIAL EXTRACTION ROTATION
/CRITERIA MINEIGEN(1) ITERATE(25)
/EXTRACTION PC
/CRITERIA ITERATE(25)
/ROTATION VARIMAX
/METHOD=CORRELATION.
Factor Analysis
Notes
Output Created 23-NOV-2013 23:33:00
Comments
Input
Data
C:\Users\Owner\Documents\SOPH-
Semester
1\PR\Experiment\AdComparisonRe
sults.sav
Active Dataset DataSet1
Filter <none>
Weight <none>

27
Split File <none>
N of Rows in Working
Data File
71
Missing Value Handling
Definition of Missing
MISSING=EXCLUDE: User-
defined missing values are treated as
missing.
Cases Used
LISTWISE: Statistics are based on
cases with no missing values for any
variable used.
Syntax
FACTOR
/VARIABLES
LSUsmokeChangedOpinion
LSUsmokeParticipating
LSUsmokeIntense1
LSUsmokeMessageMatters
LSUSmokeEffective1
LSUsmokeDisregarded
/MISSING LISTWISE
/ANALYSIS
LSUsmokeChangedOpinion
LSUsmokeParticipating
LSUsmokeIntense1
LSUsmokeMessageMatters
LSUSmokeEffective1
LSUsmokeDisregarded
/PRINT INITIAL EXTRACTION
ROTATION
/CRITERIA MINEIGEN(1)
ITERATE(25)
/EXTRACTION PC
/CRITERIA ITERATE(25)
/ROTATION VARIMAX
/METHOD=CORRELATION.
Resources
Processor Time 00:00:00.05
Elapsed Time 00:00:00.05
Maximum Memory
Required
5544 (5.414K) bytes
Communalities

28
Total Variance Explained
Compone
nt
Initial Eigenvalues Extraction Sums of
Squared Loadings
Rotation Sums of Squared
Loadings
Tota
l
% of
Varianc
e
Cumulativ
e %
Tota
l
% of
Varianc
e
Cumulativ
e %
Tota
l
% of
Varianc
e
Cumulativ
e %
1 2.74
1
45.682 45.682 2.74
1
45.682 45.682 2.33
7
38.952 38.952
2 1.09
6
18.274 63.956 1.09
6
18.274 63.956 1.50
0
25.004 63.956
3 .704 11.740 75.696
4 .642 10.695 86.391
5 .483 8.056 94.448
6 .333 5.552 100.000
Extraction Method: Principal Component Analysis.
Initial Extraction
LSUsmokeChangedOpini
on
1.000 .740
LSUsmokeParticipating 1.000 .872
LSUsmokeIntense1 1.000 .543
LSUsmokeMessageMatter
s
1.000 .588
LSUSmokeEffective1 1.000 .524
LSUsmokeDisregarded 1.000 .571
Extraction Method: Principal Component
Analysis.
Component Matrixa
Component
1 2
LSUsmokeChangedOpini
on
.765 .394
LSUsmokeParticipating .446 .820
LSUsmokeIntense1 .657 -.334
LSUsmokeMessageMatter
s
.704 -.305
LSUSmokeEffective1 .718 -.087
LSUsmokeDisregarded -.717 .237

29
Rotated Component Matrixa
Component
1 2
LSUsmokeChangedOpini
on
.469 .721
LSUsmokeParticipating -.019 .933
LSUsmokeIntense1 .736 .035
LSUsmokeMessageMatter
s
.762 .083
LSUSmokeEffective1 .667 .280
LSUsmokeDisregarded -.741 -.150
Extraction Method: Principal Component
Analysis.
Rotation Method: Varimax with Kaiser
Normalization.
a. Rotation converged in 3 iterations.
GET
FILE='C:\Users\Owner\Documents\SOPH-Semester
1\PR\Experiment\AdComparisonResults.sav'.
DATASET NAME DataSet1 WINDOW=FRONT.
RELIABILITY
/VARIABLES=LSUsmokeIntense1 LSUsmokeMessageMatters LSUSmokeEffective1
LSUsmokeDisregarded
/SCALE('Motivation') ALL
/MODEL=ALPHA
/SUMMARY=TOTAL.
Reliability
Extraction Method: Principal Component
Analysis.
a. 2 components extracted.
Component Transformation
Matrix
Component 1 2
1 .869 .496
2 -.496 .869
Extraction Method: Principal
Component Analysis.
Rotation Method: Varimax with
Kaiser Normalization.

30
[DataSet1] C:\Users\Owner\Documents\SOPH-Semester
1\PR\Experiment\AdComparisonResults.sav
Scale: Motivation
Reliability Statistics
Cronbach's Alphaa N of Items
-.033 4
Notes
Output Created 03-DEC-2013 16:09:08
Comments
Input
Data
C:\Users\Owner\Documents\SOPH-
Semester
1\PR\Experiment\AdComparisonResults.sav
Active Dataset DataSet1
Filter <none>
Weight <none>
Split File <none>
N of Rows in Working Data File 71
Matrix Input
Missing Value Handling
Definition of Missing User-defined missing values are treated as
missing.
Cases Used Statistics are based on all cases with valid
data for all variables in the procedure.
Syntax
RELIABILITY
/VARIABLES=LSUsmokeIntense1
LSUsmokeMessageMatters
LSUSmokeEffective1
LSUsmokeDisregarded
/SCALE('Motivation') ALL
/MODEL=ALPHA
/SUMMARY=TOTAL.
Resources Processor Time 00:00:00.02
Elapsed Time 00:00:00.02
Case Processing Summary
N %
Cases
Valid 71 100.0
Excludeda 0 .0
Total 71 100.0
a. Listwise deletion based on all variables in the
procedure.
31
a. The value is negative due to a
negative average covariance
among items. This violates
reliability model assumptions. You
may want to check item codings.
Item-Total Statistics
Scale Mean if
Item Deleted
Scale Variance if
Item Deleted
Corrected Item-
Total Correlation
Cronbach's Alpha
if Item Deleted
LSUsmokeIntense1 9.39 1.785 .381 -1.035a
LSUsmokeMessageMatters 8.75 2.478 .194 -.440a
LSUSmokeEffective1 8.99 2.557 .215 -.449a
LSUsmokeDisregarded 9.25 5.706 -.534 .662
a. The value is negative due to a negative average covariance among items. This violates reliability model
assumptions. You may want to check item codings.
COMPUTE SNsmoke=LSUsmokeIntense1 + LSUsmokeMessageMatters +
LSUSmokeEffective1 + LSUsmokeDisregarded.
EXECUTE.
COMPUTE GuiltSmoke=MC3020smokeIntense1 + MC3020smokeMessageMatters +
MC3020smokeEffective1 + MC3020smokeDisregarded.
EXECUTE.
COMPUTE SNdrink=LSUdrinkIntense1 + LSUdrinkMessageMatters +
LSUdrinkEffective1 + LSUdrinkDisregarded.
EXECUTE.
COMPUTE GuiltDrink=MC3020drinkIntense1 + MC3020drinkMessageMatters +
MC3020drinkEffective1 + MC3020drinkDisregarded.
EXECUTE.
COMPUTE SNads=SNsmoke + SNdrink.
EXECUTE.
COMPUTE GuiltAds=GuiltSmoke + GuiltDrink.
EXECUTE.
T-TEST PAIRS=SNads WITH GuiltAds (PAIRED)
/CRITERIA=CI(.9500)
/MISSING=ANALYSIS.
T-Test
Notes
Output Created 03-DEC-2013 16:18:39
Comments

32
[DataSet1] C:\Users\Owner\Documents\SOPH-Semester
1\PR\Experiment\AdComparisonResults.sav
Paired Samples Correlations
N Correlation Sig.
Pair 1 SNads & GuiltAds 71 .369 .002
Paired Samples Test
Paired Differences t df Sig. (2-
tailed) Mean Std.
Deviation
Std. Error
Mean
95% Confidence Interval
of the Difference
Lower Upper
Pair
1
SNads -
GuiltAds
-
4.63380
3.48974 .41416 -5.45981 -3.80780 -
11.189
70 .000
Input
Data
C:\Users\Owner\Documents\SOPH-
Semester
1\PR\Experiment\AdComparisonResults.sav
Active Dataset DataSet1
Filter <none>
Weight <none>
Split File <none>
N of Rows in Working Data File 71
Missing Value Handling
Definition of Missing User defined missing values are treated as
missing.
Cases Used
Statistics for each analysis are based on the
cases with no missing or out-of-range data
for any variable in the analysis.
Syntax
T-TEST PAIRS=SNads WITH GuiltAds
(PAIRED)
/CRITERIA=CI(.9500)
/MISSING=ANALYSIS.
Resources Processor Time 00:00:00.03
Elapsed Time 00:00:00.03
Paired Samples Statistics
Mean N Std. Deviation Std. Error Mean
Pair 1 SNads 22.6901 71 3.21866 .38198
GuiltAds 27.3239 71 2.98460 .35421

33
References
Baker, W. E., & Lutz, R. (2009). An Empirical Test of an Updated Relevance-Accessibility
Model of Advertising Effectiveness. JA, 29 (1), 1-14
Berkowitz, A. (2004, August). The Social Norms Approach: Theory, Research, and
Annotated Reaction. (n.d.). Merriam-Webster.com. Retrieved from: http://www.merriam-
webster.com/dictionary/reactionBibliography. Retrieved from
http://www.alanberkowitz.com/articles/social_norms.pdf.
Block, L. G. (2005). Self-Referenced Fear and Guilt Appeals: The Moderating Role of SeIf-
Construal. Journal Of Applied Social Psychology, 35(11), 2290.
Boston University School of Public Health. (2013, January 22). Behavioral Change Models:
Social Norms Theory. Retrieved from http://sphweb.bumc.bu.edu/otlt/MPH-
Modules/SB/SB721-Models/SB721-Models7.html#socialnormstheory
Center for Disease Control and Prevention [CDC]. (2013, June 24). Smoking and Tobacco Use:
Health Effects of Cigarette Smoking. Retrieved from:
http://www.cdc.gov/tobacco/data_statistics/fact_sheets/health_effects/effects_cig_smokin
g/index.htm
Delahaye, P. K. (2011). Measure what matters: Online tools for understanding customers, social
media, engagement, and key relationships. Hoboken, N.J: John Wiley & Sons Inc.
Dillard, J. P., & Pfau, M. (2002). Guilt as a Mechanism of Persuasion. In M. H. Seawell
(Ed). The Persuasion Handbook: Developments in Theory and Practices (pp. 329-343).
Thousand Oaks, CA: Sage Publications, Inc.
Gerrig, R.J. & Zimbardo, P.G. (2002).Glossary. Psychology And Life, 16e. Retrieved from:

34
http://www.apa.org/research/action/glossary.aspx#b
National Institute on Alcohol Abuse and Alcoholism [NIAAA]. Overview of Alcohol
Consumption. Retrieved from
http://www.niaaa.nih.gov/alcohol-health/overview-alcohol-consumption
StatPac (2004). The Experimental Method. Retrieved November 12, 2013, from
http://www.learningdomain.com/PXGS6102Experimental2.html