the effect of vibration and temperature on the …
TRANSCRIPT
THE EFFECT OF VIBRATION AND TEMPERATURE
ON THE LATERAL PRESSURE OF CONCRETE ON FORMWORK
by
AMJID RAUF QURESHI
Submitted in partial fulfillment
of the requirement for the degree
of
Master of Applied Sciences
School of Graduate Studies
Department of Civil Engineering
University of Ottawa
August, 1978
$ yfflll uOttawa
UMI Number: EC55755
INFORMATION TO USERS
The quality of this reproduction is dependent upon the quality of the copy
submitted. Broken or indistinct print, colored or poor quality illustrations
and photographs, print bleed-through, substandard margins, and improper
alignment can adversely affect reproduction.
In the unlikely event that the author did not send a complete manuscript
and there are missing pages, these will be noted. Also, if unauthorized
copyright material had to be removed, a note will indicate the deletion.
UMI UMI Microform EC55755
Copyright 2011 by ProQuest LLC All rights reserved. This microform edition is protected against
unauthorized copying under Title 17, United States Code.
ProQuest LLC 789 East Eisenhower Parkway
P.O. Box 1346 Ann Arbor, Ml 48106-1346

- i -
ABSTRACT
The Objective of this investigation was to determine the variation
of lateral pressure of fresh placed concrete with power of vibrator, im
mersed depth of vibrator, duration of vibration and concrete temperature,
keeping concrete strength, slump, rate of pour and form dimensions con
stant. The lateral concrete pressure envelopes and maximum design pres
sure were also compared with those recommended by ACI Committee 347
and CIRIA.
Experimental tests were conducted by pouring concrete from a
ready-mix concrete truck into a 15 feet deep rigid steel formwork.
Cambridge cells were used to measure the normal and shear
pressures at five locations over the height of the form structure. Strain
gauges installed over the webs of the cells were connected to the strain
indicator to measure the strain induced by concrete pressure.
By analysis of the experimental results, following conclusions
were obtained:
The actual pressure envelope is characterized by a linear
relationship of pressure with depth tending to hydrostatic up to a certain
maximum value and then followed by a parabolic curve reaching a maximum
and eventually decreasing. For design purposes the lateral pressure dis
tribution of freshly poured vibrated concrete can be represented by a bi
linear curve - hydrostatic up to maximum and then constant at maximum
value.
The shear force acting parallel to the height of the formwork,
is inversely related to the normal force acting on the face of the form.

- ii -
Vibration and its parameters have a very significant effect on
the magnitude of the lateral pressure exerted by fresh concrete. An in
crease in the power of vibrator from 1 H.P- to 2.5 H.P- increased the
pressure of concrete equivalent to 2 to 5 feet of concrete head in dif
ferent tests. An increase in the duration of vibration increases the
lateral pressure of concrete but this factor is effective only up to a
certain limit after which any further increase in the duration of vibration
results into either a constant value of maximum pressure or a drop in
pressure. An increase in the depth of immersion of vibrator head increased
the lateral pressure of concreteJ the increase measured varied by an
average of 1.28 ft of equivalent concrete head, due to an increase in the depth
of immersion of vibrator head from 2 feet to 1 metre.
The temperature of the concrete has a significant effect on the
lateral pressure of concrete. A major fall in temperature gives rise to
a significant increase in lateral pressure exerted by the concrete.
The pressure formulae recommended by the American Concrete
Institute in ACI 347-68, are over conservative in respect of high
rates of pour.
The recommendations to determine the lateral pressure of concrete
provided by CIRIA are influenced predominantly by the arching limit cri
teria and the recommended design pressures provided could be useful at
moderate concrete temperature conditions but cannot be applied for con
crete at low temperatures. CIRIA's stiffening criteria is conservative
and provides pressures..which are significantly high.

- iii -
ACKNOWLEDGEMENTS
The author wishes to express his sincere appreciation and
gratitude to the following persons and organizations for their contribu
tion to this thesis:
Professor N. J. Gardner, not only for his supervision and
guidance throughout the entire investigation but also as a source of
encouragement as a friend.
Mr. William Watson for his continuous assistance as a
technician, his contribution to the successful completion of this pro
gramme cannot be overlooked.
The National Research Council of Canada for their financial
assistance by means of NRC Grant No. A5654.
Mrs. Wanda Storto for typing the thesis.
Miss Nicole Renaud for friendly encouragement at all times.
Mr. Tanvir Rizvi, graduate student of Mechanical Engineering,
who helped during the pouring of concrete.
My wife, Farida, for being a continuous source of help and
encouragement throughout this programme.

- iv -
TABLE OF CONTENTS
Page
ABSTRACT i
ACKNOWLEDGEMENTS iii
TABLE OF CONTENTS iv
LIST OF TABLES vii
LIST OF ILLUSTRATIONS viii
LIST OF ABBREVIATIONS AND SYMBOLS xv
CHAPTER 1 INTRODUCTION 1
CHAPTER 2 THEORETICAL BACKGROUND AND HISTORICAL REVIEW 7
CHAPTER 3 OBJECT OF THE PRESENT STUDY 42
CHAPTER 4 EXPERIMENTAL APPARATUS 44
4.1 General 44
4.2 Description of Formwork 44
4.3 Pressure Measuring Device and Principles 45
4.3.1 General 45
4.3.2 Type of Cells 49
4.3.3 Shear and Normal Force Measurement
using Earth Pressure Cells 49
4.3.4 Cambridge Cell 50
4.3.4.1 Modification of the Cambridge Cell 50
4.3.4.2 Principle of Operation 51
4.3.4.3 Choice of Cell Material and Circuit 51
4.3.4.4 Choice of Web Dimensions 53
4.3.4.4.1 Normal Web Thickness 53
4.3.4.4.2 Shear Web Thickness 54
4.3.4.5 Gauging and Bridge Circuit 55

- v -
Page
4.3.4.6 Pressure Cell Calibration 55
4.3.4.6.1 Static Load Calibration 55
4.3.4.6.2 Water Calibration 56
4.3.4.7 Calibration Tests and Load Cell 56 Constants
4.3.4.7.1 Calibration Tests 5 7
4.4 Matrix Inversions
4.5 Comparison of Dead Load Calibration with Water Calibration
59
62
63 CHAPTER 5 EXPERIMENTAL PROCEDURE
5.1 General 6 3
5.2 Water Calibration Test 63
5.3 Description of Concrete 64
5.4 Experimental Programs 65
5.4.1 Parameters 65
5.4.2 Steel Reinforcement 65
5.4.3 Test Procedure 66
5.5 Experimental Problems 67
CHAPTER 6 DISCUSSION OF EXPERIMENTAL RESULTS 70
6.1 General 70
6.2 Lateral Pressure Envelope 70
6.3 The Effect of Internal Vibration on the Lateral Pressure of Concrete on Formwork 73
a) The Effect of Power of Vibration 75
b) The Effect of Duration of Vibration 78
c) The Effect of Depth of Immersion of
Vibrator 80

- vi -
Page
6.4 Temperature Effects on the Lateral Pressure of Concrete on Formwork 82
6.5 Comparison of the Maximum Measured Pressures with the ACI and CIRIA Recommendations for the Lateral Pressure of Concrete 84
CHAPTER 7 CONCLUSIONS AND RECOMMENDATIONS 90
REFERENCES 94
ILLUSTRATIONS 96
VITA

- vii -
LIST OF TABLES
Table Page
2.1 Maximum Lateral Pressure of Concrete on Wall Forms Recommended by ACI Committee 347- 18
2.2 Maximum Lateral Pressure of Concrete on Column Forms Recommended by ACI Committee 347- 19
2.3 Maximum Lateral Pressure of Concrete in Tons Per Square Metre (Adam). 34
2.4 Maximum Pressure of Concrete in Pounds Per Square
Foot. 41
4.1 Details of Rigid Steel Formwork. 46
6.1 Details of the Programme. 71
6.2 Analysis of the Experimental Results. 76
6.3 Comparison of Concrete Pressures Recommended by CIRIA and ACI with Experimentally Achieved Pressures. 85
- viii -
LIST OF ILLUSTRATIONS
Figure Page
1.1 Pressures developed at various rates of pour 96
1.2 Lateral concrete pressure envelope under varying
concrete head 97
2.1 Relation between maximum pressure and rate of pour 98
2.2 Head of concrete at maximum pressure 98
2.3a Relation between time to reach maximum pressure and
rate of pour 99
2.3b Correction for different concrete mixes 100
2.3c Effect of slump on concrete pressure 100
2.3d Correction of concrete pressure due to variation in
concrete temperature 101
2.4 Shape of pressure diagram for design of forms 102
2.5 Variation of active pressure, X, with time 102
2.6 Increase of vertical pressure with depth 103
2.7 Diagram for A = e _ a ^ V 1 " ^ 1 ^ 103
2.8 Diagram for k 104
2.9 Pressure developed at various rates.of pour (1:3 mix) 105
2.10 Pressure developed at various rates of pour (1:6 mix) 106
2.11 Comparison of pressure developed with hand and
vibrated concrete (1:3 mix) 107 2.12 Comparison of pressure developed with hand and
vibrated concrete (1:6 mix) 108 2.13 Variation in maximum pressure developed with size of
formwork 109
2.14 Effect of mix on concrete pressure 110
2.15a Effect of consistency on concrete pressure (1:3 mix) H I
2.15b Effect of consistency on concrete pressure (1:6 mix) 112

- ix -
Figure Page
2.16 Relationship between stiffening time and the
temperature of concrete (CERA) 113
2.17 Values of Factor C (CERA) 114
2.18 Pressure design chart (CERA) 115
2.19 Values of Factor F (CERA) 116
2.20 Relation between pressure and rate of pour 117
2.21 Relation between rate of pour, concrete pressure and temperature of mix 117
2.22 Cross section geometry of wall and qualitative diagram of form pressure distribution 118
2.23 Diagram of linear standard visco-elastic solid as model for form surface 118
2.24 Variation of residual to maximum pressure ratio with stiffness ration "S" and time ratio "T" 118
2.25a,b, Comparison of recommended design pressures 119-c 120
4.1a(i) Position of formwork in structural laboratory, University 121-
(ii) of Ottawa. General view of formwork from top 122
4.1b General assembly of formwork 123
4.1b(ii) General view of the formwork from top after the concrete
is poured 125
4.2 Strain gauges on original Cambridge cell 126
4.3 Strain in webs of Cambridge cell 127
4.4 Comparison of original and modified Cambridge cell 128
4.5a General view of the Cambridge cell without face plate 129
4.5b General view of the Cambridge cell with face plate 130
4.6 Normal static load calibration of the cells 131
4.7 Relation between centre load and strain for Load Cell 132 No. 1
4.8 Relation between shear load and strain for Load Cell ND. 1 133
Figure
- x -
Page
Relation between positive moment and strain for Load Cell No. 1
Relation between negative moment and strain for Load Cell No. 1
Relation between centre load and strain for Load Cell No. 2
Relation between shear load and strain for Load Cell No. 2
Relation between positive moment and strain for Load Cell No. 2
Relation between negative moment and strain for Load Cell No. 2
Relation between centre load and strain for Load Cell No. 3
Relation between shear load and strain for Load Cell No. 3
Relation between positive moment and strain for Load Cell No. 3
Relation between negative moment and strain for Load Cell No. 3
Relation between centre load and strain for Load Cell No. 4
Relation between shear load and strain for Load Cell No. 4
Relation between positive moment and strain for Load Cell No. 4
Relation between negative moment and strain for Load Cell No. 4
Relation between normal load and strain for Load Cell No. 5
Relation between shear load and strain for Load Cell No. 5
Relation between positive moment and strain for Load Cell No. 5
- xi -
Figure Page
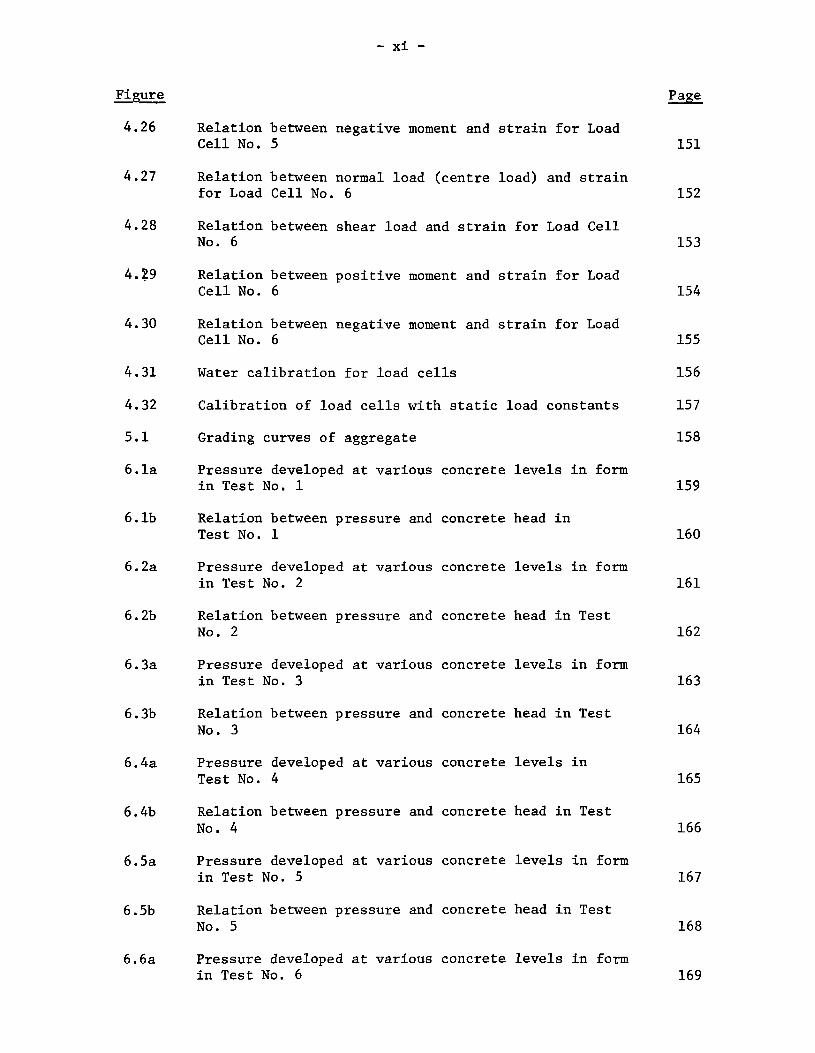
4.26 Relation between negative moment and strain for Load Cell No. 5 151
4.27 Relation between normal load (centre load) and strain for Load Cell No. 6 152
4.28 Relation between shear load and strain for Load Cell No. 6 153
4.29 Relation between positive moment and strain for Load Cell No. 6 154
4.30 Relation between negative moment and strain for Load
Cell No. 6 155
4.31 Water calibration for load cells 156
4.32 Calibration of load cells with static load constants 157
5.1 Grading curves of aggregate 158
6.1a Pressure developed at various concrete levels in form
in Test No. 1 159 6.1b Relation between pressure and concrete head in
Test No. 1 160
6.2a Pressure developed at various concrete levels in form in Test No. 2 161
6.2b Relation between pressure and concrete head in Test No. 2 162
6.3a Pressure developed at various concrete levels in form in Test No. 3 163
6.3b Relation between pressure and concrete head in Test No. 3 164
6.4a Pressure developed at various concrete levels in Test No. 4 165
6.4b Relation between pressure and concrete head in Test No. 4 166
6.5a Pressure developed at various concrete levels in form in Test No. 5 167
6.5b Relation between pressure and concrete head in Test No. 5 168
6.6a Pressure developed at various concrete levels in form in Test No. 6 169

- xii -
Figure
6.6b
6 .7a
6.7b
6.8a
Page
Relation between pressure and concrete head in Test No. 6 169
Pressure developed at various concrete levels in form in Test No. 7 170
Relation between pressure and concrete head in Test No. 7 171
Pressure developed at various concrete levels in form in Test No. 8 172
6.8b Relation between pressure and concrete head established in Test No. 8 173
6.9a Pressure developed at various concrete levels in form in Test No. 9 174
6.9b Relation between pressure and concrete head established in Test No. 9 175
6.10a Pressure developed at various concrete levels in form in Test No. 10 176
6.10b Relation between pressure and concrete head established in Test No. 10 177
6.11a Pressure developed at various concrete levels in form in Test No. 11 178
6.11b Relation between pressure and concrete head established in Test No. 11 179
6.12a Pressure developed at various concrete levels in form in Test No. 12 180
6.12b Relation between pressure and concrete head established in Test No. 12 181
6.13a Pressure developed at various concrete levels in form in Test No. 13 182
6.13b Relation between pressure and concrete head established in Test No. 13 183
6.14a Pressure developed at various concrete levels in form in Test No. 14 184
6.14b Relation between pressure and concrete head established in Test No. 14 185

- xiii -
Figure Page
6.15a Pressure developed at various concrete levels in form in Test No. 15 186
6.15b Relation between pressure and concrete head established in Test No. 15 187
6.16a Pressure developed at various concrete levels in form in Test No. 16 188
6.16b Relation between pressure and concrete head established in Test No. 16 189
6.17a Pressure developed at various concrete levels in form in Test No. 17 19°
6.17b Relation between pressure and concrete head established in Test No. 17 m
6.18 Variation of shear and lateral concrete pressures with concrete head (Test No. 3) 1 9 2
6.19 Variation of shear and lateral concrete pressures with concrete head (Test No. 8) 193
6.20 Variation of shear and lateral concrete pressures with concrete head (Test No. 5) 194
6.21 Variation of shear and lateral concrete pressures with concrete head (Test No. 1) 195
6.22 Variation of shear and lateral concrete pressures with concrete head (Test No. 2) 196
6.23 Variation of shear and lateral concrete pressures with concrete head (Test No. 18) 197
6.24 Variation of shear and lateral concrete pressures with concrete head (Test No. 6) 198
6.25 Comparison of pressure envelopes at 1 ft elevation of the form (55 to 71°F)
6.26 Comparison of pressure envelopes at 3 ft elevation of the form
199
200
6.27 Comparison of pressure at different vibration parameters 201
6.28 Effect of power of vibration on concrete pressure 202
6.29 Effect of duration of vibration on concrete pressure 203

- XIV -
Figure Page
6.30 Relation between concrete pressure and duration of vibration 204
6.31 Effect of depth of vibrator immersion on concrete pressure 205
6.32 Effect of temperature on lateral pressure of concrete 206
6.33 Relation between percent hydrostatic pressure and continuity of vibration 207
6.34 Relation between concrete pressure and power of vibrator 208
6.35 Variation of concrete pressure with depth of vibrator immersion 209

- XV -
LIST OF ABBREVIATIONS AND SYMBOLS
A Constant
d Minimum dimension of the form in inches
e Eccentricity
e Load cell constant
e Load cell constant
es Load cell constant
E Stiffness coefficient of form
F The concrete area in a horizontal section
H Head of concrete at maximum pressure m
h Pore water pressure expressed as head of water
h The height to which the concrete has risen when it has taken
the final set, counting from the vibrated depth of the concrete
h The depth to which the effect of vibration penetrates
k Constant
K The coefficient giving the pore water as the function of the height of concrete
K- Relaxation factor of the form
N Normal load
n
n Load cell constants ns
P The maximum pressure of concrete m
P Residual form pressure 00
R Rate of pour in feet per hour
S' The ratio of residual form stiffness to initial form stiffness
S Shear load

- xvi -
+ s s~ Load constants
ss
T Temperature of concrete in degrees Fahrenheit
T' Ratio of hardening time to relaxation time
t The time in hours from the commencement of the placing of concrete t Stiffening time of concrete (hours) max 6
Setting time of concrete H
U The circumference
V Rate of pour (ft/hour)
V Output strain from + normal circuit
V Output strain from - normal circuit
V Output strain from the shear circuit x
V Unit weight of the concrete mix
y. Unit weight of water
X Active lateral pressure coefficient
XI The coefficient, function of the stiffness of the concrete
0 The angle of internal friction of concrete
0 Angle of internal friction between the form and the concrete

- 1 -
CHAPTER 1
INTRODUCTION
Concrete due to its low cost, high structural strength,
inertness to chemical attack, high fire resistance and ease with
which massive elements of complex shapes can be formed has become the
major structural material used in Civil Engineering. In order to make
the best use of concrete in engineering, considering structural,
architectural and economic aspects, the various mechanical and chemical
properties of concrete have been under investigation for many years.
But one of the properties of concrete which has been particularly per
plexing is its physical behaviour between the time of mixing and the
time the cement paste has attained its final set. During this time
the physical properties of the concrete change from a plastic condi
tion to a solid state. If the concrete in its plastic state is poured
into a container or form, it will flow to the shape of the form. The
cost of formwork has been estimated to vary from thirty to sixty percent
of the total cost of concrete work in a construction. Forms are basically
the tools and dies of concrete construction, they mould the concrete to
the desired size and shape and control its position and alignment. But
formwork is more than a mould, it is a temporary structure that supports
its own weight and that of the freshly placed concrete as well as con
struction live loads including materials, equipment and workmen. Hence
the form builder must be concerned with more than simply making forms
the right size, his objective must be three fold; to build substantially

- 2 -
so that the formwork is capable of supporting all dead and live loads
without collapse or danger to workmen and to the concrete structure, to
design and build forms accurately so that the desired size, shape, posi
tion and finish of the cast concrete is attained, and to build efficiently,
saving time and money for the contractor and owner alike.
In order to achieve the above objectives in the design of form-
work it is essential to have as complete a knowledge as possible of the
properties and physical behaviour of concrete as a material, between the
time of mixing and the time that it has obtained its final form. The
lateral pressure exerted by concrete in its liquid or plastic state is
the property which controls formwork design for vertical faces.
When concrete is first mixed, it has properties lying between
those of a liquid and those of solid substance. With the passage of
time, concrete loses its plasticity and changes into a solid. The ability
to change from a semiliquid to a solid state appears to be the result of
setting of the cement which is considered to begin some 30 minutes after
addition of water but this seems to be an arbitrary estimation. However
slowly the process of setting may begin, it must commence as soon as the
cement comes into contact with water. This phenomenum results in the
development of shear strength of the concrete which is a function of
time and is contributed to by the angle of internal friction, cohesion
and interlocking between the particles. The magnitude of the internal
friction is higher in a dry concrete than in wet, and it increases with
the loss of water from a concrete mass.
ACI Committee 622 in its report on Pressures on Formwork (5)

- 3 -
surmised that the lateral pressure of freshly mixed concrete on formwork
is at least a function of the following:
1. Depth of placement
2. Rate of pour of concrete
3. Temperature of the concrete mix
4. Ambient temperature
5. Method of compacting the concrete
6. Weight of concrete
7- Consistency of concrete
8. Maximum aggregate size
9. Smoothness and permeability of forms
10. Cross section of forms
11. Placing procedures
12. Porewater pressure
13. Type of cement
Many of the above variables are interrelated and it should be
very difficult and time consuming to identify their individual effects
on the lateral pressure of concrete and their participation in the
design formulae.
Previous research, generally field tests on actual construction
sites, lead the investigators to conclude that the lateral pressure of
concrete on vertical form faces is hydrostatic to a certain depth from
the pouring surface, and after a certain depth it deviates from the
hydrostatic line, reaches a maximum and thereafter shows a measurable
reduction in spite of increase in concrete head. The depth of the
region, which behaves as a fluid, and the maximum pressure achieved is

- 4 -
believed to be dependent on the above stated parameters. Figure 1.1
presented by Ritchie (16) shows typical envelopes of lateral pressure
of concrete.
To understand more fully the phenomenum involved it is
necessary to consider the pouring sequence in detail. Consider a wall
form 5 metres in depth to be filled with concrete in lifts of 1 metre
each and to be vibrated with an internal vibrator immersed to a depth
of 1 metre; Figure 1.2 shows in detail the sequence of pouring, vibrating,
raising the vibrator, pouring the next lift, etc.
Figure 1.2a shows the first metre of concrete placed and the
vibrator immersed over the whole depth of the concrete. The resulting
lateral pressure is hydrostatic as the vibrator completely fluidizes
the concrete removing all shear strength and wall friction. In the
second stage illustrated in Figure 1.2b the second metre of concrete is
placed and the vibrator immersed into the top 1 metre mass of concrete,
and the lateral pressure continues to be hydrostatic.
Figure 1.2c shows the third metre of concrete placed and only
the top 1 metre of the concrete vibrated. The resulting lateral pressure
is hydrostatic in the top section of the form, but it is observed to
slightly deviate from the hydrostatic line at the bottom.
Figure 1.2d illustrates the fourth metre of concrete placed,
and the vibrator immersed into the top 1 metre of the concrete mass.
The lateral pressure is hydrostatic to a certain depth, when it starts
deviating from the hydrostatic time and after achieving a maximum pressure,
shows a prominent reduction in pressure. This phenomenum, observed in

- 5 -
Figures 1.2c and 1.2d can be attributed to the friction between the
surface of the form and the concrete and the development of shearing
strength in concrete.
Figure 1.2e shows the fifth metre of concrete poured, with
the vibrator immersed to the top 1 metre. The lateral pressure deviates
from the hydrostatic line and after achieving a maximum value shows a
significant drop in pressure, this unexpected drop in pressure is due
to the shrinkage in concrete.
Generally, the lateral pressure envelope is idealized as a
bi-linear curve initially hydrostatic and thereafter constant at the
maximum value. The magnitude of the maximum pressure is dependent upon
the depth of concrete fluidized, the gain in shear strength and wall
friction on the concrete below the vibrated layer.
The depth of fluidized concrete is dependent upon the immersed
depth of the vibrator, power of the vibrator, duration of vibration,
width of section and depth of influence of the vibrator which is
dependent upon the gain of shear strength and wall friction in the
concrete below the head of the vibrator. Rate of pour (time) and
temperature are important to the extent that they control the gain of
shear strength of the concrete.
Shear strength is a function of head of concrete, time (rate
of pour), temperature, mix proportions, mix consistency, additives used
and the rigidity of the formwork. The more flexible the formwork, the
more the concrete can strain laterally and develop shear strength.
Hence the considerations controlling lateral pressure given by ACI can
be regrouped to reflect these two ideas.

- 6 -
Shear Strength
1. Depth of placement
2. Time (rate of pour) from the start of pour
3. Temperature of concrete mix and ambient temperature
4. Mix proportions and maximum aggregate size
5. Mix consistency
6. Type of cement
7. Smoothness and permeability of form
8. Porewater pressure
JFluidized Depth of Concrete
9. Power of vibrator
10. Immersed depth of vibrator
11. Duration of vibration
12. Depth of influence of vibration
13. Cross section of the form
14. Shear strength of concrete

- 7 -
CHAPTER 2
THEORETICAL BACKGROUND AND HISTORICAL REVIEW
2.1 One of the first reports, concerned with the lateral pressure
of fresh concrete, was published in 1894 by McCullough as quoted by
Leung (10). Since 1894 many investigators from various countries reported
their observations on this particular topic in the technical press. In
1952 Rodin collected together and critically reviewed the then published
experimental data on the lateral pressure of fresh concrete against ver
tical forms, and discussed the various factors that affect this lateral
pressure (17).
In this section only the conclusions and recommendations of
Rodin and the investigations carried out subsequently will be discussed
as being relevant and covering all the necessary information available
to-date.
2.2 Rodin (17), in 1952, presented a review of the published
experimental data on the lateral pressure of concrete against forms, dis
cussed the various factors that effect the lateral pressure and gave a
rational explanation of the physical phenomena causing the type of pressure
found in practice. Rodin deduced that the factors directly influencing
the lateral pressure of concrete on formwork were as follows:
1. Rate of filling the forms
2. Method of placing the concrete, whether by hand or mechanical vibration
3. Consistency and proportions of the mix
4. Temperature of the concrete

- 8 -
5. Rate of setting of the concrete
6. Size and shape of the form.
Rodin, after study of the available data, concluded that the
following physical factors determine the general shape of the pressure
distribution against the form:
a) The degree of the arching action of the aggregate.
b) The rate of hardening of the cement mortar, and the setting shrink
age of the cement.
c) The relative rigidity of the formwork.
d) The method of placing the concrete.
The greater the degree of the above factors, the more the
pressure distribution will tend to deviate from the equivalent hydrostatic
pressure of a fluid having the same density as the concrete.
Rodin observed that the principal factors and concrete
characteristics affecting the values of maximum pressure f and the head
of concrete H at maximum pressure are: m
a) Rate of Filling the Forms: As the rate of pour increases both P and m
H increase at a decreasing rate, indicating that at low rates of pour m
the hardening of the cement has a more important effect than the arching
action and conversely at high rates of pour. The time required to reach
P ranges from about 2 hours for rates of pour of 2 to 3 feet per hour m
to less than 30 minutes for rates of pour of more than 20 feet per hour.
Figures 2.1, 2.2 and 2.3 give the relations between the rate of pour and
the maximum recorded pressure, the head of concrete at maximum pressure,
and the time required to reach the maximum pressure; these results are

- 9 -
based on experimental data deduced from tests conducted on 1:2:4 con
crete at a temperature of 70°F.
The following general equations were considered satisfactory
by Rodin for designing forms for a 1:2:4 mix, at a temperature of about
70°F.
P = 110 H lb per square foot, for hand placed concrete 2 m m
* = 150 H lb per square foot, for internally vibrated concrete 2
1/3 H = 3.6 R /J feet, 2 m *
where R denotes rate of pour in feet per hour.
Where external vibrators are used the full depth of concrete
is in agitation and appears to act as a fluid, so that the forms should
be designed for the full hydrostatic pressure of a liquid having the
same density as the concrete.
However, where internal vibrators are used, it is normal
practice to insert the vibrator into only the top 2 feet or so of the
concrete, and as the height of the pour increases, it seems reasonable
to assume that only the mass of concrete in the upper few feet will be
affected by the vibration sufficiently to produce a full fluid pressure.
Below this depth, it might be expected that the concrete will behave
in a manner similar to hand placed concrete.
Thus it is considered satisfactory to assume a behaviour
similar to that of hand placed concrete, in that the concrete pressure
increases to a maximum value at a head given by equation 2.3, but
unit weight of concrete is 150 lbs/ft-5 in Imperial units. Vibration is only considered to the extent that the effective density is increased from 100 lbs/ft3 to 150 lbs/ft3-

- 10 -
assuming a full hydrostatic pressure to this depth. This is given by
equation 2.2 and shown in Figure 2.1.
b) Proportions of Concrete Mix: The richer the mix the greater is the
value of maximum lateral pressure of concrete, possibly because of the
increasing lubricating action of the cement and hence a decreasing
arching action. This is summarized in the results plotted in Figure 2.3b.
c) Consistency of the Concrete: It is expected that, for a particular
mix, the higher the water/cement ratio, or slump, the smaller would be
the deviation of the pressure from a hydrostatic distribution, resulting
from the increased fluidity of the concrete. The results available are
plotted in Figure 2.3c.
d) Temperature of the Concrete; The pressure seems to rise significantly
with a decrease in temperature. The limited data available in this
respect is illustrated in Figure 2.3d.
e) Size and Shape of the Form; It is assumed that the smaller the width
of the form, the greater would be the arching action, which will reduce
the lateral pressure. No correction curve was presented for this factor.
Rodin suggested use of the pressure diagram shown in Figure 2.4,
which provides maximum pressure, depth of fluid region of concrete and
the resultant reduced pressure. Figures 2.3b, 2.3c and 2.3d suggest the
percentage corrections to be made for type of mix, slump and temperature;
but the accuracy of these results is in doubt.

- 11 -
2.3. R. Schjodt (18), using the concepts of soil mechanics, developed
mathematical relations for the calculation of the pressure of concrete on
forms. The factors considered in these derivations are the setting time,
consistency and density of concrete; the smoothness, permeability and
cross-section of the form; rate of pour and the depths to which the
vibration penetrates.
Schjodt considered the fresh concrete, when compacted by vibra
tion, to behave as a liquid and the pressure curve always to begin
tangential to the line of hydrostatic pressure. As soon as the concrete
is left alone, it developes cohesion and friction. With time this co
hesion in the concrete will increase but here this phenomenum has been
assumed of theoretical importance and of little practical significance.
Schjodt stated that the angle of internal friction will have
a relatively small value to begin with, but will increase during setting
to a maximum value of 90°. This assumption is obviously not correct.
Schjodt in his study of the pressure of concrete gave con
siderable importance to the porewater pressure, which is part of the
total pressure against the form, but this is difficult to estimate due
to leakage from the form and adsorption of water into the cement gel.
Schjodt developed equations for two different sets of
assumptions.
2.3.1 Pressure Without Friction Between the Concrete and the Forms
The lateral pressure of concrete, below the depth of the effect
of vibration, was derived using earth pressure theories and assuming
rapid internal drainage,

- 12 -
P = [y-iK + h) - y h ]X. + y h
1 ' o w l 'ow
= [(Y - Y0K)X1 + y*](\ + h) 2.4
where h = K(h-+h) is the porewater pressure, and K is a coefficient
giving the porewater pressure as a function of the height of concrete.
Y is the unit weight of the mix, Y unit weight of water and
1L the depth to which the effect of vibration penetrates, h is the dis
tance from this level to the point where the pressure is to be calculated.
The coefficient X. is a function of the stiffness of the con
crete and varies with time. Here in order to take into account the
setting, X. is written as
X1 = tan2(45-0/2) (1 - jj-) = X(l - £-) 2.5
s s 2
where X = tan (45-0/2) is the active lateral pressure coefficient
for a cohesionless mass and h is the height to which the concrete has
risen when it has taken the final set, counting from the depth h1.
0 is the angle of internal friction of the concrete after
it is left unvibrated.
Assuming slow internal drainage, equation 2.4 can be written
as
P = (Y -Yn)(h, + h)X1 + Y h 2.6 O 1 1 o w
If the concrete rises at the speed V in the forms, then
h = Vt 2.7 s s
where t is the setting time. Equation 2.4 can be written as

- 13 -
P = [(Y " Y K) X (1 - £-) + Y K](h. + h) o h o i s
The maximum value of the pressure is given as
v> h Y K h h h1 Y
s s s o
the depth of this pressure from the surface is given by the relation
H --§. [(i --I) + * -1°—] m 2 h X Y~Y K s o
If it is assumed that h.. = K = 0 and X = 1
then
m 4 s
Schjodt in his use of the lateral pressure coefficients
assumed the concrete mass to fail which is far from reality, and not
applicable.
2.3.2 Pressure with Exterior Friction
In narrow walls and in columns especially when the forms have
the rough surface of ordinary form boards, the friction of the concrete
against the forms has a significant influence and cannot be neglected.
In order to find an expression for the pressure in this case,
the equilibrium of a horizontal section of the concrete below h ,
shown in Figures 2.5 and 2.6 must be considered.
dP F = Y-. F dh - P- U dh tan0, v 1 1 1
where P.. is a horizontal pressure, not counting the porewater pressure
Y-L - Y " YQK

- 14 -
where Y is the unit weight of mix, Y of water and K is a coefficient
giving the porewater pressure as a function of the height of concrete.
F is the concrete area in a horizontal section and U is the
circumference.
0. is the angle of friction between the concrete and the
formwork.
It should be noted that the angle of wall friction actually
developed is indeterminate and less than the limiting value.
F — can be represented by R.
dP tan0-P then _v=Yi-__Li 2
and — = ratio between horizontal and vertical pressure = X«'l-h/h ) 2 ir S V
Equation 2.13 is written as
d P i, V = Y, - #-<i - £->p d, '1 fi N h ' v
h s s
With a = Xtan0, h /R. 1 s
From equation 2.15, using P = Y-ih-i f° r h = 0 the constant
can be determined
P = Y-. (Ah, + kh ) v 1 1 s
Here
k -r*1 -A = e s
a/2(l - £-)2
h / 0
= e s / -a
h 2h
£
X
-)
2
• f a
e dh
s

- 15 -
The numerical values of A and K are plotted in Figure 2.7 and Figure 2.8,
respectively. The pressure against the forms is calculated from equations
2.14 and 2.16, and the porewater pressure added
P = P X ( l - £ - ) + Y K(h, + h) v h o 1 s
= Yi(Ah. + Kh )(1 - £-) + y k(h, + h) 2.17 i 1 s h o 1
s
If 0. is small, or if the wall is thick so that R is great, "a" will
have a small value, then A % 1 and K % — and equation 2.17 will be h s
identical to equation 2.8.
2.4 ACI Committee 622 (Redesignated Committee 347) (8) was
organized in 1955 to improve the safety and quality of formwork for
concrete construction. With the basic goal of developing specifications
for the design and construction of formwork, the Committee reviewed
existing test reports and design formulae developed since the nineteenth
century.
The Committee after studying all the variables affecting the
lateral pressure of concrete concluded that the following variables
affect the lateral pressure of concrete after placement in forms:
1. Rate of placement
2. Consistency of concrete
3. Weight of concrete
4. Maximum aggregate size
5. Temperature of concrete mix
6. Ambient temperature

- 16 -
7. Smoothness and permeability of form
8. Cross section of forms
9. Effect of consolidation by vibration
10. Placing procedures
11. Porewater pressure
12. Type of cement
13. Depth of placement.
The following general relation was produced by ACI Committee
622 for form design (8), taking into account the variables of tempera
ture of the concrete.and rate of pour when compacted by internal
vibration
C R Pm = Cl(l+-4-) 2.18
where C. is a function of the unit weight of mix and C„ is some function
of the consistency of the concrete. P is the maximum lateral pressure m
in psf, R is the rate of pour in feet per hour, and T is the temperature
of the concrete in degrees Fahrenheit. 3
Assuming the unit weight of concrete mix as 150 lbs/ft , the
Committee proposed the following formula for columns
P m = 1 5 0 + i P | O 2>19
maximum 3000 psf or 150 h, whichever is less.
For walls the following relations were recommended
a) With rate of placement controlled and less than 7 ft/hr
F , - H * * l ps£ 2.20

- 17 -
with a maximum of 2000 psf or 150 h whichever is less,
b) With rate of placement greater than 7 ft/hr
P =150 + ^m + mii: psf 2.2 m T T F
[150 h or 2000 psf which ever is less].
Where h represents the height of wall.
Table 2.1 gives the maximum lateral pressure of concrete
for design of wall forms based on ACI Committee 347 pressure formulae
2.20 and 2.21.
Table 2.2 gives the maximum lateral pressure of concrete for
design of column forms based on ACI Committee 347 pressure formula 2.19,
2.5 Ritchie (16), experimentally investigated the effects of rate
of pour, mode of compaction, workability of the concrete and the size of
the form, on the shape of the pressure envelope and the maximum pressure
exerted on the formwork.
2.5.1 Rate of Pour
Four rates of pour were used, namely 4, 10, 20 and 70 ft per
hour; the results are given in Figures 2.9 and 2.10 for both 1:3 and
1:6 mixes compacted by internal vibration. Both mixes show a rapid
initial increase in pressure with rate of pour which then levels off
considerably at higher rates. It was noticed that there was a wide
difference between the results for the 1:6 mix and the 1:3 mix.
2.5.2 Method of Compaction
Due to the marked difference in behaviour recorded between

- 18 -
TABLE 2.1 Maximum Lateral Pressure of Concrete on Wall Forms Recommended by ACI Committee
p, maximum lateral pressure Rate of Placement psf, for temperature indicated R, ft per hr go0]p 8Q<>7 7QOl 6Q0^ 5Q0^ ^ ^
1 2 3 4 5
6 7 8 9 10
250 350 450 550 650
750 850 881 912 943
262 375 488 600 712
825 938 973 1008 1043
278 407 536 664 793
921 1050 1090 1130 1170
300 450 600 750 900
1050 1200 1246 1293 1340
330 510 690 870 1050
1230 1410 1466 1522 1578
375 600 825 1050 1275
1500 1725 1795 1865 1935

- 19 -
TABLE 2.2 Maximum Lateral Pressure of Concrete on Column Forms Recommended by ACI Committee 347.
Rate of p, maximum lateral pressure, Placement _ . ,. ^ ,
R ,.. , psf, for temperature indicated
90°F 80°F 70°F 60°F 50°F 40°F
1 2 3 4 5
6 7 8 9 10
11 12 13 14 16
18 20 22 24 26
28 30
250 350 450 550 650
750 850 950 1050 1150
1250 1350 1450 1550 1750
1950 2150 2350 2550 2750
2950 3000
262 375 488 600 712
825 938 1050 1163 1275
1388 1500 1613 1725 1950
2175 2400 2625 2850 3000
278 407 536 664 793
921 1050 1178 1307 1436
1564 1693 1822 1950 2207
2464 2721 2979 3000 3000
300 450 600 750 900
1050 1200 1350 1500 1650
1800 1950 2100 2250 2550
2850 3000
330 510 690 870 1050
1230 1410 1590 1770 1950
2130 2310 2490 2670 3000
375 600 825 1050 1275
1500 1725 1950 2175 2400
2625 2850 3000
psf maximum governs

- 20 -
the 1:3 and 1:6 mixes, both mixes were studied to determine the relative
effects of compaction by hand and by mechanical vibration. The results
are shown in Figures 2.11 and 2.12. In both cases the maximum pressure
developed was greater with vibrated compaction, but the average per
centage increase for the two mixes was quite different. Although the
mixes had nominally the same workability, the lean (1:6) mix was more
influenced by the effects of vibration. The pressure developed in this
case increased by an average of 56 percent compared with only 10 percent
for the rich (1:3) mix. The corresponding increase in pressure predicted
by Rodin for a 1:2:4 mix was 36 percent.
It was observed that the head of concrete at maximum pressure
tended to increase as the pressure itself was increased with vibration.
Ritchie noted that with both the 1:3 and 1:6 mixes, when compacted by
hand, the batches with low workability gave slightly higher pressures
than those with high workability: This he considered to be due to the
wedging action of the aggregate particles, when they were compacted by
hand ramming, as opposed to the floating action produced by mechanical
vibration.
2.5.3 Formwork
To determine the effect of size of the formwork on the maximum
lateral pressure of concrete, the maximum pressures were recorded with
column sizes of 6 in. x 6 in. and 10 in. x 10 in. Concrete placed in the
10 in. x 10 in. formwork gave an increase of 26 percent in lateral pres
sure as compared to the 6 in. x 6 in. form. The comparison of different
column sizes is given in Figure 2.13. Ritchie commented that the results

- 21 -
obtained with formwork of 24 in. x 96 in. cross-section, with heavy
vibration, agreed almost exactly with Rodin's theoretical estimate for
P and H . The maximum pressure developed was 268 percent greater than
that for the original column of 6 in. x 6 in. section.
2.5.4 Properties of the Concrete Mix
a) Richness of the Mix
The comparison between 1:3 and 1:6 mixes is shown in Figure 2.14.
It was observed that the richer mix gave the higher pressure. The per
centage increase in pressure was 91 percent at 10 ft per hour and 38 per
cent at 20 ft per hr or an average correction factor of 165 percent for
the richer mix. This corresponded to Rodin's 136 percent increase in
pressure for a 1:1:2 mix over the basic 1:2:4 mix.
b) Workability
The lateral pressure of concrete was observed to increase with
workability as shown in Figures 2.15a and 2.15b. However, there was a
significant difference between the 1:3 and 1:6 mixes as illustrated in
Figures 2.11, 2.12 and 2.15a and 2.15b.
2.6 The Civil Engineering Research Association (Now called CIRIA -
Construction Industry Research and Information Association) (9) sponsored
a large scale field investigation on the lateral pressure of concrete on
formwork by making over 200 pressure measurements under actual industrial
conditions in England during 1961-1962. The results were published as a
research report in 1965.
The range of conditions covered by this secies of tests was
considerable. Concrete temperatures were observed as low as 38° to over

- 22 -
90°F, rates of placing varied from 1 ft/hour to 120 ft/hour, sections
varied in minimum dimensions from 5 inch to 8 ft, heights of pour were
normally not less than 10 ft and a few were in excess of 20 ft. Internal
vibration was invariably used but external vibration was sometimes employed
in addition. Maximum sizes of aggregate varied up to 1-1/2 inch with
slumps from 0 to 6 inch.
The authors concluded from a preliminary investigation that
fresh concrete behaves almost as a liquid under the mobilizing influence
of vibration, the pressure generated being simply the product of density
and head. Deviation of the pressure curve from the equivalent hydrostatic
condition occurs in consequence of two factors - stiffening of the concrete
and arching effects.
2.6.1 Stiffening of concrete was defined as the progressive in
crease in resistance of the concrete to mobilization, which is partly due
to chemical changes in the cement matrix but is also dependent upon the
degree of mechanical interlocking between aggregate particles. As
stiffening developes, the concrete becomes capable of supporting additional
surcharge without increase in lateral pressure; this phenomenon was
assumed to be related to the rate of increase of shear strength of the
fresh concrete.
2.6.2 Arching effects - Kinnear et el considered that in all sections,
the vertical load at any horizontal section is reduced by frictional forces
developed between the concrete and the form faces. These frictional
forces assume particular importance in narrow sections where the sur
charge volume is comparatively small. This effect has been termed

- 23 -
arching and is dependent on the minimum dimensions of the section, the
profile and slope of the form surface, and the variation of the co
efficient of friction between the concrete and the form faces. It was
also concluded that the arching limit increased with higher rate of
placing, and could be represented by the equation
P = 300 + 50d + 20R 2.22
where d is the minimum dimension of form in inches.
2.6.3 CIRIA after preliminary study of the test results, concluded
that five influencing variables were of particular importance and
classified the test results according to the magnitude of these variables.
The subdivisions adopted were:
1. Concrete Temperature - °F
A B C D E F G
<40 40-50 50-60 60-70 70-80 80-90 >90
2. Rate of Placement - R ft/hour
A B C D E F G H
1-2 2-3 3-5 5-8 8-12 12-20 20-30 >30
3. Minimum Dimension - d inches
A B C D E
<6 6-12 12-18 18-24 >24
4. Workabiltiy
A B C
Stiff Normal Highly Workable
The above classification of workability is further explained
in terms of slump.
- 24 -
Workability Ranges
Stiff Normal Highly Workable
Slump 0-1 1-2-1/2 2-1/2-5 (inches)
5. Vibration
A B C
Low Intermittent Continuous
This classification did not give a very clear division hence an appro
priate division was made in terms of continuity of vibration expressed
as a percentage of total placing time
Low Intermittent Continuous
10-40% 40-70% 70-100%
Each of the above results were then coded for rapid identification with
a five letter symbol representing each of the above divisions, e.g., a
result with the Index CDACB represented a test when the concrete tempera
ture lay between 50 and 60°F, placing continued at a rate of 5-8 ft/hour
in a wall up to 6 inches wide using a highly workable concrete vibrated
intermittently.
2.6.4 Stiffening Time of Concrete
The stiffening time t , may be defined (7) as the time at ° max J
which maximum pressure occurs. It must be stated here that this definition
of time is more realistic than the more usual set times as defined in
ASTM C191-70. This time should be dependent on the concrete temperature
and on the workability of the concrete. The derived relationship between
the stiffening time and temperature of the concrete is given in Figure 2.16.

- 25 -
2.6.5 The Shape of the Pressure Curve
CIRIA gave the following relation for the pressure curve
P ^ 2.23 1 + C ( f - 4
max
2 where P = pressure lb/ft
3 A = density of the concrete (lb/ft )
R = rate of placing (ft/hour)
t = time from commencement of placing (hours)
t = stiffening time of the concrete (hours), Figure 2.16 max
C = factor depending upon the workability of the concrete and the continuity of vibration
Empirical values of C are given in Figure 2.17 and were derived directly
from the experimental results. A correction to the above equation was
introduced to account for the withdrawal of the source of vibration
which normally occurs with very high rates of placing. The correction
12(8-R) has the effect of adding small pressures at R < 8 and subtracting
comparatively large pressures at R > 8. The final equation is
P = ^ r + 12(8-R) 2.24
i + c ( | — r
max
CIRIA recommended an additional pressure of 200 psf to allow for impact
surcharge due to pouring of concrete from heights.
2.6.6 Pressure Design Chart
CIRIA developed a chart from the test results to provide a guide
to determine the design pressure for formworks, this is presented in

- 26 -
Figure 2.18. The radial lines represent rates of placing R from 1 ft/hr
to 50 ft/hr, while the full spiral lines represent different temperatures
of concrete from 40°F to 90°F. The broken spiral lines, d, are arching
limits for minimum section dimensions from 6 in. to 18 in. whereafter
arching effects are considered to be inappropriate.
The diagram would be used by selecting the appropriate rate
of pour and concrete temperature and then measuring the pressure radially,
from point 0 in accordance with scale P, to the point at which the lines
representing the above criteria intersect. The basic pressure thus
derived is then modified by multiplying by a factor F obtained from
Figure 2.19 to compensate for concretes of different workabilities and
for different continuities of vibration. The arching limit for the
appropriate section is then checked on the same radial "rate of placing"
line and the lesser value used to determine the design pressure. An
2 addition of 200 lb/ft is made after the application of factor F, to
take account of pressure due to impact.
The pressure design chart is bounded by two arbitrary limits,
2 a maximum pressure of 3000 lb/ft and a minimum temperature of 40°F.
2.7 Olsen (13) in his Ph.D. thesis, presented a design method based
on the ACI and CIRIA approaches, modified by introducing the concept of
shear strength of the fresh concrete.
The shear strength of fresh concrete was determined by use of
a triaxial testing arrangement. The triaxial tests were conducted at
different concrete set times, defined as time after addition of water to
the mix and a shear strength-set time relationship was established. Only

- 27 -
one concrete mix 1:1.5:1.5 with a water cement ratio of 0.40 and a test
temperature of 77°F was used so that the factor of shear strength could
be isolated and its effects on concrete pressure established.
Under these conditions, the lateral pressures obtained by this
method were compared with the pressures that were computed using the
methods recommended by ACI and CIRIA.
Olsen then made the following conclusions:
1. Triaxial tests may be used to determine the lateral pressure on
vertical formwork by wet concrete.
2. The shear strength parameters of concrete are a linear function
of set time.
3. Coulomb's rupture theory does apply to concrete before it sets.
4. The shear strength of fresh concrete can be related to the lateral
pressure of concrete on formwork provided , the associated boundary
conditions are considered.
5. Both the ACI and CIRIA methods for determining the concrete pressures
give similar results. However, in some cases they are both overly
conservative.
2.8 Ritchie (15), in a study sponsored by CIRIA, investigated the
effect of stiffening of concrete on the lateral pressure of concrete on
vertical formwork.
A detailed study was conducted to establish a relationship
between types of cement, types of aggregates and the workability of the
concrete mix. It was established that slump tests, vebe tests and by
means of flow table, stiffening of concrete can be determined, but the
- 28 -
slump test becomes inoperative when a zero slump has been obtained.
Ritchie concluded that the compaction of concrete mixes by mechanical
means increases the shear strength over those compacted by hand; this
effect is more noticeable with decrease in the ratio of cement to
aggregate. It was also concluded after experimental investigation
that the ACI calculated pressures are excessively conservative, prob
ably because of the non-recognition of the effects of mix characteristics,
and intensity of vibration. Ritchie also observed that the CIRIA design
chart provided the closest agreement between predicted and recorded
pressures, although the increase in pressure forecast by the chart due
to increase in rate of pour was not obtained experimentally. A greater
difference in the pressures predicted and observed occurred with concretes
of low cement content. Also the correction factor 'F' by which the basic
pressures from the CIRIA design chart are multiplied, was observed to
cover too wide a range, predicting greater reductions and increases
from a standard condition than were actually achieved.
Ritchie formulated a new concept of the mechanisms intrinsic
in the pressure of concrete on formwork, by considering a slug of
freshly mixed concrete initially placed in the formwork, to consist of
a heterogeneous conglomerate of discrete batches of aggregate particles
bound together in a cement matrix. Each of these batches is interlinked
by this matrix and enclose large air voids. With vibration this semi-
continuous mass is rendered homogeneous, with a majority of the air
being expelled and the aggregate particles being kept in suspension by
dispersive pressure. When the mix is in such a condition it acts as
3 fluid with a density of around 150 lbs/ft and exhibits a hydrostatic

- 29 -
pressure on the form in proportion to its depth. With the withdrawal
of the source of vibration the concreteg structural viscosity is
immediately increased, although the yield strength of the cement paste
matrix may be removed, diminished or augmented depending upon the dura
tion of shear. The form pressure which the mix exhibits as it congeals
will reduce rapidly from the totally fluid to that necessary to maintain
equilibrium, since a resistance to dilatancy of the cement paste together
with the regained viscosity, and cohesion will contain a large proportion
of the shearing stresses induced by the mix self weight. With the im
position of a further slug of concrete which is also rendered fluid by
vibration, the shearing stresses induced in the lower slug will be such
that the dilated resistance to deformation and cohesion are easily over
come and the mix will tend to deform plastically, such that the pressure
produced at all levels will appear to be hydrostatic in 1:1 ratio.
During this process the aggregate particles in the matrix will tend to
approach one another since because the yield strength of the cement paste
has been removed it becomes incapable of suspending these particles. The
particles will gravitate although this will depend on the dispersive
pressure between any two particles caused by transmitted vibration and
also hydrodynamic lag effects. Eventually, with the superimposition of
further slugs of concrete and transmitted vibration, a particulate system
will form, with sizes ranging from unhydrated cement particles to the
largest aggregate size with such a system pressure may still be trans
mitted in a lateral direction through pore-fluid of the cement paste
matrix. As the shearing stresses induced by the head are transferred
to the skeleton structure a compression of the volume occupied by the

- 30 -
particles will occur, resulting in the expulsion of the interstitial
cement paste and water and thus the transference of vertical pressure to
the form walls.
When, however, a maximum density of the particulate system
occurs, any further shearing stresses induced by the head will cause a
dilation of the structure and thus a slight increase in the volume which
it occupies. This will cause the pore fluid to be drawn into the inter
stitial spaces formed, and hence will result in a reduction of the pressure
transmitted in the lateral and vertical directions. Thus, the concrete
pressure reaches a maximum and then exhibits the phenomenon of no pressure
increase with further head. A distinct drop off in pressure is experienced
with time as thixetropic regain is established and the chemical bonds
restrain any tendency to plastic deformation.
During his investigation, Ritchie also discovered the following:
1) The effect of increasing the workability of concrete as measured
by the slump test does not necessarily produce an increase in the lateral
pressures generated on formwork.
2) An increase in the continuity of vibration applied to any one
mix at any level of workability does not appear to necessarily produce
an increase in the maximum pressure. It would appear that for the form
used and the type of vibration applied, a critical continuity exists
whereby a reduction, or increase, in this value gives a reduction in the
maximum lateral pressure. The degree of this reduction, however, would
appear to be dependent on the combined effect of mix characteristics,
workability, the continuity of vibration applied and the rate of placing.

- 31 -
3) The degree of pressure reduction is not related directly to
the degree of workability as measured by the slump test at zero time,
the history of vibration, mix cement to aggregate ratio, or rate of
concrete placement.
4) It was suggested that the degree of pressure reduction under
anycircumstances is dependent on the degree of mix mobility, matrix
fluidity obtained at the time of occurrence of maximum pressure, and the
setting action of cement producing an increase in the cohesion of the
mass, i.e., its isotropic tensile strength.
2.9 Adam (1) conducted tests to study the effect of certain variables
on the lateral pressure of concrete by using a steel wall formwork 3 metres
high (9.75 ft), 2.5 metres (8.13 ft) wide and of variable thickness. He
considered the type of cement, size of aggregates, additives, slump of
the mix, rate of pour and vibration to be the factors affecting the con
crete pressure significantly.
During his study, Adam, measured concrete pressure using a
device wMch consisted of a metallic membrane attached to the vertical
face of the formwork supported by oil, which transmitted the concrete
pressure from the membrane to a monometer.
Adam conducted tests with various types of cement, and additives.
Concrete pressure was determined experimentally varying the rate of pour
from 0.33 m/hr (1 ft/hr) to 8 m/hr (26 ft/hr), wall thickness 12 cm (5 in.)
to 40 cm (15 in.) and temperature from 0°C to 25°C. During the tests
slump, porewater pressure and the influence of vibration were measured.

- 32 -
Adam concluded that the depth of influence of vibration is a signifi
cant factor affecting the concrete pressure though he did not take into
consideration the power of the vibration or the duration of vibration.
Adam also commented that the slump and thickness did not have a very
significant effect on the lateral pressure and the effect of the rate of
pour was less than suggested by previous investigators.
Adam concluded the following factors to have a significant
influence on the lateral pressuresof concrete.
1. Temperature: As the temperature decreases, the pressure increases,
but this phenomenon is appreciable only in case of high rates of pour and
in case of rates of pour as low as 1 m/hr its effect is negligible.
2. Rate of Pour: It was concluded that the increase in rate of pour of
concrete gives rise to an increase in pressure, as illustrated in
Figure 2.20, but this effect is less than predicted by Rodin, ACI Com
mittee 622 and Schjodt.
3. Type of Cement:. It was found that the type of cement has a signifi
cant effect on the pressure of concrete.
4. Size of Aggregate: Adam concluded that the size of the aggregate
is a factor significantly affecting the concrete pressure.
5. Thickness of Form: Adam concluded that an increase in form thickness
increases the concrete pressure only for a moderate rate of pour (2 to 3
m/hr) and does not have any influence on pressure for rate of pour less
than 1 m/hr or greater than 4 m/hr.
6. Additives: Tests were also conducted with various types of cement and
additives and these variables were concluded to have a major effect on
concrete pressure.
- 33 -
Adam proposed prediction equations relating concrete pressure
to rate of pour and temperature of the concrete mix which are illustrated
in Figure 2.21 and summarized in Table 2.3.
2.10 Levitsky (11) attempted to approach the problem analytically by
hypothesizing that the shape of the pressure curve was the result of a
simultaneous hardening and shrinkage of the concrete mix following place
ment, and in addition a relaxation of the formwork.
Levitsky considered pouring a vertical wall between form sur
faces some arbitrary distance apart, as depicted in Figure 2.22; the wall
extending to infinity, horizontally and resting upon an infinitely rigid
body. The form surfaces were modelled to exhibit a large initial stiff
ness under impulsive loading, limited creep under constant pressure, and a
relaxation of pressure with constant displacement. The coefficients of
such a model are associated with the physical parameters of the formwork
according to the following definitions, also illustrated in Figure 2.23.
(1) E, + E„ = initial stiffness coefficient
(2) E1 = residual stiffness coefficient
(3) n = viscous coefficient
(4) n/E„ = t = relaxation time constant of the formwork. 2. R
Assuming R to be the rate of pour in feet per hour, t the ri
settling time for the concrete mix, z representing the depth of liquid n
region of concrete and z the vertical coordinate of the system, the maxi
mum form pressure, occurring at the hardening surface of the concrete, is
given by the relation
P = p R t 2.25 m ri

- 34 -
TABLE 2.3 Maximum Lateral Pressure of Concrete in Tons Per Square Metre (Adam)
P (V) Rate of Pour (m/h) max t/m V < 2 m/h V > 2 m/h
< 5°C 2 + 1.25 V 4.1 + 0.2 V
u
g 15°C 2 + V 3.6 + 0.2 V
cu H
>25°C 2 + 0.85 V 3.3 + 0.2 V

- 35 -
The residual value of the form pressure P is represented by
P = P (1 - k) 2.26 m
where k is called the relaxation factor and is given as
K = -§iy![l - exp(-S'T)] 2.27
' fcH T = —— = ratio of hardening time to relaxation time
CR and
El S* = p — , = ratio of residual form stiffness to initial
1 2 form stiffness given in Figure 2.24.
In the final form the pressures for hydrostatic region and be
neath the hardening interface were given as the following:
P = density x depth = pz, 0 < z < Rt„ 2.28 £1
P = pressure below the hydrostatic limit z ~* z
= Pro + (Pm - PJ exp(-L— }, RtH <: z < - 2.29
Levitsky's theoretical approach, to determine the lateral
pressure of concrete, reproduces the characteristic shape of the pressure
curve but the variation of the form pressure distribution with rate of
pour does not correspond to the experimental data; it is observed that
this method gives a linear variation of lateral pressure with pouring
rate.
Levitsky did not take into consideration the development of
shear strength and stiffening of concrete, shrinkage, vibration, arching
and porewater pressure, but is more or less based on the structural
aspects of the form.
- 36 -
2.11 Summary
Owing to the large number of different variables affecting the
lateral pressure of concrete and the different empirical approaches
adopted by different investigators to solve the problem, it is important
to summarize the different factors responsible for the general pattern
of the pressure distribution of concrete on the form and their effects
on the maximum pressure.
2.11.1 Shape of Pressure Diagram of Forms
From the hypothetical and experimental reasonings given by
different investigators, at this stage, it can be concluded that the
shape of the pressure curve achieved is due to the following factors
(a) Arching, which is a phenomenon representing the friction between
concrete and the face of the form and the internal shear strength
mobilized due to the deflection of any part of the form. This
factor has been considered to be important by Rodin, Schojdt,
Kinnear and Ritchie.
(b) Shear Strength of Concrete. Shear strength in a particulate material
is due to the development of cohesion and internal friction. It is
obvious that the shear strength of concrete increases with time,
probably the major change being the development of cohesion (inter
locking crystal growth). Rodin, Ritchie, Schjodt's and Olsen agreed
to this phenomenon. Rodin concluded that shrinkage and bleeding of
concrete tends to accelerate the stiffening time of concrete and
speed the development of its shear strength.

- 37 -
2.11.2 Influence of Physical Factors on the Lateral Pressure of Concrete
In addition to the factors stated above the following physical
factors influence the development of maximum pressure of concrete.
(a) Rate of Placement of Concrete
As the rate of pouring of concrete increases the maximum pressure
also increases. The significance of this factor has been taken into con
sideration in Rodin's equations 2.1, 2.2 and 2.3. This factor has also
been observed to have a major affect on concrete pressure by ACI Committee
347, Ritchie (16), Kinnear (9) and Adam (1).
(b) Proportion of Concrete Mix
Rodin and Ritchie observed that the richer concrete mix exhibits
higher pressure. Rodin attributed this phenomenum to the lubricating
action of the cement which reduces the frictional properties of the mass
and hence the arching action.
(c) Size of Aggregate
Adam (1) and ACI (8) concluded that the size of the aggregate
is a factor significantly affecting the concrete pressure.
(d) Consistency of the Concrete
The higher the slump for a particular mix the lesser would be
the deviation of the pressure from a hydrostatic distribution, and the
higher the lateral pressure. This was concluded by Rodin and Ritchie
and indirectly by CIRIA.
(e) Temperature of the Concrete Mix
A decrease in temperature increases the concrete pressure sig
nificantly. This affect has been observed by Rodin, Ritchie, Kinnear
and Adam.
Rodin's formulae for maximum pressure of concrete provide

- 38 -
pressures at 70°F to which a correction factor has to be applied to
obtain pressure for a given temperature of concrete mix, the relation of
temperature and correction factor is given in Figure 2.4d.
Kinnear (9) considered the effect of temperature on the pressure
of concrete in his derivation of the relation (Eq. 2.26) giving lateral
pressure of concrete by assuming that the setting time of concrete is
affected by temperature.
Ritchie (16) and Adam (1) also observed this effect during
their investigations.
(f) Size and Shape of the Form
It is generally considered that the smaller the width of the
form, the greater would be the arching action which would reduce the con
crete pressure.
(g) Method of Compaction
Rodin concluded that the concrete compacted by vibration will
exhibit higher pressures than that compacted by hand. Rodin also observed
that using external vibrators results in hydrostatic concrete pressure
over the total depth of the form.
Ritchie (16) observed that the pressure developed during the
compaction of lean mixes by mechanical vibration was 56 percent greater
than that exhibited during hand placing, whereas the influences of
vibration on a rich mix (1:3) gave a 10 percent difference of pressure
due to lubrication.
CIRIA (9) considered continuity of vibration to be a significant
factor influencing the concrete pressure and adopted a constant of vibra
tion in its relation for pressure.

- 39 -
2.11.3 Comparison of Results
The pressures which would be predicted by the methods recom
mended by Rodin, CIRIA, ACI and Adam at temperatures of 70°F, 50°F and
35°F, at a rate of pour of 20 ft/hr are compared and illustrated in
Figures 2.25a, 2.25b and 2.25c.
It is noticed that Rodin's approach towards the calculations
of lateral pressure takes into consideration the effects of temperature
changes which are quite significant, whereas the effect of vibration is
considered only to the extent of the method of compaction with no specific
attention to the parameter of vibration.
The method recommended by CIRIA takes into consideration the
effects of rate of pour, temperature, continuity of vibration and width
of the form but the pressures achieved are highly influenced by the
arching criteria which only takes into consideration the rate of pour of
concrete and width of the form.
The ACI Committee 622 (347) recommendations do not show signi
ficant effects due to small changes in temperatures and usually provides
higher values for the lateral pressure.
Adam considered the variation in temperature and rate of pour to
have significant effects on the lateral pressure of concrete; however, his
conclusions from the experimental results showed the temperature effects to
be significant only over a major temperature variation as illustrated in
Table 2.3.

- 40 -
In order to compare the methods of determining lateral pressures
of concrete, the pressures calculated by the methods recommended by Rodin,
ACI Committee, CIRIA and Adams are tabulated in Table 2.4 for various
rates of pour, temperature, slump and mix proportions.

TABLE 2.4 Maximum Pressure of Concrete in Pounds Per Square Foot
Rate of Pour R = 5 ft/hr R = 10 ft/hr R = 20 ft/hr
Rodin
ACI
CIRIA-S tiffening Criteria
Arching Criteria
Stiffening Criteria
Arching Criteria
Max Design Pressure**
Max Design Pressure
Adam
Temp of Concrete 40°F 50°F 70°F 40°F 50°F 70°F 40°F 50°F 70°F
d in
12"
12"
18'
18"
12"
18"
Cone Mix
Slump
1:2:4
1:3:6
2" 4" 8"
2" 4" 8"
2" 4" 8"
2" 4" 8"
2" 4" 8"
2" 4" 8"
1151 1263 1543
978 1074 1312
561 598 *
1000 1000 1000
561 598 *
1300 1300 1300
761 798 1200
761 798 1200
804
984 1080 1320
836 918 780
1275 1050
558 597
*
1000 1000 1000
558 598 *
1300 1300 1300
758 "797 1200
758 797 1200
725
757 831 1015
644 706 863
507 588
*
1000 1000 1000
507 588 *
1300 1300 1300
707 788 1200
707 788 1200
725
1450 1591 1945
1233 1352 1653
1240 1361 1664
1054 1157 1414
954 1047 1280
811 890 1088
1827 2005 2451
1553 1704 2083
1563 1715 2096
1329 1458 1782
1099 1100 *
1100 1100 1100
1099 1100 *
1400 1400 1400
1299 1300 1300
1299 1300 1300
967
1091 1099 *
1100 1100 1100
1091 1099 *
1400 1400 1400
1291 1299 1300
1291 1299 1300
864
991 1080 *
1100 1100 1100
991 1080 *
1400 1400 1400
1191 1280 1300
1191 1280 1300
2101 2105 *
1300 1300 1300
2101 2105 *
1600 1600 1600
1500 1500 1500
1500 1500 1500
864 1093
2086 2102 *
1300 1300 1300
2086 2102 *
1600 1600 1600
1500 1500 1500
1500 1500 1500
990
1202 1319 1612
1022 1121 1370
793 2400 1950 1436 3000 3000 2721
1886 2065 *
1300 1300 1300
1886 2065 *
1600 1600 1600
1500 1500 1500
1500 1500 1500
990
i
Under given conditions this criteria is not predominant, hence not considered. ** Max design pressure = minimum pressure value obtained from stiffening and arching criteria - 200 psi (impact pressure).

- 42 -
CHAPTER 3
OBJECT OF THE PRESENT STUDY
The lateral pressure of concrete is a function of numerous
parameters. Tests to determine the lateral pressure of freshly-placed
concrete have been coiiducted by many researchers, but the results varied
too much to provide reliable data. This has been attributed to the dif
ferent conditions under which the experiments were carried out, and also
to the multitude of factors that influence the fresh concrete.
The original intention of this study was to experimentally
determine a conservative envelope of lateral pressure with the parameters
of slump and concrete strength kept constant and varying the width of
the form, the temperature of the concrete and rate of pour. The first
pour of this series of tests was a repeat of a pour in a previous series
of tests to calibrate and reproduce the results obtained previously and
to measure lateral pressure of concrete by using Cambridge cells; the
Principles of Cambridge cell will be discussed in detail in Chapter 4.
Unfortunately, the results in no way correspond with the previous results
and the reason for this discrepancy had to be determined.
After studying the details of the present and previous experi
ments and much discussion it was realized that a different vibrator had
been used, the depth to which the vibrator was immersed could have been
different and that the duration of vibration could have differed. At
this point it was realized that it would be unrealistic to determine a
pressure envelope until the dependency of lateral pressure on vibration
had been clarified. Hence the objectives were redefined as determining

- 43 -
the variation of lateral pressure with power of vibration, immersed depth
of vibrator, duration of vibration and temperature keeping concrete
strength, slump, rate of pour and form dimensions constant.

- 44 -
CHAPTER 4
EXPERIMENTAL APPARATUS
4.1 General
To determine the lateral pressure of concrete on formwork and
to study the parameters responsible for the variations in concrete pres
sure and the extent of their influence, different investigators used
many different types of equipment. However, the lack of correlation
between results of the different investigators can be explained partly
as due to the scarcity of knowledge and control of the parameters in
fluencing the behaviour of the concrete, and partly due to the equip
ment used for measuring the lateral pressures.
It has been observed by several investigators that any outward
movement or deflection of the form causes a tremendous reduction in
lateral pressure, thus the current experimental investigation used rigid
steel formwork to minimize this effect and hence maximize the lateral
pressure.
4.2 Description of Formwork
The formwork used is a steel open ended box erected in the
basement of the structural laboratory of the University of Ottawa. The
basement floor is 12 feet below the main strong floor of the laboratory
and hence 3 feet of the form projects above the ground floor. This
location enables concrete to be poured directly from the mixing truck
into the form. An overall view of the form is shown in Figure 4-la.
- 45 -
The formwork has dimensions of 15 feet in height, 3 feet in width and
thickness variable up to 22 inches. The movable 3 feet wide back face
of the formwork has 5 holes, each 5 inches in diameter, to locate the
pressure measuring devices.
The formwork is a rigid structure made from structural steel
and details of the fabrication are illustrated in Figure 4-lb and given
in Table 4.1. The major parts of the form are:
1. The movable back face
2. The two side faces
3. The front face
4. The supporting collars.
The movable back face is 0.5 inch thick steel plate stiffened
by two vertical I-section beams and stiffeners; these beams in turn
support 3 cross-beams to provide further stiffening and support a vertical
I-section beam along the mid-width which is used to carry the pressure
cells} to prevent any movement of the movable face during concrete
pouring. The supporting collars, made of box sections are also used to
support the hydraulic jacks necessary to avoid any unforeseen movement
in the back face of the form. The side faces are held tight against the
front and back faces by beams bolted at three locations over the height
of the structure.
4.3 Pressure Measuring Device and Principles
4.3.1 To measure the lateral pressure of concrete over the years
many different types of instruments have been used. Roby (14) measured

- 46 -
TABLE 4.1 Details of Rigid Steel Formwork (Refer to Fig. 4-lb)
Index No. Description
1 Front face (2-15" channel sections and 1'6" channel sections).
2,3 Side faces, 12" channel section each, bolted to 5 .
4 4x4 WF Beam, welded to back of 'front face'.
5 4x4 WF Beam, hinged to '4', holding the 'side face' in vertical position.
6 Movable back face.
7 6x6 WF Beams, various lengths.
8 6x6 WF Beams, all the 5 load cells are mounted to it.
9 Pressure measuring device - load cell
10 6x6 Box section, welded to the back of front face, forming part of the supporting collar.
11 6x6 Box section, joining the movable part of the supporting collar, can be moved to the desired position 'a', 'b', 'c' or 'd' according to the desired form thickness.
12 Jack, trade mark 'ENARPAC-RC-102', 10 tons capacity and 2-1/8" stroke.
13 Supporting threaded rods.
14 Pull out threaded rods.
15 6" channel section, part of the supporting collar.
16 Threaded rod, holding the side faces from opening up while concreting, rod has to pass through each side face of each side at position of 'a', 'b', 'c' or 'd' according to form thickness.
a Position for 6" thickness of the form.
b Position for 9" thickness of the form.
c Position for 12" thickness of the form.
d Position for 18" thickness of the form.

- 47 -
the concrete pressure by the deflection of a 7/16 inch steel plate,
6 inches wide, extending the full width of the form and resting on knife
edges 28 inches apart. The steel plate was located near the bottom of
the form; by means of a pivoted bar, connected to a lever to give a ratio
of 10:1, the deflection of the centre of the plate was read on a scale
graduated in 1/64 inch, and by using a magnifying glass it was possible
to read to within 1/256 inch. This corresponded to a plate deflection
of 0.004 inch. The thickness of the timber sheathing above and below
the steel plate was designed to give the same deflection under load as
the steel plate.
Shunk (19) inserted a 9-1/4 inch diameter cylinder, fitted with
a freely moving piston, into the wood formwork, and by means of a weighted
lever arm determined the load required just to prevent the piston from
moving under the applied concrete pressure.
McDaniel and Carver (12) used a pressure gauge consisting of a
small flexible German-Silver diaphragm acting upon a reservoir containing
mercury. The reservoir was connected to a glass tube, and the pressure
was indicated by the position of the mercury in the tube.
Macklin (12a) calculated the pressure of concrete against form-
work by measuring the deflection of the wood sheathing relative to the
supporting studs by means of a dial type micrometer mounted on a bridge
arrangement.
The pressure measuring device used by the California Division
of Highways (13) consisted of a metal disk, to one side of which a sheet-
rubber diaphragm was clamped in a manner similar to that of a drum head.

- 48 -
The shallow space between the rubber diaphragm and the disk was filled
with liquid, which operated an ordinary pressure gauge mounted on the
back of the disk. The cells, 6 and 12 inches in diameter, were inserted
into the form wall so that the rubber diaphragm was flush with the inside
surface of the wall.
David, Jensen and Neeland (3) during the restoration of the up
stream surface of the Barker Dam with prepakt concrete attached strain
meters to the 1 inch diameter steel bars which anchored the precast face
slabs to the face of the old dam. The stresses in the anchor bar were
measured and the pressures against the slab form, during the process of
filling with aggregate and the later process of grouting, were back
calculated. Carlson electric resistance meters were welded to the anchor
bar to measure the loads in the anchor bar.
Smith, Slater, Goldbeck and Teller (17) used Goldbeck-type
pressure cells inserted in the forms with the diaphragms flush with the
inside form surface. This type of cell requires a small movement of the
diaphragm against the concrete to break the circuit.
Civil Engineering Research Association (9) CERA now CIRIA used a
nominally no displacement device to measure the lateral pressure of concrete,
which comprised of a cylinder and piston. Air pressure within the cylinder
was used to balance the direct thrust from the concrete. Sensitive micro-
switches were used to indicate small movements of the piston and so en
able balance to be effected.
Considerable conflict exists between the results of these
previous researchers which has largely been attributed to differences in

- 49 -
measuring techniques. Great importance has recently been attached,
therefore, to the type of apparatus used and its sensitivity.
All the problems inherent in the lateral pressures of fresh
concrete also occur in the measurement of earth pressures. Over the past
few years the measurement of earth pressures has advanced considerably
and for this investigation it was decided to use a standard developed
earth pressure cell.
When selecting the type of pressure cell to be used in this
investigation, it was decided to adopt a device capable of measuring both
the lateral pressure of concrete on the vertical faces of the form and
the shear forces developed due to the friction effects at the same
location, simultaneously.
4.3.2 Type of Cells
There are two basic types of pressure cells which have been
utilized in the past for various pressure measurements. These are cells
with a flexible surface or diaphragm in contact with the soil and cells
with a rigid face plate. A detailed study on this subject has been con
ducted by Doohan (4).
4.3.3 Shear and Normal Force Measurement using Earth Pressure Cells
Most earth pressure cells are capable of measuring only the
pressure normal to the face of the cell. Recently several load cells
have been devised that can measure force both perpendicular and parallel
to the face of the cell.

- 50 -
The Cambridge cell developed by Arthur and Roscoe (2), which
can measure both normal and tangential pressures, was chosen for this
study as it could be made and calibrated in-house and experience of use
existed in the Ottawa area.
4.3.4 Cambridge Cell
Basically the cell is designed so that the face plate is supported
by thin webs which are infinitely stiff in their own direction and in
finitely flexible in the transverse direction, load being measured by
strain gauges on the webs. By using webs in any required direction the
load in that direction can be determined. The cell shown in Figure 4-2.
A normal load causes strain in the normal webs and a shear load develops
strain in the shear webs. Eccentricity is calculated from the proportion
of the normal load carried by each normal web. Range and sensitivity of
the cell is determined by the thickness of the webs and by the area of
the top plate.
4.3.4.1 Modification to the Cambridge Cell
The original Cambridge cell transmitted the shear forces through
a shear pillar by two shear webs. A total of 20 strain gauges were used
to measure the various load components. The original Cambridge cell was
modified to transmit the shear force through four shear webs and the
number of strain gauges required reduced to sixteen. Doohan (4) used the
modified Cambridge cells to measure the distribution of shear and normal
forces on a footing. The purpose of modifying the cell was to ensure
higher precision in measurements and minimize the chances of damage.

- 51 -
A comparison of the original and modified cells is shown in
Figure 4-4»
In each cell sixteen strain gauges were used, eight for shear
and eight for normal pressure measurements . The strain gauges
were connected to the strain indicator through the balance unit, using
a quarter bridge arrangement for both shear and normal circuits, each
using two active gauges and two dummy gauges connected in series.
4.3.4.2 Principle of Operation
Cambridge cells can measure a shear force S, a normal force N,
and the eccentricity of the normal force e, in the plane of the shear
force. As the force N is applied at a distance e, from the centre of the
cell, it can be replaced by a force N' = N at the centre and a moment
N x e. The force N' is balanced by reactions of N'/4 in each of the
normal webs. The moment N.e results in forces in each pair of normal
webs, of equal magnitude but opposite sign and a force in the shear webs.
Similarly, a shear force S can be replaced by a force S' in the shear
webs and a moment caused by the fact that the actual force S acts slightly
above the level of the shear webs. This moment is balanced by forces in
each pair of normal webs (see Figure 4-3).
4.3.4.3 Choice of Cell Material and Circuit
Temperature variations influence the performance of resistance
strain gauges, due to temperature variations in gauge resistance, which
can be of the same magnitude as that caused by the strain. Generally,
AR the relative change — at a strain e and a temperature variation
- 52 -
A0 = 0 - 0 can be written as o
= | = e k (1 + mA0) + (a + kAa)A0 4.1 is. o
Ii the first term of equation 4.1, k is the conventional gauge
factor at room temperature, 0 and m is its temperature coefficient. The
second term comprises contributions from the thermal coefficient of resis
tivity Qt, and from the product kAa, where Aa = a.. - a~ is the difference
between the coefficients of thermal expansion of the test structure, a.. ,
and of the gauge wire, a„. The temperature error of a bonded resistance
strain gauge, therefore depends not only on the properties of the gauge
material but also on those of the test structure. It is possible, by a
suitable combination of materials, to obtain temperature compensation
AR with respect to —=r, so that
a + k(a1 - a2) = 0 4.2
It has been observed that a combination of a strain gauge with
aluminum substructures shows comparatively low effects due to change in
temperature.
This thermal effect can further be reduced by pairing active
gauges with dummy gauges or with matched dummies in a 1/4 bridge arrange
ment.
The cell was machined from a solid piece of aluminum alloy
HS15W. Aluminum was used as it has a low modulus of elasticity and is easy
to machine. A material with a low modulus of elasticity provides larger
strains, which are easier to measure under given conditions than a
material with a high modulus.

- 53 -
4.3.4.4 Choice of Web Dimensions
The dimensions of the webs govern the range and sensitivity of
the load cell. It should be noted that the minimum web thickness would
be about 0.015 inches (0.381 mm) since machining thinner than this would
be difficult. The webs were made 0.50 inches long and 0.25 inches wide
(12.7 mm x 6.35 mm).
4.3.4.4.1 Normal Web Thickness
The maximum normal load which could be expected would be hydro-
3 static pressure with a density of concrete of 153 lb/ft and under a
concrete head of fourteen feet.
P = YH = 153 x 14 = 2142 lbs/ft2
2 Hence a cell would be subjected to a maximum load of 2200 lbs/ft in
extreme conditions. If this pressure was evenly distributed over the cell
face plate of 19.12 square inch area (5" diameter), the normal force per
cell would be not more than 293 pounds. The cell was designed to take a
total load of 400 pounds. Under no eccentric load each web would be
required to take 25 percent of the total load, but since the load can be
eccentric each pair of webs was designed to take 75 percent of the total
load. Hence the thickness of the web can be calculated from:
t --150 lbs 3 fA x b ,, ,. 2 ,
lb/in x in
where fA = allowable strength of aluminum
= 20,000 psi
b = width of web
=0.25 inch
- 54 -
150 t = on nnn rT~oT = 0.030 inches
20,000 x 0.25
To check the web against buckling, Euler's buckling formula
was used assuming the web to be fixed at both ends.
2 3 P = iJbt lbs 4i4
C r 3L2
where E = modulus of elasticity 10 psi
P = critical buckling load
L = length of web
b = width of web
2 - 3P I,
or t3 = -f 4.5 IT Eb
3 x 150 x (0.5)2 , _, in-6 . . = — x =— — = 4.56 x 10 inches •n x 10 x 0.25
t = 0.0166 inches
Therefore a thickness of 0.030 inches was adopted for the
normal webs.
4.3.4.4.2 Shear Web Thickness
The maximum shear force was expected not to exceed the maximum
normal force, hence the shear webs were made to the same dimensions as
the normal webs.

- 55 -
4.3.4.5 Gauging and Bridge Circuit
Each cell contained sixteen CEA-13-125UW-120 type strain gauges
manufactured by Micro-Measurements and compensated for aluminum. The
gauges used had a gauge factor of 2.12 ± 0.5% at 75°F and resistance of
120 ± 0.3% OHMS. The strain gauges were placed on both sides of the shear
and normal webs and connected in series to eliminate bending effects.
Great difficulty was encountered in fixing the gauges to the webs and
then soldering leads to these gauges; only single strand small diameter
wire was attached to each solder dot. M bond 610 was used to cement the
gauges to the webs.
To use a quarter bridge arrangement two gauges were cemented to
a piece of aluminum and connected in series to act as a temperature com
pensated dummy.
4.3.4.6 Pressure Cell Calibration
1. Static Load Calibration
The cells were calibrated by applying directly vertical and
horizontal loads on the rigid face plates of the cells. The normal load
was applied by means of a hanger and weights at the centre and at
eccentricities of 5/8 of an inch on both sides of the centre of the plate,
through a steel ball. Shear load was applied in the direction parallel
to the plane of the face plate through a hanger and pulley.
Arthur and Roscoe (2) stated and it was observed experimentally
that the load cells recorded the same load whether the load was applied
at a point through a steel ball or uniformly over the whole face plate
of the cell.
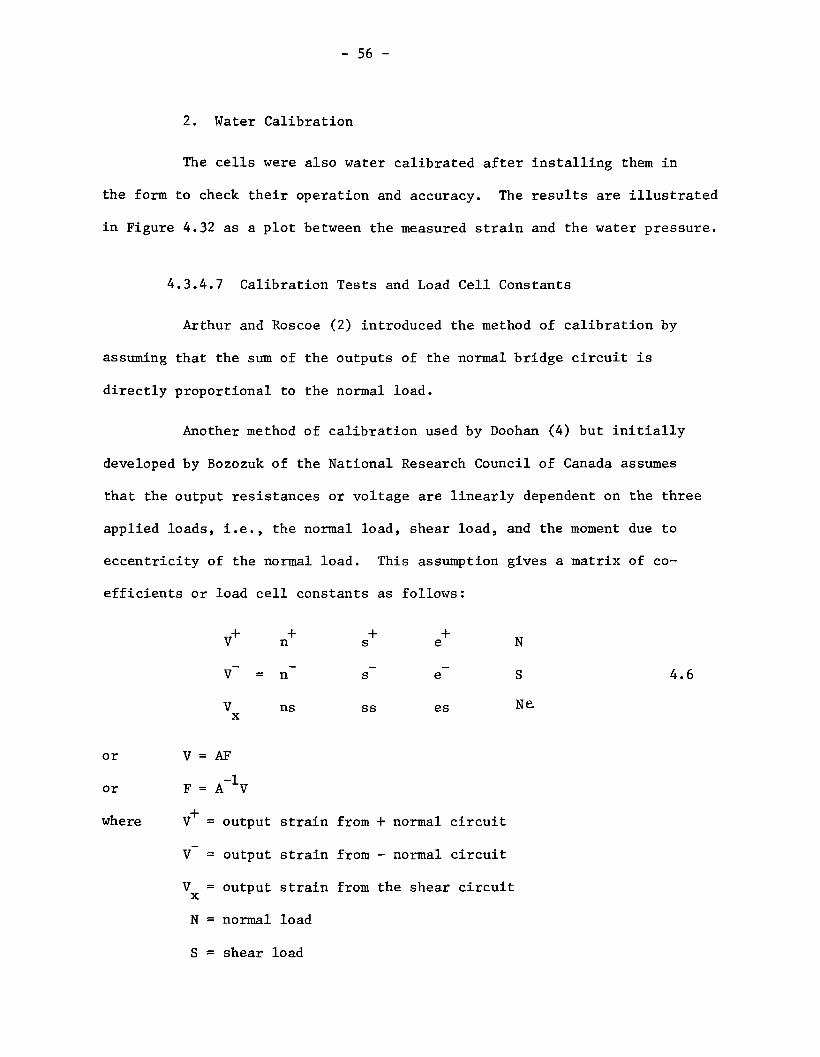
- 56 -
2. Water Calibration
The cells were also water calibrated after installing them in
the form to check their operation and accuracy. The results are illustrated
in Figure 4.32 as a plot between the measured strain and the water pressure.
4.3.4.7 Calibration Tests and Load Cell Constants
Arthur and Roscoe (2) introduced the method of calibration by
assuming that the sum of the outputs of the normal bridge circuit is
directly proportional to the normal load.
Another method of calibration used by Doohan (4) but initially
developed by Bozozuk of the National Research Council of Canada assumes
that the output resistances or voltage are linearly dependent on the three
applied loads, i.e., the normal load, shear load, and the moment due to
eccentricity of the normal load. This assumption gives a matrix of co
efficients or load cell constants as follows:
V n s e N
V~ = n~ s~ e~ S 4.6
V ns ss es N£ x
or V = AF
or F = A V
where V = output strain from + normal circuit
V = output strain from - normal circuit
V = output strain from the shear circuit
N = normal load
S = shear load

- 57 -
Ne = moment, normal load x eccentricity
A = matrix of load cell constants
In order to determine the load cell constants a series of
calibration tests were performed.
4.3.4.7.1 Calibration Tests
a) Fix S = 0, and e = 0, varying N from 0 to 400 pounds in 80 pound
increments and then from 400 pounds to 0, the results are plotted
on Figure 4-6, for load cell number 1.
b) Fix N = e = 0, and vary S from 0 to 400 lbs in 40 lb increments and
then return to zero. Plot the results as in Figure 4-7 for load
cell number 1.
c) Fix S = 0 and e = ±0.635 inches from the centre of the cell face
plate: vary N from 0 to 200 pounds in 40 pound increments, plotting
the results as shown in Figure 4-8 for cell number 1.
Hence from the relation 4-6 the following relationship can be obtained
for moments having opposite signs.
V+ = N(n+) + S(s+) + Ne(e+) 4.7
V*" = N(n+) + S(s+) - Ne(e+) 4.8
From the above two r e l a t i o n s the va lue of e can be ob ta ined
V+ - V* = P (e + ) + Ne(e")
or + = V - TT = 1 / V V \ 6 2N 2 4 L $ '
e e e
e is evaluated from the plot between V and N taking the moment N with
positive and negative eccentricities.

- 58 -
The calibration curves of load cells 2, 3, 4, 5 and 6 are shown
in Figures 4-10 to 4-31.
Load cell constants for each cell were determined as outlined
above, and are substituted into equation 4.6 as follows:
Cell No. 1
Cell No. 2
v+
v= =
V
-5 .396
= -5 .104
0 .11
5.25
- 4 . 3 3
15 .0
6.32
- 5 . 9 0
0 .21
N
S
Ne
Cel l No.
Cel l No.
3
4
V+
V~ =
V x
v+
v~ =
V X
-5.39
= -5.54
-0.08
-5.0
• -6.016
-0.11
4.92
-4.213
15.31
4.375
-4.375
15.78
6.15
-6.75
0.23
6.358
-6.93
-0.032
N
S
Ne
N
S
Ne
V+ -5.14 4.375 6.39 N
V" = -5.55 -4.61 -6.32 s
V -0.028 14.61 0.296 Ne x

- 59 -
Cell No. 5
Cell No. 6
V+
V~ =
V X
-5.56
> -5.78
0.145
4.76
-4.085
14.22
6.6
-6.6
0.3
N
S
Ne
V+ -5.625 5.0 6.79 N
V~ = -5.7 -4.53 -6.84 S
V 0.055 15.94 0.26 Ne x
4.4 Matrix Inversions
In section 4,3.4.7 the load cell constants were determined from
the basic relation which can be written in the form
V = AF 4.9
where V is the strain achieved from the bridge circuits
A is the matrix of load cell constants
F are the forces acting on the load cell
In order to determine these forces F, equation 4.9 can be
written in the form
F = A_1V
where A is the inverse of A
The inversions of the matrices of load cell constants deter
mined in section 4.3.4.7 are as follows:

Cel l No. 1
- 60 -
-919.80
- 5.66
802.075
-985.03
20.57
-862.712
28.99
674.61
-527.43
Cell No. 2
A"1 = ID"4
-959.85
- 17.11
798.5
-872.179
- 7.111
-770.09
68.45
660.63
-468.51
Cel l No. 3
A"1 = 1 0 - 4
-950.79
- 4.947
828.51
-872.41
- 7.464
-680.94
21.73
633.02
-418.50
Cell No. 4
A" 1- io-4
-969.61
- 18.56
829.89
•; -..
-940.77
+ 13.75
-766.16
- 18.47
694.36
-490.26
Cell No. 5
A"1-. io-4
-882.27
- 7.40
777.24
-880.35
25.00
-759.66
42.43
712.89
-478.40
Cell No. 6
A"1 = lO"4
-886.67
- 9.091
744.91
-879.11
15.09
-739.39
28.29
634.49
-443.79

- 61 -
The three load components can be calculated from the output
resistance from the following equation
N
S
Ne
- A " 1
V
V
V X
where N = normal load in pounds
S = shear load in pounds
Ne = normal load times the eccentricity of the normal load
V = sum of the strain given by gauges 1 and 2 or strain output of the '+' normal circuit
V = sum of the strain given by gauges 5 and 6 or strain output of the '-' normal circuit
V = strain given by the shear circuit
For example the strains measured by Cell No. 3 at a load of
160 lbs at an eccentricity of 0.625 inches, are V = -1438 micro inches/
inch, V = -268 micro inches/inch and V = -31 micro inches/inch. The
three loads can be determined from the strains as follows
F = VA -1
N
S = 10
Ne
-4
-950.79
- 4.947
828.51
-872.41
- 7.864
-680.94
21.73
633.02
-418.50
-1438
-268
-31
N = +136.7236 + 23.38059 - 0.06736 = 160 lbs
S = +0.711379 + 0.2000 - 1.96 = 1.05 lbs
Ne = -119.1397 + 18.249 + 1.29738 = 99.6 lbs or e = 0.6225 inch
These cells are assumed to give an error not more than 2 percent

- 62 -
4.5 Comparison of Dead Load Calibration with Water Calibration
To compare the water calibration and static load calibrations,
the results obtained in both cases were compared by plotting pressure
against strain in micro inches as illustrated in Figures 4.31 and 4.32.
Cells 2,3,4 and 5 show a difference of about 10 percent whereas Cell 1
showed a higher discrepancy; this could be due to changing of gauges in
different cells whenever they were damaged and partly due to the normal
forces acting eccentric to the face of the cell, when the form is filled
with water. The water calibration test was adopted as a standard for
measurements as the water test could be performed before performing
every test and after any gauge was repaired or replaced.
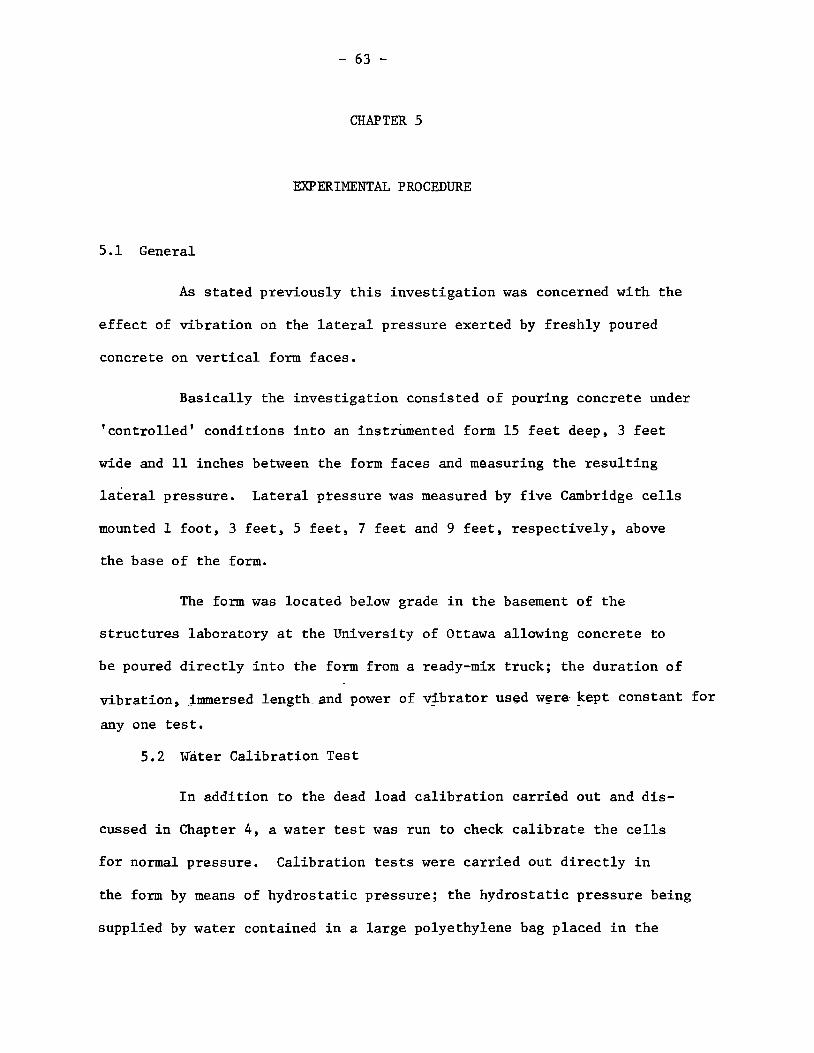
- 63 -
CHAPTER 5
EXPERIMENTAL PROCEDURE
5.1 General
As stated previously this investigation was concerned with the
effect of vibration on the lateral pressure exerted by freshly poured
concrete on vertical form faces.
Basically the investigation consisted of pouring concrete under
'controlled' conditions into an instrumented form 15 feet deep, 3 feet
wide and 11 inches between the form faces and measuring the resulting
lateral pressure. Lateral pressure was measured by five Cambridge cells
mounted 1 foot, 3 feet, 5 feet, 7 feet and 9 feet, respectively, above
the base of the form.
The form was located below grade in the basement of the
structures laboratory at the University of Ottawa allowing concrete to
be poured directly into the form from a ready-mix truck; the duration of
vibration, immersed length.and power of vibrator used were- kept constant for
any one test.
5.2 Water Calibration Test
In addition to the dead load calibration carried out and dis
cussed in Chapter 4, a water test was run to check calibrate the cells
for normal pressure. Calibration tests were carried out directly in
the form by means of hydrostatic pressure; the hydrostatic pressure being
supplied by water contained in a large polyethylene bag placed in the

- 64 -
form. The bag was gradually filled with water, strain gauge readings
being recorded at every 2 feet intervals of the water level in the form.
Thus the pressure/gauge reading relationship was obtained for the load
cells.
The results of the water calibration of the load cells, shown
in Figure 4-31, were used to obtain the lateral pressure through all the
experimental tests.
A number of water calibration tests were carried out success
fully to achieve the presented results. Many tests proved to be unsuccess
ful due to difficulties in preventing water leaking through the polyethylene
bag, and hence wetting the gauges.
The water calibration was performed regularly to check the
calibration and that the cells worked satisfactorily.
5.3 Description of Concrete
The concrete used for the experiments was type 1 normal weight
mix concrete 1:2.4:3.3, ordered from a local ready-mix company by specifying
the required 28 days compressive strength and the desired slump. The con
crete was specified to have a compressive strength of 4000 psi and 2-1/2"-
3" slump, with a maximum aggregate size of 3/4 inches, the grading curve
is shown in Figure 5.1.
Concrete was poured directly into the form at the required rate
as soon as the concrete truck arrived. Generally the pour was started
half an hour after the addition of water to concrete.
In order to measure the concrete strength, three cylinders
were moulded, and tested at 28 days after casting. Slump tests were
made after completion of the pour.

- 65 -
5.4 Experimental Programme
5.4.1 Parameters
This study was carried out under conditions such that some of
the parameters were varied, as required keeping the remainder normally
cons tant.
The concrete mix, strength, the rate of pour of the concrete
and the dimensions of the form were kept constant throughout the study-
The parameters varied were
a) Power of vibrator
b) Depth of vibrator immersed into concrete
c) Duration of vibration per unit volume of concrete placed
d) Concrete temperature and lab temperature.
5.4.2 Steel Reinforcement
To extract the hardened block of concrete from the form and to
enable the block to be handled with safety a cage of reinforcement was
cast in the concrete. The reinforcement consisted of four #6 longitudinal
bars tied into a box with #2 bars at two feet spacings on the sides of
the box and at the top and bottom of the front and back faces of the box.
There was no reinforcement towards the front and back faces of the form.
To minimize friction between the form and the concrete, to pre
vent the concrete from bonding to the form and to protect the load cells
from getting wet a polyethylene bag was used to line the inner surface
of the form.

- 66 -
5.4.3 Test Procedure
The general procedure consisted of zeroing the strain readings
of all the gauges of the five cells, and then fresh concrete was placed
from the truck into the form at a speed of 20 ft/hr. The formwork was
filled in eight stages, in 2 feet intervals for the first fourteen feet
and then the last one foot. The concrete was vibrated at every stage
using the required vibrator, for the specified duration and immersed to
a particular depth. The temperature in the laboratory and that of the
concrete mix was recorded; slump of concrete was measured at the commence
ment, middle and at the end of the pour. At every two feet intervals
after the concrete had been vibrated the gauge readings, for both shear
and normai"pressures, were recorded.
Twenty-two tests were carried out in total. In order to study
the behaviour of concrete under different parameters, while keeping the
temperature constant, the initial set of tests were performed in a
temperature range of 65° to 75°F. During the investigation the rate of
pour, was maintained constant at 20 ft/hr; vibrators of 1 HP and 2.5 HP
were used. The duration of vibration was varied at 0.5 minutes, 2.5
minutes, 3.5 minutes and 5 minutes. The vibrator head was immersed to a
depth of either 2 feet or 1 metre. The strain gauge readings were recorded
at each lift of concrete to measure the variation of lateral pressure and
shear force with concrete head.
Similar tests were repeated in the cooler temperatures of fall
and early winter to study the influence of temperature on the behaviour
of concrete.

- 67 -
The strain readings obtained from the normal gauges were
converted into normal pressures in pounds per square foot units and
plotted against the depth of concrete in the form, shown in Figures 6.1a,
6.2a to 6.17a.
To check the performance of each cell and study the pressures
exerted by the concrete at each level, the pressures given by each cell
under different heads of concrete were plotted against concrete head as
shown in Figures 6.1b, 6.2b to 6.17b. The concrete was expected to
exhibit the same pressure under the same head of concrete at all levels
of the form, but it was observed from the plots that the internal con
sistency of the results varied.
The lateral pressures obtained experimentally were compared with
the lateral pressures recommended by the ACI Committee 347 and CIRIA as
shown in Figures 6.1 to 6.17.
The strain gauge readings obtained from the shear gauges were
converted to pressures in pounds per square foot and plotted against head
of concrete. To project a better understanding of the relation between
lateral pressures and shear force acting parallel to the face of the form,
lateral pressures and shear pressures were plotted against the head of
concrete on the same graphs as illustrated in Figures 6.18 to 6.23.
5.5 Experimental Problems
During the experimental investigation a number of observations
and difficulties which were minor in nature but of significant importance
regarding the magnitude and accuracy of the results, were encountered.
These are stated below to be available for reference.

- 68 -
1. While carrying out the water calibration tests, polyethylene
sheating, supported around a wooden frame, was used as a water proofing
membrane. It was found to be a difficult task to provide a water tight
membrane.
2. The strain gauges used in the load cells were very sensitive to
moisture. The seepage of water past the face plate of the load cell
could not be prevented and though a water-proof coating had been applied
to the gauges, water affected the wire connections and seeped between
the webs and the strain gauges, damaging them.
During both the water calibration tests and the concrete tests
extreme care had to be taken to prevent the polyethylene membrane from
being damaged.
3. When installing the cells in the back face of the form it was
necessary to ensure that the face plate of the cell was flush with the
face of the form. If the cell was projecting out it would press against
the polyethylene membrane, and the effective area of the face plate of
the cell would be increased, giving an apparent higher lateral pressure.
Also the vertical impact of the falling concrete would give a higher
shear force.
4. During static calibration of the cells it was observed that with
a concentric load each of the four normal circuits, did not give the same
output strain. However, the sum of the four normal web strains always
remained the same under a specific load.
5. The gauges used in the Cambridge cells were very delicate and
the webs were too small to fix the gauges conveniently. Whenever any
gauge was damaged the particular cell was regauged and the recalibrated
to compare with the previous calibration.

- 69 -
6. Each cell consisted of 16 gauges, eight circuits, numerous
connections and eight wires leading to the balance unit. Thus a total
of 40 wires were run to the strain reading equipment on the ground floor.
Extreme caution had to be observed while moving the back face of the
form, tightening of the ties and bolts and working around the form to
avoid breaking the wires.
7. Due to the sensitivity and delicacy of the cells, there always
existed a possibility of damaging the cells while vibrating the concrete.
8. While pulling out the set concrete slab, force was exerted
against the cells, and on occasions damaged the cell webs.
9. To stop the leakage of water into the cells, plastic bags
were used to cover the cells.

- 70 -
CHAPTER 6
DISUCSSION OF EXPERIMENTAL RESULTS
6.1 General
The parameters varied during this investigation were the depth
of immersion of the vibrator, duration of vibration, power of the vibrator
and temperature of the concrete. The specifications of the various tests
are summarized in Table 6.1. All tests were carried out with a rate of
pour of 20 ft/hr with a specified slump of 2.5 inches and the concrete
poured in lifts of 2 feet.
6.2 Lateral Pressure Envelope
The lateral pressure envelopes, plotted against elevation of
the concrete in the form, shown in Figures 6.1a, 6.2a to 6.17a. The
same information is plotted against head of concrete in Figures 6.1b to
6.17b.
It can easily be observed_that the pressure envelope is initially
linear with increase in head deviating from the line of linearity after
the concrete has been poured to a certain depth in the form; the pressure
reaching a maximum and then declining. This phenomenum is typical and
has been reported by all investigators including Adam, Kinnear (CIRIA),
Ritchie and Rodin.
The concrete pressures plotted against the head of concrete
are shown in Figures 6.1b to 6.17b. It is readily apparent that although

TABLE 6.1 Details of Test Program
Test No
1 2 3 4 5
6 7 8 9 10
11 12 13 14 15
16 17 18
"Dafp •LfCLCC
26.08.77 28.07.77 31.08.77 04.08.77 19.08.77
09.08.77 02.09.77 12.08.77 06.07.77 28.10.77
13.10.77 20.10.77 22.12.77 25.11.77 07.12.77
14.12.77 22.03.78 21.07.77
Slump ins.
2.5 2.5 2.5 2.5 2.5
2.5 3 2.75 2.5 3
2.5 3 2.5 3 3
2.25 2.5 2.5
Rate of Pour ft/hr
20 20 20 20 20
20 20 20 20 20
20 20 20 20 20
20 20 20
Fig No
6.1 6.2 6.3 6.4 6.5
6.6 6.7 6.8 6.9 6.10
6.11 6.12 6.13 6.14 6.15
6.16 6.17 6.23
Concrete Temp °F
71 74 71 78 71
75 72 68 73 65
62 55 48 54 47
66 57 76
Power of H.P.
1 1 1 1 1
1 1 1
2.5 2.5
2.5 2.5 1
2.5 2.5
1 1 1
Duration of Vibration minutes
0.5 2.5 3.5 5.0 0.5
2.5 3.5 5.0 0.5 2.5
0.5 2.5 0.5 2.5 0.5
0.5 0.5 0.5
Depth of Vibrator Immersion ft
2 2 2 2
3.25
3.25 3.25 3.25
2 2
3.25 3.25 3.25
2 3.25
3.25 3.25 2
Max Pressure psf
740 800 990 725 940
950 960 975 1112 1300
1275 1715 1380 2050 1840
1000 944 615
i
~ j
i - 1
i

- 72 -
the pressure envelopes are similar, the internal consistency of any
single test is not as uniform as could be hoped.
All tests show a similar behaviour except tests 1, 2, 4, 6, 8
and 9 where the pressure on the lowest cell increases with head for the
last few feet of concrete pour.
To study the effect of friction between the concrete and the
surface of the formwork, and any effect due to vertical shrinkage of the
concrete, shear pressure and normal pressure in pounds per square foot
are plotted against the head of concrete in Figures 6.18 to 6.24 for
tests 1, 2, 5, 6 and 8. The shear forces recorded do not give conclusive
results but the plots to some extent illustrate the relation between normal
pressures and shear forces; Figures 6.19, 6.20, 6.22, 6.23 and 6.24 show
a significant relation between normal and shear forces. It is interesting
to note that the linear part of the lateral pressure envelope corresponds
to zero shear force, the rate of increase of lateral pressure decreasing
as shear friction develops, but the relation between lateral pressures
and shear friction can only be developed after detailed further investiga
tion. The anomalous shear force recorded by Cell 1 in Figures 6.18 and
6.21 could only be attributed to internal residual impact due to pouring
of concrete.
In the plots shown in Figures 6.4a, 6.6a, 6.7a, 6.8a and 6.10
it is observed that the pressures recorded at the 1 foot elevation of the
form, in contradiction to the generally expected distribution, exceed
those recorded at the 3 feet elevation, under large concrete heads. This
phenomenum was also observed in the tests performed by Ritchie (15) but
was not explained; the reason could be the accumulation of drained water

- 73 -
at the bottom of the form, thus exerting a pore water pressure in addition
to the concrete pressure. This hypothesis which was initially introduced
by Rodin (17) can be put forward only as a possible explanation with no
definite proof.
It is observed for tests 6, 7, 8, 9, 11, 13, 14, 16 and 17 that
under a concrete head varying between 7 feet and 11 feet the lateral
pressure dropped, followed by an increase in pressure; and then finally
showing a drop in pressure forming a general pattern for the lateral
pressure envelope, this is illustrated in Figures 6.6b, 6.7b, 6.8b, 6.9b,
6.11b, 6.13b, 6.14b, 6.16b and 6.17b. This phenomenum can be explained
as due to the ineffectiveness of the vibration at depths remote from the
vibrator and the developed shear strength of the concrete. Thus at a
certain instant the vertical concrete load is supported by the shear
strength of the concrete, however any further increase in superimposed
load would increase the vertical forces and this pressure would still be
transmitted through the pore fluid of the concrete mix in a lateral
direction, thus showing an increase in a lateral pressure. The drop in
pressure at large concrete heads can be attributed to friction between
the form and the concrete, shrinkage of the concrete and perhaps partially
to the deflection of the form under lateral pressure.
6.3 The Effect of Internal Vibration on the Lateral Pressure of Concrete
on Formwork
As shown in Table 6.1 tests were carried out to study the
effects of various parameters of vibration on the lateral pressure of
concrete. This effect was commented upon by both the ACI and CIRIA as

- 74 -
significant. The importance of this effect can also be understood from
the experimental data reviewed by Rodin and initially conducted by the
Bureau of Public Roads, according to which if concrete is externally
vibrated throughout the depth of the form, the concrete would retain its
fluidity even with a slump as low as 1-1/2 inches exhibiting hydrostatic
pressure.
To analyse the effect of internal vibration with the effective
parameters taken into consideration being power of the vibrator, con
tinuity of vibration and the depth of immersion of the vibrator head, the
pressure values achieved by the cells installed at 1 foot and 3 feet above
the bottom of the formwork are plotted against the head of concrete in
Figures 6.25 and 6.26, respectively. The maximum design pressures measured
under the various conditions of vibration under 14 feet head of concrete
are illustrated as bi-linear curves, with an initial line tangent to the
measured pressure envelope at the origin and tangent to the maximum
pressure, in Figures 6.27 and summarized in Table 6.2. All the initial
tangents in the bi-linear curves shown in Figure 6.27 tend to the line of
hydrostatic pressure. In discussion of the results concrete pressure is
expressed in terms of head of hydrostatic concrete with a unit weight of
150 lbs/ft3.
From these results it is evident that generally the cumulative
effect of the three parameters of vibration taken into consideration in
crease the lateral pressure exerted by the concrete. The concrete pressure
is observed to have increased from a maximum value of 740 psf achieved by
a vibrator of 1 H.P., duration of vibration 30 seconds and vibrator head
immersed to a depth of 2 feet at a concrete temperature of 71°F to a

- 75 -
maximum value of 1715 psf with a vibrator of 2.5 H.P., duration of
vibration 2.5 minutes and vibrator head immersed 1 metre at a concrete
temperature of 54°F, which is an increase equivalent to 6.37 ft head of
concrete, it must be pointed out that in this increase of pressure the
drop in temperature from 71°F to 54°F would also be a participant.
In order to analyse the effects of the different parameters of
vibration more closely it is convenient to examine them separately.
a) The Effect of Power of Vibrator
During this investigation 1 H.P. and 2.5 H.P. vibrators were
utilized. The effect of the power of the vibrator can be visualized from
the plots shown in Figures 6.25, 6.26, 6.27 and 6.28 which include the bi
linear curves giving maximum concrete pressures; the maximum pressure values
and the equivalent hydrostatic depths of concrete achieved are given in
Table 6.2.
During test No. 1 conducted with the vibrator of 1 H.P., 30
seconds duration of vibration per 2' lift of concrete, vibrator head
immersed 2 feet into the concrete and a concrete mix temperature of 71°F
the maximum pressure measured was 740 psf or 4.85 feet of fluidized depth
of concrete from the surface behaving hydrostatically. Test No. 9 carried
out with the vibrator power increased to 2.5 H.P. and keeping the other
parameters constant, shows the maximum pressure as 1112 psf or a fluidized
depth of concrete of 7.26 feet. These tests indicate an increase in
pressure equivalent to 2.43 feet of concrete head.
Test No. 2 and Test No. 10 were carried out with 1 H.P- and 2.5
H.P- vibrators, respectively, the concrete vibrated 2.5 minutes for every

TABLE 6.2 Analysis of Experimental Results
Test No
Ambient Temp Date
1 2 3 4 5
6 7 8 9
10
11 12 13 14 15
16 17 18
71 71 71 74 71
73 71 67 73 61
61 59 58 54 40
37 46 75
Cone Temp °F
Power Duration " Depth of of of Vibrator • Vibration Vibrator H.P. min feet
26.08.77 28.07.77 31.08.77 04.08.77 19.08.77
09.08.77 02.09.77 12.08.77 06.07.77 28.10.77
13.10.77 20.10.77 22.12.77 25.11.77 07.12.77
14.12.77 22.03.78 21.07.77
71 74 71 78 71
75 72 68 73 65
62 54 48 54 47
66 54 76
1 1 1 1 1
1 1 1 2.5 2.5
2.5 2.5 1 2.5 2.5
1 1 1
0.5 2.5 3.5 5.0 0.5
2.5 3.5 5.0 0.5 2.5
0.5 2.5 0.5 2.5 0.5
0.5 0.5 0.5
2 2 2 2 3.25
3.25 3.25 3.25 2.0 2.0
3.25 3.25 3.25 2 3.25
3.25 3.25 2
Max Pressure (Pm) psf
740 800 990 725 940
950 960
1000 1112 1300
1275 1715 1380 2050 1840
1000 944 615
Design Hydrostatic Concrete Depth ft*
4.93 5.3 6.6 4.8 6.30
6.27 6.30 6.7 7.41 8.7
8.5 11.41 9.20 13.67 12.30
6.70 6.3 4.1
Percent Increase of Test No. 1
0 8.1 33.8 -2.0 27.0
28.4 29.7 35 50 75.8
72.3 13.2 86.5 177 149
35.1 27.6 -16.9
•vl
*TT J .. *.• J ..t. max. pressure ,_... Hydrostatic depth = y^r (ft)

- 77 -
2 feet increase in concrete depth, the vibrator head immersed 2 feet
into concrete and the temperature of the concrete mixes recorded at 74°F
and 61°F, respectively. The maximum pressures recorded were 800 psf in
Test No. 1 and 1300 psf in Test No. 10 and the hydrostatic depths of con
crete 5.33 feet and 8.67 feet, respectively, from the surface. This
shows an increase of 500 psf in pressure which is equivalent to a concrete
head of 3.33 feet. It is important to note that in Test No. 10 the tempera
ture could not be maintained at 74°F and the increase in pressure, al
though mainly attributed to parameters of vibration, was partially due
to the influence of temperature changes.
In Table 6.2 and Figure 6.28b, Test Nos. 5 and 11 are shown to
exhibit pressures of 940 psf and 1275 psf, respectively, all variables
kept constant except the vibrator power increased from 1 H.P- to 2.5 H.P-
The increase in pressure was observed to be 335 psf, equivalent to 2.19 ft
of concrete head and the fluidized depth of concrete, exhibiting linear
pressure was increased by 2.15 ft from the surface.
A similar comparison can be made between Test Nos. 6 and 12
shown in Figure 6.29b which shows an increase of pressure from 950 psf to
1715 psf which is equivalent to 5.1 ft head of concrete and the fluidized
depth of concrete increased by 4.95 ft. The increase in pressure by an
equivalent concrete head of 5.1 ft can be explained as a contribution of
both an increase in the power of the vibrator and the drop in temperature
of the concrete mix.
Many previous investigators including Rodin, Kinnear (CIRIA)
and Teller have stressed the importance of vibration in the development

- 78 -
of concrete pressure, but there does not exist any published data avail
able which specifically comments upon the effect of the power of the
vibrator. From the above discussion it is obvious that an increase in
the power of the vibrator, used for compaction of the concrete, increases
the depth of hydrostatic pressure and the maximum pressure significantly.
Figure 6.34 illustrates the relation between the power of vibrator and
the percent of hydrostatic pressure.
b) The Effect of Duration of Vibration
Experimental tests were conducted to determine the variation of
lateral pressure of concrete on the form with varying durations of vibra
tion and the results measured are given in Table 6.2. A comparison of the
effect of the different levels of vibration duration on the concrete
pressure envelopes is illustrated in Figures 6.25, 6.26, 6.27 and 6.29.
In Figures 6.25 and 6.26 the pressures Measured 1 ft and 3 ft
above the bottom of the formwork, under varying concrete heads and vibra
tion parameters, are compared.
Figures 6.27 and 6.29 illustrate the comparison between the bi
linear pressure curves obtained under varying durations of vibration. It
is observed that the lowest duration of vibration exhibits the lowest
pressure and the increase in vibration time tends to increase the concrete
pressure.
Comparing Test Nos. 1, 2, 3 and 4 in Table 6.2 graphically
illustrated in Figures 6.1, 6.2, 6.3, 6.4 and the results compared in
Figures 6.27 and 6.29. It is obvious that with a 1 H.P- vibrator and the

- 79 -
head of the Vibrator immersed 2 ft into the concrete, varying the duration
of vibration from 0.5 minutes, 2.5 minutes, 3.5 and 5 minutes per 2' lift
of concrete under a temperature range of 71°F to 78°F, shows a general trend
of an increase in concrete pressure up to an optimum limit of 3.5 minutes
vibration, thereafter a drop in pressure is observed. The increase in
pressure was recorded from 740 psf with 0.5 minutes of vibration to 990 psf
with 3.5 minutes of vibration, which is equivalent to 1.63 ft of concrete
head, and the drop in pressure equivalent to 1.73 ft of concrete head was
observed by increasing the vibration period from 3.5 minutes to 5 minutes.
This significantly shows that up to a certain limit the duration of vibra
tion is effective in destroying the shearing strength of the concrete.
It is of interest to note that the effect of the duration of
vibration on pressure in the case of a 1 H.P. vibrator immersed 1 metre
into the concrete is insignificant. The results of these Test Nos. 5, 6,
7 and 8 are illustrated in Figures 6.5, 6.6, 6.7, 6.8 and the results
compared in Figures 6.25, 6.26, 6.27 and 6.29. In Table 6.2 the results
of these tests are summarized.
Similar tests were conducted with the 2.5 H.P- vibrator and the
results are summarized in Table 6.2 as Test Nos. 9, 10, 11 and 12. These
tests are graphically represented in Figures 6.9, 6.10, 6.11 and 6.12 and
the results compared in Figures 6.25, 6.26, 6.27 and 6.29. It is observed
that with the 2.5 H.P. vibrator and the vibrator head immersed 2 ft the
pressure increases by an equivalent concrete head of 1.2 ft by increasing
the duration of vibration from 0.5 minutes to 2.5 minutes under a tempera
ture range of 65°F and 73°F.

- 80 -
A pressure increase equivalent to 2.9 ft head of concrete is
observed in Test Nos. 11 and 12 conducted with a vibrator of 2.5 H.P.,
and the vibrator head immersed to 1 metre into the concrete, when the
duration of vibration is varied from 0.5 minutes to 2.5 minutes.
It must be pointed out that with an increase in the duration of
vibration the depth of initial linearity of the lateral pressure envelope
of the concrete is also increased, this is illustrated in Figures 6.25,
6.26, 6.27 and 6.29.
It can be summarized that the pressure increased up to an
optimum level of duration of vibration and there is either a drop in
pressure or no further increase in pressure with increase in vibration
time. This phenomenum was also observed by Ritchie (15). Ritchie carried
out tests on cement mortars and concrete, varying the continuity of vibra
tion, and concluded that the maximum concrete pressure occurred at 25 per
cent continuity of vibration; an increase in the continuity of vibration
beyond this limit resulted into reduced pressure.
c) The Effect of Depth of Immersion of Vibrator
The effect of the depth of immersion of the vibrator head into
the concrete, on the concrete pressure is obvious from the results of
Test Nos. 1 to 12 summarized in Table 6.2 and graphically represented in
Figures 6.1 to 6.12. These results are compared in Figures 6.25, 6.26, 6.27
and 6.31. From Figures 6.31a and 6.31b it can be concluded that by in
creasing the depth of the vibrator head immersion there is a general trend
of increase in concrete pressure, and depth of linearity of the pressure

- 81 -
envelope. It is observed, by comparing Test Nos. 1 and 5 that with a
vibrator of 1 H.P. keeping the duration of Vibration constant at 0.5
minutes for every 2 ft increase in head of concrete and varying the
vibrator head immersion from 2 ft to 1 metre, the maximum concrete pressure
increases from 740 psf to 940 psf, which is an increase equivalent to 1.31
ft of concrete head and the depth of linearity of the pressure envelope is
increased by 1.4 ft.
Comparison of Test Nos. 2 and 6, performed with a 1 H.P. vibrator
duration of vibration 2.5 minutes, temperature 74 to 75°F and the vibrator
head immersion increased from 2 ft to 1 metre (3.25 ft) show an increase
of concrete pressure equivalent to 0.98 ft of concrete head.and the depth
of linearity of the pressure envelope increased by 0.9 ft. This is
illustrated in Figure 6.31.
By comparing Test Nos. 3 and 7, performed with a 1 H.P- vibrator,
the duration of vibration maintained at 3.5 minutes, temperature of the
concrete mix kept between 71°-72°F., and the depth of the vibrator head
varied as in the previous tests, it is observed that there was no major
difference in pressure.
Comparison of Test Nos. 4 and 8 show that with a vibrator of 1
H.P., temperature of mix at 78°F and 68°F, respectively, vibration dura
tion 5 minutes and depth of vibrator head immersion increased from 2 ft
to 1 metre shows a difference in pressure equivalent to 1.8 ft of concrete
head. The unexpectedly high difference in pressure observed between Test
Nos. 4 and 8 can be explained as due to the development of shear strength
in Test No. 4 due to the high temperature of the concrete mix.

- 82 -
Similar tests carried out with the 2.5 H.P. vibrator, sum
marized in Table 6.2 and illustrated in Figure 6.31 show a definite
increase in pressure by changing the depth of vibrator immersion from
2 ft to 1 metre. Comparing Test Nos. 9 and 11 shows a pressure increase
equivalent to 1.1 ft of concrete head. When comparing Test Nos. 10 and
12 an increase in pressure equivalent to 2.7 ft of concrete head is
observed. It must be noted that in this case part of the increase in
pressure must be attributed to the 11°F drop in temperature of the concrete
mixes, which could not be controlled due to severe weather conditions.
The above discussion evidently indicates that increase in the
immersed depth of the vibrator head increases the influence of vibration
and this effect is true for both 1 H.P. and 2.5 H.P. vibrators and is
significant up to 2.5 minutes duration of vibration. Figure 6.35
illustrates the relation between depth of vibrator immersion and the
pressure expressed in terms of percent of hydrostatic pressure.
6.4 Temperature Effects on the Lateral Pressure of Concrete on Formwork
ii order to investigate the effect of temperature on the lateral
pressure of concrete seven tests were performed in moderately cold and
extremely cold weather; three of these tests were rejected. The
pressures recorded are plotted against the elevation of the formwork in
Figures 6.13a to 6.17a and the same information is plotted against the
head of concrete in Figures 6.13b to 6.17b. The maximum pressures are
summarized in Table 6.2.
Figures 6.25 to 6.27 illustrate comparison between the pressure
envelopes achieved from different tests. In Figure 6.32 the maximum

- 83 -
pressures achieved from Test Nos. 5, 10, 11, 13, 14, 15, 16 and 17 are
compared. Test Nos. 5 and 13 were performed with the 1 H.P. vibrator,
0.5 minutes duration of vibration, and vibrator head immersed 1 metre
into the concrete during the process of internal vibration; the tempera
ture of the concrete mix was recorded during the tests. It is observed
in Figures 6.5, 6.13 and 6.32 that the maximum pressures achieved during
these tests at concrete temperatures of 71°F and 48°F are 940 psf and
1380 psf, respectively, which is an increase of pressure equivalent to
2.9 ft of head of concrete.
Comparison of Test Nos. 10 and 14 illustrates an increase of
pressure equivalent to 4.9 ft head of concrete by reducing the temperature
from 65°F to 54°F, with a vibrator of 2.5 H.P., duration of vibration 2.5
minutes and the vibrator head immersed 2 ft into the concrete. These
tests are illustrated in Figures 6.10, 6.14 and 6.32. Observing Figure
6.14b it is evident that the pressure recorded by Cell A, located 1 ft
above the bottom of the formwork, between 11 ft and 15 ft head of concrete
shows a deviation from the generally expected pattern of the pressure.
This could be attributed to outward deflection of the rigid form at the
top, resulting in an inward movement of the form at the base, thus sub
jecting the bottom cell to passive pressure.
Comparison of Test Nos. 11 and 15 show an increase in pressure
equivalent to 3.7 ft of concrete head, by a reduction of the temperature
of the concrete mix from 62°F to 47°F., with a 2.5 H.P. vibrator, immersed
1 metre into concrete and the concrete vibrated for 0.5 minutes.
To confirm this effect of temperature of the concrete mix on
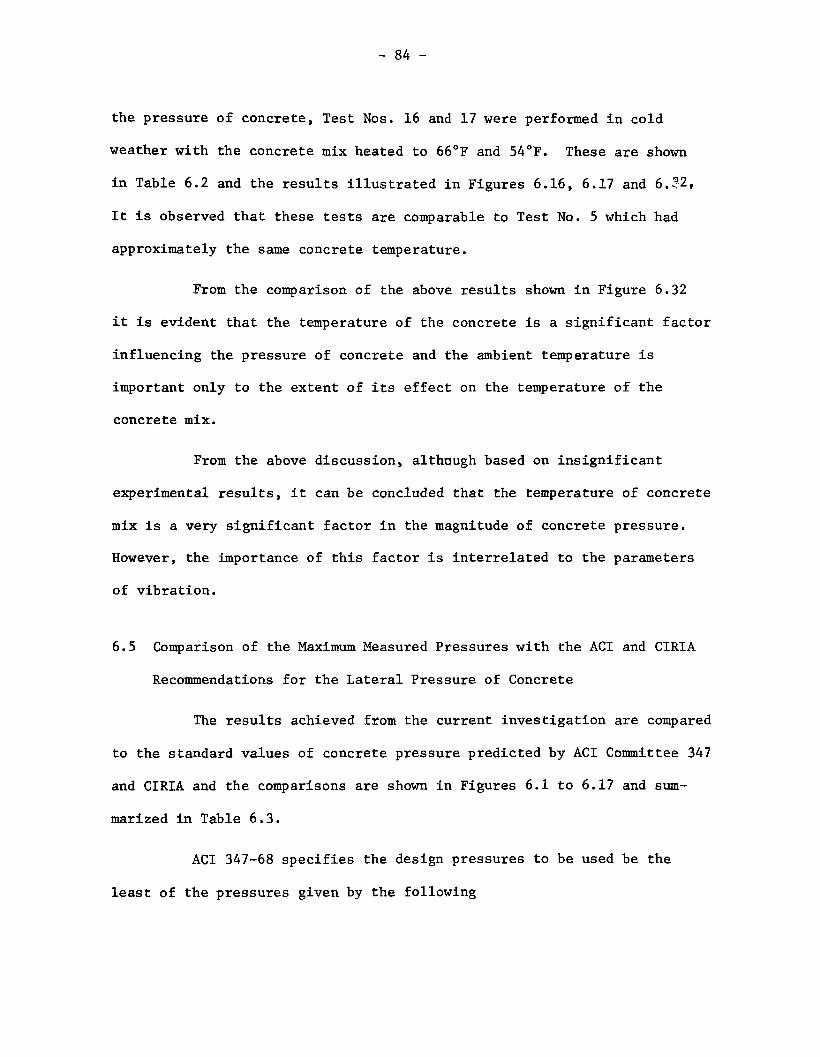
- 84 -
the pressure of concrete, Test Nos. 16 and 17 were performed in cold
weather with the concrete mix heated to 66°F and 54°F. These are shown
in Table 6.2 and the results illustrated in Figures 6.16, 6.17 and 6.32,
It is observed that these tests are comparable to Test No. 5 which had
approximately the same concrete temperature.
From the comparison of the above results shown in Figure 6.32
it is evident that the temperature of the concrete is a significant factor
influencing the pressure of concrete and the ambient temperature is
important only to the extent of its effect on the temperature of the
concrete mix.
From the above discussion, although based on insignificant
experimental results, it can be concluded that the temperature of concrete
mix is a very significant factor in the magnitude of concrete pressure.
However, the importance of this factor is interrelated to the parameters
of vibration.
6.5 Comparison of the Maximum Measured Pressures with the ACI and CIRIA
Recommendations for the Lateral Pressure of Concrete
The results achieved from the current investigation are compared
to the standard values of concrete pressure predicted by ACI Committee 347
and CIRIA and the comparisons are shown in Figures 6.1 to 6.17 and sum
marized in Table 6.3.
ACI 347-68 specifies the design pressures to be used be the
least of the pressures given by the following

TABLE 6.3 Comparison of Concrete Pressures Recommended by CIRIA and ACI with Experimentally Achieved Pressures
Test No
1 2 3 4 5
6 7 8 9 10
11 12 13 14 15
16 17
Continuity of
Vibration %
8,3 42 58 83 8.3
42 58 . 83 .
8.3 42.
8.3 42 8.3 42 8.3
83 8.3
Rate of
Pour ft/hr
20 20 20 20 20
20 20 20 20 20
20 20 20 20 20
20 20
Temp of
Mix (°F)
71 74 71 78 71
75 72 68 73 65
62 55 48 54 47
66 57
150 h
2100 2100 2100 2100 2100
2100 2100 2100 2100 2100
2100 2100 2100 2100 2100
2100 2100
ACI
2685 2582 2685 2458 2685
2550 2650 2797 2616 2919
3053 2423 3900 3483 3980
2877 3308
Concrete Pressures (psf)
CIRIA Arching Criteria
1250 1250 1250 1250 1250
1250 1250 1250 1250 1250
1250 1250 1250 1250 1250
1250 1250
CIRIA Stiffening Criteria
1975 1937 2033 1939 2288
2012 2287 2083 1936 2077
2090 2135 2141 2135 2141
2051 2117
Experimental Results
740 800 990 725 940
950 960 975
1112 1300
1275 1715 1380 2050 1840
1000 944
| m
1

- 86 -
P = 150 + 9000 ^ m T
Pm = 150 h (6.1)
P = 3000 psf m r
where P is the maximum design pressure (psf) m
R is the rate of pour in ft/hr
T is the temperature of the mix in <1F
h is the head of concrete in feet.
If concrete behaved hydrostatically, the maximum pressure pre
dicted by ACI under 14 ft head of concrete would be 2100 psf.
The pressure values predicted by the ACI, for concrete poured
at 20 ft/hr and temperatures ranging between 70°F and 80°F, when compared
to the results of Test Nos. 1 to 7 in Table 6.3 conducted with a 1 H.P.
vibrator, show that the measured maximum pressures fall far below those
given by ACI 347-68; the pressure differences are noted to vary from 127
to 210 percent of the pressure measured experimentally.
Comparing Test No. 9, conducted with the 2.5 H.P. vibrator at
73°F, to ACI 347-68 it is observed to provide a 1112 psf pressure against
the predicted pressure of 2100 psf.
Test No. 8, conducted at 68°F with a 1 H.P- vibrator, gave a
pressure of 1000 psf against the predicted value of 2100 psf.
Comparison of Test Nos. 8, 10, 11 and 16 conducted under different
parameters of vibration and the concrete mix temperature ranging between
60 and 70°F, it is observed that the maximum pressure achieved is 1300 psf
with a vibrator of 2.5 H.P., duration of vibration 2.5 minutes and immersed

- 87 -
to a depth of 1 metre into the concrete, against a predicted pressure
of 2100 psf.
Test Nos. 12, 13, 14, 15 and 17 conducted at low temperature
ranging between 47°F and 54°F show a maximum pressure ranging between
944 psf and 2050 psf. From these tests it is obvious that the maximum
pressures obtained show a tendency towards the hydrostatic pressure of
concrete, and it is reasonable to assume hydrostatic design pressures
under severe test conditions, taking into account both low concrete
temperature and the most severe parameters of vibration.
The above discussion indicates that the pressures calculated
using the hydrostatic pressure of concrete agrees well with those measured
for temperatures below 60°F. However, the pressures calculated using
Equation 6.1 are conservative, sometimes excessively so, in all cases.
The pressure values given by the pressure formula
P = 150 + 9000 | (6.1) m T
are highly influenced by the rate of pour of concrete and are unreasonably
high for higher rates of pour.
CIRIA identifies two limiting criteria for the calculation of
the pressure of fresh concrete against formwork; the criteria giving the
lower pressure to be used. As a design aid CIRIA produced the chart
shown in Figure 2.18 which plots both criterias on one set of coordinates.
Stiffening Criteria
P 150_JR__t + 12(8_R) ( 6 2 )
1 + C(t/t ) 4
max

- 88 -
Arching Criteria
P = 300 + 50 d + 20 R (6.3)
where P is the pressure in pounds per square foot
d is the minimum sectional dimension of the form
R is the rate of pour in ft/hr
3 A is the density of concrete (lb/ft )
t is the time from the commencement of placing (hours)
t is the stiffening time of the concrete (hours) max 6
C is the factor depending on the workability of the concrete and the continuity of vibration.
CIRIA recommends use of the minimum pressure calculated from
the Stiffening and Arching Criterias stated in Equations 6.2 and 6.3
respectively with an additional 200 psf surcharge to allow for impact
for all structures. The calculations in Table 6.3 do not include the
surcharge.
In the Stiffening Criteria the factors considered important
by CIRIA are the temperature of the concrete mix, rate of pour, slump
and continuity of vibration but factors not taken into account are the
power of the vibrator and the depth of immersion of the vibrator head.
The maximum concrete pressures achieved experimentally are
compared to the pressures predicted by the Stiffening Criteria in
Table 6.3. For times less than t Equation 6.2 degrades to the hydro
static condition which gives good agreement for concretes poured at low
temperatures in Test Nos. 12, 14 and 15. In general, the Stiffening
Criteria provides higher pressures which are in no way comparable to the
experimentally achieved pressures.
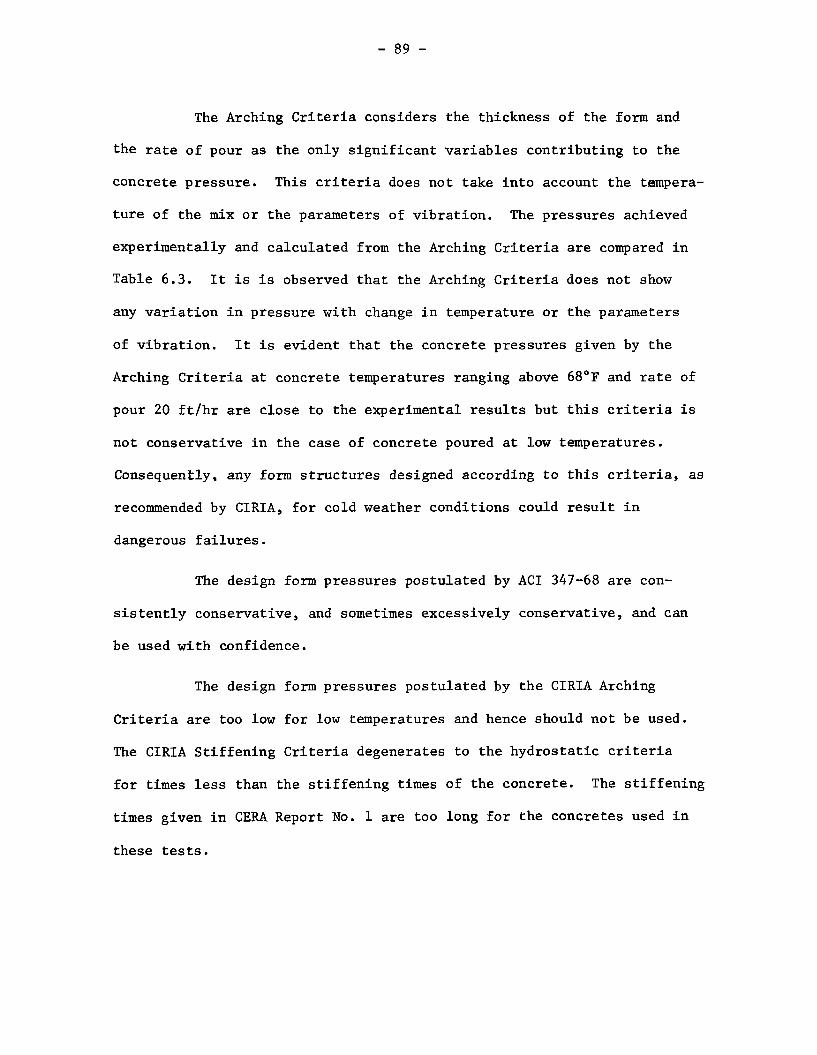
- 89 -
The Arching Criteria considers the thickness of the form and
the rate of pour as the only significant variables contributing to the
concrete pressure. This criteria does not take into account the tempera
ture of the mix or the parameters of vibration. The pressures achieved
experimentally and calculated from the Arching Criteria are compared in
Table 6.3. It is is observed that the Arching Criteria does not show
any variation in pressure with change in temperature or the parameters
of vibration. It is evident that the concrete pressures given by the
Arching Criteria at concrete temperatures ranging above 68°F and rate of
pour 20 ft/hr are close to the experimental results but this criteria is
not conservative in the case of concrete poured at low temperatures.
Consequently, any form structures designed according to this criteria, as
recommended by CIRIA, for cold weather conditions could result in
dangerous failures.
The design form pressures postulated by ACI 347-68 are con
sistently conservative, and sometimes excessively conservative, and can
be used with confidence.
The design form pressures postulated by the CIRIA Arching
Criteria are too low for low temperatures and hence should not be used.
The CIRIA Stiffening Criteria degenerates to the hydrostatic criteria
for times less than the stiffening times of the concrete. The stiffening
times given in CERA Report No. 1 are too long for the concretes used in
these tests.
- 90 -
CHAPTER 7
CONCLUSIONS AND RECOMMENDATIONS
In view of the results achieved by previous investigators and
the detailed discussion made in Chapter 6, the following conclusions
can be drawn:
1. For design purposes the lateral pressure distributions of
freshly poured vibrated concrete can be represented by a bi-linear curve,
i.e., the lateral pressure is equal to the hydrostatic pressure of con
crete up to a maximum value and thereafter may be considered constant at
this maximum value.
The actual pressure envelope is characterised by a linear
relationship of pressure with depth tending to hydrostatic.up to a certain
maximum value and then followed by a parabolic curve. The deviation of
pressure from the linear pressure line can be attributed to a number of
causes which include stiffening and arching effects, friction between the
form surface and concrete, settlement of the concrete, bleeding and water
absorption by aggregates.
3. The vertical force acting parallel to the height of the form-
work, which is comparable to the shear force, is inversely related to the
normal force acting on the face of the form. This shear force can be
attributed to the settlement or shrinkage of the concrete and friction be
tween the concrete and the face of the formwork.
4. Vibration and its parameters have a very significant effect on

- 91 -
the lateral pressure of concrete and its magnitude is governed
by this factor.
4.1 The power of the vibrator contributes significantly to
the lateral pressure of concrete and pressure increase in different tests,
equivalent from 2 ft to 5 ft of concrete head has been recorded by an in
crease in the power of vibration from 1 H.P. to 2.5 H.P. Although some of
this Increase in pressure can be attributed to the drop in temperature of
the mix, however the major increase, undoubtedly, has been due to the
variation in the power of the vibrator.
4.2 The duration of vibration, which has also been termed as "time
of application of effort per unit volume placed" has been observed to be
a significant factor influencing the lateral pressure of concrete. An
increase in the duration of vibration increases the lateral pressure of
concrete but this factor is effective only up to a certain limit after
which any further increase in the duration of vibration results into
either a constant value of maximum pressure or a drop in pressure. This
optimum value of the duration of vibration exists between 3.5 minutes (58
percent) and 5 minutes (83 percent) per 2 ft lift of concrete level.
From this investigation it is concluded that the increase in
the duration of vibration can increase the concrete pressure of the order
equivalent to a concrete head of 3 ft.
4.3 An increase in the depth of immersion of the vibrator head will
increase the lateral pressure of concrete, this increase in pressure was
determined to vary between 9 to 14 percent of hydrostatic pressure or 1ft
to 2.7 ft of equivalent concrete head, by an increase in the depth of
- 92 -
vibrator head immersion from 2 ft to 1 metre. This is illustrated
in Figure 6.35. [It can also be concluded that a maximum of 11% increase
in pressure can be obtained by increasing the depth of immersion of the
vibrator by 1 ft.]
5. The temperature of the concrete has a significant effect on the
lateral pressure of concrete. A major fall in temperature gives rise to
a significant increase in lateral pressure exerted by the concrete.
Extremely cold temperatures distinctly contribute to the development of
hydrostatic pressure throughout the mass of concrete depending on the
height of the formwork. An increase of pressure equivalent to 20-40 per
cent of the hydrostatic pressure can be expected by dropping the concrete
temperature from warm circa (70°F) to very cold circa (45°F).
6. The pressure formulae recommended by the American Concrete
Institute in the ACI 347-68, are over conservative in respect of high
rates of pour.
For the head of concrete available in these tests the maximum
pressures under low temperatures are comparable to the hydrostatic case
recommended by ACI 347-68. However, the maximum pressures given by the
limiting condition of ACI 347-68 are extremely conservative. A major
problem in the ACI limiting criteria is that it is too sensitive to the
rate of pour.
7. The recommendations to determine the lateral pressure of con
crete provided by CIRIA are influenced predominantly by the arching limit
- 93 -
criteria and the recommended design pressures provided could be useful
at moderate concrete temperature conditions but cannot be applied for
concrete at low temperatures.
CIRIA1s Stiffening Criteria is conservative and provides
pressures which are significantly high for higher rates of pour. The
stiffening time factor assumed by this criteria does not provide
realistic values and the following expression, for t = t ,
150 x R x t
* - f^T£ + 12(8-R)
gives excessively lare pressures when compared to those obtained from
expression 2.24.
The CIRIA Stiffening Criteria is directly related to rate
of pour which is not justified when compared to the data of Rodin and
Adam.

- 94 -
REFERENCES
Adam, M. "Poussee beton frais sur les coffrages", Annales de 1'Institute
Technique du Batiment et des Travaux Publics, Mars-Avril 1965.
Arthur, J.R.F. and Roscoe, K.H. "An Earth Pressure Cell for the
Measurement of Normal and Shear Stresses", Civil Engineering and
Public Works Review, Vol. 56, No. 659, pp.765-770, 1961.
Davis, E.R., Jansen, C.E. and Neelands, T.W. "Restoration of Barker
Dam". J. American Concrete Inst., Vol. 19, pp.633, April 1948, Proc.
Vol. 44.
Doohan, J.P- "Earth Pressure Cells to Measure the Distribution of
Shear and Normal Forces on a Footing", M.A.Sc. Thesis, University
of Ottawa, 1975.
Elsberg, H. "Pressures on Formwork". Journal of the American Concrete
Institute, V.30, No. 2, August 1958, Proceeding V.55.
Ho, P.T.J. "A Study of the Lateral Pressure of Fresh Concrete on
Formwork", M.Eng. Thesis, University of Ottawa.
Hanna, T.H. "Foundation Instrumentation", Trans Tech Publication, 1973.
Hurd, M.K. "Formwork on Concrete", Special Publication No. 4, American
Concrete Institute, Detroit, pp.73-82, Trans Tech Publication, 1973.
Kinnear, Sadgrove, Acharya, George, Turner and Sheperd, "Lateral
Pressure of Concrete on Formwork", CERA Research Report 1 (RR 1)
Published 1965.
Leung, M.C. "Lateral Pressure of Fresh Concrete on Formwork", M.Eng.
Thesis, University of Ottawa.
Levitsky, M. "Form Pressure and Relaxation in Formwork", Journal of
Eng. Mech. Division, ASCE, June 1975.
- 95 -
McDaniel, A.B. and Carver, N.B. "Pressure of Concrete on the Sides
of Column Forms", Eng. News, Vol. 75, p.933, May 18 1916.
Macklin, C.A. "Pressure on Formwork", Discussion on a Report by ACI Com
mittee 622. DISC 55-10, Published in ACI Journal, V.30, No. 2. Aug. 1958.
Olsen, R.H. "Lateral Pressure of Concrete on Formwork", Ph.D. Thesis,
Oklahoma State University, Okla., U.S.A., 1968.
Roby, H.G. "Pressure of Concrete on Forms", C W Engineering, Vol. 5,
p.162, March 1935.
Ritchie,A,G„B "Effects of Early Stiffening of Concrete on Formwork
Pressure", Report by Construction Industry Research and Information
Association.
Ritchie, A.G.B. "The Pressures Developed by Concrete on Formwork",
Civil Engineering and Public Works Review, Part I, Vol. 57, No. 672,
July 1966, pp.885-888; Part II, Vol. 57, No. 673, August 1962,
pp.1027-1030.
Rodin, S. "Pressure of Concrete on Formwork", Proc. Inst, of Civil
Engineering (London), Vol. 1, No. 6, Paper No. 5863, Nov. 1952, pp.709-746.
Schjodt, R. "Calculation of Pressure of Concrete on Forms", American
Society of Civil Engineers, Vol. 81, May 1955, pp.680-1 - 680-16.
Shunk, F.R. "Pressure of Concrete on Forms", Engineering News,
Vol. 62, pp.288, September 1909.
Wynn, A.E. and Manning, G.P. "Design and Construction of Formwork
for Concrete Structures", Published by The Cement and Concrete
Association, London, England.

ILLUSTRATIONS
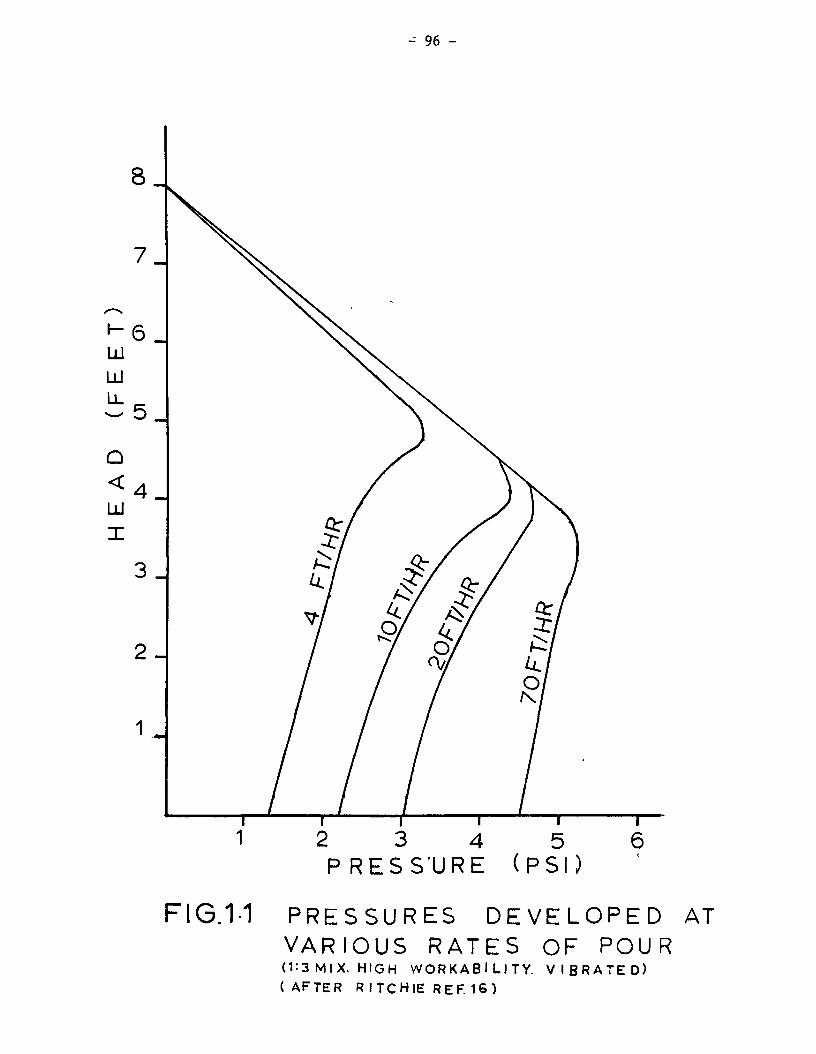
- 96 -
8_
7_
• - 6 _ LU LU LL _ ~ 5_
Q
«4_ LU I
3_
2 _ £•_ ^
1 _
37
V
I ' I '
/ 0/ / 7
• / 1
x / ^7
' 1 1 2 3 4 5 P R E S S U R E ( P S I )
FIG.1-1 PRESSURES D E V E L O P E D AT VARIOUS RATES OF POUR ( 1 : 3 M I X . HIGH W O R K A B I L I T Y . V I B R A T E D ) ( AFTER R I T C H I E R E F . 1 6 )

A
CONCRETE
1 / LEVEL
( Q )
< d )
F IG . 1-2
( b)
DJEPTHOFVIB IMMERSION
VD
( e )
LATERAL CONCRETE PRESSURE ENVELOPE VARYING CONCRETE HEAD
UNDER

- 98 -
1 4 0 0 - !
UL S^I 2 0 o i
RATE OF POUR FEET/HOUR FIG.21 RELATION BETWEEN MAXIMUM
PRESSURE & RATE OF POUR "*
u tu
o z O u
HI K z> </> LU K 0 .
1 2 - ,
<
$5
a -
5 5 4 -
4 8 12 16 20 24
RATE OF POUR FT/HR
FlG.2-2 HEAD OF CONCRETE AT MAXIMUM PRESSURE

- 99 -
l/)21 0 LU I -ZD
l
en
LU
,1 8 0 _
E 1 4 0 .
<
o < UJ
a:
O LLl
1 0 0 _
6 0
2 0
T _ ^ MINUTES ( 3 ' 6 HOURS)
T 8 12 16 20
"1 24
RATE OF POUR (FT/HR)
FIG.2-3CL RELATION BETWEEN TIME TO REACH MAXPRESSURE AND RATE OF POUR

- 100 -
1:4:8 1:3:6
MIX PROPORTION FIG.2-3b CORRECTION FOR DIFFERENT
CONCRETE MIXES
LU 1 5 o_j
U CC LU Q_ 12 5 _
O 1 00 _
U LU cr a: O
75 _
5 0 _
2 5 "T 6 8 10 1 2
FIG.2-3C SLUMP (INCHES)
EFFECT OF SLUMP ON CONC. PRESSURE
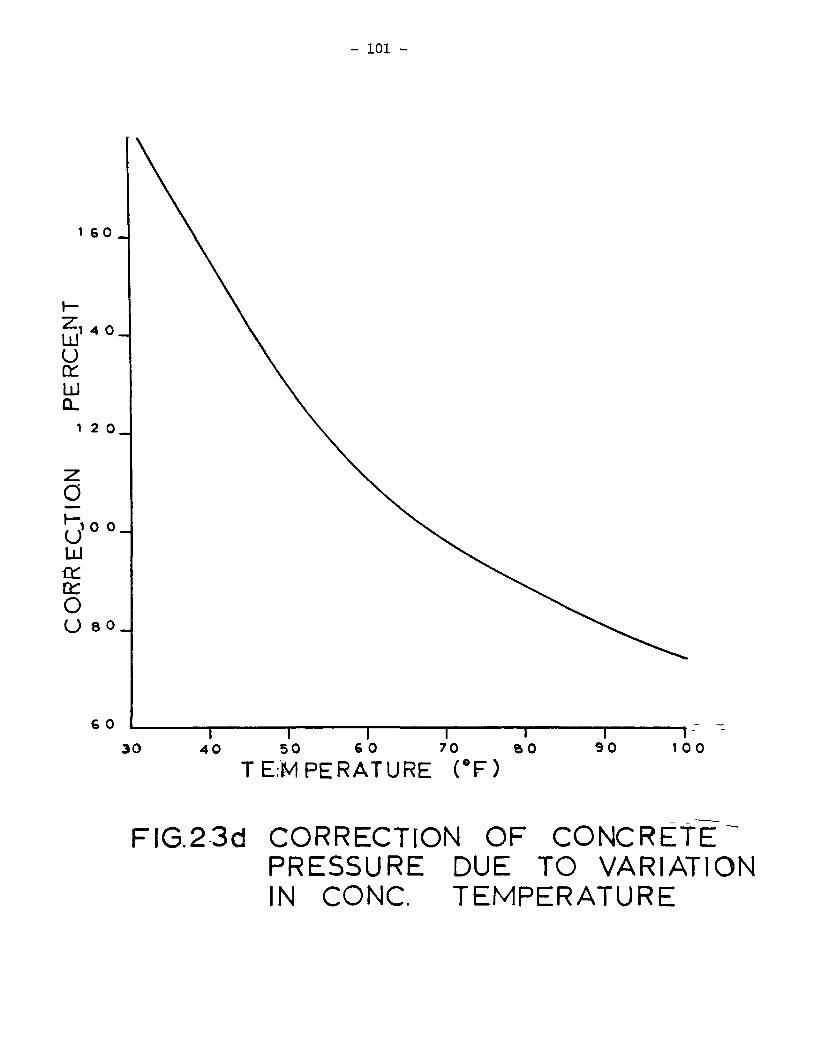
- 101 -
0 0 _
8 0 .
3 0 4 0 5 0 6 0 7 0 " T " 8 0
TEMPERATURE CF) 9 0
—r-1 0 0
FIG.23d CORRECTION OF CONCRETE" PRESSURE DUE TO VARIATION IN CONC. TEMPERATURE

- 102 -
A C T U A L PRESSURE D I S T R I B U T I O N
SHAPE ASSUMMED FOR DESIGN
3 R - ( H - H J P
3R F I G 2 4 S H A P E OF PRESSURE DIAGRAM
FOR DESIGN OF FORMS ( AFTER RODlN REE17)
CONCRETE SURFACE A = 1
A=0
'" SPADED OR VIBRATED ^ CONCRETE
h = 0
~ SETTIN G CONCRETE
t : 0 t = t£
F I G . 2 - 5 VARIATION OF A, WITH TIME (AFTER SCHJODT REF.18)

- 103 -
€ f j -x— a
Pv
_i
K • d Pv
FIG 2-6 INCREASE OF VERTICAL PRESSURE WITH DEPTH
I I
1 2 1 r T r
36
h/i_Ji 2 0 26
a VALUES m n
FIG.27 DIAGRAM FOR A=e s

1.0 .,
0 6
l-C
0-2
a = Atg<ph if
o
FIG.2-8 DIAGRAM FOR K

- 105 -
UJ u
Ui
LL!
(X O
o o
u. o
o UJ
ICO 200 200 400 500 600 700 800
CONCRETE PRESSURE (PSF)
FIG.2-9 PRESSURE DEVELOPED AT VARIOUS RATE OF POURttSMIX)
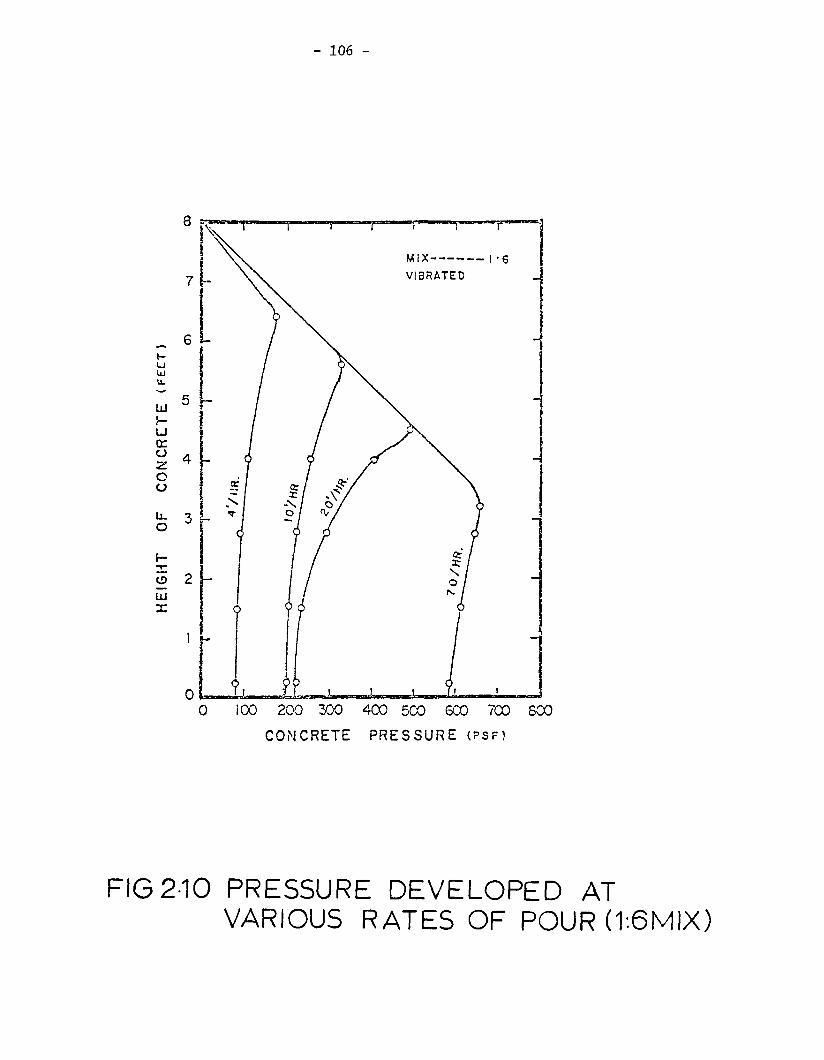
- 106 -
u UJ
U Q: o Z O o
o
(S> d t-LU X
SCO
CONCRETE PRESSURE ( ? S F )
FIG 2-10 PRESSURE DEVELOPED AT VARIOUS RATES OF POUR (T.6MIX)

- 107 -
UJ I -UJ (T O 2 ; o o
u. o
X
8
7 -
4 -
3 h
- 2 -UJ X
I f -
MIX I : 3
X 0\
v \
. \ . \
N \
\ \
/ /
£ &
W / /
^ ^
k / #
£
- J L
n ±
) \
100 200 200 400 500 600 CONCRETE PRESSURE ( P S F )
G.2-11 COMPARISON OF PRESSURE DEVELOPED WITH HAND AND VIBRATED CONCRETE

- 108 -
!00 2CO 300 400 500 600 CONCRETE PRESSURE ( P S F )
700
F I G 212 COMPARISON OF PRESSURE DEVELOPED WITH HAND AND VIBRATED CONCRETE (1:6 MIX)

- 109 -
200 400 S00 8 0 0 1000
CONCRETE PRESSURE (PSF)
FIG.2-13 VARIATION IN MAXIMUM PRESSURE DEVELOPED WITH SIZE OF FORMWORK

- l i p -
T™
I X
s s\
.%
tu
UJ 5
1 4 o 4 u. o
X
3 _ 0 it
UJ
= 2
0 1
\ \
V
.N o
(0
o
to ,
J L
/
j
Li_ -U 0 iOO 200 200 400 500 600 700
CONCRETE PRESSURE (PSF)
FIG.2-14 EFFECT OF MIX ON CON
CRETE PRESSURE

- I l l -
UJ
UJ h~ UJ Q: o •z o o
U.
o
X o UJ
ICO 200 200 400 300 600 700 CONCRETE PRESSURE ( P S F )
FIG.2-15a EFFECT OF CONSISTENCY ON
CONCRETE PRESSURE (1:3MIX)

- 112 -
i-
UJ u.
UJ t -UJ D: o o
u. o
X O
UJ
200 300 400 500 600
CONCRETE PRESSURE ( P S F )
700
FIG.2-15b EFFECT OF CONSISTENCY ON CONCRETE PRESSURE (1:6MIX)

- 113 -
Concretes of vinous slumps
40 50 60 70 80
CONCRETE TEMPERATURE — "F
90
FIG.2-16 RELATIONSHIP BETWEEN STIFFENING TIME AND THE TEMPERATURE OF CONCRETE (CERA)

- 114 -
K
a. £ O s
00
90
80
70
60
SO
40
30
20
10
r\ ••—!
Ex 4 (n)
\ 0 35
\ 0 40 ^
^ '
' \
1 Ex 4 (,)
\ 1
\ 0 30
015
i
\ 0 20
-i r
\ 0 15
\
' ^
V
\ 0 10
1
1 —
\ 0 0S
Ex 4 (MI)
i \
-
-
\
-
\
-
Stiff Range
3
Normal Range Highly Workable Range
SLUMP OF CONCRETE (inches)
FIG.2-17 VALUES OF FACTOR C. (CERA REF 9)

- 115 -
FlG.2-18 PRESSURE DESIGN CHART (CERA REF9)

- 116 -
^ z o
O S
Stiff Range Normal Range Highly Workable Range
SLUMP OF CONCRETE ( I N C H E S )
FIG 2-19 VALUES OF FACTOR F (CERA RER 9 )

- 117 -
M
to c o
LU Q: ID
to
LU Q: CL
6 _
2 _
0- 3 V
1 2 4 6
RATE OF POUR m/hour(V)
i 4
1 8
FIG.2-20 RELATION BETWEEN PRESSURE AND RATE OF POUR
4 S
RATE OF POUR 8
FIG2-21 RATE OF POUR m/hour(V)
RELATION BETWEEN RATE OF POUR,CONCRETE PRESSURE AND TEMPERATURE OF MIX.

- 118 -
L IQUID REGION
SOLID REGION
POURING SURFACE
FORM PRESSURE
F l G . 2 - 2 2 CROSS SECTION GEOMETRY OF WALL AND QUALITATIVE DIAGRAM OF FORM PR ESS. DISTRIBUTION
*? < -
F I G . 2 -23 DIAGRAM OF LINEAR STANDARD VISCO-ELASTIC SOLID AS MODEL FOR FORMSURFACE
DIMENSION RATIO S
F I G . 2 - 2 4 VARIATION QF RESIDUAL TO MAXIMUM PRESS. RATIO WITH STIFFNESS RATIO S AND" TIME RATIO T

CONCRETE MIX
TEMP. OF M I X
SLUMP 2-5 INCH
PERIOD OF VIBRATION 2-5 MIN
RATE OF POUR 2 0 FT/HR
4 0 0 8 0 0 1 2 0 0 1 6 0 0 2 0 0 0
CONCRETE PRESSURE (PSF) 400 800 1200 1600 2000
CONCRETE PRESSURE(PSF) 24 0 0
FlG.2-25 COMPARISON OF RECOMMENDED DESIGN PRESSURES

1 5.
CONCRETE M IX 1
TEMP. OF MIX SLUMP
PERIOD OF VIBRATION
RATE OF POUR
: 2 '.4
3 5 ' F
2 - 5 INCH
2 - 5 MIN
2 0 FT/HR
(c) to
o
4 0 0 8 0 0 12 0 0 16 0 0 2 0 0 0
PRESSURE ( PSF) FIG.225 COMPARISON OF RECOMMENDED DESIGN PRESSURE

- 121 -
P L A N
V IEW
/>»
> LU
L L
Q K O
J l r
LL
•+•12 FT.
"1
. I P !
.__^ 1
LU _J
LU >
< - 1 CO
J l r
6 FT. x 12 FT. OPENING ON GRD. FL.
GRD FL.
BASEMENT
2 2 FT. APPROX. TO BTM. OF CRANE
1
1 !
IT «?",
rr ? i CO ,
I I > I • i . A 'A
* . /I
• 4 " .
» • 4
7 SECTIONAL <N ELEVATION
f t " 7 " ••.!,. •".*
FORMWORK POSITION
^
FIG 4-1 a(i) FORMWORK POSITION IN STRUCTURAL LABORATORY.

- 122 -
F I G 4 1 a ( l l ) GENERAL VIEW OF FORMWORK
FROM TOP

- 123 -
XT
-H .1 I
t
(15)
1..
t " - " I T "
(11)
Ix Ey3
"ijnnn g ^ ( 1 2 )
(8)
4 II i
(5)
6
if PI
4> >w I n o
r h
I (3)
('/)
>(9> j i __
(^
b a
(1)
(4)
(10)
(3)
y 3
^44
r j —
- d
- c
b — s - a
(5)
^ = i l
.... c - - b
a
(9)
SCALE : 3 / 4 " = V - 0 "
FIG 4-1 b(i) GENERAL ASSEMBLY OF FORMWORK

- 124 -
TABLE 4.1 Details of Rigid Steel Formwork (Refer to Fig. 4-lb)
Index No. Description
1 Front face (2-15" channel sections and 1'6" channel sections).
2,3 Side faces, 12" channel section each, bolted to 5 .
4 4x4 WF Beam, welded to back of 'front face'.
5 4x4 WF Beam, hinged to '4', holding the 'side face' in vertical position.
6 Movable back face.
7 6x6 WF Beams, various lengths.
8 6x6 WF Beams, all the 5 load cells are mounted to it.
9 Pressure measuring device - load cell
10 6x6 Box section, welded to the back of front face, forming, part of the supporting collar.
11 6x6 Box section, joining the movable part of the supporting collar, can be moved to the desired position 'a', 'b', 'c' or 'd' according to the desired form thickness.
12 Jack, trade mark 'ENARPAC-RC-102', 10 tons capacity and 2-1/8" stroke.
13 Supporting threaded rods.
14 Pull out threaded rods.
15 6" channel section, part of the supporting collar.
16 Threaded rod, holding the side faces from opening up while concreting, rod has to pass through each side face of each side at position of 'aT, 'b1, 'c' or 'd' according to form thickness.
a Position for 6" thickness of the form.
b Position for 9" thickness of the form.
c Position for 12" thickness of the form.
d Position for 18" thickness of the form.

- 125 -
F IG41b ( i i ) GENERAL VIEW OF FORMWORK FROM TOP AFTER CONCRETE IS POURED

- 126 -
dummy normal gauges (total 8)
shea (tc
r gauges >tal 4)
active normal gauges (total 8)
FIG.4-2 STRAIN GAUGES ON
ORIGINAL CAMBRIDGE CELL

- 127 -
N
£L
i i
e " i
normal load measurement
ID
\
w
AC "/2 ^
shear load measurement
£±
—A —
I 1
L_J L_J
<* ' h-~yo *
3 •^L*"
FIG.4-3 STRAIN IN WEBS OF CAMBRIDGE CELL.

- 128 -
MODIFIED CAMBRIDGE CELL
1 1 ' 1
•
1 1 1 1 1 •
G4"
0.5'
0.5
shear web L
t — I I ~ i i
i i LL
normat
f.8'
"F3
025"
1.4'
ORIGINAL CAMBRIDGE CELL
normal webs
shear webs
shear pillar
F I G . 4 - 4 COMPARISON OF ORIGINAL AND MODIF IED CAMBRIDGE CELLS

- 129 -
FIG.4 -5a GENERAL VIEW OF CAMBRIDGE CELL WITHOUT FACEPLATE

- 130 -
• filler.;.
1 ji^K^M^ltSP^^JKSBm^ >
F!G.4-5b GENERAL VIEW OF CAMBRIDGE CELL WITH FACEPLATE
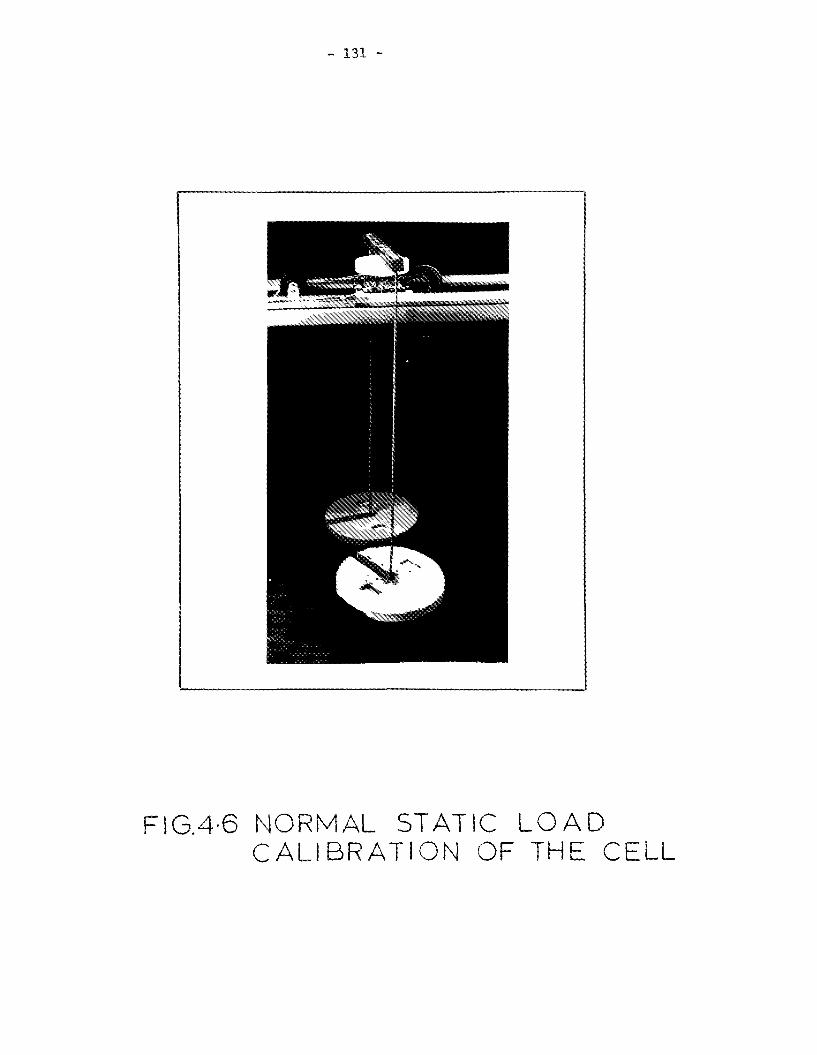
- 131 -
FIG4-6 NORMAL STATIC LOAD CALIBRATION OF THE CELL

- 132 -
L O A D CELL NO 1
•(1*2)
- ( 5 * 6 )
0 _
0 .
(-3H-8)*4«7
100 2 0 0
1 —
2 0 0 4 0 0
CENTRE LOAD (POUNDS)
FIG. 4-7 CENTRE LOAD VS STRAIN

- 133 -LOAD C E L L N O I
2 5 0 0 _
u
u
15 0 0
o cr O 2
< cr \— LO
5 0 0 .
1 0 0
( - 3 ) * ( - 8 ) * 4 • 7
2 0 0 3 0 0
SHEAR L O A D (POUNDS)
FIG.4-8 SHEAR LOAD VS STRAIN
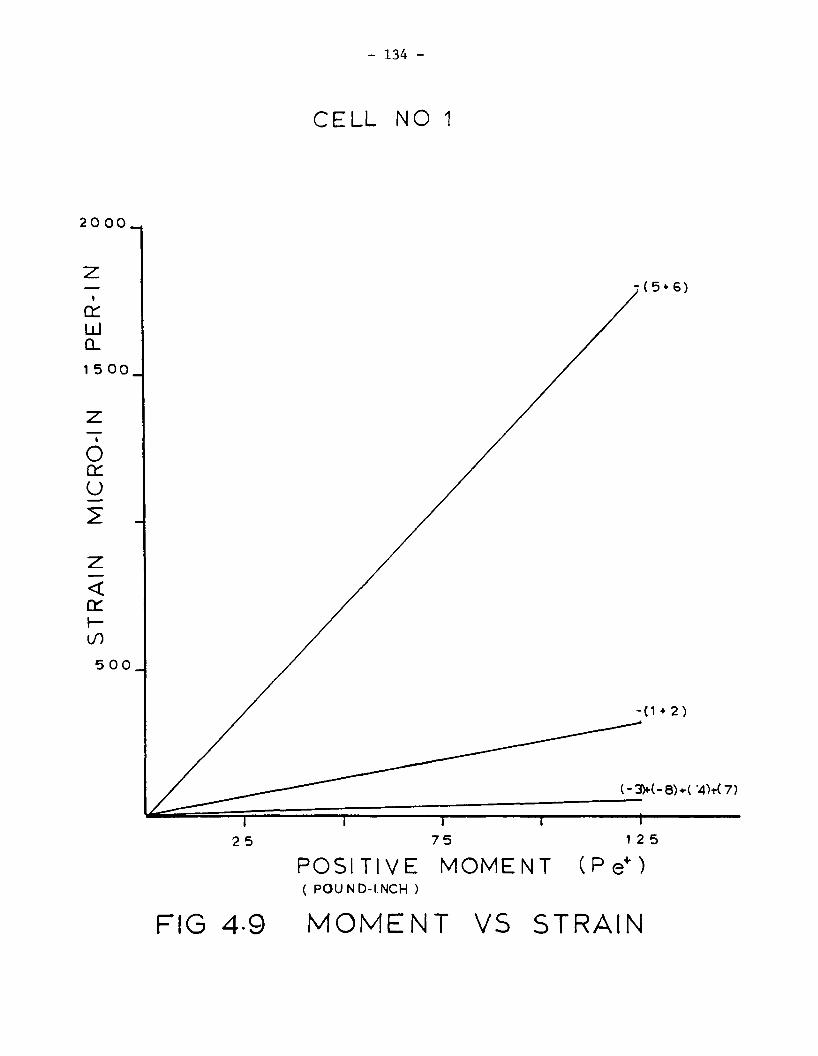
- 134 -
CELL NO 1
2 0 0 0 _
cr LU Q_
1 5 0 0 _
O cr u
< cr \—
5 0 0
; ( 5 * 6 )
2 5 7 5 12 5
POSITIVE MOMENT ( P e+ ) ( POUND-INCH )
FIG 4-9 MOMENT VS STRAIN

- 135
C E L L NO 1
(1» 2)
2 5 75 125
NEGETIVE MOMENT (Pe ' )
FIG.410 MOMENT VS STRAIN

- 136 -
LOAD CELL NO 2
- ( 1 • 2)
5* 6)
(-3M-8>4»7
—r~ 100 200 300
1 4 0 0
CENTRE LOAD (POUNDS)
FIG 4-11 CENTRE LOAD VS STRAIN

- 137 -
CELL NO 2
1 0 0
• ( - 3 W - 8 ) * 4 * 7
2 0 0 3 0 0
SHEAR LOAD (POUNDS)
FIG.4-12 SHEAR LOAD VS STRAIN

- 138 -
CELL NO 2
20 0 0 _, ( 5*. 6)
2 5 7 5 1 2 5
POSITIVE MOMENT (IN-POUND)
FIG 4-13 MOMENT VS STRAIN

- 139 -
CELL NO 2
(1* 2)
2 5 7 5 1 25
NEGETIVE MOMENT (Pe") IN-POUND
FIG 4-14 MOMENT VS STRAIN

- 140 -
CELL NO 3
2 5 0 0 „
i
o cr U
1 5 0 0 .
< 1 cr
5 0 0 .
100 200
CENTRE LOAD 3 0 0
( 5 * 6 )
- ( 1 * 2 )
((-3M-e)*4*7
4 0 0
FIG.4-15 CENTRAL LOAD VS STRAIN

- 141 -
CELL NO 3
• ( - 3 ) * < - 8 ) » 4 * 7
1 0 0 2 0 0 3 0 0
SHEAR LOAD (POUNDS)
FIG.4-16 SHEAR LOAD VS STRAIN

- 142 -
CELL NO 3
( 5 * 6 )
25 75 125
POSITIVE MOMENT (Pe+) IN POUND
FIG.4-17 MOMENT VS STRAIN

- 143 -
CELL NO 3
2 5 0 0 4
2 ooo - z:
1 0 0 0 .
- < 1 » 2 >
- < 5 * 6 )
(< -3 ) * ( -8 ) *4»7 )
2 5 75 1 2 5
NEGETIVE MOMENT (IN POUND)
FIG.418 MOMENT VS STRAIN

- 144 -
CELL NO 4
100 200 3 00 400
C E N T R E L O A D '. I":( POUNDS)
FIG 419 CENTRE LOAD VS STRAIN

- 145 -
C E L L NO 4
2 5 0 0 .
1 5 0 0 -
5 0 0 -
z:
z
O cr (J
z: < cr i— / to /
(-3>ea)*4*7
- ( 5 * 6 )
^ / / • ( 1 * 2)
100 200 300
SHEAR L O A D (POUNDS)
FIG 4-20 SHEAR LOAD VS STRAIN

- 146 -
CELL NO 4
2 5 0 0
1 5 0 0 . _
5 0 0
- ( 5 * 6 )
( ! • 2 )
• (-3M-8)*4*7
POSITIVE M O M E N T (Pe+-lN POUND
FIG.4-21 MOMENT VS STRAIN

- 147 -
2 5 0 0 .
1 5 0 0 .
5 0 0 .
CELL NO 4
- < ! • 2 )
[-8)*4*7
2 5 7 5 125
NEGETIVE MOMENT ("Pe" INPOUND)
FIG.422 MOMENT VS STRAIN

- 148 -
2 5 0 0
4 z: O cr u
1 5 0 0 .
<
cr h-
5 0 0
CELL NO 5
( 5 * 6 )
1*2)
( - 3 ) * ( -8)*4*7
100 2 0 0 3 0 0 4 0 0
CETRE LOAD (POUNDS)
FIG.4-23 NORMAL LOAD VS STRAIN
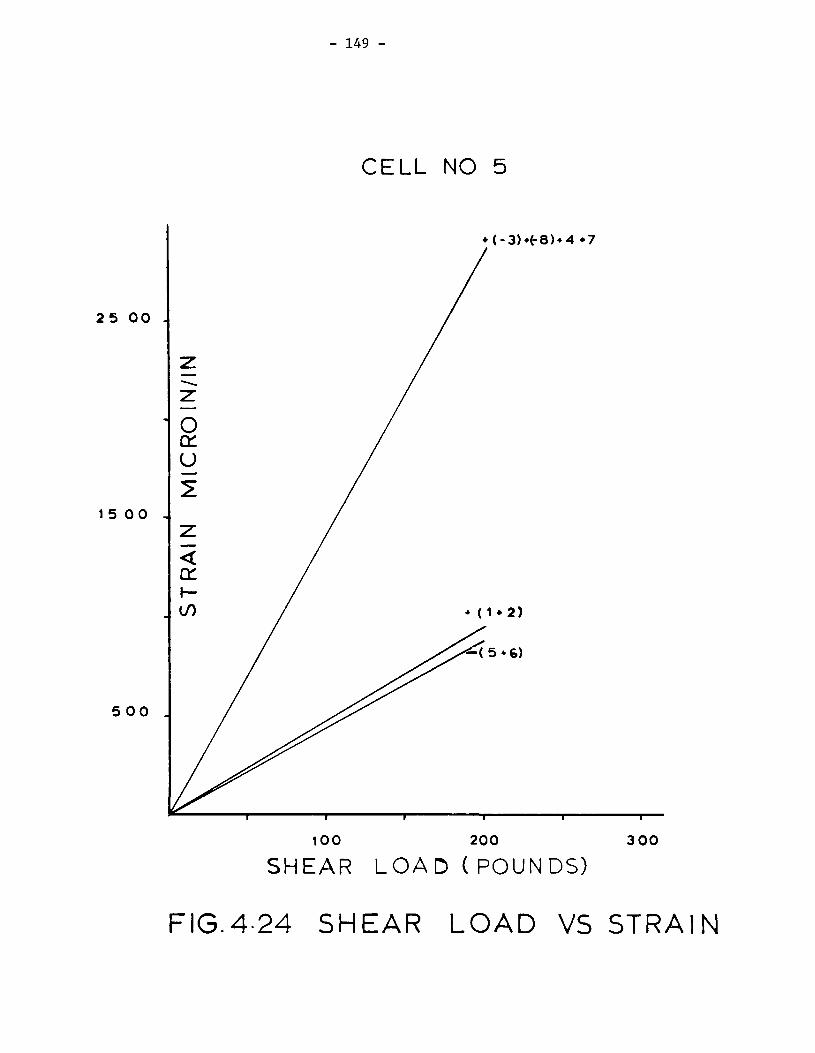
- 149 -
CELL NO 5
• (-3)*t-8)*4 *7
2 5 0 0 .
15 0 0 -
5 0 0 .
1 0 0 2 0 0 3 0 0
SHEAR LOAD ( POUNDS)
FIG.4-24 SHEAR LOAD VS STRAIN

- 1 5 0 •§•
CELL NO 5
2 5 0 0 .
15 0 0
5 0 0 .
1 25
POSITIVE MOMENT (Pe+ INPOUND)
FIG4-25 MOMENT VS STRAIN

- 151 -
CELL NO 5
( 1 * 2)
NEGETIVE MOMENT (Pe" INPOUND)
FIG.4-26 MOMENT VS STRAIN

- . 152 -
1500 <
cr t -i/)
5 0 0 .
CELL NO 6
2 5 0 0
O cr O
-<5« 6)
tfl • 2)
( - 3 M - 8 ) M * 7
100 200 3 0 0
NORMAL LOAD AT CENTRE 4 0 0
FIG.4-27 NORMAL LOAD VS STRAIN

- 153 -
CELL NO 6
2 5 0 0 .
1 5 0 0 .
5 0 0 .
z: O cr O
< / cr / \- /
*^ i i
* (1* 2)
^ ^ * < 5 * 6 >
i l l '
100 2 0 0 3 0 0
SHEAR LOAD (POUNDS)
FIG.4-28 SHEAR LOAD VS STRAIN

- 154 -
CELL NO 6
2 5 0 0 J
15 0 0 J
5 00 J
- ( 5 * 6 )
( 1 * 2 )
-<(-3>*<-8)*4»7)
5 0 100 125
POSITIVE MOMEN" (Pe+ INPOUND)
FIG.4-29 MOMENT VS STRAIN

- 155 -
2 5 0 0 .
1 5 0 0
5 0 0 -
CELL NO 6
( 1 * 2)
2 5 7 5 1 2 5
NEGETIVE MOMENT (Pe" INPOUND)
FIG.4-30 MOMENT VS STRAIN
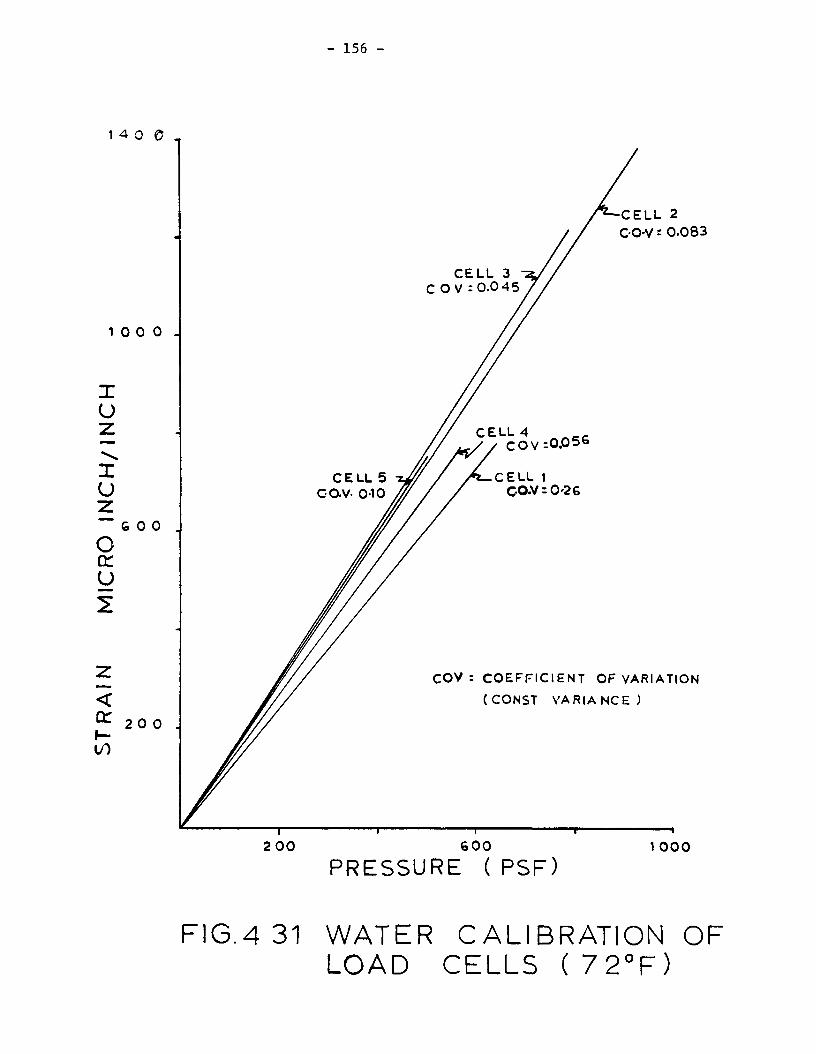
- 156 -
14 0 0
1 0 0 0 .
I o Z. \ X o z O cr U
6 0 0 .
cr to
2 0 0
CELL 3 C O V : 0-0 45
CELL 2 GO-V = 0.083
CELL 5 OO.V- 0-10
CELL 4 CO V =0.056
CELL 1 OO.V = 0-26
COV : COEFFICIENT OF VARIATION
(CONST VARIANCE )
2 0 0 6 0 0 1 0 0 0
PRESSURE (PSF)
FIG.4 31 WATER CALIBRATION OF LOAD CELLS ( 7 2 ° F )

- 1-57 -
1 4 0 C
1 0 0 0
6 0 0 . -
2 0 0
2 0 0 600 1000
PRESSURE (PSF)
FIG.4-32 CALIBRATION OF LOAD CELLS WITH STATIC LOAD CONSTANTS

U S ' STANDARD SIEVE NUMBER
1 0 0
9 0
8 0 I
o UJ
£
>-(0
o 2 i/> i/>
< a.
t -2 LU
u o: UJ a.
7 0
6 0
5 0
4 0
3 0
2 0
1 0
0
6 4 : 1
i 2 1 1
1 •V21 : T" r
J/4 1/2 3/g 1 1 I
\
\
\
\
\
\ 1
\
, \
\ 1
\
3 4 6 R C
\
\
\
8 10 1416 20 30 40 ' 1
\
....
\
I I I
k
\
\
\
1 • \ \
\
\
^ 50 70100140
1
*
\ ^
r i
V \
2 0 0 T
5 0 0 100 50 10 5 1 0 5
GRAIN SIZE - MILLMETERS
0 1 0-05
FlG:5.1 GRADING CURVES OF AGGREGATE ( MAX. COARSE AGG „ , SIZE = 3 /4)
00

t -u.
TEST NO DATE S P EC I F I ED CONC. STRENGTH
AVERAGE CONC. STRENGTH
AVERAGE SLUMP
FORM THICKNESS
RATE OF CONC. POUR
POWER OF V I B R A T O R
PERIOD OF V I BRATION
DEPTH OF VIBRATOR IMMERSION
CONC. TEMPERATURE
AMBIENT TEMPERATURE
2 6 . 8 . 77 4 0 0 0 PSI
5 3 0 5 PSI 2*5-
11 20
1 30
2
71
3 I NCI
INCI-FT/HF
H.P SECS
FT
°F ° F
<J1 VO
200 4 00
FIG. 6-1 a 600 8 00 1000 1200 1400 1600 1800 2000 2200
.CONCRETE PRESSURE (PSF) PRESSURE DEVELOPED AT VARIOUS CONC. LEVELS IN FORM

CONCRETE PRESSURE (PSF) 200 4 0 0 8 0 0 1000 1200 1 4 0 0 1600 1800 2 0 0 0
1 2 2 0 0
1 T T T I
TEST NO. 1 DATE S P E C I F I E D CONC. STRENGTH
AVE. CONC.STRENGTH
AVE. SLUMP
;FORM THICKNESS
RATE OF POUR
POWER OF VIBRATOR
PERIOD OF VIBRATION
DEPTH OF VI B. IMMERSION
CONC. TEMPERATURE
AMBIENT TEMPERATURE
. PRESSURE FR CELL 1 X PRESSURE FR CELL 2 G PRESSURE FR CELL 3
+
4 0 0 0 5 3 0 5
2-5-3
11
20
1
3 0 2
71
PSI
PSI
INCH.
INCH. FT/HR
H.P
SECS FT
• P • F
PRESS FR CELL 4-
A PRESS. FR CELL 5
ON
o
HYDROSTATIC L INE
FIG.6-1 b RELATION BETWEEN PRESSURE & CONC. HEAD

,v \
\
A
TEST NO
^
DATE S P EC I F I ED CONC. STRENGTH AVERAGE CONC. STRENGTH AVERAGE SLUMP FORM THICKNESS
RATE OF CONC. POUR POWER OF VI BRATOR PERIOD OF V I BRATION DEPTH OF VIBRATOR IMMERSION CONC TEMPERATURE AMBIENT TEMPERATURE
2 28.7 .1977
4 0 0 0 PSI
4 315 PSI
2-5-3 INCH
11 INCH
20 FT/HF 1 H.P
2-5 MIN 2 FT
74 °F 71 °F
\
\ \
s
J L ± ±
O m 70
J C /
± 200 4 00
FIG. 6-2 a 6 0 0 8 00
I 1000 1200 1400 1600 1800 2000 2200
CONCRETE PRESSURE (PSF) PRESSURE DEVELOPED AT VARIOUS CONC. LEVELS IN FORM
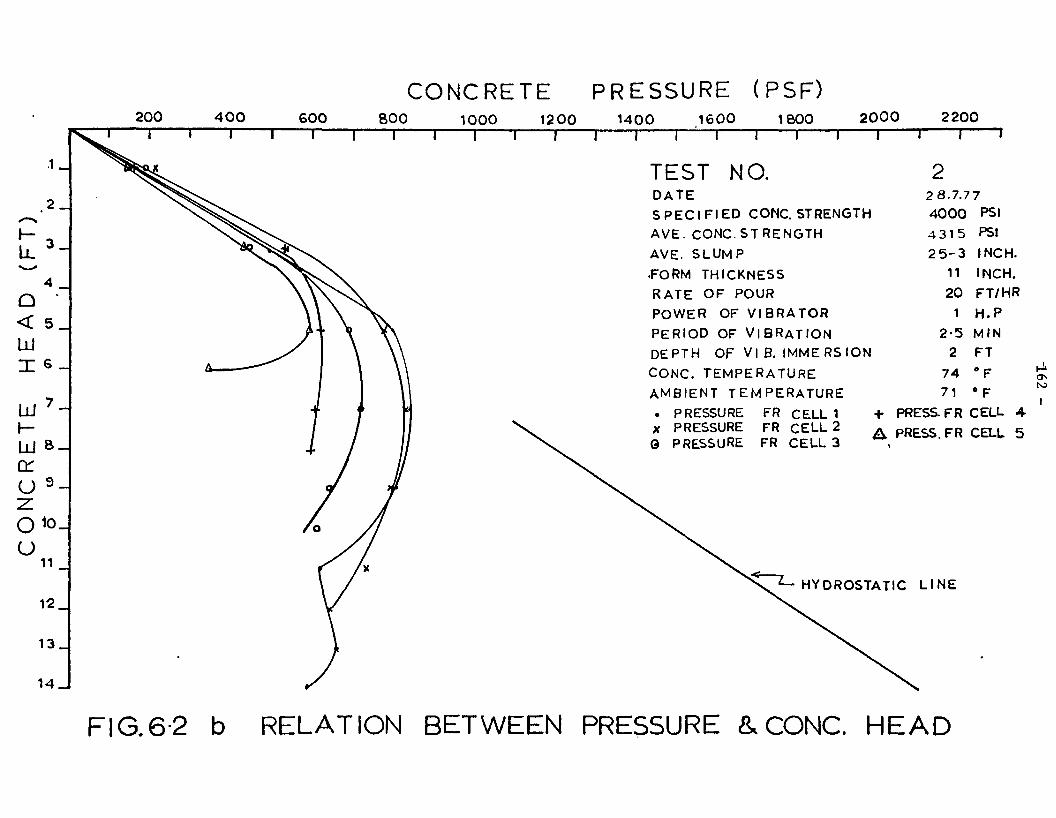
200 4 0 0 6 0 0
CONCRETE PRESSURE (PSF) 800 1000 1200 1400 1600 1800 2000
1 T 2200
1 1 T T T T
NO. TEST DATE S P E C I F I E D CONC. STRENGTH
AVE. CONC.STRENGTH
AVE. SLUMP
•FORM THICKNESS
RATE OF POUR
POWER OF VIBRATOR
PERIOD OF VIBRATION
DEPTH OF V| B. IMMERSION
CONC. TEMPERATURE
AMBIENT TEMPERATURE
. PRESSURE FR CELL 1 X PRESSURE FR CELL 2 0 PRESSURE FR CELL 3
2 2 8.7.77
4 0 0 0 PSI
4 3 1 5 FSI
2 5 - 3 INCH.
11 INCH.
20 FT/HR
1 H.P
2-5 MIN
2 FT
74 ° F
71 »F
+ PRESS FR CELL 4-
A PRESS. FR CELL 5
HYDROSTATIC L I N E
FIG.6-2 b RELATION BETWEEN PRESSURE &CONC. HEAD

TEST NO D A T E S PEC I F I ED CONC. STRENGTH
AVERAGE CONC. STRENGTH
AVERAGE SLUMP
FORM THICKNESS
RATE OF CONC. POUR
POWER OF V I BRATOR
PERIOD OF V I BRATION
DEPTH OF VIBRATOR IMMERSION
CONC TEMPERATURE
AMBIENT TEMPERATURE
3 31.8.77
4 0 0 0 PSI
4 5 0 0
2 - 5 - 3
2 0 0 4 0 0
FIG. 6-3 a 6 0 0
11
20
1
3-5
2
71
72
PSI
INCH
INCH
FT/HR
H.P
MIN
FT
F
8 00 1000 1200 1400 1600 1800 2000 2200
CONCRETE PRESSURE (PSF) PRESSURE DEVELOPED AT VARIOUS CONC. LEVELS IN FORM

CONCRETE PRESSURE (PSF) 200 4 0 0 6 0 0 8 0 0 1000 1200 1400 1600 1800 2000
I 2200
4 j Q
< 5 j
LLl
T T T T
TEST NO. DATE S P E C I F I E D CONC. STRENGTH
AVE CONC.STRENGTH
AVE SLUMP
.FORM THICKNESS
RATE OF POUR
POWER OF VIBRATOR
PERIOD OF VIBRATION
DEPTH OF V| B. IMMERSION
CONC. TEMPERATURE
AMBIENT TEMPERATURE
. PRESSURE FR CELL 1 X PRESSURE FR CELL 2 0 PRESSURE FR CELL 3
31 8 1 9 7 7
4 0 0 0 PSI 4 5 0 0 PSI
INCH.
INCH. FT/HR
H.P
11
20
1
3*5 Ml N 2 FT
71 ' F
7 2 • F
+ PRESS FR CELL
A PRESS. FR CELL
4>-
4-
5
HYDROSTATIC L I N E
FIG.6-3 b RELATION BETWEEN PRESSURE & CONC. HEAD

V
8.
47.
6 _ *
3 5_
\
A A
A
\
\ \
J. i . _L I J_
o m 70
IU
-L
TEST NO DATE S P E C I F I E D CONC. STRENGTH
AVERAGE CONC. STRENGTH
AVERAGE SLUMP
FORM THICKNESS
RATE OF CONC. POUR
POWER OF V I BRATOR PERIOD OF V I BR AT ION
DEPTH OF VIBRATOR IMMERSION
CONC TEMPERATURE
AMBIENT TEMPERATURE
4 4 - 8 - 1 9 77 4 0 0 0 PSI
5 12 8 PSI
2 5 3 | N C H 11 INCH
20 F T / H
1 H.P 5 M I N
2 FT
7 8 °F
7 4 ° F
<5/ P/
_L -L _L _L -C
ON
2 0 0 4 0 0
FIG. 6-4 a 6 0 0 8 0 0 1000 1 2 0 0 1 4 0 0 1600 1800 2000 2 2 0 0
CONCRETE PRESSURE (PSF) PRESSURE DEVELOPED AT VARIOUS CONC. LEVFLS IN FORM
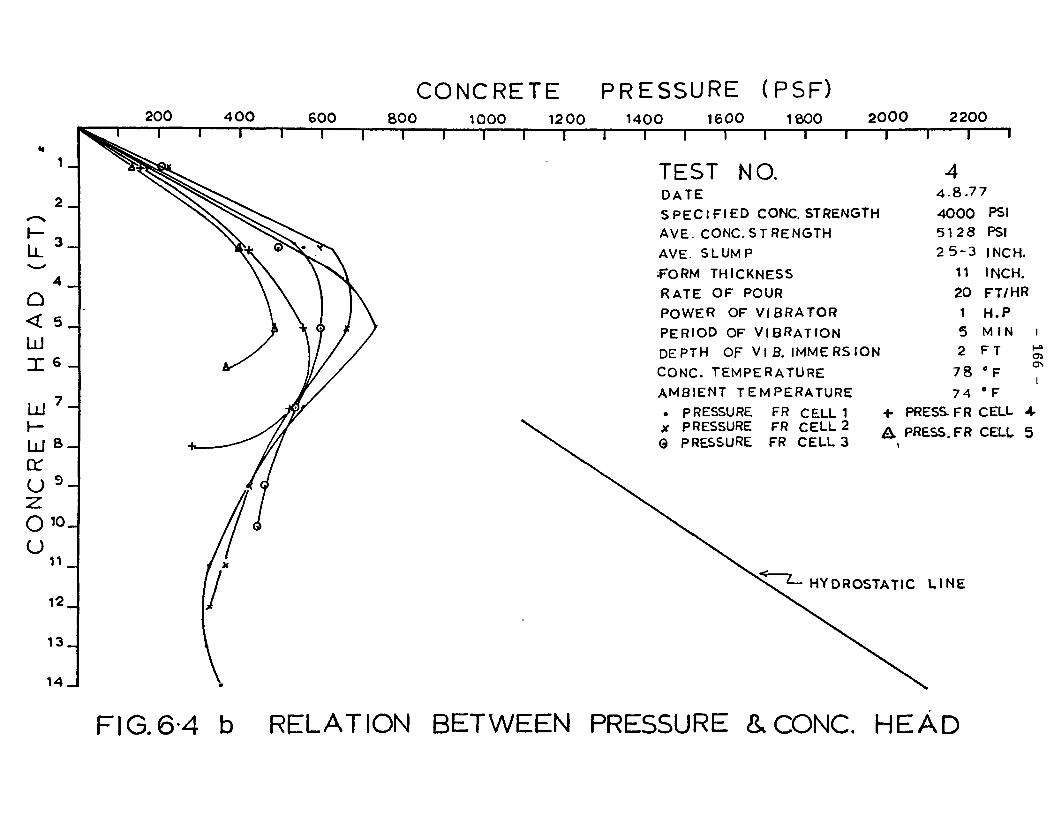
CONCRETE PRESSURE (PSF) 200 8 0 0 1000 1200 1400 1600 1800 2000 2200
T T T T
TEST NO. DATE
S P E C I F I E D CONC. STRENGTH
AVE. CONC.STRENGTH
AVE. SLUMP
;FORM THICKNESS
RATE OF POUR
POWER OF VIBRATOR
PERIOD OF VIBRATION
DEPTH OF VI B. IMMERSION
CONC. TEMPERATURE
AMBIENT TEMPERATURE
. PRESSURE FR CELL 1 X PRESSURE FR CELL 2 Q PRESSURE FR CELL 3
4 8 . 7 7
4 0 0 0 PSI
5 1 2 8
2 5 - 3
11
20
1
5
2
7 8
74
PSI
INCH.
INCH. FT/HR
H.P M IN
FT
* F
• F
7 _ HYDROSTATIC L I N E
+ PRESS FR CELL 4-
A PRESS. FR CELL 5
FIG.6-4 b RELATION BETWEEN PRESSURE &CONC. HEAD
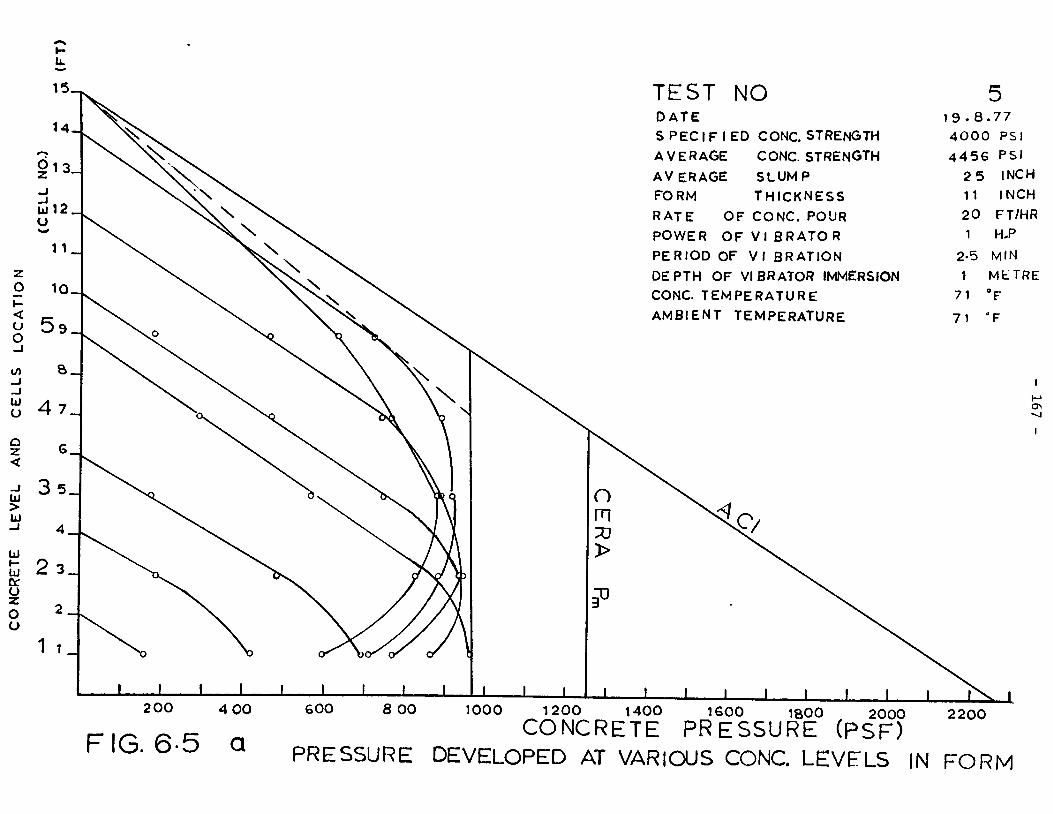
TEST NO DATE
S PEC I F I ED CONC. STRENGTH
AVERAGE CONC. STRENGTH
AVERAGE SLUMP
FORM THICKNESS
RATE OF CONC. POUR
POWER OF V I B R A T O R
PERIOD OF V I BRATION
DEPTH OF VIBRATOR IMMERSION
CONC. TEMPERATURE
AMBIENT TEMPERATURE
5 1 9 . 8 . 7 7 4 0 0 0 PSI 4 4 5 6 PSI
2 5 INCH 11 INCH
FT/HR H-P MIN
METRE
°F
'F
20
1
2-5
1 71
71
2 0 0 4 0 0
FIG. 6-5 a 6 0 0 8 0 0 1000 1 2 0 0 1 4 0 0 1600 1800 2000 2 2 0 0
CONCRETE PRESSURE (PSF) PRESSURE DEVELOPED AT VARIOUS CONC. LEVELS IN FORM

CONCRETE PRESSURE (PSF) 200 4 0 0 6 0 0 8 0 0 1000 1200 1400 1600 1800 2000 2200
T T T l T T
NO. TEST DATE
S P E C I F I E D CONC. STRENGTH
AVE CONC.STRENGTH
AVE. SLUMP
.FORM THICKNESS
RATE OF POUR
POWER OF VIBRATOR
PERIOD OF VIBRATION
DEPTH OF VI B. IMMERSION
CONC. TEMPERATURE
AMBIENT TEMPERATURE . PRESSURE x PRESSURE Q PRESSURE
FR CELL 1 FR CELL 2 FR CELL 3
5 1 9 . 8 -77
4 0 0 0 PSI 4 4 5 6 PSI
2-5 INCH.
11 INCH.
20 FT/HR
1 H.P
30 SECS 1 METRE
71 ° F
71 ° F + PRESS. FR CELL 4-
& PRESS. FR CELL 5
II
oo
HYDROSTATIC L I N E
FIG.6-5 b RELATION BETWEEN PRESSURE & CONC. HEAD

TEST NO D A T E S PEC 1 F 1 ED CONC. STRENGTH
AVERAGE CONC. STRENGTH
AVERAGE SLUMP FORM THICKNESS
RATE OF CONC. POUR
POWER OF V I BRATOR
PERIOD OF V I BRATION
DEPTH OF VIBRATOR IMMERSION
CONC. TEMPERATURE
AMBIENT TEMPERATURE
6 9 . 8 . 7 7
4 0 0 0 PSI 4 4 39 PSI
2-5 LNCH
11 INCH 20 FT/HR
1 H (P
2-5 MIN
1 METRE
7 5 ' F 7 3 °F
2 0 0 4 0 0
FIG. 6-6 a
6 0 0 8 00 1000 1200 1400 1600 1800 2000 2200
CONCRETE PRESSURE (PSF) PRESSURE DEVELOPED AT VARIOUS CONC. LEVELS IN FORM

200 4 0 0 6 0 0
CONCRETE PRESSURE (PSF) 800 1000 1200 1400 1600 1800 2000 2200
TEST NO. 6 DATE 9 - 8 - 7 7
S P E C I F I E D CONC. STRENGTH 4 0 0 0 PSI
AVE. CONC.STRENGTH 4 4 3 9 PSI
AVE. SLUMP 2-5 INCH.
•FORM THICKNESS 11 INCH.
RATE OF POUR 20 FT/HR
POWER OF VIBRATOR 1 H.P
PERIOD OF VIBRATION 2-5 MIN DEPTH OF VI B. IMMERSION 1 METRE
CONC. TEMPERATURE 7 5 ° F AMBIENT TEMPERATURE 7 3 * F . PRESSURE FR CELL 1 + PRESS FR CELL 4-
A PRESS. FR CELL 5
O
X PRESSURE 0 PRESSURE
FR CELL 2 FR CELL 3
HYDROSTATIC L I N E
FIG.6-6 b RELATION BETWEEN PRESSURE & CONC. HEAD

TEST NO DATE S P E C I F I E D CONC. STRENGTH
AVERAGE CONC. STRENGTH
AVERAGE SLUMP
FORM THICKNESS
RATE OF CONC. POUR
POWER OF VI BRATOR
PERIOD OF V I BR AT ION
DEPTH OF VIBRATOR IMMERSION
CONC. TEMPERATURE
AMBIENT TEMPERATURE
7 2 . 9 •
4 0 0 0 3 8 2 0
2 - 5 -
11 2 0
1
3-5 1
72
71
7 7
PSI PSI
3 I NCI
INCI FT/H
H.P
MIN METRI *F
° F
I
~-l
1
200 4 00
FIG. 6-7 a 6 0 0 8 00 1000 1200 1400 1600 1800 2000 2200
CONCRETE PRESSURE (PSF) PRESSURE DEVELOPED AT VARIOUS CONC. LEVFLS IN FORM

200 4 0 0 6 0 0
CONCRETE PRESSURE (PSF) 800 1000 1200 1400 1600 1800 2000 2200
1 T T T T T
NO. TEST DATE
S P E C I F I E D CONC. STRENGTH
AVE. CONC.STRENGTH
AVE. SLUMP
;FORM THICKNESS
RATE OF POUR
POWER OF VIBRATOR
PERIOD OF VIBRATION
DEPTH OF V| B. IMMERSION
CONC. TEMPERATURE
AMBIENT TEMPERATURE . PRESSURE X PRESSURE Q PRESSURE
FR CELL 1 FR CELL 2 FR CELL 3
+ A
7 2 . 9 .
4 0 0 0 3 8 2 0
2 5-3
11
• 20
1
3-5 1
7 2
7 1
7 7
PSI
PSI
INCH.
INCH.
FT/HR
H.P
MJN METRE
° F
° F PRESS FR CELL A
PRESS. FR CELL 5
Ho
I
HYDROSTATIC L I N E
FIG.6-7 b RELATION BETWEEN PRESSURE & CONC. HEAD

TEST NO D A T E S P E C I F I E D CONC. STRENGTH
AVERAGE CONC. STRENGTH
AVERAGE SLUMP
FORM THICKNESS
RATE OF CONC. POUR
POWER OF V I BRATOR
PERIOD OF V I BRATION
DEPTH OF VIBRATOR IMMERSION
CONC. TEMPERATURE
AMBIENT TEMPERATURE
8 1 2 . 8 - 7 7
4 0 0 0
4 4 9 2
2 - 5 - 3
11
20
1
5 1
6 6
6 7
PSI
PSI INC
INC ,
FT/I-
H.P
MIN
METRE °F D
F
200 4 00
FIG. 6-8 a 600 8 00 1000 1200 1400 1600 1800 2000 2200
CONCRETE PRESSURE (PSF) PRESSURE DEVELOPED AT VARIOUS CONC. LEVELS IN FORM

200 4 0 0 6 0 0
CONCRETE PRESSURE (PSF) 800 1000 1200 1400 1600 1800 2000
1 2200
T T T T 1
NO. TEST DATE
S P E C I F I E D CONC. STRENGTH
AVE. CONC.STRENGTH
AVE. SLUMP
•FORM THICKNESS
RATE OF POUR
POWER OF VIBRATOR
PERIOD OF VIBRATION
DEPTH OF V | B. IMMERSION
CONC. TEMPERATURE AMBIENT TEMPERATURE . PRESSURE X PRESSURE 0 PRESSURE
8 1 2 . 8 . 7 7 4 0 0 0 PSI 4 4 92 PSI
2 5 - 3 INCH.
11 INCH.
FR CELL 1 FR CELL 2 FR CELL 3
!
+
20
1
5 1
6 8
67
FT/HR
H.P
MIN
METRE ° F
° F PRESS FR CELL 4-
A PRESS. FR CELL 5
HYDROSTATIC L I N E
FIG.6-8b RELATION BETWEEN PRESSURE & CONC. HEAD

TEST NO DATE S P E C I F I E D CONC. STRENGTH
AVERAGE CONC. STRENGTH
AVERAGE SLUMP
FORM THICKNESS
RATE OF CONC. POUR
POWER OF V I BRATOR
PERIOD OF V I BRATION
DEPTH OF VIBRATOR IMMERSION
CONC TEMPERATURE
AMBIENT TEMPERATURE
2 0 0 4 0 0
FIG. 6-9 a
9 6-7.77 4 0 0 0 PSI
4 6 2 0 PSI
2-5-3 INCH
11 I N C H
20 FT/HR
2-5 H.P
30 SECS
2 FT
73 *F
73 °F
6 0 0 8 0 0 1000 1 2 0 0 1400 1600 1800 2000 2 2 0 0
CONCRETE PRESSURE (PSF) PRESSURE DEVELOPED AT VARIOUS CONC. LEVELS IN FORM

CONCRETE PRESSURE (PSF) 200 4 0 0 6 0 0 8 0 0 1000 1200 1400
"~l 1600 1800
T 2000
—I T
2 2 0 0 1 1
TEST DATE S P E C I F I E D CONC. STRENGTH
AVE. CONC.STRENGTH
AVE. SLUMP
.FORM THICKNESS
RATE OF POUR
POWER OF VIBRATOR
PERIOD OF VIBRATION
DEPTH OF V| B. IMMERSION
CONC. TEMPERATURE
AMBIENT TEMPERATURE
. PRESSURE X PRESSURE 9 PRESSURE
FR CELL 1 FR CELL 2 FR CELL 3
9 6.7.77
4 0 0 0 PSI
4 6 2 0 PSI
2 5 - 3 INCH.
11 INCH.
20 FT/HR
2-5 H.P
30 SECS
2 FT
7 3 ° F
7 3 ° F ,
+ PRESS FR CELL 4-
A PRESS. FR CELL 5
-*4
HYDROSTATIC L I N E
F I G . 6 9 b RELATION BETWEEN PRESSURE & CONC. HEAD
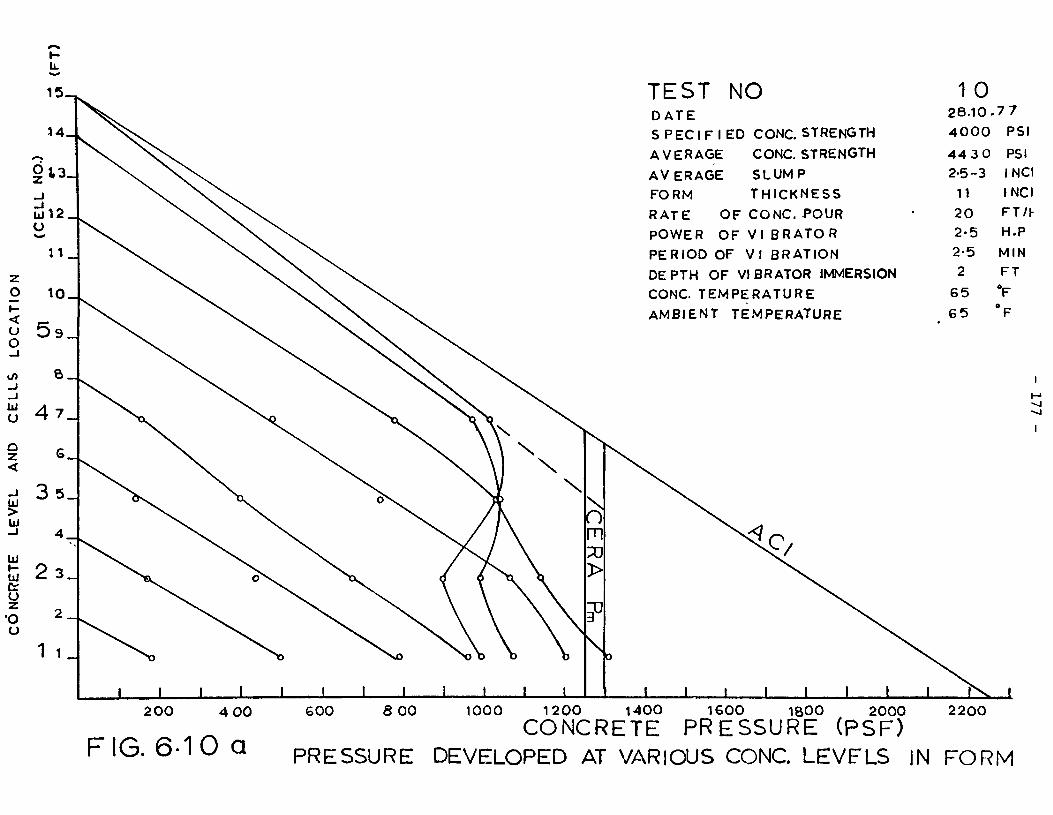
\ \
\
I
N O m 70
33
\
TEST NO D A T E S P E C I F I E D CONC. STRENGTH
AVERAGE CONC. STRENGTH
AVERAGE SLUMP
FORM THICKNESS
RATE OF CONC. POUR
POWER OF V I BRATOR
PERIOD OF V I BRATION
DEPTH OF VIBRATOR IMMERSION
CONC TEMPERATURE
AMBIENT TEMPERATURE
<5? C
_L
1 0 28.10-4 0 0 0
4 4 3 0
2-5-3
11
2 0 2-5 2-5 2
6 5
6 5
7 7
PSI
PSI INCI
INCI FT/I-H.P
MIN FT
°F
°F
± 2 0 0 4 0 0
FIG. 6-10 a 6 0 0 8 0 0 2 2 0 0 1000 1 2 0 0 1 4 0 0 1600 1800 2000
CONCRETE PRESSURE (PSF) PRESSURE DEVELOPED AT VARIOUS CONC. LEVFLS IN FORM
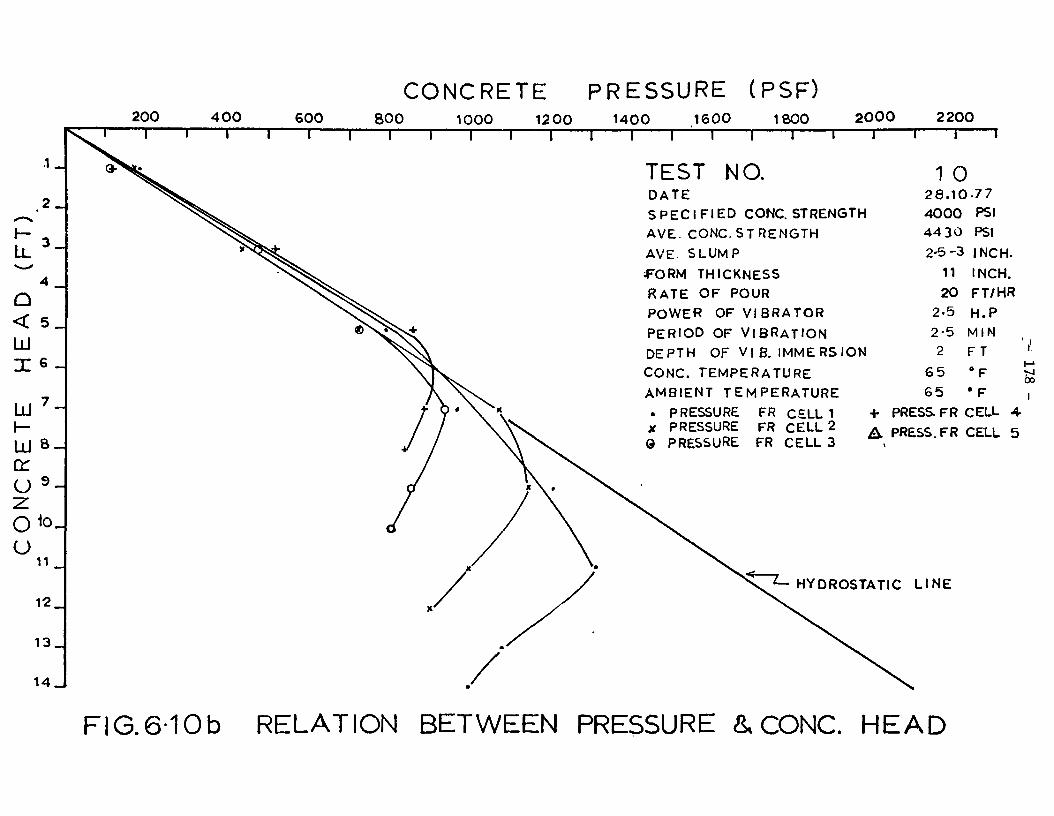
CONCRETE PRESSURE (PSF) 800 1000 1200 1400 1600 1800 2000 2200
I 1
TEST DATE S P E C I F I E D CONC. STRENGTH
AVE. CONC. STRENGTH
AVE. SLUMP
f O R M THICKNESS
RATE OF POUR
POWER OF VIBRATOR
PERIOD OF VIBRATION
DEPTH OF V| B. IMMERSION
CONC. TEMPERATURE
AMBIENT TEMPERATURE
. PRESSURE FR CELL 1 X PRESSURE FR CELL 2 Q PRESSURE FR CELL 3
+ A
1 0 2 8 . 1 0 7 7
4 0 0 0 PSI
44 30 PSI
2-5-3 INCH.
11 INCH.
20 FT/HR
2-5 H.P
2-5 MIN
2 FT
6 5 8 F
6 5 ° F
PRESS FR CELL 4-
PRESS. FR CELL 5
HYDROSTATIC L I N E
oo
FIG. 610b RELATION BETWEEN PRESSURE & CONC. HEAD

U.
_L
o m
5D
TEST NO D A T E S P E C I F I E D CONC. STRENGTH
AVERAGE CONC. STRENGTH
AVERAGE SLUMP
FORM THICKNESS
RATE OF CONC. POUR
POWER OF V I BRATOR
PERIOD OF V I BRATION
DEPTH OF VIBRATOR IMMERSION
CONC. TEMPERATURE
AMBIENT TEMPERATURE
<<l P/
J- J-
11 13.10.77
4 0 0 0 f 4 5 6 7 F
2 5 - 3 U 11 IN 2 0 FT 2-5 H,
3 0 SE 1 METRE
62 °F 61 ° F
vo
2 0 0 4 0 0
FIG. 6-11 a 6 0 0 8 0 0 1000 1 2 0 0 1 4 0 0 1600 1800 2000 2 2 0 0
CONCRETE PRESSURE (PSF) PRESSURE DEVELOPED AT VARIOUS CONC. LEVFLS IN FORM

200 4 0 0 6 0 0
CONCRETE PRESSURE (PSF) 800 1000 1200 1400 1600 1800 2000 2200
TEST NO. DATE SPECIF IED CONC. STRENGTH AVE. CONC.STRENGTH
AVE. SLUMP
•FORM THICKNESS RATE OF POUR POWER OF VIBRATOR
PERIOD OF VIBRATION DEPTH OF VI B. IMMERSION
CONC. TEMPERATURE AMBIENT TEMPERATURE . PRESSURE FR CELL 1
PRESSURE FR CELL 2
11
PRESSURE CELL 3
13.10
4 0 0 0 4 5 6 7
2-5-3
11
20
2-5
3 0
1
6 2
61
+ PRESS FR
A PRESS. FR
7 7
PSI
PSI
INCH.
INCH. FT/HR
H.P SECS
METRE ° F oo
o ° F ,
CELL 4-
CELL 5
HYDROSTATIC L I N E
FIG.6-11 b RELATION BETWEEN PRESSURE &CONC. HEAD

u.
TEST NO D A T E S P E C I F I E D CONC. STRENGTH
AVERAGE CONC. STRENGTH
AVERAGE SLUMP
FORM THICKNESS
RATE OF CONC. POUR
POWER OF V I BRATOR
PERIOD OF V I BRATION
DEPTH OF VIBRATOR IMMERSION
CONC. TEMPERATURE
AMBIENT TEMPERATURE
12 20.10
4 0 0 0 5 0 4 0
2 5 - 3 11
20
2-5 2-5
1
5 5 ° 5 9 °
. 7 7
P S I PSI
INCH
INCH
FT/HP
H.P M I N
METRE
F
F
.C /
200 4 00
FIG. 6-12 a 6 0 0 8 00 1000 1200 1400 1600 1800 2000
CONCRETE PRESSURE (PSF) 2200
PRESSURE DEVELOPED AT VARIOUS CONC. LEVELS IN FORM

CONCRETE PRESSURE (PSF) 200 4 0 0 6 0 0 8 0 0 1000 1200 1400 1600 1800 2 0 0 0 2 2 0 0
T
TEST NO. DATE S P E C I F I E D CONC. STRENGTH
AVE. CONC.STRENGTH
AVE. SLUMP
•FORM THICKNESS
RATE OF POUR
POWER OF VIBRATOR
PERIOD OF VIBRATION
DEPTH OF V| B. IMMERSION
CONC. TEMPERATURE
AMBIENT TEMPERATURE
. PRESSURE X PRESSURE G PRESSURE
FR CELL 1 FR CELL 2 FR CELL 3
+ A
1 2 20-10
4 0 0 0 5 0 4 0
2-5-3
11
20
2-5
2-5 1
5 5
5 9
•77 PSI
PSI
INCH.
INCH.
FT/HR
H.P M I N
METRE tfF
° F PRESS FR CELL 4-
PRESS. FR CELL 5
t
oo l-o
1
HYDROSTATIC L I N E
FIG.6-12b RELATION BETWEEN PRESSURE & CONC. HEAD
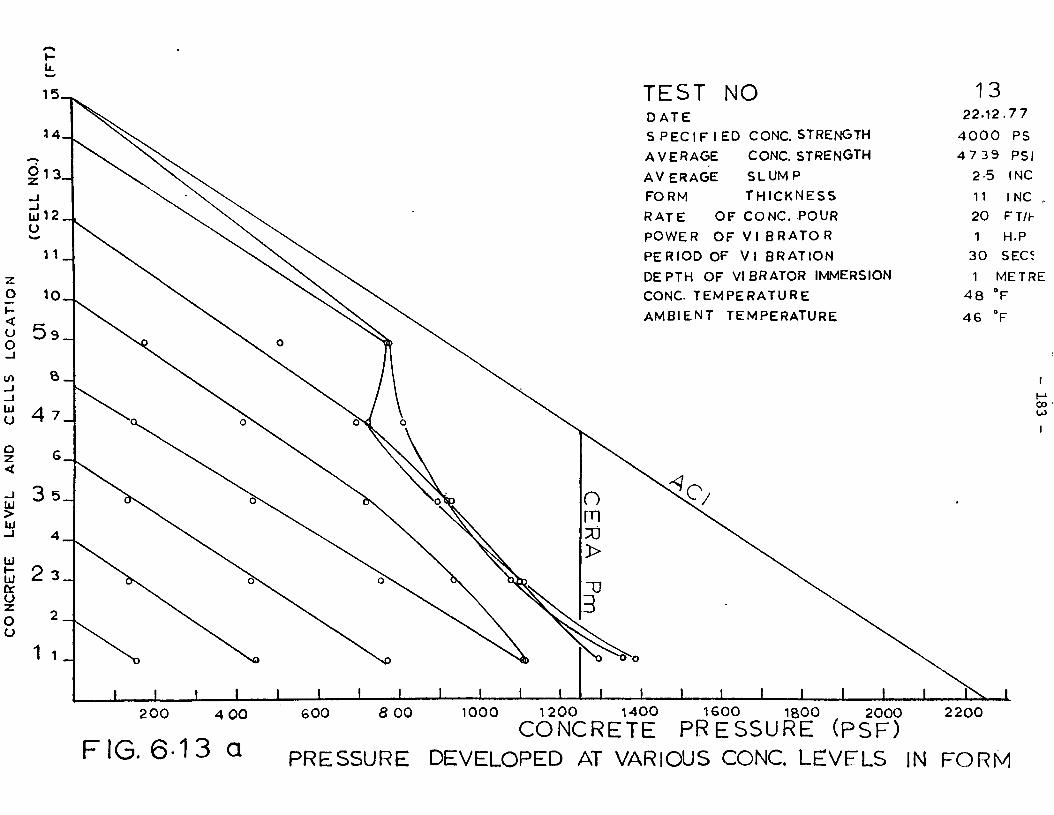
TEST NO D A T E S P E C I F I E D CONC. STRENGTH
AVERAGE CONC. STRENGTH
AVERAGE SLUMP
FORM THICKNESS
RATE OF CONC. POUR
POWER OF V I BRATOR
PERIOD OF V I BRATION
DEPTH OF VIBRATOR IMMERSION
CONC. TEMPERATURE
AMBIENT TEMPERATURE
2 0 0 4 0 0
FIG. 6-13 a 6 0 0
13 22.12.77
4 0 0 0 PS
4 7 3 9 PSI
2-5 INC
11 INC ,
20 FT/h
1 H.P
30 SECS
1 METRE
4 8 °F
4 6 °F
8 0 0 1000 1 2 0 0 1 4 0 0 1600 1800 2000 2 2 0 0
CONCRETE PRESSURE (PSF) PRESSURE DEVELOPED AT VARIOUS CONC. LEVFLS IN FORM

CONCRETE PRESSURE (PSF) 8 0 0 1000 1200 1400 1600 1800 2000
—\ 2 2 0 0
TEST NO. DATE
S P E C I F I E D CONC. STRENGTH
AVE. CONC.STRENGTH
AVE. SLUMP
•FORM THICKNESS
RATE OF POUR
POWER OF VIBRATOR
PERIOD OF VIBRATION
DEPTH OF VI B. IMMERSION
CONC. TEMPERATURE AMBIENT TEMPERATURE
. PRESSURE FR CELL 1 X PRESSURE FR CELL 2 Q PRESSURE FR CELL 3
1 3
+ A
2 2.12
4 0 0 0 4 7 3 9
2-5
11
20
3 0 1
4 8
4 6
.77
PSI
PSI
INCH.
INCH.
FT/HR
H.P SECS
M E T R E ' F 9
PRESS FR CELL 4-
PRESS.FR CELL 5
HYDROSTATIC L I N E
FlG.6-13b RELATION BETWEEN PRESSURE & CONC. HEAD
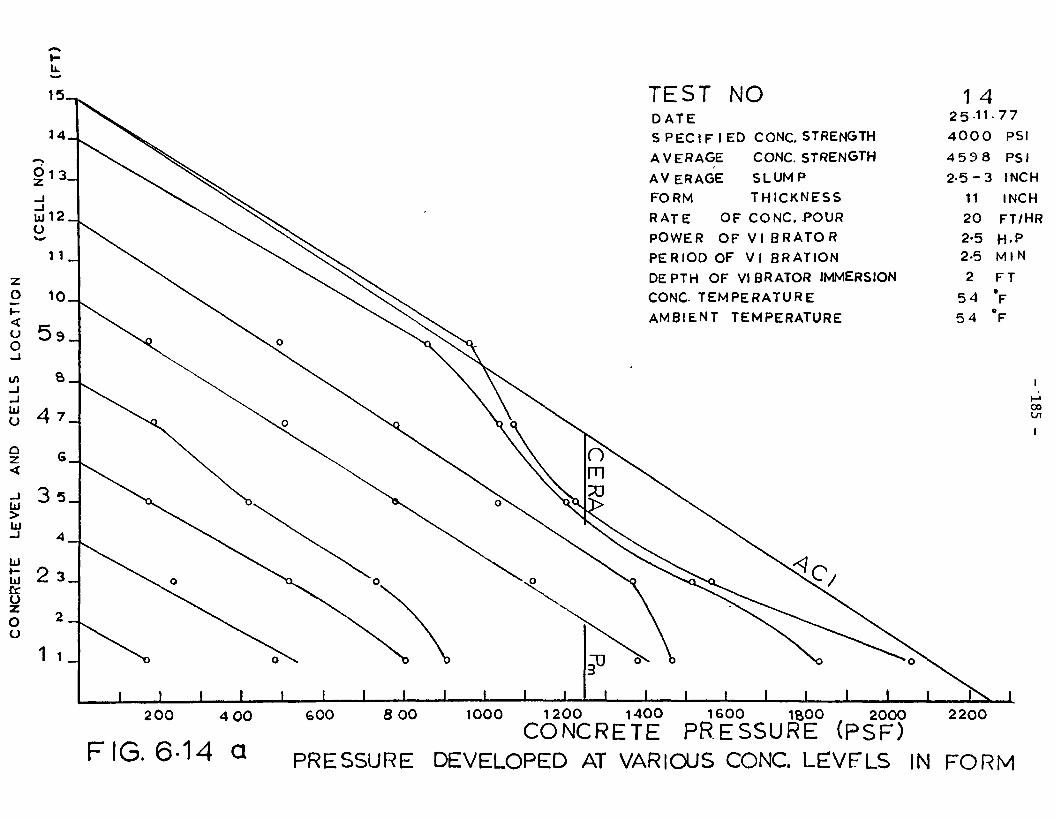
h.
TEST NO DATE S P E C I F I E D CONC. STRENGTH
AVERAGE CONC. STRENGTH
AVERAGE SLUMP
FORM THICKNESS
RATE OF CONC. POUR
POWER OF VI BRATOR
PERIOD OF V I BRATION
DEPTH OF VIBRATOR IMMERSION
CONC TEMPERATURE
AMBIENT TEMPERATURE
2 0 0 4 0 0
FIG. 6-14 a
6 0 0
1 4 25-11 4 0 0 0
4 5 9 8
2 - 5 - 3
11
2 0
2-5 2-5
2
5 4
5 4
7 7
PSI
PSI INCH
INCH FT/HR
H.P M I N
FT • F
V
00
8 00 1000 1200 1400 1600 1800 2000 2200
CONCRETE PRESSURE (PSF) PRESSURE DEVELOPED AT VARIOUS CONC. LEVFLS IN FORM

CONCRETE PRESSURE (PSF) 200 4 0 0 600
~~r~ 8 0 0 1000 1200 1400
—1 1600 1800 2000 2200
1
TEST DATE
S P E C I F I E D CONC. STRENGTH
AVE. CONC.STRENGTH
AVE. SLUMP
;FORM THICKNESS
RATE OF POUR
POWER OF VIBRATOR
PERIOD OF VIBRATION
DEPTH OF V| B. IMMERSION
CONC. TEMPERATURE AMBIENT TEMPERATURE
. PRESSURE FR CELL 1 PRESSURE FR CELL 2
14 25.11-77
4 0 0 0 PSI
4 5 9 8 PSI
2 5 - 3 INCH.
11 INCH.
PRESSURE CELL 3
20
2-5
2-5
2
5 4
5 4
+ PRESS. FR CELL
A PRESS. FR CELL
FT/HR
H.P
M I N
FT
° F
• F
HYDROSTATIC L I N E
s CTN
4-
5
FIG..6-14b RELATION BETWEEN PRESSURE & CONC. HEAD

U.
TEST NO DATE S PEC I F I ED CONC. STRENGTH
AVERAGE CONC. STRENGTH
AVERAGE SLUMP
FORM THICKNESS
RATE OF CONC. POUR
POWER OF V I BRATOR
PERIOD OF V I BRATION
DEPTH OF VIBRATOR IMMERSION
CONC. TEMPERATURE
URE
2 0 0 4 0 0 6 0 0 8 0 0 1000 1 2 0 0 1 4 0 0 1 6 0 0 1800 2 0 0 0
CONCRETE PRESSURE (PSF)
1 5 7.12
4 0 0 C 4 7 2 2
2-5
11
2 0 2»5
30 1
4 7
4 0 '
. 7 7
) PSI
PSI
I NCH
I NCH
FT/HR H.P
SECS METRE
°F
'F
h-1
oo
2200
F I G . 6 -15 a PRESSURE DEVELOPED AT VARIOUS CONC. LEVELS IN FORM

200
CONCRETE PRESSURE (PSF) 8 0 0 1000 1200 1400 1600 1800 2 0 0 0
-~T 2 2 0 0
1
TEST NO. DATE
S P E C I F I E D CONC. STRENGTH
AVE. CONC.STRENGTH
AVE. SLUMP
;FORM THICKNESS
RATE OF POUR
POWER OF VIBRATOR
PERIOD OF VIBRATION
DEPTH OF V| B. IMMERSION
CONC. TEMPERATURE AMBIENT TEMPERATURE
. PRESSURE FR CELL 1 x PRESSURE FR CELL 2 0 PRESSURE FR CELL 3
1 5 7.12.77
4 0 0 0 PSI 4 7 2 2
2-5
11
20
2-5
30 1
4 7
4 0
+ PRESS FR CELL 4-
A PRESS. FR CELL 5
PSI
INCH.
INCH.
FT/HR
H.P
SECS
METRE
° F
° F
oo 00
HYDROSTATIC L I N E
FIG.6-15b RELATION BETWEEN PRESSURE & CONC. HEAD
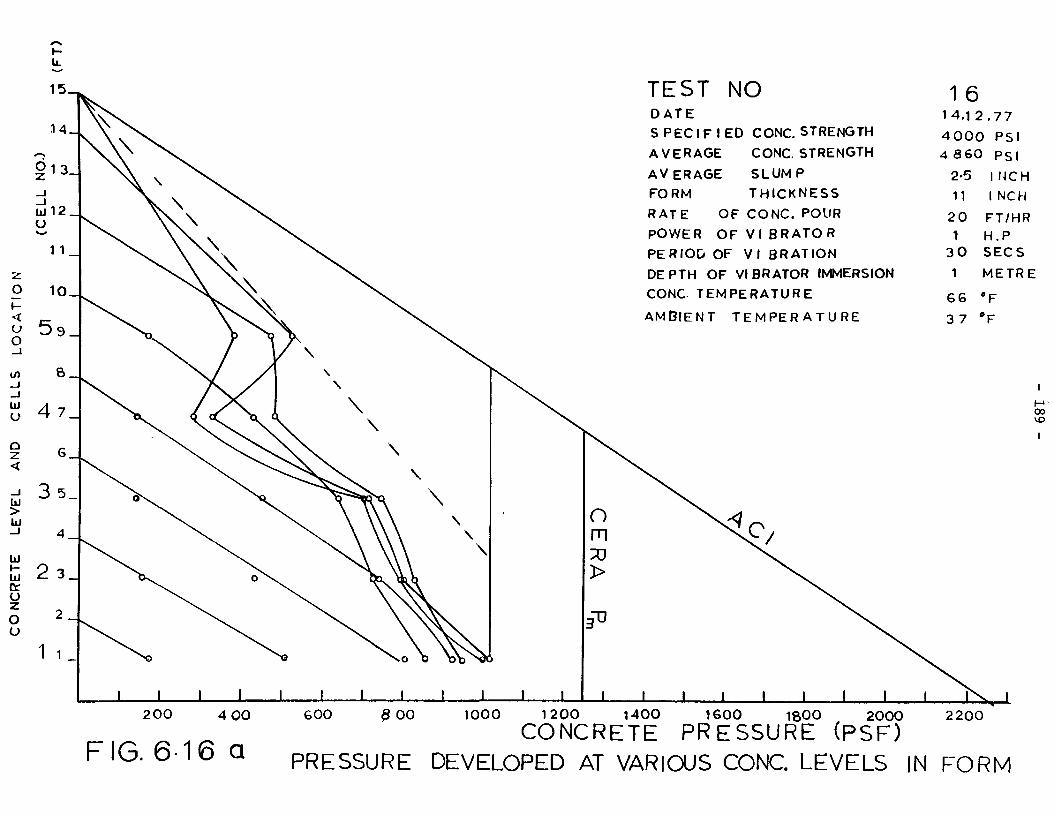
Ii.
V v\
\
\ \
A s\
^
^
\
\
\
\
\
\
\
\ \ \
i ±
O
m
> 33
TEST NO
C
16 D A T E S P E C I F I E D CONC. STRENGTH
AVERAGE CONC. STRENGTH
AVERAGE SLUMP
FORM THICKNESS
RATE OF CONC. POUR
POWER OF V I BRATOR
PERIOD OF V I BR AT ION
DEPTH OF VIBRATOR IMMERSION
CONC TEMPERATURE
AMBIENT T E M P E R A T U R E
1 4 . 1 2 . 7 7
4 0 0 0 PSI 4 8 6 0 PSI
2-5
11
2 0 1
3 0
1
6 6
3 7
I NCH
I NCH
FT/HR H.P SECS
METRE
°F °F
± ± ± ± 200 4 00 600 8 00 1000 1200 1400 1600 1800 2000
CONCRETE PRESSURE (PSF) 2200
F I G . 6 - 1 6 a PRESSURE DEVELOPED AT VARIOUS CONC. LEVELS IN FORM

200 4 0 0 6 0 0
CONCRETE PRESSURE (PSF) 800 1000 1200 1400 1600 1800 2000 2200
T T T T T T T T T 1
TEST NO. DATE S P E C I F I E D CONC. STRENGTH
AVE. CONC.STRENGTH
AVE. SLUMP
^ORM THICKNESS
RATE OF POUR POWER OF VIBRATOR
PERIOD OF VIBRATION DEPTH OF VI B. IMMERSION
CONC. TEMPERATURE AMBIENT TEMPERATURE
. PRESSURE FR CELL 1 x PRESSURE FR CELL 2 0 PRESSURE FR CELL 3
1 6 14.12.77
4 0 0 0 PSI 4 8 6 0
2*2 5
11
20
1
3 0
PSI
INCH.
INCH.
FT/HR
H.P
SECS
1 METRE
6 6 3 7 r ,
+ PRESS FR CELL 4-
A PRESS. FR CELL 5
8 F
° F o
HYDROSTATIC L INE
FIG.6-16b RELATION BETWEEN PRESSURE &CONC. HEAD

TEST NO
J_ J_
o m 70 >
P
DATE S P E C I F I E D CONC. STRENGTH
AVERAGE CONC. STRENGTH
AVERAGE SLUMP
FORM THICKNESS
RATE OF CONC. POUR
POWER OF V I B R A T O R
PERIOD OF V I BR AT ION
DEPTH OF VIBRATOR IMMERSION
CONC. TEMPERATURE
AMBIENT T E M P E R A T U R E
J c /
J_ _L _L J_ ±
1 7 2 2 . 3 , 7 §
4 0 0 0 PSI
4 9 8 0 PSI
11
2 0 1
3 0
1
5 4
4 6
I NCH
I NCH
FT/HR H.P
SECS
METRE
°F
*F
_r 2 0 0 4 0 0
FIG. 6-17 a
6 0 0 8 0 0 1000 1 2 0 0 1400 1600 1800 2000 2 2 0 0
CONCRETE PRESSURE (PSF) PRESSURE DEVELOPED AT VARIOUS CONC. LEVELS IN FORM

200 4 0 0 6 0 0
CONCRETE PRESSURE (PSF) 800 1000 1200 1400 1600 1800 2000 2200
T T T T T T T
NO. TEST DATE
S P E C I F I E D CONC. STRENGTH
AVE. CONC.STRENGTH
AVE- SLUMP
.FORM THICKNESS
RATE OF POUR
POWER OF VIBRATOR
PERIOD OF VIBRATION
DEPTH OF VI B. IMMERSION
CONC. TEMPERATURE
AMBIENT TEMPERATURE . PRESSURE FR CELL 1 X PRESSURE FR CELL 2 Q PRESSURE FR CELL 3
1 7 2 2 . 3 . 7 8 4 0 0 0 PSI 4 9 8 0 2-7 5
11 • 20
1 3 0 1
5 4 4 6
+ PRESS FR CELL 4-
A PRESS. FR CELL 5
PSI
INCH.
INCH.
FT/HR
H.P
SECS M
METRES
°F i
• F
HYDROSTATIC L INE
FIG.617b RELATION BETWEEN PRESSURE & CONC. HEAD

C O N C R E T E PRESSURE ( P S F )
4 0 0 2 0 0
—r~ 1 2 0 0
1 1 4 0 0
—r~
TEST NO. DATE
SLUMP
STRENGTH OF CONC.
POWER OF VIBRATOR PERIOD OF VIBRATION
DEPTH OF VIB.IMMER.
CONC TEMPERATURE
• CELL 1 + CELL
"CELL 2 .A CELL
©CELL 3
31.8.77
2-5
45 00 1
2-5
2
71
4
5
INCH
PSI H.P MIN
FT.
• F
SHEAR P R E S S U R E
L A T E R A L P R E S S U R E
FIG. 6-18 V A R I A T I O N OF SHEAR AND LATERAL CONCRETE PRESSURES WITH CONC. HEAD
«3

C O N C R E T E
4 0 0 2 0 0
PRESSURE ( P S F )
2 0 0 4 0 0 6 0 0 BOO T "
1 0 0 0 1
1 2 0 0 1 —
1 4 0 0
TEST NO. DATE
SLUMP
STREGTH OF CONC.
POWER OF VIBRATOR
PERIOD OF VIBRATION
OEPTH OF VIB.IMMER.
CONC TEPERATURE
8 12 .8 .77
2-75 (NCH
4 4 92 PSI
•CELL 1
-CELL 2
©CELL 3
+ CELL A CELL
1 5 1
6 8
4
5
H.P MIN METRE
°F
SHEAR
L A T E R A L
P R E S S U R E
P R E S S U R E
FIG. 6-19 V A R I A T I O N OF SHEAR AND LATERAL CONCRETE PRESSURES WITH CONC. HEAD

C O N C R E T E
4 0 0 r—
2 0 0 — I —
PRESSURE ( P S F )
2 0 0 4 0 0 6 0 0 8 0 0 ~~T~
1 0 0 0 1
1 2 0 0 1
1 4 0 0
TEST NO. DATE
SLUMP
STREGTH OF CONC.
POWER OF VIBRATOR PERIOD OF VIBRATION
DEPTH OF VIB.IMMER.
CONC TEPERATURE
• CELL 1 + CELL "CELL 2 .ACELL
©CELL 3
b 2-5 INCH
4456 PSI 1 H.P
0-5 MIN
1 METRE
*F
4
5
SHEAR P R E S S U R E
. L A T E R A L P R E S S U R E
FIG. 6-20 VARIATION OF SHEAR AND LATERAL CONCRETE PRESSURES WITH CONC. HEAD

4 00
CONCRETE PRESSURE (PSF)
2 00 2 00 4 0 0 600 8 0 0 1 0 0 0 T i r
1 2 0 0 1
1 4 0 0
TEST NO. DATE SLUMP STREGTH OF CONC. POWER OF VIBRATOR PERIOD OF VIBRATION DEPTH OF VIB.IMMER. CONC TEPERATURE
• CELL t * CELL "CELL 2 .A CELL ©CELL 3
1 26.8 .77
2-5 INCH 5 3 0 5 PSI
1 H.P 0-5 MIN
2 FT. 71 °F
4
5
SHEAR PRESSURE g LATERAL PRESSURE .
FIG. 6-21 V A R I A T I O N OF SHEAR AND LATERAL CONCRETE PRESSURES WITH CONC HEAD

C O N C R E T E
4 0 0 2 0 0
PRESSURE ( P S F )
2 0 0 4 0 0 6 0 0 1 0 0 0 1 2 0 0
r T 1 4 0 0
—r~
TEST NO. 2 DATE 2 8 . 7
SLUMP 2-5
STREGTH OF CONC. 4 315
POWER OF VIBRATOR 1 PERIOD OF VIBRATION 2-5
DEPTH OF VIB.IMMER. 2
CONC TEPERATURE 7 4
77
INCH
PSI H.P MIN FT
• F
•CELL 1
"CELL 2
©CELL 3
SHEAR
— L A T E R A L
* CELL 4 A CELL 5
P R E S S U R E
P R E S S U R E
FIG. 6-22 V A R I A T I O N OF SHEAR AND LATERAL CONCRETE PRESSURES WITH CONC. HEAD

4 0 0
C O N C R E T E PRESSURE ( P S F )
2 0 0 2 0 0 4 0 0 6 0 0 T
FIG. 6-23 V A R I A T I O N CONCRETE
8 0 0 1
1 0 0 0 1 1
1 2 0 0 1 4 0 0 i l i l 1
TEST NO. DATE
SLUMP
STREGTH OF CONC.
POWER OF VIBRATOR PERIOD OF VIBRATION
DEPTH OF VIB.IMMER.
CONC TEPERATURE
• CELL 1 + CELL «CELL 2 .A CELL
©CELL 3
18 21.7.77
Z-5
4 5 2 0 1
0*5
2
7 5
4
5
INCH
PSI H.P MIN FT.
°F
u. SHEAR P R E S S U R E g
— L A T E R A L P R E S S U R E i
OF SHEAR AND LATERAL PRESSURES WITH CONC. HEAD
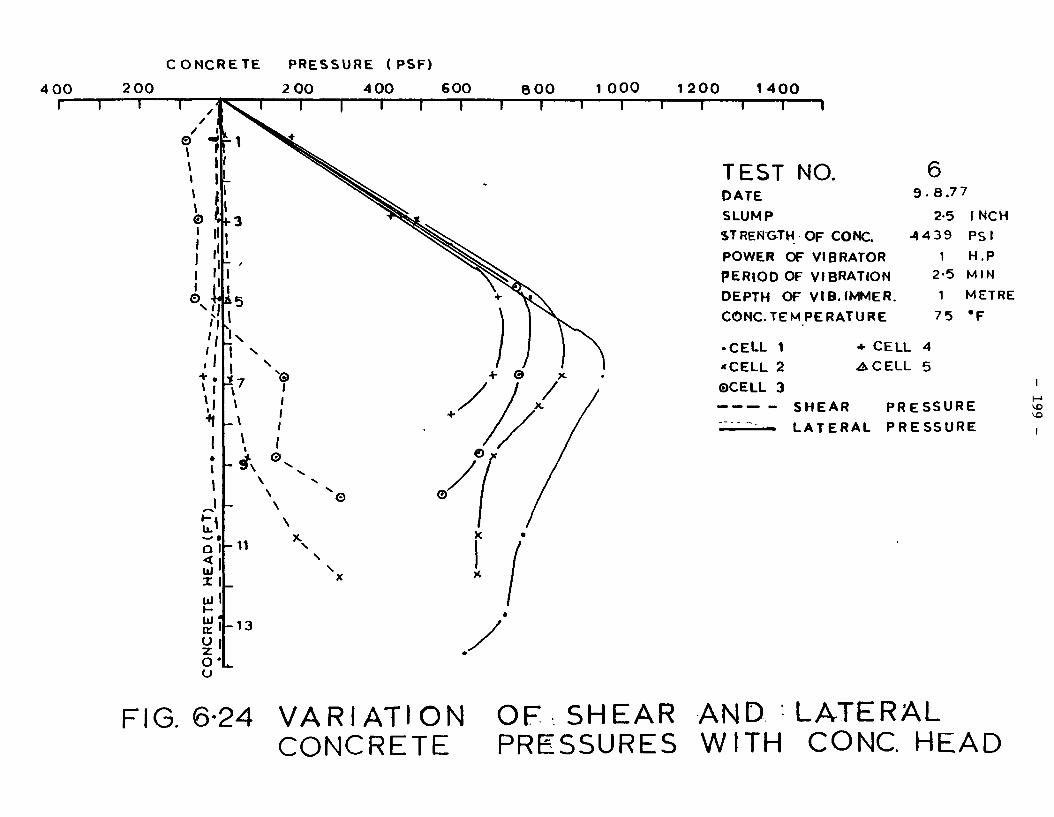
CONCRETE
4 00 |—
2 0 0 — I —
PRESSURE (PSF)
2 00 4 00 600 8 0 0 1 0 0 0 1 2 0 0 1 —
1 4 0 0 I—
TEST NO. DATE
SLUMP
ST RENC-TH OF CONC.
POWER OF VIBRATOR
PERIOD OF VIBRATION
DEPTH OF VIB.IMMER.
CONC-TEMPERATURE
6 9 . 8 . 7 7
2-5 INCH
4 4 3 9 PSI
1 H.P 2-5 MIN
1 METRE
75 ' F
•CELL 1
"CELL 2
©CELL 3
* CELL .A CELL
4 5
SHEAR
L A T E R A L
P R E S S U R E
P R E S S U R E U3
FIG. 6-24 V A R I A T I O N OF SHEAR AND • LATERAL CONCRETE PRESSURES WITH CONC. HEAD

CONCRETE PRESSURE (PSF) 1 0 0 0 1 2 0 0
i 1 I L _ 1 4 0 0 1 6 0 0
1 1 L__ 1 8 0 0 2 0 0 0 2 2 0 0
1 I I | I
sTEST NO 9 e
( 2-5 H-P-30 S S-2-73°F)
^ T E S T N O 11(2-5H-P-30SECS-2M-62°F
s-TEST N O . 8 (1 H-P-30SEC S-1M-68 F)
z T E S T N O 1 0 ( 25HP 25MLN-2)
r-TEST NO 12 ( 2 5 H P 25MIN 1M 5 4 F )
o o
FlG.6-25 COMPARISON OF PRESSURE ENVELOPES AT 1 FT ELEVATION OF THE FORM ( 5 4 t o 7 1 ° F )

2 0 0 I
4 0 0 L—
6 0 0 8 0 0 1 0 0 0 I
1200 I
1 4 0 0 1 6 0 0 1 8 0 0 2 0 0 0 2 2 0 0 __l I I I I I I I I
2 _
4 _
6
8 _
1 0
1 2
1 4 _
(1HP-5M-2")TEST NO- 4-
(IH-P-3OS2.)TEST NO- 1 -
- [1 HP-3-5M-lM)T E S T N O . T s
(1HP.25M.1M1
TEST N06 (1H-P-2-5M 2') A
TESTN0.2/-Z
TESTNO.8 (1HP 5 M I N 1M 68°F)
T E S T N O . 5 _( 1 HP-30 SECS-1 N»ET~71°F)
T E S T N O . 1 1 (25HP-30SECS-1MET-62°F)
N O . 1 2 (2-5H.P-2.5MIN-1MET-54°F)
N O . 1 0 (25H-P 2-5MIN 2FT-65°F)
N O - 9 (2-5H-P-30SECS-2FT-73F)
•NO 3 (1H-P 3'MIN 2FT 71°F)
O h-1
FIG. 6-26 COMPARISON OF PRESSURE ENVELOPE AT 3FT ELEVATION OF FORM

T E S T N O . 7 (1HP-35MIN-1MET-72F-)
Q (1 HP~5MlN-1MET-6eTF)
(25HP-30SECS -2FT-73F)
- ]2 (2-5HP-2-5MIN-1MET-54F)
1 1 1 1 T 200 4 0 0 600 800 1000 1200 1400
PRESSURE (PSF) 1600 1800 2000 2 2 00
o
FIG.6-27 COMPARISON OF PRESSURES AT DIFF VIBRATION PARAMETERS,

- 9 »-ui UJ u.
0. UJ Q
UJ >— UJ 5 IX
o Z
o
TESTNOI^ (1 HP-0.5M-2'-71°F)
TESTN02' (1 HP-2-5M-2-74°F)
3 _
1 _
2 0 0 — I 6 0 0
( a )
-TEST NO 3(1H-P-3W)
•*T E ST N O 9< 25H-p-csM-ir
^ T E S T N O I O u (2-5H-P-2-5M-2')
1 0 0 0 1
1 4 0 0 I 8 0 0 2 2 0 0
PRESSURE (PSF)
T E S T N O 5(1HB0-5M-3-25)
TEST NO 6 (1HP-2-5M-3-2 5 )
O
TEST N011 (2-5HP0-5M 3-2 5 ,-62°F)
TEST NO 12 , (25HP-2«M-M5 ,^4^)
10 00 1 8 0 0 2 2 0 0
P R E S S U R E ( P S F )
FIG.6-28 EFFECT OF POWER OF VIBRATOR ON CONC. PRESSURE

ho O
200 i 1 r
400 PRESSURE
l r 1 1 r 800 1200 1600
PRESSURE ( PSF) 2000
F l G . 6 - 2 9 EFFECT OF DURATION OF VIBRATION ON CONCRETE PRESSURE
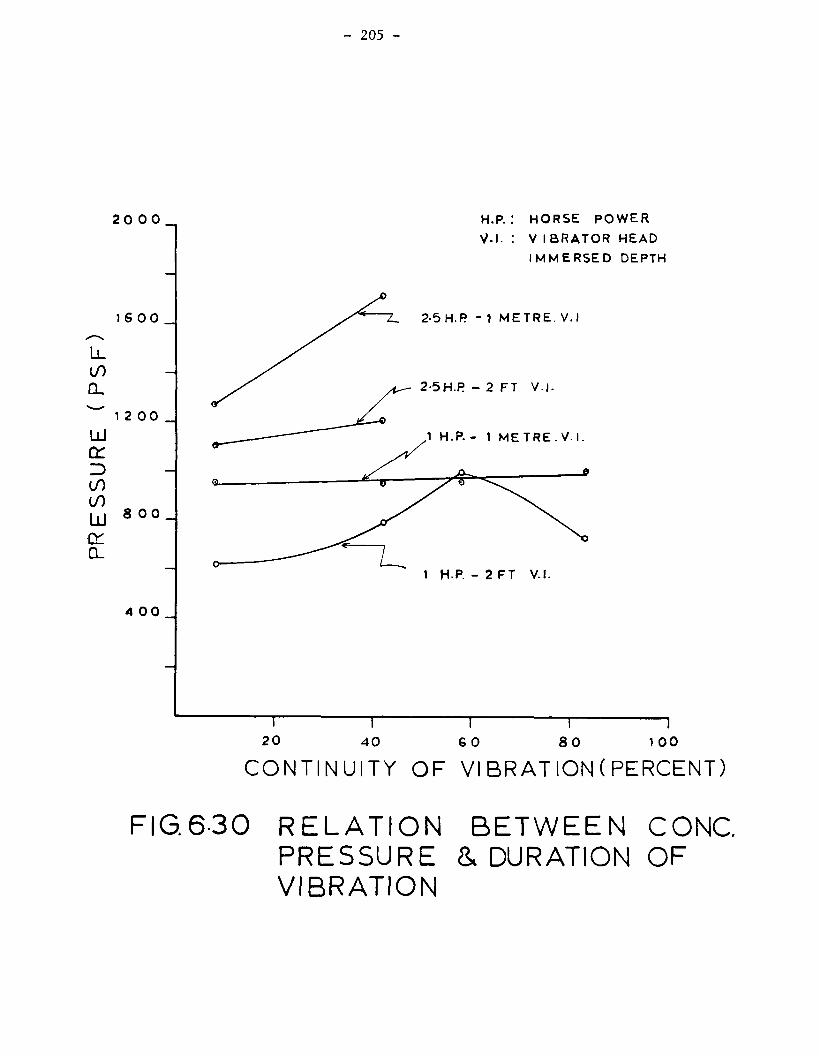
- 205 -
2 0 0 0
1 6 0 0 _
LL CO Q_
^ 1 2 0 0
LU
cr LO
LU s o o j cr Q_
4 0 0
H.P. : HORSE POWER
V. I . : V IBRATOR HEAD
IMMERSED DEPTH
7_ 2-5 H.P - 1 METRE. V.I
2-5H.R - 2 FT V-l-
1 H.P. - 1 METRE. V. I .
1 HP. - 2 FT V.I.
2 0 4 0 6 0 8 0 1 0 0
CONTINUITY OF VI BRAT ION ( PERCENT)
FIG.630 RELATION BETWEEN CONC PRESSURE & DURATION OF VIBRATION

15
13_
1 1 1 1 1 1 i r 600 1000 1400 1800 CONCRETE PRESSURE (PSF)
2200
FIG.6-31 E F F E C T OF DEPTH OF
CONCRETE PRESSURE
(b)
to o as
- M O
1
I i0 CM
r*Vn u.
?2 O UJ
± in CM
o io . - O O CM
UJ™ I - Q -
cci
c\i o <*» z
in CM
I a. ± CM
L,
^
T - ^—i 1—"—i 1 r 400 800 1200 1600 2000
CONCRETE PRESSURE (PSF)
VIBRATOR IMMERSION ON

2 0 0 4 0 0 6 0 0 - 8 0 0 1 0 0 0 PRESSURE ( PSF )
12 0 0
F I G . 6 - 3 2 EFFECT OF TEMPERATURE OF CONCRETE
< m _ i
CM
z 1 in CM
1
N5 O ^i
*"-S
0^
in CM
m 1 m o Q.
I
m ~ O z i-
US \-*-<
1 1
i
0. ^S. I s. ^ s ^ in \ ^^^ CM
\ . ^ S . w ^ ^ ^ ^ t
S\ Tin^
OUJ
^T in <S
1 1 1
O >. z ^ v y-
\ . US ^ V H-
1 1
*J
1 1 1400 1600 1800 2 0 0 0 2 2 0 0
ON LATERAL PRESSURE

- 208 -
u — 1 0 0
O cr Q 8° > -I
LU U cr LU CL
LU
cr Z) I/) (/) LU
cr Q_
6 0
4 0
20 _
H.P. : HORSE POWER
V . I . : V I BRATOR HEAD
IMMERSED DEPTH
2-5 H.P - 1 MET V.I
2-5 H P - 2 FT V . I .
1 H. P. - 2 FT . V . I.
2 0 I
4 0 6 0 —r 8 0 1 0 0
CONTINUITY OF VI BRATION (PERCENT)
F I G 6 -33 RELATION BETWEEN PERCENT HYDROSTATIC PRESSURE & CONTINUITY OF VIBRATION

•- 209 -
(/I I/) LU cr cr (J 1 0 0
L0
O cr Q > -
T.
o< h- x
LU UJ
US LUS
u.
LU *
^ S
(/) o LU LT Q_
8 0 _
6 0
4 0 _
2 0 _
2-5 MIN - 1 METRE V I
3 0 S E C S - 1 METRE .V.I.
2-5 MIN 2 FT V.I .
30SECS 2 FT V . I .
1 1 1 r
POWER OF2 VIBRATOR (H.P)
F I G 6 - 3 4 RELATION BETWEEN CONC. PRESSURE (% HYDROSTATIC) AND POWER OF VIBRATOR
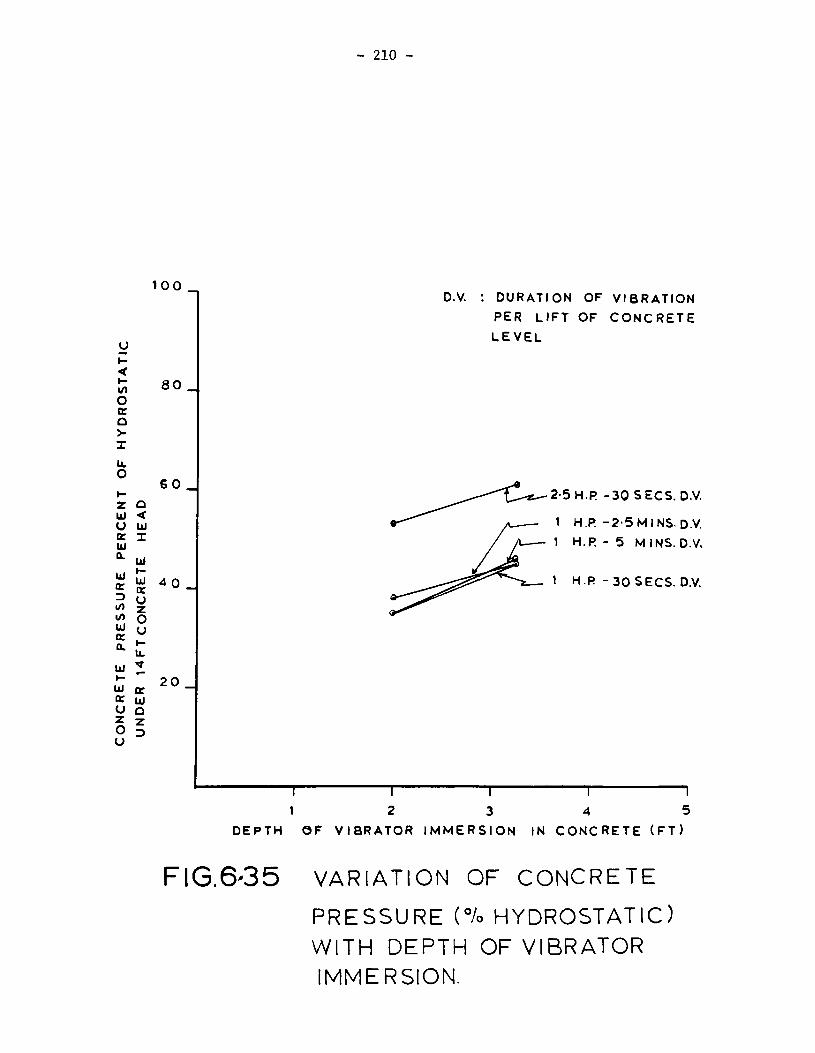
- 210 -
0 0 D.V. : DURATION OF VIBRATION
PER LIFT OF CONCRETE
LEVEL
8 0 _
6 0
4 0 _
2-5 H.R - 3 0 SECS. D.V.
1 H.P -2 -5 M INS. D.V. 1 H.P. - 5 M INS. D.V
1 H.R -30SECS. D.V.
2 0
, ! , j ,
1 2 3 4 5
DEPTH OF VIBRATOR IMMERSION IN CONCRETE ( F T )
FIG.6-35 VARIATION OF CONCRETE
PRESSURE (% HYDROSTATIC) WITH DEPTH OF VIBRATOR IMMERSION.

VITA
NAME Amjid Rauf QURESHI
BORN Peshawar, North West Frontier Province, Pakistan
EDUCATED
Primary
Presentation Convent School, Peshawar, 1953-58
Secondary
St. Mary's Cambridge School, Peshawar, Pakistan, 1958-1965
Pre-Engineering
Edward's College, Peshawar, Pakistan, 1965-1967
University
University of Peshawar, Pakistan, 1967-1971
Course
Civil Engineering B.A.Sc, September 1971
University
University of Ottawa, Ottawa, Canada, 1977-1978
Course
M.A.Sc, 1978
EXPERIENCE
Senior Field and Planning Engineer Cementation Intrafdr Ltd Tarbela Dam Project, Pakistan September 1971 - February 1974
Assistant Engineer Buildings and Roads Public Works Department N.W.F.P., Pakistan February 1974 - May 1976