the effect of using tqlr (tune question listen
TRANSCRIPT

THE EFFECT OF USING TQLR (TUNE QUESTION LISTEN
AND REVIEW) STRATEGY TOWARD LISTENING
COMPREHENSION OF THE FIRST YEAR
STUDENTS AT JUNIOR HIGH
SCHOOL YKPP
DUMAI
By
SHELFIANY FRUARSIH
NIM. 10814002449
FACULTY OF EDUCATION AND TEACHER TRAINING
STATE ISLAMIC UNIVERSITY OF SULTAN SYARIF KASIM RIAU
PEKANBARU
1432 H/2011 M

THE EFFECT OF USING TQLR (TUNE QUESTION LISTEN
AND REVIEW) STRATEGY TOWARD LISTENING
COMPREHENSION OF THE FIRST YEAR
STUDENTS AT JUNIOR HIGH
SCHOOL YKPP
DUMAI
Thesis
Submitted as a Partial Fulfillment of the Requirements
for Getting Bachelor Degree in of Education
(S.Pd.)
By
SHELFIANY FRUARSIH
NIM. 10814002449
DEPARTMENT OF ENGLISH EDUCATION
FACULTY OF EDUCATION AND TEACHER TRAINING
STATE ISLAMIC UNIVERSITY OF SULTAN SYARIF KASIM RIAU
PEKANBARU
1432 H/2011 M

i
SUPERVISOR APPROVAL
The thesis entitled “The Effect of using TQLR (Tune, Question, Listen
and Review) Strategy toward Listening Comprehension of the First Year Students
at Junior High School YKPP Dumai”, is written by Shelfiany Fruarsih, NIM.
10814002449. It is accepted and approved to be examined in the meeting of the
final examination committee of undergraduate degree at Faculty of Education and
Teacher Training of State Islamic University of Sultan Syarif Kasim Riau.
Pekanbaru, Jumadil Akhir 13, 1433 HMay 03, 2012 M
Approved by
The Chairperson of English
Education Department Supervisor
Dr. Hj. Zulhidah, M.Pd. Riri Fauzana M.Sc.

ii
EXAMINER APPROVAL
The thesis entitled “The Effect of Using TQLR (Tune, Question, Listen and
Review) Strategy toward Listening Comprehension of the First Year Students at
Junior High School YKPP Dumai”, is written by Shelfiany Fruarsih, NIM.
10814002449. It has been approved and examined by the final examination
committee of undergraduate degree at the Faculty of Education and Teacher
Training of State Islamic University Sultan Syarif Kasim Riau on Rajab 28, 1433
H/June 18, 2012 M as one of requirements for Undergraduate Degree (S.Pd.) in
English Education.
Pekanbaru, Rajab 28, 1433 H
June 18, 2012 M
Examination Committee
Chairperson Secretary
Dr. Hj. Helmiati, M.Ag. Dr. Hj. Zulhidah, M.Pd.
Examiner I Examiner II
Drs. H. Kalayo Hasibuan, M.Ed-TESOL. Dr. Hj. Zulhidah, M.Pd.
Dean
Faculty of Education and Teacher Training
Dr. Hj. Helmiati, M.Ag.
NIP. 197002221997032001

v
ACKNOWLEDGMENT
االله الرحمن الرحیممبس
By the name of Allah Almighty, the Lord of the world, who has been
giving the writer His guidance, mercy, blessing, and health to complete this
academic requirement. Shalawat and salam forever to a noble character, the
prophet Muhammad SAW who has brought the human beings from the darkness
to the lightness and from the bad character to the good one.
This project paper is intended to complete a partial requirement for the
award of undergraduate degree in English Education Department of Education
and Teacher Training Faculty of State Islamic University of Sultan Syarif Kasim
Riau. The title of this project paper is “The Effect of Using TQLR (Tune,
Question, Listen and Review) Strategy toward Students’ Listening
Comprehension at the First Year of Junior High School YKPP Dumai”.
The writer realizes that there are many weaknesses on this project paper.
Therefore, constructions and suggestions are needed very much to improve this
project paper. A lot of thanks to who have given moral and material supports to
the writer. Thus, the writer expresses her gratitude and sincere thanks to:
1. Prof. Dr. H. M. Nazir, the Rector of State Islamic University of Sultan
Syarif Kasim Riau for his kindness and encouragement.
2. Dr. Hj. Helmiati, M.Ag, the Dean of Education and Teacher Training
Faculty for her kindness and encouragement.
3. Dr. Hj. Zulhidah, M.Pd, as the Chairperson of English Education
Department for their kindness and encouragement.
4. Dedy Wahyudi , M. Pd, the secretary of English Education Department.
5. Riri Fauzana, M.Sc, as the writer’s supervisor for his invaluable
assistance, guidance, encouragement, persistence, helpful and valuable
suggestions and advice that has encouraged and motivated the writer to
complete this project paper.

vi
6. All lecturers who have given knowledge, information of this project
paper, contributions and supports during the courses.
7. The head master of Junior High School YKPP Dumai, Jasman Zainudin,
S.Pd, and also all of the teacher, especially for English teacher, Dhini
Dwifasari, S.Pd who has helped the writer in the process of collecting
data,
8. My beloved parents, M.Saleh and Rosmiani who have given meaningful
and useful supports, both material and spiritual. Thanks a lot for your
praying. You are my hero and angel in my life. I love you forever.
9. My beloved sister and brother, Rosshalia, M.Riski Putra Pratama,
M.Zidan Ramadhan for their support and praying. I love you.
10. My beloved family in Pekanbaru, Syahril, S.Pd and Ida Suryani, M.Pd
who have given meaningful and supports. Yuli, Izul and Ilham, thanks a
lot for your support. And also my big family.
11. My best friends, Fanny, Wulan, Rina, Era, Mbk Ida, Rita, Norma and
Yenni for their kindness and motivations.
12. My classmates of class A of English Education Department who have
given me motivation and support. You are the best friends.
Finally, this thesis is still far from perfect. Therefore, constructive
comments, critiques, suggestions will be appreciated very much.
“May Allah Almighty bless you, bless me, and bless us”
العالمینامین یا ربّPekanbaru, 03 May 2012
The Writer,
Shelfiany FruarsihNIM. 10814002449

iv
Abstrak
SHELFIANY FRUARSIH (2012) : Pengaruh Penerapan Strategi TQLR(Tune, Question, Listen and Review)terhadap Pemahaman Mendengar SiswaPada Siswa Kelas Satu SMP YKPP Dumai
Mendengar adalah keahlian yang memegang peranan yang sangat pentingdi dalam sebuah kelas pembelajaran bahasa asing termasuk bahasa Inggris.Dengan mendengar siswa mampu mendapat informasi dan pengetahuan dari guruatau teman mereka. Dan mendengar juga mampu memberikan pengetahuankepada siswa tentang bahasa Inggris sesuai yang mereka harapkan. Namun,harapan tampaknya belum dapat direalisasikan. Salah satu faktor dominan adalahstrategi dalam mengajar. Dalam hal ini strategi TQLR adalah strategi yang tepatuntuk meningkatkan pemahaman mendengar siswa, karena strategi ini melibatkansiswa untuk saling berdiskusi dan lebih banyak mendengar untuk meningkatkankemampuan mendengar mereka.
Tujuan dari penelitian ini adalah untuk menemukan bagaimanapemahaman mendengar siswa yang diajarkan dengan strategi TQLR, kemudianmenemukan bagaimana pemahaman mendengar siswa yang diajarkan denganstrategi biasa dan terakhir menemukan ada atau tidaknya pengaruh yangsignifikan dari strategi TQLR (Tune, Question, Listen and Review) terhadappemahaman mendengar pada siswa kelas satu SMP YKPP Dumai.
Penelitian ini adalah jenis penelitian eksperiment semu tipe Non-equvalentControl Group Design. Adapun populasi dari penelitian ini adalah semua siswakelas satu SMP YKPP Dumai yang terdiri dari 151 siswa, dan terdiri dari empatkelas. Sampel dari penelitian ini adalah kelas; VIIB dan VIIC. VIIB sebagaikelompok eksperimen yang diajar dengan strategy TQLR dan kelas VIIC sebagaikelas control yang diajar dengan strategy biasa.
Temuan penelitian menunjukkan bahwa peningkatan dapat dilihat dariskor uji-t. Total skor t-tes adalah 2,89. Berdasarkan t-tabel, 2.00 <2.89> 2.65.Oleh karena itu, dapat disimpulkan bahwa ada pengaruh yang signifikan darimenggunakan strategi TQLR terhadap pemahaman mendengar pada siswa kelassatu SMP YKPP Dumai.

vii
THE LIST OF CONTENTS
SUPERVISOR APPROVAL................................................................i
ABSTRACT ...........................................................................................ii
ACKNOWLEDGMENT ......................................................................v
THE LIST OF CONTENTS.................................................................vii
THE LIST OF TABLES.......................................................................ix
THE LIST OF APPENDICES .............................................................x
CHAPTER I. INTRODUCTION.........................................................1
A. Background of the Problem………………………...1B. The Problems............................................................4
1. The Identification of the Problems……………..42. The Limitation of the Problem............................53. The Formulation of the Problem.........................5
C. The Objectives and significance of the Research.....61. The Objectives of the Research ……………….. 62. The Significance of the Research ……………... 6
D. The Definition of the Terms ......................................7
CHAPTER II. REVIEW OF RELATED LITERATURE ................10
A. Theoretical Framework .............................................101. The Nature of Listening ……………...………...102. Characteristic of Listening...................................113. Concept of Listening Comprehension ................134. The Listening Proses ...........................................145. Teaching Listening..............................................176. The procedures of TQLR Strategy......................197. Teaching Listening by Using TQLR Strategy ......21
B. Relevant Researchs ...................................................25C. Operational Concept..................................................27D. Assumption and Hypothesis......................................29

viii
CHAPTER III. RESEARCH METHODOLOGY ............................30
A. Method of the Reasearch...........................................30B. Time and Location of the Research ..........................31C. The Subject and Object of the Research ...................32D. The Population and Sample of the Research............32E. The Technique of Data Collection ...........................33F. The Procedures of the Research ...............................34G. The Technique of Analyzing Data ...........................34H. Validity of the Instrument ........................................36I. Reliability of the Instrument.....................................38
CHAPTER IV. DATA PRESENTATION ANDANALYSIS ................................................................40
A. The Description of the Research Instrument ............40B. The Data Presentation…………………………….. 40
1. Data Observation.............................................482. The Data of Pre-test and Post-test...................51
a. Data of Experimental Group.......................51b. Data of Control Group................................53c.The TQLR Strategy Toward Students’
Listening Comprehension At The FirstYear Of Junior High School YKPPDumai.........................................................58
C. The Data Analysis Technique ..................................671. Mean and Standard Deviation of Pre-test …. 682. Mean and Standard Deviation of Post-test … 703. Analysis of Experimental and Control
Group ……………………………………… 71
CHAPTER V. CONCLUSION AND SUGGESTION .......................75A. Conclusion................................................................75B. Suggestion ................................................................76
BIBLIOGRAPHYAPPENDICES

ix
THE LIST OF TABLES
Table III.1 Research Design ..................................................................31Table III.2 The Population of the research.............................................32Table III.3 Sample of the Research ........................................................33Table III.4 The categorizing Level of Scoring Listening
Comprehension …………………………………………… 36Table III.5 The Interpretation of Validity .............................................38Table III.6 The Interpretation of Reliability ..........................................39Table IV.1 Indicator I .............................................................................41Table IV.2 Indicator II ............................................................................41Table IV.3 Indicator III ...........................................................................42Table IV.4 Indicator IV...........................................................................42Table IV.5 Indicator V ............................................................................43Table IV.6 The Result of Pre Test in Control & Experimental Class ...48Table IV.7 Mean and Standard Deviation of Pre Test in
Experimental & Control Class ...........................................50Table IV.8 Distribution of the Data Experimental Class ........................52Table IV.9 The Normality Data Testing Experimental Class .................52Table IV.10 Distribution of the Data Control Class ...............................55Table IV.11 The Normality Data Testing Control Class ........................56Table IV.12 The Result Post Test in Control & Experimental Class ....59Table IV.13 Mean and Standard Deviation of Post Test in
Experimental & Control Class ...........................................61Table IV.14 The classification of students listening comprehension
taught by tqlr strategy.........................................................63Table IV.15 The Frequency & Percentage between Experimental &
Control Class………………………………………… 64Table IV.16 Description of Students Score on Pre Test .........................65Table IV.17 Description of Students Score on Post Test .......................66Table IV.18 The Students Gain Post Test Score Experimental Class..... 68Table IV.19 The Students Gain Post Test Score Control Class ............. 70

1
CHAPTER I
INTRODUCTION
A. Background
Listening is one of the language skills. It is an essential part of the
communication process that should be mastered by the students. By listening, the
students can acquire the information and develop what the speakers say.
According to Fox, listening is an activity in which a listener can analyze, identify,
respond and understand to speak in the second language.1
In order to develop communicative efficiency in pronunciation, the students
need to understand how sounds are made and how stress is used. Based on
Harmer, clarifies that the students can improve their listening skills and gain
valuable language input – through a combination of extensive and intensive
listening material and procedure.2 Listening of both kinds is especially important
since it provides the perfect opportunity to hear voices rather than the teacher,
enables the students to acquire good speaking habits as a result of the spoken
English, help to improve their own pronunciation.3 This is something that the
teacher can tell through explanation and examples. The students also need to hear
the language used, so that they can both imitate the pronunciation and also
subconsciously acquire some of its sound.
1 Fox J, Teaching Listening Skills, English Forum. (USA : Prentice Hall, 1970), p. 42-45
2 Jeremy Harmer, The Practice of English Language Teaching. (Cambridge : Logman, 2001),p. 228
3 Ibid, p. 228
2
In teaching and learning English process in Indonesia schools, especially at
every level of education, listening skill is categorized as the final language skills
that must be mastered by all the students. Listening skill is not a difficult activity
for the students but it is enjoyable activity.4
And in the syllabus of the first year (especially for the second semester) at
SMP YKPP Dumai that the students are required to be able comprehend the
meaning in transactional and interpersonal conversation in some expressions,
short functional texts, and descriptive text.5
Based on writer’s preliminary study at the first year of SMP YKPP Dumai on
the December 10 2011. The teacher used many strategies in teaching listening,
such as, teacher divided students into small group, then teacher gave a topic
listening and then teacher gave explanation about background knowledge of topic
of listening and then the teacher gave strategy to students in listening
comprehension. The example is the use of bottom up, and top down strategy.
Ideally, the students should comprehend the information of the topic, because
the teacher has given warming up before listening. Then, there are some
difficulties found in teaching listening that can be itemized into the following
symptoms :
1. Some of the students are not able to find the message from the speaker.
2. Some of the students are not able to find clue from the listening
material.
4 Rika Ariani. The Use of English Songs in Listening Sounds Discrimination by the Third YearStudents at SMP N 3 Pasir Penyu. 2007. P. 9 unpubished
5 Syllabus of SMP YKPP Dumai 2010-2011. unpubished
3
3. Some of the students are not able to catch what the speaker say.
4. Some of the students have lack of background knowledge.
5. Some of students are not able to associate two phonetically new
similar words.
Based on the problems described above, the writer wants to apply an
appropriate way as an effort to increase listening ability for the students at the first
year of SMP YKPP Dumai. The way has to be acceptable and easy for students to
follow. The writer is interested in applying the TQLR strategy as a strategy in
teaching listening. This strategy assists listening comprehension. Students
generate questions and listen for specific statements related to those questions.
TQLR strategy is a four-step listening strategy to improve their listening
skills. Manzo says that the purpose of TQLR strategy is to improve the student’s
ability to listen in focused manner and to recall, try the TQLR (Tune in, Question,
Listen, and Review) strategy.6 It means that, the strategy is appropriate in teaching
listening, because it can improve the students’ skill in listening.
Based on statement above, the writer thinks that TQLR strategy is appropriate
or necessary to achieve the active learning and interesting learning. It is an
interesting strategy that is used to improve the student’s active learning, especially
in listening process.
Based on the explanation and the problem above, the writer is interested in
conducting a research entitled “THE EFFECT OF USING TQLR STRATEGY
6 Anthony V Manzo, Ula V Manzo. Teaching Children to be Literate : A Reflective Approach.(New York : Harcourt Brace College Publisher, 1995), p. 105

4
TOWARD THE LISTENING COMPREHENSION OF THE FIRST YEAR
STUDENTS AT JUNIOR HIGH SCHOOL YKPP DUMAI“.
B. Reason for Choosing the Problem
The reasons why the writer is interested in carrying out the research on the
topic above are based on several considerations as follows:
1. The problems of the research are very interesting and challenging to be
investigated in teaching and learning listening.
2. The topic is relevant to the writer as one of the students of the English
Education Department.
3. The students of Junior High School YKPP Dumai still get difficulties
in listening skill.
C. The Problem
1. Identification of the Problem
Based on the background and the phenomena above, the writer would
like to identify the problems as follows:
1. Why are some of the students unable to find the message from the
speaker?
2. Why are some of the students unable to find clue from listening
material?
3. Why some of the students are unable to catch what speaker says?

5
4. Why do some of the students have lack of background knowledge?
5. Why do some of the students have difficulties to associate two
phonetically new similar words?
2. Limitation of the Problem
Based on the identifications of the problems above, there are some
problems involving in this research. In this research, the researcher only
focuses on the effect of using TQLR (Tune, Question, Listen and Review)
Strategy toward listening comprehension of the first year student at Junior
High School YKPP Dumai.
3. Formulation of the Problem
The problems of this research are formulated in the following research
questions:
1. How is students’ listening comprehension taught by using TQLR
(Tune, Question, Listen and Review) strategy at the first year students
of Junior High School Dumai?
2. How is students’ listening comprehension taught without using TQLR
(Tune, Question, Listen and Review) strategy at the first year students
of Junior High School Dumai?
3. Is there any significant effect of using TQLR (Tune, Question, Listen
and Review) strategy at the first year students of Junior High School
Dumai?

6
D. Objectives of the Research
This research is necessarily carried out in order to achieve the objectives as
follows:
1. To get information about the students’ comprehension in listening taught
by using TQLR (Tune, Question, Listen and Review) strategy at the first
year of Junior High School Dumai.
2. To get information about the students’ comprehension in listening taught
without using TQLR (Tune, Question, Listen and Review) strategy at the
first year of Junior High School Dumai.
3. To know the effect of TQLR (Tune, Question, Listen and Review) strategy
toward students’ listening comprehension at the first year of Junior High
School Dumai.
E. Significance of the Research
Related to the objectives of the research above, the significance of the
research is as follows:
1. To the writer as a researcher in term of learning how to conduct the
research.
2. These research findings are also expected to give the positive contribution
or information to the first year students of SMP YKPP Dumai and the
teacher of English as determiner of their learning and teaching success.
3. These research findings are also hoped to justify these existing theories on
teaching and learning English as second language – first language, and for

7
those who are concerned with current issues on learning and teaching
language.
F. Definition of the Terms
In order to avoid misunderstanding and misinterpretation about some terms
used in this research, the writer defines them as follows:
1. Effect
Effect is a measure of the strength of one variable’s effect on another or
the relationship between two or more variables.7 In this research, effect is
defined as the result of teaching listening treated by using TQLR strategy
at the first year students of SMP YKPP Dumai.
2. TQLR
TQLR is listening strategy. TQLR is a way to teach student a variety of
possible ways to listen what the speaker say. The basic TQLR procedure is
summarized by its title:8
Tune : get ready to listen, and to give the speaker your full attention.
Question : ask your self questions while you are listening.
Listen : listen for clue words or phrases that help you predict what is
coming.
7 Jack C. Richards and Richard Schmidt. Longman Dictionary of Language Teaching andApplied Linguistics. Third Edition (New York, Pearson Education: 2002) p. 175.
8 Antoni V Manzo, Loc. cit., p. 105
8
Review : to make your review even stronger, say it out load.
TQLR strategy is a four-step listening strategy to improve their listening
skills. In this research, TQLR strategy is strategy that is used to improve
the students’ skill in listening.
3. Strategy
Strategy is a series of ordered steps that will allow a student to perform a
task. The strategy serves to help structure the students’ efforts (i.e., to do
the steps in order) and to remind the students what to do at each stage of
the process.9
In this study, strategy deals with the way that is used by the students to
comprehend listening. Strategy that is used in this research is TQLR
(Tune, Question, Listen, and Review).
4. Listening Comprehension
Listening comprehension is the process of understanding speech in a
second or foreign language.10 The study of listening comprehension
processes in second language learning focuses on the role of individual
linguistic units (e.g. phonemes, words, grammatical structures) as well as
the role of the learner’s expectations, the situation and context,
background knowledge and the topic. In this research, listening
9 Robert Reid and Torri Ortiz Lienemann. Strategy Instruction for Students with LearningDisabilities. (New York : The Guilford Press, 2006), p. 18
10 Jack C. Richards, John Platt. Heidi Platt. Language Teaching and Applied Linguistics,Logman Dictionary. ( England : Pearson Educato Limited, 1999), p. 216

9
comprehension is process of understanding speech in foreign language
with used TQLR strategy.

CHAPTER II
REVIEW OF RELATED LITERATURE
A. THEORITICAL FRAMEWORK
1. The Nature of Listening
Listening is the activity of paying attention to and trying to get meaning
from something we hear.1 To listen successfully to spoken language, we need to
be able to work out what speakers mean when they use particular words in
particular ways on particular occasions, and not simply to understand the words
themselves.
According to Nation, listening is the natural precursor to speak; the early
stages of language development in a person’s first language (and in naturalistic
acquisition of other languages) are dependent on listening.2
Listening is an activity and purposefully process, in which listener
participates and makes a positive contribution by bringing his power
concentration to hear what he hears.3 From these, we can see that listening is not a
passive activity. In listening, the listener is asked to be more active in analyzing
and constructing the message from the speaker.
1 Mary Underword, Teaching Listening. (London and New York : Logman, 1989), p. 1
2 I. S. P Nation and Jonathan Newton. Teaching ESL / EFL Listening and Speaking. (NewYork and London : Routledge Taylor & Francis Group, 2008), p. 37
3 Rika Ariani. The Use of English Songs in Listening Sounds Discrimination by the Third YearStudents at SMP N 3 Pasir Penyu. 2007. P. 9 unpubished

In addition, listening is a demanding process, not only because of the
complexity of the process itself, but also due to factors that characterize the
listener, the speaker, the content of the message, and any visual support that
accompanies the message.4
Listening skills are crucial for the learners. Listening and speaking are
often taught together, but beginners especially non-literate ones should be given
more listening than speaking practice. It is important to speak as close to natural
speed as possible, although with beginners some slowing is usually necessary.
From the explanation above, the writer can conclude that listening is
important skill because through listening the listener can get some information
that she or he wants to know.
2. Characteristic of Listening
There are six characteristics of listening and their implications for teaching
listening.5
1. Spoken language is different from written language. Spoken language
is not organized, does not consist of complete sentences and is full of
interruptions, hesitations and repetition and does not necessarily
contain a lot of information. Hence, students should be exposed to
4 G. Brown & G. Yule. Teaching the Spoken Language. (Cambridge: Cambridge UniversityPress, 1983), p. 7
5 Mac Yin Mee. Teaching Listening- An Overview. (University of Malaya : The EnglishTeacher Vol XIX July 1990)

authentic speech instead of artificial dialogue or written speech which
is read.
2. The listener is usually helped by visual information which facilitates
understanding. We can see the speaker and his expressions. Therefore,
a lot of visuals (slides, maps. photographs etc) should be used or native
speakers could be invited to class.
3. Listeners would have "expectations" about how a conversation might
go, what they are going to hear and what their interlocutors are going
to say. The implication is that there should be pre-listening activities to
prepare students for what they will hear.
4. Listeners have contextual knowledge about the speaker and the
situation. Thus, pre-listening activities should ensure that students are
privy to contextual knowledge.
5. People listen for a purpose and they have a specific reason for
listening. Hence, it is vital that students are asked to listen for
something during their While-listening exercises.
6. Often spoken language is simply for social interaction and not for
exchange of ideas or information. Therefore, students should not be
asked to listen for facts all the time. Students should be encouraged to
listen for gestures, attitudes and feelings too.
Therefore, we can distinguish two broad types of listening:
1. One-way listening—typically associated with the transfer of
information (transactional listening).

2. Two-way listening—typically associated with maintaining social
relations (interactional listening).6
3. Concept of Listening Comprehension
Listening comprehension means, listeners can understand and catch the
ideas what they are listening to.7 In addition, listening comprehension is not
only an activity to listen to the speakers but also try to get the message from
what is being said. In this case, it does need good coordination between ears
and brain.
Listening comprehension is the process that starts with the receiving news
analyzed in sounds, words, clauses, and sentences until getting message of the
speaker.8
It clears that the students should be active listeners while listening to
English by having good hearing and basic knowledge such as grammar and
vocabulary to understand the speakers’ statement. Active listening means here
that you really listen to what your interlocutors are saying.
We can conclude that listening comprehension is an active process where
the listener should know what the topic is, meaning of the talk and so forth.
Therefore, the listeners should use their brain and their basic knowledge for
listening comprehensively.
6 I. S. P Nation and Jonathan Newton, Op. cit., p. 40
7 Mardhatillah. A Study on the Sixth Semester Students’ Ability in Listening Comprehensionafter Viewing Video Programs at the English Study Program FKIP-UNRI. 2007. P. 7 Unpublished
8 Ibid, p. 7

4. The Listening Process
Listening is a complex process in which many things happen
simultaneously inside the mind.9 Besides being complex, listening is more
difficult than many people can imagine.
The listening process basically involves seven steps: the person
communicating has his purpose in mind and produces the oral symbols which
will carry his ideas across. The person receiving the communication hears the
oral symbols, recognizes add interprets them, selects what he wants to
comprehend or to retain, so that he can respond or react. 10
Listening thus involves two basic levels; recognition and selection.
When the learner is first confronted with a foreign language, he/she hears
only a barrage of meaningless noise. Gradually after exposuring to the
language, the learner recognizes the elements and patterns like phonemes,
intonation, words and phrases. When the learner is able to recognize the
phonological, syntactic and semantic codes of the language automatically, the
learner has reached the level of recognition. Next, the learner sifts out the
message bearing units for retention and comprehension without conscious
attention to individual components. This is the level of selection.
Students do not have an innate understanding of what effective
listeners do; therefore, it is the responsibility of teachers to share that
9 Mac Yin Mee, Loc. cit., Vol XIX
10 Mac Yin Mee, Loc. cit., Vol XIX

knowledge with them. Perhaps the most valuable way to teach listening skills
is for teachers to model them themselves, creating an environment, which
encourages listening. Teachers can create such an environment by positive
interaction, actively listening to all students and responding in an open and
appropriate manner. Teachers should avoid responding either
condescendingly or sarcastically. As much as possible, they should minimize
distractions and interruptions.
It is important for the teacher to provide numerous opportunities for
students to practice listening skills and to become actively engaged in the
listening process. The three phrases of the listening process are: pre-
listening, during- listening, and after- listening.11 In this research, strategy
used include in three phrases, such as tune and question include in pre-
listening, listen include in during- listening and review includes in after-
listening.
1. Pre- listening
Before listening, students need assistance to activate what they
already know about the ideas they are going to hear. Simply being told
the topic is not enough. Pre- listening activities are required to establish
what is already known about the topic, to build necessary background,
11 Arif Saricoban. The Teaching of Listening. Hacettepe University (Beytepe-Ankara,Turkey). Journal, Vol. V, No. 12, December 1999. http://iteslj.org/Articles/Saricoban-Listening.html

and to set purpose (s) for listening. There are two primary goals of pre-
listening activities. There are to bring to consciousness the tools and
strategies that good listeners use when listening and to provide the
necessary context for that specific listening task.
2. During- listening
While-listening activities relate directly to the text, and students do
them during or immediately after the time they are listening, teacher can
draw activity as listening with visuals. Teachers can also encourage
guided imagery when students are listening to presentations that have
many visual images, details, or descriptive words. Students can form
mental pictures to help them remember while listening. So, the listeners
should pay attention attentively to what is being said.
3. After- listening
Students need to act upon what they have heard to clarify meaning
and extend their thinking. Well-planned post-listening activities are just
as important as those before and during. The purposes of the activities
serve:
1. To check whether the learners have understood what they need to
understand and whether they have successfully completed the
while- listening task.
2. To reflect on why some students have failed to understood or
missed parts of the message.

3. To give students the opportunity to consider the attitude and
manner of the speakers of the listening text.
4. To expand on the topic or language of the listening text and
transfer what they have learned to another task and context. 12
5. Teaching Listening
People learn the language by listening. A child, before being able to speak,
listens to the sound of the language around him. Then she or he tries top repeat
the sound until her or him able to utter those words correctly. We know that
many people make some mistakes in repeating the sound from new word that
they heard like repeat English word as a foreign language, so the writer is
interested in teaching the students in listening by using TQLR (tune, question,
listen and review).
Listening materials should be carefully graded as to introduce a bare
minimum of unfamiliar words. Listening passages should use normal speed
from the start as slowed down speech distorted and led to learners relying on
auditory cues that will not be present in normal speech. The speech should
also include the usual redundancies of informal speech, including pauses,
repetitions, saying the same thing in two different ways.
There are three components of listening that influence communication
accuracy, hearing, and comprehension and retention.
12 Ibid. p. 20- 21

1. Hearing.
It is the ability to receive sounds.
2. Comprehension.
It is the ability to interpret and understand the spoken word. If some
one cannot hear a message it means that he is not able to comprehend
it.
3. Retention.
It is the ability to remember what has been said. Good listening habits,
particularly the ability to recall information, are very important to
students to make correct interpretation to the meaning of the text that is
said or to the speaker’s sentences.13
The objectives of teaching listening covered in the English curriculum
emphasized to the understanding about the information commonly used in
classroom or school life.
From the explanation above, it can be concluded that listening skill is
important in any communication situation. Teachers should find a suitable
approach in teaching listening in order to increase students’ listening ability.
Moreover, students should train and improve their listening skill, so that they
13 Rika Ariani. The Use of English Songs in Listening Sounds Discrimination by the ThirdYear Students at SMP N 3 Pasir Penyu. 2007. P. 9 unpubished

are familiar with the sound of the language they are listening. Teachers are
expected to create various practices for listening habit.
Teachers in teaching listening should be able to create good environment
in order to encourage and motivate students to learn listening optimally.
Furthermore, teachers need to enlarge their knowledge in listening materials in
order to give more various forms in practicing listening. This is useful for
creating listening habits. As the frequency of practicing increases, the students
are expected to be more familiar with the listening comprehension.
6. TQLR Strategy
TQLR strategy is a four-step listening strategy to improve students’
listening skills; there are tune, question, listen and review. It is a way to teach
student a variety of possible ways to listen what the speakers say. It is an
interesting strategy that is used to improve the student’s active learning.
This strategy assists with listening comprehension. Students generate
questions and listen for specific statements related to those questions. The
steps in TQLR are:
1. Tuning in
2. Questioning
3. Listening
4. Reviewing14
14 Catherine Collier. Learning Support Team (LST) Strategies. 2003. p. 31

There are four steps in listening strategy, to improve listening ability
students:15
1. TUNE IN.
Give the introduction to the students about the material lesson.
2. QUESTION.
After giving the introduction, teacher gives question for the students
about the material.
3. LISTEN.
After the question given for the students, teachers hear the material.
4. REVIEW.
After that, students review what they hear from the speaker says.
The one you will use in the upcoming listening activity is TQLR
(Tune-in, Question, Listen, and Review).16
1. T – Tune in : You need to “tune in” to the speaker and the
subject, mentally calling up everything known about
the subject and shutting out distractions. You
should have a positive attitude, not assume that the
presentation will be boring.
2. Q – Question : You should have a clear purpose for listening and
mentally formulate questions to help set a purpose.
15 Admin Global. Listening: the TQLR Process. 06-04-2011 04:20 A.Mhttp://www.anriintern.com/selected_news_500119
16 English Language Arts B10 Module 1: Equality Lesson 4, P. 171

3. L – Listen : You should listen for specific information and ideas
as they are presented. It sometimes helps to
anticipate what the speaker will say next. While
listening, react mentally to what is being said.
4. R – Review : You should go over what has been said, summarize,
and evaluate what was heard.
From explanation above, the writer can conclude that TQLR strategy is the
way in listening comprehension to improve student’s ability in listening.
Because with TQLR students can catch what the speaker says.
7. Teaching Listening by Using TQLR strategy
The strategy that is used by the teacher should encourage the students in
all the language skills.
The purposes teach TQLR is to improve listening ability the students.
There are four steps or procedures to use TQLR in teaching listening:17
1. Tune: get ready to listen, and to give the speaker your full attention. If
you are still getting settled and miss the beginning of a lesson, a story
being read, or a assignment being given, it’s hard to understand what
you are hearing. Failure to “tune in” early will leave you felling as
though you came in on a TV program five minutes late: confused and
17 Antony V Manzo, op. cit. p. 105-107

mildly annoyed. When this does happen you have to listen even more
carefully for clues that might put you on target. In the classroom, such
clues could include a reference to something on the board or to a page
in the text book.
2. Question: ask your self question while you are listening. Your job as a
listener is to identify the main ideas. Here are some good question to
ask yourself when you listen:
a. What is the purpose of what I listening to (to give me
direction? To give me information? To give me information a
something? To get information from me? To amuse me?)
b. What’s new in what I’m hearing? How important is it? Do I
need to try to remember it?
3. Listen: now listen to get answer the questions. Try to guess what is
coming next. Were you right? Listen for clue words or phrases that
help you predict what is coming.
4. Review: the two important keys to remembering almost anything are to
want remember it, and to review it. When you hear something
important, repeat it to yourself immediately. Say it in your own word.
Write in down in short form to review again later the same day. To
make your review even stronger, say it out load.
TQLR stands for Tune In, Question, Listen, and Review. First help
students understand the components of this system. Next model this process.
Then guide students to practice it. The first tell students to use this process

with all of the listening activities. In addition, students can use this system
when viewing videos, while listening to audio, during class instruction,
watching television, and for many other activities.18
1. Tune In and Question
The first give tune in or introduce the material. Place chart paper on
the board, and SAY TO STUDENTS:
This is what you should say to yourselves: “I am ready to listen. I have
a sheet of paper and my pencil to take notes, and I have cleared my
desk of everything. I am now ready to listen to the story.” Now I am
going to think out loud as I read the story
The second give the question about the material.
2. Listen and Review
Now read the story a second time without questions. This time
model the Listen and Review components of TQLR. Record your
students’ responses to Listen and Review components on the chart
paper.
Listen and Review
SAY TO STUDENTS:
Now I am going to read the story a second time. Then together we’ll
record some notes for listening and reviewing.
18 Sampler. Listen Take Note Primary, Teacher Edition, (New York: Silver Moon Press,2009), p. 3-5

The four steps in teaching listening by Using TQLR strategy.19
1. TUNE IN. Right as the lecture begins, determine the speaker's
topic and recall what you may already know about the topic.
2. QUESTION. Early in the lecture, begin the listening process by
asking questions such as: "What point is the speaker making?",
"What devices for support is he/she using?", "What do I need to
specifically remember?" This process, if continued throughout the
entire lecture, helps lead to an understanding of main ideas, the
speaker's organization of the material being covered, and
supporting details.
3. LISTEN. This includes hearing the basic message and answering
the questions being raised during the total process. In order to
accomplish this, you must anticipate what will be said, and take in
what is said. Active alertness is ALWAYS REQUIRED.
4. REVIEW. This is the process of checking on the anticipated
message after the message is delivered. To review, you must
evaluate the message against your questions, fit ideas together,
summarize ideas, and evaluate the meaning and impact of the
message based on your circumstances. This review process should
lead to further questions and keep you constantly tuned in to the
lecture.
19 Admin Global. Listening: the TQLR Process. 06-04-2011 04:20 A.Mhttp://www.anriintern.com/selected_news_500119

From the explanation above, the writer can conclude that TQLR strategy is
appropriate way to use in teaching listening. Because by using TQLR can
improve listening comprehension of students.
B. RELEVANT RESEARCH
According to Syafi’i relevant research is required to observe some previous
researchers conducted by other researchers in which they are relevant to our
researcher.20 Besides, we have to analyze what the point that was focused on,
inform the design, finding and conclusion of the previous research:
1. Ummi Rasyidah conducted a research entitled “The correlation
between critical thinking and students listening comprehension ability
at SMAN 1 Kampar.21 From her research, she found that the second
hyphotesis is accepted because the table of “r” product moment at the
5% grade of significance is 0,288. While in the level of significance
1% is 0,372. Furthermore, she analyzed the significance of 1% is 0,66
higher than the table of “r” product moment in 5% or 1%. Thus, it can
be read that 0,375 < 0,66 > 0,288. It means that there is positive
significant correlation between critical thinking and students’ listening
comprehension ability at SMAN 1 Kampar.
20 M. Syafi’i. S. From Paragraph to a Research Report: A Writing of English for AcademicPurposes. (Lembaga Bimbingan Belajar Syaf Intensive/ LBSI, Pekanbaru: 2007), p. 122.
21 Ummi Rasyidah. The Correlation between Critical Thinking and Students ListeningComprehension at SMA N 1 Kampar. 2009 unpublished

2. A research from Mardhatillah.22 Conducted a research which entitled
A study on the sixth semester students ability in listening
comprehension after viewing video programs at the English study
program FKIP-UNRI. From the research, She found that the second
hyphotesis is accepted because T-table at the 5 % grade of significance
refers to 2.01. while in the level of significance 1 % is 2.68. Therefore,
it can be analyzed that to is higher than T-table in either at 5 % or 1 %
grade of significance. It can be read that 2.01 < 8.26 > 2.68. it means
that there is significance of students ability in listening comprehension
after viewing video programs at the English study program FKIP-
UNRI. She found that there is significant study of the students’ ability
in listening after viewing video programs.
C. OPERATIONAL CONCEPT
Operational concept is the concept that will be used to give limitation to the
theoretical framework in order to avoid misunderstanding and misinterpretation in
this research. In carrying out this research, it is necessary to clarify briefly the
variable that will be used in analyzing data. In this research, there are two
variables; they are (1) the effect of using tqlr strategy as X variable and (2)
students’ ability in listening comprehension as Y variable. Because the type of
this research is experimental research, the writer states to use two classes to be
observed as: experimental class and control class. The data will be taken by using
test. Furthermore, the writer is also as the teacher involved in teaching the
students in both experimental and control class during the research time. For
22 Mardhatillah. A Study on the Sixth Semester Students Ability in Listening ComprehensionAfter Viewing Video Programs at the English Study Program FKIP-UNRI. 2007. Unpublished.

experimental class, the students will be taught by tqlr strategy in teaching
listening, and for control class, the students will be taught by using conventional
technique, or the usual technique that is used by the teacher. The materials that
will be taught to both classes are same. The difference is only the use of
technique. All of the techniques that will be applied are focused on students’
ability in listening comprehension.
1. Experimental Class
a. The Procedure of Using TQLR (Tune, Question, Listen and
Review) Strategy (Variable X):
1) The teacher begins by introducing about the topic or listening
material.
2) The teacher gives the question about the material that has been
explained.
3) The students listen about the material from the questions that
have been given.
4) The students review what they hear and answer the questions.
b. The Indicators of Students Listening Comprehension (Variable
Y) as Follow:
1) The students are able to respond the meaning in oral functional
descriptive text.
2) The students are able to identify the communicative purpose of
descriptive text that be listened accurately.
3) The students are able to identify the language features of
functional descriptive text that be listened accurately.

4) The students are able to identify the language features of
descriptive text carrefully and logical thinking.
5) The students are able to identify the communicative purpose that
be listened accurately.
2. Control Class
a. The Procedures of Using Three – Phase Strategy (Variable X)
1.) The teacher makes a topic and asks the students by practice
listening.
2.) The students listens the record.
3.) The students answer the question.
4.) The students do peers correction.
b. The Indicators of Students Listening Comprehension (Variable
Y) as Follow:
1) The students are able to respond the meaning in oral functional
descriptive text.
2) The students are able to identify the communicative purpose of
descriptive text that be listened accurately.
3) The students are able to identify the language features of functional
descriptive text that be listened accurately.
4) The students are able to identify the language features of
descriptive text carrefully and logical thinking.
5) The students are able to identify the communicative purpose that be
listened accurately.

D. Assumption and Hypothesis
1. The Assumption
In this research, the writer assumes that the students’ listening is
various, the students’ listening ability can be influenced by many factors,
and strategy in teaching can influence students’ listening ability.
2. The Hypothesis
Ho: There is no significant effect of listening ability between students who
are taught by using TQLR strategy and those who are taught by using
conventional strategy.
Ha: There is a significant effect of listening ability between students who
are taught by using TQLR strategy and those who are taught by using
conventional strategy.

CHAPTER III
RESEARCH METHODOLOGY
A. METHOD OF THE RESEARCH
The design of this research is quasi-experiment design, which uses
nonequivalent control group design. According to Creswell1, quasi-experiments
design are experiments situations in which the researcher assigns, but not
randomly, participants to groups because the experimenter cannot artificially
create groups for the experiment. There were two classes in this research; control
and experimental classes. The treatment was only given to experimental class,
namely: TQLR strategy. There were a pretest and post-test for both classes. The
end of the pre-test, the condition of students could be identified. After that, the
treatments were given to the experimental class only. Then classes were given
post-test. Cohen et al. 2 say that to account for differences between pretest and
posttest scores by reference to the effects of X (treatment).
According to Cresswell, the writer assigns intact group the experiment and
control group, and administers a pretest to both groups by giving treatment for
experiment group only, and then the writer administers a posttest to assess the
difference between the two groups.3
1 John W. Creswell, Educational Research: Planning, Conducting, and EvaluatingQuantitative and Qualitative Research. (New Jersey: Pearson Education Ltd., 2008), p. 645.
2 Cohen, Louis, et al. Research Methods in Education, (New York: Routledge,2007), p. 282.
3 John W. Creswell, Op.Cit, p.313-314

Table 1II.1
Research Design
Group Pre-Test Treatment Post-Test
X1 T1 X T2
X3 T1 T2
Where:
X1 : Control Group
X2 : Experimental Group
T1 : Pre-test for Experimental and control group
√ : Receiving particular treatment
X : Without particular treatment
T2 : Post-test for experimental and control group
In this research, the writer found out the effect of using TQLR (Tune,
Question, Listen, and Review) strategy toward students’ listening comprehension
at the first year of Junior High School YKPP Dumai. The variables of this
research were the effect of TQLR (Tune, Question, Listen and Review) strategy as
X variable and students’ listening comprehension as Y variable.
B. LOCATION AND TIME OF THE RESEARCH
The research was conducted at the first year students of Junior High School
YKPP Dumai. The collecting of data was done in two months, started from
February until March 2012.

C. SUBJECT AND OBJECT OF THE RESEARCH
Subject of the research was the first year students of SMP YKPP Dumai. The
object of this research was the effect of TQLR (tune, question, listen and review)
strategy toward the listening comprehension.
D. POPULATION AND SAMPLE OF THE RESEARCH
1. Population
The population of this research was the first year students of Junior High
School YKPP Dumai. The total of the first year students were 151 students.
The number of students includes in the following table:
Table 1II.2
Population of the research:
(Source : Document of SMP YKPP Dumai academic year2010/2011)
Based on the table above, the total population was 151 students included
class VII.A, VII.B, VII.C and VII.D.
2. Sample
There were 4 classes as the total population in this research. Because the
total population was big, the researcher took the sample by using cluster
sampling. According to Gay, Cluster Sampling randomly selects groups, not
No Class Students
1 VII.A 38
2 VII.B 38
3 VII.C 38
4 VII.D 37
Total 151

individuals. All the members of selected groups have similar characteristics.4
Therefore, the researcher took two classes to represent the population having
similar characteristics.
The similar characteristics intended for the both of class are: the students
were taught by the same teacher of English, the students had the same level,
and the students had the same material about learning of listening. The first
class was used as a control class and the second class was used as an
experimental class.
Table III.3
Sample of the Research
VII.B Experiment class 38
VII.C Control class 38
TOTAL 76
E. Technique of Collecting Data
The instrument that was use by the researcher to collect the data that was test.
Test was conducted in order to determine the students’ listening comprehension.
The number of the question was 20 questions. The questions were related to the
indicators of listening comprehension. The test was divided into two kinds of
tests; pre-test and post-test. Pre-test was given just one time before treatment and
post-test was also given one time after treatment. The treatment was given for six
meetings of studying in classroom. The test was given twice. First, test was given
in pre-test. The purpose of giving pre-test was to know the students’ ability in
listening comprehension. Then, the post-test was given. The purpose of the post
test was to know about the significant effect of using TQLR (Tune, Question,
4 Op.cit., p. 129

Listen and Review) strategy toward students’ listening comprehension. The
questions script of the test can be seen in appendix 1.
F. The Procedures of the Research
1. The first procedure, the writer gave tryout to know the validity and
reliability of the test before giving test to experimental and control group.
2. Giving pre-test for experimental and control group. The purpose of pre-
test was to know the students’ listening comprehension.
3. Conducting treatment. The writer just gave treatment to the experimental
group. In experimental group, the writer used TQLR (Tune, Question,
Listen and Review) strategy as a strategy in teaching. Control group used a
traditional listening strategy as a conventional teaching, because English
teacher used traditional listening strategy in learning teaching process. So,
in this class, the writer just used conventional teaching. The writer gave
treatments for six meetings of study.
4. Giving the post-test to students in the last meeting of study. The post-test
was given to both experimental and control group. The purpose of post-
test was to obtain the data of students’ listening comprehension and the
effect of using TQLR (Tune, Question, Listen and Review) strategy
toward students’ listening comprehension at the first year students of
Junior High School YKPP Dumai.
G. Technique of Analyzing Data
In order to find out whether there was a significant effect of using TQLR
(Tune, Question, Listen and Review) Strategy toward Listening Comprehension
of the First Year Student at Junior High School YKPP Dumai.

The technique of the data analysis that was used in this research was
Independent T-test formula. 5
= −1²1 + 2²2Note:
Mx : Mean of the experiment class variable
My : Mean of the control class variable
SDx : Standard error of mean of the experimental class
SDy : Standard error of mean of the control class
N : The number of case.
The result of T-test formula was compared to Ttable to determine the
significant level of score by using degree of freedom (df). The formula of degree
of freedom:
df = Nx+Ny-2
Note:
df : the degree of freedom
Nx : the number of students in experiment class
Ny : the number of students in control class
5 Prof. Dr. Sugiono. Statistika untuk Penelitian. (Bandung : Alfabeta, 2011), p. 138

If t-test is higher than ttable, the writer can conclude that ha is accepted and ho is
rejected. It means that there is significant effect of using TQLR strategy toward
the students’ listening comprehension. If t-test is lower than ttable, the writer can
conclude that ha is rejected and ho is accepted. It means that there is no significant
effect without using TQLR strategy toward the students’ listening comprehension.
To analyze the collected data, the writer established categories to classify the
result of the test as main instruments of this research. Sudijhono in Putri
categorized levels of listening comprehension achievement into five categories
level.6 They are as follows:
Table III.4
The categorizing Level of Scoring Listening Comprehension
SCORE CATEGORY
80 – 100 Very good
66 – 79 Good
56 – 65 Enough
46 – 55 Less
0 – 45 Fail
H. Validity of the Instrument
In this research, the writer used multiple choices as the instrument of test. In
giving the test to respondents, the test should be valid. The research instrument
should be qualified. The instrument can be valid if the instrument is measuring
what the researcher wants to find out. Scarvia B. Anderson et.al in Suharsimi
6 Rima Dewi Putri. The Effect of Using Song in Increasing Students’ Listening Ability at theSecond Year Students of SMAN 1 Kuantan Hilir 2008, p . 14 unpublished

claims the statement “a test is valid if it measures what it purposes to measure7. In
addition, Lado in Weir asks “Does a test measure what it is supposed to measure?
If it does, it is valid”.8
The validity in this research used construct validity. This test particularly
measured the purpose of the test based on the purpose of particular instructions. It
means that every item in the test measured the particular instructions in thinking
aspect9.
The validity in this research used construct validity. This test particularly
measured the purpose of the test based on the purpose of particular instructions. It
means that every item in the test measured the particular instructions in thinking
aspect10. The product moment formula was used. Thus, the formula of validity can
be seen below:
= (∑ ) − (∑ ). (∑ ){ . ∑ − (∑ ) }. . ∑ − (∑ )Where:
N = Total number of respondent
Rxy = Correlation coefficient∑ = Total score of one item
7 Suharsimi Arikunto, Dasar-Dasar Evaluasi Pendidikan (Edisi Revisi), Jakarta: PT. BumiAksara. 2009, p. 65
8 Cyrill J. Weir, Language Testing and Validation, New York: Palgrave Macmillan, , 2005,p.12
9 Suharsimi Arikunto, Op.Cit p. 67
10 Suharsimi Arikunto, Op.Cit p. 67

∑ = Total score for all item∑ = Multiplication of X and Y
The interpretation of validity
I. Reliability of the Instrument
Reliability is the other important thing in measuring the instrument.
Reliability is used to know the consistency of the test. It focuses on how many
items were given to respondents. Reliability is related to validity. Even validity is
more important, but reliability supports validity11. There are several formulas that
can be used to measure the reliability of the test. In this research, the writer used
Kr-20 formula, it is from Kuder Richardson in Riduwan12 The formula can be
seen below:
R11=∑
Where:R11 = reliability
N = total items
S = standard deviation
11 Suharsimi, ibid, p.87.
12 Riduwan, Metode dan Tekhnik Menyusun Tesis, Bandung: ALFABETA, 2010, p.119-120
Coefficient correlation Category
0.800 – 1.00 Very high
0.600 – 0.800 High
0.400 – 0.600 Enough
0.200 – 0.400 Low
0.00 – 0.2.00 Very low (invalid)

After getting score of reliability, it should be consulted with “r” product
moment table. The score should be higher than significant level of 1% and
significant level of 5%.
Significant level of 1% = 0.413
Significant level of 5% = 0.320
The interpretation of reliability
Interpretation Category
R11 > “r” product moment Reliable
R11 < “r” product moment Not reliable
(Suharsimi, 2010: 100)

CHAPTER IV
PRESENTATION AND ANALYSIS DATA
A. The Data Presentation
1. The Data from the Test
Before giving the test for the sample of the research, the writer made try
out to the other class to determine the validity and reliability of the instruments.
The test items which were not valid and reliable were changed to the other item.
a. Validity
To analyze the validity of data, the writer used items of difficulty by using
the formula below:
FV =
Where = FV : Index of difficulty
R : The number of the correct answer
N : The number of students taking test
The standard level of difficulty is < 0.30 and >0.70. Then, the proportion correct
is represented by “p”, whereas the proportion of incorrect is represented by “q”. It
can be seen in the following tables:

Table IV. 1Indicator 1:
Students are able to respond the meaning in oral functional descriptive text
IndicatorStudents are Able to Identify The Main Idea
N
Item no. 1 2 3 4
30Correct 21 22 20 21
P 0.55 0.58 0.52 0.55Q 0.45 0.42 0.48 0.45
The description of the table above is that indicator 1 consists of four items
in listening comprehension test. Item number 1 shows the proportion correct 0.55,
item number 2 shows the proportion correct 0.58, Item number 3 shows the
proportion correct 0.52 and item number 4 shows the proportion correct 0.55. The
interpretation of standard difficulty must be in the middle of 0.30 to 0.70. Every
item is in average, so the items of the test are accepted.
Table IV. 2Indicator 2:
Students are able to identify the communicative purpose of descriptive textthat be listened accurately
IndicatorStudents are Able to Identify Form in The
Text N
Item no. 5 6 7 8
30Correct 19 21 19 24
P 0.50 0.55 0.50 0.63Q 0.50 0.45 0.50 0.37
The description of the table above is that indicator 2 consists of four items
in listening comprehension test. Item number 5 shows the proportion correct 0.50,
item number 6 shows the proportion correct 0.55, Item number 7 shows the
proportion correct 0.50 and item number 8 shows the proportion correct 0.63. The
interpretation of standard difficulty must be in the middle of 0.30 to 0.70. Every
item is in average, so the items of the test are accepted.

Table IV. 3Indicator 3:
Students are able to identify the language features of functional descriptivetext that be listened accurately
IndicatorStudents are Able to Identify Color in the Text
N
Item no. 9 10 11 12
30Correct 19 18 18 19
P 0.50 0.47 0.47 0.50q 0.50 0.53 0.53 0.50
The interpretation of the indicator 3 above, every score in the middle is
0.30 to 0.70. So, all of the items in listening comprehension test are very reliable.
The items for indicator 3 are accepted.
Table IV. 4Indicator 4:
Students are able to identify the language features of descriptive textcarefully and logical thinking
IndicatorStudents are Able to Identify Characteristic in
the Text N
Item no. 13 14 15 16
30Correct 25 17 21 18
P 0.66 0.44 0.55 0.47q 0.34 0.56 0.45 0.53
The description of the table above is that indicator 4 consists of four items
in listening comprehension test. Item number 13 shows the proportion correct
0.66, item number 14 shows the proportion correct 0.44, Item number 15 shows
the proportion correct 0.55 and item number 16 shows the proportion correct 0.47.
The interpretation of standard difficulty must be in the middle of 0.30 to 0.70.
Every item is in average, so the items of the test are accepted.

Table IV. 5Indicator 5:
Students are able to identify the communicative purpose that be listenedaccurately
IndicatorStudents are Able to Respond Question from
the Text N
Item no. 17 18 19 20
30Correct 17 18 22 19
P 0.44 0.47 0.58 0.50Q 0.56 0.53 0.42 0.50
The description of the table above is that indicator 4 consists of four items
in listening comprehension test. Item number 17 shows the proportion correct
0.44, item number 18 shows the proportion correct 0.47, Item number 19 shows
the proportion correct 0.58 and item number 20 shows the proportion correct 0.57.
The interpretation of standard difficulty must be in the middle of 0.30 to 0.70.
Every item is in average, so the items of the test are accepted.
b. Reliability
Furthermore, to analyze the reliability of the instrument, the writer used
Flanagan,s formula quoted by Suharsimi Arikunto.1
r11 = 2
vt
VV 211
Where: r ll : The reliability of instruments
V1 : The variance of variable x
V2 : The variance of variable y
1 Suharsimi Arikunto. Prosedur Penelitian Suatu Pendekatan Praktik. Jakarta: PT. RinekaCipta, 2006, p.184

Vt : Total variance
Before calculating the data by using the formula above, all of the variances
should be found, to look for variances, the writer used the statistic formula below:
V =N
N
XX
2
2
Where: V : Variance
X2 : The total of multiplication uneven score into even score
N : Number of students
1. Calculating the Data
To know the reliability of the test, the writer analyzes it manually by the
formula of statistic above (see appendix to know the process of finding the data).
The data that were needed had been found after it was calculated, they are as
follows:
∑x : 201 ∑xy : 1038
∑y : 197 ∑t : 398
∑x2 : 1149 ∑t2 : 4360
∑y2 : 1135
V1 =N
N
XX
2
2

=38
38
2011149
2
= 38
289,51149 2
=38
973,271149
=38
027,1121
= 29. 50
V2 =N
N
YY
2
2
=38
38
1971135
2
=38
873,261135
=38
1271108
= 29.161
Vt =N
N
tt
2
2
=38
38
3984360
2

= 38
473,104360 2
=38
683,1094360
=38
317,4250
= 111.85
The result of calculation of the variances above are:
V1 = 29. 50
V2 = 29.161
Vt = 111.85
r11 = 2
vt
VV 211
= 2
85,111
161,2950,291
= 2
85,111
161,2950,291
= 285,111
339,01
= 2 (1- 0.003)
= 2 997,0
= 1.994

2. Testing Reliability
Based on the calculation of the data above, the result of r11 is 1.994. To
know the reliability of the rest, it should be consulted with “t-table of product
moment”. If the numbers of students are 38, the significant in 5 % and 1 % are
0.320 and 0.413. It means that 0.320 <1.994> 0.413, in other word, the instrument
of the research is reliable because the result of reliability calculation is higher than
t-table.
B. The Presentation of the Data
The test items were constructed to find out the used of TQLR (Tune,
Question, Listen and Review) strategy toward students’ listening comprehension
at the first year of Junior High School YKPP Dumai. The data analyzed were the
scores of the students’ post-test because it was more influential rather than pre-
test. The function of giving pre-test to all samples was to determine two classes as
the sample of the research before giving them new treatment.
After distributing the test items in form of objective, the test pre-test and
post-test, the writer analyzed those data quantitatively to find their individual
scores at each time of test. The results of listening comprehension for experiment
and control groups are as follows:
1. The Result of Pre-test
The students’ listening comprehension score at the pre-test can be seen in
the following table:

Table 6The Result of Pre-Test
Experimental group Control groupStudents’ code Correct
AnswerScore Students’
codeCorrectAnswer
CorrectAnswer
S-1 8 40 S-1 9 45S-2 11 55 S-2 10 50S-3 11 55 S-3 12 60S-4 11 55 S-4 7 35S-5 7 35 S-5 10 50S-6 11 55 S-6 11 50S-7 8 40 S-7 11 55S-8 13 65 S-8 9 45S-9 8 40 S-9 10 50S-10 7 35 S-10 8 40S-11 12 60 S-11 13 65S-12 9 45 S-12 8 40S-13 12 60 S-13 8 40S-14 9 45 S-14 7 35S-15 7 35 S-15 10 50S-16 11 55 S-16 12 60S-17 14 70 S-17 10 50S-18 10 50 S-18 8 40S-19 10 50 S-19 10 50S-20 11 55 S-20 16 80S-21 11 55 S-21 9 45S-22 7 35 S-22 11 55S-23 8 40 S-23 7 35S-24 10 50 S-24 11 55S-25 11 55 S-25 12 60S-26 9 45 S-26 7 35S-27 12 60 S-27 8 40S-28 11 55 S-28 8 40S-29 10 50 S-29 8 40S-30 10 50 S-30 10 50S-31 8 40 S-31 10 50S-32 12 60 S-32 10 50S-33 12 60 S-33 12 60S-34 8 40 S-34 13 65S-35 9 45 S-35 11 55S-36 8 40 S-36 11 55S-37 8 40 S-37 12 60S-38 6 30 S-38 9 45Total 370 1850 Total 378 1890Mean 9.73 48.68 Mean 9.94 49.73

Based on the data of table 8 above, the writer found that the total correct
answer achieved by experimental group is 370 and the mean score is 9.73. While
the total scores achieved by experimental group is 1850 and the mean score is
48.68. Thus, the students’ pre-test score of the experimental group is categorized
into LESS.
In the same time, the total correct answer achieved by control group is 378
and the mean score is 9.94. The total scores achieved by experimental group are
1890 and the mean score is 49.3. Thus, the students’ pre-test score of the control
group is categorized into LESS. The data above show that the score of
experimental group is not fairly high rather than control group at the pre-test.
2. Homogeneity of the Test
To find out the homogeneity of pre-test, the writer used the formula
below:
In finding “F obtained” above, the standard deviation of students’ score of
experimental and control groups should be found by the table below

Table 7
Mean and Standard Deviation of Pre-Test
StudentsSCORE
X Y X2 Y2Experiment
groupControlgroup
S-1 40 45 -8.68 -4.73 75.34 22.37S-2 55 50 6.32 0.27 39.94 0.07S-3 55 60 6.32 10.27 39.94 105.47S-4 55 35 6.32 -14.73 39.94 216.97S-5 35 50 -13.68 0.27 187.14 0.07S-6 55 50 6.32 0.27 39.94 0.07S-7 40 55 -8.68 5.27 75.34 27.77S-8 65 45 16.32 -4.73 266.34 22.37S-9 40 50 -8.68 0.27 75.34 0.07
S-10 35 40 -13.68 -9.73 187.14 94.67S-11 60 65 11.32 15.27 128.14 233.17S-12 45 40 -3.68 -9.73 13.54 94.67S-13 60 40 11.32 -9.73 128.14 94.67S-14 45 35 -3.68 -14.73 13.54 216.97S-15 35 50 -13.68 0.27 187.14 0.07S-16 55 60 6.32 10.27 39.94 105.47
S-17 70 50 21.32 0.27 454.54 0.07
S-18 50 40 1.32 -9.73 1.74 94.67S-19 50 50 1.32 0.27 1.74 0.07S-20 55 80 6.32 30.27 39.94 916.27S-21 55 45 6.32 -4.73 39.94 22.37S-22 35 55 -13.68 5.27 187.14 27.77S-23 40 35 -8.68 -14.73 75.34 216.97S-24 50 55 1.32 5.27 1.74 27.77S-25 55 60 6.32 10.27 39.94 105.47S-26 45 35 -3.68 -14.73 13.54 216.97S-27 60 40 11.32 -9.73 128.14 94.67S-28 55 40 6.32 -9.73 39.94 94.67S-29 50 40 1.32 -9.73 1.74 94.67S-30 50 50 1.32 0.27 1.74 0.07S-31 40 50 -8.68 0.27 75.34 0.07S-32 60 50 11.32 0.27 128.14 0.07S-33 60 60 11.32 10.27 128.14 105.47S-34 40 65 -8.68 15.27 75.34 233.17S-35 45 55 -3.68 5.27 13.54 27.77S-36 40 55 -8.68 5.27 75.34 27.77S-37 40 60 -8.68 10.27 75.34 105.47S-38 30 45 -18.68 -4.73 348.94 22.37
Total X=1850 Y=1890∑X2=
3484.12∑Y2=3669.5

Mx = 68,4838
1850
N
X
My = 73,4938
1890
N
Y
SDx = 575,968,9138
12,34842
N
X
SDy = 826,956,9638
5,36692
N
Y
F0 = 94,056,96
68,91
82,9
57,92
2
Su
Sb
By comparing Fo = ( 0.94 ) to Ftable ( dk for the highest variance = 38 – 1,
and dk for the lowest variance = 38 – 1 ) at 5% level = (1,80 ) and at 1% level = (
2,11 ), found that Fo was less than Ftable.
The criteria of interpreting:
If : Fo > Ftable, it can be stated Ha was rejected. There is no the homogeneity
variances.
If : Fo < Ftable, it can be stated Ho was accepted. There are the homogeneity
variances.
Based on the result, Fo < Ftable. It meant that Ha was rejected and Ho was
accepted. In conclusion, there were the homogeneity variances of two classes.

THE NORMALITY OF DATA ANALYSIS
TABLE. 8
DISTRIBUTION OF THE DATA IN EXPERIMENTAL CLASS
Interval Class f Xi X’ fX’ fX’2 fXi
80 - 85 6 82.5 2 12 144 495
70 - 75 10 72.5 1 10 100 725
60 – 65 12 62.5 0 0 0 750
50 – 55 4 52.5 -1 -4 16 210
40 – 45 6 42.5 -2 -12 144 255
38 6 404 2435
Table. 9
THE NORMALITY DATA TESTING IN EXPERIMENTAL CLASS
No Class Z- Score The Score 0 -
Z
The Score of
Class
Fe Fo Fo - fe ( Fo – fe )2
fe
1 85,5 1,31 0,4049 0,146 5,548 6 0,452 0,03682
2 75,5 0,70 0,2580 0,226 8.588 10 1,412 0,23215
3 65,5 0,08 0,0319 0,230 8,74 12 3,26 1,21597
4 55.5 -0,52 0.1985 0,172 6,53 4 -2,53 0,98022
5 45,5 -1.13 0.3708 0,054 2,05 6 3,95 7,61097
6 40,5 -1,44 0,4251
∑fo = 38 ∑ ( Fo – fe )2
Fe
= 10,0761

The way to find out the normality of data used Chi Square formula:
1.) Determine the high score and the low score
The high score : 85
The low score : 40
2.) Determine the range :
R = 85 – 40 = 45
3.) Determine the total of class :
Class = 1 + 3,3 log n
= 1 + 3,3 ( log 38)
= 1 + 3,3 ( 1,57)
= 1 + 5,1 = 6.1 = 6
4.) Determine (i)
3.6R
i
5.) Mx = 07.6438
2435
38FXi
= i −= 5 −= 5 10.63 – 0.0225= 5 √10.6075 = 5 (3.2569) = 16.284 = 16.3

6.) Z =
Z1 =. .. = 1.31
Z2 =. .. = 0.70
Z3 =. .. = 0.08
Z4 =. .. = −0.52
Z5 =. .. = −1.13
Z6 =. .. = −1.44
The class wide :
0,4049 – 0,2580 = 0,146 0,1985 – 0,3708 = 0,172
0,2580 – 0,0319 = 0,226 0,3708 – 0,4251 = 0,054
0,0319 + 0,1985 = 0,230
Fe :
0,146 X 38 = 5,548 0,569 X 38 = 6,53
0,226 X 38 = 8,588 0,795 X 38 = 2,05
0,230 X 38 = 8,74

Chi Square :
X = ∑ ( )= 10,0761
Dk = 5 -1 = 4
X was compared to Xtable at 5% significant level 9,488 and at 1% significant
level 13,277. The interpretation of criteria :
1. If X > Xtable, it means that there is no the normal data
2. If X < Xtable, it means that there is the normal data
Conclusion :
Based on the result ( 9,488 > 10,0761< 13,277 ) it means that there is the
normal data.
TABLE. 10
DISTRIBUTION OF THE DATA IN CONTROL CLASS
Interval Class f yi y’ fy’ fy’2 fyi
75 - 80 2 77.5 2 4 16 155
65 – 70 6 67.5 1 6 36 405
55 – 60 14 57.5 0 0 0 805
45 – 50 10 47.5 -1 -10 100 475
35 – 40 6 37.5 -2 -12 144 225
38 -12 296 2065

Table. 11
THE NORMALITY DATA TESTING IN CONTROL CLASS
No Class Z- Score The Score 0 -
Z
The Score of
Class
Fe Fo Fo - fe ( Fo – fe )2
fe
1 80,5 1,31 0,3810 0,004 0,152 2 1,848 2.467
2 70,5 0,70 0,3770 0,207 7,866 6 -1,866 0,442
3 60,5 0,08 0,1700 0,276 10,488 14 3,512 1,176
4 50.5 -0,52 0.1064 0,232 8,816 10 1,184 0,159
5 40,5 -1.13 0.3389 0,074 2,812 6 3,188 3.164
6 35,5 -1,44 0,4131
∑fo = 38 ∑ ( Fo – fe )2
Fe
= 4,50637
The way to find out the normally of data used Chi Square formula :
1. Determine the high score and the low score
The high score : 80
The low score : 35
2. Determine the range :
R = 80 – 35 = 45
3. Determine the total of class :
Class = 1 + 3,3 log n

= 1 + 3,3 log 38
= 1 + 3,3 ( 1,57 )
= 1 + 5,1 = 6,1 = 6
4. Determine ( i )
6R
i
5. My =∑ = = 54.34
Sdy = i − 2Sdy = 5 − 2Sdy = 5 √7.79 − 0.11 = 5 √7.68 = 5 ( 2.771 ) = 13.85
6. Z =
Z1 =. .. = 1.888
Z2 =. .. = 1.166
Z3 =. .. = 0.444
Z4 =, .. = −0,277

Z5 =. .. = −0.999
Z6 =, . = −1.360
The Class Wide :
0,3810 – 0,3770 = 0,004 0,1064 – 0,3389 = -0,232
0,3770 – 0,1700 = 0,207 0,3389 – 0,4131 = -0,074
0,1700 + 0,1064 = 0,276
Fe :
0,004 X 38 = 0,152 -0,232 X 38 = -8,816
0,207 X 38 = 7,866 -o,074 X 38 = -2,812
0,276 X 38 = 10,488
Chi Square :
X = ∑ ( )= 10,
Dk = 5 – 1 = 4
X was compared to Xtable at 5% significant level 11,070 and at 1%
significant level 15,086. The interpretation of criteria :
1. If X > Xtable, it means that there is no the normal data
2. If X < Xtable, it means that there is the normal data
Conclusion :
Based on the result ( 11,070 > 4,50637 < 15,086 ) it means that there is thenormal data.
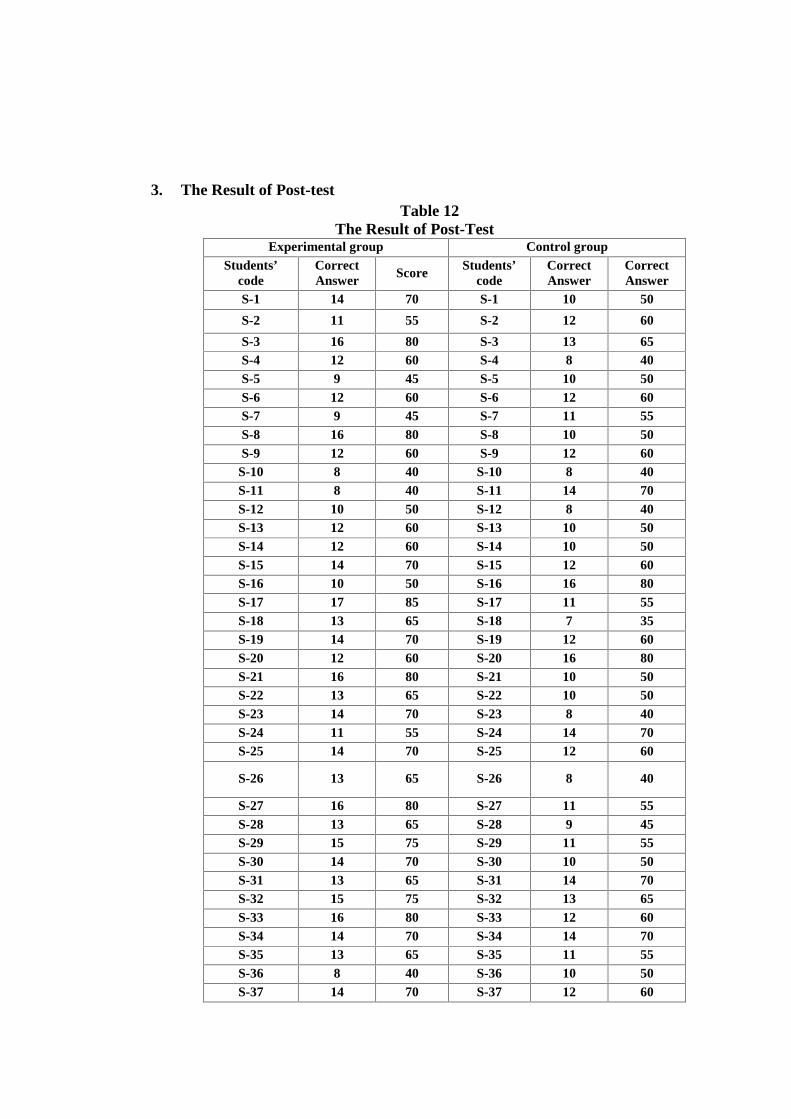
3. The Result of Post-testTable 12
The Result of Post-TestExperimental group Control group
Students’code
CorrectAnswer
ScoreStudents’
codeCorrectAnswer
CorrectAnswer
S-1 14 70 S-1 10 50
S-2 11 55 S-2 12 60
S-3 16 80 S-3 13 65S-4 12 60 S-4 8 40S-5 9 45 S-5 10 50S-6 12 60 S-6 12 60S-7 9 45 S-7 11 55S-8 16 80 S-8 10 50S-9 12 60 S-9 12 60
S-10 8 40 S-10 8 40S-11 8 40 S-11 14 70S-12 10 50 S-12 8 40S-13 12 60 S-13 10 50S-14 12 60 S-14 10 50S-15 14 70 S-15 12 60S-16 10 50 S-16 16 80S-17 17 85 S-17 11 55S-18 13 65 S-18 7 35S-19 14 70 S-19 12 60S-20 12 60 S-20 16 80S-21 16 80 S-21 10 50S-22 13 65 S-22 10 50S-23 14 70 S-23 8 40S-24 11 55 S-24 14 70S-25 14 70 S-25 12 60
S-26 13 65 S-26 8 40
S-27 16 80 S-27 11 55S-28 13 65 S-28 9 45S-29 15 75 S-29 11 55S-30 14 70 S-30 10 50S-31 13 65 S-31 14 70S-32 15 75 S-32 13 65S-33 16 80 S-33 12 60S-34 14 70 S-34 14 70S-35 13 65 S-35 11 55S-36 8 40 S-36 10 50S-37 14 70 S-37 12 60

S-38 8 40 S-38 12 60Total 481 2405 Total 423 2115Mean 12.65 63.28 Mean 11.13 55.65
Based on the description of the data above, the writer found that the total
correct answer achieved by experimental group is 481 and the mean score is
12.65. The total scores achieved by experimental group are 2405 and the mean
score is 63.28. Thus, the students’ post-test score of the experimental group is
categorized into ENOUGH.
In the same time, the total correct answer achieved by control group is 423
and the mean score is 11.13. The total scores achieved by experimental group are
2115 and the mean score is 55.65. Thus, the students’ post-test score of the
control group is categorized into LESS. It means that the score that achieved by
experimental group is higher than control group.

Table 13
Mean and Standrad Deviation of Post-Test
StudentsSCORE
X Y X2 Y2Experiment
groupControlgroup
S-1 70 50 6.72 -5.65 45.15 31.92S-2 55 60 -8.28 4.35 68.55 18.92S-3 80 65 16.72 9.35 279.55 87.42S-4 60 40 -3.28 9.35 10.75 87.42S-5 45 50 -18.28 -5.65 334.15 31.92S-6 60 60 -3.28 4.35 10.75 18.92S-7 45 55 -18.28 -0.65 334.15 0.42S-8 80 50 16.72 -5.65 279.55 31.92S-9 60 60 -3.28 4.35 10.75 18.92
S-10 40 40 -23.28 -15.65 541.95 244.92S-11 40 70 -23.28 14.35 541.95 205.92S-12 50 40 -13.28 -15.65 176.35 244.92S-13 60 50 -3.28 -5.65 10.75 31.92S-14 60 50 -3.28 -5.65 10.75 31.92S-15 70 60 6.72 4.35 45.15 18.92S-16 50 80 -13.28 24.35 176.35 592.92S-17 85 55 21.72 -0.65 471.75 0.42S-18 65 35 1.72 -20.65 2.95 426.42S-19 70 60 6.72 4.35 45.15 18.92S-20 60 80 -3.28 24.35 10.75 592.92S-21 80 50 16.72 -5.65 279.55 31.92S-22 65 50 1.72 -5.65 2.95 31.92S-23 70 40 6.72 -15.65 45.15 244.92S-24 55 70 -8.28 14.35 68.55 205.92S-25 70 60 6.72 4.35 45.15 18.92S-26 65 40 1.72 -15.65 2.95 244.92S-27 80 55 16.72 -0.65 279.55 0.42S-28 65 45 1.72 -10.65 2.95 113.42S-29 75 55 11.72 -0.65 137.35 0.42S-30 70 50 6.72 -5.65 45.15 31.92S-31 65 70 1.72 14.35 2.95 205.92S-32 75 65 11.72 9.35 137.35 87.42S-33 80 60 16.72 4.35 279.55 18.92S-34 70 70 6.72 14.35 45.15 205.92S-35 65 55 1.72 -0.65 2.95 0.42S-36 40 50 -23.28 -5.65 541.95 31.92S-37 70 60 6.72 4.35 45.15 18.92S-38 40 60 -23.28 4.35 541.95 18.92Total X=2405 Y=2115 ∑X2= 5913.5 ∑Y2=

4250.96
Mx = 28,6338
2405
N
X
My = 65.5538
2115
N
Y
SDx = 47.1262.15538
5.59132
N
X
SDy = 57.1087.11138
96.42502
N
Y
4. The Classification of Students’ Listening Comprehension
The writer classified the students’ listening comprehension score in table 11
below:

Table 14
The Classification of Experimental and Control Group
in Listening Comprehension at Post-Test
Students’Code
Experimental Group Control GroupScore Classification Score Classification
S-1 70 Good 50 LessS-2 55 Less 60 EnoughS-3 80 Very Good 65 EnoughS-4 60 Enough 40 FailS-5 45 Fail 50 FailS-6 60 Enough 60 EnoughS-7 45 Fail 60 EnoughS-8 80 Very Good 55 EnoughS-9 60 Enough 50 Enough
S-10 40 Fail 60 EnoughS-11 40 Fail 70 GoodS-12 50 Less 40 FailS-13 60 Enough 50 EnoughS-14 60 Enough 50 EnoughS-15 70 Good 60 EnoughS-16 50 Less 80 Very GoodS-17 85 Very Good 55 EnoughS-18 65 Enough 35 FailS-19 70 Good 60 EnoughS-20 60 Enough 80 Very GoodS-21 80 Very Good 50 EnoughS-22 65 Enough 50 EnoughS-23 70 Good 40 FailS-24 55 Enough 70 GoodS-25 70 Good 60 EnoughS-26 65 Enough 45 FailS-27 80 Very Good 55 EnoughS-28 65 Enough 45 FailS-29 75 Good 55 EnoughS-30 85 Very Good 50 EnoughS-31 65 Enough 70 GoodS-32 75 Good 65 EnoughS-33 80 Very Good 60 EnoughS-34 70 Good 70 GoodS-35 65 Enough 55 EnoughS-36 40 Fail 50 EnoughS-37 70 Good 60 Enough
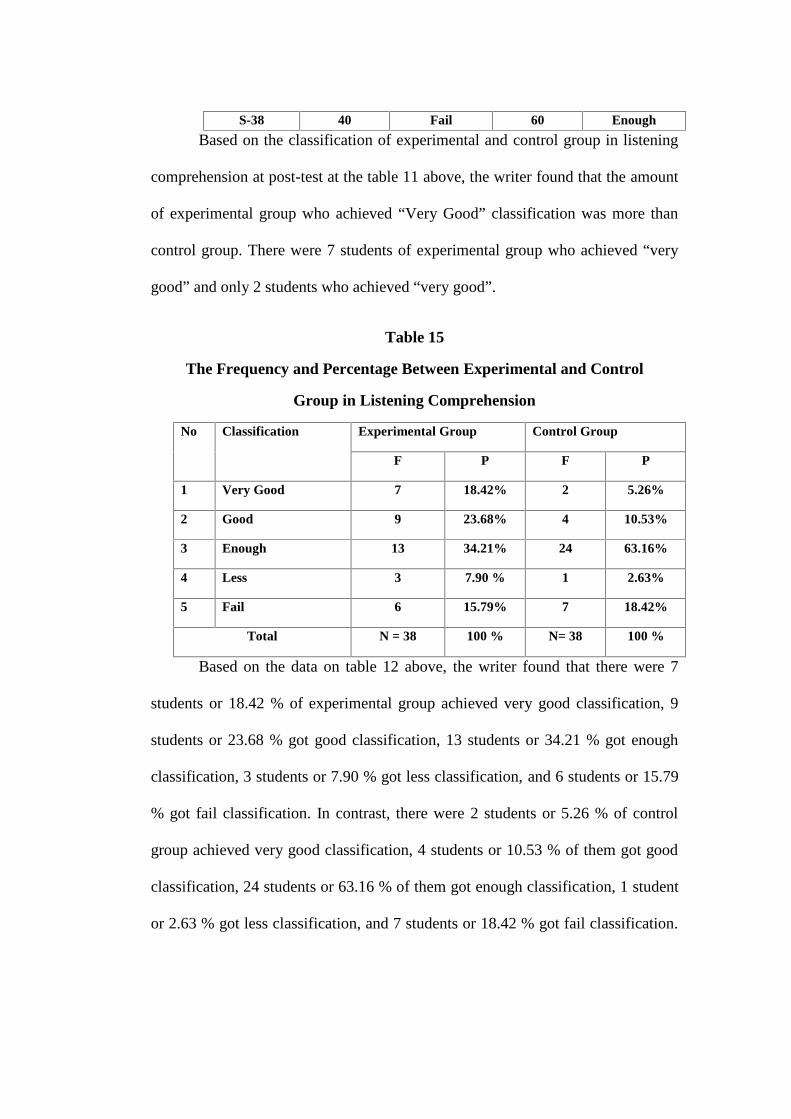
S-38 40 Fail 60 Enough
Based on the classification of experimental and control group in listening
comprehension at post-test at the table 11 above, the writer found that the amount
of experimental group who achieved “Very Good” classification was more than
control group. There were 7 students of experimental group who achieved “very
good” and only 2 students who achieved “very good”.
Table 15
The Frequency and Percentage Between Experimental and Control
Group in Listening Comprehension
No Classification Experimental Group Control Group
F P F P
1 Very Good 7 18.42% 2 5.26%
2 Good 9 23.68% 4 10.53%
3 Enough 13 34.21% 24 63.16%
4 Less 3 7.90 % 1 2.63%
5 Fail 6 15.79% 7 18.42%
Total N = 38 100 % N= 38 100 %
Based on the data on table 12 above, the writer found that there were 7
students or 18.42 % of experimental group achieved very good classification, 9
students or 23.68 % got good classification, 13 students or 34.21 % got enough
classification, 3 students or 7.90 % got less classification, and 6 students or 15.79
% got fail classification. In contrast, there were 2 students or 5.26 % of control
group achieved very good classification, 4 students or 10.53 % of them got good
classification, 24 students or 63.16 % of them got enough classification, 1 student
or 2.63 % got less classification, and 7 students or 18.42 % got fail classification.

So, the highest frequency and percentage achieved by experimental and control
group are “enough classification”.
B. The Data Analysis
The writer analyzed the data manually and categorized it into five levels,
they are very good, good, enough, less, and fail classifications.
1. The Result of Experimental and Control Group on Pre-Test
The description of the students’ listening comprehension on pre-test of
class experimental and control group can be seen in the table 13 below:
Table 16The description of Students’ Score on Pre-Test
Experimental Class (variable X)Score (X) Frequency (f) Fx Percentage Classification
30 1 30 2.63 % Fail35 4 140 10.53 % Fail40 8 320 21.05 % Fail45 4 180 10.53 % Fail50 5 250 13.16 % Less55 9 495 23.68 % Less60 5 300 13.16 % Enough65 1 65 2.63 % Enough70 1 70 2.63 % Good
Total N=38 1850100 %
Mean 48.68Control Class (Variable Y)
Score (x) Frequency (f) Fx Percentage Classification35 4 140 10.53 % Fail40 7 280 18.42 % Fail45 4 180 10.53 % Fail50 10 500 26.31 % Less55 5 275 13.16 % Less60 5 300 13.16 % Enough65 2 130 5.26 % Enough80 1 80 2.63 % Very good
Total N=38 1890100 %
Mean 49.73

2. The Result of Experimental and Control Group on Post-Test
The description of the students’ listening comprehension on pre-test of
class experimental and control group can be seen in the table 14 below:
Table 17
The description of Students’ Score at Post-Test
Experimental Class (Variable X)Score (x) Frequency (f) fx Percentage Classification
40 4 160 10.53 % Fail45 2 90 5.26 % Fail50 2 100 5.26 % Less55 2 110 5.26 % Less60 6 360 15.79 % Enough65 6 390 15.79 % Enough70 8 560 21.05 % Good75 2 150 5.26 % Good80 5 400 13.16 % Very good85 1 85 2.63 % Very good
Total N= 38100 %
MeanControl Class (Variable Y)
Score(Y) Frequency (f) fY Percentage Classification35 1 35 2.63 % Fail40 5 200 13.16 % Fail45 1 45 2.63 % Fail50 9 450 23.68 % Less55 5 275 13.16 % Less60 9 540 23.68 % Enough65 2 130 5.26 % Enough70 4 280 10.53 % Good80 2 16 5.26 % Very good
Total N= 38100 %
Mean

3. The effect of Using TQLR (Tune, Question, Listen and Review) Strategy
toward Students’ Listening Comprehension
To prove whether there is or no significant effect of using TQLR (Tune,
Question, Listen and Review) strategy toward students’ listening comprehension,
the researcher analyzed the post-test data by comparing scores of both experiment
and control group manually by T-test formula. The T-test formula which was used
was adopted from Sugiyono book, the formula as follow:2
to =
a. Finding Mean and Standard Deviation of Experimental Group
2 Prof. Dr Sugiyono.. Statistika untuk Penelitian. (Bandung : Alfa Beta, 2011). p. 138.

Table 18
The Students’ Gain Post – Test Score In Experimental Class
Students’ Code Post Test Pre Test X x x2
S-1 70 40 30 15.79 249.32
S-2 55 55 0 -14.21 201.92
S-3 80 55 25 10.79 116.42
S-4 60 55 5 -9.21 84.82
S-5 45 35 10 -4.21 17.72
S-6 60 55 5 -9.21 84.82
S-7 45 40 5 -9.21 84.82
S-8 80 65 15 0.79 0.62
S-9 60 40 20 5.79 33.52
S-10 40 35 5 -9.21 84.82
S-11 40 60 -20 -5.79 33.52
S-12 50 45 5 -9.21 84.82
S-13 60 60 0 -14.21 201.92
S-14 60 45 15 0.79 0.62
S-15 70 35 35 20.79 432.22
S-16 50 55 -5 -9.21 84.82
S-17 85 70 15 0.79 0.62
S-18 65 50 5 -9.21 84.82
S-19 70 50 20 5.79 33.52
S-20 60 55 5 -9.21 84.82
S-21 80 55 25 10.79 116.42
S-22 65 35 30 15.79 249.32
S-23 70 40 30 15.79 249.32
S-24 55 50 5 -9.21 84.82
S-25 70 55 15 0.79 0.62
S-26 65 45 20 5.79 33.52
S-27 80 60 20 5.79 33.52
S-28 65 55 10 -4.21 17.72
S-29 75 50 20 5.79 33.52
S-30 70 50 20 5.79 33.52
S-31 65 40 25 10.79 116.42
S-32 75 60 15 0.79 0.62
S-33 80 60 20 5.79 33.52
S-34 70 40 30 15.79 249.32
S-35 65 45 20 5.79 33.52
S-36 40 40 0 -14.21 201.92

S-37 70 40 30 15.79 249.32
S-38 40 30 10 -4.21 17.72
Total 2405 1850 540 3755.16
Based on the table above, the writer found some calculation as follows:
1. Mx = 21.1438
540
N
x
2. SDx =N
x 2
=38
16.3755
= 82.98
= 9.94
b. Finding Mean and Standard Deviation of Control Group

Table 19The Students’ Gain Post – Test Score In Control Class
Students’ Code Post Test Pre Test X x x2
S-1 50 45 5 -0.78 0.61
S-2 60 55 10 4.22 17.81
S-3 60 50 5 -0.78 0.61
S-4 65 60 5 -0.78 0.61
S-5 40 35 0 -5.78 33.41
S-6 50 50 10 4.22 17.81
S-7 60 50 0 -5.78 33.41
S-8 55 55 5 -0.78 0.61
S-9 50 45 10 4.22 17.81
S-10 60 50 0 -5.78 33.41
S-11 40 40 5 -0.78 0.61
S-12 70 65 0 -5.78 33.41
S-13 40 40 10 4.22 17.81
S-14 50 40 15 9.22 85.1
S-15 50 35 10 4.22 17.81
S-16 60 50 20 14.22 202.21
S-17 80 60 5 -0.78 0.61
S-18 55 50 -5 0.78 0.61
S-19 35 40 10 4.22 17.81
S-20 60 50 0 -5.78 33.41
S-21 80 80 5 -0.78 0.61
S-22 50 45 -5 0.78 0.61
S-23 50 55 5 -0.78 0.61
S-24 40 35 15 9.92 85.1
S-25 70 55 0 -5.78 33.41
S-26 60 60 5 -0.78 0.61
S-27 40 35 15 9.22 85.1
S-28 55 40 5 -0.78 0.61
S-29 45 40 15 9.22 85.1
S-30 55 40 0 -5.78 33.41
S-31 50 50 20 14.22 202.21
S-32 70 50 5 -0.78 0.61
S-33 60 60 0 -5.78 33.41
S-34 70 65 5 -0.78 0.61
S-35 55 55 0 -5.78 33.41
S-36 50 55 -5 0.78 0.61

S-37 60 60 0 -5.78 33.41
S-38 60 45 15 9.22 85.1
Total 2115 1890 220 1280.03
Based on the table above, the writer found some calculation as follows:
1. My = 78.538
220
N
y
2. SDy =N
y 2
=38
03.1280
= 69.33
= 5.80
After finding the mean score and the standard deviation of experimental
and control groups, the writer analyzed the data by using T-test:
to =
=. .. .
=.√ . .
=.√ .
=..
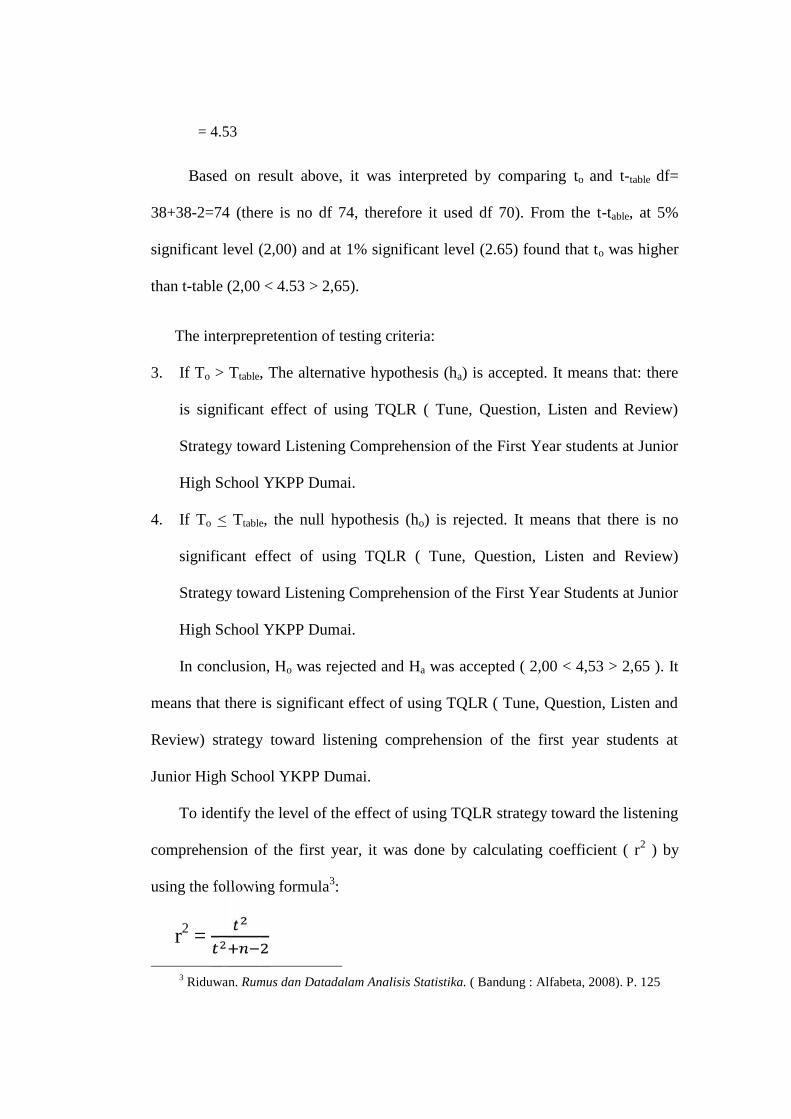
= 4.53
Based on result above, it was interpreted by comparing to and t-table df=
38+38-2=74 (there is no df 74, therefore it used df 70). From the t-table, at 5%
significant level (2,00) and at 1% significant level (2.65) found that to was higher
than t-table (2,00 < 4.53 > 2,65).
The interprepretention of testing criteria:
3. If To > Ttable, The alternative hypothesis (ha) is accepted. It means that: there
is significant effect of using TQLR ( Tune, Question, Listen and Review)
Strategy toward Listening Comprehension of the First Year students at Junior
High School YKPP Dumai.
4. If To < Ttable, the null hypothesis (ho) is rejected. It means that there is no
significant effect of using TQLR ( Tune, Question, Listen and Review)
Strategy toward Listening Comprehension of the First Year Students at Junior
High School YKPP Dumai.
In conclusion, Ho was rejected and Ha was accepted ( 2,00 < 4,53 > 2,65 ). It
means that there is significant effect of using TQLR ( Tune, Question, Listen and
Review) strategy toward listening comprehension of the first year students at
Junior High School YKPP Dumai.
To identify the level of the effect of using TQLR strategy toward the listening
comprehension of the first year, it was done by calculating coefficient ( r2 ) by
using the following formula3:
r2 =
3 Riduwan. Rumus dan Datadalam Analisis Statistika. ( Bandung : Alfabeta, 2008). P. 125

r2 =..
r2 =..
r2 = 0.2171044
To find out the percentage of coefficient effect ( Kp ), it used the followig
formula :
Kp = r2 X 100%
Kp = 0.2171044 X 100%
Kp = 21.71%
Based on the analysis data about the students ability in comprehending
descriptive text, it showed that mean of the students’ ability in comprehending
descriptive text by using TQLR strategy was higher than mean of the students’
ability in comprehending descriptive without using TQLR strategy.
The differences treatment of two classes taught to the homogeny students
caused the differences students’ scores in comprehending descriptive text.
Therefore, the result of this analysis could answer the formulation of the
problem:
1. The students’ ability of the first year students at Junior High School
YKPP Dumai in comprehending descriptive text without using TQLR
(Tune, Question, Listen and Review) strategy was lower. It was caused
by different treatment used in teaching learning process.

2. The students’ ability of the first year students at Junior High School
YKPP Dumai in comprehending descriptive text by using TQLR (Tune,
Question, Listen and Review) strategy was higher.
3. There is significant effect of using TQLR ( Tune, Question, Listen and
Review) strategy in comprehending descriptive text of the first year
students at Junior High School YKPP Dumai.


CHAPTER V
CONCLUSION AND SUGGESTION
A. CONCLUSION
By looking all the data analysis the writer can make some conclusions as
follows:
1. The students’ listening comprehension score in experimental group is
not higher than control group on pre-test. It can be seen from mean score
of both groups. The mean score of experimental is 48.68, while the mean
score of control group is 49.73
2. The students’ listening comprehension score taught by TQLR strategy is
higher than control group on post-test. It can be proved by looking at the
total and mean score of both groups. The total score of experimental
group is 2405 and the mean is 63.28. Besides, the total score of control
group is 2115 and the mean score is 55.65.
3. The H0 (Hypothesis Null) is rejected and Ha(Hypothesis Alternative) is accepted, in
other words, TQLR gives effect toward student’ listening comprehension
at the first year of junior high school YKPP Dumai. It can be seen from
the result of data calculation. The result of t-test is 2.71. The writer
found that 2.00 < 2.71 > 2.65. it indicates that tobserved is higher than ttable
in significant 5% and 1 %.
In brief, the differences scores between students in experimental class
and students in control class are influenced by different treatment. It causes the

students’ ability in listening comprehension taught by using TQLR strategy has
the significant positive effect than the students taught without using TQLR
strategy.
B. SUGGESTION
Based on the research finding above, the writer would like to give some
suggestion to:
1. The head master of Junior High School YKPP is expected to give the
support for the teacher to teach better, especially to English teacher, and
complete the facilities of teaching learning process. Besides, the head
master should help English teacher to find the suitable strategy for the
students.
2. The English teacher should be creative in selecting the strategy that can
be used in English teaching, especially in teaching listening in order to
make the students’ listening comprehension better. Based on the
research findings, there is a significant effect of TQLR strategy toward
students’ listening comprehension. It means that, TQLR can be applied
to increase students’ listening comprehension. TQLR strategy is one of
them strategy to teaching listening. So, teacher can apply this strategy to
increase students’ listening comprehension.
3. Other researchers, the findings of this research are subject matters which
can develop largely and deeply by adding other variables or to enlarge
the sample.

BIBLIOGRAPHY
Bambang Setiyadi. Metode Penelitian untuk Pengajaran Bahasa AsingPendekatan Kuantitatif dan Kualitatif. Yogyakarta: Graha Ilmu,2006.
Collier, Catherine. Learning Support Team (LST) Strategies. 2003.
Creswell, John W. Educational Research: Planning, Conducting, and EvaluatingQuantitative and Qualitative Research. New Jersey: PearsonEducation Ltd., 2008.
English Language Arts B10 Module 1: Equality Lesson.
Fox J, W. Teaching Listening Skills. English Forum. USA : Prentice Hall, 1970.
Global, Admin. Listening: the TQLR Process. 06-04-2011 04:20 A.Mhttp://www.anriintern.com/selected_news_500119.
Harmer, Jeremy. The Practice of English Language Teaching. Cambridge, UK :Logman, 2001.
Hartono.. Statistik untuk Penelitian. Yogyakarta : Pustaka Pelajar, 2009.
Jack . C. Richards and Richard Schmidt. Longman Dictionary of LanguageTeaching and Applied Linguistics. Third Edition .New York:Pearson Education, 2002.
Mac, Yin Mee. Teaching Listening- An Overview. University of Malaya : TheEnglish Teacher Vol XIX July 1990.
Manzo, Anthony V and Ula V Manzo. Teaching Children to be Literate : AReflective Approach. New York : Harcourt Brace College Publisher,1995.
Mardhatillah. “A Study on the Sixth Semester Students’ Ability in ListeningComprehension after Viewing Video Programs at the English StudyProgram FKIP-UNRI. 2007.” Unpublished.
Nation, I S P and Jonathan Newton. Teaching ESL / EFL Listening and Speaking.New York and London : Routledge Taylor & Francis Group, 2008.
Nunan, David, Designing Tasks for the Communicative Classroom. Cambridge:Cambridge University Press, 2007.
Ummi Rasyidah. “The Correlation between Critical Thinking and StudentsListening Comprehension Ability at SMAN 1 Kampar. 2009.” p. 20-21 Unpublished.

Rika Ariani. “The Use of English Songs in Listening Sounds Discrimination bythe Third Year Students at SMP N 3 Pasir Penyu. 2007.” Unpublished
Richards. C and John Platt. Heidi Platt. Language Teaching and AppliedLinguistics, Logman Dictionary. England : Pearson Educator Limited,1999.
Robert, Reid and Torri Ortiz Lienemann. Strategy Instruction for Students withLearning Disabilities. New York : The Guilford Press, 2006.
Sampler. Listen Take Note Primary, Teacher Edition. New York: Silver MoonPress, 2009.
Saricoban, Arif. The Teaching of Listening. Hacettepe University (Beytepe-Ankara, Turkey). Journal, Vol. V, No. 12, December 1999.
http://iteslj.org/Articles/Saricoban-Listening.html
M.Syafii S. From Paragraph to a Research Report: A writing of English forAcademic Purpose. Pekanbaru: Lembaga Bimbingan Belajar SyafIntensive, 2007.
Sugiyono. Statistika untuk Penelitian. Bandung : Alfa Beta, 2011.
Suharsimi Arikunto. Prosedur Penelitian: Suatu Pendekatan Praktik. Edisi RevisiVI. Jakarta: Rineka Cipta, 2006.
Syllabus of SMP YKPP DUMAI 2010 / 2011. Unpublished.
Underword, Mary. Teaching Listening. London and New York : Logman, 1989.