the effect of sulfur in rotary kiln fuels on nickel
TRANSCRIPT

The Effect of Sulfur in Rotary Kiln Fuels on Nickel Laterite
Calcination
by
Muhammad Haziq Uddin
B.A.Sc., The University of British Columbia, 2017
A THESIS SUBMITTED IN PARTIAL FULFILLMENT OF
THE REQUIREMENTS FOR THE DEGREE OF
MASTER OF APPLIED SCIENCE
in
THE FACULTY OF GRADUATE AND POSTDOCTORAL STUDIES
(Materials Engineering)
THE UNIVERSITY OF BRITISH COLUMBIA
(Vancouver)
January 2020
© Muhammad Haziq Uddin, 2020

ii
The following individuals certify that they have read, and recommend to the Faculty of Graduate
and Postdoctoral Studies for acceptance, a thesis/dissertation entitled:
The Effect of Sulfur in Rotary Kiln Fuels on Nickel Laterite Calcination
submitted by Muhammad Haziq Uddin in partial fulfillment of the requirements for
the degree of Master of Applied Science
in Materials Engineering
Examining Committee:
Leili Tafaghodi Khajavi, Materials Engineering
Supervisor
David Dreisinger, Materials Engineering
Supervisory Committee Member
Edouard Asselin, Materials Engineering
Supervisory Committee Member

iii
Abstract
Rotary Kiln - Electric Furnace (RKEF) process is the most commonly used
pyrometallurgical technique for processing nickel laterite ores and is mainly suited for saprolite
deposits. Sulfur is one of the most harmful elements in crude ferronickel obtained via the RKEF
process and adversely affects the mechanical properties of the final product. Typically, laterite
ores contain insubstantial sulfur content; hence, it is hypothesized that most of the sulfur in crude
ferronickel originates from the coal added as the fuel and the reductant during calcination in the
rotary kiln. This study investigates the role of sulfur content of rotary kiln fuels on the composition
of the calcine.
The calcination-partial reduction experiments were conducted in a furnace at 900 oC for a
2-hour residence time. Various reducing gas mixtures representing combustion product of rotary
kiln fuels (i.e., coal) were contacted with the ore. The sulfur content of the resulting calcines were
measured by ICP-AES analysis. At constant PCO, the sulfur content of the calcine increases linearly
with an increase in PSO2 in the input gas mixtures. Similarly, at fixed PSO2, the percentage of sulfur
in the calcine and sulfur deportation increase with PCO. However, an exceptional case is observed
at PSO2 = 0 atm, where the sulfur content and sulfur deportation slightly decrease by increasing PCO
in the input gas. The sulfur content and the percentage of sulfur deportation drop at a lower input
flow rate of the reducing gas mixtures. Lastly, the sum of the metallized and sulfurized iron/nickel
was found to increase with an increase in PSO2.

iv
Lay Summary
Rotary Kiln - Electric Furnace (RKEF) process is a pyrometallurgical technique to extract
nickel from laterite ores. It is essentially a two-step process where the ore is first calcined in a
rotary kiln and then smelted in an electric furnace. The product of the RKEF process is crude
ferronickel (iron-nickel alloy), which needs to be refined for impurities such as sulfur. Sulfur is
one of the most harmful impurity elements in ferronickel and degrades mechanical properties of
the material. The rotary kiln is heated by combustion of fuels such as coal, which contain sulfur as
an impurity. This study investigates the relationship between the sulfur content of rotary kiln fuel
and the calcine.

v
Preface
This thesis is the original, independent, and unpublished work by the author,
Muhammad Haziq Uddin.

vi
Table of Contents
Abstract ................................................................................................................................... iii
Lay Summary ........................................................................................................................... iv
Preface ....................................................................................................................................... v
Table of Contents ..................................................................................................................... vi
List of Tables ............................................................................................................................ ix
List of Figures............................................................................................................................ x
List of Symbols ....................................................................................................................... xiv
List of Abbreviations ............................................................................................................... xv
Acknowledgments .................................................................................................................. xvi
Chapter 1: Introduction ............................................................................................................ 1
Chapter 2: Literature Review ................................................................................................... 3
2.1 Nickel Laterite Ores .....................................................................................................3
2.1.1 Oxide Deposits .............................................................................................3
2.1.2 Hydrous Magnesium Silicates Deposits ........................................................3
2.1.3 Clay Silicate Deposits...................................................................................4
2.2 Processing of Nickel Laterite Ores ...............................................................................4
2.2.1 High-Pressure Acid Leaching .......................................................................5
2.2.1.1 Mixed-Sulfide Precipitation ...................................................................7

vii
2.2.1.2 Mixed-Hydroxide Precipitation..............................................................8
2.2.2 Caron Process (Yabulu Modification) ...........................................................9
2.2.3 Blast or Submerged Arc Furnace Smelting ................................................. 11
2.2.4 Rotary Kiln Electric Furnace Process (Ferronickel Production) .................. 12
2.2.4.1 Drying ................................................................................................. 14
2.2.4.2 Calcination and Partial Reduction ........................................................ 15
2.2.4.3 Smelting .............................................................................................. 16
2.2.4.4 Refining .............................................................................................. 18
2.2.5 Rotary Kiln Electric Furnace Process (Matte Production) ........................... 19
2.2.5.1 Roasting of Sulfide Matte ....................................................................... 22
2.3 The Behavior of Laterite Ores in Carbo-Sulfurizing Gas Mixture............................... 24
2.4 Scope and Objectives ................................................................................................. 29
Chapter 3: Materials and Methods ........................................................................................ 31
3.1 Materials.................................................................................................................... 31
3.2 Characterization of Raw Materials ............................................................................. 31
3.3 Preliminary Processing of the Raw Materials ............................................................. 34
3.4 Calcination and Partial Reduction Experiments .......................................................... 36
3.5 Chemical Analysis ..................................................................................................... 42
3.5.1 Inductively Coupled Plasma - Atomic Emission Spectroscopy ................... 42

viii
3.5.2 X-ray Diffraction, Scanning Electron Microscopy and Energy Dispersive X-
ray Spectroscopy ............................................................................................................... 45
Chapter 4: Thermodynamic Analysis .................................................................................... 46
4.1 Model Description ..................................................................................................... 46
4.2 Model Results ............................................................................................................ 50
Chapter 5: Experimental Results and Discussion .................................................................. 56
5.1 The Effect of PSO2 on the Sulfur Content of the Calcine ............................................. 56
5.2 The Effect of PCO on the Sulfur Content and Sulfur Deportation in the Calcine .......... 60
5.3 The Effect of the Flow Rate of the Input Gas on % S in the Calcine ........................... 65
5.4 X-ray Diffraction of the Calcine................................................................................. 68
5.5 The Effect PSO2 on Sum of Metallized and Sulfurized Iron and Nickel ....................... 70
5.6 Energy Dispersive Analysis of the Calcine ................................................................. 72
Chapter 6: Conclusion ............................................................................................................ 74
Chapter 7: Future Work ......................................................................................................... 76
References................................................................................................................................ 77

ix
List of Tables
Table 2.1 Possible sulfurization reactions for Fe2O3 and NiO at 900 ºC in CO-SO2 system ........ 24
Table 3.1 Chemical assay of the raw ore.................................................................................... 32
Table 3.2 Composition of the coal added as the reductant .......................................................... 33
Table 3.3 The gas flow rates for the calcination and partial reduction experiments at 900 oC and 2-
hour residence time with total input flow rate of 292 ml/min ..................................................... 40
Table 3.4 The gas flow rates for the calcination and partial reduction experiments at 900 oC and 2-
hour residence time with total input flowrate of 176 ml/min ...................................................... 41
Table 4.1 List of all the considered species in thermodynamic analysis ..................................... 46
Table 4.2 Initial and equilibrium partial pressure of different components of the gas mixtures at
900 oC ....................................................................................................................................... 48
Table 4.3 Standard Gibbs free energies of the reactions between species containing iron/nickel in
the laterite ore and CO-SO2 atmosphere at 900 ºC ..................................................................... 49
Table 5.1 % Atomic concentration on selected points for calcine produced at 900 oC under PCO
and PSO2 equal to 0.51 and 0.0216 atm, respectively .................................................................. 73

x
List of Figures
Figure 2.1 An idealized profile of laterite ores from surface to bedrock [1]..................................4
Figure 2.2 HPAL process flowsheet with mixed-sulfide precipitation [1] ....................................6
Figure 2.3 Mixed-hydroxide precipitation flowsheet [24] ............................................................8
Figure 2.4 Caron process flowsheet with Yabulu modification [1, 23, 24] ................................. 10
Figure 2.5 The process flowsheet of the RKEF route [1] ........................................................... 13
Figure 2.6 (a) Shielded-arc electric furnace (b) Immersed electrode electric furnace [33] .......... 18
Figure 2.7 PT Inco sulfide-matte smelting flowsheet [1] ............................................................ 21
Figure 2.8 Peirce-Smith converter [1] ........................................................................................ 22
Figure 2.9 Oxidation roasting of sulfide-matte [1] ..................................................................... 23
Figure 2.10 Equilibrium partial pressure of gaseous components at 700 oC in CO-SO2 system of
various compositions [39] ......................................................................................................... 26
Figure 2.11 TGA curves of Fe2O3 samples at 700 oC in CO-SO2 atmosphere with various
compositions [39] ...................................................................................................................... 27
Figure 2.12 TGA curves of Fe2O3 samples at XCO = 0.66 for various temperatures [39] ............ 28
Figure 2.13 TGA curves of laterite samples at 700 oC in CO-SO2 system of various composition
[40] ........................................................................................................................................... 29
Figure 3.1 XRD pattern of the raw ore....................................................................................... 33
Figure 3.2 (a) Oven (b) Mortar grinder mill ............................................................................... 34
Figure 3.3 (a) As-received ore (b) Dried ore (c) Ground ore (d) Ground coal ............................. 35

xi
Figure 3.4 Particle size distribution of the ground ore ................................................................ 35
Figure 3.5 Furnace temperature calibration by comparing the values obtained from internal and
external thermocouple ............................................................................................................... 37
Figure 3.6 (a) Gas cylinders (b) Mass flow controllers (c) Gas mixing column (d) Gas inlet to the
furnace ...................................................................................................................................... 38
Figure 3.7 (a) Complete experimental setup (b) Quartz reactor .................................................. 39
Figure 3.8 Temperature cycle for calcination and partial reduction experiments ........................ 41
Figure 3.9 Ball mill grinder ....................................................................................................... 43
Figure 3.10 Muffle furnace ........................................................................................................ 43
Figure 3.11 (a) Reduced calcine (b) KOH pellets (c) Zirconium crucible (d) Leached solution .. 44
Figure 4.1 Predicted sulfur content of the calcine produced at 900 oC for various amount of gas
mixtures (a) experimental amounts listed in Table 3.3 (b) one - fourth of the experimental amounts
(c) one - eighth of the experimental amounts ............................................................................. 52
Figure 4.2 Predicted grades (i.e., percentages of iron and nickel in ferronickel alloy) at 900 oC for
experiments listed in Table 3.3 (a-c) nickel (d-f) iron ................................................................ 53
Figure 4.3 Predicted metallization of nickel/iron at 900 oC for experiments listed in Table 3.3 (a-
c) nickel (d-f) iron ..................................................................................................................... 54
Figure 4.4 Predicted sulfurization of nickel/iron at 900 oC for experiments listed in Table 3.3 (a-c)
nickel (d-f) iron ......................................................................................................................... 55
Figure 5.1 The effect of PSO2 on the sulfur content of the calcine produced at 900 oC and PCO =
0.39 atm .................................................................................................................................... 57

xii
Figure 5.2 The effect of PSO2 on the sulfur content of the calcine produced at 900 oC and PCO =
0.45 atm .................................................................................................................................... 58
Figure 5.3 The effect of PSO2 on the sulfur content of the calcine produced at 900 oC and PCO =
0.51 atm .................................................................................................................................... 58
Figure 5.4 The effect of PSO2 on the sulfur content of the calcine produced at 900 oC and PCO =
0.57 atm .................................................................................................................................... 59
Figure 5.5 The effect of PSO2 on the sulfur content of the calcine produced at 900 oC and PCO =
0.63 atm .................................................................................................................................... 59
Figure 5.6 Comparison of experimentally obtained % S values with thermodynamic simulations
................................................................................................................................................. 60
Figure 5.7 The effect of PCO on the sulfur content and sulfur deportation of the calcine produced at
900 ºC and PSO2 = 0 atm ............................................................................................................ 61
Figure 5.8 The effect of PCO on the sulfur content and sulfur deportation of the calcine produced at
900 ºC and PSO2 = 0.0072 atm .................................................................................................... 61
Figure 5.9 The effect of PCO on the sulfur content and sulfur deportation of the calcine produced at
900 ºC and PSO2 = 0.0144 atm .................................................................................................... 62
Figure 5.10 The effect of PCO on the sulfur content and sulfur deportation of the calcine produced
at 900 ºC and PSO2 = 0.0216 atm ................................................................................................ 62
Figure 5.11 The effect of PCO on the sulfur content and sulfur deportation of the calcine produced
at 900 ºC and PSO2 = 0.0288 atm ................................................................................................ 63

xiii
Figure 5.12 The effect of PCO on the sulfur content and sulfur deportation of the calcine produced
at 900 ºC and PSO2 = 0.0360 atm ................................................................................................ 63
Figure 5.13 Comparison of experimentally obtained % S values with those predicted by the model
................................................................................................................................................. 65
Figure 5.14 The effect of gas flow rate on % S in the calcine for a 2-hour residence time at 900 ºC
................................................................................................................................................. 67
Figure 5.15 The effect of gas flow rate on % sulfur deportation in the calcine for a 2-hour residence
time at 900 ºC ........................................................................................................................... 67
Figure 5.16 XRD pattern of the calcine produced at 900 ºC under PSO2 = 0.0360 atm and PCO =
0.39 atm .................................................................................................................................... 69
Figure 5.17 XRD pattern of the calcine produced at 900 ºC under PSO2 = 0.0360 atm and PCO =
0.51 atm .................................................................................................................................... 69
Figure 5.18 XRD pattern of the calcine produced at 900 ºC under PSO2 = 0.0360 atm and PCO =
0.63 atm .................................................................................................................................... 70
Figure 5.19 Sum of metallized and sulfurized iron/nickel in the calcine produced at 900 oC ...... 71
Figure 5.20 (a) SEM image of the calcine produced at 900 oC under PCO = 0.51 atm and PSO2 =
0.0216 atm (b-f) EDS mapping of iron, sulfur, silicon, and magnesium ..................................... 72

xiv
List of Symbols
∆G° Standard Gibbs free energy
D Diffusion coefficient
ds Diameter of particle
kg Gas-solid mass transfer coefficient
M Molar
Px Partial pressure of x (gas)
Re Reynolds number
Sc Schmidt number
Sh Sherwood number
v Velocity
μg Gas viscosity
ρg Gas density

xv
List of Abbreviations
BNC Basic nickel carbonate
BVM Bureau Veritas Minerals
HPAL High-pressure acid leaching
ICP-AES Inductively coupled plasma - atomic emission spectroscopy
LOI Loss on ignition
MH Mixed hydroxide
MS Mixed sulfide
NPI Nickel pig iron
PLS Pregnant leach solution
RKEF Rotary kiln - electric furnace
STP Standard temperature and pressure
XRD X-ray diffraction
XRF X-ray fluorescence

xvi
Acknowledgments
I would like to acknowledge the continuous trust, support, and encouragement from my
supervisor, Dr. Leili Tafaghodi. Without her guidance, this thesis would not be completed.
Furthermore, I am thankful to our sponsors Hatch and Mitacs for providing financial support for
this project.
I am grateful to my friend and mentor, Dr. Kashif Mairaj Deen, for his consistent moral
and technical support. Thank you for providing your valuable time whenever I encountered
challenges in my research.
I would like to thank Maureen Soon for all the help she provided in conducting ICP
analysis. I really appreciate Yuchang Xiao for assisting me in experimentation and analysis during
this study. Furthermore, I would like to acknowledge the cooperation of Sahand Sarbishei in
setting up the lab equipment and always providing useful suggestions whenever needed.
I am indebted to all my friends, especially Mohammad Rizvi and Usman Nasim, for their
unconditional support throughout my research work. Thank you for always being there for me and
never letting me feel alone.
Lastly, I appreciate the love and support of my family, without whom none of my
accomplishments were possible.

1
Chapter 1: Introduction
Nickel is a critical alloying element in stainless steel due to its excellent corrosion
resistance, workability, and strength [1]. The manufacturing of stainless steel consumes almost
two-thirds of the nickel produced globally, while the remaining is consumed in the production of
superalloys, non-ferrous alloys, copper alloys, electroplating, and batteries [1, 2]. The growth of
the stainless steel industry is the main driving force behind the increasing demand for nickel. As a
result, the annual nickel production has increased from 1.1 million tonnes to 1.6 million tonnes in
the first decade of the 21st century [3]. Stainless steel is the primary market for nickel; however,
nickel demand for batteries is rapidly growing and expected to influence the market in near future
[4].
Nickel ores are divided into two main categories; sulfide and laterite. The total reserves for
nickel are estimated to be approximately 100 million tonnes [5], with laterite ores representing
72 % of the deposits. In 2003, laterite ores accounted for only 42 % of the primary nickel
production [5]. The production of nickel from laterite ores has steadily increased, and was reported
60 % in 2013 [6, 7]. The difference in the available resources and production from the laterite ores
is due to their higher energy consumption and challenges in beneficiation processes. However, as
a result of continued depletion of sulfide ores and increasing demand for nickel, laterite ores are
becoming an essential source for nickel [9].
There are two notable sub-divisions in a laterite profile; limonite and saprolite. These are
separate layers of the same deposit but sub-divided based on the nickel-bearing host minerals.
Limonite accounts for approximately 60 % of the total laterite resources, while saprolite is about
32 %. The remaining 8 % is found as a layer between limonite and saprolite, and is usually known
as smectite [7, 9]. Generally, limonite ores are treated using hydrometallurgical processes due to

2
their high iron and low magnesia and nickel content. On the other hand, saprolite ores are
economically processed using pyrometallurgical methods because of their relatively low iron and
high magnesia and nickel content [11].
The rotary kiln-electric furnace (RKEF) process is the primary method for extracting nickel
from saprolite ores. In this technique, the ore is first calcined and pre-reduced at 850 - 1000 oC in
a rotary kiln followed by smelting in an electric furnace at 1500 - 1600 oC [11, 12]. The resulting
crude ferronickel is refined before casting to remove impurities such as sulfur, phosphorus, and
carbon [14]. The final ferronickel product typically contains 30 % nickel and 70 % iron. The RKEF
process is energy-intensive and requires both fossil fuel and electric power [6]. It is difficult to
concentrate the ore before processing, and substantially all of it undergoes the high energy-
consuming steps, such as calcination and smelting. The ore is usually wet and needs drying before
subsequent operations. The high magnesia content of the ore increases the melting temperature
[1, 8]. Therefore, the profit margins in the RKEF process are slim and require the need to cut costs
across the board [15].
Sulfur is one of the deleterious elements in crude ferronickel and is partially introduced by
the addition of reductants and fuels. It is highly unwanted in steel production where most of the
ferronickel is used as an alloying element [14]. Therefore, it must be removed before ferronickel
is cast into bars or granulated. The refining of ferronickel is usually done in a ladle furnace and
sulfur is removed by adding calcium carbide. The reported consumption of calcium carbide is
approximately 6 kg/kg sulfur [16]. Thus, refining may add a significant cost to the overall
economics of the process. For example, crude ferronickel containing 1 wt. % sulfur requires
60 kg CaC2 per tonne. Considering the current price of CaC2, this accounts for
USD 42 per tonne ferronickel in reagent costs alone for the removal of sulfur.

3
Chapter 2: Literature Review
2.1 Nickel Laterite Ores
Laterite ores are a product of extensive chemical weathering of olivine-rich ultramafic
rocks such as peridotite, pyroxenite, and dunite, containing nickel, cobalt, iron, and other metals
[8, 15]. They occur near the surface and are available for open-pit mining techniques. The tropical
regions around the equator, western Australia, and humid regions of eastern Europe are most
abundant in laterite ores [18]. These ores have formed over millions of years under changing
climatic and tectonic activity. Consequently, their profile is complex with varying mineralogy
from the surface to bedrock (Figure 2.1). There are generally three distinct layers found in a laterite
profile [17]: oxides, hydrous magnesium silicates, and clay silicates.
2.1.1 Oxide Deposits
Oxide deposits are commonly referred to as ‘limonite’ and occur as an upper layer of
laterite profile. The principle nickel-bearing minerals are iron oxyhydroxide, mainly goethite.
Nickel is present either by adsorption onto the surface or by substitution for iron in the goethite
structure [7, 15]. The limonitic layer is relatively rich in iron and low in nickel, magnesia, and
silica content. The global mean grade of nickel in limonite deposits is 1.03 %, and they represent
about 60 % of the total nickel laterite resources.
2.1.2 Hydrous Magnesium Silicates Deposits
This layer of laterite deposits is generally referred to as ‘saprolite’ and is usually found
deep in the profile. The mineralogy of saprolite ores is very inconsistent, and nickel is present as
a mixture of different nickel-containing varieties of magnesium-rich silicate minerals, i.e.,
serpentine, talc, chlorite, and sepiolite. These minerals are also informally referred to as the

4
garnierite group [19]. Both iron and nickel substitute for magnesium in various hydrous
magnesium silicates present in the ore [20]. They are relatively abundant in nickel, magnesia, and
silica while low in iron. The global mean grade of nickel in saprolite deposits is 1.53 %, and they
represent about 32 % of the total nickel laterite resources [7, 8, 15].
2.1.3 Clay Silicate Deposits
These deposits generally occur as a transition layer between limonite and saprolite and are
commonly referred to as ‘smectite.’ They have recently been recognized and exploited as a distinct
ore type [8]. Nickel-rich smectite clays such as nontronite and saponite are found noticeably in
these deposits. The global mean grade of nickel in smectite deposits is 1.21 %, and they represent
8 % of total nickel laterite resources [17].
Figure 2.1 An idealized profile of laterite ores from surface to bedrock [1]
2.2 Processing of Nickel Laterite Ores
The identification of different layers in the laterite ores is vital due to the different
extraction processes required for each segment. In general, limonite ores are commonly processed

5
by hydrometallurgical methods to reduce nickel to the metallic state. High iron and low nickel in
limonite ores make them uneconomical for smelting, while their low magnesia content reduces the
acid consumption during the leaching process. Contrarily, saprolite ores are processed by
pyrometallurgical techniques due to their high magnesia content. The relatively low iron and
higher nickel make them suitable for melting [1, 10]. In the following sections, the most widely
used processes to treat laterite ores are discussed in further detail.
2.2.1 High-Pressure Acid Leaching
In High-Pressure Acid Leaching (HPAL), an autoclave is used to leach limonite ores
facilitated by the addition of sulfuric acid and steam (Figure 2.2). The process takes place under
aggressive conditions, i.e., 250 oC temperature and 40 Bar pressure. Under these conditions,
goethite containing nickel and cobalt, can rapidly dissolve in the solution. However, the dissolved
iron quickly hydrolyzes and precipitates as hematite and jarosite while regenerating the acid [21].
The recovery of nickel in pregnant leach solution (PLS) is higher than 95 %, while only 3 % iron
is dissolved in the solution [20, 21]. In downstream processing, there is some loss of nickel and
cobalt; however, overall recoveries are still very high, and in the range of 90 - 92 %. There are
several processing options to recover nickel and cobalt from the PLS. These include precipitation
to produce mixed intermediate product, i.e., sulfide and hydroxide, or by direct solvent extraction
and refining [13]. The HPAL process is not economical for saprolite ores due to the high
concentration of acid consuming magnesia.

6
Figure 2.2 HPAL process flowsheet with mixed-sulfide precipitation [1]

7
The chemical reactions inside the autoclave are given by equations 2.1 - 2.5 [1]:
a) Leaching of nickel and cobalt:
Ni(OH)2 (s) + H2SO4 (l) = NiSO4 (aq) + 2H2O (l) Eq 2.1
Co(OH)2 (s) + H2SO4 (l) = CoSO4 (aq) + 2H2O (l) Eq 2.2
b) Dissolution of goethite and precipitation of iron as hematite and jarosite
2FeOOH (s) + 3H2SO4 (l) = Fe2(SO4)3 (aq) + 4H2O (l) Eq 2.3
Fe2(SO4)3 (aq) + 3H2O (l) = Fe2O3 (s) + 3H2SO4 (aq) Eq 2.4
3Fe2(SO4)3 (aq) + 14H2O (l) = 2[H3OFe3(SO4)2(OH)6] (s) + 5H2SO4 (aq) Eq 2.5
2.2.1.1 Mixed-Sulfide Precipitation
In a mixed-sulfide (MS) precipitation process (Figure 2.2), the leached slurry is allowed
to boil in sequential flash tanks and then pre-neutralized with limestone to a pH of 1.0 [23]. The
slurry is then passed through a 7-stage counter-current decantation circuit (CCD), which separates
the PLS from the solid residues. The clarified solution is again neutralized to a pH of 3.3 to
precipitate impurities, i.e., iron, aluminum, and chromium as hydroxides. Zinc and copper are
removed from the solution as sulfides in a separate reactor by precipitating them selectively with
hydrogen sulfide gas. Finally, the low impurity solution undergoes the sulfurization stage, where
hydrogen sulfide gas is used to precipitate a mixed nickel-cobalt sulfide product. The MS product
is then delivered to a refinery to recover pure nickel and cobalt metal.
The precipitation reaction of mixed nickel-cobalt sulfide is given by equation 2.6 [1]:
NiSO4 (aq) + CoSO4 (aq) + 2H2S (g) = NiS (s) + CoS (s) + 2H2SO4 (aq) Eq 2.6
8
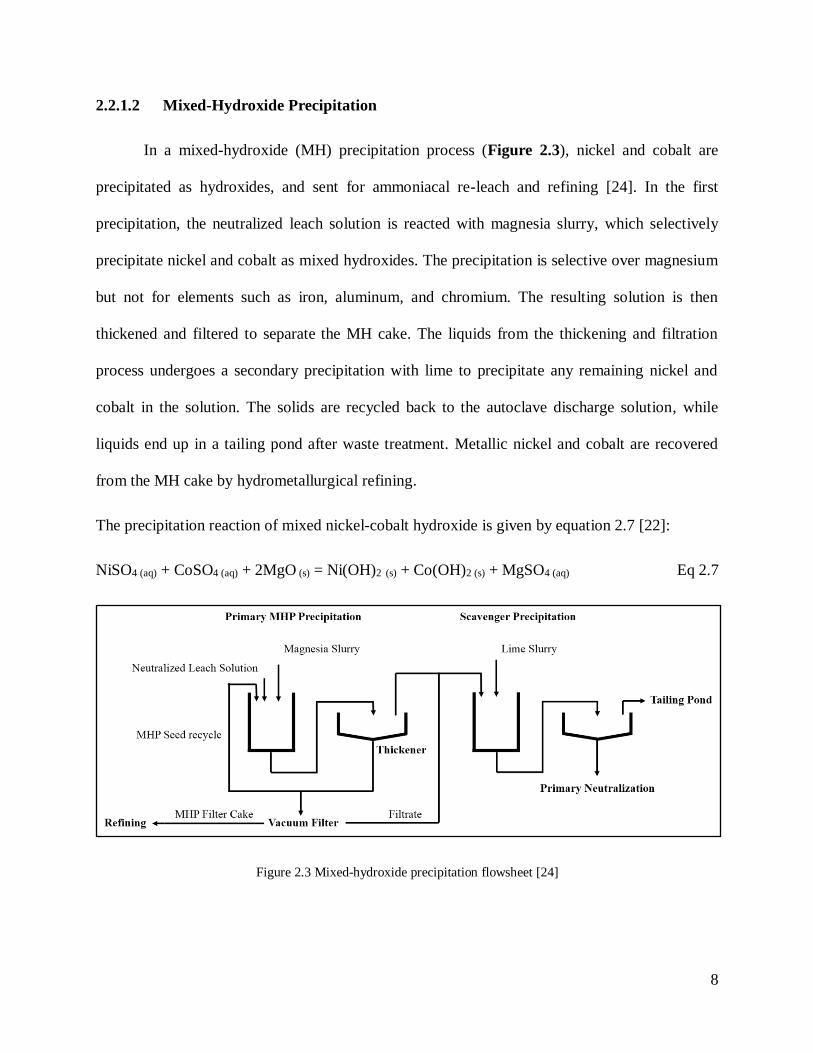
2.2.1.2 Mixed-Hydroxide Precipitation
In a mixed-hydroxide (MH) precipitation process (Figure 2.3), nickel and cobalt are
precipitated as hydroxides, and sent for ammoniacal re-leach and refining [24]. In the first
precipitation, the neutralized leach solution is reacted with magnesia slurry, which selectively
precipitate nickel and cobalt as mixed hydroxides. The precipitation is selective over magnesium
but not for elements such as iron, aluminum, and chromium. The resulting solution is then
thickened and filtered to separate the MH cake. The liquids from the thickening and filtration
process undergoes a secondary precipitation with lime to precipitate any remaining nickel and
cobalt in the solution. The solids are recycled back to the autoclave discharge solution, while
liquids end up in a tailing pond after waste treatment. Metallic nickel and cobalt are recovered
from the MH cake by hydrometallurgical refining.
The precipitation reaction of mixed nickel-cobalt hydroxide is given by equation 2.7 [22]:
NiSO4 (aq) + CoSO4 (aq) + 2MgO (s) = Ni(OH)2 (s) + Co(OH)2 (s) + MgSO4 (aq) Eq 2.7
Figure 2.3 Mixed-hydroxide precipitation flowsheet [24]

9
2.2.2 Caron Process (Yabulu Modification)
Caron process is a hybrid pyro-hydro metallurgical process to extract nickel from the
laterite ores (Figure 2.4). It is primarily used for limonites but can also treat a mixture of limonite
and saprolite. The process is extremely energy-intensive, and the overall nickel recovery is around
75 % [1]. The ore is dried, ground, and blended with heavy fuel oil before being calcined in a
multiple hearth furnace operating above 700 oC in a reducing atmosphere. The nickel and cobalt
oxides are reduced to metal, while the majority of iron exists as magnetite. Rotary cooler
submerged partially in water bath cools the calcine to temperature below 200 oC. Subsequently,
ammonia-ammonium carbonate solution leaches the calcine and selectively dissolve metallic
nickel, cobalt, and iron. However, iron amine complex is unstable and rapidly precipitates as
hydroxide upon reacting with oxygen [25].
The reduction reactions inside the multiple hearth furnace are given by equations 2.8 - 2.10 [1]:
2NiOOH (s) + 3H2 (g) = 2Ni (s) + 4H2O (g) Eq 2.8
2CoOOH (s) + 2CO (g) + H2 (g) = 2Co (s) + 2CO2 (g) + 2H2O (g) Eq 2.9
12FeOOH (s) + H2 (g) + CO (g) = 4Fe3O4 (s) + CO2 (g) + 7H2O (g) Eq 2.10
The leaching of calcine by ammonia-ammonium carbonate solution is given by equations
2.11- 2.12 [1]:
Ni (s) + 6NH3 (g) + CO2 (g) + 0.5O2 (g) = Ni(NH3)62+
(aq) + CO32-
(aq) Eq 2.11
Co(s) + 6NH3 (g) + CO2 (g) + 0.5O2 (g) = Co(NH3)62+
(aq) + CO32-
(aq) Eq 2.12

10
Figure 2.4 Caron process flowsheet with Yabulu modification [1, 23, 24]
The iron precipitates are removed from the solution by filtration, and copper is separated
by ammoniacal solvent extraction. The purified solution is then boiled to remove ammonia and
precipitate nickel as basic nickel carbonate (BNC), i.e., a mixed-carbonate-hydroxide solid. The
BNC product contains 52 % nickel on a dry basis and after filtration, undergoes a series of high-
temperature processes. At first, BNC is dehydrated, decomposed, and partially reduced in a rotary
kiln. The calcine is a mixture of approximately 60 % nickel and 40 % nickel oxide with typically
92 % overall nickel content. The kiln product is blended with sawdust and reduced in a traveling
belt furnace at 900 - 1000 oC temperature. The furnace product contains 97.5 % Ni, which is then
sintered to achieve purity of more than 99 % nickel [26].

11
The precipitation of BNC by steam heating and its subsequent decomposition in a rotary kiln is
given by equation 2.13 and 2.14, respectively [1]:
5Ni(NH3)62+
(aq) + 2CO32-
(aq) + 6OH-(aq) = [3Ni(OH)2 . 2NiCO3] (s) + 30NH3 (g) Eq 2.13
[3Ni(OH)2.2NiCO3] (s) = 5NiO (s) + 3H2O (g) + 2CO2 (g) Eq 2.14
2.2.3 Blast or Submerged Arc Furnace Smelting
In the early 2000’s, nickel pig iron (NPI) production gained a great deal of popularity in
China due to the rapid rise in stainless steel demand and the soaring price of refined nickel. NPI
offered a cheap alternative to the domestic demand for nickel by stainless steel producers. Several
small iron blast furnace operators modified their processes to treat laterite ores. However, in 2014,
Indonesia prohibited the export of laterite ores, which decreased the NPI production in China [27].
Furthermore, the strict environmental regulations, decrease in nickel prices, and several technical
challenges have significantly decreased blast furnace smelting [3].
Nickel pig iron or low-grade ferronickel is essentially an iron-nickel alloy that has lower
nickel content than traditional RKEF ferronickel. The process can treat low-grade limonite ores,
generally containing less than 1 % nickel. The pig iron from the blast or submerged arc furnaces
may contain up to 8 % and 15 % nickel, respectively [3, 26]. The production of NPI is very similar
to conventional pig iron process. The ore, coke breeze, and fluxes are blended, and then sintered
to form agglomerates. A blast or submerged arc furnace smelts the sintered product along with
additional fluxes. The molten ferronickel is separated from the slag and refined for impurities
before being poured into molds.
There are several technical challenges associated with sintering and smelting in the NPI
process. The sintering consumes a large amount of coke breeze due to high moisture and refractory

12
materials in the ore. The smelting generates a vast amount of slag, consumes a high amount of
energy, and delivers a ferronickel product with poor fluidity. The viscosity of slag is very high due
to the presence of chromium oxide. The addition of fluxes, i.e., fluorite, severely erodes the
refractory of the furnace, and yield poisonous gases. Moreover, the NPI contains a high level of
harmful impurities, i.e., sulfur and phosphorus, which have to be removed before subsequent
processing [3, 26].
2.2.4 Rotary Kiln Electric Furnace Process (Ferronickel Production)
The Rotary kiln - Electric Furnace (RKEF) process, shown in Figure 2.5, is the most
commonly used pyrometallurgical technique for processing laterite ores and is mainly suited for
saprolite deposits. In 2003, 70 % of nickel was being extracted from the laterites using the RKEF
process, and it accounted for 30 % of the overall nickel production globally. In a standard
operation, the feed is dried, calcined and partially reduced in a rotary kiln followed by smelting in
an electric furnace. About 90 % of the smelting is done to produce a ferronickel alloy while the
rest produces a sulfide matte [1, 11].
Smelting aims to selectively separate nickel as a metallic phase while rejecting the other
oxides in the ore as slag. Under any reducing condition, the recovery of nickel as metal is the
highest, followed by that of cobalt and iron. A small proportion of chromium and silicon may
metalize as well, while all of the magnesia and alumina reports to the slag. Since the percentage
of iron in the ore is an order of magnitude higher than nickel, the crude ferronickel alloy usually
contains only 20 - 40 % nickel. More aggressive reducing conditions ensures higher nickel
recovery but a lower nickel grade in ferronickel, and vice versa. Typically, the nickel recovery in
RKEF process is higher than 90 % [1, 11].

13
Figure 2.5 The process flowsheet of the RKEF route [1]

14
Figure 2.5 shows the RKEF process flowsheet. In general, there are four main stages with
following objectives:
1. Drying: removal of a significant portion of free moisture in the ore
2. Calcination and Partial Reduction: removal of remaining moisture and crystalline water
in the ore, reduction of substantial portion of nickel and a controlled part of iron, and
preheating the ore for smelting furnace
3. Smelting: complete reduction of nickel and separation of crude molten ferronickel from the
slag phase
4. Refining: removal of impurities, i.e., sulfur, phosphorus, carbon, chromium, and silicon
from crude ferronickel
The feed to the RKEF process is generally a magnesium-rich saprolite ore containing
1.5 - 3 % nickel, 15 % iron, 25 - 35 % free moisture, and 10 - 12 % crystalline water. Unlike sulfide
ores, the beneficiation of laterite ores is very difficult. However, the nickel-rich weathered
minerals are usually softer than the precursor rocks. Therefore, the ore is crushed, ground, and
screened to separate soft nickel-rich particles. The nickel content in the upgraded ore generally
increases only up to 1.2 to 2 times than the original ore [1, 27, 28].
2.2.4.1 Drying
The upgraded ore is wet, sticky, and has inconsistent moisture content. Rotary dryers
usually 4 m in diameter and 30 m long, partially dries the ore [1]. Complete evaporation of water
is not desired at this stage since the feed will become dusty and difficult to handle. Fuel combustion
and recycled hot gases from calcination, smelting, and slag-cooling are used to heat the rotary
dryer. The gases at about 600 - 800 oC interacts co-currently with the ore. The product is a dusty
off-gas and partially dried ore with a consistent free moisture in the range of 15 - 20 %. The dust

15
is recovered from the off-gas in electrostatic precipitators and is recycled either to the dryer or
calcination kiln [11, 29].
2.2.4.2 Calcination and Partial Reduction
A slightly sloped rotary kiln, typically 5 m in diameter and 100 m long, receives the dried
ore along with carbonaceous reductants [1]. The kiln is heated by partial combustion of fuels, e.g.,
coal, at the discharge end. The ore is slowly guided through the rotary kiln by internal lifters and
interacts with hot reducing gases counter-currently, which eliminates the free moisture. The air
fans and coal scoops along the length of the kiln controls the gas temperature and partial pressures
of carbon monoxide and hydrogen [31]. At 700 oC, the lattice structure of hydrated magnesium
silicates dissociates thermally, and yields highly reactive amorphous oxides while evaporating
crystalline water. More than a quarter of nickel reduces to metal, while most of the Fe3+ reduces
to Fe2+ minerals. The discharge temperature of calcine is between 800 - 1000 oC, and the off-gas
temperature is between 250 - 400 oC. The dust in the off-gas accounts for almost 15 - 20 % of the
kiln feed. It is recovered, pelletized, and recycled back to the calcination kiln. The bone-dry
calcine, bearing enough coal for further reduction, is transferred to the smelting furnace [11, 29].
The chemical reaction in the rotary kiln can be summarized by equations 2.15 - 2.26 [1, 31]:
a) Complete evaporation of free moisture in the ore:
H2O (l) = H2O (g) Eq 2.15
b) Thermal dissociation laterite minerals, i.e., goethite for limonite, and serpentine for saprolite:
2(Fe, Ni)OOH (s) = (Fe, Ni)2O3 (s) + H2O (g) Eq 2.16
(Mg, Fe, Ni)3Si2O5(OH)5 (s) = (Mg, Fe, Ni)SiO3 (s) + (Mg, Fe, Ni)2SiO4 (s) + 2H2O (g) Eq 2.17

16
c) Boudouard reaction:
C (s) + CO2 (g) = 2CO (g) Eq 2.18
d) Direct reduction of resulting oxides by carbon:
3Fe2O3 (s) + C (s) = 2Fe3O4 (s) + CO (g) Eq 2.19
Fe3O4 (s) + C (s) = 3FeO (s) + CO (g) Eq 2.20
FeO (s) + C (s) = Fe (s) + CO (g) Eq 2.21
NiO (s) + C (s) = Ni (s) + CO (g) Eq 2.22
e) Indirect reduction of resulting oxides by reducing gases, i.e., carbon monoxide:
3Fe2O3 (s) + CO (g) = 2Fe3O4 (s) + CO2 (g) Eq 2.23
Fe3O4 (s) + CO (g) = 3FeO (s) + CO2 (g) Eq 2.24
FeO (s) + CO (g) = Fe (s) + CO2 (g) Eq 2.25
NiO (s) + CO (g) = Ni (s) + CO2 (g) Eq 2.26
2.2.4.3 Smelting
During smelting, the nickel in the hot calcine is completely reduced to its metallic form.
The crude ferronickel product typically contains 20 - 40 % nickel. Molten slag containing SiO2,
MgO and FeO with an insignificant amount of nickel is also generated and floats on top. The crude
molten ferronickel at 1450 - 1500 oC, is tapped from the lower taphole into a ladle, and transported
for refining and casting. Molten slag at 1550 - 1600 oC, is tapped from high taphole and is either
dumped as waste or granulated and sold as building material or metallurgical flux. The off-gas is
fully combusted, dedusted, and released into the atmosphere or recycled back to the rotary dryer
[1, 11, 29].

17
The chemical reactions in the smelting furnace can be summarized by equation 2.27 - 2.29 [1]:
a) Reduction of iron and nickel oxides to metallic state:
FeO (s) + C (s) = Fe (s) + CO (g) Eq 2.27
NiO (s) + C (s) = Ni (l) + CO (g) Eq 2.28
b) The melting and alloying of iron and nickel:
Ni (l) + Fe (s) = (Ni, Fe) (l) Eq 2.29
The composition of smelter slag depends on the feed and typically contains 40 - 55 % SiO2,
20 - 35 % MgO, 5 - 20 % FeO, 1 - 7 % CaO and 1 - 2 % Al2O3 [1]. The slag is ionic and made up
of cations such as Mg2+ and Fe2+, and anion mainly SiO44-. The loss of nickel in the slag is minimal,
and recovery in ferronickel is usually between 90 - 98 %. The nickel losses can be further
minimized by increasing nickel content of the feed, tapping slag at higher temperatures and adding
enough carbon for complete reduction of nickel oxide.
Industrial furnaces are either rectangular with six carbon electrodes or round with three
electrodes [1]. These electrodes are consumed during the smelting process by oxidation of carbon
and are regenerated at the top by welding. A high amount of current flows between suspended
electrodes and Joule heating provides the energy for melting the calcine.
Most of ferronickel producers practice the shielded arc method nowadays [33], which
enables the transfer of the power directly from the arc to the calcine (Figure 2.6). The electric
current passes from one electrode of a pair to the other electrode through the air gap and slag.
Almost 80 % of the energy is provided by Joule heating in the air gaps where it is readily available
for heating and melting the solid calcine. The shielded arc method minimizes the energy
requirements, prevents overheating of refractories, and increases the rate of melting. In contrast,

18
the immersed electrode method superheats the slag bath, which results in melting of the overlaying
calcine. It has several disadvantages, i.e., higher heat and electrical energy losses, higher
consumption of electrode, faster degradation of refractories, and larger size and cost for the
required electrode.
Figure 2.6 (a) Shielded-arc electric furnace (b) Immersed electrode electric furnace [33]
2.2.4.4 Refining
The crude ferronickel from the smelter may contain up to 0.06 % phosphorus and
1 % sulfur, whereas the desired ferronickel product must contain less than 0.02 % phosphorus and
0.05 % sulfur. Impurities such as carbon and silicon may sometime also be above the acceptable
limits. A ladle heated up to 1550 - 1600 oC is used to do all of the refining operations on freshly
tapped ferronickel. It physically moves through each of the refining station, i.e.,
dephosphorization, desulfurization, and decarburization [1].
Lime and oxygen are added into molten ferronickel to remove phosphorus as calcium
phosphate. Lime is added into the ladle before and during the refining process for efficient mixing
while oxygen is blown deep into ferronickel by refractory-coated stainless-steel lances [1].
Phosphorus is brought down to the acceptable limit by careful removal of the floating slag.

19
Similarly, calcium carbide is added into ferronickel to remove sulfur as calcium sulfide. However,
lime, calcium carbonate, sodium carbonate, and sodium peroxide may also be added to remove
sulfur. Oxygen is injected into the molten ferronickel to remove impurities such as carbon and
silicon. The refined ferronickel is then either granulated or cast into small ferrocones or large ingots
[11, 29].
Equations 2.30 - 2.32 present the reactions for phosphorus, sulfur, and carbon removal,
respectively [1]:
2[P] + 5
2 O2 (g) + 4CaO (s) = (CaO)4P2O5 (l) Eq 2.30
[S] + CaC2 (s) = 2[C] + CaS (l) Eq 2.31
2[C] + O2 (g) = 2CO (g) Eq 2.32
2.2.5 Rotary Kiln Electric Furnace Process (Matte Production)
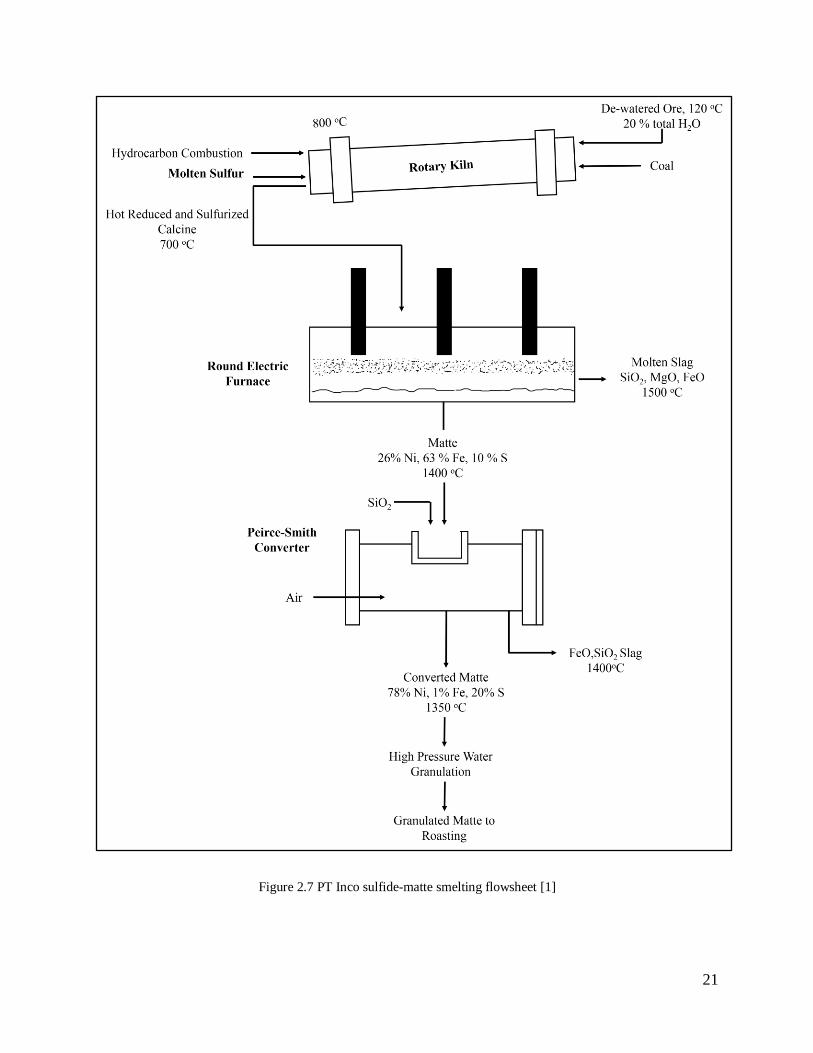
Occasionally, the RKEF route is employed to produce an iron-nickel sulfide matte. Two
primary producers of sulfide matte are PT Inco in Indonesia and Le Nickel in New Caledonia. In
the PT Inco process, molten sulfur is added at the discharge end of the rotary kiln to sulfurize the
ore (Figure 2.7). The exit temperature of sulfurized calcine is 700 oC, and it typically contains
2 % nickel, 20 % iron, and 1 % sulfur. An electric furnace at 1400 oC melts the calcine, and it
forms a molten matte containing 26 % nickel, 63 % iron and 10 % sulfur. The recovery of nickel
in the matte is usually higher than 93 %. Peirce-Smith converter (Figure 2.8) is used to remove
iron from the furnace matte. Most of the iron and some sulfur is oxidized by adding silica as flux
and blowing oxygen into the converter. The reactions in the Peirce-Smith converter are highly
exothermic and requires no external heat. The product from convertor contains 78 % nickel, 1 %

20
iron, and 20 % sulfur. The matte is solidified into small granules and sent for roasting operations
[1, 33].
The sulfurization reaction in the rotary kiln are given by equations 2.33 and 2.34 [1]:
3Ni (s) + S2 (g) = Ni3S2 (s) Eq 2.33
2Fe (s) + S2 (g) = 2FeS (s) Eq 2.34
The main reactions in Peirce-Smith converter are given by equations 2.35 and 2.36 [1]:
2Fe (l) + O2 (g) + SiO2 (s) = Fe2SiO4 (l) Eq 2.35
[S] + O2 (g) = SO2 (g) Eq 2.36
At Le Nickel, sulfide matte is produced by the conversion of about 20 % of the refined
ferronickel. A Peirce-Smith converter is charged with refined ferronickel from the RKEF process
along with molten sulfur. A continuous-belt mold caster casts the molten matte into ingots. These
ingots are then shipped for chloride leaching to produce high purity nickel chemicals [1].
21
Figure 2.7 PT Inco sulfide-matte smelting flowsheet [1]

22
Figure 2.8 Peirce-Smith converter [1]
2.2.5.1 Roasting of Sulfide Matte
The sulfide-matte is roasted to eliminate sulfur and produce a product for stainless steel
and other industries. The first step is oxidation roasting of sulfide-matte in fluidized-bed roasters
to produce a nickel oxide product. This product is then re-roasted in a reducing environment to
obtain nickel as metal. The oxidation roasting is carried out in fluidized-bed roasters, typically in
two stages: primary and secondary (Figure 2.9). The primary step is auto-thermal, where granules
of sulfide matte are oxidized by oxygen-enriched air in a highly exothermic reaction. The process
is controlled at 1050 oC by water spraying to prevent overheating. The product from the primary
oxidation contains 0.4 % sulfur, which is then re-roasted. The secondary roasting is done at
1000 oC and relies on hydrocarbon combustion [1, 34, 35].
The oxidation roasting of sulfide matte is given by equation 2.37:
NiS (s) + 1.5O2 (g) = NiO(s) + SO2 (g) Eq 2.37

23
The final roasted product typically contains 76 % nickel, 23 % oxygen, 0.5 % iron, and
0.003 % sulfur. The product is cooled and sent either for reduction roast to obtain melting grade
nickel or sometimes directly sent for stainless steel production. The off-gas is always de-dusted to
recycle the nickel-bearing solids to the roaster. The SO2 in the off-gas is captured and converted
into sulfuric acid.
The reduction roasting is done to recover nickel in metallic form. The roaster operates at
1000 oC and is heated by air-deficient hydrocarbon combustion to create a reducing environment.
The final product contains 95 - 97 % nickel. The nickel oxide reacts with carbon monoxide and
hydrogen and reduces to metallic nickel. The recovery of nickel in oxidation and reduction roasting
is almost always 100 % [1].
Figure 2.9 Oxidation roasting of sulfide-matte [1]

24
2.3 The Behavior of Laterite Ores in Carbo-Sulfurizing Gas Mixture
There is limited literature available on the behavior of nickel laterites in reducing gas
mixtures that contain SO2. The most relevant studies have been carried out for bauxite ores to
sulfurize hematite in the presence of CO-SO2 gas mixtures. These studies were aimed at selective
removal of iron by sulfurization and subsequent chlorination to improve the aluminum content of
bauxite ores. These past studies may be used to understand the behavior of nickel laterites in a
reducing atmosphere that contains SO2. Table 2.1 lists the possible sulfurization reactions at
900 oC for iron and nickel oxides in the ore. The highly negative values of ∆Gº for Equation 2.38
and 2.39 dictates that, in theory, some of the Fe2O3 and NiO in the ore may sulfurize in the presence
of CO-SO2 gas mixtures.
Table 2.1 Possible sulfurization reactions for Fe2O3 and NiO at 900 ºC in CO-SO2 system
Equation Reaction ∆Gº900 (KJ/mol SO2)
2.38 1/2 Fe2O3 (s) + 7/2 CO (g) + SO2 (g) = FeS (s) + 7/2 CO2 (g) -185.4
2.39 NiO (s) + 3CO (g) + SO2 (g) = NiS (s) + 3CO2 (g) -186.1
The sulfurization of hematite, to selectively remove iron from minerals was proposed as a
beneficiation method for ferruginous bauxite ores. Fink and Marchi (1938) were first to suggest
such a procedure when they converted Fe2O3 to FeS by adding elemental sulfur at high
temperatures, followed by chlorination of this product to remove 90 % of iron oxides in the ore
[37]. Holliday and Milne (1975) explored the possibility of upgrading bauxites by using CO-SO2
gas mixtures instead of elemental sulfur. They found rapid sulfurization rates at 720 oC for a 7:3
CO-SO2 gas mixture. The iron level was 5.3 % initially; however, it was brought down to
approximately 0.1 - 0.3 % after chlorination of FeS to FeCl3 [38].

25
Bolsaitis and Nagata (1980) studied the kinetics of gas-solid reactions between Fe2O3 and
CO-SO2 gas mixtures by thermogravimetric analysis (TGA). The temperature range for the study
was between 500 - 900 oC, and the composition of CO-SO2 mixtures were between
XCO = 0.4 - 0.92 (where X is the gas molar ratio). The sample size was about 0.2 g, and the gas
flow rate was 1130 ml/min (STP). The overall conversion of Fe2O3 to FeS was given by a reduction
and sulfurization process. The dominant sulfurizing agents were found to be S2 and COS, and the
kinetic behavior of both species were found to be very similar [39]. The authors summarized the
chemical reactions in the system by the following equations:
a) Gas-phase equilibria:
3CO + SO2 = COS + 2CO2 Eq 2.43
2CO + SO2 = 1/2 S2 + 2CO2 Eq 2.44
2CO2 = 2CO + O2 Eq 2.45
b) Reduction of hematite to magnetite as given by Eq 2.23
c) Sulfurization of magnetite by S2 and COS:
Fe3O4 (s) + 5/2S2 (g) = 3FeS (s) + 2SO2 (g) Eq 2.46
Fe3O4 (s) + 3COS (g) + CO (g) = 3FeS (s) + 4CO2 (g) Eq 2.47
Figure 2.10 shows equilibrium partial pressures of each constituent in the CO-SO2 system.
The most pronounced change in partial pressures of S2 and COS occur over the range of
XCO = 0.6 - 0.8. At XCO ≤ 0.4, S2 is the only dominant sulfurizing agent, while at XCO ≥ 0.92, COS
is the most dominating species. It is noteworthy that, at XCO ≲ 0.8, hematite will only reduce to
magnetite, while for higher XCO, further reduction to wustite may happen.

26
Figure 2.10 Equilibrium partial pressure of gaseous components at 700 oC in CO-SO2 system of various
compositions [39]
Figure 2.11 shows TGA curves at 700 oC for various gas compositions. The most
important feature of this diagram is the virtually similar curves obtained for XCO between 0.57 to
0.77. As discussed earlier, in this region, the most noticeable changes in PS2 and PCOS occur. Hence,
it may be concluded that both S2 and COS are active sulfurizing agents. In general, for all curves,
an initial weight decrease corresponding to the reduction of hematite to magnetite can be observed,
which is followed by an increase in weight representing the conversion of magnetite to FeS.
At XCO = 0.4, a decrease is observed in the rate of reduction, sulfurization, and overall conversions.
At XCO = 0.92, four distinct features are found in the curve [39]:
1) A swift reduction region that proceeds beyond Fe3O4 and indicates possible conversion to
wustite as given by Eq 2.24
2) A region dominated by simultaneous reduction - sulfurization reactions
3) A region dominated by sulfurization reaction

27
4) The slope for sulfurization region is very similar to the slope observed for XCO = 0.4; which
further explains that S2 and COS have very similar sulfurization activity
Figure 2.11 TGA curves of Fe2O3 samples at 700 oC in CO-SO2 atmosphere with various compositions [39]
Figure 2.12 shows the TGA curves at XCO = 0.66 for various temperatures. At a
temperature of 600 oC and above, authors found a rapid reduction of hematite followed by
nucleation and growth of the sulfide phase. At a temperature of 550 oC, both reduction and
sulfurization take place simultaneously and at considerably lower rates. Almost negligible
reduction occurred at 500 oC, and hematite was sulfurized directly to FeS at a prolonged rate. In
the light of the above kinetic analysis and morphological observations, the authors concluded that
the rate-controlling step of the overall carbo-sulfurization process is the diffusion of S2 and COS
through FeS crystals.

28
Figure 2.12 TGA curves of Fe2O3 samples at XCO = 0.66 for various temperatures [39]
Nagata and Bolsaitis (1987) conducted a similar study for hematite contained in a laterite
ore and compared the results with those obtained for pure hematite. The TGA curves at 700 oC
(Figure 2.13) were plotted for CO-SO2 system of various compositions. The laterite ore was
composed of 25.9 % Al2O3, 38.5 % Fe2O3, 31.3 % SiO2, and 4.6 % TiO2. The time for sulfide
nucleation was similar in both cases; however, no reduction was observed in the case of the laterite.
The absence of reduction was attributed to the inhibition of magnetite nucleation, possibly due to
impurities in hematite grains. Furthermore, the rates of sulfurization were found to be faster for
laterite samples, probably because of the higher specific surface area [40].

29
Figure 2.13 TGA curves of laterite samples at 700 oC in CO-SO2 system of various composition [40]
Previous studies on reduction-sulfurization of iron oxides were conducted with an ultimate
goal of selective removal of iron from various minerals such as bauxite or ilmenite to increase
valuable metal content of the ore. It should be noted that the partial pressure of SO2 in these studies
were significantly higher than the ones generated from oxidation of the sulfur as an impurity
element in the fuel. This study investigates the effect of the presence of low SO2 content in the
furnace atmosphere, on the sulfur content of the calcine.
2.4 Scope and Objectives
Sulfur is one of the most harmful impurities in nickel products. It can form non-metallic
inclusions, which deteriorates the mechanical properties of the alloy [41]. Crude ferronickel from
the RKEF process may contain up to 1 % sulfur, which is significantly higher than the desired
range of 0.05 % sulfur in the final ferronickel product [14]. Generally, a ladle furnace is used to

30
remove sulfur from crude ferronickel by adding reagents such as calcium carbide. As discused
earlier,using calcium carbide imposes an additioal reagent cost which will affect the economics of
the process.
Typically, laterite ores contain an insignificant amount of sulfur [42], so it is expected that
most of the sulfur in crude ferronickel originates from the coal added as the fuel and the reductant
during calcination in the rotary kiln. The slim profits of RKEF process are pushing producers to
use low-quality coals, which generally contains high concentrations of sulfur [15]. It is
hypothesized that during calcination of laterites in the rotary kiln, sulfur present as an impurity in
the rotary kiln fuel is oxidized and transferred to the calcine. Therefore, there is a need to study
the effect of sulfur in the rotary kiln fuels on the sulfur content of the calcine.
The main objectives of this study are to examine the following:
• The effect of the composition of the coal added as rotary kiln fuel on the composition of the
calcine.
• The effect of the kiln atmosphere (e.g., PCO, PCO2) on the composition of the calcine.
• The effect of the flow rate of the reducing gas mixture on the composition of the calcine.

31
Chapter 3: Materials and Methods
3.1 Materials
The laterite ore used in this study was provided by FLSmidth and was originally obtained
from a Brazilian deposit. Coal was added as a reductant in each experiment and was obtained from
the Coal and Mineral Processing Laboratory at UBC. Following reagents were used in digestion
of the calcine: Potassium hydroxide (KOH, 89 % purity, VWR chemicals), nitric acid
(HNO3, 69.7 % purity, VWR chemicals), Methanol (CH3OH, 99.8 % purity, VWR chemicals),
and Bromine (Br, 99.8 % purity, Alfa Aesar).
3.2 Characterization of Raw Materials
The chemical assay of the raw ore was determined by Bureau Veritas Minerals (BVM) in
Vancouver and is given in Table 3.1. The test sample was dried at 105 oC to remove free moisture
before being fused in a platinum crucible with lithium tetraborate flux. The fused sample was cast
in a disc and was analyzed by x-ray fluorescence (XRF) to determine the percentage of each
component in the raw ore. Another portion of the test sample was roasted at 1000 oC to determine
the loss on ignition (LOI). The mineralogy of the raw ore was determined by x-ray diffraction
(XRD) using Bruker D8 Focus Diffractometer with CoKα radiation source within the range of 2
values of 3º to 80º. Based on the XRD results presented in Figure 3.1, the major crystalline phases
in the raw ore are identified as nontronite, lizardite, doyleite, goethite, quartz, trevorite, and
hematite. The ore is characterized as a mixture of smectite and saprolite due to the presence of
nontronite and lizardite, as well as the relatively low magnesia content.
The proximate analysis of coal was carried out according to ASTM standards D3175,
D3174, and D3173, to determine volatiles, ash, and moisture contents, respectively. The fixed

32
carbon was found by difference. The total carbon and sulfur contents were determined using LECO
analysis. The chemical composition of coal is given in Table 3.2.
Table 3.1 Chemical assay of the raw ore
Component Wt. %
Fe2O3 34.6
SiO2 36.7
MgO 8.74
Al2O3 5.88
Cr2O3 1.62
TiO2 0.1
CaO 0.03
P2O5 0.013
K2O <0.005
Ni 1.87
Co 0.118
Cu 0.01
Zn 0.045
LOI 9.3

33
Figure 3.1 XRD pattern of the raw ore
Table 3.2 Composition of the coal added as the reductant
Component Wt. % Test Method
Volatile Matter 25.34 ASTM D3175
Ash 7.08 ASTM D3174
Moisture 2.76 ASTM D3173
Fixed Carbon 64.82 By Difference
Total Carbon 77.74 LECO
Total Sulfur 0.43 LECO
34
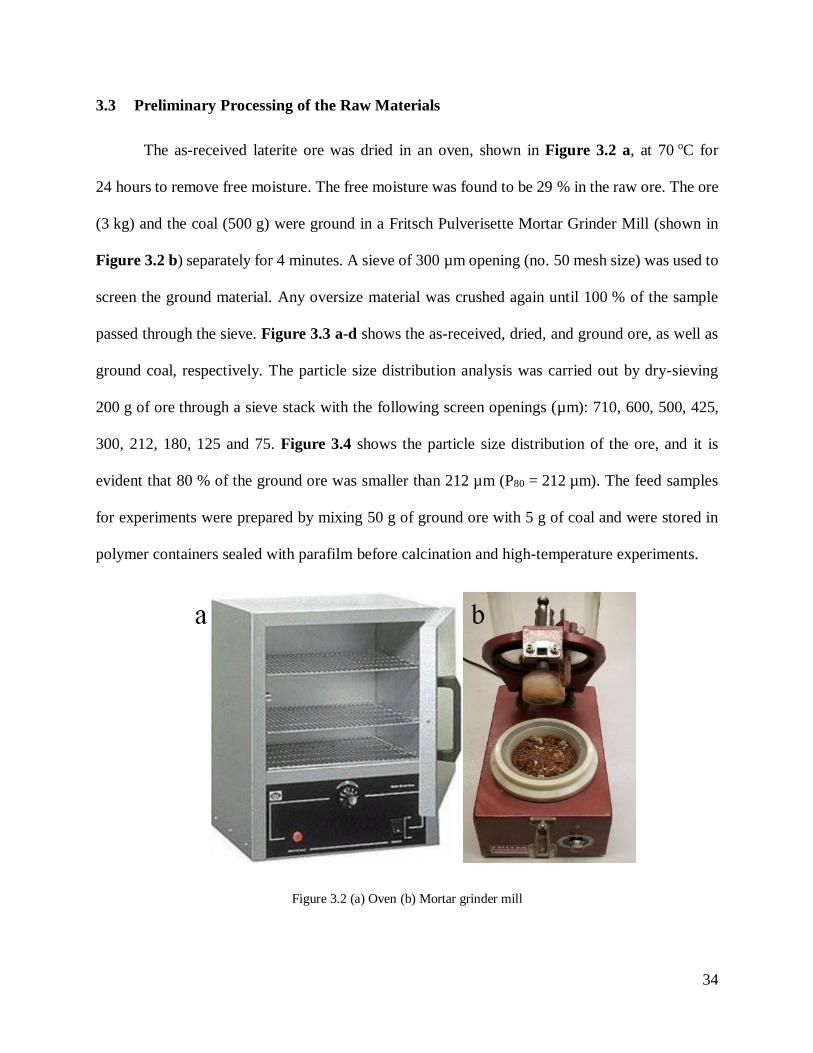
3.3 Preliminary Processing of the Raw Materials
The as-received laterite ore was dried in an oven, shown in Figure 3.2 a, at 70 oC for
24 hours to remove free moisture. The free moisture was found to be 29 % in the raw ore. The ore
(3 kg) and the coal (500 g) were ground in a Fritsch Pulverisette Mortar Grinder Mill (shown in
Figure 3.2 b) separately for 4 minutes. A sieve of 300 µm opening (no. 50 mesh size) was used to
screen the ground material. Any oversize material was crushed again until 100 % of the sample
passed through the sieve. Figure 3.3 a-d shows the as-received, dried, and ground ore, as well as
ground coal, respectively. The particle size distribution analysis was carried out by dry-sieving
200 g of ore through a sieve stack with the following screen openings (µm): 710, 600, 500, 425,
300, 212, 180, 125 and 75. Figure 3.4 shows the particle size distribution of the ore, and it is
evident that 80 % of the ground ore was smaller than 212 µm (P80 = 212 µm). The feed samples
for experiments were prepared by mixing 50 g of ground ore with 5 g of coal and were stored in
polymer containers sealed with parafilm before calcination and high-temperature experiments.
Figure 3.2 (a) Oven (b) Mortar grinder mill

35
Figure 3.3 (a) As-received ore (b) Dried ore (c) Ground ore (d) Ground coal
Figure 3.4 Particle size distribution of the ground ore

36
3.4 Calcination and Partial Reduction Experiments
A Nabertherm RSRB 80 - 750/11 furnace was used to conduct all the experiments. The
furnace had a 1400 mm long quartz reactor with tapered ends. The heated zone of the reactor was
750 mm in length and 76 mm in diameter. An additional thermocouple was used once to determine
the proximity of temperature inside the reactor and the one shown by the furnace controller.
Figure 3.5 shows that both temperatures were reasonably close during the complete heat cycle up
to a maximum temperature of 700 oC.
A gas supply system was designed and connected to the furnace to provide a mixture of
following gases: carbon monoxide (CO), carbon dioxide (CO2), nitrogen (N2), and sulfur dioxide
(SO2). Alicat Scientific gas mass flow controllers (MC and MCS series) were used to inject the
desired amount of each gas into the furnace. The MC series controllers are suitable to handle non-
corrosive gases, i.e., CO, CO2, and N2, while MCS series controllers are built with special materials
to handle corrosive gases, e.g., SO2. The gases through the mass controllers were mixed in a
cylindrical column filled with glass beads to achieve a homogenous mixture as the input reducing
gas. A ceiling-mounted extraction arm was used to collect the exit gases on the other end of the
furnace. The level of hazardous gases inside the lab was continuously monitored by alarm devices
to avoid any safety incidents. Figure 3.6 shows the gas injection setup for the furnace experiments.
Figure 3.7 a and b show the complete experimental setup and quartz reactor, respectively.
The prepared feed samples composed of 50 g of the ore and 5 g of coal were fed to the
quartz reactor at room temperature. The feed was heated to 900 oC at 450 oC/hour under a neutral
atmosphere. The neutral atmosphere inside the reactor was maintained by flowing 1 L/min of N2
at room temperature for 15 min and then 200 ml/min of N2 during ramp-up. The feed was kept at
900 oC for 2 hours in the presence of a CO-CO2-SO2-N2 gas mixture followed by cooling to room

37
temperature under neutral atmosphere. The total flow rate of the gas mixture was kept constant at
292 ml/min. The flow rates of individual gases were varied to simulate the combustion product of
rotary kiln fuels. Table 3.3 lists the experiments and their parameters when the total flow rate of
the reducing gas mixtures was 292 ml/min. Experiments 13 - 18 presented in Table 3.3 were
repeated by lowering the total flow rate of the input gas mixtures from 292 to 176 ml/min for
constant calcination time of 2 hours. The modified flow rates for individual gases are presented in
Table 3.4. The overall temperature cycle for furnace experiments is shown in Figure 3.8.
Figure 3.5 Furnace temperature calibration by comparing the values obtained from internal and external
thermocouple

38
Figure 3.6 (a) Gas cylinders (b) Mass flow controllers (c) Gas mixing column (d) Gas inlet to the furnace

39
Figure 3.7 (a) Complete experimental setup (b) Quartz reactor

40
Table 3.3 The gas flow rates for the calcination and partial reduction experiments at 900 oC and 2-hour residence
time with total input flow rate of 292 ml/min
Experiment
No. CO/CO2
CO
(ml/min)
CO2
(ml/min)
SO2
(ml/min)
N2
(ml/min)
PCO
(atm)
PSO2
(atm)
1
60/40
112 74 0 106 0.39 0
2 112 74 2.1 103.9 0.39 0.0072
3 112 74 4.2 101.8 0.39 0.0144
4 112 74 6.4 99.6 0.39 0.0216
5 112 74 8.5 97.5 0.39 0.0288
6 112 74 10.6 95.4 0.39 0.0360
7
70/30
131 56 0 106 0.45 0
8 131 56 2.1 103.9 0.45 0.0072
9 131 56 4.2 101.8 0.45 0.0144
10 131 56 6.4 99.6 0.45 0.0216
11 131 56 8.5 97.5 0.45 0.0288
12 131 56 10.6 95.4 0.45 0.0360
13
80/20
149 37 0 106 0.51 0
14 149 37 2.1 103.9 0.51 0.0072
15 149 37 4.2 101.8 0.51 0.0144
16 149 37 6.4 99.6 0.51 0.0216
17 149 37 8.5 97.5 0.51 0.0288
18 149 37 10.6 95.4 0.51 0.0360
19
90/10
168 19 0 106 0.57 0
20 168 19 2.1 103.9 0.57 0.0072
21 168 19 4.2 101.8 0.57 0.0144
22 168 19 6.4 99.6 0.57 0.0216
23 168 19 8.5 97.5 0.57 0.0288
24 168 19 10.6 95.4 0.57 0.0360
25
100/0
187 0 0 106 0.63 0
26 187 0 2.1 103.9 0.63 0.0072
27 187 0 4.2 101.8 0.63 0.0144
28 187 0 6.4 99.6 0.63 0.0216
29 187 0 8.5 97.5 0.63 0.0288
30 187 0 10.6 95.4 0.63 0.0360

41
Table 3.4 The gas flow rates for the calcination and partial reduction experiments at 900 oC and 2-hour residence
time with total input flowrate of 176 ml/min
Experiment
No. CO/CO2
CO
(ml/min)
CO2
(ml/min)
SO2
(ml/min)
N2
(ml/min)
PCO
(atm)
PSO2
(atm)
31
80/20
89.7 22.3 0 63.62 0.51 0
32 89.7 22.3 1.27 62.35 0.51 0.0072
33 89.7 22.3 2.54 61.08 0.51 0.0144
34 89.7 22.3 3.81 59.81 0.51 0.0216
35 89.7 22.3 5.08 58.54 0.51 0.0288
36 89.7 22.3 6.35 57.27 0.51 0.0360
Figure 3.8 Temperature cycle for calcination and partial reduction experiments

42
3.5 Chemical Analysis
3.5.1 Inductively Coupled Plasma - Atomic Emission Spectroscopy
Inductively Coupled Plasma - Atomic Emission Spectroscopy (ICP-AES) was used to
measure the concentration of sulfur, iron, and nickel in the calcine. The calcine was first ground
in a ball mill grinder for 15 minutes (Figure 3.9). Since silicates are not acid-soluble, an alkali salt
fusion process was carried out at high temperature to achieve near-total digestion. Approximately
0.2 g of ground calcine was mixed with 3 g of potassium hydroxide (KOH) and added into a
zirconium crucible. The crucible was covered with a lid and heated in a muffle furnace
(Figure 3.10) to a temperature of 500 oC for 1 hour. After heating, the crucible was allowed to
cool to room temperature in a desiccator to avoid exposure to air and humidity. 100 ml of 6 M
nitric acid was used to digest the fused calcine. The solution was filtered using Whatman No.1
cellulose filters. Figure 3.11 shows reduced calcine, KOH pellets, zirconium crucible, and leached
solution after filtration, respectively. A Varian 725-ES ICP spectrometer was used to analyze the
solution. The concentration of sulfur was measured directly by analyzing 10 ml of the leached
solution. The equation for the conversion of sulfur concentration in the solution (mg/L) to the
concentration in the solid calcine (wt. %) is given below:
Csulfur (wt.%) = 𝐶𝑆 𝑖𝑛 𝑠𝑜𝑙𝑢𝑡𝑖𝑜𝑛(
𝑚𝑔
𝐿) 𝑥 𝑉𝑠𝑜𝑙𝑢𝑡𝑖𝑜𝑛(𝐿)
𝑊𝑑𝑖𝑔𝑒𝑠𝑡𝑒𝑑 𝑐𝑎𝑙𝑐𝑖𝑛𝑒(𝑚𝑔) x 100 Eq 3.1
Where CS in solution is the concentration of sulfur in the leach solution measured by ICP-AES, Vsolution
is the total volume of the solution (i.e., 100 ml), and Wdigested calcine is the mass of calcine digested
in the solution (i.e., 0.2 g).

43
Figure 3.9 Ball mill grinder
Figure 3.10 Muffle furnace

44
Figure 3.11 (a) Reduced calcine (b) KOH pellets (c) Zirconium crucible (d) Leached solution
The leach solution was diluted 20 times by adding 0.5 ml solution into 9.5 ml of 6 M nitric
acid. The total iron and nickel concentration were measured by testing the resulting solution. The
equation for the conversion of iron and nickel concentration in the solution (mg/L) to the total
concentration in the solid calcine (wt.%) is given below:
C Fe/Ni (wt.%) = 𝐶𝐹𝑒/𝑁𝑖 𝑖𝑛 𝑠𝑜𝑙𝑢𝑡𝑖𝑜𝑛(
𝑚𝑔
𝐿) 𝑥 𝑉𝑠𝑜𝑙𝑢𝑡𝑖𝑜𝑛 (𝐿)
𝑊𝑑𝑖𝑔𝑒𝑠𝑡𝑒𝑑 𝑐𝑎𝑙𝑐𝑖𝑛𝑒(𝑚𝑔) x Fdil x 100 Eq 3.2
Where C Fe/Ni in solution is the concentration of iron or nickel in the leach solution, Vsolution is the total
volume of the solution (i.e., 100 ml), Wdigested calcine is the mass of calcine digested in the solution
(i.e., 0.2 g), and Fdil is the dilution factor (i.e., 20).
The bromine-methanol leach was used to determine the sum of nickel/iron present as
metallic and sulfide form in the calcine. The bromine-methanol leach is very selective to dissolve
pure metals and sulfides but does not dissolve oxides [32]. Calcined samples weighing 0.25 g were
added into 50 ml of the 5 % bromine - 95 % methanol solution and stirred for 20 min at room
temperature. The solution was then filtered using Whatman No.1 cellulose filters. The filter paper

45
was washed with 50 ml of deionized water. The filtrate was then diluted by adding 3 ml of solution
into 47 ml of deionized water. The iron and nickel concentration were measured by testing 10 ml
of the resulting solution. The equation for the conversion of concentration of iron and nickel in the
solution (mg/L) to the sum of metallic and sulfurized iron/nickel in the solid calcine (wt.%) is
given below:
Cmetallic & sulfide (wt.%) = 𝐶 𝐹𝑒 𝑁𝑖⁄ 𝑖𝑛 𝑠𝑜𝑙𝑢𝑡𝑖𝑜𝑛(
𝑚𝑔
𝐿) 𝑥 𝑉𝑠𝑜𝑙𝑢𝑡𝑖𝑜𝑛(𝐿)
𝑊𝑑𝑖𝑔𝑒𝑠𝑡𝑒𝑑 𝑐𝑎𝑙𝑐𝑖𝑛𝑒(𝑚𝑔) x Fdil x 100 Eq 3.3
Where CFe/Ni in solution is the concentration of iron or nickel in the bromine - leach solution, Vsolution
is the total volume of the solution (i.e., 100 ml), Wdigested calcine is the mass of calcine digested in the
solution (i.e., 0.25 g), and Fdil is the dilution factor (i.e., 50/3).
The sum of metallic and sulfurized iron/nickel in the calcine is determined by the equation 3.4.
Sum of metallic & sulfurized iron/nickel (%) = 𝐶Metallic & sulfide (wt.%)
𝐶Fe/Ni (wt.%) x 100 Eq 3.4
3.5.2 X-ray Diffraction, Scanning Electron Microscopy and Energy Dispersive X-ray
Spectroscopy
The calcine was analyzed by x-ray diffraction (XRD) to characterize its mineralogy.
Bruker D8 Focus diffractometer with CoKα radiation source collected continuous diffraction data
within the range of 2 values of 3o to 80o. The X-ray diffractogram was analyzed using the
International Centre for Diffraction Database. FEI Quanta with large area EDX was used to study
the morphology and elemental composition of the calcine.

46
Chapter 4: Thermodynamic Analysis
4.1 Model Description
The equilibrium module of HSC Chemistry 6.0 [43] is utilized to estimate the multi-
component equilibrium composition of the current system. The input species and their amounts
corresponding to the experimental conditions and the expected output species are specified to
determine the equilibrium system in the furnace. In these calculations, the activity coefficient
values are assumed to be constant and equal to 1. The software utilizes Gibbs energy minimization
method to calculate the equilibrium amount of all species at 900 oC [44]. Table 4.1 lists all the
species considered in the thermodynamic simulation.
Table 4.1 List of all the considered species in thermodynamic analysis
Gas Solids
Oxides Sulfides Ferronickel Coal
CO
CO2
N2
SO2
S
S2
SO
COS
CS2
SiO2
NiO
Fe2O3
Fe3O4
FeO
Fe2SiO4
FeSiO3
MgO
Mg2SiO4
MgSiO3
NiFe2O4
NiS
NiS2
Ni3S2
FeS
FeS2
Ni
Fe
C
S
The input stream consists of raw ore, coal, and a gas mixture containing CO, CO2, N2, and
SO2 at 900 oC. The mineralogy of the raw ore (Table 3.1) and the amounts of the ore and coal
selected in the model calculations are the same as the ones used in the actual experiments, i.e.,
50 g and 5 g, respectively. Free moisture, crystalline water, and volatiles in the ore and coal are
assumed to have already evaporated at elevated temperature. Molar quantities are used to define

47
all of the input components. The specific amounts of gas for a 2-hour experiment (Vgas,exp) are
calculated from the flow rates presented in Table 3.3. To further elucidate the effect of the total
gas volume, modeling calculations are also carried out at lower volumes, i.e., one-fourth
(1/4 Vgas,exp) and one-eighth (1/8 Vgas,exp) of the experimental values. Thermodynamic modeling at
various partial pressures of CO and SO2 (PCO and PSO2) predicts the change in sulfur content of the
calcine (% S), nickel and iron grade (i.e., % nickel/iron in the ferronickel alloy), and metallization
and sulfurization of iron and nickel.
HSC software was used to obtain equilibrium partial pressures of the input gas mixtures
(containing CO, CO2, N2, and SO2) at 900 oC. Four experimental mixtures were studied
(Experiments 8, 12, 20, and 24). The initial amount of each gas species was calculated for a 2-hour
experiment from the flow rates presented in Table 3.3. The results of HSC modeling are shown in
Table 4.2. It is noticeable that at equilibrium conditions, SO2 transforms into COS and S2, and the
partial pressure of COS is significantly higher than S2. At constant PCO, i.e., experiments 8 and 12
as well as 20 and 24, increasing PSO2 enhances the partial pressure of COS. Similarly, at constant
PSO2, i.e., experiments 8 and 20 as well as 12 and 24, increasing PCO results in higher partial
pressure of COS.
Table 4.3 presents the overall sulfurization reactions for all the oxides and reduced species
in the nickel laterite ores. It also shows the reactions associated with the evolution of intermediate
gaseous products, i.e., S2 and COS. Furthermore, it presents the reactions of the original oxides
and their reduced forms with the intermediate gas species. Since the COS content of the gas
mixture is significantly higher than that of S2, sulfurization reactions with COS are expected to be
the ones that govern FeS formation. From the thermodynamic point of view, sulfurization of Fe2O3

48
and NiO are more favorable than their reduced species. However, the sulfurization of Fe is
thermodynamically more favorable than FeO and Fe3O4.
It should be emphasized that the simulations are based on pure thermodynamic modeling,
which does not account for kinetics, since the module used, only minimizes the Gibbs free energy
of the system. As a result, kinetics considerations are not accounted for appropriately. This model
also does not consider the continuous supply of the gas mixture from outside the system and the
removal of the gaseous compounds from the furnace.
Table 4.2 Initial and equilibrium partial pressure of different components of the gas mixtures at 900 oC
Experiment CO
(Vol%)
CO2
(Vol%)
N2
(Vol%)
SO2
(Vol%)
COS
(Vol %)
S2
(Vol%)
8
Initial 38.31 25.43 35.53 0.73 - -
Equilibrium 36.44 27.07 35.79 - 0.66 0.04
12
Initial 38.31 25.43 32.57 3.69 - -
Equilibrium 29.60 33.78 33.60 - 2.27 0.75
20
Initial 57.26 6.48 35.53 0.73 - -
Equilibrium 55.56 8.03 35.70 - 0.69 0.02
24
Initial 57.26 6.48 32.57 3.69 - -
Equilibrium 48.71 14.33 33.61 - 2.90 0.45

49
Table 4.3 Standard Gibbs free energies of the reactions between species containing iron/nickel in the laterite ore and
CO-SO2 atmosphere at 900 ºC
Reaction Overall Sulfurization Reactions ∆G⁰900
⁰C (KJ/mol SO2)
1 1/2 Fe2O3 + 7/2 CO + SO2 = FeS + 7/2 CO2 -185.4
2 1/3 Fe3O4 + 10/3 CO + SO2 = FeS + 10/3 CO2 -167.4
3 FeO + 3CO + SO2 = FeS + 3CO2 - 165.6
4 Fe + 2CO + SO2 = FeS + 2CO2 - 172.7
5 NiO + 3CO + SO2 = NiS + 3CO2 - 186.1
6 Ni + 2CO + SO2 = NiS + 2CO2 - 139.1
Reaction Formation of Intermediate Gas Species ∆G⁰900
⁰C (KJ/mol SO2)
7 3CO + SO2 = COS + 2CO2 -83.6
8 2CO + SO2 = 1/2 S2 + 2CO2 -84.7
Reaction Reactions with COS ∆G⁰900
⁰C (KJ/mol COS)
9 1/2 Fe2O3 + 1/2 CO + COS = FeS + 3/2 CO2 -101.8
10 1/3 Fe3O4 + 1/3 CO + COS = FeS + 4/3 CO2 -83.8
11 FeO + COS = FeS + CO2 -82.3
12 Fe + COS = FeS + CO -85.3
13 NiO + COS = NiS + CO2 -102.5
14 Ni + COS = NiS + CO -55.5
Reaction Reactions with S2 ∆G⁰900
⁰C (KJ/mol S2)
15 Fe2O3 + 3CO + S2 = 2FeS + 3CO2 -201.3
16 2/3 Fe3O4 + 8/3 CO + S2 = 2FeS + 8/3 CO2 -165.4
17 2FeO + 2CO + S2 = 2FeS + 2CO2 -161.8
18 2Fe + S2 = 2FeS -175.9
19 2NiO + 2CO + S2 = 2NiS + 2CO2 -202.6
20 2Ni + S2 = 2NiS -108.7

50
4.2 Model Results
The models predict that NiS and FeS are the only thermodynamically stable sulfide species
in the calcine. It further inferred that all of the sulfur in the input stream that may exist either as
gaseous or in solid phase is completely converted to iron and nickel sulfides. Figure 4.1 shows the
effect of PSO2 in the input gas mixture on the sulfur content of the calcine. The % S in the calcine
increases linearly by increasing PSO2 in the gas mixture and reaches a maximum value of
approximately 4 %. According to thermodynamic simulations, increasing PCO in the gas mixture
negligibly increases the % S in the calcine. The effect of the amount of the gas mixture on % S in
the calcine is evident and found to be in direct relation. In other words, purging lower flow rates
of the gas mixture that represents the freeboard gas results in decreased sulfur content in the
calcine.
Figure 4.2 a-c shows that the improvement of nickel grade (i.e., nickel in ferronickel alloy)
is directly related to PSO2, which validates the formation FeS in the calcine. Increasing PSO2
promotes the formation of FeS, which results in lower Fe (Figure 4.2 d-f) and higher Ni grades.
In Contrast, at constant PSO2, the nickel grade decreases by increasing PCO because of enhanced
metallization of iron. The nickel grade reduces by lowering the amount of the gas mixture, possibly
due to low iron sulfurization, which in turn promotes iron metallization.
Figure 4.3 a-f shows the effect of PSO2 on the metallization of nickel and iron. The
metallization of iron and nickel decreases by increasing the PSO2. At constant PSO2, increasing PCO
enhances the metallization of both iron and nickel. Figure 4.4 a-f shows that the sulfurization of
nickel and iron increases with PSO2. The increase in PCO slightly affects the iron sulfurization;
however, it noticeably decreases the nickel sulfurization. The decrease in nickel sulfurization can

51
be associated with the sulfurization of NiO, i.e., reaction 5 in Table 4.3, being thermodynamically
more favorable compared with that of Ni, i.e., reaction 6 in Table 4.3. In other words, the Gibbs
free energy of the sulfurization reaction is lower for NiO than Ni, i.e., -186.1 vs. -139.1 kJ/mol
NiS. Higher PCO leads to higher Ni and lower NiO content, which in turn results in lower
sulfurization of nickel.

52
Figure 4.1 Predicted sulfur content of the calcine produced at 900 oC for various amount of gas mixtures (a) experimental amounts listed in Table 3.3
(b) one - fourth of the experimental amounts (c) one - eighth of the experimental amounts

53
Figure 4.2 Predicted grades (i.e., percentages of iron and nickel in ferronickel alloy) at 900 oC for experiments listed in Table 3.3 (a-c) nickel (d-f) iron

54
Figure 4.3 Predicted metallization of nickel/iron at 900 oC for experiments listed in Table 3.3 (a-c) nickel (d-f) iron

55
Figure 4.4 Predicted sulfurization of nickel/iron at 900 oC for experiments listed in Table 3.3 (a-c) nickel (d-f) iron

56
Chapter 5: Experimental Results and Discussion
The sulfurization of laterite ore using various reducing gas mixtures has been investigated.
The gas mixtures are intended to simulate the combustion products of rotary kiln fuels (i.e., coal).
The sulfur content of the calcine is measured at various PSO2 and PCO values presented in Table 3.3.
The impact of the flow rate of the input gas on the sulfur content of the calcine is investigated by
lowering the flowrate for the experiments listed in Table 3.4. X-ray diffraction is used to confirm
the reduction of the ore in the rotary kiln and to identify sulfur-containing products. The
bromine - methanol leach test is employed to determine the sum of iron and nickel present as
metallic and sulfide form in the calcine at various PSO2 values. Finally, energy dispersive
spectroscopy is used to investigate the composition of the calcine.
5.1 The Effect of PSO2 on the Sulfur Content of the Calcine
Figure 5.1 - 5.5 shows the effect of PSO2 in the input gas mixture on the sulfur content of
the calcine. At constant PCO, the % S in the calcine was found to be in direct relation with PSO2 in
the input gas mixture. The sulfur in calcine is found to be lowest at PSO2 = 0 atm, i.e., when there
is no sulfur in the coal used as rotary kiln fuel. The % S in calcine continuously increases by
increasing PSO2 and reaches its highest at PSO2 = 0.0360 atm, which is equivalent to 10 % S in the
coal. Figure 5.6 compares experimentally obtained % S values with results obtained by the
thermodynamic modelling. It is observed that the experimental amounts are lower than the
thermodynamic predictions due to the kinetic limitations.
The increase in sulfur content of the calcine by increasing PSO2 can be explained by a
possible reaction sequence, as discussed by Bolsaitis and Nagata [38, 39], and the thermodynamic
discussion presented in Chapter 4. In a reducing gas mixture, SO2 reacts with CO and form

57
gaseous products, i.e., COS and S2, according to reactions 7 and 8 shown in Table 4.3. These
gaseous species are the intermediate products of the calcine sulfurization. Bolsaitis and Nagata
observed that when XCO is higher than 0.92 in a CO-SO2 gas mixture, COS is the most dominant
intermediate gas species. Thermodynamic simulations in this study predicted similar results, and
PCOS was found to be significantly higher than PS2 for four different experimental gas mixtures
(Table 4.2). However, it should be noted that both COS and S2 are active sulfurization agents that
react with iron, nickel, and their oxides and produce sulfur-containing compounds as given by
reactions 9 - 20 in Table 4.3. In a nutshell, an increase in the SO2 content of the combustion
product of rotary kiln fuel promotes the sulfurization of the laterite ore during calcination.
Figure 5.1 The effect of PSO2 on the sulfur content of the calcine produced at 900 oC and PCO = 0.39 atm

58
Figure 5.2 The effect of PSO2 on the sulfur content of the calcine produced at 900 oC and PCO = 0.45 atm
Figure 5.3 The effect of PSO2 on the sulfur content of the calcine produced at 900 oC and PCO = 0.51 atm

59
Figure 5.4 The effect of PSO2 on the sulfur content of the calcine produced at 900 oC and PCO = 0.57 atm
Figure 5.5 The effect of PSO2 on the sulfur content of the calcine produced at 900 oC and PCO = 0.63 atm

60
Figure 5.6 Comparison of experimentally obtained % S values with thermodynamic simulations
5.2 The Effect of PCO on the Sulfur Content and Sulfur Deportation in the Calcine
It is noteworthy that the slope of regression lines in Figure 5.1 - 5.5 increases with
increasing PCO in the input gas mixtures. This implies a relation between the sulfur content of the
calcine and PCO. The effect of PCO on % S in the calcine at constant PSO2 is investigated
experimentally and plotted in Figure 5.7 - 5.12. The data points obtained from the linear regression
lines (shown in Figure 5.1 - 5.5) are overlaid on the experimentally obtained values. Lastly, the
deportation of sulfur given by equation 5.1 is plotted separately in Figure 5.7 - 5.12.
% Sulfur Deportation = 𝑀𝑎𝑠𝑠 𝑜𝑓 𝑠𝑢𝑙𝑓𝑢𝑟 𝑖𝑛 𝑡ℎ𝑒 𝑐𝑎𝑙𝑐𝑖𝑛𝑒
𝑇𝑜𝑡𝑎𝑙 𝑚𝑎𝑠𝑠 𝑜𝑓 𝑖𝑛𝑝𝑢𝑡 𝑠𝑢𝑙𝑓𝑢𝑟× 100 Eq. 5.1

61
Figure 5.7 The effect of PCO on the sulfur content and sulfur deportation of the calcine produced at 900 ºC and
PSO2 = 0 atm
Figure 5.8 The effect of PCO on the sulfur content and sulfur deportation of the calcine produced at 900 ºC and
PSO2 = 0.0072 atm

62
Figure 5.9 The effect of PCO on the sulfur content and sulfur deportation of the calcine produced at 900 ºC and
PSO2 = 0.0144 atm
Figure 5.10 The effect of PCO on the sulfur content and sulfur deportation of the calcine produced at 900 ºC and
PSO2 = 0.0216 atm

63
Figure 5.11 The effect of PCO on the sulfur content and sulfur deportation of the calcine produced at 900 ºC and
PSO2 = 0.0288 atm
Figure 5.12 The effect of PCO on the sulfur content and sulfur deportation of the calcine produced at 900 ºC and
PSO2 = 0.0360 atm

64
The % S in the calcine at PSO2 = 0 atm (Figure 5.7) slightly decreases by increasing PCO in
the input gas. Similarly, the deportation of sulfur also reduces by increasing the PCO values. The
sulfur in the ore and coal is usually found to be in the form of pyrite (FeS2) [45]. Hence, the
marginal decrease in % S in the calcine may be attributed to the reaction of pyrite with carbon
monoxide to form COS as given by the equation 5.2. However, it should be noted that the COS
generated can react with the ore again and form sulfide species as provided by reactions 9 -14 in
Table 4.3. Hence, even though the % S and % sulfur deportation decreases with increasing PCO, it
is negligibly small due to the re-utilization of COS to generate sulfide products.
FeS2 (s) + CO (g) = FeS (s) + COS (g) ∆Gº900 C = -20.25 KJ Eq. 5.2
Figure 5.8 - 5.12, shows the variation in % S in the calcine and % sulfur deportation with
changing PCO. At constant values of PSO2 between 0.0072 and 0.0360 atm, the % S in the calcine
and % sulfur deportation increases with increasing PCO. According to the reactions given in
Table 4.3, the evolution of COS is promoted by the increasing PCO in the input gas mixtures, and
as a result, the overall generation of sulfide products increase. In other words, increasing PCO in
the input gas mixtures can increase PCOS, which subsequently enhances the sulfurization of the
calcine.
A model is developed to predict % S in the calcine as a function of both PSO2 and PCO by
using the sum of square error minimization technique. The % S in the calcine, is predicted by the
model according to equation 5.3. The values predicted by the model are overlaid on experimental
values in Figure 5.13. It can be seen that the modeled and measured values are in excellent
agreement with each other.
% S = 51.9 PSO2 + 66.4 PCO Eq. 5.3

65
Figure 5.13 Comparison of experimentally obtained % S values with those predicted by the model
5.3 The Effect of the Flow Rate of the Input Gas on % S in the Calcine
Figure 5.14 shows the change in % S in the calcine as a function of PSO2 for the two
different flow rates, i.e., 292 and 176 ml/min at a fixed PCO value of 0.51 atm. Similarly,
Figure 5.15 shows variation in % sulfur deportation as a function of PSO2 for these flow rates.
Decreasing the flow rate of input gas mixtures in the furnace results in lower sulfur content of the
calcine, as evident in Figure 5.14. There are two possible explanations for the decrease in % S in
the calcine: i) The decline is mostly associated with lower amount of the sulfurization gas, i.e.,
SO2, which may react with the ore to form sulfide species ii) In addition, there might be some
kinetic limitations associated with lower flow rate. Sulfur deportation (%) plotted in Figure 5.15,
decreases by lowering the input gas volume. Hence, it is assumed that the gas flow rate may affect

66
reaction kinetics, and gas-solid mass transfer coefficient could be a rate-controlling factor under
such applied conditions.
The gas-solid mass transfer coefficient, kg, for a spherical particle in an uninterrupted gas
flow can be calculated according to Ranz and Marshall correlation presented in equation 5.4 with
the Reynolds (Re) and Schmidt (Sc) number defined with equations 5.5 and 5.6 respectively [46].
Increasing gas flow rate increases gas velocity, which results in higher Re number. Based on Ranz
and Marshall correlation, higher gas velocity results in a higher mass transfer coefficient. In other
words, faster mass transfer at higher flow rates is partially responsible for the higher sulfur content
of the calcine.
𝑆ℎ =𝑘𝑔𝑑𝑠
𝐷= 2.0 + 0.6𝑅𝑒
1
2𝑆𝑐1
3 Eq. 5.4
𝑅𝑒 =𝜌𝑔𝑣𝑑𝑠
𝜇𝑔 Eq. 5.5
𝑆𝑐 =𝜇𝑔
𝜌𝑔𝐷 Eq. 5.6
Where 𝑑𝑠 is the diameter of the particle, D is the diffusion coefficient, v is the gas velocity, 𝜌𝑔 is
the density and 𝜇𝑔 is the viscosity of the gas phase.
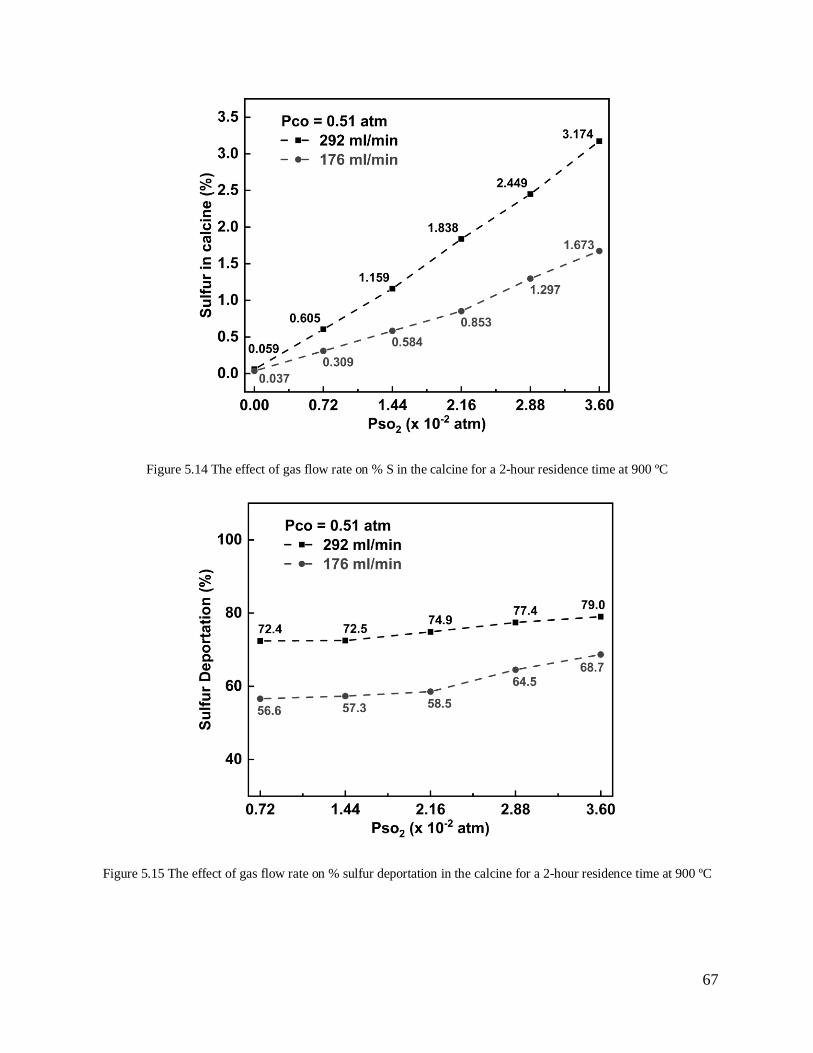
67
Figure 5.14 The effect of gas flow rate on % S in the calcine for a 2-hour residence time at 900 ºC
Figure 5.15 The effect of gas flow rate on % sulfur deportation in the calcine for a 2-hour residence time at 900 ºC

68
5.4 X-ray Diffraction of the Calcine
The X-ray diffraction analysis was performed on three different calcine samples to
ascertain the mineralogy of the product, as shown in Figure 5.16, 5.17, and 5.18, respectively. The
tested samples were calcined at constant PSO2 = 0.0360 atm, and PCO = 0.39, 0.51 and 0.63 atm,
respectively. The major iron-bearing minerals in all of the tested samples were found to be
forsterite and fayalite, where iron is present as Fe+2 in the crystalline structure. Since, iron in the
raw ore was present in the form of nontronite, lizardite, and goethite, i.e., Fe+3 minerals, the
formation of forsterite and fayalite indicates the reduction of iron from Fe+3 to Fe+2 state. The
formation of olivine group minerals is also justified by Hallet’s (1997) study, where it was found
that minerals such as lizardite and smectite (nontronite) undergoes dehydroxylation in the
temperature range of 500 - 800 oC and recrystallizes to olivine above 800 oC [47].
The only sulfur-containing compound found by XRD analysis was pyrrhotite, Fe11S12. A
noteworthy feature in Figure 5.16 - 5.18 is the increase in the intensities of pyrrhotite and
ferronickel peaks by increasing the PCO in input gas. Pyrrhotite and ferronickel peaks are
highlighted in these figures. It can be seen that the peak intensities are the lowest at PCO = 0.39 atm
and the highest at PCO = 0.63 atm. XRD results are in line with the findings of ICP analysis
presented in Figure 5.7 - 5.12, where % S in the calcine was found to be in direct relation with
PCO. Similarly, metallic content in the calcine, i.e., ferronickel, is observed to be in direct relation
with PCO according to the XRD results.

69
Figure 5.16 XRD pattern of the calcine produced at 900 ºC under PSO2 = 0.0360 atm and PCO = 0.39 atm
Figure 5.17 XRD pattern of the calcine produced at 900 ºC under PSO2 = 0.0360 atm and PCO = 0.51 atm

70
Figure 5.18 XRD pattern of the calcine produced at 900 ºC under PSO2 = 0.0360 atm and PCO = 0.63 atm
5.5 The Effect PSO2 on Sum of Metallized and Sulfurized Iron and Nickel
The bromine - methanol leach test was performed for six calcine samples to find the sum
of iron/nickel present in metallic and sulfide forms The bromine - methanol solution is very
selective in dissolving metallics and sulfides but does not dissolve oxides [32]. Figure 5.19 shows
the effect of increasing PSO2 in the input gas mixtures on the sum of iron/nickel present as metal
and sulfide in the calcine. The partial pressure of CO for all the tested samples was constant and
equal to 0.63 atm.
At PSO2 = 0 atm, the metallization for both iron and nickel are found to be unexpectedly
low. Moreover, opposed to the thermodynamic predictions, the metallization for nickel is less than
that for iron. A possible explanation for both phenomena can be found in Hallet’s (1997) study.
The reducing gases in the current study were injected into the furnace upon reaching 900 oC. Hallet
explained that minerals such as lizardite and nontronite undergo dehydroxylation in the

71
temperature range of 500 - 800 oC. Dehydroxylation results in an amorphous phase in which NiO
is most susceptible to reduction. However, above 800 oC, recrystallization into olivine may occur
and would require extreme reducing conditions to metalize nickel [47]. A slightly higher iron
metallization can be explained by the presence of goethite in the ore (Figure 3.1), which can reduce
to wustite under experimental conditions. Hallet elucidated that reduction to iron metal from
wustite would occur before nickel metallization should the formation of olivine happen during
calcination.
The percentage of oxides converted to metallic state and sulfides for iron/nickel increases
by increasing PSO2 in the input gas mixtures. This can be attributed to higher sulfurization in the
calcine by increasing PSO2, which yields a higher percentage of iron and nickel sulfides. Nickel
conversion exceeds that for iron at PSO2 higher than 0.0072 atm. This may imply higher recovery
of nickel from within the olivine structure by increasing PSO2. In other words, it may be possible
that it is easier to sulfurize NiO entrapped within olivine structure than to reduce it to nickel metal.
Figure 5.19 Sum of metallized and sulfurized iron/nickel in the calcine produced at 900 oC

72
5.6 Energy Dispersive Analysis of the Calcine
EDS analysis was done for a single calcine sample, i.e., Experiment 16, given in Table 3.3
where PCO and PSO2 in the input gas mixture were 0.51 and 0.0216 atm, respectively. Initially, the
map of sulfur was obtained to identify the areas with high sulfur concentrations. Figure 5.20 a
show the SEM image of the sample, and b-f shows EDS mapping on the same image for iron,
sulfur, silicon, and magnesium. Table 5.1 lists the atomic concentrations of various elements for
six selected points in Figure 5.20 a, which seemed to be more abundant in sulfur. The presence of
sulfur in the sample is further confirmed by EDS analysis, as shown in Figure 5.20 c and
Table 5.1.
Figure 5.20 (a) SEM image of the calcine produced at 900 oC under PCO = 0.51 atm and PSO2 = 0.0216 atm (b-
f) EDS mapping of iron, sulfur, silicon, and magnesium

73
Table 5.1 % Atomic concentration on selected points for calcine produced at 900 oC under PCO and PSO2 equal to
0.51 and 0.0216 atm, respectively
Point Oxygen Silicon Magnesium Aluminum Iron Sulfur
1 53.76 16.33 5.51 2.36 9.19 12.84
2 51.34 16.09 9.00 2.64 8.74 12.2
3 52.95 16.66 13.45 3.35 5.54 8.05
4 58.57 19.04 6.66 2.32 4.57 8.66
5 54.79 19.15 8.90 2.44 5.59 9.13
6 53.24 21.50 8.77 1.82 6.19 8.44

74
Chapter 6: Conclusion
The behavior of nickel laterite ore in the CO-CO2-N2-SO2 gas mixtures is investigated to
understand the effect of the sulfur content of the fuel on the % S in the calcine. At constant PCO,
the % S in the calcine is found to be directly proportional to PSO2 in the input gas mixtures. In other
words, the higher the amount of sulfur in the coal used as the fuel, the higher the sulfur content of
the resulting calcine. Similarly, at constant PSO2, the sulfur content of the calcine and sulfur
deportation increases with higher PCO in the input gas. This implies that the reducing atmosphere
of the furnace contributes to sulfur transfer to the calcine. However, an exceptional case is
observed at PSO2 = 0 atm, where the sulfur content and sulfur deportation slightly decrease by
increasing PCO in the input gas. The findings of this study confirm the formation of sulfides during
nickel laterite calcination in various CO-CO2-N2-SO2 gas mixtures at 900 ºC. An equation is
developed to fit the experimentally obtained data given as:
% S = 51.9 PSO2 + 66.4 PSO2 PCO
At constant PSO2 and PCO, the % S in the calcine and % sulfur deportation is found to
decrease by lowering the flow rate of the input gas mixtures. The gas-solid mass transfer
coefficient is considered to be the rate-controlling factor in the tested range of the input gas flow
rates. However, further investigation is required to understand the effect of the flow rate on the
overall sulfurization process.
The x-ray diffraction analysis confirmed the presence of forsterite, fayalite, ferronickel,
and pyrrhotite in the calcine. The intensity of the obtained peaks for pyrrhotite and ferronickel
increase with PCO in the input gas.

75
At constant PCO, the sum of metallized and sulfurized iron/nickel is found to increase with
PSO2. The meager percentage for nickel at PSO2 = 0, can be explained by the presence of olivine
minerals, which can interlock NiO in its crystal structure and thus inhibit reduction. However, by
increasing PSO2, the metallized and sulfurized content of nickel increases dramatically, possibly
suggesting the convenience of sulfurizing NiO from within the olivine structure.

76
Chapter 7: Future Work
In the current study, the CO (in the input gas) to Fe2O3 molar ratio was selected as five
times higher than the stoichiometrically required amount to reduce all Fe3+ to Fe2+ minerals.
Similar studies can be conducted for lower CO to Fe2O3 ratios. Furthermore, the calcination-partial
reduction temperature was fixed at 900 oC, and reducing gases were only purged after the
maximum temperature was reached. The XRD analysis of the calcined samples shows the
formation of olivine minerals, which subsequently explains very low metallization of nickel. Thus,
for future experimentations, it is recommended to examine the temperature between 750 oC and
900 oC. This methodology can avoid the interlocking of NiO within olivine structure and thus
improve the reduction of nickel to metallic state. Lastly, the metallization of nickel and iron in a
sulfurizing atmosphere needs to be studied in further detail to understand the effect of higher sulfur
in fuels on the overall performance of rotary kiln calcination.

77
References
[1] F. K. Crundwell, M. S. Moats, V. Ramachandran, T. G. Robinson, and W. G. Davenport,
Extractive Metallurgy of Nickel, Cobalt and Platinum-Group Metals. Elsevier, 2011.
[2] G. Li, H. Jia, J. Luo, Z. Peng, Y. Zhang, and T. Jiang, “Ferronickel Preparation from
Nickeliferous Laterite by Rotary Kiln-Electric Furnace Process,” in Characterization of
Minerals, Metals, and Materials, Springer International Publishing, 2016, pp. 143–150.
[3] M. Rao, G. Li, T. Jiang, J. Luo, Y. Zhang, and X. Fan, “Carbothermic Reduction of
Nickeliferous Laterite Ores for Nickel Pig Iron Production in China: A Review,” JOM, vol.
65, no. 11, pp. 1573–1583, 2013.
[4] N. Campagnol, K. Hoffman, A. Lala, and O. Ramsbottom, “The Future of Nickel: A Class
Act,” 2017.
[5] International Nickel Study Group, “The World Nickel Factbook,” 2018.
[6] A. D. Dalvi, W. G. Bacon, and R. C. Osborne, “The Past and the Future of Nickel Laterites,”
in PDAC 2004 International Convention, Trade Show & Investors Exchange, 2004.
[7] D. R. Swinbourne, “Understanding Ferronickel Smelting From Laterites Through
Computational Thermodynamics Modeling,” Mineral Processing and Extractive
Metallurgy, vol. 123, no. 3, pp. 127–140, 2014.
[8] C. Butt and D. Cluzel, “Nickel Laterite Ore Deposits: Weathered Serpentinites,” Elements,
vol. 9, no. 2, pp. 123–128, 2013.
[9] A. Bunjaku, “The Effect of Mineralogy, Sulfur, and Reducing Gases on the Reducibility of
Saprolitic Nickel Ores,” Aalto University, 2013.

78
[10] R. Elliott, F. Rodrigues, C. A. Pickles, and J. Peacey, “A Two-Stage Thermal Upgrading
Process For Nickeliferous Limonitic Laterite Ores,” Canadian Metallurgical Quarterly,
vol. 54, no. 4, pp. 395–405, 2015.
[11] R. S. B. Eliott, “A Study on the Role of Sulfur in Thermal Upgrading of Nickeliferous
Laterite Ores,” Queen’s University, 2015.
[12] A. E. M. Warner, C. M. Díaz, A. D. Dalvi, P. J. Mackey, and A. V Tarasov, “JOM World
Nonferrous Smelter Survey, Part III: Nickel: Laterite,” JOM, vol. 58, no. 4, pp. 11–20, 2006.
[13] T. Norgate and S. Jahanshahi, “Assessing the Energy and Greenhouse Gas Footprints of
Nickel Laterite Processing,” Minerals Engineering, vol. 24, no. 7, pp. 698–707, 2011.
[14] C. Red, R. Matthias Pfennig, S. Fritsch, and H. Muller, “Refining of Ferronickel,” in The
Thirteenth International Ferroalloys Congress Efficient Technologies in Ferroalloy
Industry, 2013, vol. 229.
[15] A. Ma, S. Mostaghel, and K. Chattopadhyay, “Review of Applicable Desulfurization
Models For Crude Ferronickel Refining,” Mineral Processing and Extractive Metallurgy,
vol. 127, no. 1, pp. 10–28, 2018.
[16] R. A. Bergman, “Nickel Production from Low-Iron Laterite Ores: Process Descriptions,”
CIM Bulletin, vol. 96, no. 1072, pp. 127–138, 2003.
[17] N. Brand, C. R. M. Butt, and M. Elias, “Nickel Laterites: Classification and Features,”
Journal of Australian Geology and Geophysics, vol. 17, no. 4, pp. 81–88, 1998.
[18] G. M. Mudd, “Global Trends and Environmental Issues in Nickel Mining: Sulfides versus
Laterites,” Ore Geology Reviews, vol. 38, no. 1, pp. 9–26, 2010.
[19] M. P. Foose, “Nickel-Mineralogy and Chemical Composition of Some Nickel-Bearing

79
Laterites in Southern Oregon and Northern California,” in Contributions to Commodity
Geology Research (US Geological Survey Bulletin : 1877), US Government Printing Office,
1992, pp. E1–E24.
[20] A. Manceau and G. Calas, “Nickel-Bearing Clay Minerals: II. Intracrystalline Distribution
of Nickel: An X-ray Absorption Study,” Clay Minerals, vol. 21, no. 3, pp. 341–360, 1986.
[21] B. I. Whittington and D. Muir*, “Pressure Acid Leaching of Nickel Laterites: A Review,”
Mineral Processing and Extractive Metallurgy Review, vol. 21, no. 6, pp. 527–599, 2000.
[22] J. Kyle, “Nickel Laterite Processing Technologies - Where to Next?,” in ALTA Nickel-
Cobalt-Copper Conference, 2010.
[23] O. Nakai, M. Kawata, Y. Kyoda, and N. Tsuchida, “Commissioning of Coral Bay Nickel
Project,” in ALTA Nickel-Cobalt Conference, 2006.
[24] J. Vaughan, W. Hawker, and D. White, “Chemical Aspects of Mixed Nickel-Cobalt
Hydroxide Precipitation and Refining,” in ALTA Nickel-Cobalt-Copper Conference, 2011.
[25] J. E. Fittock, “Nickel and Cobalt Refining at QNI Pty Ltd, Yabulu, QLD,” in AUSIMM
Monograph 19, 1992, pp. 1–47.
[26] M. A. Rhamdhani, J. Chen, T. Hidayat, E. Jak, and P. Hayes, “Advances in Research on
Nickel Production Through the Caron Process,” in European Metallurgical Conference,
2009.
[27] P. Prasetyo, “The Effect of Entry into Force of the Mining Law 2009 Began January 2014
in the Production of NPI (Nickel Pig Iron) in China,” IOP Conference Series: Materials
Science and Engineering, vol. 285, 2018.
[28] E. Keskinkilic, “Nickel Laterite Smelting Processes and Some Examples of Recent Possible

80
Modifications to the Conventional Route,” Metals, vol. 9, no. 9, 2019.
[29] K. Quast, J. N. Connor, W. Skinner, D. J. Robinson, and J. Addai-Mensah,
“Preconcentration Strategies in the Processing of Nickel Laterite Ores Part 1: Literature
review,” Minerals Engineering, vol. 79, pp. 261–268, 2015.
[30] M. Adams et al., “Piloting of the Beneficiation and Epal Circuits for Ravensthorpe Nickel
Operations,” in International Laterite Nickel Symposium, 2004, pp. 193–202.
[31] S. Kashani-Nejad and I. Candy, “Modeling of Nickel Laterite Kiln Processing - A
Conceptual Overview,” in Nickel and Cobalt 2005: Challenges in Extraction and
Production: Proceedings of the International Symposium on Nickel and Cobalt, CIM, 2005,
pp. 231–246.
[32] F. M. Rodrigues, “Investigation Into The Thermal Upgrading of Nickeliferous Laterite
Ore,” Queen’s University, 2013.
[33] N. Voermann, T. Gerritsen, I. Candy, F. Stober, and A. Matyas, “Developments in Furnace
Technology for Ferro-Nickel Production,” in Tenth International Ferroalloys Congress,
2004.
[34] C. Doyle, “The Steps Required to Meet Production Targets at PT Inco, Indonesia: A New
Innovative Business Strategy,” in International Laterite Nickel Symposium, 2004, pp. 667–
684.
[35] H. Ishiyama and Y. Hirai, “Fluid Bed Roasting at Tokyo Nickel Company,” in Proceedings
of the Nickel-Cobalt International Symposium, 1997, pp. 133–140.
[36] K. Adham and C. Lee, “Process Design Considerations For the Fluidized Bed Technology
Applications in the Nickel Industry,” CIM Bulletin, 2018.

81
[37] C. G. Fink and V. S. Marchi, “Beneficiating Ferruginous Bauxites Through Chlorination,”
Transactions of The Electrochemical Society, vol. 74, no. 1, pp. 469–494, 1938.
[38] R. D. Holliday and D. J. Milne, “Experimental Evaluation of Routes for Purification of
Bauxite by Gas-Solid Reactions,” Industrial & Engineering Chemistry Process Design and
Development, vol. 14, no. 4, pp. 447–452, 1975.
[39] P. Bolsaitis and K. Nagata, “Kinetics of Sulfidization of Iron Oxide with SO2-CO Mixtures
of High Sulfur Potential,” Metallurgical Transactions B, vol. 11, no. 2, pp. 185–197, 1980.
[40] K. Nagata and P. Bolsaitis, “Selective Removal of Iron Oxide from Laterite by
Sulphurization and Chlorination,” International Journal of Mineral Processing, vol. 19, no.
1, pp. 157–172, 1987.
[41] V. Sidorov, V. Rigin, P. Min, and Y. Folomeikin, “Removal of a Sulfur Impurity From
Complex Nickel Melts in Vacuum,” Russian Metallurgy (Metally), vol. 2015, no. 11, pp.
910–915, 2015.
[42] T. Ogura, K. Kuwayama, A. Ono, and Y. Yamada, “Production of Fe-Ni by the Rotary Kiln-
Electric Furnace Process at Hyuga Smelter,” International Journal of Mineral Processing,
vol. 19, no. 1, pp. 189–198, 1987.
[43] A. Roine and others, “HSC Chemistry 6.0,” Outokumpu Technology, Pori, Finland. 2006.
[44] D. V. Furta, “13. Equilibrium Module-Description of Menus and Options,” 2014.
[45] B. H. Bowen and M. W. Irwin, “Coal Characteristics,” 2008.
[46] J. H. A. Kiel, W. Prins, and W. P. M. van Swaaij, “Mass Transfer Between Gas and Particles
in a Gas-Solid Trickle Flow Reactor,” Chemical Engineering Science, vol. 48, no. 1, pp.
117–125, 1993.

82
[47] C. J. Hallet, “A Thermodynamic Analysis of the Solid State Reduction of Nickel from
Laterite Minerals,” in Nickel-Cobalt International Symposium, 1997, pp. 299–312.