mechanism of sulfur poisoning by h s and so of nickel …
TRANSCRIPT

MECHANISM OF SULFUR POISONING BY H2S AND SO2 OF
NICKEL AND COBALT BASED CATALYSTS FOR DRY
REFORMING OF METHANE
A Thesis Submitted to the College of
Graduate Studies and Research
in Partial Fulfillment of the Requirements
for the Degree of Master of Science
in the Department of Chemical and Biological Engineering
University of Saskatchewan
Saskatoon
By
Francisco Javier Pacheco Gómez
© Copyright Francisco Javier Pacheco Gómez, March 2016. All rights
reserved.

i
PERMISSION TO USE
In presenting this thesis in partial fulfillment of the requirements for a Postgraduate degree from
the University of Saskatchewan, I agree that the Libraries of this University may make it freely
available for inspection. I further agree that permission for copying of this thesis/dissertation in
any manner, in whole or in part, for scholarly purposes may be granted by Professor Hui Wang
who supervised my thesis work. It is understood that any copying or publication or use of this
thesis or parts for financial gain shall not be allowed without my written permission. It is also
understood that due recognition shall be given to me and to the University of Saskatchewan in
any scholarly use which may be made of any material in my thesis.
DISCLAIMER
The University of Saskatchewan was exclusively created to meet the thesis and/or exhibition
requirements for the degree of Master of Science at the University of Saskatchewan.
Reference in this thesis to any specific commercial products, process, or service by trade name,
trademark, manufacturer, or otherwise, does not constitute or imply its endorsement,
recommendation, or favouring by the University of Saskatchewan. The views and opinions of the
author expressed herein do not state or reflect those of the University of Saskatchewan, and shall
not be used for advertising or product endorsement purposes. Requests for permission to copy or
to make other uses of materials in this thesis in whole or part should be addressed to:

ii
Department Head
Department of Chemical and Biological Engineering
University of Saskatchewan
College of Engineering
57 Campus Drive
Saskatoon, SK S7N 5A9
Canada
Or
Dean
College of Graduate Studies and Research
University of Saskatchewan
107 Administration Place
Saskatoon, Saskatchewan S7N 5A2
Canada

iii
ABSTRACT
Nickel catalysts employed in the production of syngas throughout CO2 reforming of CH4 can be
poisoned and deactivated by the presence of H2S or SO2 found in the feedstock. It is necessary to
understand the poisoning mechanism to develop more resistant catalysts. The effect of sulfur
poisoning by H2S and SO2 on the mechanism of carbon dioxide reforming of methane was
studied for Ni/AlMgOx, Ni-Co/AlMgOx and Co/AlMgOx catalysts prepared by coprecipitation
and impregnation methods. The method employed for mechanism study was Diffuse Reflectance
Infrared Fourier Transform Spectroscopy (DRIFTS). DRIFTS made possible to observe that the
mechanism of carbon dioxide reforming of methane reaction involved: 1) methane adsorption
and possibly dissociation into C, CHx and H2; 2) carbon dioxide adsorption and dissociation into
CO; 3) formation of carbonates that could occur after CO2 attaches to an oxygen atom or after
CO binds to two oxygen atoms present in the catalyst surface. It was found a relation ship
between the concentration of carbonates and adsorbed CO.
The presence of H2S in reacting gasses caused a decrease in the intensity of the methane and CO2
absorption bands on the nickel (Ni)-monometallic catalysts, suggesting that H2S blocks the
nickel active sites. Also, H2S caused a decrease in the OH-
species, suggesting that NiS was
formed. The band at 2077 cm-1
, attributed to linear carbonyl, was replaced by two bands located
at 2071 and 2051 cm-1
, which are assigned to carbonyl sulfide produced by the reaction H2S +
CO2 ⇌ COS + H2O on the catalyst surface. When SO2 interacted with the catalysts, a band at
about 1358 cm-1
was observed, which is assigned to sulfate species. SO2 also caused a decline in
the concentration of carbonates and adsorbed CO. This study allowed a better understanding of
the poisoning mechanism by H2S and SO2.

iv
ACKNOWLEDGEMENTS
I want to thank all the people and organizations that made the completion of this thesis possible.
Firstly, I want to deeply thank my supervisor Dr. Hui Wang for accepting my application to the
Master of Science in Chemical Engineering program at the University of Saskatchewan. I
appreciate his guidance throughout this journey and also his financial support.
I recognize the valuable suggestions received from the members of the advisory committee, Dr.
Lifeng Zhang and Dr. Yongfeng Hu. Additionally, I thank Dr. Stephen Foley for accepting to be
the external examiner for my thesis defense.
I appreciate the scholarship provided by CONACYT throughout the official length of my studies.
It allowed me to focus on my studies without financial concerns.
I feel grateful for the help received from Kelly Bader to complete my application. She was the
first staff member from the University of Saskatchewan I had communication with. Her help and
kindness were very valuable to complete the application to the program.
I also acknowledge Wahab Alabi, Mohsen Shakouri and Armin Moniri for helping me to answer
questions and showing me their knowledge in the laboratory.
My gratitude also goes to Richard Blondin for providing technical support for devices and
instruments and to RLee Prokopishyn for helping to fix devices whenever it was needed.

v
DEDICATION
I dedicate this thesis to my parents for supporting me financially and for encouraging me to study
and take important decisions in life. Also, I dedicate this thesis to myself for having the strength
to begin, continue and finish this journey in spite of hard and sometimes discouraging
challenges.

vi
TABLE OF CONTENTS
PERMISSION TO USE................................................................................................................i
ABSTRACT………………….....................................................................................................iii
ACKNOWLEDGMENTS..........................................................................................................iv
DEDICATION..............................................................................................................................v
TABLE OF CONTENTS............................................................................................................vi
LIST OF TABLES.......................................................................................................................x
LIST OF FIGURES.....................................................................................................................xi
NOMENCLATURE AND ABBREVIATIONS......................................................................xv
CHAPTER 1. INTRODUCTION..............................................................................................1
1.1 OVERVIEW........................................................................................................................1
1.2 PREVIOUS RESEARCH MADE BY DR. HUI WANG’S GROUP.......................…...3
1.3 MOTIVATION TO CARRY OUT THIS THESIS..........................................................5
1.4 ORGANIZATION OF THE THESIS...............................................................................6
CHAPTER 2. LITERATURE REVIEW.................................................................................8
2.1 REFORMING OF METHANE..........................................................................................8

vii
2.2 COMMERCIAL PROCESSES FOR THE PRODUCTION OF SYNGAS...........…..11
2.2.1 CALCOR process………………………………………………………..………..11
2.2.2 SPARG process………………………………………………………………...…12
2.3 DRY REFORMING OF METHANE………………………………………….….……13
2.3.1 Environmental aspects for dry reforming of methane…………………............13
2.3.2 Obtainment of reactants for dry reforming of methane……………..………...14
2.3.3 Thermodynamic analysis…………....................................................…………...16
2.3.4 Mechanisms reported for dry reforming of methane……………………..........18
2.3.5 Catalysts used for dry reforming of methane……………….......................……22
2.3.5.1 Nickel-based catalysts.......................................................................……22
2.3.5.2 Cobalt-based catalysts……........….................……………………….….24
2.3.6 Catalyst deactivation………………………...…………………………..……….25
2.3.6.1 H2S poisoning………………………………………………....…………27
2.3.6.2 SO2 poisoning………………………………….…………….…..………29
2.3.7 Regeneration of catalysts after sulfur poisoning………………………..............31
2.4 KNOWLEDGE GAPS, HYPOTHESES AND RESEARCH OBJECTIVES..............32
2.4.1 Knowledge gaps.......................................................................................................32
2.4.2 Research objectives.................................................................................................32
2.4.3 Hypotheses……..……….........................................................................................32
CHAPTER 3. EXPERIMENTAL SET-UP AND PROCEDURE.......................................33
3.1 SAFETY PRECAUTIONS……………………………………………….……………..33

viii
3.2 CATALYST PREPARATION METHODS....................………...........................……34
3.2.1 Coprecipitation method....................................................................................…..34
3.2.2 Impregnation method.............................................................................................35
3.3 CATALYST CHARACTERIZATION...........................................................................36
3.4 PROCEDURE OF DRIFTS EXPERIMENTS………………………...…....................37
CHAPTER 4. RESULTS AND DISCUSSION......................................................................40
4.1 MECHANISM OF CH4 ADSORPTION AND DISSOCIATION………...………..40
4.2 MECHANISM OF CO2 ADSORPTION AND DISSOCIATION……………….….44
4.3 MECHANISM OF DRY REFORMING OF METHANE…………………………..52
4.4 EFFECT OF H2S ON DRY REFORMING OF METHANE……................................56
4.4.1 Independent interactions of H2S with the catalysts………..……….………......56
4.4.2 Adsorptions of CH4 and CO2 in the presence of H2S……………………...…..59
4.4.3 Formation of carbonyl sulfide in the presence of H2S…………...…………....70
4.4.4 Proposed mechanism for H2S poisoning……………………….………...……71
4.5 EFFECT OF SO2 ON DRY REFORMING OF METHANE …………...…..…..…..72
4.5.1 Independent interactions of SO2 with the catalysts…………………………...73
4.5.2 Adsorptions of CH4 and CO2 in the presence of SO2…..…….………………..77
4.5.3 Proposed mechanism for SO2 poisoning………….……….…………………..89
CHAPTER 5. CONCLUSIONS AND RECOMMENDATIONS........................................91

ix
5.1 CONCLUSIONS................................................................................................................91
5.1.1 Mechanism of dry reforming of methane…………………………………..…...91
5.1.2 Effect of H2S on dry reforming of methane……………..…………………..…..92
5.1.3 Effect of SO2 on dry reforming of methane……………….……………...……..93
5.2 RECOMMENDATIONS .................................................................................................93
REFERENCES...........................................................................................................................95
APPENDIX A: FUNDAMENTALS OF FTIR SPECTROSCOPY……..………….....108
APPENDIX B: WAVENUMBERS OF FUNCTIONAL GROUPS………..……….....116

x
LIST OF TABLES
1-1. Metal and metal oxide content after reduction measured by the curve fitting of
XANES……………………………………........…………………………………………………5
2-1. Reforming of methane reactions to produce syngas…………….………...….……..….…….9
2-2. Side reactions during reforming of methane………………...……………..……………….11
2-3. Mechanisms reported in the literature for dry reforming of methane…………...…….........19
2-4. Chemical composition of natural gas…………...……………………..………………........27
2-5. Mechanism steps for H2S chemisorption and dissociation…….…………....……….….......28
3-1. Comparison of methods for catalyst preparation…..……………………………...………...35
3-2. Catalysts tested in this research work……………………..……………...…………...…….36
3-3. BET properties of the catalysts tested in this research work……………..…………..…..…37
3-4. Metal compositions of the catalyst precursors measured by ICP……....………………..….37
B-1. Vibrations attributed to OH- functional groups………………………………….......…....116
B-2. Vibrations attributed to carbonates……………………………………………..........……116
B-3. Vibrations attributed to H2S or species produced by H2S……………………...……..…..116
B-4. Vibrations attributed to SO2 or species produced by SO2…………………..………...…..117
B-5. Vibrations attributed to carbonyl sulfide……………………………..……...……………117
B-6. Vibrations attributed to CH4………………………………………...……...……..………117
B-7. Vibrations attributed to CO2……………………..…………………………...…….……..118
B-8. Vibrations attributed to CO………………………………………………………..………118

xi
LIST OF FIGURES
2-1. Simplified process flow of CALCOR standard process………………........….……..…....12
2-2. Process flow of SPARG process…………………………………………..…….…….......13
2-3. Greenhouse gas emissions in the US in 2013…………………………...………..…..……14
2-4. US Carbon dioxide emissions by source……………………………………...……..…….14
2-5. US methane emissions by source……………………………….…………………....……15
2-6. Reaction equilibrium constants as a function of temperature for some of the reactions
related to dry reforming of methane………………………………..………..…...………..17
2-7. Possible SO2 interactions with alumina………………………………………….…….......30
3-1. Pictorial representation of DRIFTS experimental setup…………………………...…..…..39
3-2. Top view of the DRIFTS accessory showing the trajectory of the infrared light……..…..39
4-1. Comparison of bands produced by CH4 on coprecipitated catalysts and support………...42
4-2. Comparison of bands produced by CH4 on impregnated catalysts and support…………...43
4-3. Antisymmetric mode of CO2………………………..……………………………………..45
4-4. Bands produced by adsorbed CO2 on coprecipitated catalysts and support…………........46
4-5. Bands produced by adsorbed CO2 on impregnated catalysts and support……………......47
4-6. Broad band attributed to carbonates for coprecipitated and impregnated catalysts after the
interaction with CO2……………………………………………….…………………..…..48
4-7. Carbonates formed after CO interacted with the catalysts at 600 oC…………..………….50
4-8. Band at 2077 cm-1
attributed to linear carbonyl for coprecipitated and impregnated catalysts
in the presence of CO2…………………………………….……………..………...……….51
4-9. Coadsorption of CH4 and CO2 before the introduction of H2S…………………………....53
4-10. Coadsorption of CH4 and CO2 before the introduction of SO2……………..…………….54

xii
4-11. OH- consumption in the presence of H2S………………………….......…..…….…...........58
4-12. Bands attributed to CO2 (a) and CH4 (b, c, d) displayed before introducing H2S, 3 hours
after introducing H2S and 1 hour after stopping the H2S flow for CopCat-
Ni4……………....................................................................................................................61
4-13. Bands attributed to CO2 (a) and CH4 (b, c, d) displayed before introducing H2S, 3 hours
after introducing H2S and 1 hour after stopping the H2S flow for ImpCat-
Ni5……………..…………………………………………………………………….…….62
4-14. Bands attributed to CO2 (a) and CH4 (b, c, d) displayed before introducing H2S, 3 hours
after introducing H2S and 1 hour after stopping the H2S flow for CopCat-
Co6………...........................................................................................................................63
4-15. Bands attributed to CO2 (a) and CH4 (b, c, d) displayed before introducing H2S, 3 hours
after introducing H2S and 1 hour after stopping the H2S flow for ImpCat-
Co5……………...…………………………………………………………………………64
4-16. Bands attributed to CO2 (a) and CH4 (b, c, d) displayed before introducing H2S. 3 hours
after introducing H2S and 1 hour after stopping the H2S flow for CopCat-
Ni2Co4………….................................................................................................................65
4-17. Bands attributed to CO2 (a) and CH4 (b, c, d) displayed before introducing H2S, 3 hours
after introducing H2S and 1 hour after stopping the H2S flow for ImpCat-
Ni2Co3……….....................................................................................................................66
4-18. Bands attributed to CO2 (a) and CH4 (b, c, d) displayed before introducing H2S, 3 hours
after introducing H2S and 1 hour after stopping the H2S flow for MgAlOx
support…………..................................................................................................................67
4-19. Decrease in the concentration of carbonates in the presence of H2S………….……...........68

xiii
4-20. Carbonyl sulfide instead of carbonyl produced in the presence of H2S……...……...……70
4-21. Bands attributed to physisorbed SO2 and sulfate species………………………...……......74
4-22. Negative peak at the OH- region seen after the interaction of SO2……….…………........76
4-23. Bands attributed to CO2 (a) and CH4 (b, c, d) displayed before introducing SO2, 3 hours
after introducing SO2 and 1 hour after stopping the SO2 flow for ImpCat-
Ni5………………................................................................................................................78
4-24. Bands attributed to CO2 (a) and CH4 (b, c, d) displayed before introducing SO2, 3 hours
after introducing SO2 and 1 hour after stopping the SO2 flow for CopCat-
Ni4…………………………………………………………………………………….…...79
4-25. Bands attributed to CO2 (a) and CH4 (b, c, d) displayed before introducing SO2, 3 hours
after introducing SO2 and 1 hour after stopping the SO2 flow for CopCat-
Co6………………………………………………………………………………………...80
4-26. Bands attributed to CO2 (a) and CH4 (b, c, d) displayed before introducing SO2, 3 hours
after introducing SO2 and 1 hour after stopping the SO2 flow for ImpCat-
Co5……………...…………………………………………………………………………81
4-27. Bands attributed to CO2 (a) and CH4 (b, c, d) displayed before introducing SO2, 3 hours
after introducing SO2 and 1 hour after stopping the SO2 flow for CopCat-
Ni2Co4……….....................................................................................................................82
4-28. Bands attributed to CO2 (a) and CH4 (b, c, d) displayed before introducing SO2, 3 hours
after introducing SO2 and 1 hour after stopping the SO2 flow for ImpCat-
Ni2Co3…………………………………………………………………………………….83

xiv
4-29. Bands attributed to CO2 (a) and CH4 (b, c, d) displayed before introducing SO2, 3 hours
after introducing SO2 and 1 hour after stopping the SO2 flow for MgAlOx
support………………………………………………………………………..……………84
4-30. The impact of the presence of SO2 on CO species for various catalysts…….…………….85
4-31. Concentration of carbonates before, in and after the presence of SO2……………...……..86
4-32. Decrease of the concentration of carbonates after the introduction of SO2……………..…88
A-1. The electromagnetic spectrum…………………………………………………...……......108
A-2. Stretching vibrations (symmetrical and asymmetrical) of the CO2 molecule…………......110
A-3. Bending vibrations for a CH2 group ……………………………………..…………..…..111

xv
NOMENCLATURE AND ABBREVIATIONS
BET: Brunauer–Emmett–Teller.
CopCat-Ni4: Coprecipitated monometallic nickel catalyst.
CopCat-Ni2Co4: Coprecipitated bimetallic Ni-Co catalyst.
CopCat-Co6: Coprecipitated monometallic cobalt catalyst.
Heat capacity at mole-constant pressure.
DRIFTS: Diffuse Reflectance Infrared Fourier Transform Spectroscopy.
DRM. Dry reforming of methane.
FTIR: Fourier-Transform Infrared Spectroscopy.
ICP: Inductively Coupled Plasma.
ImpCat-Ni5: Impregnated monometallic nickel catalyst.
ImpCat-Ni2Co3: Impregnated bimetallic Ni-Co catalyst.
ImpCat-Co5: Impregnated monometallic cobalt catalyst.
K: Reaction equilibrium constant.
MSDS: Material Safety Data Sheets.
OH-: Hydroxyl functional group.
XANES: X-ray Absorption Near Edge Spectroscopy.
R: Gas constant (J/mol K).
ΔGo: Standard Gibbs free-energy change (J/mol).
Standard enthalpy change (J/mol).
Standard entropy change (J/mol K).
: Sum of heat capacities of chemical species multiplied by their stoichiometric
coefficients.

1
CHAPTER 1. INTRODUCTION
1.1 OVERVIEW
Carbon dioxide reforming of methane, also known as dry reforming of methane or DRM (CO2 +
CH4 →2CO + 2H2), generates syngas, which is a gaseous mixture appropriate for the production
of valuable chemicals (Bitter et al., 2000). The complete process to convert natural gas into
valuable liquid products such as methanol and dimethyl ether is called Gas to Liquids (GTL)
Technology. In this process, the production of syngas is the part of the process that requires more
capital investment, ranging from 50 to 75% of the plant investment (Christensen et al., 1998).
Syngas can be produced from any feedstock containing carbon such as coal, petroleum, coke,
hydrocarbons, and biomass. Among these options, the cheapest processes to produce syngas use
natural gas as feedstock (Wilhelm et al., 2001). The reactants for dry reforming of methane can
also be obtained from biogas, which is a mixture of methane and carbon dioxide with trace
quantities of nitrogen, hydrogen sulfide, ammonia and other compounds. Biogas is produced by
anaerobic digestion of biomass. The CO2 reforming of CH4 reaction is environmentally friendly
because it turns two greenhouse gases into useful and valuable chemicals (Ruckenstein and Hu,
1995). The utilization of biogas would help to decrease a wide variety of contaminants that are
dangerous to human health. Therefore, a significant motivation exists to use biogas as soon as it
is generated for energy applications (Saha et al., 2014).

2
Catalysts made with most of the metals from Group VIII are active for the reaction according to
Fischer and Tropsch in 1928. Transition metals such as Ru, Rh, Ni, Pd and Pt have also been
tested (Bitter et al., 2000).
Nickel-based catalysts are seen with interest from the industrial perspective due to their low cost
and high availability (Cui et al., 2007). However, sulfur poisoning is one of the biggest
challenges for nickel catalysts that interferes with their activity (Sehested, 2003).
Both carbon formation and sulfur poisoning can block active sites in the catalyst. Sulfur
molecules can inhibit the catalyst at concentrations as low as in the ppb order (Hashemnejad and
Parvari, 2011). The capacity to adsorb sulfur is an important characteristic of the catalyst
(Sehested, 2003). Different variables such as the sulfur-containing compound, the composition of
the catalyst and, the conditions of operation determines the degree of sulfur poisoning. (Ashrafi
et al., 2008).
There are two options to overcome sulfur poisoning: 1) to purify the feed to low levels of sulfur
compounds (even as small as in the ppb order) or 2) to develop catalysts that maintain their
activity in the presence of sulfur compounds. The separation of sulfur from the gas stream before
the reforming reaction would represent a high percentage of operating costs and therefore, the
second approach is preferred (Rangan et al., 2011).
It is reported that sulfur adsorbs on the catalysts as metal sulfides, but suitable identification of
sulfur species on the deactivated catalysts has been of great importance (Chen et al., 2010). The
catalysts can be deactivated not only by the formation of metal sulfides but also by the formation

3
of sulfates on the support. The formation of sulfates can change the crystal arrangement, thus
impacting the metal-support synergy. The capacity for every catalyst to reverse this mechanism
depends on its composition (Jones et al., 2003).
This study will help to determine the effect of H2S and SO2 on Ni-Co/AlMgOx, Ni/AlMgOx and
Co/AlMgOx catalysts during dry reforming of methane. The catalysts will be tested for dry
reforming of methane before, in and after the presence of H2S and SO2. Diffuse Reflectance
Infrared Fourier Transform Spectroscopy (DRIFTS) will be used to determine the species
adsorbed on the surface of the catalysts.
1.2 PREVIOUS RESEARCH MADE BY DR. HUI WANG’S GROUP
Previous work done under Dr. Hui Wang’s supervision at the University of Saskatchewan has
generated deep insight into the catalyzed CO2 reforming of methane.
It was reported by Zhang et al. (2007) that, among bimetallic coprecipitated catalysts containing
nickel with either Co, Fe, Cu and Mn supported on AlMgOx, the Ni-Co/AlMgOx catalyst was
the best regarding activity, stable operation and low carbon formation. This superior performance
was attributed to its high surface area, small pore size, high-extent reducibility and strong metal-
support interaction. Carbon Sciences Inc, in Santa Barbara, USA obtained an exclusive license
from University of Saskatchewan to use the Ni-Co/AlMgOx catalyst in 2010. Additionally, the
catalyst was patented in July 2011 for the production of syngas (US patent 7, 985, 710).
Zhang et al. (2008a) tested different Ni/Co ratios for the dry reforming of methane reaction and
found that the best ratios are between 0.6 and 1.5. Also, the best metal dispersion and smaller

4
metal particles are found in lower Ni-Co content. They concluded that Ni-Co catalysts with a
ratio approximate to 1 and lower metal content had higher activity and stability and insignificant
carbon formation since they have smaller particles that suppress carbon deposition.
On the basis that particle sizes and metal-support interaction are the most influential factors for
carbon resistance in catalysts, Zhang et al. (2008a) studied the calcination temperature to
determine its effect on particle size and metal-support interaction. They discovered that low
calcination temperature such as 400 oC allowed the formation of particles with small sizes but
lacking strong metal-support interaction. On the contrary, by increasing the temperature up to
1100 oC, larger particles were produced and the catalyst had stronger metal-support interaction.
It was concluded that a calcination temperature between 700-900 oC was better for Ni-
Co/AlMgOx for dry reforming of methane.
Finally, Zhang et al. (2008b) studied the kinetics of dry reforming of methane using Ni-
Co/AlMgOx in the range 650-750 oC. It was suggested that the dissociation of methane and the
reaction between carbon and adsorbed CO2 are the rate-determining steps.
Shakouri (2011) studied the effect of Ni-Co ratios and H2S poisoning on the performance of
catalysts for dry reforming of methane. He prepared bimetallic Ni-Co/AlMgOx catalysts as well
as monometallic Ni/AlMgOx and Co/AlMgOx catalysts using coprecipitation and impregnation
methods. Catalysts with higher nickel content showed higher resistance to H2S poisoning.
Moreover, the bimetallic and nickel monometallic catalysts prepared by impregnation
regenerated better after the interaction of H2S than the catalysts prepared by coprecipitation.

5
X-Ray Absorption Near-Edge Spectroscopy (XANES) determined the reduction extent of nickel
and cobalt oxides. The reduction took place at 750 oC for 4 hours by a H2/He mixture. This
technique determined the composition of nickel and cobalt in its reduced and oxidized forms as
shown in Table 1-1.
Table 1-1. Metal and metal oxide content after reduction measured by the curve fitting of
XANES (Wang et al., 2013).
Reduction at higher temperatures (850 oC) produced larger particle sizes (more than 100
angstroms) whereas reduction at 750 oC produced particles smaller than 100 angstroms. Also, the
amount of reduced metal on impregnated catalysts was almost twice the amount on
coprecipitated catalysts. Nickel was easier to reduce than cobalt, regardless of the preparation
method. The impregnated Ni monometallic catalysts had the highest conversion. On the other
side, the Co monometallic catalyst did not show good activity. (Wang et al., 2013).
1.3 MOTIVATION TO CARRY OUT THIS THESIS
As previously discussed, the CO2 reforming of methane is important because it produces syngas
that can be used in the production of liquid hydrocarbons by the Fischer-Tropsch reaction and at
the same time it consumes two of the more abundant greenhouse gases in the atmosphere.
Catalyst Ni/Co Ni% NiO% Co% CoO%
CopCat-Ni4 - 87 13 - -
CopCat-Ni2Co4 0.6 52 48 20 80
CopCat-Co6 - - - 0 100
ImpCat-Ni5 - 84 16 - -
ImpCat-Ni2Co3 0.5 82 18 37 63
ImpCat-Co5 - - - 43 57

6
Many studies focus only on the gas phase or the species desorbed from the catalysts. It is
necessary to study the species adsorbed on the catalyst surface to understand the mechanism or
the reaction pathway (Hauchecorne and Lenaerts, 2013). It is important to understand the
reaction mechanism for dry reforming of methane without H2S and SO2. Additionally, since the
reactants for DRM usually contain gases such as H2S in biogas and SO2 in the mixture of gases
produced by the combustion of coal, it is paramount to study the response of Ni-Co/AlMgOx
catalysts when there is H2S or SO2 in the feed. The knowledge of the mechanism of a reaction is
one of the steps involved in the design of a catalyst and helps to determine the properties that a
satisfactory catalyst should possess. (Dowden et al., 1968). Another purpose of the study of the
mechanisms is the optimization of reaction conditions for rate and selectivity.
1.4 ORGANIZATION OF THE THESIS
The thesis is organized according to the University of Saskatchewan guidelines for master degree
thesis.The arrangement of this work is as follows:
Chapter 1: Introduction describes the background of dry reforming of methane and the
challenges this area has faced. The previous research made on catalyst development for dry
reforming of methane under the supervision of Dr. Hui Wang is also presented.
Chapter 2: Literature review gives information about the different forms of reforming of
methane. Attention is then focused on dry reforming of methane and its characteristics
(environmental aspects, thermodynamics and mechanism). Research on different catalysts
(especially nickel and cobalt based catalysts) for DRM reaction is also presented. Finally, this

7
chapter shows causes of deactivation of catalysts, especially H2S and SO2 poisoning. Knowledge
gaps in the literature review are identified at the end of this chapter.
Chapter 3: Experimental set-up and procedure describes the process of preparation of the
catalysts used in this research work. Some of the physical and chemical properties of the
catalysts such as surface area, pore size, pore volume and metal composition are presented.
Finally, this chapter explains the fundamentals of infrared spectroscopy and the procedure of the
experiments using this technique.
Chapter 4: Results and discussion shows the results of the experiments and the analysis to
reach the conclusions. First, the mechanism on the catalyst surface when methane interacts with
the catalysts without the presence of carbon dioxide, and then the other way around, is discussed.
Then, the mechanism on the catalyst surface is described when both methane and CO2 interact
with the catalysts at the same time (during dry reforming of methane reaction). Finally, the effect
of either H2S or SO2 on the mechanism for DRM is analyzed.
Chapter 5: Conclusions and recommendation summarizes the main contributions or findings
in this research work and suggests further research that could be performed in the area.

8
CHAPTER 2. LITERATURE REVIEW
The intention of this chapter is to revisit existing literature to enable both the reader and
researcher to learn from previous studies.
In this chapter, firstly, some of the reactions to produce syngas (as well as the side reactions)
using methane as feedstock will be presented. Secondly, a review of the carbon dioxide
reforming of methane and the catalysts used for this reaction (especially nickel and cobalt-based
catalysts) will be introduced. Finally, the mechanism of dry reforming of methane and the
poisoning of catalysts by hydrogen sulfide and sulfur dioxide during the reaction using FTIR
spectroscopy will be presented.
At the end of the literature review, some knowledge gaps are identified to justify the research.
2.1 REFORMING OF METHANE
The reforming of methane is the reaction of methane with either water, carbon dioxide or oxygen
(or a combination of them) to produce syngas. Table 2-1 illustrates the methane reforming
reactions.
9
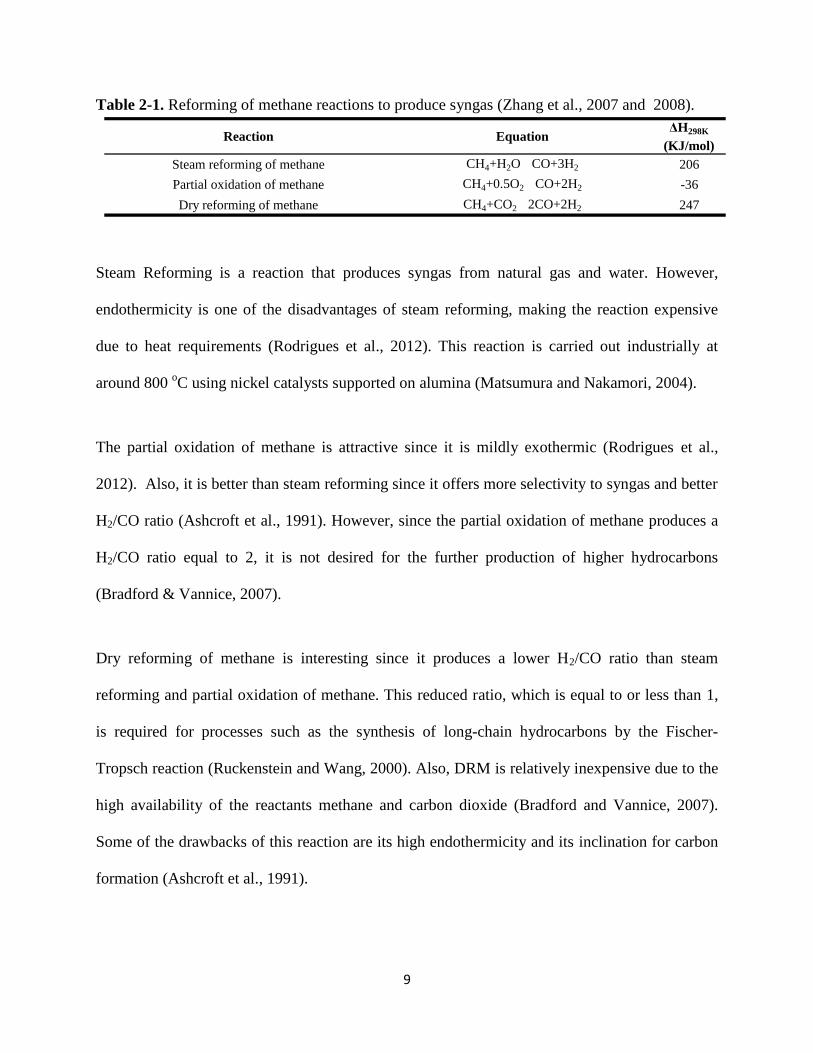
Table 2-1. Reforming of methane reactions to produce syngas (Zhang et al., 2007 and 2008).
Steam Reforming is a reaction that produces syngas from natural gas and water. However,
endothermicity is one of the disadvantages of steam reforming, making the reaction expensive
due to heat requirements (Rodrigues et al., 2012). This reaction is carried out industrially at
around 800 oC using nickel catalysts supported on alumina (Matsumura and Nakamori, 2004).
The partial oxidation of methane is attractive since it is mildly exothermic (Rodrigues et al.,
2012). Also, it is better than steam reforming since it offers more selectivity to syngas and better
H2/CO ratio (Ashcroft et al., 1991). However, since the partial oxidation of methane produces a
H2/CO ratio equal to 2, it is not desired for the further production of higher hydrocarbons
(Bradford & Vannice, 2007).
Dry reforming of methane is interesting since it produces a lower H2/CO ratio than steam
reforming and partial oxidation of methane. This reduced ratio, which is equal to or less than 1,
is required for processes such as the synthesis of long-chain hydrocarbons by the Fischer-
Tropsch reaction (Ruckenstein and Wang, 2000). Also, DRM is relatively inexpensive due to the
high availability of the reactants methane and carbon dioxide (Bradford and Vannice, 2007).
Some of the drawbacks of this reaction are its high endothermicity and its inclination for carbon
formation (Ashcroft et al., 1991).
Steam reforming of methane CH4+H2O
⇌
CO+3H2 206
Partial oxidation of methane CH4+0.5O2
⇌
CO+2H2 -36
Dry reforming of methane CH4+CO2
⇌
2CO+2H2 247
ΔH298K
(KJ/mol)Reaction Equation

10
Syngas can also be produced by a combination of steam and dry reforming of methane or by tri-
reforming of methane, which is reacting methane with oxygen, CO2 and steam (Gangadharan et
al., 2012; Song and Pan, 2004). The combination of reactions, also known as “mixed” reforming,
allows H2/CO ratios from 1 to 3 simply by adjusting the CO2/H2O/O2 ratios (Bradford &
Vannice, 2007). One example of “mixed” reforming is the autothermal reforming of methane,
which is the combination of partial oxidation of methane with either carbon dioxide or steam
(Ayabe et al., 2003). In the autothermal mode, the heat provided by the exothermic reaction
(partial oxidation of methane) supplies the energy for the endothermic reactions (steam or dry
reforming of methane) (Barrai et al., 2007). The preferred option to produce syngas industrially
in an economical, safe and large-scale manner is autothermal reforming (Aasberg-Petersen et al.,
2003).
Synthesis gas has a wide variety of applications. Hydrogen can be used for the production of
electricity using fuel cells (Choudhary et al., 2003), as well as in many processes in the
petrochemical industry such as hydrotreating and hydrocracking. Syngas can also be used for the
production of liquid fuels such as diesel, methanol, gasoline and dimethyl ether (DME) (Rostrup-
Nielsen, 2000). Carbon monoxide can be utilized for the production of valuable products such as
chemicals used in agriculture, organic acids and polycarbonates (Teuner et al., 2001). Syngas can
be produced from any feedstock containing carbon such as coal, petroleum, coke, hydrocarbons,
and biomass. Among these options, the cheapest processes to produce syngas use natural gas as
feedstock (Wilhelm et al., 2001).
The reforming of methane has side reactions which deactivate the catalyst or alter the H2/CO
ratio. Table 2-2 shows some of these reactions.

11
Table 2-2. Side reactions during reforming of methane.
2.2 COMMERCIAL PROCESSES FOR THE PRODUCTION OF SYNGAS
There are at least two commercial processes for the production of syngas, the CALCOR and
SPARG processes:
2.2.1 CALCOR process
The CALCOR process comprises the steps (Teuner et al., 2001) shown in Figure 2-1:
-Heating a stream composed of natural gas as feed and recirculated hydrogen coming from
syngas purification.
-Desulfurization of this mixture by hydrogenation and adsorption on ZnO.
-Mixing of the mixture with recirculated carbon dioxide.
-Reforming of the mixture in reforming tubes filled with catalysts and heated with a high-speed
burner.
-Cooling of the syngas product before passing it into a purification unit in which hydrogen is
separated as well as traces of CH4 and CO2.
-CO is produced by low-temperature or membrane purification, depending on the concentration
or purity required.
CH4 decomposition CH4
⇌
C+2H2
Boudouard reaction 2CO
⇌
C+CO2
Reverse water gas shift reaction CO2+H2
⇌
CO+H2O
Water gas reaction H2O+C
⇌
H2+CO
Water-gas shift reaction CO+H2O
⇌
CO2+H2
Reaction Equation

12
Absorber
CO product
Syngas
Syngas
Stripper
Feed Make-up
CO2
Reformer
CH4 Feed Hydrogen feed
Figure 2-1. Simplified process flow of CALCOR standard process (Teuner et al., 2001).
2.2.2 SPARG Process
One characteristic of this process is that the catalysts are covered by sulfur (sulfur passivation) to
prevent carbon deposition (Udengaard et al., 1992). This process produces a ratio of H2/CO
equal to 1.8 which is suitable for the production of valuable chemicals such as dimethyl ether,
oxo-alcohols, and acetic acid. This process combines steam reforming with CO2 reforming of
methane, producing a lower H2/CO ratio than steam reforming alone (Udengaard et al., 1992).
The developers of this process have reported the absence of coke for almost three years at the
prereformer. The flow diagram of SPARG process is shown in Figure 2-2.

13
CO2
Steam
Natural gas
CO2
Syngas
Desulfurization Prereforming Reforming CO2 wash
Figure 2-2. Process flow of SPARG process (Udengaard et al., 1992).
2.3 DRY REFORMING OF METHANE
2.3.1 Environmental aspects for dry reforming of methane
From the environmental point of view, dry reforming of methane is beneficial since it consumes
two abundant greenhouse gasses (Pichas et al., 2010). More concern should be taken about
methane since it was reported to have a global warming potential 28 times higher than that of
carbon dioxide (epa.gov). It is debated whether the dry reforming of methane reduces carbon
dioxide in the atmosphere since the energy consumption during reaction produces more carbon
dioxide than the carbon dioxide consumed in the chemical reaction (Centi and Perathoner, 2009).
The main greenhouse gasses emitted to the atmosphere are methane and carbon dioxide as Figure
2-3 shows:

14
Figure 2-3. Greenhouse gas emissions in the US in 2013 (epa.gov).
2.3.2 Obtainment of reactants for DRM
The main sources that generate carbon dioxide are shown in Figure 2-4:
Figure 2-4. US Carbon dioxide emissions by source in 2013 (epa.gov).
Methane can be emitted and obtained from many sources as displayed in Figure 2-5.

15
Figure 2-5. US methane emissions by source in 2013 (epa.gov).
Most of the methane emitted come from organic waste, as Figure 2-5 shows. The organic waste
can be originated from animals, crops, wastewater, sewage sludge and municipal residues.
Biogas is produced when bacteria break down organic waste by anaerobic digestion (Buekens,
2005).
The composition of biogas varies depending on its source but generally, it is composed mainly of
methane (45-75%) and carbon dioxide (25-50%). It also contains sulfur compounds such as
hydrogen sulfide (up to 100-1000 ppm), mercaptans (up to 100 ppm) and minuscule amounts of
carbonyl sulfide, sulfur dioxide and CS2 (Mescia et al., 2011).
The utilization of biogas for the production of syngas has been reported in the literature as dry
reforming of biogas (Barrai et al., 2007). It would help to decrease a wide variety of
contaminants that are dangerous to human health including methane, which is a greenhouse gas.
That is why there is a great motivation to use biogas as soon as it is generated for energy
applications. (Saha et al., 2014). Biogas, compared to other sources of renewable energy such as

16
solar, wind and hydropower, has the advantage of not having geographical limits, and its
production neither requires sophisticated technology nor is it monopolistic (Taleghani and Kia,
2005).
2.3.3 Thermodynamic analysis
For a chemical reaction, ΔGo represents the standard Gibbs free-energy change for the conversion
of reactants in their standard states to products in their standard states. ΔGo
is a function of
temperature and it is defined as:
= -RTlnK (2-1)
(2-2)
where R is the gas constant, T is the temperature, K is the reaction equilibrium constant, and
are the standard enthalpy change and standard entropy change, respectively. Equation (2-1)
can be rearranged as follows:
(2-3)
and are defined as:
= 289K+
(2-4)
= 298K+
(2-5)
is the heat capacity at mole-constant pressure and can be determined with the formula:

17
= a + bT + cT2 + dT
3 (2-6)
where a, b, c and d are constants that are reported on thermodynamic books such as Cengel and
Boles, 2011. and
are reported as well. is the sum of heat capacities of
chemical species multiplied by their stoichiometric coefficients. By combining equations (2-2),
(2-4) and (2-5) into (2-3), it is possible to find the equilibrium constants for the dry reforming of
methane reaction and its side reactions as a function of temperature, as shown in Figure 2-6
(Zhang et al., 2008).
Figure 2-6. Reaction equilibrium constants as a function of temperature for some of the
reactions related to dry reforming of methane (Zhang et al., 2007).

18
2.3.4 Mechanisms reported for dry reforming of methane
The mechanism of dry reforming of methane can be studied by Diffuse Reflectance Infrared
Fourier Transform Spectroscopy (DRIFTS). This technique helps to characterize in situ
intermediates of reaction adsorbed on the surface of heterogeneous catalysts at actual conditions
of operation such as high pressure and temperature. The DRIFTS cell is like a “window” that
allows the observation of the mechanism of reaction on the surface of the catalyst at reaction
conditions (Highfield et al., 1991). Some examples of the information obtained by different
authors related to the dry reforming of methane and sulfur poisoning using infrared spectroscopy
will be presented in the following paragraphs.
Kroll et al. (1997) studied the mechanism of dry reforming of methane catalyzed by nickel
supported on silica using in-situ DRIFT spectroscopy. They found that right after methane and
CO2 interact with the catalyst, dehydrogenated carbon species adsorb on nickel. Bands were
found at 2012 and 1855 cm-1
, which were attributed to linear and multibonded CO adsorbed
species, respectively. They found CO infrared bands at 500 oC but not at 700
oC and they
assigned this to a very short residence time and, therefore, negligible accumulation of CO on the
catalyst surface.
Erdőhelyi et al. (1997) determined that CH4 has a promoting effect on the dissociation of CO2.
This promoting effect was concluded by observing CO bands at higher intensities and at lower
temperatures when CH4 was also introduced.
Kitla et al. (2013) detected a band at 2075 cm-1
which they attributed to linear carbonyl
chemisorbed on Ni0. When Cu was added to the nickel catalyst it was observed a redshift, which

19
is lower energy to produce the vibration or lower wavenumber, of about 50-70 cm-1
for the CO
peak, this was attributed to copper donating electrons to nickel. The vibration frequency of
carbon monoxide experienced a blue shift (higher energy of vibration or higher wavenumber) of
about 34 cm-1
on Ni-rich bimetallic catalysts.
Redshifts and blueshifts can be explained in terms of bond length. For example, in X-H (in
which X is a more electronegative atom or functional group than H), bond lengthening is related
to redshift or lower wavenumber in infrared spectrometry (Joseph and Jemmis, 2007). On the
contrary, X-H bond contraction is believed to produce a blueshift or higher wavenumber on the
spectra.
Bitter et al. (1997) documented that upon CO2 adsorption, the presence of linear CO on Pt as
well as carbonates were detected on Al2O3, TiO2 and ZrO2 catalyst supports using infrared
spectroscopy. However, they could not observe carbonates on SiO2. They concluded that
catalysts that can form carbonates on the support have superior activity to catalysts which do not
have this feature. Among the previous catalyst supports, the formation of carbonates was much
higher on Al2O3, this was confirmed by infrared spectroscopy.
Other mechanistic steps for DRM are reported in Table 2-3.
Table 2-3. Mechanisms reported in the literature for dry reforming of methane.
Mechanism Reaction Comments and references
Carbonates on the
support react with C to
produce CO (Tsipouriari
and Verykios, 1999).
CO2-Os+C→2CO (where s
means oxygen on the support)
Tsipouriari and Verykios (2001)
reported this step to be rate
determining.

20
Table 2-3. Mechanisms reported in the literature for dry reforming of methane (continued).
Mechanism Reaction Comments and references
CO2 adsorption and
further dissociation into
gaseous CO and
adsorbed oxygen
(Schuurman et al., 1998;
Bitter et al., 1997)
CO2+ 2S*⇌CO-S* + O-S*
Schuurman et al. (1998) and Kroll
et al. (1997) showed by their
experiments that no oxygen release
was detected after CO2 dissociation
and CO was immediately detected
in the gas phase. This step is greatly
reversible and swift (Kroll et al.,
1997).
Adsorbed oxygen
reacting to carbon
produced by methane
dissociation, yielding
more CO. (Schuurman
et al., 1998)
CO2 ⇌ CO + O-S*
Ni-Oads+NiC→2Ni+CO
Overall reaction:
CO2+NiC⇌2CO+Ni
Or in simpler terms:
CO2+C⇌2CO
The inverse of the previous reaction is
called Boudouard reaction (Tsipouriari
and Verykios, 1999). This step was
reported as rate limiting on Ni/SiO2
catalyst (Schuurman et al., 1998; Kroll
et al., 1997).
Methane dissociation
after adsorption on the
catalyst (Hickman and
Schmidt, 2015;
Schuurman et al., 1998)
CH4→ C-S* +4H-S*
CH4+Ni⇌NiC+2H2
On nickel catalysts, methane
dissociation leads to hydrogen
production and carbon
accumulation on nickel (Schuurman
et al., 1998). The methane
conversion decreases when the
oxygen on the catalytic surface is
unavailable or when the surface is
saturated with carbon (Schuurman
et al., 1998). It also decreases on a
highly oxidized catalyst
(Schuurman et al., 1998).
Tsipouriari and Verykios (1999)
concluded that dissociation of CH4
to form CHx species is a slow step.
Bitter et al. (1997) concluded that
the activation of methane occurs on
the metal.
Water produced after
hydrogen reacts with
oxygen produced by
CO2 dissociation
(Schuurman et al.,
1998).
CO2+2S*⇌CO-S*+O-S*
The water-gas shift reaction is a
combination of these steps H2+Ni-Oads⇌H2O+Ni (Schuurman
et al., 1998)
Formation of formate
and/or carbonate on
alumina support
(Schuurman et al., 1998;
Erdohelyi et al., 1997).
O2-
+CO2⇌CO32-
Bitter et al. (1997) reported that
catalysts containing MgO, Al2O3,
TiO2 or ZrO2 allow carbonates
formation. Formation of carbonates
does not occur on SiO2 support.
OH-+CO⇌OCHO

21
Table 2-3. Mechanisms reported in the literature for dry reforming of methane (continued).
Mechanism Reaction Comments and references
Oxidation of carbon to
CO2 (Goula et al.,
1996).
O2+2S*⇌2O-S* There is not a report of a kinetic model
for the oxidation of filamentous carbon C+O-S*→CO-S*
CO-S*+O-S*→CO2+2S*
Erdőhelyi et al. (1997) concluded that the concentration of the reactants has an effect on the
composition of the mixture of products on alumina supported catalysts. An increase in the
concentration of CH4 leads to lower CO/H2 ratio and an increase in the concentration of carbon
dioxide produces more CO and less H2. Additionally, it was reported that when methane is in
excess on the reacting mixture, the amount of carbon deposited also increased.
In the reforming of methane reaction, carbon dioxide, oxygen or water have as purpose to
regenerate the catalysts and removing carbon produced by the cracking of methane with the
following mechanism (Choudhary and Goodman, 2006):
C+H2O/O2/CO2→COx+H2 + regenerated catalyst surface (2-7)
It might be reasonable to think that the carbon deposition could be prevented by an excess of
carbon dioxide during DRM reaction. However, this is not preferred in the industry due to the
high costs that the further separation of CO2 would incur (Zhang et al., 2012).
The dissociation of methane is very small on metal surfaces and it is promoted by oxygen
produced by the dissociation of carbon dioxide. Synergistically, the dissociation of CO2 is
favored by adsorbed hydrogen resulting from the cracking of methane (Erdőhelyi et al., 1997).

22
Tsipouriari and Verykios (1999) documented that the dissociation of methane on nickel to
produce NiC and H2 is a slow step while activation of CO2 in the support used (La2O3) to
produce carbonates (La2O2CO3) is a fast step.
Zhang et al. (2008b) studied the kinetics of dry reforming of methane using Ni-Co/AlMgOx at
the range 650-750 oC. He suggested that the dissociation of methane and the reaction between
carbon and adsorbed CO2 are the rate-determining steps.
2.3.5 Catalysts used for dry reforming of methane
Many metals have been employed to produce catalysts for the reforming of methane. For
example, Rostrup-Nielsen and Hansen (1993) tested Ni, Ru, Rh, Pd, Pt and Ir and they found that
Ru and Rh allow carbon-free operation and they concluded the succeding order in activity: Ru,
Rh > Ir > Ni, Pt and Pd.
Even though catalysts composed of noble metals have shown a stable operation for dry
reforming of methane and low carbon deposition, they are not the preferred option in the industry
due to their high price and limited availability. Therefore, the research community has widely
focused on nickel catalysts due to their high availability (Zhang et al., 2007).
2.3.5.1 Nickel-based catalysts
Nickel catalysts have been prepared both monometallic and bimetallic for dry reforming of
methane. An example of this was the study made by Zhang et al. (2008). Ni-Metal/AlMgOx
(where metal could be Co, Cu, Fe, or Mn) catalysts were compared and Ni-Co/AlMgOx was
more active and stable than the others. The performance of Ni-Co/AlMgOx was different after
varying Ni/Co ratio and loading. Coke was not detected with a Ni/Co ratio around 1 and Ni-Co

23
loading between 4-10% (Zhang et al., 2008). The Ni-Co bimetallic catalyst performed steadily
for 2000 h with CH4 and CO2 conversions = 90 and 91%, respectively. (Zhang et al., 2007). This
superior activity of the catalysts was attributed to its high surface area and high metal dispersion,
small particle size, strong metal-support interaction and synergy between nickel and cobalt.
Sun (2005) prepared Ni-Ti and Ni-Ti-Al catalysts. The activity of the Ni-Ti catalyst for DRM
increased with Ni loading between 1-10 wt%. The reduction temperature had a big effect on the
activity of the reduced catalyst. The activity increased when reduction temperature was increased
until 973 K, and after that point, the activity decreased until disappearance at 1023 K. Also, the
author obtained a Ni-Ti catalyst with a high surface area equal to 426 m2/g when calcined at 473
K and it was noted that calcination at higher temperature made surface area to decrease notably.
Another aspect that influences the performance of the catalysts is the method of preparation. An
example of this was the work made by Shakouri (2011). He prepared bimetallic Ni-Co/AlMgOx,
as well as monometallic Ni/AlMgOx and Co/AlMgOx catalysts by coprecipitation and
impregnation methods with different Ni/Co ratios. His findings were that Ni/Co obtained ratios
in the impregnated catalyst were closer to the intended ratio, contrary to the catalysts prepared by
coprecipitation. Also, with equal Ni/Co ratios, the impregnated catalysts were reduced more than
the ones made by coprecipitation. In terms of activity, the nickel monometallic catalyst prepared
by impregnation had the higher conversion at 710 oC.
Tang et al., (2000) developed nickel-based catalysts with 3 different methods of preparation and
with the same nickel content (10 wt%): 1) impregnation of γ-Al2O3 support (NiAlCO-IM), 2) sol–
gel-made γ-Al2O3 (NiAlSG-IM) and 3) direct sol–gel method from organometallic compounds

24
(NiAlSG). In his tests, the catalysts had similar activity but a significant difference in coking
resistivity. NiAlSG-IM catalyst had great resistance to coke even after 80 hours at 700 oC.
Followed by NiAlSG, with an average coke rate deposited of 0.003 gcarbon gcat-1
h-1
. On contrast,
quick coke deposition occurred on NiAlCO-IM, with an average rate of 0.095 gcarbon gcat-1
h-1
,
blocking the reactor after 3.5 hours.
The support on which nickel is deposited also plays a significant role on the catalyst
performance. Ruckenstein and Hu (1995) found that reduced NiO/MgO catalyst had higher CH4
conversion and selectivity than NiO/CaO, NiO/SrO and NiO/BaO. Additionally, NiO/MgO had
excellent stability and good resistivity to coking. The author attributed the resistant to coking to
the suppression of CO disproportionation caused by a solid solution between NiO and MgO.
Goula et al. (1996) showed that the CaO/Al2O3 ratios in Ni/CaO-Al2O3 catalysts influenced the
amount of carbon species formed during dry reforming of methane. The catalyst with
CaO/Al2O3=1/2 was more resistant to the formation of coke and slightly more active than that
with CaO/Al2O3=12/7.
2.3.5.2 Cobalt-based catalysts
Ruckenstein and Wang (2000) prepared cobalt catalysts supported on MgO, CaO, SrO and BaO
and they found that MgO was the best support. Co/MgO had higher and more stable activity for
dry reforming of methane. Additionally, it resisted carbon formation and sintering and they
attributed this to a solid solution formed between MgO and CoO.

25
Takanabe et al. (2005) prepared titania-supported catalysts composed of nickel and cobalt, both
bimetallic and monometallic. Catalysts containing only cobalt showed a high resistance to
carbon deposition but they deactivated due to copper oxidation. The addition of 10 mol% of
nickel resulted in the resistance of cobalt to oxidation and high stability, whereas an excess of
nickel, higher than 80 mol%, provoked carbon formation. It was reported that cobalt has a
stronger affinity for species containing oxygen whereas nickel has higher attraction for carbon
species.
While Takanabe et al. (2005) found that catalysts containing only cobalt had a high resistance to
carbon formation, San-Jose-Alonso et al. (2009) determined that among Ni-Co catalysts with
different ratios, the catalysts with the highest amount of cobalt had the greatest amount of carbon
deposited after 6 hours of reaction.
2.3.6 Catalyst deactivation
One of the main problems that nickel catalysts face is the formation of carbonaceous deposits
that eventually decreases catalyst activity (Priya et al., 2012). Haldor Topsoe reported that in
order for a catalyst to operate without carbon formation, it must have less acidic sites since they
are known to cause cracking reactions. Therefore, they used magnesium aluminate in the
composition of their catalysts because it is less acidic than pure alumina.
Other factors responsible for catalyst deactivation are sintering, which is defined as the decrease
in catalytic area caused by the growth of smaller particles (Sehested, 2004) and, sulfur poisoning
(Ashrafi et al., 2008; Erdohelyi et al., 2004).

26
While some authors consider the presence of sulfur compounds as a problem, other authors have
considered their presence as beneficial. For example, it was demonstrated by Priya et al. (2012)
that the addition of ethyl disulfide decreased the rate of formation of carbon more than the
reforming rate. Also, Jones et al. (2003) showed that sulfur-containing compounds at certain
levels produce alterations in the metal or the support that could be favorable for certain reactions
such as the catalyzed combustion of certain alkanes. Rostrup-Nielsen (1984) found the when the
catalysts where partially passivated by sulfur it was possible to carry out steam reaction free of
carbon deposition.
This mechanism of sulfur passivation is used in the SPARG process (Udengaard et al., 1992).
Rostrup-Nielsen (1991) compared this beneficial effect to the principle of homeopathy in which
an evil can be treated by a poison in small doses. It was assumed that sulfur is chemisorbed on
sites that are active for carbon formation and at the same time leaving the reaction sites
unchanged.
However, at higher concentration, sulfur-containing compounds have demonstrated to lower the
catalytic activity for dry reforming of methane. Natural gas contains small amounts of sulfur-
containing compounds (about 5.5 mg/m3), including the mercaptan added (4.9 mg/m
3) to warn
about leakages (Uniongas.com). Table 2-4 shows the composition of natural gas as reported by
Union Gas. However, this composition can vary depending on the location where the gas is
obtained from.

27
Table 2-4. Chemical composition of natural gas (uniongas.com/about-us/about-natural-
gas/chemical-composition-of-natural-gas).
There are two different ways to overcome the issue of sulfur poisoning. The first solution is to
develop catalysts with high tolerance to sulfur poisoning. The second one is the separation of
sulfur from the gas stream before the reaction but this would represent a high cost of operating
costs and therefore the first option is preferred (Rangan et al., 2011).
Sulfur poisoning is caused when metal sulfides, either reversibly or irreversibly, are formed on a
metal surface (Sato and Fujimoto, 2007). Also, in the surface of a metal oxide they can form
sulfates (Rodriguez et al., 1999). Sulfur chemisorption on the metal surface reduces methane
conversion (Bartholomew, 2001).
2.3.6.1 H2S poisoning
H2S can be removed by many methods to lower its concentration to about 10 ppm. Harsh sulfur
poisoning on catalysts can occur even at this low concentration (Agrawal, 1979). H2S causes
poisoning and deactivation of nickel-based catalysts even at extremely low ppb levels. H2S
Component Typical analysis (mole %) Range (mole %)
Methane 95.00 87-97
Ethane 3.20 1.5-7.0
Propane 0.20 0.1-1.5
iso-Butane 0.03 0.01-0.3
normal-Butane 0.03 0.01-0.3
iso-Pentane 0.01 trace-0.04
normal-Pentane 0.01 trace-0.04
Hexane 0.01 trace-0.06
Nitrogen 1.00 0.2-5.5
Carbon dioxide 0.50 0.1-1.0
Oxygen 0.02 0.01-0.1
Hydrogen trace trace-0.02

28
decomposes to sulfur on the Ni catalyst surface throughout the steps shown in Table 2-5:
(Rangan et al., 2011).
Table 2-5. Mechanism steps for H2S chemisorption and dissociation (Rangan et al., 2011).
Some examples of the effects of H2S poisoning on catalyst activity for dry reforming of methane
and related reactions are shown in the following paragraphs.
Ashrafi et al. (2008) experimented with steam reforming of methane using Ni-based catalysts.
The catalysts were poisoned by H2S concentrations ranging from 15 to 145 ppm at 700 oC. They
found out that the CH4 conversion decreased from 90 to 10% in 3 hours at 145 ppm and from 90
to 30% in 10 hours at 15 ppm. They observed that the temperature has a strong effect on the
catalyst to resist sulfur poisoning. For example, in the presence of H2S, the activity had a slight
decrease at 900 oC. In contrast, at 800 and 700
oC, there was a marked decrease in activity. The
same pattern was shown at 31 and 108 ppm. However, at 108 ppm, the activity loss was much
faster than at 31 ppm.
Finally, Ashrafi et al. (2008) tested the catalytic activity before H2S, during hydrogen sulfide and
after its removal. They observed that the catalysts partially recovered their initial activity just by
removing hydrogen sulfide. The activity was not decreased significantly when the reaction was
carried out at 900 oC compared to at 700
oC.
Step Equation
H2S adsorption H2S(gas)→H2S(ads)
1st dissociation H2S(ads)→SH(ads)+H(ads)
2nd
dissociation SH(ads)→S(ads)+H(ads)

29
Shakouri (2011) examined the effect of H2S on the activity of monometallic catalysts of nickel
and cobalt as well as bimetallic catalysts composed of the two metals. He found out that in
contrast to Ni-Co/AlMgOx, Ni/AlMgOx had more H2S tolerance in all experiments, either
prepared by impregnation or coprecipitation methods. Moreover, catalysts made by impregnation
were more active and had higher regeneration after H2S poisoning than the coprecipitated
catalysts.
2.3.6.2 SO2 poisoning
In the autothermal reforming of diesel using Pt/Ceria catalyst, it was found that the addition of
SO2 increased the concentration of methane and carbon dioxide but decreased the hydrogen yield
(Cheekatamarla and Lane, 2005).
On cesium and Cs/ZnO catalysts, it was determined that sulfur dioxide produced SO3 and SO4
upon reaction with atomic oxygen. Also, the presence of sulfur dissociated on the metal was very
low (Rodriguez et al., 1999).
In the study of SO2 poisoning over Pt/Ba/Al2O3 catalysts for NOx storage. Sulfur dioxide caused
a decrease in NOx capacity, suggesting that it forms SOx species that compete for adsorption
against NO2. The presence of sulfur dioxide also inhibited carbon formation (Anderson et al.,
2006). Poulston and Rajaram (2003) showed that when Pt/Ba-based catalysts are sulfated they
were almost totally deactivated and were not able to be completely regenerated using H2. On the
contrary, using a mixture containing CO2 made the catalysts recover its storage activity.

30
The catalysts can be deactivated not only by the formation of metal sulfides but also by the
occurrence of sulfating on the support. This formation of sulfates can change the crystal
arrangement, thus impacting the metal-support synergy. The capacity of every catalyst to reverse
this mechanism depends on its composition (Jones et al., 2003). Hubbard et al. (1993) reported
that sulfation increases the acid strength of gamma alumina. However, large deposits of sulfates
in catalysts can block access of reactants to the catalytic active sites.
Datta and Cavell (1985) studied the sequential adsorption of sulfur dioxide and hydrogen sulfide
on alumina catalysts. Using FTIR, they found no infrared bands ascribed to bending of stretching
modes of hydrogen sulfide but they did not interpret this as a lack of adsorption of H2S on the
alumina catalysts. They concluded that H2S adsorbs to the catalyst and dissociates immediately.
However, the occurrence of dissociation and formation of Al-S bonds cannot be detected by
infrared spectroscopy. Also, they identified peaks at about 1324 cm-1
which were attributed to
sulfur dioxide physically adsorbed on alumina. This band decreased in intensity after H2S was
also introduced. They found other peaks after SO2 was fed, which they attributed to different SO2
interactions on alumina as shown in Figure 2-7.
Figure 2-7. Possible SO2 interactions with alumina. (Datta and Cavell, 1985).

31
2.3.7 Regeneration of catalysts after sulfur poisoning
Since H2S adsorbs on the catalyst surface by the reaction: H2S+Nisurface Nisurface-S+H2, the
regeneration of the catalyst can be achieved with hydrogen (the reverse of previous reaction) and
also by oxidation. (Ashrafi et al., 2008). The regeneration is favored at temperatures ranging
from 800 to 900 oC for steam reforming of methane.
Sulfur can be removed from the catalyst surface by exposing it to oxygen or to species that
dissociate to oxygen, forming SO2 (Bartholomew, 2001).
After nickel-based catalysts used in the steam reforming of methane had been sulfur poisoned,
they were regenerated by a mixture of CO2, H2O and O2 and using nitrogen as a carrier gas. The
process was carried out for 2 hours at 700 oC due to the risk of sintering at higher temperatures
(Hashemnejad & Parvari, 2011). It was shown that the sulfur and carbon removed is greater at
higher H2O/H2 ratios.
Ashrafi et al. (2008) tried to regenerate nickel-based catalysts with an air/N2 mixture after they
were poisoned by H2S at 700 oC. It was found that activity was not increased, so they concluded
that sulfur chemisorption was irreversible by air treatment.
Figoli and Argentiere (1996) studied the regeneration of Ni/Silica catalysts after submitted to
poisoning by carbon disulfide. The regenerating compounds used were hydrogen and a mixture
of 2-butyne with hydrogen. They found out that some sulfur was removed from the surface of the
catalyst and the rest of sulfur was irreversibly adsorbed on the catalyst.

32
2.4 KNOWLEDGE GAPS, HYPOTHESES AND RESEARCH OBJECTIVES
2.4.1 Knowledge gaps
- The effect of H2S and SO2 on the mechanism of dry reforming of methane on Ni-Co/AlMgOx,
Ni/AlMgOx and Co/AlMgOx catalysts prepared by our research group has been neither studied
by Dr. Wang’s research group nor reported in the literature (to the best of my knowledge).
2.4.2 Research objectives
The objective of this research is to determine the following:
-The mechanism of the DRM reaction on Ni-Co/AlMgOx, Co/AlMgOx and Ni-Co/AlMgOx.
-The chemical species formed on the catalysts in the presence of H2S or SO2 as well as the
poisoning mechanism.
-The influence of the preparation methods, Ni and Co on the poisoning mechanisms.
2.4.3 Hypotheses
The following hypothesis were tried to be proved or disproved by this research.
-The presence of SO2 forms sulfates.
-The presence of H2S forms metal sulfides.
-Bimetallic catalysts are more resistant to poisoning by H2S and SO2 due to the synergy between
Ni and Co (formation of alloys that prevent sulfur chemisorption).
-There should be differences in the chemical species and its concentration formed between
catalysts prepared by impregnation and impregnation due to the reduction extent.
-Species attributed to the dissociation of methane must not be found on MgAlOx support.

33
CHAPTER 3. EXPERIMENTAL SET-UP AND PROCEDURE
This chapter will introduce the material, instrumentation and procedure employed to conduct the
research. Subsection 3.1 briefly introduces the safety guidelines, one of the most important
aspects in this research. Subsections 3.2 and 3.3 in this chapter will describe the methods
employed to prepare the catalysts and some properties of the catalysts such as surface area, pore
size, pore volume and metal composition, as reported in Wang et al. (2013). Finally, subchapter
3.4 presents the procedure used for the experiments.
3.1 SAFETY PRECAUTIONS
For this research, it was necessary to employ hazardous and poisonous gases. Therefore, safety
guidelines according to the individual Material Safety Data Sheets (MSDS) and in adherence to
the policies of the Department of Chemical Engineering of the University of Saskatchewan were
followed. All the gases leaving the reaction were vented and a GasAlertMicro 5 detector was
used to determine if the concentration of the gases used was above allowed safety limits.
3.2 CATALYST PREPARATION METHODS
The catalysts were prepared by and received from Mohsen Shakouri, member of Dr. Hui Wang’s
research group at University of Saskatchewan. The catalysts were prepared by coprecipitation

34
and impregnation methods as described in Shakouri (2011) and Wang et al (2013). Subsequent
paragraphs show a brief explanation about the steps of each preparation method.
3.2.1 Coprecipitation method
In this method, an aqueous solution containing metal salts is mixed with another substance to
cause precipitation. Then, the precipitated material is washed, dried and calcined. A brief
description of the steps involved in the coprecipitation method is presented in the following
paragraphs.
Preparation of the solution: Nitrates of metals (nickel, cobalt, aluminum and magnesium) are
dissolved in deionized water in quantities that depend on the composition of the catalyst wanted.
Coprecipitation: This occurs when ammonium hydroxide (NH4OH) is added to the previous
solution, changing the pH and provoking the metals to precipitate.
Filtering and washing: The purpose of this step is to remove unwanted ions. The solution with
the solid coprecipitation is filtered and washed with water at room temperature until the pH of
the water is 7. After this step, a cake-like solid is produced.
Drying: The solid obtained in the previous step is heated in oven at 120 oC for at least 16 hours
to remove water content.
Calcination: In this step, the dried catalyst is heated in tube furnace exposed to air at 850 oC
for 6 hours.

35
Selection of particle size: Lastly, the catalyst is ground and sieved to particle sizes between 250
and 355 micrometers using U.S.A standard testing sieves No. 45 and 60 (A.S.T.M. E-11
specification).
3.2.2 Impregnation method
This method involves dipping the support into a solution of metal salts or spraying a metal
solution on the support, following by drying and calcination as explained in the previous section.
After this process, the metal remains in the pores of the support as well as on the surface of the
support.
The advantages and disadvantages of each method are displayed in Table 3-1 (Shakouri, 2011).
Table 3-1. Comparison of methods for catalyst preparation (Zhang et al., 2012).
The catalysts were prepared and separated into two groups: catalysts prepared by coprecipitation
and by impregnation methods. Every group was composed of three different catalysts (two
monometallic catalysts made of nickel or cobalt and one bimetallic catalyst consisting of nickel
and cobalt). The purpose of preparing these six different catalysts was to determine the influence
Feature Impregnation Precipitation
High metal loading Difficult to achieve Easy to achieve
High metal dispersion Easy to achieve Easy to achieve
Relative cost Lower Higher
Difficult to achieve Easy to achieveMixing of catalytic components at
molecular level
Distribution of multi-active components
Surface area higher than 200 m2/g
Less uniform Uniform
Easy to achieve Difficult to achieve

36
of the preparation method and the metal composition on the mechanism of dry reforming of
methane and sulfur poisoning by H2S and SO2. Aluminum and magnesium oxide (AlMgOx)
made by precipitation is the support for impregnated catalysts. Therefore, the support was also
studied in this thesis.
Properties or characterization results of the catalysts prepared and used in this study have been
reported in a previous paper with specific names (Wang et al., 2013; Shakouri, 2011). Therefore,
they will be reviewed in further sections by the names shown in Table 3-2.
Table 3-2. Catalysts tested in this research work.
3.3 CATALYST CHARACTERIZATION
The BET properties of the catalysts such as surface area, porous volume and average pore size
are listed in Table 3-3.
Label Formula
CopCat-Ni4 Ni/AlMgOx
CopCat-Ni2Co4 Ni-Co/AlMgOx
CopCat-Co6 Co/AlMgOx
ImpCat-Ni5 Ni/AlMgOx
ImpCat-Ni2Co3 Ni-Co/AlMgOx
ImpCat-Co5 Co/AlMgOx.
MgAlOx support AlMgOx
Impregnated monometallic cobalt catalyst
AlMgOx without nickel or cobalt
Description
Coprecipitated nickel monometallic catalyst
Coprecipitated bimetallic (Ni-Co) catalyst
Coprecipitated cobalt monometallic catalyst
Impregnated nickel monometallic catalyst
Impregnated bimetallic (Ni-Co) catalyst

37
Table 3-3. BET properties of the catalysts tested in this research work.
The metal composition of the catalysts is reported in Table 3-4. The data was extracted from
Wang et al. (2013) and Shakouri, (2011).
Table 3-4. Metal compositions of the catalyst precursors measured by ICP.
3.4 PROCEDURE OF DRIFTS EXPERIMENTS
PRAXAIR provided the gases employed in the experiments. CH4, CO2 and N2 cylinders were
provided in purity higher than 99.9%. Nitrogen and helium diluted the rest of the gases: 5% H2 in
N2; 522 ppm H2S (balance helium) and; 1000 ppm SO2 (balance nitrogen). Rotameters controlled
the flow of the gases. A PIKE Technologies temperature controller was used to increase the
temperature of the adsorbed and reacting gases up to 600 oC, which is the temperature at which
BET area Porous volume Average pore size
m2/g mL/g A
CopCat-Ni4 113 0.227 81
CopCat-Ni2Co4 111 0.287 104
CopCat-Co6 106 0.277 105
ImpCat-Ni5 114 0.34 119
ImpCat-Ni2Co3 124 0.359 116
ImpCat-Co5 102 0.296 116
MgAlOx support 85 0.226 106
Catalyst
Catalyst Ni% Co% Mg% Al% Ni/Co Mg/Al
CopCat-Ni4 4 0 69 27 - 2.6
CopCat-Ni2Co4 2 4 68 26 0.6 2.6
CopCat-Co6 0 6 69 26 - 2.7
ImpCat-Ni5 5 0 65 30 - 2.2
ImpCat-Ni2Co3 2 3 68 27 0.5 2.5
ImpCat-Co5 0 5 65 30 - 2.1
MgAlOx support - - 69 31 - 2.2

38
the DRIFTS experiments were carried out. The schematic of the experimental setup and the
DRIFTS cell are shown in Figures 3-1 and 3-2, respectively.
All the spectra were collected using a Perkin Elmer Spectrum 100 spectrometer with a DiffuseIR
Accessory with KBr windows from PIKE Technologies (Figures 3-3 and 3-4). The boiling point
of the KBr windows is 630 oC. For this reason, experiments were not conducted at temperature
higher than 600 oC. The spectra were obtained in situ or when the reaction was taking place.
Firstly, 15 mg of catalyst was inserted into the sample holder of the Diffuse IR cell. The
temperature was set at 600 oC for all the experiments. All the catalysts were reduced first by a
mixture of 5% of H2 in N2 for 2.5 hours. After reduction, a background spectrum was collected.
This background spectrum was subtracted from each of the further spectra obtained. By doing so,
it was possible to eliminate the influence of the environmental noise, spectrometer noise and
bands present on the catalysts. Therefore, only the chemical species adsorbed on the catalytic
surface as a result of the dry reforming of methane reaction and sulfur poisoning were displayed
on the spectra.
The spectra were manipulated with the Spectrum software. The spectra were collected with a
resolution of 8 cm-1
. 30 scans were averaged for every spectrum in order to have a higher signal
to noise ratio. Most of the spectra are presented in absorbance units. However, some peaks could
not be clearly detected in absorbance units and therefore Kubelka-Munk units were used. An
explanation about these two different units is presented in Appendix A.

39
FI FI FI FI FI FI
H2 N2 CH4 CO2 H2S SO2
FTIR spectrometer
Software fordata manipulation
Gas outlet to exhaust vent
Gas inlet tospectrometer
Figure 3-1. Pictorial representation of DRIFTS experimental setup
Figure 3-2. Top view of the DRIFTS accessory showing the trajectory of the infrared light

40
CHAPTER 4. RESULTS AND DISCUSSION
As explained in the previous chapter, the focus of this research is to determine the mechanism of
the CO2 reforming of methane reaction on nickel and cobalt based catalysts, under and without
H2S or SO2 poisoning conditions.
Firstly, to understand the interactions of CH4 and CO2 with the catalysts, the independent
adsorptions of methane and CO2 were assessed. Secondly, the simultaneous interactions of CH4
and CO2 were studied to observe differences between independent adsorptions and concomitant
adsorptions and to elucidate the reaction mechanism for dry reforming of methane. Finally, the
effect of either H2S or SO2 before and during dry reforming of methane was investigated to
understand the poisoning mechanism.
4.1 MECHANISM OF CH4 ADSORPTION AND DISSOCIATION
To understand how methane interacts with the catalysts, the following steps were carried out.
Firstly, the catalysts were reduced as explained earlier and then methane was introduced. After
15 minutes, a spectrum was collected. When methane interacted with any of the catalysts used
(including the support), the spectra showed bands corresponding to the fundamental vibrations of

41
methane at the following wavenumbers: 3012, 1540 and 1302 cm-1
. Bands at near wavenumbers
are attributed to asymmetrical stretching, in-plane bending or scissoring and out-of-plane
bending, respectively (Silverstein et al., 2005). The band at about 1540 cm-1
is inactive in the
free molecule but become active when the interaction of methane with the adsorption sites causes
lowering of the symmetry of methane from Td to C3v (Huber and Knozinger, 1995). Therefore,
the presence of this band must indicate methane adsorption.
Additionally to the previous fundamental vibrations, overtones were also displayed. An overtone
is a band present at multiples of the wavenumbers of the fundamental vibrations. This overtone,
which is about two times the fundamental vibration at 1302 cm-1
(2v3), occurred at 2599 cm-1
. A
band found at 3865 cm-1
on coprecipitated catalysts and at 3862 cm-1
on impregnated catalysts
could be resulted from the 3v4 overtone of a CH2 functional group (Rest et al., 1996) or could be
caused by OH- functional groups formed by hydrogen produced from methane dissociation
bonding to oxygen atoms present on the catalysts (Schwach et al., 2015). This band was found in
all catalysts as shown in Figures 4-1 (a) and 4-2 (a) except on the MgAlOx support and CopCat-
Co6, this might be due to the lack of metallic sites on MgAlOx support and on CopCat-Co6
(Wang et al., 2013) in which methane can dissociate.
Also, combination bands (peaks at wavenumbers equal or approximately equal to the sum of two
or more different fundamental vibrations) appeared at 2824 cm-1
(combination band v2+v4)
(Figures 4-1 and 4-2).

42
Figure 4-1. Comparison of bands produced by CH4 on coprecipitated catalysts and support. a)
Overtone 3v4, b) v3 symmetric vibration, c) combination band v2+v4 and overtone 2v4, d) v2
bending vibration; e) v4 bending vibration.
3960 3920 3880 3840 3800 3760
Ab
sorb
an
ce (
AU
)
Wavenumber (cm-1)
MgAlOx support
CopCat-Co6
CopCat-Ni2Co4
CopCat-Ni4
v(OH)
3865 cm-1
a)
3400 3200 3000 2800 2600
Ab
sorb
an
ce (
AU
)
Wavenumber (cm-1)
vs(CH
2)
3012 cm-1 MgAlOx support
CopCat-Ni4
CopCat-Ni2Co4
CopCat-Co6
b)
2850 2800 2750 2700 2650 2600 2550
Ab
sorb
an
ce (
AU
)
Wavenumber (cm-1)
MgAlOx support
CopCat-Co6
CopCat-Ni2Co4
CopCat-Ni4
2v4b
(CH2)
2599 cm-1
2823 cm-1
v2b+v
4b(CH2)
c)
1600 1500 1400 1300 1200 1100 1000
Ab
sorb
an
ce (
AU
)
Wavenumber (cm-1)
MgAlOx support
CopCat-Ni4
CopCat-Ni2Co4
CopCat-Co6
v4b
(CH2)
1302 cm-1
e)
1700 1650 1600 1550 1500 1450
Ab
sorb
an
ce (
AU
)
Wavenumber (cm-1)
MgAlOx support
CopCat-Co6
CopCat-Ni2Co4
CopCat-Ni4
v2b(CH2)
1540 cm-1
d)

43
Figure 4-2. Comparison of bands produced by CH4 on impregnated catalysts and support. a)
Overtone 3v4, b) v3 symmetric vibration, c) combination band v2+v4 and overtone 2v4, d) v2
bending vibration; e) v4 bending vibration.
3960 3920 3880 3840 3800 3760
Abso
rba
nce
(A
U)
Wavenumber (cm-1)
MgAlOx support
ImpCat-Ni2Co3
ImpCat-Ni5
ImpCat-Co5
v(OH)
3862 cm-1
a)
3400 3200 3000 2800 2600
Abso
rba
nce
(A
U)
Wavenumber (cm-1)
vs(CH2)
3012 cm-1
MgAlOx support
ImpCat-Ni5
Impcat-Ni2Co3
ImpCat-Co5
b)
2850 2800 2750 2700 2650 2600 2550
Abso
rba
nce
(A
U)
Wavenumber (cm-1)
MgAlOx support
ImpCat-Ni2Co3
ImpCat-Ni5
ImpCat-Co5
2823 cm-1
2599 cm-1
v2b+v
4b(CH
2)
2v4b(CH
2)
c)
1600 1500 1400 1300 1200 1100 1000
Abso
rba
nce
(A
U)
Wavenumber (cm-1)
v4b
(CH2)
1300 cm-1
MgAlOx support
ImpCat-Ni5
ImpCat-Ni2Co3
ImpCat-Co5
e)
1700 1650 1600 1550 1500 1450
Abso
rba
nce
(A
U)
Wavenumber (cm-1)
MgAlOx support
ImpCat-Ni2Co3
ImpCat-Ni5
ImpCat-Co5
v2b
(CH2)
1540 cm-1
d)

44
Spectra on Figures 4-1 and 4-2 show the methane bands after 15 minutes of interaction with the
catalysts. The intensities of the bands are lower on the support than those on the rest of the
catalysts. This difference in intensities suggests that methane could adsorb preferentially on the
metal active sites. Morlanes (2013) reported that hydrocarbons are preferentially adsorbed on
metal surfaces.
The dissociation of methane has been reported to occur on nickel catalysts, producing hydrogen
and carbon adsorbed on the catalyst surface (Hickman and Schmidt, 2015; Schuurman et al.,
1998) according to the Equation 4-1:
CH4+Ni↔NiC+2H2 (4-1)
In this work, the presence of hydrogen could not be detected by infrared spectroscopy since this
molecule is infrared inactive. C and CHx species could not be detected either. The only possible
observations that could indicate that dissociation of methane took place were the bands in the
OH- region previously mentioned. Bradford and Vannice (2007) reported that CHx species can be
detected by transient CH4/D2 or by deuteration of adsorbed methane.
4.2 MECHANISM OF CO2 ADSORPTION AND DISSOCIATION
The molecule of carbon dioxide has 3 fundamental vibrations: symmetric stretching (v1), bending
(v2) and antisymmetric (v3) (Aoki et al., 1993). These vibrations occur at the wavenumbers 1388,
667 and 2349 cm-1
, respectively (Silverstein et al., 2005). However, only modes v2 (667 cm-1
)
and v3 (2349 cm-1
) can be detected by infrared spectroscopy since mode v1 (1388 cm-1
) is
infrared inactive (it can be detected by Raman spectroscopy, though).

45
To elucidate how carbon dioxide interacts with the catalysts, the following steps were performed.
Firstly, the catalysts were reduced as described before and then CO2 entered into the reactor cell.
After 15 minutes, a spectrum was collected. In the experiments performed, the mode v2 located at
667 cm-1
was not always observed due to the numerous absorptions present at wavenumbers
lower than 1000 cm-1
, assigned to metal oxides such as NiO (Rahemi et al., 2013). The band
located at 2349 cm-1
, although it could be seen, appeared as variable peaks in the wavenumber
range around 2280-2380 cm-1
(Figure 4-3). For these reasons, the bands at 667 cm-1
and 2349
cm-1
were not analyzed in the present work.
2500 2450 2400 2350 2300 2250 2200
Absorb
ance (
AU
)
Wavenumber (cm-1)
CopCat-Co6
CopCat-Ni2Co4
CopCat-Ni4
ImpCat-Co5
ImpCat-Ni2Co3
ImpCat-Ni5
MgAlOx support
Figure 4-3. Antisymmetric mode of CO2 (detected as variable peaks in the wavelength
range around 2280-2380 cm-1
).
Carbon dioxide adsorbed on the catalysts could be clearly distinguished by the presence of 4
combination bands that appeared as four peaks at about 3730 and 3704 cm-1
(v3 + v1 bending

46
modes of CO2); 3622 and 3598 cm-1
(v3+2v2 modes of CO2) (Hu et al., 2013). On the support, the
bands at about 3622 and 3598 cm-1 occurred at lower wavenumbers than on the rest of the
catalysts containing nickel or cobalt (marked by the vertical black lines on Figures 4-4 and 4-5).
Bond lengthening is related to lower wavenumber, or red shift, of bands in infrared spectrometry
(Joseph and Jemmis, 2007). Bond lengthening could occur when the difference in
electronegativity between two atoms in a bond is higher. Using the Pauling scale to calculate
these differences yield: Mg-O=2.3 (3.5-1.2); Al-O=2 (3.5-1.5), Ni-O=1.7 (3.5-1.8) and, Co-
O=1.7 (3.5-1.8). It is visible that the difference in electronegativity between the two atoms is
higher for Mg-O and Al-O than for Ni-O and Co-O. This higher difference could result in bond
lengthening and explain the red shift for the support compared to the catalysts that contain
nickel, cobalt or both.
3800 3750 3700 3650 3600 3550 3500
3622 and 3598 cm-1
Absorb
ance (
AU
)
Wavenumber (cm-1)
MgAlOx support
CopCat-Ni4
CopCat-Ni2Co4
CopCat-Co6
vs+v
as(CO2)
3730 and 3704 cm-1
2vb+v
as(CO2)
Figure 4-4. Bands produced by adsorbed CO2 on coprecipitated catalysts and support.

47
3800 3750 3700 3650 3600 3550 3500
Absorb
ance (
AU
)
Wavenumber (cm-1)
MgAlOx support
ImpCat-Ni5
ImpCat-Ni2Co3
ImpCat-Co5
vs+v
as(CO2)
3730 and 3704 cm-1 2v
b+v
as(CO2)
3622 and 3598 cm-1
Figure 4-5. Bands produced by adsorbed CO2 on impregnated catalysts and support.
Besides the fundamental vibrations and combination bands of carbon dioxide, other bands were
shown during the interaction of CO2 with the catalysts. One of these signals was a broad band at
about 1640 cm-1
(Figure 4-6), which is attributed to the formation of carbonates produced by
CO2 reacting with oxygen in the surface of the catalysts (Pan et al., 2014; Nakamura et al., 1994
and; Morlanés, 2013). All catalysts tested in this work showed the capacity to form carbonates.
Some literature papers report that the catalysts with this attribute perform better for DRM than
the catalyst without this characteristic. For example, Bitter et al. (1997) reported that catalysts
such as Pt/Al2O3, Pt/TiO2 and Pt/ZrO2 showed the capacity to have carbonates formed on the
support and had much higher activity than catalysts unable to form carbonates on the support,
such as Pt/SiO2.

48
Nakamura et al. (1994) reported that the catalytic activity for dry reforming of methane is in the
order Rh/Al203 >Rh/TiO2 >Rh/SiO2. Rh/Al2O3 was shown to be 18 times more active than
Rh/SiO2. They reported than CO2 activates on Al2O3, TiO2 and MgO as carbonates in the
presence of hydrogen. Carbonates did not appear on SiO2. Therefore, it was suggested that the
formation of carbonates was responsible for the higher activity for dry reforming of methane.
Morlanés (2013) reported that the formation of carbonates is associated with a better oxygen
release capacity for the support and the catalysts that showed carbonates formation had a higher
activity for naphtha steam reforming.
Figure 4-6. Broad band attributed to carbonates for a) coprecipitated and b) impregnated
catalysts after the interaction with CO2.
It can be noted from Figure 4-6 that the carbonate bands are located at different wavenumbers
among different catalysts and preparation methods. For example, the band for the cobalt
monometallic catalyst prepared by coprecipitation is found at 1643 cm-1
and shifted to lower
wavenumbers when the cobalt monometallic catalyst was prepared by impregnation. On the
1800 1700 1600 1500 1400 1300
Abso
rba
nce
(A
U)
Wavenumber (cm-1)
CopCat-Co6
CopCat-Ni2Co41643 cm
-1
CopCat-Ni4
MgAlOx support
1642 cm-1 a)
1596 cm-1
1590 cm-1
1800 1700 1600 1500 1400 1300
Abso
rba
nce
(A
U)
Wavenumber (cm-1)
ImpCat-Co5
ImpCat-Ni2Co3
ImpCat-Ni5
MgAlOx support
b)1642 cm-1
1648 cm-1
1592 cm-1
1598 cm-1

49
contrary, the bimetallic catalyst prepared by impregnation has a carbonate absorbance band at
higher wavenumber than the bimetallic catalyst prepared by coprecipitation. The explanations for
this observation is not clear.
The bands attributed to carbonates in Figure 4-6 for the cobalt catalysts, CopCat-Co6 and
ImpCat-Co5, have higher intensities compared to the rest of the catalysts containing nickel. This
higher intensity could be caused by the low reducibility on cobalt catalysts and higher oxygen
content compared to nickel catalysts. It can also be seen that the band is higher for CopCat-Ni4
than for ImpCat-Ni5 which could be explained by the lower reducibility of coprecipitated
catalysts compared to impregnated catalysts and, therefore, higher oxygen content to which CO2
molecules can attach to form carbonates. The MgAlOx support sample was not treated by
reduction because it lacks of nickel and cobalt. Therefore, this sample should have the highest
oxygen content, and this might explain the maximum intensity for this sample compared to the
rest of the catalysts.
It might be important that the reduction extent is not very high or low. If the reduction extent is
very high, the catalyst would have too much Ni0 and Co
0 and low amount of NiO, CoO and other
oxides. This situation would allow activation of methane on Ni0 and at the same time would
permit low formation of carbonates. On the contrary, if the reduction extent is very low, the
catalysts would result in low Ni0 and Co
0 and high content of NiO, CoO and other oxides. In this
situation, carbonates would be easily formed but activation in Ni0 (such as methane activation)
would hardly occur. Therefore, the reduction should produce an optimal concentration of Ni0,
Co0, NiO, CoO and other oxides.

50
Carbonates could be seen not only in the presence of CO2 but also when carbon monoxide
interacted with the catalysts (Figure 4-7). Therefore, it is possible that two mechanisms explain
the formation of carbonates: 1) Dissociation of CO2 into CO and atomic oxygen and further
attachment of CO to two oxygen atoms on the support; 2) Attachment of CO2 to an oxygen atom
on the support. This is in agreement with Morlanés (2013).
Figure 4-7. Carbonates formed after CO interacted with catalysts at 600 oC.
CopCat-Ni2Co4 CopCat-Ni4
ImpCat-Co5 ImpCat-Ni2Co3
1680 1640 1600 1560
1618 cm-1
Ku
be
lka
-Mu
nk
(AU
)
Wavenumber (cm-1)
CO flow
No flow
1680 1640 1600 1560
1624 cm-1
Ku
be
lka
-Mu
nk
(AU
)
Wavenumber (cm-1)
No flow
CO flow
1680 1640 1600 1560
1618 cm-1
Ku
be
lka
-Mu
nk
(AU
)
Wavenumber (cm-1)
CO flow
No flow
1680 1640 1600 1560
1620 cm-1
Ku
be
lka
-Mu
nk
(AU
)
Wavenumber (cm-1)
CO flow
No flow

51
The absorbance bands attributed to carbonates seen after the interaction of carbon monoxide
(Figure 4-7) is not shifted as obviously among different catalysts compared to the bands seen
after the interaction of carbon dioxide with the catalysts on Figure 4-6.
Another band at 2077 cm-1
was found when CO2 interacted with any of the catalysts and the
support. This peak was very minuscule compared to the rest of the peaks and it was visible on all
catalysts only after zooming in that area (Figure 4-8). This band is attributed to linear carbonyl
on different nickel active sites (Morlanés, 2013) produced by dissociation of CO2 into CO and
O2-
according to Equation 4-2.
CO2⇌CO+O (4-2)
Figure 4-8. Band at 2077 cm-1
attributed to linear carbonyl for a) coprecipitated and b)
impregnated catalysts in the presence of CO2.
In this work, the band at 2077 cm-1
appeared on catalysts containing nickel and cobalt and also
on the support. This band is higher on cobalt catalysts, especially on CopCat-Co6. It was
2120 2100 2080 2060 2040 2020 2000
Absorb
ance (
AU
)
Wavenumber (cm-1
)
MgAlOx support
CopCat-Ni4
CopCat-Ni2Co4
CopCat-Co6
2077 cm-1
v(CO)
a)
2120 2100 2080 2060 2040 2020 2000
v(CO)2077 cm
-1
Absorb
ance (
AU
)
Wavenumber (cm-1)
MgAlOx support
ImpCat-Ni5
ImpCat-Ni2Co3
ImpCat-Co5
b)

52
reported on Wang et al. (2013) that CopCat-Co6 was not able to be reduced, consisting of 100%
of CoO and 0% Co, this would allow more activation of CO2 and, therefore, more dissociation of
CO2. Morlanés (2013) found bigger bands for adsorbed CO on NiMgAlCe catalyst compared to
NiMg, NiMgAl, NiMgCoAl. This was attributed to small metal particles with higher oxygen
release capacity of NiMgAlCe catalyst.
Summarizing, upon CO2 interaction with any of the catalysts, it was observed adsorbed CO2,
linear carbonyl produced by dissociation of CO2 into CO and atomic oxygen and, carbonates
formation that could be produced by either CO2 or CO attachment to oxygen species present in
the catalysts.
4.3 MECHANISM OF DRY REFORMING OF METHANE
The following steps were applied to understand how CH4 and CO2 interact with the catalysts.
Firstly, the catalysts were reduced as explained earlier and then both CH4 and CO2 were
introduced. After 15 minutes, a spectrum was collected. During the coadsorption of CH4 and
CO2 at 600 oC (or during dry reforming of methane reaction) it was possible to observe the same
bands for all the catalysts studied compared to when the independent interactions of CH4 and
CO2 were studied. CH4 and CO2 were coadsorbed on all catalysts before the interaction of H2S
and also prior the interaction of SO2, as shown in Figures 4-9 and 4-10. These 2 sets of data
allowed to test the reproducibility of the results. It can be seen from Figures 4-9 and 4-10 that all
bands are located at the same wavenumber, except for the carbonates. This allows to ascertain
qualitative repeatability of the results. There are differences in intensities for the same catalysts
in the two different figures that could be explained by the way in which the sample is inserted in

53
the sample holder (such as the pressure applied at the moment of inserting the sample holder).
Difference in intensity among different spectra for quantitative information is more reliable when
the same catalyst is used to obtain the different spectra.
It can be seen that the bands attributed to adsorbed carbonyl appears in all cases at 2077 cm-1
.
This band appeared when carbon dioxide interacted with the catalysts independently as well as
when both CH4 and CO2 were adsorbed at the same time. For carbonates, there are differences in
the position of the bands for the same catalyst in Figures 4-9 and 4-10. These differences could
be attributed to different types of carbonates coalescing into one single band but this is only a
guess. It can also be noted that the adsorbed carbonyl and the carbonates bands are not easily
seen in the spectra in the 4000-1000 cm-1
range. It was possible to see these bands only by
zooming in that region. That is why the three different spectrums are shown in each Figure.
Figure 4-9. Coadsorption of CH4 and CO2 before the introduction of H2S. a) Full range spectra;
b) zoom in for carbonyl bands and ; c) zoom in for carbonates.
4000 3500 3000 2500 2000 1500 1000
Ab
so
rba
nce
(A
U)
Wavenumber (cm-1)
ImpCat-Ni5
ImpCat-Ni2Co3
ImpCat-Co5
CopCat-Ni4
CopCat-Ni2Co4
CopCat-Co6
MgAlOx support
a)vs+v
as(CO2)
3730, 3704 cm-1
vs(CH2)
3012 cm-1
1302 cm-1
v4b
(CH2)
2vb+v
as(CO2)
3622, 3598 cm-1
2100 2085 2070 2055 2040 2025
Ab
so
rba
nce
(A
U)
Wavenumber (cm-1)
ImpCat-Ni5
ImpCat-Ni2Co3
ImpCat-Co5
CopCat-Ni4
CopCat-Ni2Co4
CopCat-Co6
MgAlOx support
v(CO)2077 cm
-1b)
1900 1850 1800 1750 1700 1650 1600 1550
Ab
so
rba
nce
(A
U)
Wavenumber (cm-1)
ImpCat-Ni5
ImpCat-Ni2Co3
ImpCat-Co5
CopCat-Ni4
CopCat-Ni2Co4
CopCat-Co6
MgAlOx support
c)1642 cm-1
1646 cm-1
1626 cm-1
1648 cm-1
1644 cm-1
4000 3500 3000 2500 2000 1500 1000
Ab
so
rba
nce
(A
U)
Wavenumber (cm-1)
ImpCat-Ni5
ImpCat-Ni2Co3
ImpCat-Co5
CopCat-Ni4
CopCat-Ni2Co4
CopCat-Co6
MgAlOx support
a)vs+v
as(CO2)
3730, 3704 cm-1
vs(CH2)
3012 cm-1
1302 cm-1
v4b
(CH2)
2vb+v
as(CO2)
3622, 3598 cm-1

54
Figure 4-9. Coadsorption of CH4 and CO2 before the introduction of H2S. a) Full range spectra;
b) zoom in for carbonyl bands and ; c) zoom in for carbonates (continued).
Figure 4-10. Coadsorption of CH4 and CO2 before the introduction of SO2. a) Full range spectra;
b) zoom in for carbonyl bands and ; c) zoom in for carbonates.
4000 3500 3000 2500 2000 1500 1000
Ab
so
rba
nce
(A
U)
Wavenumber (cm-1)
ImpCat-Ni5
ImpCat-Ni2Co3
ImpCat-Co5
CopCat-Ni4
CopCat-Ni2Co4
CopCat-Co6
MgAlOx support
a)vs+v
as(CO2)
3730, 3704 cm-1
vs(CH2)
3012 cm-1
1302 cm-1
v4b
(CH2)
2vb+v
as(CO2)
3622, 3598 cm-1
2100 2085 2070 2055 2040 2025
Ab
so
rba
nce
(A
U)
Wavenumber (cm-1)
ImpCat-Ni5
ImpCat-Ni2Co3
ImpCat-Co5
CopCat-Ni4
CopCat-Ni2Co4
CopCat-Co6
MgAlOx support
v(CO)2077 cm
-1b)
1900 1850 1800 1750 1700 1650 1600 1550
Ab
so
rba
nce
(A
U)
Wavenumber (cm-1)
ImpCat-Ni5
ImpCat-Ni2Co3
ImpCat-Co5
CopCat-Ni4
CopCat-Ni2Co4
CopCat-Co6
MgAlOx support
c)1642 cm-1
1646 cm-1
1626 cm-1
1648 cm-1
1644 cm-1
4000 3500 3000 2500 2000 1500 1000
Ab
so
rba
nce
(A
U)
Wavenumber (cm-1)
ImpCat-Ni5
ImpCat-Ni2Co3
ImpCat-Co5
CopCat-Ni4
CopCat-Ni2Co4
CopCat-Co6
MgAlOx support
a)vs+v
as(CO2)
3730, 3704 cm-1
vs(CH2)
3012 cm-1
1302 cm-1
v4b
(CH2)
2vb+v
as(CO2)
3622, 3598 cm-1
4000 3500 3000 2500 2000 1500 1000
Ab
so
rba
nce
(A
U)
Wavenumber (cm-1)
ImpCat-Ni5
ImpCat-Ni2Co3
ImpCat-Co5
CopCat-Ni4
CopCat-Ni2Co4
CopCat-Co6
MgAlOx support
a)vs+v
as(CO2)
3730, 3704 cm-1 3012 cm
-1vs(CH2) v
4b(CH2)
1302 cm-1
2vb+v
as(CO2)
3622, 3598 cm-1
2100 2085 2070 2055 2040 2025
Ab
so
rba
nce
(A
U)
Wavenumber (cm-1)
ImpCat-Ni5
ImpCat-Ni2Co3
ImpCat-Co5
CopCat-Ni4
CopCat-Ni2Co4
CopCat-Co6
MgAlOx support
v(CO)
2077 cm-1
b)
1900 1850 1800 1750 1700 1650 1600 1550
Ab
so
rba
nce
(A
U)
Wavenumber (cm-1)
ImpCat-Ni5
ImpCat-Ni2Co3
ImpCat-Co5CopCat-Ni4
CopCat-Ni2Co4
CopCat-Co6
MgAlOx support
c)1594 cm-1
1648 cm-1
1602 cm-1
1636 cm-1
1596 cm-1
1608 cm-1
1604 cm-1

55
Figure 4-10. Coadsorption of CH4 and CO2 before the introduction of SO2. a) Full range spectra;
b) zoom in for carbonyl bands and ; c) zoom in for carbonates (continued).
It can also be seen from Figures 4-9 and 4-10 that the intensity of the carbonyl peaks is related
with the intensity of the carbonate peaks. For example, in Figure 4-9 the carbonyl peaks with the
lowest intensities are ImpCat-Ni2Co3, ImpCat-Co5 and CopCat-Co6. Similarly, the catalysts
with the lowest intensities for the carbonates bands are the same (ImpCat-Ni2Co3, ImpCat-Co5
and CopCat-Co6). From the same prespective, it can be seen in Figure 4-10 that the carbonyl
bands with the lowest intensities are the support and CopCat-Ni4. Similarly, the bands for
carbonate with the lowest intensities are the support and CopCat-Ni4 as well. This suggest that
there is a correlation between the concentration of carbonates and the linear carbonyl.
The bands found during the coadsorption of CH4 and CO2 confirm that the mechanism for dry
reforming of methane involves formation of carbonates and dissociation of carbon dioxide into
adsorbed carbonyl. Carbon monoxide could also be produced by the following mechanisms that
were not directly confirmed by this research. 1) Reaction of carbon with an oxygen atom,
4000 3500 3000 2500 2000 1500 1000
Absorb
ance (
AU
)
Wavenumber (cm-1)
ImpCat-Ni5
ImpCat-Ni2Co3
ImpCat-Co5
CopCat-Ni4
CopCat-Ni2Co4
CopCat-Co6
MgAlOx support
a)vs+v
as(CO2)
3730, 3704 cm-1 3012 cm
-1vs(CH2) v
4b(CH2)
1302 cm-1
2vb+v
as(CO2)
3622, 3598 cm-1
2100 2085 2070 2055 2040 2025
Absorb
ance (
AU
)
Wavenumber (cm-1)
ImpCat-Ni5
ImpCat-Ni2Co3
ImpCat-Co5
CopCat-Ni4
CopCat-Ni2Co4
CopCat-Co6
MgAlOx support
v(CO)
2077 cm-1
b)
1900 1850 1800 1750 1700 1650 1600 1550
Absorb
ance (
AU
)
Wavenumber (cm-1)
ImpCat-Ni5
ImpCat-Ni2Co3
ImpCat-Co5CopCat-Ni4
CopCat-Ni2Co4
CopCat-Co6
MgAlOx support
c)1594 cm-1
1648 cm-1
1602 cm-1
1636 cm-1
1596 cm-1
1608 cm-1
1604 cm-1

56
forming one molecule of CO (Goula et al., 1996; Tsipouriari and Verykios, 1999). 2) Reaction of
carbon with one carbonate group (CO32-
), forming two molecules of CO and leaving one atom of
oxygen available or (Tsipouriari and Verykios, 2001). 3) Reaction of carbon with one molecule
of CO2, forming two molecules of CO, also known as Boudouard reaction (Schuurman et al.,
1998; Kroll et al., 1997). If the previous steps did not exist, the catalysts would deactivate due to
carbon deposition generated by the following reaction:
CH4→C+H2 ∆H1073K=90.1 KJ/mol CH4 (4-3)
4.4 EFFECT OF H2S ON DRY REFORMING OF METHANE
The purpose of these experiments is to elucidate the poisoning mechanism by H2S on the dry
reforming of methane. To better understand the mechanism, the independent adsorption of H2S
was studied first to try to understand how hydrogen sulfide interacts with the catalysts and
determine the chemical species formed on the catalyst surface.
Secondly, in other set of experiments, the dry reforming of methane reaction was carried out
first. Then, H2S was introduced to understand its effect on the mechanism of the dry reforming of
methane reaction. Finally the H2S feed was stopped to understand what happens on the surface of
the catalysts after the hydrogen sulfide feed is stopped.
4.4.1 Independent interactions of H2S with the catalysts
For these experiments, the catalysts were reduced first as explained in chapter 3. Then, the
hydrogen feed was stopped and nitrogen started to flow for about 10 minutes. Subsequently, a

57
background spectrum was collected. After the background scan, H2S was introduced and some
scans were obtained afterwards.
In this work the presence of peaks attributed to the vibrations of hydrogen sulphide or the
vibrations of metal sulphides were not observed. Datta and Cavell (1985) pointed out that the
adsorption and dissociation of hydrogen sulphide, as well as the formation of nickel sulphide,
cannot be detected by infrared spectroscopy. X-ray absorption spectroscopy could determine the
formation of nickel sulfide or cobalt sulphide.
However, an interesting observation was found when H2S interacted with the reduced catalysts
without the presence of methane or CO2. It was visible that soon after H2S was introduced, a
negative peak (pointing downwards) appeared in the OH- region. The negative peak could
suggest hydroxyl consumption by H2S. Usually, the peaks in absorbance units are pointing
upwards, but the presence of this peak pointing downwards could be caused by the background
subtraction. At the moment of the background scan, hydroxyl functional groups might be present
in the catalysts. This background spectrum is subtracted to further collected spectra. If hydroxyl
is consumed, the background subtraction should produce a peak pointing in the opposite
direction (Figure 4-11). The previous observation is in agreement with Pakhare et al. (2014).

58
Figure 4-11. OH- consumption in the presence of H2S.
The disappearance of OH- groups is ascribed to hydroxy groups reacting to produce adsorbed
water (Toops and Crocker, 2008). This OH- groups could be in the form of Ni(OH)2. Czekaj et
al. (2011) reported that their “as delivered” catalysts contained NiO and Ni(OH)2 particles. The
CopCat-Co6 CopCat-Ni4
ImpCat-Co5 ImpCat-Ni5
3900 3850 3800 3750 3700 3650 3600
Before H2S
Ku
be
lka
-Mu
nk (
AU
)
Wavenumber (cm-1)
3730 cm-1
v(OH) During H2S
3900 3850 3800 3750 3700 3650 3600
Ku
be
lka
-Mu
nk (
AU
)
Wavenumber (cm-1)
3718 cm-1v(OH)
During H2S
Before H2S
3900 3850 3800 3750 3700 3650 3600
Ku
be
lka
-Mu
nk (
AU
)
Wavenumber (cm-1
)
3728 cm-1v(OH)
Before H2S
During H2S
3900 3850 3800 3750 3700 3650 3600
Ku
be
lka
-Mu
nk (
AU
)
Wavenumber (cm-1)
v(OH)
3722 cm-1
Before H2S
During H2S

59
partial reduction of Ni2+
produced Ni0 and still some NiO and Ni(OH)2 particles remained
unreduced.
Davidson and Sohail (1995) documented that hydroxy groups in zinc oxides disappeared due to
interaction with hydrogen sulphide, producing water. They suggested that H2S required
chemisorbed OH- to transfer two protons. They concluded that in the creation of sulfides, H2S
does not transfer two protons to oxides on the surface.
For cobalt monometallic catalysts, CopCat-Co6 and ImpCat-Co5, the negative peak occurs at
higher wavenumbers (3730 and 3728 cm-1
, respectively) compared to the nickel monometallic
catalysts CopCatNi-4 and ImpCatNi-5 (3718 and 3722 cm-1
, respectively).
4.4.2 Adsorptions of CH4 and CO2 in the presence of H2S
For this set of experiments, the catalysts were reduced first by a mixture of 5% H2 in N2 for 2.5
hours. Right after the reduction, a background spectrum was collected. Then, a mixture of
methane and CO2 was introduced to the DRIFTS cell and after 15 minutes the first spectrum was
collected. Following the previous step, a mixture of 522 ppm of H2S in Ar was added and after 3
hours, the second spectrum was scanned. After the second scan, the flow of hydrogen sulfide was
stopped and the flow of methane and CO2 continued for one more hour and then the third
spectrum was collected. All the spectra were normalized for easier comparison.
Figures 4-12 to 4-18 show the comparison of bands produced by carbon dioxide: a) and methane:
b) 3012 cm-1
(asymmetrical stretching); c) 2823 and 2599 cm-1
(combination band and overtone
respectively) and; d) 1540 and 1302 cm-1
(in-plane bending and out-of-plane bending,
respectively). These bands are compared at three different intervals: before the introduction of

60
H2S (black spectrum), three hours after the introduction of H2S (red spectrum) and one hour after
stopping the H2S flow (blue spectrum). The purpose of comparing these three spectra at
different intervals was to study 1) the CH4 and CO2 response to the interaction of H2S to
determine if poisoning occurred or not and; 2) the recovery of the CH4 and CO2 bands after
stopping H2S to determine if the catalyst can be recovered after being poisoned by H2S.
The spectra for the catalysts containing only nickel, both prepared by coprecipitation (CopCat-
Ni4)) and impregnation (ImpCat-Ni5) are compared in Figures 4-12 and 4-13, respectively. It
can be seen a decrease in intensity in all the absorbance bands of CO2 and CH4 after 3 hours of
exposure to H2S. This decline suggests that H2S blocks active sites for CH4 and CO2 adsorptions.
It can also be noticed that the decrease caused by H2S poisoning is lower for the impregnated
catalysts ImpCat-Ni5 (Figure 4-13) than that for coprecipitated catalyst CopCat-Ni4 (Figure 4-
12).
It can also be noted that the CH4 and CO2 bands for all the catalysts increased in intensity after
stopping the H2S flow, suggesting that the poisoning is reversible and that catalyst activity is
recoverable. This could be confirmed by Gas Chromatography.
The intensity of the CH4 and CO2 bands collected 1 hour after stopping the H2S feed are much
higher than the bands collected before the introduction of H2S (with the exception of MgAlOx
support). This could be explained by the time that the catalysts were not in contact with H2S,
which was 15 minutes for the period before the introduction of H2S and 60 minutes for the
period after stopping the H2S feed. Therefore, both CH4 and CO2 had more time to adsorb on the
catalyst surface. An alternative explanation to this phenomena is that H2S contributed to reduce

61
the metals, allowing more adsorption of CH4 and CO2. This could be further determined by
synchrotron experiments.
Figure 4-12. Bands attributed to CO2 (a) and CH4 (b, c, d) displayed before introducing H2S, 3
hours after introducing H2S and 1 hour after stopping the H2S flow for CopCat-Ni4.
CopCat-Ni4
3800 3750 3700 3650 3600 3550 3500 3450 3400
Abso
rba
nce
(A
U)
Wavenumber (cm-1)
vs+v
as(CO2)
3730, 3704 cm-1
2vb+v
as(CO2)
3622, 3598 cm-1
1 h after stopping H2S
Before H2S
3 h H2S
a)
3150 3100 3050 3000 2950 2900 2850A
bso
rba
nce
(A
U)
Wavenumber (cm-1)
vs(CH
2)
3012 cm-1
1 h after stopping H2S
3 h H2S
Before H2S
b)
2880 2800 2720 2640 2560
Abso
rba
nce
(A
U)
Wavenumber (cm-1)
1 h after stopping H2S
2v4b
(CH2)
2599 cm-1
Before H2S
v2b+v
4b(CH2)
2823 cm-1
3 h H2S
c)
1520 1440 1360 1280 1200
Abso
rba
nce
(A
U)
Wavenumber (cm-1)
v2b
(CH2)
1540 cm-1
1 h after stopping H2S
v4b
(CH2)
1302 cm-1
3 h H2S
Before H2S
d)

62
Figure 4-13. Bands attributed to CO2 (a) and CH4 (b, c, d) displayed before introducing H2S, 3
hours after introducing H2S and 1 hour after stopping the H2S flow for ImpCat-Ni5 (continued).
Interestingly, the catalysts containing only cobalt (CopCat-Co6 and ImpCat-Co5) showed the
opposite trend: the intensities of the methane and CO2 bands increased in the presence of
hydrogen sulphide (Figures 4-14 and 4-15), suggesting that H2S does not poison the cobalt sites
at 600 oC.
ImpCat-Ni5
3800 3750 3700 3650 3600 3550 3500 3450 3400
Abso
rba
nce
(A
U)
Wavenumber (cm-1)
vs+v
as(CO2)
3730, 3704 cm-1
3622, 3598 cm-1
2vb+v
as(CO2)
1 h after stopping H2S
3 h H2SBefore H2S
a)
3150 3100 3050 3000 2950 2900 2850
Abso
rba
nce
(A
U)
Wavenumber (cm-1)
vs(CH
2)
3012 cm-1
3 h H2S
1 h after stopping H2S
Before H2S
b)
2880 2800 2720 2640 2560
Abso
rba
nce
(A
U)
Wavenumber (cm-1)
v2b+v
4b(CH2)
2823 cm-1
1 h after stopping H2S
2599 cm-1
2v4b
(CH2)
Before H2S
3 h H2S
c)
1520 1440 1360 1280 1200
Abso
rba
nce
(A
U)
Wavenumber (cm-1)
v2b
(CH2)
1540 cm-1
1302 cm-1v4b
(CH2)
1 h after stopping H2S
3 h H2S
Before H2S
d)

63
Figure 4-14. Bands attributed to CO2 (a) and CH4 (b, c, d) displayed before introducing H2S, 3
hours after introducing H2S and 1 hour after stopping the H2S flow for CopCat-Co6 (continued).
CopCat-Co6
3800 3750 3700 3650 3600 3550 3500 3450 3400
Ab
sorb
an
ce (
AU
)
Wavenumber (cm-1)
3 h H2SBefore H2S
3622, 3598 cm-1
2vb+v
as(CO2)
vs+v
as(CO2)
3730, 3704 cm-1
1 h after stopping H2S
a)
3150 3100 3050 3000 2950 2900 2850
Ab
sorb
an
ce (
AU
)
Wavenumber (cm-1)
3 h H2S
vs(CH
2)
3012 cm-1
Before H2S
1 h after stopping H2S
b)
2880 2800 2720 2640 2560
Ab
sorb
an
ce (
AU
)
Wavenumber (cm-1)
3 h H2S
vs(CH
2)
2823 cm-1
Before H2S
1 h after stopping H2S
2v4b
(CH2)
2599 cm-1
c)
1520 1440 1360 1280 1200
Ab
sorb
an
ce (
AU
)
Wavenumber (cm-1)
1540 cm-1
v2b
(CH2)
1 h after stopping H2S
1302 cm-1
v4b
(CH2)
3 h H2SBefore H2S
d)

64
Figure 4-15. Bands attributed to CO2 (a) and CH4 (b, c, d) displayed before introducing H2S, 3
hours after introducing H2S and 1 hour after stopping the H2S flow for ImpCat-Co5.
For the coprecipitated bimetallic catalysts CopCat-Ni2Co4 (Figure 4-16) the bands produced by
methane and CO2 significantly decreased in intensity in the presence of H2S and regained
intensity after the removal of hydrogen sulphide. The decline in intensity could be caused by
nickel active sites poisoned or blocked by hydrogen sulphide. It can also be noted that the
decrease in intensity in the methane and CO2 bands is lower for the impregnated catalyst
ImpCat-Ni2Co3 (Figure 4-17) than for the coprecipitated catalyst CopCat-Ni2Co4 (Figure 4-16).
ImpCat-Co5
3800 3750 3700 3650 3600 3550 3500 3450 3400
Ab
sorb
an
ce (
AU
)
Wavenumber (cm-1)
vs+v
as(CO2)
3730, 3704 cm-1
2vb+v
as(CO2)
3622, 3598 cm-1
1 h after stopping H2S
Before H2S
3 h H2S
a)
3150 3100 3050 3000 2950 2900 2850
Ab
sorb
an
ce (
AU
)
Wavenumber (cm-1)
vs(CH
2)
3012 cm-1
Before H2S
3 h H2S
1 h after stopping H2S
b)
2880 2800 2720 2640 2560
Ab
sorb
an
ce (
AU
)
Wavenumber (cm-1)
v2b+v
4b
2823 cm-1
3 h H2S
1 h after stopping H2S
Before H2S
2599 cm-1
2v4b
c)
1520 1440 1360 1280 1200
Ab
sorb
an
ce (
AU
)
Wavenumber (cm-1)
1 h after stopping H2S
3 h H2S
v2b
(CH2)
1540 cm-1
Before H2S
1302 cm-1v4b
(CH2) d)

65
Figure 4-16. Bands attributed to CO2 (a) and CH4 (b, c, d) displayed before introducing H2S, 3
hours after introducing H2S and 1 hour after stopping the H2S flow for CopCat-Ni2Co4.
The ImpCat-Ni2Co3 was the only nickel-containing catalysts for which the CO2 and methane
intensities were not highly lowered in the presence of H2S (the height of the peaks remained
almost the same) as shown in Figure 4-17. This could suggest that among all the nickel-
containing catalysts tested, this is the catalyst with more tolerance to H2S poisoning. After the
interruption of the H2S flow, the bands attributed to CH4 and CO2 increased in intensity.
CopCat-Ni2Co4
3800 3750 3700 3650 3600 3550 3500 3450 3400
Abso
rba
nce
(A
U)
Wavenumber (cm-1)
vs+v
as(CO2)
3730, 3704 cm-1
2vb+v
as(CO2)
3622, 3598 cm-1
1 h after stopping H2S
3 h H2S
Before H2S
a)
3150 3100 3050 3000 2950 2900 2850
Abso
rba
nce
(A
U)
Wavenumber (cm-1)
vs(CH
2)
3012 cm-1
1 h after stopping H2S
3 h H2S
Before H2S
b)
2880 2800 2720 2640 2560
Abso
rba
nce
(A
U)
Wavenumber (cm-1)
v2b+v
4b(CH2)
2823 cm-1
1 h after stopping H2S2v4b
(CH2)
2599 cm-1
3 h H2S
Before H2S
c)
1520 1440 1360 1280 1200
Abso
rba
nce
(A
U)
Wavenumber (cm-1)
v2b
(CH2)
1540 cm-1
1 h after stopping H2S
v4b
(CH2)
1302 cm-1
3 h H2SBefore H2S
d)

66
Figure 4-17. Bands attributed to CO2 (a) and CH4 (b, c, d) displayed before introducing H2S, 3
hours after introducing H2S and 1 hour after stopping the H2S flow for ImpCat-Ni2Co3.
It can also be observed that the intensities of methane and CO2 bands decreased more on
coprecipitated catalysts (CopCat-Ni2Co4 and CopCat-Ni4) than on impregnated catalysts
(ImpCat-Ni2Co3 and ImpCat-Ni5). This lower decline for impregnated catalysts could be caused
by their larger pore volume and pore size than coprecipitated catalysts. Also, the particles size
resulted from reduction are higher on impregnated catalysts than on coprecipitated catalysts
(Shakouri, 2011). The higher tolerance to H2S on impregnated catalysts could be explained by
the higher reducibility of nickel and cobalt on impregnated catalysts (Wang et al., 2013).
ImpCat-Ni2Co3
3800 3750 3700 3650 3600 3550 3500 3450 3400
Abso
rba
nce
(A
U)
Wavenumber (cm-1)
vs+v
as(CO2)
3730, 3704 cm-1
2vb+v
as(CO2)
3622, 3598 cm-1
1 h after stopping H2S
Before H2S
3 h H2S
a)
3150 3100 3050 3000 2950 2900 2850
Abso
rba
nce
(A
U)
Wavenumber (cm-1)
3012 cm-1
vs(CH
2)
3 h H2S
1 h after stopping H2S
Before H2S
b)
2880 2800 2720 2640 2560
Abso
rba
nce
(A
U)
Wavenumber (cm-1)
1 h after stopping H2S
3 h H2S
Before H2S
2599 cm-1
2v4b
(CH2)
2823 cm-1
v2b+v
4b(CH2) c)
1520 1440 1360 1280 1200
Abso
rba
nce
(A
U)
Wavenumber (cm-1)
v2b
(CH2)
1540 cm-1
1 h after stopping H2S
3 h H2SBefore H2S
1302 cm-1
v4b
(CH2) d)

67
For the support, the methane and CO2 intensities decreased in the presence of H2S and remained
with almost the same intensity after H2S was stopped, suggesting that H2S reduced the
adsorptions of methane and CO2 on the support irreversibly.
Figure 4-18. Bands attributed to CO2 (a) and CH4 (b, c, d) displayed before introducing H2S, 3
hours after introducing H2S and 1 hour after stopping the H2S flow for MgAlOx support.
The bands collected 1 hour after stopping H2S feed were the highest for the catalysts containing
nickel or cobalt. However, for the support, these bands remained decreased almost at the same
intensities than bands collected in the presence of H2S, suggest that sulfur blocked active sites
MgAlOx support
3800 3750 3700 3650 3600 3550 3500 3450 3400
Ab
sorb
an
ce (
AU
)
Wavenumber (cm-1)
Before H2S
3622, 3598 cm-1
2vb+v
as(CO2)
3730, 3704 cm-1
vs+v
as(CO2)
1 h after stopping H2S
3 h H2S
a)
3150 3100 3050 3000 2950 2900 2850
Ab
sorb
an
ce (
AU
)
Wavenumber (cm-1)
3 h H2S
1 h after stopping H2S
vs(CH
2)
3012 cm-1
Before H2S
b)
2880 2800 2720 2640 2560
Ab
sorb
an
ce (
AU
)
Wavenumber (cm-1)
v2b+v
4b(CH2)
2823 cm-13 h H2S
1 h after stopping H2S
Before H2S
2599 cm-12v4b
(CH2) c)
1520 1440 1360 1280 1200
Ab
sorb
an
ce (
AU
)
Wavenumber (cm-1)
v2b
(CH2)
1540 cm-1
3 h H2S
Before H2S1 h after stopping H2S
v4b
(CH2)
1302 cm-1
d)

68
that interfered with the methane and CO2 adsorptions even after the removal of H2S (Figure 4-
18). Czekaj et al. (2011) found that carbonyl sulfide is more stably adsorbed to the support than
to nickel particles on Ni/Al2O3 catalyst.
One effect produced by H2S in the mechanism of dry reforming of methane reaction is to
decrease the concentration of carbonates as shown in Figure 4.19. Davidson and Sohail (1995)
documented that carbonates (CO32-
) react with hydrogen sulfide to produce H2O and CO2 during
sulfidation.
Figure 4-19. Decrease in the concentration of carbonates in the presence of H2S.
CopCat-Co6 ImpCat-Co5
Copcat-Ni2Co4 ImpCat-Ni2Co3
CopCat-Ni4 ImpCat-Ni5
MgAlOx support
1900 1850 1800 1750 1700 1650 1600 1550
Abs
orba
nce
(AU
)
Wavenumber (cm-1)
1 h after stopping H2S
3 h H2SBefore H2S
1900 1850 1800 1750 1700 1650 1600 1550
Abs
orba
nce
(AU
)
Wavenumber (cm-1)
1652 cm-1
3 h H2S
Before H2S
1 h after stopping H2S
1900 1850 1800 1750 1700 1650 1600 1550
Abs
orba
nce
(AU
)
Wavenumber (cm-1)
1642 cm-1
Before H2S
3 h H2S
1 h after stopping H2S
1900 1850 1800 1750 1700 1650 1600 1550
Abs
orba
nce
(AU
)
Wavenumber (cm-1)
1 h after stopping H2S
3 h H2S
Before H2S
1604 cm-1
1900 1850 1800 1750 1700 1650 1600 1550
Abs
orba
nce
(AU
)
Wavenumber (cm-1)
1640 cm-1
1 h after stopping H2S
3 h H2S
Before H2S
1900 1850 1800 1750 1700 1650 1600 1550
Abs
orba
nce
(AU
)
Wavenumber (cm-1)
1628 cm-1
3 h H2S
1 h after stopping H2S
Before H2S
1900 1850 1800 1750 1700 1650 1600 1550
Abs
orba
nce
(AU
)
Wavenumber (cm-1)
Before H2S
1 h after stopping H2S
3 h H2S
1640 cm-1

69
Figure 4-19. Decrease in the concentration of carbonates in the presence of H2S (continued).
The ability of catalysts to have carbonates formed is related with a better activity for DRM
(Bitter et al., 1997; Nakamura et al., 1994). For the cobalt monometallic catalyst, ImpCat-Co5,
the decrease in the carbonates band during the H2S feed was not as obvious as for nickel-
containing catalysts CopCat-Ni4, CopCat-Ni2Co4 and ImpCat-Ni5 (Figure 4-19), suggesting
that cobalt catalysts are harder to poison by hydrogen sulfide than nickel-containing catalysts.
For the coprecipitated catalysts CopCat-Ni2CO4 and Copcat-Ni4, the reduction in the
concentration of carbonates in the presence of H2S was higher than for the impregnated catalyst
ImpCat-Ni5, suggesting that impregnated catalysts are more resistant to H2S poisoning than
coprecipitated catalysts.
CopCat-Co6 ImpCat-Co5
Copcat-Ni2Co4 ImpCat-Ni2Co3
CopCat-Ni4 ImpCat-Ni5
MgAlOx support
1900 1850 1800 1750 1700 1650 1600 1550
Abs
orba
nce
(AU
)
Wavenumber (cm-1)
1 h after stopping H2S
3 h H2SBefore H2S
1900 1850 1800 1750 1700 1650 1600 1550
Abs
orba
nce
(AU
)
Wavenumber (cm-1)
1652 cm-1
3 h H2S
Before H2S
1 h after stopping H2S
1900 1850 1800 1750 1700 1650 1600 1550
Abs
orba
nce
(AU
)
Wavenumber (cm-1)
1642 cm-1
Before H2S
3 h H2S
1 h after stopping H2S
1900 1850 1800 1750 1700 1650 1600 1550
Abs
orba
nce
(AU
)
Wavenumber (cm-1)
1 h after stopping H2S
3 h H2S
Before H2S
1604 cm-1
1900 1850 1800 1750 1700 1650 1600 1550
Abs
orba
nce
(AU
)
Wavenumber (cm-1)
1640 cm-1
1 h after stopping H2S
3 h H2S
Before H2S
1900 1850 1800 1750 1700 1650 1600 1550
Abs
orba
nce
(AU
)
Wavenumber (cm-1)
1628 cm-1
3 h H2S
1 h after stopping H2S
Before H2S
1900 1850 1800 1750 1700 1650 1600 1550
Abs
orba
nce
(AU
)
Wavenumber (cm-1)
Before H2S
1 h after stopping H2S
3 h H2S
1640 cm-1

70
4.4.3 Formation of carbonyl sulfide in the presence of H2S
For all the catalysts tested, including the support, the peak at 2077 cm-1
, attributed to linear CO
produced by CO2 dissociation, was replaced by two peaks at 2071 and 2054 (or 2051) cm-1
, upon
interaction with hydrogen sulfide. These two peaks are attributed to carbonyl sulfide (COS)
(Barnes et al., 1995; Hongbo et al., 2004; Hattori et al., 2012). Carbonyl sulfide might have been
produced by the reaction H2S + CO2 ⇌ COS + H2O. After the flow of H2S was stopped, the
peak at 2077 cm-1
reappeared, and the two peaks produced by COS disappeared (Figure 4-20).
Figure 4-20. Carbonyl sulfide instead of carbonyl produced in the presence of H2S.
CopCat-Co6 ImpCat-Co5
CopCat-Ni2Co4 ImpCat-Ni2Co3
CopCat-Ni4 ImpCat-Ni5
MgAlOx support
2090 2080 2070 2060 2050 2040
v(COS)
2051 cm-1
Abs
orba
nce
(AU
)
Wavenumber (cm-1)
v(CO)2077 cm-1
1 h after stopping H2S
v(COS)2071 cm-1
3 h H2S
Before H2S
2090 2080 2070 2060 2050 2040
2051cm-1
v(COS)
Abs
orba
nce
(AU
)
Wavenumber (cm-1)
v(CO)2077 cm-1
1 h after stopping H2S
3 h H2S
v(COS)
2071cm-1
Before H2S
2090 2080 2070 2060 2050 2040
v(COS)2051 cm-1
Before H2S
2071 cm-1
Abs
orba
nce
(AU
)
Wavenumber (cm-1)
2077 cm-1
v(COS)
3 h H2S
1 h after stopping H2S
v(CO)
2090 2080 2070 2060 2050 2040
v(COS)
2054 cm-1
Abs
orba
nce
(AU
)
Wavenumber (cm-1)
2071 cm-1
v(COS)
1 h after stopping H2S
3 h H2S
Before H2S
v(CO)
2077 cm-1
2090 2080 2070 2060 2050 2040
v(COS)
2051 cm-1
Abs
orba
nce
(AU
)
Wavenumber (cm-1)
2071 cm-1
v(COS)
v(CO)
3 h H2S
2077 cm-1
Before H2S
1 h after stopping H2S
2090 2080 2070 2060 2050 2040
v(COS)
2051 cm-1
Abs
orba
nce
(AU
)
Wavenumber (cm-1)
1 h after stopping H2S
v(COS)2071 cm-1
3 h H2S
Before H2S
2077 cm-1
v(CO)
2090 2080 2070 2060 2050 2040
2054 cm-1
2071 cm-1
v(COS)
v(COS)
Abs
orba
nce
(AU
)
Wavenumber (cm-1)
v(CO)2077 cm
-1
3 h H2S
1 h after stopping H2S
Before H2S

71
Figure 4-20. Carbonyl sulfide instead of carbonyl produced in the presence of H2S (continued).
Czekaj et al. (2011) found from theoretical calculations that COS and H2S are the most stable
adsorbates on Ni/Al2O3. Carbonyl sulfide might not be a stable chemical species formed on the
surface of the catalysts, this is suggested by the disappearance of COS bands after stopping the
H2S flow. Therefore, carbonyl sulfide must not be responsible for the poisoning of the catalysts.
4.4.4 Proposed mechanism for H2S poisoning
By reconciling the observation of hydroxyl consumption with the observation that CH4 and CO2
adsorptions were decreased on nickel monometallic catalysts, suggesting that H2S attacks nickel
active sites, the following mechanism is proposed for poisoning of the nickel active sites:
CopCat-Co6 ImpCat-Co5
CopCat-Ni2Co4 ImpCat-Ni2Co3
CopCat-Ni4 ImpCat-Ni5
MgAlOx support
2090 2080 2070 2060 2050 2040
v(COS)
2051 cm-1
Abs
orba
nce
(AU
)
Wavenumber (cm-1)
v(CO)2077 cm-1
1 h after stopping H2S
v(COS)2071 cm-1
3 h H2S
Before H2S
2090 2080 2070 2060 2050 2040
2051cm-1
v(COS)
Abs
orba
nce
(AU
)
Wavenumber (cm-1)
v(CO)2077 cm-1
1 h after stopping H2S
3 h H2S
v(COS)
2071cm-1
Before H2S
2090 2080 2070 2060 2050 2040
v(COS)2051 cm-1
Before H2S
2071 cm-1
Abs
orba
nce
(AU
)
Wavenumber (cm-1)
2077 cm-1
v(COS)
3 h H2S
1 h after stopping H2S
v(CO)
2090 2080 2070 2060 2050 2040
v(COS)
2054 cm-1
Abs
orba
nce
(AU
)
Wavenumber (cm-1)
2071 cm-1
v(COS)
1 h after stopping H2S
3 h H2S
Before H2S
v(CO)
2077 cm-1
2090 2080 2070 2060 2050 2040
v(COS)
2051 cm-1
Abs
orba
nce
(AU
)
Wavenumber (cm-1)
2071 cm-1
v(COS)
v(CO)
3 h H2S
2077 cm-1
Before H2S
1 h after stopping H2S
2090 2080 2070 2060 2050 2040
v(COS)
2051 cm-1
Abs
orba
nce
(AU
)
Wavenumber (cm-1)
1 h after stopping H2S
v(COS)2071 cm-1
3 h H2S
Before H2S
2077 cm-1
v(CO)
2090 2080 2070 2060 2050 2040
2054 cm-1
2071 cm-1
v(COS)
v(COS)
Abs
orba
nce
(AU
)
Wavenumber (cm-1)
v(CO)2077 cm
-1
3 h H2S
1 h after stopping H2S
Before H2S

72
Ni(OH)2 + H2S → NiS +2H2O (4.4)
The observation of OH- consumption occurred not only for nickel monometallic catalysts,
but also for cobalt monometallic catalysts, suggesting that sulfidation could occur on cobalt
metal sites, or even on the support, by the following mechanisms:
Co(OH)2 + H2S → CoS +2H2O (4.5)
Mg(OH)2 + H2S → MgS +2H2O (4.6)
Summarizing the subsection 4.4, DRIFT spectroscopy did not show absorbance bands attributed
to the fundamental vibrations of H2S or SH- species, but it showed carbonyl sulfide adsorbed on
the surface instead of the linear carbonyl. The presence of carbonyl sulfide bands may indicate
that the product selectivity is changed by H2S. Also, there was a decrease in intensities of
methane and CO2 bands on nickel-containing catalysts in the presence of H2S. This decrease was
higher on coprecipitated catalysts (CopCat-Ni2Co4 and CopCat-Ni4) than on impregnated
catalysts (ImpCat-Ni2Co3 and ImpCat-Ni5). The reduction in intensities of CH4 and CO2 bands
in the presence of hydrogen sulfide was not observed on cobalt monometallic catalysts. The
decline in hydroxyl groups after the interaction of H2S with the catalysts suggests the formation
of nickel sulfide and water.
4.5 EFFECT OF SO2 ON DRY REFORMING OF METHANE
The purpose of this section is to elucidate the poisoning mechanism by SO2 during the dry
reforming of methane reaction. Firstly, to better understand the mechanism, the independent

73
adsorption of SO2 was studied to try to understand how sulfur dioxide interacts with the catalysts
and determine the chemical species formed on the catalyst surface.
Secondly, in another set of experiments, the dry reforming of methane reaction was carried out
first. Then, SO2 was introduced to understand its effect on the mechanism of the dry reforming of
methane reaction and the poisoning mechanism. Finally, the SO2 feed was stopped to understand
the outcome of the chemical species produced (if any) during the poisoning period.
4.5.1 Independent interactions of SO2 with the catalysts
For these experiments, the catalysts were reduced at 600 oC and a background spectrum was
collected at the end of reduction as explained in chapter 3. Then, a mixture containing 1000 ppm
of SO2 in N2 was introduced at the same temperature and a scan was collected 10 minutes after.
Peaks at 1374 and about 1348 cm-1
, approximately, were detected on every catalyst after SO2
was fed to the reaction cell. Bands at 1374 and 1360 cm-1
are attributed to gaseous SO2 (Padley
et al., 1994). Also, a band at about 1358 cm-1
was seen as shown in Figure 4-21. Bands at near
wavenumbers are attributed to aluminum sulfates (Gracia et al., 2005) or less explicitly to SO42-
species (Liu et al., 2006). Since most of the spectra in Figure 4-21 are expressed in KM units, it
is not possible to compare spectra to obtain quantitative information.

74
Figure 4-21. Bands attributed to physisorbed SO2 and sulfate species.
CopCat-Co6 ImpCat-Co5
CopCat-Ni2Co4 ImpCat-Ni2Co3
CopCat-Ni4 ImpCat-Ni5
MgAlOx support
1395 1380 1365 1350 1335
Kub
elka
-Mun
k (A
U)
Wavenumber (cm-1)
Before SO2
During SO2
v(SO2)
1374 cm-1
v(SO2)
1348cm-1
v(SO2-4 )
1356cm-1
1395 1380 1365 1350 1335
Kub
elka
-Mun
k (A
U)
Wavenumber (cm-1)
v(SO2)
1374 cm-1
v(SO2-4 )
1358cm-1
v(SO2)
1348cm-1
During SO2
Before SO2
1395 1380 1365 1350 1335
Kub
elka
-Mun
k (A
U)
Wavenumber (cm-1)
v(SO2)
1374 cm-1
v(SO2)
1354cm-1
During SO2
Before SO2
1395 1380 1365 1350 1335
Kub
elka
-Mun
k (A
U)
Wavenumber (cm-1)
v(SO2)
1374 cm-1
v(SO2-4 )
1358cm-1
1346cm-1
v(SO2)
During SO2
Before SO2
1395 1380 1365 1350 1335
Kub
elka
-Mun
k (A
U)
Wavenumber (cm-1)
v(SO2)
1374 cm-1
v(SO2-4 )
1358cm-1
1348cm-1
v(SO2)
During SO2
Before SO2
1395 1380 1365 1350 1335
Kub
elka
-Mun
k (A
U)
Wavenumber (cm-1)
1374 cm-1
v(SO2)
v(SO2-4 )
1358cm-1
1346cm-1
v(SO2)
During SO2
Before SO2
1395 1380 1365 1350 1335
Kub
elka
-Mun
k (A
U)
Wavenumber (cm-1)
v(SO2)
1374 cm-1
1356cm-1
v(SO4
2-) 1348cm
-1
v(SO2)
During SO2
Before SO2

75
It can be seen in Figure 4-21 that the band attributed to SO42-
for the support is smaller than the
other two bands ascribed to adsorbed SO2. The presence of nickel or cobalt makes the SO42-
band
higher with respect with the two bands attributed to adsorbed SO2. For cobalt monometallic
catalysts, CopCat-Co6 and ImpCat-Co5, the preparation method did not have any effect on the
intensity of the three different peaks since the peaks appear almost similar. This could be
explained by the similar catalytic surface since Co was not able to be reduced by H2. For the
coprecipitated bimetallic catalyst, CopCat-Ni2Co4, the SO42-
peak at 1358 cm-1
and the peak
attributed to adsorbed SO2 at 1348 cm-1 seemed to form a new peak. For the nickel impregnated
monometallic catalyst, ImpCat-Ni5, the SO42-
band was higher than the band attributed to
adsorbed SO2 at about 1348 cm-1
and for the nickel coprecipitated monometallic catalyst, the
SO42-
band was smaller than the band attributed to adsorbed SO2. The difference in the intensity
of the bands caused by SO2 adsorption in Figure 4-21 at least indicates the changing electronic
properties on the catalyst surfaces.
Also, during the independent interaction of SO2 with some catalysts, the observation of the peak
pointing downwards at about 3742-3720 cm-1
(Figure 4-22), similar to the effect produced by
H2S, may also represent the interaction between SO2 and the hydroxyl groups. According to
Zhao et al. (2011) and Abdulhamid et al. (2006) this negative peak could indicate that hydroxyl
groups were consumed in the presence of SO2. Datta and Cavell (1985) reported that infrared
bands of non-hydrogen-bonded hydroxyls disappeared in the presence of SO2, suggesting
hydroxyl perturbation by SO2.

76
Figure 4-22. Negative peak at the OH- region seen after the interaction of SO2.
CopCat-Ni4 ImpCat-Ni5
CopCat-Ni2Co4 ImpCat-Ni2Co3
CopCat-Co6 ImpCat-Co5
MgAlOx support
3900 3850 3800 3750 3700 3650 3600
3722 cm-1
Kub
elka
-Mun
k (A
U)
Wavenumber (cm-1)
Before SO2
During SO2
v(OH)
3900 3850 3800 3750 3700 3650 3600
3742 cm-1
Kub
elka
-Mun
k (A
U)
Wavenumber (cm-1)
3742 cm-1
During SO2
Before SO2
v(OH)
3900 3850 3800 3750 3700 3650 3600
Kub
elka
-Mun
k (A
U)
Wavenumber (cm-1)
During SO2
Before SO2
3720 cm-1
v(OH)
3900 3850 3800 3750 3700 3650 3600
Kub
elka
-Mun
k (A
U)
Wavenumber (cm-1)
During SO2
Before SO2
3726 cm-1v(OH)
3900 3850 3800 3750 3700 3650 3600
Kub
elka
-Mun
k (A
U)
Wavenumber (cm-1)
During SO2
Before SO2
3726 cm-1
v(OH)
3900 3850 3800 3750 3700 3650 3600
Kub
elka
-Mun
k (A
U)
Wavenumber (cm-1)
3724 cm-1
During SO2
Before SO2
v(OH)
3900 3850 3800 3750 3700 3650 3600
Abs
orba
nce
(AU
)
Wavenumber (cm-1)
3712 cm-1
v(OH)
During SO2
Before SO2

77
There are differences in the positions of these negative bands shown in the presence of SO2. For
impregnated catalysts either bimetallic, nickel monometallic or cobalt monometallic, the
negative peaks occurred at higher wavenumbers than for coprecipitated catalysts. The negative
peak was located at higher wavenumbers on nickel monometallic impregnated catalyst than on
cobalt monometallic impregnated catalyst. Similarly, the negative peak was found at higher
wavenumber on nickel monometallic coprecipitated catalyst than for cobalt monometallic
precipitated catalyst. The reason for these discrepancies is not clear.
4.5.2 Adsorptions of CH4 and CO2 in the presence of SO2
To determine how SO2 affects the methane, CO2 and its related bands (carbonates and carbonyl
bands), spectra were taken at different intervals: 1) after 15 minutes of DRM (black spectrum);
2) three hours after the introduction of SO2 during DRM (red spectrum) and; 3) one hour after
stopping the SO2 flow (blue spectrum). Figures 4-23 to 4-29 show the comparison of bands
produced by carbon dioxide: a) and methane: b) 3012 cm-1
(asymmetrical stretching); c) 2823
and 2599 cm-1
(combination band and overtone respectively) and; d) 1540 and 1302 cm-1
(in-
plane bending and out-of-plane bending, respectively). The bands attributed to sulfates and
adsorbed SO2 also appear in d) for Figures 4-23 to 4-29 and were also compared.
For the impregnated monometallic nickel catalyst (ImpCat-Ni5), the methane and CO2 bands
considerably decreased in height in the presence of SO2 and remained almost the same after 1
hour of stopping the SO2 flow. This decline in intensity could indicate that SO2 blocks the
catalytic active sites irreversibly, preventing new methane and CO2 adsorptions (Figure 4-23). It
could also be seen for this catalyst in the presence of SO2 a peak attributed to SO2 at 1358 cm-1
and two bands ascribed to adsorbed SO2 at 1374 and 1342 cm-1
. These bands greatly decreased

78
in intensity one hour after stopping the flow of SO2, suggesting that the formation of sulfates is
reversible.
Figure 4-23. Bands attributed to CO2 (a) and CH4 (b, c, d) displayed before introducing SO2, 3
hours after introducing SO2 and 1 hour after stopping the SO2 flow for ImpCat-Ni5.
For the coprecipitated monometallic nickel catalyst (CopCat-Ni4), the methane and CO2 bands
did not seem to change noticeably in the presence of SO2, except the band at 3730 cm-1
that
slightly decreased. After stopping the SO2 flow, all the bands did not change in intensity (Figure
4-24), suggesting that poisoning by SO2 did not occur. During the interaction of SO2 with this
ImpCat-Ni5
3800 3750 3700 3650 3600 3550 3500 3450 3400
Abs
orba
nce
(AU
)
Wavenumber (cm-1)
vs+v
as(CO2)
3730, 3704 cm-1
3622, 3598 cm-1
2vb+v
as(CO2)
3 h SO2
Before SO2
1 h after stopping SO2
a)
3150 3100 3050 3000 2950 2900 2850
Abs
orba
nce
(AU
)Wavenumber (cm
-1)
vs(CH
2)
3012 cm-1
3 h SO2
1 h after stopping SO2
Before SO2
b)
2880 2800 2720 2640 2560
Abs
orba
nce
(AU
)
Wavenumber (cm-1)
Before SO2
2v4b
(CH2)
2599 cm-1
1 h after stopping SO2
3 h SO2
2823 cm-1
v2b+v
4b(CH2) c)
1560 1500 1440 1380 1320
Abs
orba
nce
(AU
)
Wavenumber (cm-1)
v2b
(CH2)
1540 cm-1
Before SO2 3 h SO2
1 h after stopping SO2
v4b
(CH2)
1302 cm-1
d)
1374 cm-1
v(SO2)
v(SO2-4 )
1358cm-1
1342cm-1
v(SO2)

79
catalyst, bands attributed to adsorbed SO2 and sulfates were detected. The sulfates disappeared
after stopping the SO2 feed but the adsorbed SO2 remained.
Figure 4-24. Bands attributed to CO2 (a) and CH4 (b, c, d) displayed before introducing SO2, 3
hours after introducing SO2 and 1 hour after stopping the SO2 flow for CopCat-Ni4.
For CopCat-Co6, the noticeable change was the intensity decrease for the bands at 3012 and
1302 cm-1
after stopping the feed of SO2. If poisoning occurred, the poisoning was still effective
even after the SO2 had been stopped. Sulfate and adsorbed SO2 were seen in the presence of SO2
and the bands were also visible after stopping the SO2, confirming that the poisoning was still
effective.
CopCat-Ni4
3800 3750 3700 3650 3600 3550 3500 3450 3400
Abs
orba
nce
(AU
)
Wavenumber (cm-1)
Before SO2
3 h SO2
3622 and 3598 cm-1
2vb+v
as(CO2)
1 h after stopping SO2
3730, 3704 cm-1
vs+v
as(CO2)
a)
3150 3100 3050 3000 2950 2900 2850
Abs
orba
nce
(AU
)Wavenumber (cm
-1)
vs(CH
2)
3012 cm-1
3 h SO2
1 h after stopping SO2
Before SO2
b)
2880 2800 2720 2640 2560
Abs
orba
nce
(AU
)
Wavenumber (cm-1)
v2b+v
4b(CH2)
2823 cm-1
1 h after stopping SO2
Before SO2
3 h SO2
2599 cm-1
2v4b
(CH2)
c)
1560 1500 1440 1380 1320
Abs
orba
nce
(AU
)
Wavenumber (cm-1)
v2b
(CH2)
1540 cm-1
3 h SO2
1302 cm-1
v4b
(CH2)
1 h after stopping SO2
Before SO2
d)
v(SO2)
1374 cm-1
1346cm-1
v(SO2)
1358cm-1
v(SO2-4 )

80
Figure 4-25. Bands attributed to CO2 (a) and CH4 (b, c, d) displayed before introducing SO2, 3
hours after introducing SO2 and 1 hour after stopping the SO2 flow for CopCat-Co6.
For ImpCat-Co5, there were no significant changes in the bands attributed to CH4 and CO2. SO2
on the surface of the catalysts was confirmed by two bands at 1374 and 1344 cm-1
. Also, a band
at 1356 cm-1
indicated the presence of sulfate. After SO2 was stopped, only a big band remained
located at lower wavenumber compared to the sulfate peak. The reason for the appearance of
only this shifted band is unclear.
CopCat-Co6
3800 3750 3700 3650 3600 3550 3500 3450 3400
Ab
sorb
an
ce (
AU
)
Wavenumber (cm-1)
vs+v
as(CO2)
3730, 3704 cm-1
2vb+v
as(CO2)
3622, 3598 cm-1
1 h after stopping SO2
3 h SO2
Before SO2
a)
3150 3100 3050 3000 2950 2900 2850
Ab
sorb
an
ce (
AU
)
Wavenumber (cm-1)
vs(CH
2)
3012 cm-1
Before SO2
3 h SO2
1 h after stopping SO2
b)
2880 2800 2720 2640 2560
Ab
sorb
an
ce (
AU
)
Wavenumber (cm-1)
v2b+v
4b(CH2)
2823 cm-1
2v4b
(CH2)
2599 cm-13 h SO2
Before SO2
1 h after stopping SO2
c)
1560 1500 1440 1380 1320
Ab
sorb
an
ce (
AU
)
Wavenumber (cm-1)
v2b
(CH2)
1540 cm-1
1 h after stopping SO2
3 h SO2
Before SO2
1302 cm-1
v4b
(CH2)d)
1354cm-1
v(SO2-4 )
1344cm-1
v(SO2)

81
Figure 4-26. Bands attributed to CO2 (a) and CH4 (b, c, d) displayed before introducing SO2, 3
hours after introducing SO2 and 1 hour after stopping the SO2 flow for ImpCat-Co5.
For CopCat-Ni2Co4 (Figure 4-27) and ImpCat-Ni2CO3 (Figure 4-28) bimetallic catalysts, the
bands attributed to CO2 at 3730 and 3704 cm-1
decreased in the presence of sulfur dioxide but the
intensity recovered after SO2 was stopped. The bands attributed to the vibration of CH2 groups
did not vary much in the presence of SO2 for the bimetallic catalysts
For the coprecipitated bimetallic catalyst, CopCat-Ni2Co4, similar to the observation for
ImpCat-Co5, it was possible to observe a band attributed to sulfates in the presence of SO2 that
disappeared after stopping the feed of SO2. It seems as if the sulfate band is shifted to lower
ImpCat-Co5
3800 3750 3700 3650 3600 3550 3500 3450 3400
Abs
orba
nce
(AU
)
Wavenumber (cm-1)
vs+v
as(CO2)
3730, 3704 cm-1
3622, 3598 cm-1
2vb+v
as(CO2)
1 h after stopping SO2
Before SO2
3 h SO2
a)
3150 3100 3050 3000 2950 2900 2850
Abs
orba
nce
(AU
)
Wavenumber (cm-1)
vs(CH
2)
3012 cm-1
Before SO2
3 h SO2
1 h after stopping SO2
b)
2880 2800 2720 2640 2560
Abs
orba
nce
(AU
)
Wavenumber (cm-1)
2v4b
(CH2)
2599 cm-1
3 h SO2
1 h after stopping SO2
Before SO2
2823 cm-1
v2b+v
4b(CH2) c)
1560 1500 1440 1380 1320
v(SO2)
1356cm-1
Abs
orba
nce
(AU
)
Wavenumber (cm-1)
v2b
(CH2)
1540 cm-1
1 h after stopping SO2
3 h SO2
Before SO2
1302 cm-1
v4b
(CH2)d)v(SO
2-4 )
1374cm-1
1344cm-1
v(SO2)

82
wavenumber after stopping the SO2 flow and whatever this band is attributed to it increased in
intensity after stopping SO2.
Figure 4-27. Bands attributed to CO2 (a) and CH4 (b, c, d) displayed before introducing SO2, 3
hours after introducing SO2 and 1 hour after stopping the SO2 flow for CopCat-Ni2Co4.
For ImpCat-Ni2Co3, sulfate seen in the presence of SO2 disappeared one hour after stopping the
flow of SO2, suggesting that the formation of sulfate is reversible. A band attributed to adsorbed
sulfur dioxide at 1344 cm-1
remained after stopping the SO2 feed.
CopCat-Ni2Co4
3800 3750 3700 3650 3600 3550 3500 3450 3400
Ab
sorb
an
ce (
AU
)
Wavenumber (cm-1)
vs+v
as(CO2)
3730, 3704 cm-1
2vb+v
as(CO2)
3622, 3598 cm-1
3 h SO2
Before SO2
1 h after stopping SO2
a)
3150 3100 3050 3000 2950 2900 2850A
bso
rba
nce
(A
U)
Wavenumber (cm-1)
vs(CH
2)
3012 cm-1
3 h SO2
1 h after stopping SO2
Before SO2
b)
2880 2800 2720 2640 2560
Ab
sorb
an
ce (
AU
)
Wavenumber (cm-1)
v2b+v
4b(CH2)
2823 cm-1
1 h after stopping SO2
3 h SO2
Before SO2
2599 cm-1
2v4b
(CH2)
c)
1560 1500 1440 1380 1320
Ab
sorb
an
ce (
AU
)
Wavenumber (cm-1)
v4b
(CH2)
1302 cm-1
1 h after stopping SO2
1540 cm-1
v2b
(CH2)
3 h SO2
Before SO2
d)
1356cm-1
v(SO2-4 )
1344cm-1
v(SO2)

83
Figure 4-28. Bands attributed to CO2 (a) and CH4 (b, c, d) displayed before introducing SO2, 3
hours after introducing SO2 and 1 hour after stopping the SO2 flow for ImpCat-Ni2Co3.
For MgAlOx support, the CO2 and methane bands increased in intensity in the presence of SO2
and increased even more after SO2 removal (Figure 4-29), suggesting that magnesium and
aluminum oxides present on the support are not attacked by SO2. Therefore, the adsorptions of
methane and CO2 were not interfered. SO2 adsorbed on the surface of the support was detected
by two obvious bands at 1374 and 1342 cm-1
, sulfates were confirmed by the presence of a band
at 1352 cm-1
. After discontinuing the flow of SO2, these species significantly decreased in
intensity. Suggesting that the poisoning on the support is reversible.
ImpCat-Ni2Co3
3800 3750 3700 3650 3600 3550 3500 3450 3400
Abs
orba
nce
(AU
)
Wavenumber (cm-1)
vs+v
as(CO2)
3730, 3704 cm-1
2vb+v
as(CO2)
3622, 3598 cm-1
1 h after stopping SO2
3 h SO2Before SO2
a)
3150 3100 3050 3000 2950 2900 2850
Abs
orba
nce
(AU
)
Wavenumber (cm-1)
vs(CH
2)
3012 cm-1
3 h SO2
Before SO2
1 h after stopping SO2
b)
2880 2800 2720 2640 2560
Abs
orba
nce
(AU
)
Wavenumber (cm-1)
v2b+v
4b(CH2)
2823 cm-1
1 h after stopping SO2
3 h SO2 2599 cm-1
2v4b
(CH2)
Before SO2
c)
1560 1500 1440 1380 1320
Abs
orba
nce
(AU
)
Wavenumber (cm-1)
v2b
(CH2)
1540 cm-1
1 h after stopping SO2
3 h SO2
Before SO2
1302 cm-1
v4b
(CH2)d)
1374cm-1
v(SO2)
1344cm-1
v(SO2)
1354cm-1
v(SO2-4 )

84
Figure 4-29. Bands attributed to CO2 (a) and CH4 (b, c, d) displayed before introducing SO2, 3
hours after introducing SO2 and 1 hour after stopping the SO2 flow for MgAlOx support.
It is important to determine if SO2 hinders the formation of CO or carbonyl on the catalyst
surface. From this point of view, it was observed on Figure 4-30 that the intensity of CO
decreased on every catalysts when SO2 was introduced except for ImpCat-Co5 and the support.
The intensity of CO can be recovered to various extent, except for ImpCat-Ni5 and CopCat-Co6.
On CopCat-Co6, the intensity of CO further decreased after stopping the SO2 feed. Fig 4-30
MgAlOx support
3800 3750 3700 3650 3600 3550 3500 3450 3400
Ab
so
rba
nce
(A
U)
Wavenumber (cm-1)
vs+v
as(CO2)
3730, 3704 cm-1
2vb+v
as(CO2)
3622, 3598 cm-1
1 h after stopping SO2
3 h SO2
Before SO2
a)
3150 3100 3050 3000 2950 2900 2850
Ab
so
rba
nce
(A
U)
Wavenumber (cm-1)
vs(CH
2)
3012 cm-1
Before SO2
3 h SO2
1 h after stopping SO2
b)
2880 2800 2720 2640 2560
Ab
so
rba
nce
(A
U)
Wavenumber (cm-1)
1 h after stopping SO2
v2b+v
4b(CH2)
2823 cm-1
3 h SO2
Before SO22599 cm-1
2v4b
(CH2)
c)
1560 1500 1440 1380 1320
Ab
so
rba
nce
(A
U)
Wavenumber (cm-1)
v2b
(CH2)
1540 cm-1
1 h after stopping SO2
v4b
(CH2)
1302 cm-1
3 h SO2Before SO2
d)v(SO
2-4 )
1352cm-1
1342cm-1
v(SO2)
v(SO2)
1374cm-1

85
basically imply that SO2 forms SO4(2-)
species on the catalyst surfaces and hinders the formation
of CO during reforming reaction.
Figure 4-30. The impact of the presence of SO2 on CO species for various catalysts
CopCat-Co6 ImpCat-Co5
CopCat-Ni2Co4 ImpCat-Ni2Co3
CopCat-Ni4 ImpCat-Ni5
MgAlOx support
2090 2080 2070 2060 2050 2040
Abs
orba
nce
(AU
)Wavenumber (cm
-1)
v(CO)
2077 cm-1
1 h after stopping SO2
Before SO2
3 h SO2
2090 2080 2070 2060 2050 2040
Abs
orba
nce
(AU
)
Wavenumber (cm-1)
v(CO)
2077 cm-1
Before SO2
1 h after stopping SO2
3 h SO2
2090 2080 2070 2060 2050 2040
Abs
orba
nce
(AU
)
Wavenumber (cm-1)
v(CO)2077 cm
-1
Before SO2
3 h SO2
1 h after stopping SO2
2090 2080 2070 2060 2050 2040
Abs
orba
nce
(AU
)
Wavenumber (cm-1)
v(CO)
2077 cm-1
Before SO2
1 h after stopping SO2
3 h SO2
2090 2080 2070 2060 2050 2040
Abs
orba
nce
(AU
)
Wavenumber (cm-1)
v(CO)
2077 cm-1
Before SO2
1 h after stopping SO2
3 h SO2
2090 2080 2070 2060 2050 2040
Abs
orba
nce
(AU
)
Wavenumber (cm-1)
v(CO)
2077 cm-1
1 h after stopping SO2
3 h SO2
Before SO2
2090 2080 2070 2060 2050 2040
Abs
orba
nce
(AU
)
Wavenumber (cm-1)
v(CO)
2077 cm-1
Before SO2
3 h SO2
1 h after stopping SO2

86
Figure 4-30. The impact of the presence of SO2 on CO species for various catalysts (continued).
As seen in section 4.3, there is a correlation between the concentration of adsorbed CO and the
concentration of carbonates. Since the formation of sulfates seen in Figures 4-23 to 4-29 might
be responsible for the decrease in the concentration of CO during SO2 poisoning seen on Figure
4-30. It is suggested that the formation of sulfates is also responsible for the decrease in the
concentration of carbonates observed in Figure 4-31. It can also be seen that the concentration of
carbonates was recovered after stopping SO2, especially for the support, since the concentration
of carbonates was even higher than before the introduction of SO2.
Figure 4-31. Concentration of carbonates before, in and after the presence of SO2.
CopCat-Co6 ImpCat-Co5
CopCat-Ni2Co4 ImpCat-Ni2Co3
CopCat-Ni4 ImpCat-Ni5
MgAlOx support
2090 2080 2070 2060 2050 2040
Abs
orba
nce
(AU
)
Wavenumber (cm-1)
v(CO)
2077 cm-1
1 h after stopping SO2
Before SO2
3 h SO2
2090 2080 2070 2060 2050 2040
Abs
orba
nce
(AU
)
Wavenumber (cm-1)
v(CO)
2077 cm-1
Before SO2
1 h after stopping SO2
3 h SO2
2090 2080 2070 2060 2050 2040
Abs
orba
nce
(AU
)
Wavenumber (cm-1)
v(CO)2077 cm
-1
Before SO2
3 h SO2
1 h after stopping SO2
2090 2080 2070 2060 2050 2040
Abs
orba
nce
(AU
)
Wavenumber (cm-1)
v(CO)
2077 cm-1
Before SO2
1 h after stopping SO2
3 h SO2
2090 2080 2070 2060 2050 2040
Abs
orba
nce
(AU
)Wavenumber (cm
-1)
v(CO)
2077 cm-1
Before SO2
1 h after stopping SO2
3 h SO2
2090 2080 2070 2060 2050 2040
Abs
orba
nce
(AU
)
Wavenumber (cm-1)
v(CO)
2077 cm-1
1 h after stopping SO2
3 h SO2
Before SO2
2090 2080 2070 2060 2050 2040
Abs
orba
nce
(AU
)
Wavenumber (cm-1)
v(CO)
2077 cm-1
Before SO2
3 h SO2
1 h after stopping SO2
CopCat-Co6 ImpCat-Co5
CopCat-Ni2Co4 Impcat-Ni2Co3
CopCat-Ni4 ImpCat-Ni5
MgAlOx support
1900 1850 1800 1750 1700 1650 1600 1550
Abs
orba
nce
(AU
)
Wavenumber (cm-1)
1640 cm-1
3 h SO2
Before SO2
1 h after stopping SO2
1900 1850 1800 1750 1700 1650 1600 1550
Abs
orba
nce
(AU
)
Wavenumber (cm-1)
1 h after stopping SO2
3 h SO2
Before SO2
1598 cm-1
1900 1850 1800 1750 1700 1650 1600 1550
Abs
orba
nce
(AU
)
Wavenumber (cm-1)
1608 cm-1
1 h after stopping SO2
Before SO2
3 h SO2
1900 1850 1800 1750 1700 1650 1600 1550
Abs
orba
nce
(AU
)
Wavenumber (cm-1)
1 h after stopping SO2
3 h SO2Before SO2
1642 cm-1
1900 1850 1800 1750 1700 1650 1600 1550
Abs
orba
nce
(AU
)
Wavenumber (cm-1)
1 h after stopping SO23 h SO2
Before SO2
1608 cm-1
1900 1850 1800 1750 1700 1650 1600 1550
Abs
orba
nce
(AU
)
Wavenumber (cm-1)
Before SO21 h after stopping SO2
3 h SO2
1598 cm-1
1900 1850 1800 1750 1700 1650 1600 1550
Abs
orba
nce
(AU
)
Wavenumber (cm-1)
1 h after stopping SO2
3 h SO2
Before SO2
1610 cm-1

87
Figure 4-31. Concentration of carbonates before, in and after the presence of SO2 (continued).
The capacity of catalysts to form carbonates is associated with a better catalyst activity for DRM
(Bitter et al., 1997; Nakamura et al., 1994). The decrease in the carbonates band is higher for
CopCat-Ni4 than for CopCat-Co6, suggesting than cobalt catalysts are harder to poison by SO2
than nickel catalysts. Similarly, the decrease in the concentration of carbonates was higher for
CopCat-Co6 ImpCat-Co5
CopCat-Ni2Co4 Impcat-Ni2Co3
CopCat-Ni4 ImpCat-Ni5
MgAlOx support
1900 1850 1800 1750 1700 1650 1600 1550
Abs
orba
nce
(AU
)
Wavenumber (cm-1)
1640 cm-1
3 h SO2
Before SO2
1 h after stopping SO2
1900 1850 1800 1750 1700 1650 1600 1550
Abs
orba
nce
(AU
)
Wavenumber (cm-1)
1 h after stopping SO2
3 h SO2
Before SO2
1598 cm-1
1900 1850 1800 1750 1700 1650 1600 1550
Abs
orba
nce
(AU
)
Wavenumber (cm-1)
1608 cm-1
1 h after stopping SO2
Before SO2
3 h SO2
1900 1850 1800 1750 1700 1650 1600 1550
Abs
orba
nce
(AU
)
Wavenumber (cm-1)
1 h after stopping SO2
3 h SO2Before SO2
1642 cm-1
1900 1850 1800 1750 1700 1650 1600 1550
Abs
orba
nce
(AU
)
Wavenumber (cm-1)
1 h after stopping SO23 h SO2
Before SO2
1608 cm-1
1900 1850 1800 1750 1700 1650 1600 1550
Abs
orba
nce
(AU
)
Wavenumber (cm-1)
Before SO21 h after stopping SO2
3 h SO2
1598 cm-1
1900 1850 1800 1750 1700 1650 1600 1550
Abs
orba
nce
(AU
)
Wavenumber (cm-1)
1 h after stopping SO2
3 h SO2
Before SO2
1610 cm-1

88
CopCat-Ni2Co4 than for ImpCat-Ni2CO3, suggesting that impregnated catalysts are more
resistant to SO2 poisoning than coprecipitated catalysts.
The formation of sulfates involves attachment of SO2 to oxygen, similar to the attachment of
CO2 or CO to oxygen to form carbonates. The formation of sulfates might compete with the
formation of carbonates. For this reason, experiments were conducted to determine if the
concentration of carbonates produced by CO is reduced by the presence of SO2. It was confirmed
that carbonates disappeared or, at least, were substantially reduced by the presence of SO2
(Figure 4-32). Kylhammar et al. (2011) also observed the removal of surface carbonates upon
introduction of SO2. Therefore, it is suggested that the formation of sulfates scavenge the oxygen
available on the catalyst surface, preventing the formation of carbonates by CO2 and CO. The
previous suggestion is in agreement with Anderson et al. (2006) who reported that SOx species
restrained the formation of carbonates on Pt/Ba/Al2O3 catalysts.
Figure 4-32. Decrease of the concentration of carbonates after the introduction of SO2.
CopCat-Ni2Co4 CopCat-Ni4
ImpCat-Co5 ImpCat-Ni2Co3
1700 1650 1600 1550
1620 cm-1
Ku
be
lka
-Mu
nk (
AU
)
Wavenumber (cm-1)
CO
CO+SO2
1700 1650 1600 1550
1618 cm-1
Ku
be
lka
-Mu
nk (
AU
)
Wavenumber (cm-1)
CO+SO2
CO
1700 1650 1600 1550
Ku
be
lka
-Mu
nk (
AU
)
Wavenumber (cm-1)
CO+SO2
CO
1620 cm-1
1700 1650 1600 1550
Ku
be
lka
-Mu
nk (
AU
)
Wavenumber (cm-1)
CO+SO2
CO
1624 cm-1

89
Figure 4-32. Decrease of the concentration of carbonates after the introduction of SO2
(continued)
It is not clear what causes the position of the carbonates. Neither is clear if the sulfates attack firs
to the carbonates and that produces a reduction in the concentration of adsorbed CO or viceversa.
However, it has been proved that both species are decreased in the presence of sulfur dioxide.
4.5.3 Proposed mechanism for SO2 poisoning
The presence of SO2 does not seem to have caused significant change on species associated to
CH4 and CO2 adsorption. Its impact on the formation of sulfate, carbonate and CO on all the
catalyst samples including the support should be analyzed.
Reconciling the two observations of the negative peak (OH- consumption) and the peak at about
1358 cm-1
(sulfate formation), it is suggested that the formation of sulfates occur on Ni or Co
metal sites as well on the support by the following mechanisms:
CopCat-Ni2Co4 CopCat-Ni4
ImpCat-Co5 ImpCat-Ni2Co3
1700 1650 1600 1550
1620 cm-1
Ku
belk
a-M
un
k (
AU
)
Wavenumber (cm-1)
CO
CO+SO2
1700 1650 1600 1550
1618 cm-1
Kub
elk
a-M
un
k (
AU
)
Wavenumber (cm-1)
CO+SO2
CO
1700 1650 1600 1550
Kub
elk
a-M
un
k (
AU
)
Wavenumber (cm-1)
CO+SO2
CO
1620 cm-1
1700 1650 1600 1550
Ku
belk
a-M
un
k (
AU
)
Wavenumber (cm-1)
CO+SO2
CO
1624 cm-1

90
Ni(OH)2 + SO2(g) →Ni(SO3) + H2O (4.7)
NiO+SO2 →Ni(SO3) (4.8)
Ni(SO3) + 2OH- →NiSO4 + H2O (4.9)
Co(OH)2 + SO2(g) →Co(SO3) + H2O (4.10)
CoO+SO2 →Ni(SO3) (4.11)
Co(SO3) + 2OH- →CoSO4 + H2O (4.12)
Mg(OH)2 + SO2(g) →Mg(SO3) + H2O (4.13)
MgO+SO2 →Mg(SO3) (4.14)
Mg(SO3) + 2OH- →MgSO4 + H2O (4.15)
To recapitulate, hydroxyl consumption was shown by the presence of SO2. The proposed
mechanism suggests that sulfites are formed first, and sulfates are formed in the further step. The
peak at about 1358 cm-1
for all catalysts confirm the presence of sulfates. These sulfate species
seem to interfering with the formation of carbonates and carbonyl on the surface of the catalysts.

91
CHAPTER 5. CONCLUSIONS AND RECOMMENDATIONS
5.1 CONCLUSIONS
The conclusions that can be drawn from this study are the following:
5.1.1 Mechanism of dry reforming of methane
The mechanism of dry reforming of methane on Ni-Co/AlMgOx catalysts was observed to occur
by the following steps:
-Methane adsorption and possibly dissociation into C, CHx and H2. The presence of bands at the
OH- region could have been caused by dissociated hydrogen bonding to oxygen present in the
catalysts, suggesting methane dissociation.
- Carbon dioxide adsorption and dissociation into CO.
- Formation of carbonates (all the catalysts tested showed the ability to form carbonates).
-It was observed a relationship between the concentration of carbonates and the concentration of
CO adsorbed on the catalysts surfaces.

92
The catalyst preparation method affects the reducibility of the catalysts and the oxides content.
Formation of carbonates was higher in catalysts with higher oxygen content, such as the support
and Copcat-Co6.
5.1.2 Effect of H2S on dry reforming of methane
When H2S interacted with the catalysts, it was observed a negative band in the region between
3730-3720 cm-1
, suggesting OH- consumption.
For nickel-containing catalysts, either monometallic or bimetallic, the methane and CO2
adsorption bands decreased in the presence of H2S. Interestingly, the catalysts containing only
cobalt (CopCat-Co6 and ImpCat-Co5) showed the opposite trend: the methane and CO2
adsorption intensities increased in the presence of hydrogen sulfide, this might suggest that H2S
helps to reduce cobalt.
The concentration of carbonates was reduced in the presence of H2S. For the cobalt
monometallic catalyst, ImpCat-Co5, the decrease in the carbonates band during H2S feed was not
as obvious as for nickel-containing catalysts CopCat-Ni4, CopCat-Ni2Co4 and ImpCat-Ni5,
suggesting that the monometallic cobalt catalyst ImpCat-Co-5 is harder to poison by H2S than
the nickel-containing catalysts. For coprecipitated catalysts CopCat-Ni2CO4 and Copcat-Ni4,
the decrease in the concentration of carbonates in the presence of H2S was higher than for the
impregnated catalyst ImpCat-Ni5. This suggests that impregnated catalysts are more resistant to
H2S poisoning than coprecipitated catalysts.

93
Carbonyl sulfide, instead of adsorbed CO, was found on all catalysts after the interaction with
H2S during dry reforming of methane. Carbonyl sulfide was reversible upon stopping H2S feed.
5.1.3 Effect of SO2 on dry reforming of methane
When SO2 interacted with the catalysts, a negative band was observed, suggesting OH-
consumption. Sulfates were also detected in the presence of SO2. The mechanism proposed is
that the consumption of OH-
functional groups by SO2 leads to formation of sulfates. Sulfates
might be responsible for the decrease in concentration of CO and carbonates. The decrease in the
concentration of carbonates band was higher for CopCat-Ni4 than for CopCat-Co6, suggesting
than cobalt catalysts are harder to poison by SO2 than nickel catalysts. Similarly, the decrease in
the concentration of carbonates was higher for CopCat-Ni2Co4 than for ImpCat-Ni2CO3,
suggesting that impregnated catalysts are more resistant to SO2 poisoning than coprecipitated
catalysts.
5.2 RECOMMENDATIONS
1. To determine by X-ray absorption spectroscopy the formation of sulfides such as NiS,
CoS and MgS. Also, to determines the types of sulfates formed such as NiSO4, CoSO4,
Al2(SO4)3, MgSO4.
2. To determine how the mechanism of poisoning by H2S and SO2 changes at actual
reaction temperature for DRM (700 oC and higher).

94
3. To study the simultaneous interaction of H2S and SO2. However, this could form
elemental sulfur (S) that could block the reactor and piping, unless precautions are taken
to prevent this problem.
4. To determine the effect of other sulfur compounds found in natural gas such as
mercaptans, dimethyl sulphide, carbonyl sulphide, etc.
5. To determine the effect of H2S or SO2 at actual concentrations in feedstock for DRM
after desulfurization process.
6. To obtain integral information about the poisoning mechanism using operando
spectroscopy. This would allow to determine the activity and spectroscopic information
at the same time for DRM in the presence of H2S and SO2.

95
REFERENCES
Aasberg-Petersen, K., Christensen, T. S., Nielsen, C. T. & Dybkjaer, I. “Recent developments in
autothermal reforming and pre-reforming for synthesis gas production in GTL
applications.” Fuel Processing Technology 83, 253-261 (2003).
Abdulhamid, H., Fridell, E., Dawody, J. & Skoglundh, M. “In situ FTIR study of SO2 interaction
with Pt/BaCO3/Al2O3 NOx storage catalysts under lean and rich conditions.” Journal of
Catalysis 241, 200–210 (2006).
Agrawal, P. “Surface and reaction studies of the poisoning of transition metal methanation
catalysts.” (1979).
Anderson, J. A., Liu, Z., Fernandez Garcia, M. “Use of in situ FT-IR and XAS/XRD to study
SO2 poisoning over model Pt/Ba/Al2O3 NOx storage and reduction (NSR) catalysts.”
Catalysis Today 113, 25-33 (2006).
Armaroli, T., Becue, T. & Gautier, S. “Diffuse Reflection Infrared Spectroscopy (DRIFTS):
Application to the in situ analysis of catalysts.” Oil and Gas Science and Technology. Vol
9, 215-237 (2004).
Aoki, K., Yamawaki, H. & Sakashita, M. “Phase study of solid CO2 to 20 GPa by infrared-
absorption spectroscopy.” Physical Review B. Volume 48, Number 13 (1993).
96
Ashcroft, A. T., Cheetham, A. K., Green, M. L. H. “Partial oxidation of methane to synthesis gas
using carbon dioxide.” Letters to Nature (1991).
Ashrafi, M., Pfeifer, C., Proll, T. & Hofbauer, H. “Experimental study of model biogas catalytic
steam reforming: 2. Impact of Sulfur on the deactivation and regeneration of Ni-based
catalysts.” Energy & Fuels, 22, 4190-4195 (2008).
Ayabe, S., Omoto, H., Utaka, T., Kikuchi, R., Sasaki, K., Teraoka, Y., Eguchi, K. “Catalytic
autothermal reforming of methane and propane over supported metal catalysts.” Applied
Catalysis A: General 241, 261-229 (2003).
Bachiller-Baeza, B., Mateos-Pedrero, C., Soria, M. a., Guerrero-Ruiz, a., Rodemerck, U., &
Rodríguez-Ramos, I. “Transient studies of low-temperature dry reforming of methane
over Ni-CaO/ZrO2-La2O3.” Applied Catalysis B: Environmental, 129, 450–459 (2013).
Barnes, I., Becker, K. H., Patroescu, I. “FTIR product study of the OH initiated oxidation of
dimethyl sulphide: Observation of carbonyl sulphide and dimethyl sulphoxide.” (1995).
Barrai, F., Jackson, T., Whitmore, N., Castaldi, M. J. “The role of carbon deposition on precious
metal catalyst activity during dry reforming of biogas.” Catalysis Today 129, 391-396
(2007).
Bartholomew, C. H. “Mechanisms of catalyst deactivation.” Applied Catalysis A: General,
212(1-2), 17–60 (2001).
Bitter, J. H., Seshan, K., & Lercher, J. A. “On the contribution of X-ray absorption spectroscopy
to explore structure and activity relations of Pt / ZrO2 catalysts for CO2/CH4 reforming.”
10, 295–305 (2000).
Bitter, J. H., Seshan, K., Lercher, J. A. “The state of zirconia supported platinum catalysts for
CO2/CH4 reforming.” Journal of catalysis 171, 279-286 (1997).

97
Bradford, M. C. J., & Albert, M. V. A : “Catalytic reforming of methane with carbon dioxide
over nickel catalysts II. Reaction kinetics”. (1996).
Bradford, M. C. J. & Vannice, M. A. “CO2 reforming of methane.” Catalysis Reviews: Science
and Engineering. (2007).
Buekens, A. “Energy recovery from residual waste by means of anaerobic digestion
technologies.” Conference: “The future of residual waste management”. (2005).
Cengel, Y. U. & Boles, M. A. “Thermodynamics. An engineering approach.” Seventh edition.
Mc Graw Hill, (2011).
Centi, G. & Perathoner, S. “Opportunities and prospects in the chemical recycling of carbon
dioxide to fuels.” Catalysis Today 149, 191-205. (2009).
Cheekatamarla, P. K. & Lane, A. M. “Catalytic autothermal reforming of diesel fuel for
hydrogen generation in fuel cells. I. Activity tests and sulfur poisoning.” Journal of
Power Sources. (2005).
Chen, Y., Xie, C., Li, Y., Song, C. & Bolin, T. B. “Sulfur poisoning mechanism of steam
reforming catalysts: an X-ray absorption near edge structure (XANES) spectroscopic
study.” Phys. Chem. Chem. Phys. 12, 5707-5711 (2010).
Choudhary, T. V., Aksoylu, E. & Goodman, D. W. “Nonoxidative oxidation of methane.”
Catalysys Reviews Vol. 45, No. 1, pp. 151–203 (2003).
Choudhary, T. V. & Goodman, D. W. “Methane decomposition: Production of hydrogen and
carbon filaments.” Catalysis, 19, 164–183 (2006).
Choudhary, T. V., Sivadinarayana, C., Goodman, D. W. “Production of COx-free hydrogen for
fuel cells via step-wise hydrocarbon reforming and catalytic dehydrogenation of
ammonia.” Chemical Engineering Journal 93, 69-80 (2003).

98
Christensen, T. S., Christensen, P. S., Dybkjaer, I., Hansen, J. H. B. & Primdahl, I. I.
“Developments in autothermal reforming.” Studies in Surface Science and Catalysis. Vol
119. (1998).
Cui, Y., Zhang, H., Xu, H., & Li, W. “Kinetic study of the catalytic reforming of CH4 with CO2
to syngas over Ni/α-Al2O3 catalyst: The effect of temperature on the reforming
mechanism.” Applied Catalysis A: General, 318, 79–88 (2007).
Czekaj, I., Struis, R., Wambach, J. & Biollaz, S. “Sulphur poisoning of Ni catalysts used in the
SNG production from biomass: Computational studies.” Catalysis Today 176, 429-432
(2011).
Datta, A. & Cavell, R. G. “Adsorption of SO2 on the alumina catalyst studied by FTIR and EPR
spectroscopy.” J. Phys. Chem. 89, 443-449 (1985).
Datta, A. & Cavell, R. G., “An FTIR Study of the sequential adsorption of SO2 and H2S on the
alumina catalyst.” J. Phys. Chem. 89, 454-457 (1985).
Davidson, J. M. & Sohail, K. “A DRIFTS study of the surface and bulk reactions of hydrogen
sulfide with high surface area zinc oxide.” Ind. Eng. Chem. Res. 34, 3675-3677 (1995).
Dowden, D.A., Schnell, C.R., and Walker, G.T., “The design of complex catalysts,” Fourth
International Congress on Catalysis, Rice University, Houston, pages 1120-1131 (1968).
Erdőhelyi, A., Fodor, K., & Solymosi F. “Reaction of CH4 with CO2 and H2O over supported Ir
catalyst.” Studies in Surface Science and Catalysis (1997).
Erdőhelyi, A., Fodor, K., & Szailer, T. “Effect of H2S on the reaction of methane with carbon
dioxide over supported Rh catalysts.” Applied Catalysis B: Environmental, 53(3), 153–
160 (2004).
Epa.gov/climatechange/ghgemissions/usinventoryreport.html

99
Epa.gov/climate/climatechange/science/indicators/ghg/index.html
Figoli, N. S. & Argentiere, P. C. L. “Regeneration of Ni/SiO2 poisoned with carbon disulfide.”
Catalysis Letters 38, 171-174 (1996).
Gangadharan, P., Kanchi, K. C., Lou, H. H. “Evaluation of the economic and environmental
impact of combining dry reforming of methane with steam reforming of methane.”
Chemical Engineering Research and Design 90, 1956-1968 (2012).
Goula, M. A., Lemonidou, A. A., & Efstathiou, A. M. “Characterization of Carbonaceous
Species Formed during Reforming of CH4 with CO2 over Ni/CaO–Al2O3 Catalysts
Studied by Various Transient Techniques.” 640(0225), 626–640 (1996).
Gracia, F. J., Guerrero, S., Wolf, E. E., Miller, J. T. & Kropf, A. J. “Kinetics, operando FTIR,
and controlled atmosphere EXAFS study of the effect of sulfur on Pt-supported catalysts
during CO oxidation.” Journal of Catalysis 233, 372-387 (2005).
Greene, E. F., Tauch, S., Webb, E. & Amarasiriwardena, D. “Application of diffuse reflectance
infrared Fourier transform spectroscopy (DRIFTS) for the identification of potential
diagenesis and crystallinity changes in teeth.” Microchemical Journal 76, 141-149
(2004).
Haldor Topsoe. Steam reforming catalysts. www.haldortopsoe.com
Hashemnejad, S. M. & Parvari, M. “Deactivation and regeneration of nickel-based catalysts for
Steam-methane reforming.” Chinese Journal of catalysis 32, 273-279 (2011).
Hattori, S., Schmidt, J. A., Mahler, D. W., Danielache, S. O., Johnson, M. S., Yoshida, N.
“Isotope Effect in the Carbonyl Sulfide Reaction with O(3P).” The Journal of Physical
Chemistry. (2012).

100
Hauchecorne, B. & Lenaerts, S. “Unravelling the mysteries of gas phase photocatalytic reaction
pathways by studying the catalyst surface: A literature review of different Fourier
transform infrared spectroscopy reaction cells used in the field.” Journal of
Photochemistry and Photobiology C: Photochemistry Reviews 14, 72– 85 (2013).
Hickman, D. A. & Schmidt, L. D. “Production of syngas by direct catalytic oxidation of
methane.” Science Magazine (2015).
Highfield, J., Prairie, M., Renken, A. “In-situ DRIFT spectroscopy in a continuous recycle
reactor.” 9, 39–46 (1991).
Hongbo, W., Xiao, W., Jianmin, C., Hongkun, Y., Huaxin, X., Xunxi, P., Huiqi, H. “Mechanism
of the heterogeneous reaction of carbonyl sulfide with typical components of atmospheric
aerosol.” Chinese Science Bulletin. (2004).
Hu, Y., Liu, Z., Xu, J., Huang, Y., & Song, Y. “Evidence of Pressure Enhanced CO2 Storage in
ZIF - 8 Probed by FTIR Spectroscopy.” (2013).
Hubbard, C. P., Otto, K., Gandhi, H. S., Ng, K. Y. S. “Effects of support material and sulfation
on propane oxidation activity over platinum.” Journal of Catalysis, 144, 484-494 (1993).
Huber, S. & Knozinger, H. “FTIR spectroscopic studies of methane adsorption on sodium and
cesium containing Y-zeolites.” Chemical Physics Letters 244, 111-116 (1995).
Jones, J. M., Dupont, V. A., Brydson, R., Fullerton, R. J., Nasri, N. S., Ross, A. B. & Westwood,
A. V. K. “Sulphur poisoning and regeneration of precious metal catalysed methane
combustion.” Catalysis Today 81, 589-601 (2003).
Joseph, J. & Jemmis, E. D. “Red-, Blue-, or No-Shift in Hydrogen Bonds: A Unified
Explanation.” JACS Articles (2007).

101
Jones, J. M., Dupont, V. A., Brydson, R., Fullerton, D. J., Nasri, N. S., Ross, A. B., Westwood,
A. V. K. “Sulphur poisoning and regeneration of precious metal catalyzed methane
combustion.” Catalysis Today, 589-601 (2003).
Kathiraser, Y., Wang, Z. & Kawi, S. “Oxidative CO2 reforming of methane in
La0.6Sr0.4Co0.8Ga0.2O3-ᵟ (LSCG) Hollow Fiber Membrane Reactor.” Environmental
Science and Technology 47, 14510−14517 (2013).
Kitla, A., Safonova, O. V., Fottinger, K. “Infrared studies on bimetallic copper/nickel catalysts
supported on zirconia and ceria/zirconia.” Springerlink.com (2013).
Kroll, V. C. H., Swaan, H. M., Lacombe, S., & Mirodatos, C. “Methane Reforming Reaction
with Carbon Dioxide over Ni / SiO2 Catalyst.” (1997).
Kylhammar, L., Carlsson, P-A. & Skoglundh, M. “Sulfur promoted low-temperature oxidation of
methane over ceria supported platinum catalysts.” (2011).
Liu, J., Yu, Y., Mu, Y. & He, H. “Mechanism of Heterogeneous Oxidation of Carbonyl Sulfide
on Al2O3: An in Situ Diffuse Reflectance Infrared Fourier Transform Spectroscopy
Investigation.” J. Phys. Chem. B, 110, 3225-3230 (2006).
Luo, T. & Gorte, R. J.” Characterization of SO2-poisoned ceria-zirconia mixed oxides.” Applied
Catalysis B: Environmental 53, 77–85 (2004).
Matsumura, Y. & Nakamori, T. “Steam reforming of methane over nickel catalysts at low
reaction temperature.” Applied Catalysis A: General 258, 107-114 (2004).
Mescia, D., Hernandez, S. P., Conoci, A., Russo, N., “MSW landfill biogas desulfurization.”
Science Direct. (2011).

102
Morlanés, N. “Reaction mechanism of naphtha steam reforming on nickel-based catalysts, and
FTIR spectroscopy with CO adsorption to elucidate real active sites.” International
Journal of Hydrogen Energy, 38(9), 3588–3596 (2013).
Nakamura, J., Aikawa, K., Sato, K. & Uchijima, T. “Role of support in reforming of CH4 with
CO2 over Rh catalysts.” Catalysis Letters 25, 265-270 (1994).
Padley, M. B., Rochester, C. H., Hutchings, G. J. & King, F. “FTIR spectroscopic study of
thiophene, SO2, and CO adsorption on Cu/Al2O3 catalysts.” Journal of Catalysis 148,
438-452 (1994).
Pakhare, D., Schwartz, V., Abdelsayed, V., Haynes, D., Shekhawat, D., Poston, J. & Spivey, J.
“Kinetic and mechanistic study of dry (CO2) reforming of methane over Rh-substituted
La2Zr2O7 pyrochlores.” Journal of Catalysis 316, 78–92 (2014).
Pan, Q., Peng, J., Sun, T., Wang, S. & Wang, S. “Insight into the reaction route of CO2
methanation: Promotion effect of medium basic sites.” Catalysis Communications 45, 74-
78 (2014).
Pichas, C., Pomonis, P., Petrakis, D., Ladavos, A. “Kinetic study of the catalytic dry reforming
of CH4 with CO2 over La2-xSrxNiO4 perovskite-type oxides.” Applied Catalysis A;
General 386, 116-126 (2010).
Poulston, S. & Rajaram, R. R. “Regeneration of NOx trap catalysts.” Catalysis Today 81, 603-
610 (2003).
Priya, K. S., Abatzoglou, N., Blais, S. “Inhibition of carbon formation during steam reforming of
methane over ethyldisulfide-impregnated metallic nickel catalysts.” Catalysis Today 207
21-27 (2012).

103
Rahemi, N., Haghighi, M., Babaluo, A. A., Jafari, M. F., & Estifaee, P. “Synthesis and
physicochemical characterizations of Ni/Al2O3–ZrO2 nanocatalyst prepared via
impregnation method and treated with non-thermal plasma for CO2 reforming of CH4.”
Journal of Industrial and Engineering Chemistry, 19(5), 1566–1576 (2013).
Rahemi, N., Haghighi, M., Babaluo, A. A., Jafari, M. F., & Estifaee, P. “Syngas production via
CO2 reforming of methane over plasma assisted synthetized Ni-Co/Al2O3-ZrO2
nanocatalysts with different Ni loadings.” International Journal of Energy Research.
(2013).
Rangan, M., Yung, M. M., & Medlin, J. W. “Experimental and computational investigations of
sulfur-resistant bimetallic catalysts for reforming of biomass gasification products.”
Journal of Catalysis, 282(2), 249–257 (2011).
Reding, F. P., & Hornig, D. F. “Vibrational Spectra of Molecules and Complex Ions in Crystals.
X. H2S and D2S.” The Journal of Chemical Physics, 27(5) (1957).
Rest, A. J., Warren, R., Murray, S. C. “Assignment of the overtones and combination bands for
liquid methane across the near infrared spectrum.” (1996).
Rodrigues, L. M. T. S., Silva, R. B., Rocha, M. G. C., Bargiela, P., Noronha, F. B., Brandao, S.
T. “Partial oxidation of methane on Ni and Pd catalysts: Influence of active phase and
CeO2 modification.” Catalysis Today 197, 137-143 (2012).
Rodriguez, J. A., Jirsak, T., Hrbek, J. “Reaction of SO2 with cesium and cesium-promoted ZnO
and MoO2.” J. Phys. Chem, 103, 1966-1976 (1999).
Rostrup-Nielsen, J., Hansen, J. “CO2 Reforming of methane over Transition metals.” Journal of
Catalysis, 144, 38-49 (1993).
Rostrup-Nielsen, J. R. “Promotion by poisoning.” Catalyst Deactivation (1991).

104
Rostrup-Nielsen, J. R., “Sulfur-passivated nickel catalysts for carbon-free steam reforming of
methane.” Journal of Catalysis, 85, 31-43 (1984).
Rostrup-Nielsen, J. R., “New aspects of syngas production and use.” Catalysis Today 63, 159-
164 (2000).
Ruckenstein, E., & Hu, Y. H. “Carbon dioxide reforming of methane over nickel/alkaline earth
metal oxide catalysts.” Applied Catalysis A: General, 133(1), 149–161 (1995).
Ruckenstein, E. & Wang, H. Y. “Carbon dioxide reforming of methane to synthesis gas over
supported cobalt catalysts.” Applied Catalysis A: General 204, 257-263 (2000).
Saha, B., Khan, A., Ibrahim, H. & Idem, R. “Evaluating the performance of non-precious metal
based catalysts for sulfur-tolerance during the dry reforming of biogas.” Fuel 120, 202–
217 (2014).
San-José-Alonso, D., Juan-Juan, J., Illán-Gómez, M. J., & Román-Martínez, M. C. “Ni, Co and
bimetallic Ni–Co catalysts for the dry reforming of methane.” Applied Catalysis A:
General, 371(1-2), 54–59 (2009).
Sato, K., & Fujimoto, K. “Development of new nickel based catalyst for tar reforming with
superior resistance to sulfur poisoning and coking in biomass gasification.” Catalysis
Communications, 8(11), 1697–1701 (2007).
Scarano, D., Bertarione, S., Spoto, G., Zecchina, A., & Arean, C. O. “FTIR spectroscopy of
hydrogen, carbon monoxide and methane adsorbed and co-adsorbed on zinc oxide.”
(2001).
Schuurman, Y., Marquez-Alvarez, C., Kroll V. C. H., Mirodatos, C. “Unraveling mechanistic
features for the methane reforming by carbon dioxide over different metals and supports
by TAP experiments.” Catalysis Today 46 185-192 (1998).

105
Schwack, P., Hamilton, N., Eichelbaum, M., Thum, L., Lunkenbein, T. & Schlogl, R. “Structure
sensitivity of the oxidative activation of methane over MgO model catalysts: II. Nature of
active sites and reaction mechanism.” Journal of Catalysis 329, 574-587 (2015).
Sehested, J. “Sintering of nickel steam-reforming catalysts.” Journal of Catalysis, 217, 417–426
(2003).
Sehested, J. “Sintering of nickel steam-reforming catalysts: effects of temperature and steam and
hydrogen pressures.” Journal of Catalysis, 223(2), 432–443 (2004).
Shakouri, M. “Effects of preparation, Ni/Co ratio and sulfure poisoning of Ni-Co bimetallic
catalysts for dry reforming reaction.” A thesis submitted to the College of Graduate
Studies and Reearch. University of Saskatchewan. (2011).
Silverstein, R. M., Webster, F. X., Kiemle, D. J. “Spectrometric identification of organic
compounds.” 7ed- Webster & kiemle.pdf. John Wiley & Sons, Inc. (2005).
Smith, B. C. “Infrared spectral interpretation.” A Systematic Approach. CRC Press. (1999).
Song, C. & Pan, W. “Tri-reforming of methane: a novel concept for catalytic production of
industrially useful synthesis gas with desired H2/CO ratios.” Catalysis Today 98, 463-484
(2004).
Sun, H. “Preparation and Evaluation of Sol-Gel Made Nickel Catalysts for Carbon Dioxide
Reforming of Methane.” University of Saskatchewan MSc thesis. (2005).
Takanabe, K., Nagaoka, K., Nariai, K., & Aika, K. “Titania-supported cobalt and nickel
bimetallic catalysts for carbon dioxide reforming of methane.” Journal of Catalysis,
232(2), 268–275 (2005).
Taleghani, G., Kia, A. S. “Technical-economical analysis of the Saveh biogas power plant.”
Renewable Energy 30, 441-446 (2005).

106
Tang, S., Ji, L., Lin, J., Zeng, H. C., Tan, K. L., & Li, K. “CO2 Reforming of Methane to
Synthesis Gas over Sol–Gel-made Ni/γ-Al2O3 Catalysts from Organometallic
Precursors.” Journal of Catalysis, 194(2), 424–430 (2000).
Teuner, S. C., Neumann, P., Von Linde, F. “The Calcor standard and Calcor economy
processes.” OIL GAS European Magazine (2001).
Toops, T. J. & Crocker, M. “New sulfur adsorbents derived from layered double hydroxides II.
DRIFTS study of COS and H2S adsorption.” Applied Catalysis B: Environmental 82 ,
199–207 (2008).
Tsipouriari, V. A., Verykios, X. E. “Carbon and oxygen reaction pathways of CO2 reforming of
methane over Ni/La2O3 and Ni/Al2O3 catalysts studied by isotopic tracing techniques.”
Journal of Catalysis 187, 85-94 (1999).
Tsipouriari, V. A., & Verykios, X. E. “Kinetic study of the catalytic reforming of methane with
carbon dioxide to synthesis gas over Ni/La2O3 catalyst.” Catalysis Today 64, 83–90
(2001).
Udengaard, N.R.; Hansen, J.-H. B.; Hanson, D. C.; Stal, J. A., “Sulfur passivated reforming
process lowers syngas H2/CO ratio”, Oil & Gas Journal, 90, 62 (1992).
Wang, H., Miller, J. T., Shakouri, M., Xi, C., Wu, T., Zhao, H., Akatay, M. C. “XANES and
EXAFS studies on metal nanoparticle growth and bimetallic interaction of Ni-based
catalysts for CO2 reforming of CH4.” Catalysis Today 207, 3-12 (2013).
Wilhelm, D. J., Simbeck, D. R., Karp, A. D., Dickenson, R. L. “Syngas production for gas-to-
liquids applications: technologies, issues and outlook.” Fuel Process Technology 71, 139-
148 (2001).
Yadav, L. D. S. “Organic spectroscopy.” Springer-Science+Business Media, B.V. (2005).

107
Zhang, J., “Research and development of nickel based catalyst for carbon dioxide
formation of methane.” PhD thesis, department of chemical engineering, University of
Saskatchewan (2008).
Zhang, J., Wang, H., & Dalai, A. “Development of stable bimetallic catalysts for carbon dioxide
reforming of methane.” Journal of Catalysis, 249(2), 300–310 (2007).
Zhang, J., Wang, H. & Dalai, A. K. “Effects of metal content on activity and stability of Ni-Co
bimetallic catalysts for CO2 reforming of CH4.” Applied Catalysis A: General 339, 121-
129 (2008a).
Zhang, J., Wang, H. & Dalai, A. K. “Kinetic Studies of Carbon Dioxide Reforming of Methane
over Ni-Co/Al-Mg-O Bimetallic Catalyst”. Ind. Eng. Chem. Res. 2009, 48, 667-684
(2009b).
Zhang, J., Wang, H., Xi, C., Shakouri, M., Hu, Y. & Dalai, A. K. “Design and Preparation of Ni-
Co Bimetallic Nanocatalyst for Carbon Dioxide Reforming of Methane.” American
Chemical Society (2012).
Zhao, L., Li, X., Quan, X. & Chen, G. “Effects of Surface Features on Sulfur Dioxide
Adsorption on Calcined NiAl Hydrotalcite-like Compounds.” Environ. Sci. Technol. 45,
5373–5379 (2011).

108
APPENDIX A: FUNDAMENTALS OF FTIR SPECTROSCOPY
Since FTIR spectroscopy was the main technique used to conduct this research, it will be
described the fundamentals of this technique in the following paragraphs,
Infrared spectroscopy is the recording of the absorption of photons in the infrared region of the
electromagnetic spectrum. The infrared radiation is a range in the electromagnetic spectrum
between 14000-4 cm-1
as shown in Figure A-1.
Figure A-1. The electromagnetic spectrum.
>14000 cm-1
14000-4000 cm-1
4000-400 cm-1
400-4 cm-1
<4 cm-1
Visible, UV and
X-rays
→
Higher energy Lower energy
Higher frequency Lower frequency
Higher wavenumber Lower wavenumber
Shorter wavelength Longer wavelength
Near infrared Mid infrared Far infrared Microwaves

109
The conversion between wavenumber, energy, frequency and wavelength can be carried out with
the following formulas (Smith, 1999).
Wavenumber to wavelength.
W=1/λ (A-1)
where W=wavenumber in cm-1
and λ= wavelength in cm-1
.
Wavelength to frequency.
λ=c/v (A-2)
where c=the speed of light (3x10¹⁰
cm/second) and v= frequency in Hertz (sec-1
).
Energy to wavelength.
E=hcW (A-3)
where E= photon energy in eV and h= Planck´s constant (4.14x10⁻¹⁵
eV-second).
Infrared radiation causes quantized vibrational and rotational changes when it is absorbed by
molecules. Therefore, infrared spectroscopy is also called vibrational-rotational spectroscopy
(Yadav, 2005). Infrared radiation below 100 cm-1
causes transitions in the rotational energy of
the molecule, producing discrete lines in the spectra. On the contrary, infrared radiation in the
range 100-10000 cm-1
produces transitions in the vibrational energy levels. In this case, the
vibration of the molecules are noticed in the spectra as bands rather than as lines. Most of the
chemists employ infrared spectroscopy in the range 4000-667 cm-1
(Yadav, 2005).
Vibration in a molecule is caused when a photon with the necessary energy impinges a molecule.
This vibration, or mode, is generally of two types: stretching vibration or bending vibration.

110
(Yadav, 2005). Stretching vibrations involve the contraction or lengthening of two atoms in the
same original bond axis. Stretching vibrations can be of two types: symmetric and
antisymmetric. Symmetric stretching vibrations occur when the movements of two atoms with
respect to the same common atom is in the same direction along the same bond axis. On the
contrary, antisymmetric vibration involves the movement of two different atoms with respect to
the same common atom in different directions (Figure A-2).
Figure A-2. Stretching vibrations (symmetrical and asymmetrical) of the CO2 molecule
(Silverstein et al., 2005).
Bending vibration occurs when two atoms in a bond change of position with respect to the
original bond axis. There are four types of bending vibrations: scissoring, rocking, wagging and
twisting (Figure A-3).

111
Figure A-3. Bending vibrations for a CH2 group (+ and – denote movements perpendicular to
the plane of the sheet) (Yadav, 2005).
Infrared spectra display only vibrations that result in a change in the dipole moment in a
molecule. In some cases bands cannot be observed such as fundamental vibrations that coalesce
and appear as one; very weak bands or; degenerate bands caused by various absorptions of the
same frequency in symmetrical molecules (Silverstein et al., 2005).
Different Fourier Transform Infrared Spectroscopy Techniques exist such as Transmission-
Absorption Spectroscopy and Diffuse Reflectance Infrared Spectroscopy.
Transmission-Absorption spectroscopy is useful only if the sample absorbs infrared radiation
weakly. In this method, the radiation is transmitted through a sample, and the molecules in the
sample will absorb part of the energy. The negative logarithm of the ratio of the energy received

112
over the transmitted energy (Equation A-4) generates a spectrum in absorbance units. In this
technique, the spectra follow the Lambert-Beer Law and therefore it is possible to obtain
quantitative information.
Absorbance=-
(A-4)
where is the radiant energy received by the sample and is the radiant energy transmitted by
the sample.
Other FTIR spectrometric technique is Diffuse Reflectance Infrared Fourier Transform
Spectroscopy (DRIFTS). The radiation focused on a molecule could either be absorbed, directly
reflected (in a specular manner for polished surfaces) or diffused in all directions. This last effect
is exploited by Diffuse Reflectance Infrared Fourier Transform Spectroscopy (Armaroli et al.,
2004). For DRIFTS, the Lambert-Beer law used in Transmission-Absorption spectroscopy is not
applicable and instead the Kubelka-Munk equation is applied (Hauchecorne and Lenaerts, 2013):
KM=
(A-5)
where KM is the Kubelka-Munk dimensionless unit, R∞ is the reflectance of an infinitely thick
layer, k is the absorption coefficient, s is the diffusion or scattering factor, ɛ is the molar
absorptivity and, c is the sample concentration. The scattering coefficient depends on the
wavelength of the photon, particle size and shape. It is possible to obtain quantitative information
by DRIFTS when the scattering coefficient is constant. However, this condition is hardly
achieved (Hauchecorne and Lenaerts, 2013). Other properties of the sample that affect the

113
DRIFTS spectra are the refractive index, packing density, homogeneity, concentration and
absorption coefficients (Armaroli et al., 2004). If the sample is very absorbent, it could
significantly affect the spectra, making it necessary to dilute the sample in KBr or another non-
absorbent matrix.
DRIFTS, although less used than transmission infrared spectroscopy, is a very valuable
technique to characterize non-transparent materials in situ at elevated temperatures. One
advantage of this method is the easiness of sample preparation (Armaroli et al., 2004). DRIFT
spectra can be collected in absorbance units as well as in Kubelka-Munk units (Greene et al.,
2004). The main disadvantages of this technique are the difficulty in obtaining quantitative
measurements and repetitive measurements due to differences in sample preparation in different
experiments. Since the temperature affects the bandwidth and intensity, it is important to collect
the spectra at the same temperature if samples need to be compared (Armaroli et al., 2004).
In the present work, some of the spectra are expressed in absorbance units and others are
expressed in Kubelka-Munk (KM) units.
3.4.1 Factors that affect the vibrational frequencies
Symmetric vibrations can be approximately calculated by the Hooke’s law when two atoms and
their connecting bond are treated as two masses united by a spring. The Hooke’s law relates the
frequency of the vibration, the force constant of the connecting bond and the two atomic masses
united by the bond according to Equation A-6.
(A-6)

114
where is the vibrational frequency in cm-1
; c is the speed in light in cm/s; f is the force constant
of the bond in dyne/cm; Mx and My represent the mass in grams of the atoms x and y,
respectively. The force constant (f) is approximately 5x10⁵ dyne/cm for single bonds and nearly
twice and thrice for double and triple bonds, respectively (Silverstein et al., 2005).
Sometimes there are differences between the frequencies of bands in a spectrum and the
expected frequencies calculated by the Hooke Law. Electronic and steric effects of other groups
in a molecule can change the force constants of a bond. Some factors responsible for the shifts in
a vibrational frequency can be:
Coupled vibrations: This is caused by two or more of the same bonds in a molecule. For
example, there are differences between C-H, CH2 and CH3 functional groups. For a C-H group,
only one symmetric vibration should occur. However, for CH2, symmetric and asymmetric
vibrations can occur (Yadav, 2005).
Hydrogen bonding: When hydrogen bonds to a functional group, there is a considerable
decrease in the frequency of the resulting bond. Hydrogen bonding also changes the shape and
intensity of a vibration band, causing the bands to appear more intense and broader. If the
hydrogen bond is stronger, the O-H stretching frequency is lower.
In infrared spectra, besides the fundamental vibrational frequencies of the molecules (transition
from v=0 to v=1), it is common to find additional peaks that could be caused by combination
bands, overtones or Fermi resonance.

115
Combination bands could appear on the infrared spectra if two or more fundamental vibrations
are excited at the same time. A combination band can be found at wavenumbers approximately
equal to the sum of different frequencies. However, difference bands are also possible, and the
vibration frequencies are subtracted.
Overtones occur when a molecule is excited from ν=0 to ν=2 or from ν=0 to ν=3. However, the
possibility of overtone decreases as ν=±n increases. The energy necessary for an overtone
transition will be n times the fundamental transition for harmonic oscillator approximation or
usually less than a multiple of the fundamental wavenumber according to anharmonic oscillator
calculations.
Fermi resonance results in the splitting of two vibrational bands that have nearly the same energy
and symmetry in both IR and Raman spectroscopy. The two bands are usually a fundamental
vibration and either an overtone or combination band. The wave functions for the two resonant
vibrations mix according to the harmonic oscillator approximation, and the result is a shift in
frequency and a change in intensity in the spectrum. As a result, two strong bands are observed
in the spectrum, instead of the expected strong and weak bands. It is not possible to determine
the contribution from each vibration because of the resulting mixed wave function.
Enrico Fermi observed this phenomenon for the first time in a CO2 molecule. The explanation
for this is that the molecule transfers its energy from fundamental vibration to overtone or
combination band level back and forth, causing a pair of transitions of almost equal intensity.
Therefore, the resulting absorption bands appear as a doublet or as two bands.

116
APPENDIX B: WAVENUMBERS OF FUNCTIONAL GROUPS
A list of the wavenumbers for the vibrations of the functional groups relevant to this study is
presented in the following tables.
Table B-1. Vibrations attributed to OH- functional groups.
Table B-2. Vibrations attributed to carbonates.
Table B-3. Vibrations attributed to H2S or species produced by H2S.
Wavenumber cm-1 Vibration References
3707, 3682, and 3641 Ni-OH Kroll et al., 1997
3615 NiO-OH Bradford and Albert, 1996
Wavenumber cm-1 Vibration References
1653, 1434 and 1227 Hydrogen carbonate Pan et al., 2014
1650-1300 Carbonate species Morlanés, 2013
1640 Carbonates on support in NiMgAl. Morlanés, 2013
1560, 1450, 1267, 1181,
1010, and 903
Carbonates, presumably produced in a
reaction of CO2 with surface oxide ions.Kathiraser et al., 2013
Wavenumber cm-1 Vibration References
2570 Chemisorbed H2S and HS- Toops and Crocker, 2008
2535 SH- Reding and Hornig, 1957
2532 H2S Reding and Hornig, 1957
2530 SH- Davidson and Sohail, 1995
1349 H2S Reding and Hornig, 1957

117
Table B-4. Vibrations attributed to SO2 or species produced by SO2.
Table B-5. Vibrations attributed to carbonyl sulfide.
Table B-6. Vibrations attributed to CH4.
Wavenumber cm-1 Vibration References
1374 and 1360 Gaseous SO2 Padley et al., 1994
1360, 1290, 1170 and 1045 Aluminum sulfate Gracia et al., 2005
1354 SO42-
species Liu et al., 2006
1335 v a s (SO2) Padley et al., 1994
1330-1300 Physisorbed SO2 Toops and Crocker, 2008
1220 and 980Surface sulfites and hydrogen sulfites
SO32- Luo and Gorte, 2004
1149 v s (SO2) Padley et al., 1994
1135-1189 Physisorbed SO2 Toops and Crocker, 2008
1055 SO2 adsorbed on alumina. Datta and Cavell, 1985
Wavenumber cm-1 Vibration References
2071 Carbonyl sulfide Hattori et al., 2012
2070 Carbonyl sulfide Barnes et al., 1995
2069 and 2046 Carbonyl sulfide Hongbo et al., 2004
Wavenumber cm-1 Vibration References
3850 3v 4 overtone of methane Rest et al, 1996
3020 ʋ3 Free methane Scarano et al, 2001
3010 ʋ3 mode of methane Rest et al, 1996
2853 Symmetrical stretching (vs CH2) Silverstein et al, 2005
2815 ʋ2+ʋ4 combination band Rest et al., 1996
2594 Overtone peak of methane 2v 4 Rest et al., 1996
1535 ʋ2 mode of methane Rest et al., 1996
1308 ʋ 4 bending mode Scarano et al., 2001
1300 ʋ4 mode of methane Rest et al., 1996

118
Table B-7. Vibrations attributed to CO2.
Table B-8. Vibrations attributed to CO.
Wavenumber cm-1 Vibration References
3700 ʋ3+ʋ1 Combination modes Hu et al., 2013
3600 ʋ3+2ʋ2 Combination modes Hu et al., 2013
2359 and 2330 CO2 gas phase Kroll et al., 1997
2350 Assymmetrical stretching (ʋas o ʋ3 CO2) Silverstein et al., 2005
1384 Adsorbed gaseous CO2 Kathiraser et al., 2013
1340Symmetrical stretching (ʋs o ʋ1 CO2) IR
inactiveSilverstein et al., 2005
665 Scissoring (bending) (δs o ʋ2 CO2) Silverstein et al., 2005
Wavenumber cm-1 Vibration References
2181 and 2121 Gaseous CO Bachiller Baeza et al., 2013
2175 and 2115 Gaseous CO Kroll et al., 1997
2100-1900Strong CO-metal bound carbonyl peaks
either in linear or bridged formKathiraser et al., 2013
2072-2056 Linear carbonyl Morlanés, 2013
2050 Linear CO Bradford and Albert, 1996
2050 and 1935 Linear and bridged CO Bradford and Albert, 1996
2040 CO adsorbed linearly on reduced Ni sites Bachiller-Baeza et al., 2013
2034, 1950 Linear and bridged carbonyl, respectively Morlanés, 2013
Around 2030 Linear CO Bachiller-Baeza et al., 2013
2012 and 1855 CO, linear and multibonded, respectively Kroll et al., 1997
Around 1905 Bridge CO Bachiller-Baeza et al 2013
1801 CO on cobalt metal sites Kathiraser et al., 2013