the effect of physical activity levels on hydration
TRANSCRIPT

University of Arkansas, FayettevilleScholarWorks@UARK
Theses and Dissertations
5-2015
The Effect of Physical Activity Levels on HydrationMarkers in Non-Athletic Free-Living IndividualsMikell Lucas HammerUniversity of Arkansas, Fayetteville
Follow this and additional works at: http://scholarworks.uark.edu/etd
Part of the Exercise Science Commons, Health and Physical Education Commons, and the OtherKinesiology Commons
This Thesis is brought to you for free and open access by ScholarWorks@UARK. It has been accepted for inclusion in Theses and Dissertations by anauthorized administrator of ScholarWorks@UARK. For more information, please contact [email protected], [email protected].
Recommended CitationHammer, Mikell Lucas, "The Effect of Physical Activity Levels on Hydration Markers in Non-Athletic Free-Living Individuals" (2015).Theses and Dissertations. 1082.http://scholarworks.uark.edu/etd/1082

The Effect of Physical Activity Levels on Hydration Markers in Non-Athletic Free-Living
Individuals

The Effect of Physical Activity Levels on Hydration Markers in Non-Athletic Free-Living
Individuals
A Master’s Thesis submitted in partial fulfillment
of the requirements for the degree of Master of Science in Kinesiology
by
Mikell L. Hammer
Southern Arkansas University Bachelor of Science in Exercise Science, 2013
May 2015 University of Arkansas
This thesis is approved for recommendation to the Graduate Council. Dr. Stavros Kavouras Dr. Matthew Ganio Thesis Director Committee Member Dr. Michelle Gray Committee Member

ABSTRACT
Higher levels of physical activity requires increased fluid intake due to increased water losses via
sweating. PURPOSE: To determine the effect of physical activity on hydration status and water
intake. METHODS: This study involved 8 visits to the Human Performance Laboratory over 22
days. Body weight and urine measurements were taken every visit. Physical activity was
assessed by the International Physical Activity Questionnaire (IPAQ), water intake by the Water
Frequency Questionnaire (WFQ), and hydration status by urine osmolality (UOsm), urine
specific gravity (USG), and urine color (UC). From the IPAQ subjects were classified as low,
moderate and high physical activity levels and the total amount of physical activity was
expressed as MET-min∙w-1. All values represent means across 22 days of measurements except
physical activity and water intake, which was a mean of two measurements. Participants were
excluded if they exercised more than 4 hours a week or if they were on medications that effected
fluid balance. One-way analysis of variance was computed to determine differences in hydration
status between groups. Additionally, 2-tailed Pearson correlations were computed to determine
relationships between all measurements while using physical activity as a continuous variable
(i.e., MET-min∙w-1). RESULTS: 95 participants (45 males, 40±13.2 y, 1.76±0.07 m, 27.3±10.8
%BF 25.9±4.6 kg∙m2; 50 females, 41.1±14.8 y, 1.63±.06 m, 35.0±11.0 %BF, 26.6±6.2 kg∙m2)
completed the study; n=39 for low activity (822±698 MET-min∙w-1), n=48 for moderate activity
(1791±1195 MET-min∙w-1), n=8 for high activity (4,728±1150 MET-min∙w-1). Hydration status
and water intake did not differ across all levels of physical activity; UOsm: 587±209, 596±223,
562±290; and TWI: 2.6±.9, 2.9±1.4, 3.0±1.5 L for low, moderate, and high physical activity
levels, respectively (P≤0.05). UOsm (589±290) was strongly correlated to Total Water Intake
(2.83±1.22 L, P=0.000), and weight (76.4±17.3 kg, P=0.000) at a significance level of P≤0.01

but not strongly correlated to MET∙min∙w-1 (1640±1453). CONCLUSION: No significant
differences in hydration or water intake were observed across groups. However, the small
numbers of participants in the high physical activity levels may have made this comparison
difficult. A wider range of MET-min∙w-1 between groups may need to be studied.

ACKNOWLEDGEMENTS
Special thanks are due to Dr. Kavouras, Dr. Gray, and Dr. Ganio for advising me through the
degree and being a part of the committee. Also, a special thanks goes out to Dr. Johnson and the
research team for mentoring me and making this all possible while giving me the opportunity to
gain valuable knowledge and learning from great experiences.

TABLE OF CONTENTS
Introduction……………………………………………………………………………………….1
Methods…………………………………………………………………………………………...3
Participants………………………………………………………………………………..3
Research Design…………………………………………………………………………..4
Measures…………………………………………………………………………………..4
Procedure………………………………………………………………………………….5
Water Frequency Questionnaire………………………………………………......6
Hydration Markers………………………………………………………………...7
International Physical Activity Questionnaire…………………………………….7
Statistical Analysis………………………………………………………………………...8
Results…………………………………………………………………………………………….8
Discussion………………………………………………………………………………………..22
Limitations……………………………………………………………………………………….24
Conclusion……………………………………………………………………………………….24
References………………………………………………………………………………………..26
Appendix…………………………………………………………………………………………28

1
Introduction: Water is one of the most important nutrients in the human body (Sawka,
Cheuvront & Carter III, 2005). It is the largest component of the human body accounting for
about 50-70% of total body mass according to Maughan (2003), Sawka and colleagues (2005),
and Armstrong (2005). It is crucial for metabolism, temperature regulation, and several other
physiological functions (Armstrong, 2005). Research has found that fluid loses of only 1-2% has
its negative effect on the body including alertness, work performance, headaches, concentration,
and tiredness along with several other health issues (Maughan, 2003). However, it is often
ignored in the general population’s nutrition to replace water loss appropriately (Sawka et al.,
2005). Due to it being ignored, recommendations are often not met. The recommended adequate
intake of water is found to be about 3.7L a day for adult men and 2.7 L a day for adult females
(Dietary Reference Intake for Water, 2005). Water intake includes drinking water, water in
beverages, and water in food (Sawka et al. 2005). Fluids from drinking water and beverages
provide about 81% of total water intake, and water from food provides about 19% of total water
intake according to the Dietary Reference Intake for Water (2005). Urinary loss is the major
route of water loss followed by sweat loss, respiratory loss, fecal loss, insensible loss, and
metabolic production (Armstrong, 2005). Water loss or lack of appropriate total water intake can
result in body water deficits. Body water deficits result when fluid intakes are reduced or fluid
losses are increased (Sawka et al., 2005).Water intake will be assessed using the Water
Frequency Questionnaire (WFQ). Westerterp (1999) found that self-reported dietary records
show an underestimate of actual consumption of fluids and food by about 17% the first week,
27% the second week, and 35% the third week when compared to 2H and 18O. This could be due
to the participant not accurately recalling what they have eaten when the intake is recorded
(Westerterp, 1999). However, it is the next best tool to use to assess water intake. To measure

2
hydration, urine specific gravity, urine osmolality, and urine color will be used to discover if
each individual is euhydrated or hypohydrated. These methods have been used in most hydration
research in the past to determine hydration status including Volpe and colleagues (2009),
Kavouras and colleagues (2012), and Cleary and colleagues (2012). Aside from hydration,
another major health concern that is often ignored is physical activity which can lead to a
healthier longer life or the lack of can lead to obesity, hypertension, diabetes, arthritis,
dyslipidemis, depression, osteoporosis, cancer, as well as several other health concerns (Marcos
et al., 2014). Several studies have found no change in total water intake with age or gender
(Bossignham, Carnell & Campbell, 2005; De Castro et al., 1992). However, there are changes
seen with physical activity. If physical activity is vigorous, total water intake requirements may
exceed 6 L a day (Sawka et al. 2005). To maintain and promote good health, healthy adults aged
18-65 years need moderate aerobic physical activity for a minimum of 30 minutes on five days a
week, vigorous aerobic physical activity for a minimum of 20 minutes on three days a week, or a
combination of the two (Haskell, Lee, Pate, Powell and Blair, 2007). Using the International
Physical Activity Questionnaire (IPAQ) scoring protocol, this physical activity would place an
individual at a minimum of 600 MET-minutes/week which is in the Moderate Intensity category
of physical activity (IPAQ Scoring Protocol, 2005). Reports indicate that as age increases
physical activity decreases and the fluid regulatory capacity decreases due to reduced renal
concentration and diluting capacity partnered with less thirst drive (Armstrong, 2005). Therefore,
we should see a decline in physical activity and lack of replacing fluids properly with an increase
in age. Also, physical activity and environmental exposure will increase water losses and
therefore increase daily fluid needs (Dietary Reference Intake of Water, 2005). We will assess
this using the IPAQ Short Form. Research has shown that the self-report short form IPAQ is a

3
valid instrument for physical activity assessment (Heesch, van Uffelen, Hill & Brown, 2010).
The IPAQ has reasonable measurement properties for monitoring population levels of physical
activity among 18 to 65 year old individuals in diverse settings (Craig et al., 2003). Water
balance studies suggest that going from minimal activity to sedentary activity levels in
temperate environments increased daily water requirements from about 2.5 to 3.2 L/day,
respectively (Fusch et al., 1998; Leiper et al., 1996).Water turnover studies indicate that
individuals with more vigorous levels of activity (> 60 minutes per day of activity)
compared to individuals engaging in relatively sedentary activity (i.e., less than 60 minutes
per day of activity) in temperate environments have increased daily total water
requirements of approximately 3.0 to 4.5 L/day in men (Fusch et al., 1998; Leiper et al.,
1996). Higher levels of physical activity further increase water requirements; for example,
very active fire fighters had daily water requirements of about 7 L/day (Ruby et al., 2002).
Hydration and physical activity are both very important concepts that when combined can
promote well-being and health or be detrimental to the individual. The purpose of the present
study was to study the effects of physical activity on hydration status and total water intake in
healthy and active but non-athletic adults. We hypothesize that there will be a negative
correlation between hydration markers and physical activity levels (as physical activity increases,
hydration markers will show more signs of dehydration). More physically active individuals will
sweat and excrete more water and not replace the lost water affectively.
Methods
Participants: This study included 102 individuals ages 18-65 years old from the local Northwest
Arkansas area in an attempt to obtain a representative sample. Once subjects with incomplete
questionnaires or other errors were excluded from the data 95 subjects (45 males, 40±13.2 y,

4
1.76±0.07 m, 27.3±10.8 %BF 25.9±4.6 kg∙m2; 50 females, 41.1±14.8 y, 1.63±0.06 m, 35.0±11.0
%BF, 26.6±6.2 kg∙m2) remained. Participation was based on inclusion criteria such as medical
clearance, healthy and active (but not a competitive athlete), and signed informed consent prior
to the initiation of any trial procedure. Exclusion criteria included inability to understand and
write English, evidence of clinically relevant metabolic, cardiovascular, hematologic, hepatic,
gastrointestinal, renal, pulmonary, endocrine or psychiatric history of disease (based on the
medical history questionnaire), pregnancy or breast feeding, surgical operation on digestive tract
(except possible appendectomy), regular drug treatment within 15 days prior to start of the study,
currently exercising more than 4 hours per week, inability to participate in the entire study,
changes in diet during the last month, or change in weight more than 2.5 kg (about 5 pounds) in
the last month.
Research Design: A random stratified sampling of participants by age group and gender to
represent the population of the United States was used for the study. All participants reported to
the Human Performance Lab at the University of Arkansas. Each participant that completed the
full study received $150.00.
Measures: This project involved 8 visits to the Human Performance Laboratory at the
University of Arkansas over 3 weeks plus one day (i.e., 22 days). Prior to the start of the study
participants met with a scientist for completion of the medical history and informed consent
forms. Morning urine samples were collected to assess hydration status, weekly water intake was
assessed using the Water Frequency Questionnaire (WFQ), and weekly physical activity was
assessed using the International Physical Activity Questionnaire (IPAQ). Body weight was
recorded every visit to the closest 100 g using a balance beam (Seca, model: 7701321004, Vogel
& Hamburg,Germany), and standing height was recorded the first visit with a wall-mounted

5
stadiometer (Seca, model: 770, Vogel & Hamburg, Germany). Body weight and height were
recorded with the subjects wearing only their shorts and a t-shirt, with no shoes directly after
they urinate. On the first day, a body composition measurement also took place via the use of
dual x-ray absorptiometry (DXA) scan, (Lunar Prodigy, General Electric Healthcare, Waukesha,
WI). Urine osmolality was measured in duplicate, by freezing point depression (3D3 Advanced
Osmometer, Advanced Instruments Inc, Norwood, MA, USA). Urine Specific Gravity was
measured with a hand held refractometer (ATAGO SUR-NE, Tokyo, Japan) in duplicate. Urine
Color was measured standing in a well-lighted room (temperature 20-22°C) with samples placed
in a clear glass tube against a white background. Urine Color was evaluated using the Urine
Color Chart (UCC). The evaluations were carried out by a trained group of researchers at all
times. These evaluation tools were also done by several past studies including Stearns et al.
(2009), Cleary et al. (2012), Bardis, Kavouras, Arnaoutis, Panagiotakos, and Sidossis (2013), and
Kavouras et al. (2012).
Procedures: This project involved eight visits to the Human Performance Laboratory at the
University of Arkansas over three weeks plus one day (i.e., 22 days). Prior to the start of the
study participants met with a scientist for completion of medical history and consent forms.
Following the briefing, written guidelines were provided with all necessary questionnaires. After
explaining the scope of the study and signing the consent form during the initial meeting of the
first day, the individual completed the medical history questionnaire. Next, the Water Frequency
Questionnaire (WFQ) and the International Physical Activity Questionnaire (IPAQ) were
completed. We then collected a morning urine sample and measured height and weight followed
by a measurement of body fat with dual x-ray absorptiometry (DXA). During the study body fat
and height was measured once, eight morning urine samples were collected in small urine

6
containers that were clearly labeled with the date, individual participant number and the sample
identification code, (i.e., “#1 - Morning”, “#2 - Morning”, etc.). Body weight was measured eight
times directly after the subject urinated, and the WFQ and IPAQ were assessed three times all
assessing the week prior to the questionnaire. The participant’s visits and what data is collected
in each visit (Table 1) serve to explain the study in more detail.
Table 1-Explains when the participants visit the lab each week over the entire study and
what data is collected for each day (DXA, Urine, Weight, IPAQ, and WFQ).
WEEK 1 WEEK
2 WEEK 3 WEEK
4
Day Monday
Tuesday
Friday
Monday Monday Tuesday Friday Monday
Lab Visit
1 2 3 4 5 6 7 8
DXA X
Height X
Urine X X X X X X X X
Weight
X X X X X X X X
IPAQ X X X
WFQ X X
X
Water Frequency Intake Records: The Water Frequency Questionnaire (WFQ) is assessed on
the first, fourth, and eighth visits to assess total water intake (L). The WFQ on the first visit is
used for familiarization. The WFQ on the fourth visit is assessing week one, and on the eighth
7
visit week three. Using this tool, we find the total weekly water consumed (L) and find the
average daily water intake (L). We can then correlate these values to the individual’s hydration
status and physical activity level. The recommended adequate intake of water is found to be
about 3.7L a day for adult men and 2.7 L a day for adult females (Dietary Reference Intake for
Water, 2005). The WFQ assesses water from beverages (milk, juice, alcohol, soft drinks, coffee,
etc.) and food (vegetables, fruits, dairy, starches, etc.).
Hydration Markers: Urine Specific Gravity (USG), Urine Osmolality (UOsm), and Urine
Color are collected on all eight visits. The values are used to find the average hydration status for
each individual and to correlate to the physical activity level and water intake of that individual.
The first four urine samples are to find the average of week one and the last four samples are
used to find the average value for week three. Hydration markers that are used for the study are:
• Urine Specific Gravity (USG) - measures hydration by a refractometer to analyze the
amount of light that passed through a small drop of urine and assess urine specific gravity
(Volpe et al., 2009). The cut off point for euhydration is based on Urine Specific Gravity
less than 1.020 (Sawka et al., 2007). Values equal to or greater than 1.020 indicate
hypohydration (Cleary et al., 2012).
• Urine Osmolality (UOsm) - measures the osmolality of urine by freezing point depression
in an osmometer. A person is in the euhydrated state if less than 700 mOsm/kg of water
or in the hypohydration state is equal to or greater than 700 mOsm/kg of water (Sawka et
al., 2007).
• Urine Color Chart- measures the urine concentration. Most researchers use an 8-level
chart. Values at 4 or lower indicate euhydration, and values greater than 4 indicate
hypohydration (Cleary et al., 2012).

8
IPAQ: The IPAQ short form is scored by High, Moderate, or Low physical activity. These
scores are used in correlation with hydration scores and total water intake. The IPAQ is given on
the first visit for familiarization, the fourth visit to assess week 1, and the eighth visit to assess
week 3. To analyze the IPAQ, walking is equivalent to 3.3 METs, moderate Intensity is
equivalent to 4.0 METs, and vigorous intensity is equivalent to 8.0 METs (IPAQ Scoring
Protocol, 2005). Categorizing of the IPAQ is as follows:
• High physical activity category- an individual must have vigorous-intensity activity on at
least 3 days and at least 1500 MET-minute∙w-1 or 7 or more days of any combination of
walking, moderate or vigorous intensity activities and at least 3000 MET-minutes∙w-1.
• Moderate physical activity category an individual must have 3 or more days of vigorous
activity of at least 20 minutes per day, 5 or more days of moderate activity and/or
walking of at least 30 minutes per day, or 5 or more days of any combination of walking,
moderate or vigorous intensity activity achieving a minimum of at least 600 MET-
minutes∙w-1.
• Low physical activity category an individual must have no activity reported or some
activity but not enough to meet the prior listed categories (IPAQ Scoring Protocol, 2005).
Statistical Analysis: Mean and SD values were computed for all variables to describe the data.
A T-test to look at differences between gender across all variables, A One-way Anova (P≤ 0.05)
was used to compare physical activity level with each variable, and also a post hoc test for
multiple comparisons by using Bonferroni’s method (P ≤ 0.05) with physical activity level in
week 1 as an independent variable, physical activity level in week 3 as an independent variable,
and average physical activity across the study as an independent variable were also computed. A
two-tailed Pearson’s Correlation was calculated for all variable averages (P≤0.05). Linear

9
Regressions were also calculated for all variable averages to analyze patterns of change. The
analysis was performed using SPSS.
Results:
Week 1: For week 1 (Table 2) there was no significant difference between males and females
(45 males, 40±13.2 y, 1.76±0.07 m, 27.3±10.8 %BF 25.9±4.6 kg∙m2; 50 females, 41.1±14.8 y,
1.63±0.06 m, 35.0±11.0 %BF, 26.6±6.2 kg∙m2) in UOsm (639±203, 543±240), USG
(1.016±0.006, 1.014±0.006), UC (3.0±0.79, 3.0±0.86), weight (81.6±16.1 kg, 71.9±17.2 kg),
MET-minutes∙w-1 (2053±2178 MET-min∙w-1, 1297±957 MET-min∙w-1), water from food
(0.51±0.27 L, 0.54±0.26 L) water from beverages (2.8±1.5 L, 2.1±1.0 L), or Total Water Intake
(3.2±1.7 L, 2.7±1.1 L), respectively.
Table 2- Week 1 differences in variables in males and females. TWI- Total Water Intake
(L).
Variable Male Female
Subjects 45 50
Age (y) 40±13.2 41.1±14.8
Height (m) 1.76±0.07 1.63±0.06
Weight (kg) 81.6±16.1 71.9±17.2
%BF 27.3±10.8 35.0±11.0
BMI 25.9±4.6 26.6±6.2
UOsm (mmol/kg) 639±203 543±240
USG 1.016±0.006 1.014±0.006
UC (1-8) 3.0±0.79 3.0±0.86
TWI (L) 3.2±1.7 2.7±1.1
MET-min∙w-1 2053±2178 1297±957
Males and females were combined for the rest of the results as there were no significant
differences between genders and we wanted to keep a large sample in each physical activity
category. There was no significant difference (Table 3) between the low physical activity (n=23),

10
moderate physical activity (n=59), and high physical activity (n=13) categories in UOsm
(595±205, 586±235, 584±227), USG (1.014±0.005, 1.015±0.006, 1.015±0.007), UC (3.0±0.8,
2.9±0.8, 2.7±0.8), weight (75.9±19.3 kg, 75.1±16.6 kg, 83.9±15.9 kg), water from food
(0.46±0.24 L,0.55±0.29 L, 0.50±0.16 L), water from beverages (2.21±0.83 L, 2.49±1.4 L,
2.6±1.9 L) or Total Water Intake (2.65±0.94 L, 3.03±1.49 L, 3.04±1.94 L), respectively.
However, as most would assume, there was a significant difference (P≤0.05) in Met-min∙w-1 as
physical activity level increased from low (533±375 MET-min∙w-1) to moderate (1344±718
MET-min∙w-1, P=0.002), low to high (5052±2029 MET-min∙w-1, P=0.000), and from moderate
to high (P=0.000).
Table 3- Change in variables between physical activity levels during Week 1. *-significant
at the P ≤0.05 Level.
Activity
Level Subjects
UOsm
Mmol/kg USG
UC
(1-8)
Weight
(kg)
TWI
(L)
METs-min∙ w-
1
Low 23 595±205 1.014±0.005 3.0±0.8 75.9±19.3 2.65±0.94 533±375*
Moderate 59 586±235 1.015±0.006 2.9±0.8 75.1±16.6 3.03±1.49 1344±718*
High 13 584±227 1.015±0.007 2.7±0.8 83.9±15.9 3.04±1.94 5052±2029*
A)
y = 0.0446x + 2867.3
R² = 0.0027
0.0
1000.0
2000.0
3000.0
4000.0
5000.0
6000.0
7000.0
8000.0
9000.0
10000.0
0.0 2000.0 4000.0 6000.0 8000.0 10000.0
Wa
ter
Inta
ke
(m
l)
Physical Activity (MET-min∙w-1)
Physical Activity and Water Intake
Series1
Linear (Series1)

11
B)
C)
Figure 1- Correlation of A) Physical Activity (MET-min∙w-1) and Water Intake (ml), B)
Physical activity (MET-min∙w-1) and UOsm (mmol/kg), C) Water Intake (ml) and UOsm
(mmol/kg)
Although not significant, we do see a higher score of UOsm, USG, MET-min∙w-1, water
from beverages and Total Water Intake in males than females. Also, we do see a slight decrease
y = -0.0076x + 600.85
R² = 0.0031
0
200
400
600
800
1000
1200
0.0 2000.0 4000.0 6000.0 8000.0 10000.0
UO
sm (
mm
ol/
kg
)
Physical Activity (METs-min∙ w-1)
Physical Activity and Hydration Level
Series1
Linear (Series1)
y = -0.0427x + 713.81
R² = 0.0735
0
200
400
600
800
1000
1200
0.0 2000.0 4000.0 6000.0 8000.0 10000.0
UO
sm (
mm
ol/
kg
)
Water Intake (ml)
Water Intake and Hydration Level
Series1
Linear (Series1)

12
in UOsm and UC, and a slight increase in weight, water from beverages and Total Water Intake
from low, moderate, to high physical activity levels.
In week 1 (Fig. 2), 31% (n=14) of males, 40% (n=20) of females, and 36% (n=34) total
reached the daily water intake recommendations of 2.7 L for females and 3.7 L for males
(Dietary Reference Intake for Water, 2005). For the recommended percentages of water from
food and beverages we selected participants who were 1% below or above 19% for food to be in
the range seen in past research. 39% (n=37) of participants did not reach the recommended
percentages of water from food intake of about 19% (Dietary Reference Intake for Water, 2005),
and only 17% (n=16) were in the 18-20% range of water from food, 66% (n=63) of the
participants were in the euhydrated state, or less than 700 mmol/kg of water when using UOsm
as the hydration marker (Sawka et al., 2007), and 76% (n=72) of the participants reached the
daily physical activity recommendations of moderate physical activity of 3 or more days of
vigorous activity of at least 20 minutes per day, 5 or more days of moderate activity and/or
walking of at least 30 minutes per day, or 5 or more days of any combination of walking,
moderate or vigorous intensity activity achieving a minimum of at least 600 MET-minutes∙w-1
(IPAQ Scoring Protocol, 2005).

13
Figure 2- Subjects in Week 1 that reached the recommendations. Water from food- (n=16),
euhydrated (n=63), ≥ Moderate Physical Activity (n=72), Total Water Intake in males
(n=20), females (n=14).
Week 3: For week 3 (Table 4) there was no significant difference between males and
females in UOsm (642±234, 543±225), USG (1.017±0.006, 1.014±0.006), UC (3.0±0.87,
3.0±0.76), weight (81.4±15.9 kg, 71.8±17.3 kg), MET-minutes∙w-1 (1972±1818 MET-min∙w-1,
1314±1217 MET-min∙w-1), water from food (0.50±0.28 L, 0.49±0.21 L) water from beverages
(2.3±1.2 L, 2.2±1.0 L), and Total Water Intake (2.8±1.3 L, 2.6±1.1 L), respectively.
Table 4- Week 3 differences in males and females. TWI-Water Intake (L).
Gender Subjects Weight
(kg) UOsm USG
UC
(1-8)
TWI
(L)
METs-min∙ w-1
Male 45 81.4±15.9 642±234 1.017±0.006 3.0±0.87 2.8±1.3 1972±1818
Female 50 71.8±17.3 543±225 1.014±0.006 3.0±0.76 2.6±1.1 1314±1217
Again, there was no significant difference (Table 5) between the low physical activity
(n=30), moderate physical activity (n=52), and high physical activity (n=13) categories in UOsm
(573±225, 606±221, 565±310), USG (1.015±0.006, 1.016±0.006, 1.015±0.009), UC (2.9±0.9,
17%
66%
76%
36%
0% 10% 20% 30% 40% 50% 60% 70% 80%
Water from Food
Euhydration
≥ Moderate Activity
Water Intake for Gender
PERCENT THAT REACH RECOMMENDATION
RE
CO
MM
EN
DA
TIO
NWeek 1 Subjects Reaching Recommendations
Percentage

14
3.0±0.6, 2.8±1.2), weight (75.9±17.8 kg, 75.8±18.0 kg, 79.9±13.7 kg), water from food
(0.45±0.25 L,0.51±0.23 L,0.53±0.29 L), water from beverages (1.97±0.83 L, 2.34±1.20 L,
2.49±1.14 L) and Total Water Intake (2.43±0.97 L, 2.83±1.23 L, 2.94±1.34 L), respectively.
Also, there was a significant difference (P≤0.05) in MET∙min∙w-1 as physical activity level
increased. However, from low (922±1589 MET-min∙w-1) to moderate (1475±772 MET-min∙w-1)
there was no significance (p=0.179), but was a significant difference from low to high
(3853±1917 MET-min∙w-1, P=0.000), and from moderate to high (P=0.000).
Table 5- Differences in variables between physical activity levels in Week 3. *-Significance
at the P≤0.05 level.
Activity
Level Subjects
UOsm
Mmol/kg USG
UC
(1-8)
Weight
(kg)
TWI
(L)
MET-
min∙w-1
Low 30 573±225 1.015±0.006 2.9±0.9 75.9±17.8 2.43±0.97 922±1589*
Moderate 52 606±221 1.016±0.006 3.0±0.6 75.8±18.0 2.83±1.23 1475±772*
High 13 565±310 1.015±0.009 2.8±1.2 79.9±13.7 2.94±1.34 3853±1917*
A)
y = 0.0171x + 2687.6
R² = 0.0005
0.0
1000.0
2000.0
3000.0
4000.0
5000.0
6000.0
7000.0
8000.0
0.0 2000.0 4000.0 6000.0 8000.0 10000.0
Wa
ter
Inta
ke
(m
l)
Physical Activity (MET-min∙w-1)
Physical Activity and Water Intake
Series1
Linear (Series1)

15
B)
C)
Figure 3- Correlation of A) Physical Activity (MET-min∙w-1) and Water Intake (ml), B)
Physical activity (MET-min∙w-1) and UOsm (mmol/kg), C) Water Intake (ml) and UOsm
(mmol/kg)
Although not significant, we do see higher levels of UOsm, USG, MET-min∙w-1, and
Total Water Intake in males than females. Also, we see a slight increase in weight, water from
y = 0.005x + 581.99
R² = 0.0011
0
200
400
600
800
1000
1200
0.0 2000.0 4000.0 6000.0 8000.0 10000.0
UO
sm (
mm
ol/
kg
)
Physical Activity (MET-min∙w-1)
Physical Activity and Hydration Level
Series1
Linear (Series1)
y = -0.0872x + 826.95
R² = 0.1935
0
200
400
600
800
1000
1200
0.0 2000.0 4000.0 6000.0 8000.0 10000.0
UO
sm (
mm
ol/
kg
)
Water Intake (ml)
Water Intake and Hydration Level
Series1
Linear (Series1)
16
food, water from beverages, and Total Water Intake as physical activity increases from low,
moderate, to high physical activity levels.
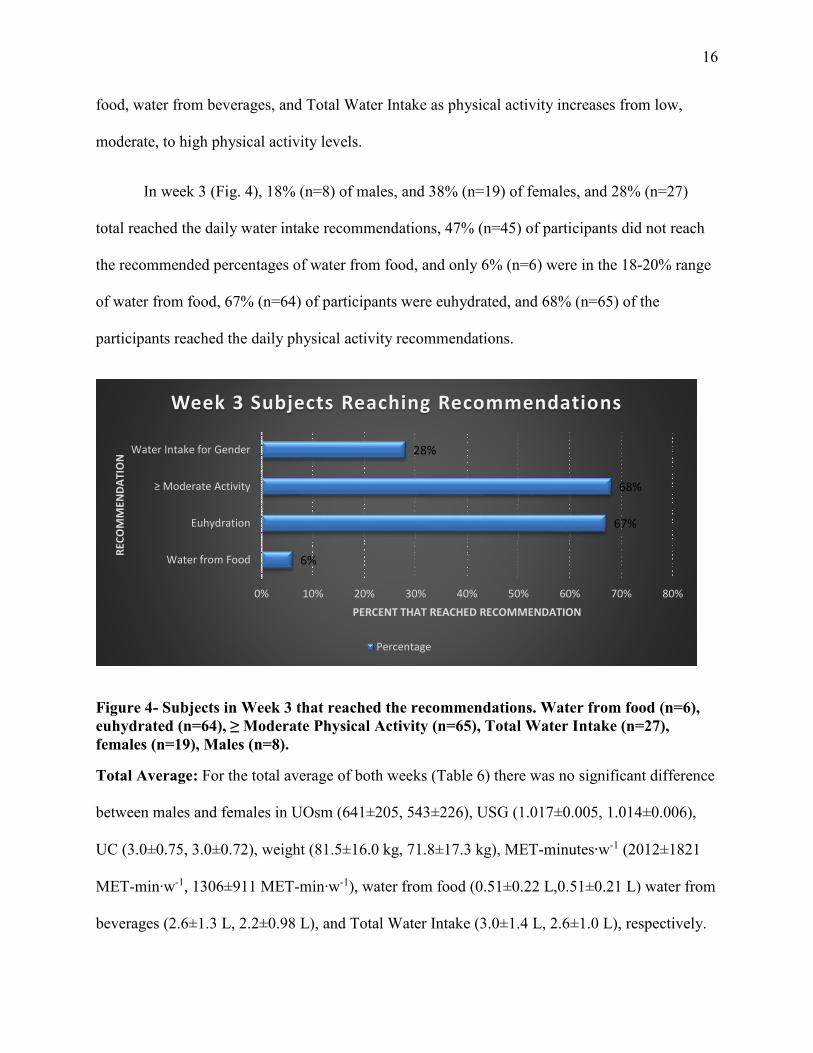
In week 3 (Fig. 4), 18% (n=8) of males, and 38% (n=19) of females, and 28% (n=27)
total reached the daily water intake recommendations, 47% (n=45) of participants did not reach
the recommended percentages of water from food, and only 6% (n=6) were in the 18-20% range
of water from food, 67% (n=64) of participants were euhydrated, and 68% (n=65) of the
participants reached the daily physical activity recommendations.
Figure 4- Subjects in Week 3 that reached the recommendations. Water from food (n=6),
euhydrated (n=64), ≥ Moderate Physical Activity (n=65), Total Water Intake (n=27),
females (n=19), Males (n=8).
Total Average: For the total average of both weeks (Table 6) there was no significant difference
between males and females in UOsm (641±205, 543±226), USG (1.017±0.005, 1.014±0.006),
UC (3.0±0.75, 3.0±0.72), weight (81.5±16.0 kg, 71.8±17.3 kg), MET-minutes∙w-1 (2012±1821
MET-min∙w-1, 1306±911 MET-min∙w-1), water from food (0.51±0.22 L,0.51±0.21 L) water from
beverages (2.6±1.3 L, 2.2±0.98 L), and Total Water Intake (3.0±1.4 L, 2.6±1.0 L), respectively.
6%
67%
68%
28%
0% 10% 20% 30% 40% 50% 60% 70% 80%
Water from Food
Euhydration
≥ Moderate Activity
Water Intake for Gender
PERCENT THAT REACHED RECOMMENDATION
RE
CO
MM
EN
DA
TIO
N
Week 3 Subjects Reaching Recommendations
Percentage

17
Table 6- Total Average differences in males and females. TWI-Water Intake (L).
Gender Subjects Weight
(kg)
UOsm
Mmol/kg USG
UC
(1-8)
TWI
(L)
METs-
min∙w-1
Male 45 81.5±16.0 641±205 1.017±0.005 3.0±0.75 3.0±1.4 2012±1821
Female 50 71.8±17.3 543±226 1.014±0.006 3.0±0.72 2.6±1.0 1306±911
For the average scores across the entire study there was no significant difference (Table
7) between the low physical activity (n=39), moderate physical activity (n=48), and high
physical activity (n=8) categories in UOsm (587±209, 596±223, 562±290), USG (1.015±0.006,
1.016±0.006, 1.015±0.008), UC (3.0±0.7, 2.9±0.7, 2.8±1.1), weight (75.5±17.8 kg, 76.3±17.2
kg, 81.6±16.4 kg), water from food (0.46±0.18 L,0.54±0.23 L, 0.54±0.25 L), water from
beverages (2.20±0.82 L, 2.43±1.32 L, 2.57±1.31 L) and Total Water Intake (2.64±0.89 L,
2.95±1.38 L, 3.0±1.54 L), respectively. Again, there was a significant difference (P≤0.05) in
MET-min∙w-1 as physical activity level increased from low (822±698 MET-min∙w-1, P=0.000),
moderate (1791±1195 MET-min∙w-1, P=0.000), to high (4728±1150 MET-min∙w-1, P=0.000)
levels.
Table 7- Differences in variables between physical activity levels for the total average
across the study. *-Significance at the p≤0.05 level.
Activity
Level Subjects
UOsm
Mmol/kg USG
UC
(1-8)
Weight
(kg)
TWI
(L)
METs-
min∙w-1
Low 39 587±209 1.015±0.006 3.0±0.7 75.5±17.8 2.64±0.89 822±698*
Moderate 48 596±223 1.016±0.006 2.9±0.7 76.3±17.2 2.95±1.38 1791±1195*
High 8 562±290 1.015±0.008 2.8±1.1 81.6±16.4 3.0±1.54 4728±1150*
Although not significant, higher scores were found for UOsm, USG, MET-min∙ w-1,
water from beverages, and Total Water Intake in males than females. Also, although not
significant, there was a slight decrease in UC, and a slight increase in weight, water from food,

18
water from beverages, and Total Water Intake as physical activity increased from low, moderate,
to high levels. For the average (Table 8), total average UOsm (589±290) is strongly correlated to
total average water from food (0.51±0.22 L, P=0.022) at a significance level of P≤0.05 (2-
tailed), total average water from beverages (2.34±1.13 L, P=0.000), total average water intake
(2.83±1.22 L, P=0.000), total average USG (1.015±0.006, P=0.000), total average UC (2.9±.7,
P=0.000), and total average weight (76.4±17.3 kg, P=0.000) at a significance level of P≤0.01 (2-
tailed) but not strongly correlated to MET-min∙w-1 (1640±1453). Total average USG
(1.015±0.006) is strongly correlated to total average water from food (0.51±0.22 L, P=0.009),
total average water from beverages (2.34±1.13 L, P=0.000), total average water intake (2.83±1.2
L, P=0.000), UOsm (589±290, P=0.000), UC (2.9±0.7, P=0.000), and total average weight
(76.4±17.3, P=0.000) at a significance level of P≤0.01 (2-tailed) but not strongly correlated to
MET-min∙w-1. Total average UC (2.9±0.7) is strongly correlated to total average water from food
(0.51±0.22 L, P=0.002), total average water from beverages (2.34±1.13 L, P=0.000), total
average water intake (2.83±1.2 L, P=0.000), total average UOsm (589±221, P=0.000), and total
average USG (1.015±0.006, P=0.000) at a significance level of P≤0.01 (2-tailed) but not strongly
correlated to total average weight, or total average MET∙min∙w-1. Total average water from food
(0.51±0.22 L) is strongly correlated to total average water from beverages (2.34±1.13 L.
P=0.002), total average water intake (p=0.000), total average USG (1.015±0.006, P=0.009), total
average UC (2.9±0.7, P=0.002) at a significance level of P≤0.01 (2-tailed) and UOsm (589±221,
P=0.022) at a significance level of P≤0.05 (2-tailed) but not strongly correlated to total average
weight or total average MET-min∙w-1. Total average water from beverages (2.34±1.13 L) is
strongly correlated to total average water from food (0.51±0.22 L P=0.002), total average water
intake (2.83±1.2 L, P=0.000), total average UOsm (589±221, P=0.000), total average USG

19
(1.015±0.006, P=0.000), and total average UC (2.9±0.7, P=0.000) at a significance level of
P≤0.01 (2-tailed) but not strongly correlated to total average weight or total average MET-
min∙w-1. Total average water intake (2.83±1.2 L) is strongly correlated to total average water
from food (0.51±0.22 L, P=0.000), total average water from beverages (2.34±1.13 L, P=0.000),
total average UOsm (589±221, P=0.000), total average USG (1.015±0.006, P=0.000), and total
average UC (2.9±0.7, P=0.000) at a significance level of P≤0.01 (2-tailed) but not strongly
correlated to total average weight or total average MET-min∙w-1. Total average weight
(76.4±17.3) is strongly correlated to total average UOsm (589±221, P=0.000), and total average
USG (1.015±0.006, P=0.000) at a significance level of P≤0.01 (2-tailed) but not strongly
correlated to total average weight, UC, MET-min∙w-1, total water intake, water from beverages,
or water from food. Total average MET-min∙w-1 is not strongly correlated with any of the
variables in the study. For the regression, we used physical activity as a continuous variable
instead of placing the participants in the three categories of low, moderate, and high physical
activity. The only significant changes seen over time were as Total Water Intake increased,
UOsm and USG tended to decrease. No changes were seen over time between physical activity
and the other variables.

20
Table 8- Correlations (R- value) of the Total Average for each variable * significance of
P≤0.05, ** significance of P≤0.01
Variable UOsm USG UC Weight TWI WFF WFB MET-
min∙w-1
UOsm 0.977** 0.789** 0.405** -0.375** -0.234* -0.359** -0.032
USG 0.977** 0.861** 0.380** -0.383** -0.266** -0.364** -0.035
UC 0.789** 0.861** 0.145 -0.406** -0.310** -0.382** -0.164
Weight 0.405** 0.380** 0.145 -0.763 -0.073 -0.892 0.156
TWI -0.375** -0.383** -0.406** -0.763 0.467** 0.983** 0.076
WFF -0.234* -0.266** -0.310** -0.073 0.467** 0.311** 0.085
WFB -0.359** -0.364** -0.382** -0.892 0.983** 0.311** 0.083
MET-
min∙w-1 -0.032 -0.035 -0.164 0.156 0.076 0.085 0.083
A)
y = 0.0635x + 2724.1
R² = 0.0057
0.0
1000.0
2000.0
3000.0
4000.0
5000.0
6000.0
7000.0
8000.0
0.0 2000.0 4000.0 6000.0 8000.0 10000.0
Wa
ter
Inta
ke
(m
l)
Physical Activity (METs-min∙ w-1)
Physical Activity and Water Intake
Series1
Linear (Series1)

21
B)
C)
Figure 5- Correlations of A) Physical Activity (MET-min∙w-1) and Water Intake (ml), B)
Physical activity (MET-min∙w-1) and UOsm (mmol/kg), C) Water Intake (ml) and UOsm
(mmol/kg)
The average for the entire study (Fig. 6) consisted of 24% (n=11) of males, and 38%
(n=19) of females, and 32% (n=30) total reached the daily water intake recommendations, 41%
y = -0.0048x + 597.14
R² = 0.001
0
200
400
600
800
1000
1200
0.0 2000.0 4000.0 6000.0 8000.0 10000.0
UO
sm (
mm
ol/
kg
)
Physical Activity (METs-min∙ w-1)
Physical Activity and Hydration Level
Series1
Linear (Series1)
y = -0.0679x + 781.24
R² = 0.1403
0
200
400
600
800
1000
1200
0.0 2000.0 4000.0 6000.0 8000.0 10000.0
UO
sm (
mm
ol/
kg
)
Water Intake (ml)
Water Intake and Hydration Level
Series1
Linear (Series1)

22
(n=45) of participants did not reach the recommended percentages of water from food, and only
14% (n=13) were in the 18-20% range of water from food, 67% (n=64) of participants were
euhydrated, and 59% (n=56) of the participants reached the daily physical activity
recommendations (note: weeks 1 and 3 were averaged together however if one week a subject
was low physical activity and the next week moderate physical activity, that subject would be
placed in the low category because their average did not reach the moderate activity
recommendations).
Figure 6- The average for the entire study (shown beside weeks 1 and 3 for comparison)
consisted of water intake (n=11) of males, (n=19) of females, (n=30) total, water from food
(n=13), euhydration (n=64), ≥ moderate activity (n=56).
Discussion The purpose of the present study was to study the effects of physical activity on
hydration status and total water intake in healthy and active but non-athletic adults. We
hypothesized that there would be a negative correlation between hydration markers and physical
activity levels (as physical activity increases, hydration markers will show more signs of
17%
66%
76%
36%
6%
67%
68%
28%
14%
67%
59%
32%
0% 10% 20% 30% 40% 50% 60% 70% 80%
Water from Food
Euhydration
≥ Moderate Activity
Water Intake for Gender
PERCENT THAT HIT RECOMMENDATIONS
RE
CO
MM
EN
DA
TIO
NS
Week 1, 3 and Average Recommendations
Average Week 2 Week 1

23
hypohydration). The results show that although there was a slight increase towards
hypohydration in hydration markers as well as an increase in water intake as physical activity
increased it was not significant. We believe this is due to the small range of physical activity
level across the three categories low (822±698 MET-min∙w-1), moderate (1791±1195 MET-
min∙w-1), and high (4728±1150 MET-min∙w-1). To put this into perspective, 822 MET-min∙w-1 is
equivalent to running a 6 minute pace for about 8 minutes and 30 seconds 6 days a week. 1791
MET-min∙w-1 is equivalent to running a 6 minute pace for about 18 minutes and 30 seconds 6
days a week. 4728 MET-min∙w-1 is equivalent to running a 6 minute pace for about 50 minutes 6
days a week. Although one may consume more fluids during or after a 50 minute run compared
to an 8 minute and 30 seconds run it is not all that significant. However, if there was a wider
range of physical activity across the three categories we may have seen stronger correlations
between physical activity, water intake, and hydration status. Also, the lack of significance could
also be due to the self-reporting of water intake and physical activity.
For week 1, 3, and the total average there was no significant difference between males and
females in UOsm, USG, UC, Weight, MET-minutes∙w-1, water from food, water from beverages,
and Total Water Intake. Males and females were combined for the rest of the results as there
were no significant differences between genders and we wanted to keep a large sample in each
physical activity category. There was no significant difference between the low physical activity,
moderate physical activity, and high physical activity categories in UOsm, USG, UC, weight,
water from food, water from beverages, and Total Water Intake in week 1, 3, or the total average.
However, as most would assume, there was a significant difference in Met-min∙w-1 as physical
activity level increased from low, moderate to high. Although not significant, we do see a higher
score of UOsm, USG, MET-min∙w-1, water from beverages and Total Water Intake in males than

24
females. Also, we do see a slight decrease in UOsm, UC, and a slight increase in weight, water
from beverages and Total Water Intake from low, moderate, to high physical activity levels. 31%
(n=14), 18% (n=8), and 24% (n=11) of males; 40% (n=20), 38% (n=19), and 38% (n=19) of
females; and 36% (n=34), 28% (n=27), and 32% (n=30) total reached the daily water intake
recommendations in week 1, 3, and total average, respectively. 39% (n=37), 47% (n=45), and
41% (n=45) of participants did not reach the recommended percentages of water from food
intake in week 1, 3, and total average, respectively. Only 17% (n=16), 6% (n=6), and 14%
(n=13) were in the 18-20% range of water from food in week 1, 3, and total average,
respectively.66% (n-63), 67% (n=64),67% (n=64) were euhydrated in week 1, 3, and total
average, respectively. 76% (n=72), 68% (n=65), 59% (n=56) of the participants reached the daily
physical activity recommendations in week 1, 3, and total average, respectively. Based on these
results, there seemed to be a slight decrease in water intake and physical activity between week 1
and week 3. Also, UOsm is significantly correlated with USG, UC, weight, and Total Water
Intake. Total Water Intake is significantly correlated with UOsm, USG, UC, water from food and
water from beverages. Weight could be correlated to hydration status because of the increase (or
lack of) of water in the body. Also, it could be due to muscle gains or food and beverage intake.
The results show that the human body is very efficient at maintaining proper hydration across
various physical activity levels on its own. However, more research needs to be done with higher
levels of physical activity.
Limitations: Self-reported data was administered to the participants via the health history form,
International Physical Activity Questionnaire (IPAQ), and water frequency questionnaire. The
results of this study heavily rely on these results. Therefore, the results could be skewed if the
questionnaires are not completed with accuracy and honesty.

25
Conclusion: Based on our results, there was no relationship between the three levels of physical
activity and hydration and water intake status. Water intake did not significantly increase with
the increase of physical activity, and hydration status did not significantly change either. This
shows the human body can effectively control its own hydration levels to an extent. A larger
range of MET-min∙w-1 needs to be studied. As expected, there was a relationship with hydration
status and water intake. There was an uneven dispersion of participants in the low, moderate, and
high physical activity categories which could be skewing the data of each variable used. In the
future, even dispersion of participants should be a focus. Further research in looking at physical
activity, hydration, and water intake is needed with a larger sample size to even the physical
activity categories and broader range of physical activity level.

26
References
Armstrong, L. E. (2005). Hydration assessment techniques. Nutrition Reviews, 63(6), S40-S54.
Bardis, C. N., Kavouras, S. A., Arnaoutis, G., Panagiotakos, D. B., & Sidossis, L. S. (2013). Mild dehydration and cycling performance during 5-kilometer hill climbing. Journal of
Athletic Training, 48(6), 741-747. Retrieved from www.natajournals.org
Bossingham, M. J., Carnell, N. S., & Campbell, W. W. (2005). Water balance, hydration status, and fat-free mass hydration in younger and older adults. American Journal of Clinical
Nutrition, 81, 1342-1350. Retrieved from http://www.ajcn.nutrition.org
Cleary, M. A., Hetzler, R. K., Wasson, D., Wages, J. J., Stickley, C., & Kimura, I. F. (2012). Hydration behaviors before and after an educational and prescribed hydration intervention in adolescent athletes. Journal of Athletic Training, 47(3), 273-281. Retrieved from www.nata.org/jat
Craig, C. L., Marshall, A. L., Sjostrom, M., Bauman, A. E., Booth, M. L., Ainsworth, B. E., Pratt, M., & Ekelund, U. (2003). International physical activity questionnaire: 12- country reliability and validity. Journal of American College of Sports Medicine, 3(3508), 1381-1395. doi: 10.1249/01.MSS.0000078924.61453.FB
De Castro, J. M. (1992). Age-related changes in natural spontaneous fluid ingestion and thirst in humans. Journal of Gerontology, 47, 321-330.
Haskell, W. L., Lee, I. M., Pate, R. R., Powell, K. E., & Blair, S. N. (2007). Physical activity and public health: Updated recommendation for adults from the american college of sports medicine and the american heart association. Circulation, 116(9), 1081-1093. doi: 10.1161/CIRCULATION.107.185649
Heesch, K. C., van Uffelen, J. G. Z., Hill, R. L., & Brown, W. J. (2010). What do ipaq questions mean to older adults? Lessons from cognitive interviews. International Journal of
Behavioral Nutrition and Physical Activity, 7(35), 1-13. Retrieved from http://ijbnpa.org/content/7/1/35
Kavouras, S. A., Arnaoutis, G., Makrillos, M., Garagouni, C., Nikolaou, E., Chira, O., Ellinikaki, E., & Sidossi, L. S. (2012). Educational intervention on water intake improves hydration status and enhances exercise performance in athletic youth. Scandinavian Journal of
Medicine and Science in Sports, (22), 684-689. doi: 10.1111/j.1600-0838.2011.01296.x
Marcos, A., Manonelles, P., Palacios, N., Warnberg, J., Casajus, J., Perez, M., Aznar, S., & Benito, P. (2014). Physical activity, hydration and health. Nutricion Hospitalaria, (9), 1224-1239. doi: DOI:10.3305/nh.2014.29.6.7624

27
Maughan, R. J. (2003). Impact of mild dehydration on wellness and on exercise performance. European Journal of Clinical Nutrition, 57(21224-1239), 19-23. doi: 10.1038/sj.ejcn.1601897
Panel on Dietary Reference Intakes for Electrolytes and Water. , Standing Committee on the Scientific Evaluation of Dietary Reference Intakes, & Food and Nutrition Board, (2005). Dietary reference intakes for water, potassium, sodium, chloride, and sulfate. (pp. 73-166). Washington, DC 20001: The National Academies Press. Retrieved from http://www.nap.edu/catalog/10925.html
Rothenburg, J. A., Panagos, A., & Knechtle, B. (2008). Musculoskeletal performance and hydration status. Curr Rev Musculoskelet Med, (1), 131-136. doi: 10.1007/s12178-008-9020-9
Sawka, M., Burke, L., Eichner, E., Maughan, R., Montain, S., & Stachenfeld, N. (2007). American college of sports medicine position stand. Exercise and fluid replacement. Medicine and Science in sport and exercise. 39(2), 377-390. Doi: 10.1249/mss.0b013e31802ca597
Sawka, M. N., Cheuvront, S. N., & Carter III, R. (2005). Human water needs. International Life
Sciences Institute, 63(6), 30-39. doi: 10.1301/nr.2005.jun.S30–S39
Stearns, R. L., Casa, D. J., Lopez, R. M., McDermott, B. P., Ganio, M. S., Decher, N. R., Scruggs, I. C., West, A. E., Armstrong, L.E., & Maresh, C.M. (2009). Influence of hydration status on pacing during trail running in the heat. Journal of Strength and
Conditioning Research, 23(9), 2533-2541.
Unknown. (2005, November). Guidelines for data processing and analysis of the internation
physical activity questionnaire (ipaq)- short and long forms. Retrieved from http://www.ipaq.ki.se/
Volpe, S. L., Poule, K. A., & Bland, E. G. (2009). Estimation of prepractice hydration status of national collegiate athletic association division i athletes. Journal of Athletic Training, 44(6), 624-629. Retrieved from www.nata.org/jat
Westerterp, K. R. (1999). Body composition, water turnover and energy turnover assessment with labelled water. Proceedings of the Nutrition Society, 58, 945-951.

28
Appendix