the effect of nmb financing on performance of small …
TRANSCRIPT

THE EFFECT OF NMB FINANCING ON PERFORMANCE OF
SMALL AND MEDIUM-SIZED ENTERPRISES (SMES)
THE CASE OF LINDI MUNICIPAL
By
Adam Medson Ntoga
A Dissertation Submitted in Partial/Fulfillment of the Requirements for Award
of the Degree of Master of Science in Accounting and Finance (MSc A&F) of
Mzumbe University
2013

i
CERTIFICATION
We, the undersigned, certify that we have read and hereby recommend for
acceptance by the Mzumbe University, a dissertation entitled The Effect of NMB
Financing on Performance of Small and Medium-Sized Enterprises (SMEs):
The Case of Lindi Municipal, in partial/fulfillment of the requirements for award of
the degree of Master of Science in Accounting and Finance of Mzumbe University.
___________________________
PROFESSOR SHRINIVAS MADISHETTI/ Major Supervisor
___________________________
Internal Examiner
Accepted for the Board of……………………………….
____________________________
DEAN, SCHOOL OF BUSINESS

ii
DECLARATION
AND
COPYRIGHT
I, Adam Medson Ntoga, declare that this dissertation is my own original work and
that it has not been presented and will not be presented to any other university for a
similar or any other degree award.
Signature ___________________________
Date________________________________
©
This dissertation is a copyright material protected under the Berne Convention, the
Copyright Act 1999 and other international and national enactments, in that behalf,
on intellectual property. It may not be reproduced by any means in full or in part,
except for short extracts in fair dealings, for research or private study, critical
scholarly review or discourse with an acknowledgement, without the written
permission of Mzumbe University, on behalf of the author.

iii
ACKNOWLEDGEMENT
I would like to express my sincere thanks to the management and staff of National
Micro-finance Bank (NMB) Lindi Branch and Lindi TRA Regional office for
allowing me to use their documents and office in conducting research and makes this
research successful. This study would have not been successful without the support
of various individuals who in one way or another helped its accomplishment. It is
however not easy to mention all the names of individuals who contributed much to
the success of this study, Therefore few of them will be mentioned. First I would like
to thank my supervisor Professor Srinivas Madishetti, for his advice, guidance and
suggestions that are incorporated in this report. Special thanks go to all Small and
Medium-Sized Enterprises from Lindi Municipal who participated fully in this study
through completing my questionnaires and interview.
Finally I would like to appreciate the moral, financial and material support during my
study from my loved wife Nyamuza, our children Levina and Alex. May God bless
them all.

iv
DEDICATION
I dedicate this work to my family, My Best Friends: Nsesheye Nkota, David
Mugendi, and Rose Mutale. My Lecturers in the course of Master of Science in
Accounting and Finance at Mzumbe University who gave me support when I was
preparing this report.

v
LIST OF ABBREVIATIONS AND ACRONYMS
BOT Bank of Tanzania
CRDB Cooperative Rural and Development Bank
DSE Dar es salaam Stock Exchange
GDP Gross Domestic Product
ILO International Labour Organization
IMF International Monetary Fund
KCBL Kilimanjaro Cooperative Bank Limited
MFIs Micro-Finance Institutions
MSE Micro and Small Enterprises
MSMEs Micro, Small and Medium-sized Enterprises
NBC National Bank of Commerce
NEDF National Entrepreneurial Development Fund
NMB National Microfinance Bank
OECD Organization for Economic Co-operation and Development
REPOA Research on Poverty Alleviation
SEDOM Small Enterprises Development Organization of Malawi
SIDO Small Industries Development Organisation
SMEs Small and medium-sized enterprises
SPSS Statistical package for social science
TRA Tanzania Revenue Authority
TZS Tanzanian Shillings
UK United Kingdom
URT United Republic of Tanzania
USA United States of America
VAT Value Added Tax
WB World Bank

vi
ABSTRACT
The financing of Small and medium-sized enterprises (SMEs) have been a topic of
great interest among both policy-makers and researchers because of the role they
play. Objective of the study was to assess the effect of NMB financing on the
performance of SMEs in Lindi municipal. It was observed that several studies have
been conducted on the importance of SMEs for economic growth, but no specific
study has been conducted on the effect of NMB financing on performance of SMEs
in Lindi and their effects of financing were not known.
Simple random sampling technique was employed in selecting the 100 SMEs from
the population of 400 Smes that constituted the sample size of the research.
Structured questionnaires was designed and distributed to facilitate the acquisition of
relevant data. Descriptive statistics in spss and excel were used as analytical tools.
Pearson correlation was used to test the relationship between the NMB financing and
the Smes performance, chi-square test also was used test the null and alternative
hypotheses.
The findings of the study revealed that, the majority of the SMEs acknowledge
positive contributions of loans towards their businesses and improved standard of
living among family members.
Tax Policy implication in this study:
The tax regime in Tanzania is unfavorable for SMEs development; the present tax
regime imposes a major burden on SMEs performance. The tax rates and compliance
costs are the same for both the SMEs and large enterprises. Government should
review the legal, tax structure and regulatory framework.
Future research
The study was focused on SMEs that operates in Lindi Municipal; the findings may
not relevant in rural areas. Therefore, future research may be conducted in rural
areas. The current research was on the effect of NMB financing on performance of
SMEs, the future research may be conducted on the effect of commercial banks
financing on performance of SMEs in all municipals in a country to broaden the
scope in order to give a better picture.

vii
TABLE OF CONTENTS
CERTIFICATION ......................................................................................................... i
DECLARATION AND COPYRIGHT ........................................................................ ii
ACKNOWLEDGEMENT ........................................................................................... iii
DEDICATION ............................................................................................................. iv
LIST OF ABBREVIATIONS AND ACRONYMS ....................................................... v
ABSTRACT ................................................................................................................. vi
TABLE OF CONTENTS ............................................................................................ vii
LIST OF TABLES ....................................................................................................... xi
LIST OF FIGURES ................................................................................................... xiii
LIST OF APPENDICES ............................................................................................ xiv
CHAPTER ONE ........................................................................................................... 1
1.0. INTRODUCTION ................................................................................................. 1
1.1. Background ............................................................................................................ 1
1.2. Background of the study ........................................................................................ 2
1.3. Statement of the problem ....................................................................................... 5
1.4.0. Objectives of the study ........................................................................................ 6
1.4.1 General objectives ................................................................................................ 6
1.4.2 Specific objectives ............................................................................................... 6
1.5. Research question .................................................................................................. 6
1.6. Significant of the study .......................................................................................... 7
1.7. Scope of the research ............................................................................................. 7
1.8: Organization of the Study ...................................................................................... 8
CHAPTER TWO .......................................................................................................... 9
2.0. LITERATURE REVIEW ....................................................................................... 9
2.1: Introduction ............................................................................................................ 9
2.2. The profile of NMB bank Ltd ................................................................................ 9
2.3. Conceptual Definitions ........................................................................................ 10
2.3.1 SMEs .................................................................................................................. 10
2.3.2 SME‘s performance............................................................................................ 10
2.4: Theoretical review of the study. ............................................................................ 11
2.5: Challenges Faced By SMEs in Tanzania ............................................................. 16
viii
2.6 Empirical Review .................................................................................................. 19
2.6.1 Empirical Analysis of Relevant Studies Done Inside Tanzania ......................... 19
2.6.2 Empirical Analysis of Relevant Studies Done Outside Tanzania ...................... 24
2.7.0. Conceptual Frame Work Model ........................................................................ 28
2.7.1 Conceptual framework model ............................................................................ 28
2.7.2. Variables of the study ........................................................................................ 29
2.7.3. Hypothesis ......................................................................................................... 33
CHAPTER THREE ..................................................................................................... 35
RESEARCH METHODOLOGY ................................................................................ 35
3.1. Introduction .......................................................................................................... 35
3.2 Research design .................................................................................................... 35
Table 3.1: Composition of the sample ........................................................................ 37
3.3. Sources of data required ....................................................................................... 37
3.4 Questionnaire ........................................................................................................ 37
3.5 Data Processing and Analysis ............................................................................... 39
3.6 Quantitative data analysis technique ..................................................................... 40
3.7 Measurements of variables of the Study ............................................................... 40
CHAPTER FOUR ....................................................................................................... 43
PRESENTATION OF THE FINDINGS ..................................................................... 43
4.0. INTRODUCTION ............................................................................................... 43
4.1.0. General information of the respondent ............................................................. 44
4.1.1. Business experience of the respondent. ............................................................ 49
4.2. SMEs performance before taking bank loan ........................................................ 50
4.2.1 Average sale per day of the respondent before loan ........................................... 50
4.2.2. The average profit of the respondent before loan ............................................. 52
4.2.3. Employment status before bank loan ................................................................ 52
4.2.4. Level of investment before loan........................................................................ 53
4.2.5. Training of the respondent before taking bank loan ......................................... 54
4.2.6: Average household expenditure of family members before loan ...................... 54
4.3.0. SMEs performance after taking bank loan ........................................................ 55
4.3.1. Average sales per day of the respondent after loan ........................................... 55
4.3.2. Average business profit after taking bank loan ................................................. 57

ix
4.3.3: Employment status after bank loan ................................................................... 57
4.3.4: Level of investment after taking bank loan ...................................................... 58
4.3.5: Contribution of the business to the region after bank loan. .............................. 59
4.3.6: The effect of business performance after training ............................................ 59
4.3.7: Average household expenditure of family members after loan ........................ 60
4.3.8: Development made after taking bank loan ....................................................... 60
4.3.9: Increase/decrease of business performance after taking bank loan? ................ 61
4.3.10: Utilisation of the bank loan ............................................................................. 61
4.3.11: Major challenges that can threaten the business growth ................................ 62
4.3.12: Major challenges facing SMEs when requesting bank loan ........................... 62
4.3.13: Application of the loan by SMEs as per population ....................................... 63
4.3.14: Application of the loan by SMEs as per sample ............................................. 64
4.3.15: Recovery rate of the loan ................................................................................ 64
4.3.16: Borrowing interest rate vs. lending interest rate ............................................. 65
4.3.17: Total bank charges to borrower ....................................................................... 65
4.4. Hypothesis test through use of chi-square ........................................................... 66
4.5 Conclusion of the chapter ..................................................................................... 68
CHAPTER FIVE ........................................................................................................ 70
5.0. DISCUSSION OF THE FINDINGS .................................................................... 70
5.1. Introductions ........................................................................................................ 70
5.2. General background of information ..................................................................... 70
5.2.1: Gender and marital status of the respondents ................................................... 71
5.2.2: Education and age of the respondents ............................................................... 71
5.2.3: Source of fund to start-up of the business ......................................................... 72
5.2.4: The purpose of the loan ..................................................................................... 73
5.2.5: Business experience of the respondent ............................................................ 73
5.3 SMEs performance before and after bank loan ..................................................... 74
5.3.1 Average sale per day of the respondent before and after loan............................ 74
5.3.2 The average profit of the respondent before and after loan ............................... 75
5.3.3. Employees employed by the respondent before and after loan ........................ 76
5.3.4: Level of investment before and after loan ........................................................ 77
5.3.5: Training of the respondent before taking bank loan ......................................... 78

x
5.3.6: Household expenditure before and after loan .................................................. 78
5.3.7: Contribution of the business to the region after bank loan. .............................. 79
5.3.8: Development made after bank loan ................................................................. 80
5.3.9: Increase/decrease of business performance after taking bank loan .................. 80
5.3.10: Firm utilization of the bank loan ..................................................................... 81
5.3.11: The major challenges that can threaten the business growth .......................... 81
5.3.12: Challenges facing SMEs when requesting bank loan ..................................... 82
5.3.13: Application of the loan by SMEs to the NMB Bank. ..................................... 86
5.3.14: Recovery rate of the loan ................................................................................ 86
5.3.15: Borrowing interest rate vs. Lending interest rate ............................................ 87
5.3.16: Total bank charges to borrower ....................................................................... 87
5.4. Conclusion of the chapter .................................................................................... 87
CHAPTER SIX ........................................................................................................... 89
6.0 SUMMARY, CONCLUTIONS AND POLICY IMPLICATIONS ....................... 89
6.1. Introduction .......................................................................................................... 89
6.2: Summary of the findings. ..................................................................................... 89
6.3 Conclusion of the study ........................................................................................ 92
6.4. Recommendations ................................................................................................ 93
6.5: Policy implication ................................................................................................ 94
6.6. Limitations of the study ....................................................................................... 95
6.7. Areas for future studies ........................................................................................ 96
REFERENCES ........................................................................................................... 98
APPENDICES .......................................................................................................... 103
Appendix 1: Questionnaires for financing for SMEs................................................ 103
PART II ...................................................................................................................... 111
Appendix 2: Schedule of Activities ........................................................................... 115
Appendix 3: Budget for the Research Study and source of fund .............................. 116

xi
LIST OF TABLES
Table: 2. 1. Employment status from 1985-2000 in Bangladesh ................................ 12
Table: 2.2. SME participation and contribution to the economy (selected countries) 13
Table 2. 3: Summary of variables from other studies ................................................. 28
Table 3.1: Composition of the sample ........................................................................ 37
Table 3.2: Variables and their measurements in the SPSS ......................................... 42
Table. 4.1: The gender of the respondent .................................................................... 44
Table 4.2: Marital status of the respondent ................................................................ 45
Table 4.3: Age of the respondent ................................................................................ 45
Table 4.4: The education background of the respondent ............................................ 46
Table 4.5: Categories of the business of the respondent ............................................. 47
Table 4.6: The source of funds for start-up of the business ........................................ 48
Table 4.7: Purpose of the loan ..................................................................................... 49
Table 4.8: Business experience of the respondent ...................................................... 49
Table 4.9: Average sales per day before taking loan ................................................... 50
Table 4.10: Average profit before loan ........................................................................ 52
Table 4.11: Employment status before bank loan ....................................................... 52
Table 4.12 Level of investment before loan .............................................................. 53
Table 4.13: Training of the respondent before taking bank loan ............................... 54
Table 4.14: Household expenditure before loan ........................................................ 54
Table 4.15: Average sales per day of the respondent after loan .................................. 55
Table 4.16: Average business profit after taking bank loan. ....................................... 57
Table 4.17: Employment status after taking bank loan .............................................. 57
Table 4.18: Average investment after taking bank loan ............................................. 58
Table 4.19 (a): SMEs contribution to the region ........................................................ 59
Table 4.19(b): Contribution of SMEs to the Lindi region through payment of taxes. 59
Table 4.20: The effect of business performance after training .................................... 59
Table 4.21: The average expenditure of family members after loan.......................... 60
Table 4.22: Development made after bank loan ......................................................... 60
Table 4.23: Business performance after taking bank loan .......................................... 61
Table 4.24: firm utilised the bank loan ..................................................................... 61
Table 4.25: The major challenges that can threaten your business growth ................. 62

xii
Table 4.26: Challenges facing SMEs when requesting bank loan .............................. 62
Table 4.27(a): Application of the loan by SMEs as per population ............................ 64
Table 4.27(b): Application of the loan by SMEs as per sample .................................. 64
Table 4.28: Recovery rate of the loan ......................................................................... 64
Table 4.29: Borrowing interest rate vs. Lending interest rate ..................................... 65
Table 4.30: Total bank charges to borrower ................................................................ 65
Table 4.31: Relationship between NMB financing and SMEs performance .............. 65
Table 4.32: Chi-Square test on average sales before and after loan ........................... 66
Table 4.33: Chi-square test on average profit before and after loan ........................... 67
Table 4.34:Chi-square test on employment before and after loan .............................. 67
Table 4.35 Chi-square test on owner‘s development before and after loan ............ 68

xiii
LIST OF FIGURES
Figure: 2.1: Conceptual Frame Work Model ............................................................. 30
Figure 4.1: The gender of the respondent ................................................................... 44
Figure 4.2: Age of the respondent ............................................................................... 45
Figure 4.3: The education background of the respondent ........................................... 47
Figure 4.4: Categories of the business of the respondent ........................................... 48
Figure 4.5: Average sales per day before taking loan ................................................. 51
Figure 4.6: Employment status before bank loan ....................................................... 53
Figure 4.7: Average sale per day of the respondent after loan .................................... 56
Figure 4.8: Employment status after taking bank loan ............................................... 58
Figure 4.9: Challenges facing SMEs when requesting bank loan............................... 63

xiv
LIST OF APPENDICES
Appendix 1: Questionnaire for SMEs ...................................................................... 103
Appendix 2: Schedule of Activities .......................................................................... 115
Appendix 3: Budget for the Research Study and source of fund ............................. 116
1
CHAPTER ONE
1.0. INTRODUCTION
1.1. Background
Small and medium-sized enterprises (SMEs) are the backbone of all economies by
serving as a key source of economic growth, dynamism and flexibility in advanced
industrialised countries, as well as in emerging and developing economies
(Christen,1997). SMEs constitute the dominant form of business organisation,
accounting for over 95% and up to 99% of enterprises depending on the country.
They are responsible for between 60-70% net job creations in Organization for
Economic Cooperation and Development (OECD) countries. Small businesses are
particularly important for bringing innovative products or techniques to the market.
Most large companies usually start as small enterprises, so the ability of SMEs to
develop and invest becomes crucial to any economy wishing to prosper. For
example, Microsoft may be a software giant today, but it started off in typical SME
fashion, as a dream developed by a young student with the help of family and
friends. For example, when Bill Gates and his colleagues had a saleable product
were they able to take it to the marketplace and look for investment from more
traditional sources (OECD, 2006).
Financing has been identified in many studies as the most important factor
determining the survival and growth of small and medium-sized enterprises (SMEs)
in both developing and developed countries(Ayyagari et al,2007; Iwodu,2010; Pietro
et al ; 2012). Access to financing allows SMEs to undertake productive investments
to expand their businesses and to acquire the latest technologies, thus ensuring their
competitiveness and that of the nation as a whole. Poorly functioning financial
systems can seriously undermine the microeconomic fundamentals of a country,
resulting in lower growth of income and employment (OECD, 2006). Like other
countries of the world, SMEs in Tanzania have the tendency to serve as sources of
livelihood to the poor, create employment opportunities (contribution to job
2
creation), generate income, and contribute to economic growth and social
development (poverty alleviation).
SMEs have been recognized by several governments of developing countries to be
the industry of supplying the resources to the extent that they now include them in
their development plans. Despite increasing its roles, these enterprises are facing
numerous obstacles that limit their performance, growth and development. Among
the difficulties faced by SMEs, the access to finance is often reported as a major
obstacle to the deployment and expansion of their activity. From theoretical point of
view we have a number of financing models to the SMEs. Examples of these
financing models includes: equity financing as external source, debt financing,
corporate bond, venture capital and many other financing. The possibilities of SMEs
for using equity financing are limited since the majority of these SMEs are privately
managed. SMEs tend to be heavily reliant on commercial banks as a source of debt
financing (Berry et al., 2002). Therefore from the above fact, my study was
concentrated only on debt financing which are bank loans. The objective of this work
was to assess the effect of NMB financing to SMEs performance which was not
known.
1.2. Background of the study
The concept of the effect of financing SMEs for their operational performance in
Africa and in the rest of the world is increasing from time to time. In Tanzania, the
SME sector is an outcome of structural adjustment policy rather than design. In
Socialism framework, the private business sector was actively discouraged in favour
of public enterprises, which were government owned, community based, or
cooperative owned ventures (Rugumamu and Mutagwaba 1999).To insist that,
different regulations were introduced to restrict civil servants, government officials
and political leaders to engage in business activities. Since almost all educated
people were members of the civil service at that time, it is obvious that business
activities were left to people who had no education at all. The reliance on
government discretion in decision-making has resulted in a culture of dependency on

3
government among most Tanzanian people to date (Rugumamu and Mutagwaba,
1999). In fact, this approach has contributed to the stifling of the development of
entrepreneurial values such as the need for achievement, personal initiatives,
creativity, willingness to take risks and related behaviours (Olomi, 2009). In 1967
after Arusha declaration, was followed by mass Nationalization i.e. all privately
business entities were taken over by the government and all services became
centrally provided by the government itself. However, nationalization of the private
sector led to a poor economy marked by a number of macro-economic imbalances,
and consequently, an economic crisis that lasted for over a decade (Kanaan, 2000).
This crisis also led to the erosion of purchasing power among salaried people
(Olomi, 2009). Thus, Tanzanian people were forced to establish small businesses
(petty business) to supplement their meager incomes. Succumbing to pressure from
the World Bank, the Tanzanian government changed its policy from a state-led
economy to a market-driven economy. In fact, the final reform took place in 1991,
leading to privatization of most public enterprises (Rutashobya and Olomi, 1999).
The privatization of state enterprises and the disengagement of the government from
some activities resulted in the retrenchment of salaried employed workers from the
public sector and, as a result, most of these workers turned to micro enterprises for
survival (Bagachwa and Maliyamkono, 1990; Olomi 2009). From the above
experience, the SMEs sector nowadays has become a very significant topic in the
Tanzanian economy.
―Finance is the oil for growth for SMEs. It is indeed the life-blood of the economic
system. The financial system is the vessel that carries this life-blood through the
economic system. Faulty vessels prevent the life-blood from reaching essential parts
of the economic system‖. (Sowah N.K., 2003). According to the Informal Sector
Survey of 1991, micro enterprises operating in the informal sector alone consisted of
more than 1.7 million businesses engaging about 3 million persons that were about
20% of the Tanzanian labour force, and it was estimated that about one- third of the
gross domestic product (GDP) originates from the SME sector. At present,
unemployment is a significant problem that Tanzania has to deal with. Estimates
show that there are about 700,000 new entrants into the labour force every year.

4
About 500,000 of these are school leavers with few marketable skills. The public
sector employs only about 40,000 of the new entrants into the labour market, leaving
about 660,000 to join the unemployed or the underemployed reserve. Most of these
persons end up in the SME sector, and especially in the informal sector. Given that
situation and the fact that Tanzania is characterised by low rate of capital formation,
SMEs are the best option to address this problem- United Republic of Tanzania
(URT, 2002). Other study revealed that, SMEs in Tanzania are estimated to
contribute 30–35% of GDP and about 20–30% of the labour force (Mittah, 2009).
There are approximately two million seven hundred (2.7m) Micro, small and
medium-sized enterprises (MSMEs) in Tanzania; sixty percent of these are located in
urban areas. Most (98%) of MSMEs are micro enterprises employing less than 5
people (Kashangaki, 2005). As shown in 1991 survey, SMEs contribution to GDP
was about 33 % and in 2006 the GDP was 35 % which makes the difference of 2 %
for fifteen (15) years with an average increase of 0.133 % per year. Also as reported
that, every year there are about 700,000 new entrants into the labour force out of
which 40,000 are employed in the public sector and 660,000 unemployed which
represents 5.7 % and 94.3 % respectively.
Previous studies have highlighted the limited access to financial resources available
to small enterprises compared to large organizations and the consequences for their
growth and development (Levy, 1993). Empirical findings by Beck et al (2002)
indicated that firms that reported being constrained by the need for special
connections with banks have significantly lower rates of growth. Increasing access to
financial services especially by the poor is an important for poverty reduction.
Provision of micro-finance in the form of loans to the self-employed poor gives
recipients a chance to start up small businesses and build them into enduring sources
of steady income. In Tanzanian, SMEs have consistently cited the problem of finance
as principal constraint on their development and growth. In survey of 136 small firms
in Tanzania (Satta, 2003) found that 63% of them consider difficulties in accessing
finance from financial institutions as the major constraint to their development.
From the background of this study, it motivates me to focus on the effect of the NMB
financing on the performance of SMEs in Lindi.

5
1.3. Statement of the problem
It is observed from the background that inadequacy in financing is the major problem
coming in the way of development of SMES in Tanzania in spite of number of
financial institutions including commercial banks channelizing their funds to SME
sector. It gives rise to two important issues one inadequacy in financing and other is
whether the financing helping the SMEs in improving their performance. The first
issue was addressed by many researchers but second issue is yet to be tapped
adequately. The following aspects necessitated to take up this study:
It was understood through literature review banks and financial institutions do not
prefer to lend to SMEs sector due high risk involved and uncertainty of recovery of
funds. The interest cost is excelling the returns and failed to repay the loans keeping
SMEs viability at stake. In the area of inadequacy of financing many studies were
there and some of which are quoted in background of the problem but with regard to
impact of financing on the performance peripheral studies are observed which
motivated me to take up this study.
These aspects call for a separate study to enquire the impact of financing on the
performance of SMEs based on some case study. For this purpose the case of NMB
financing to SMEs in Lindi region and its effect on financial performance is taken up
for this study. The bank and the region chosen for this study due to following unique
features:
Lindi region is one of the remote areas with poor infrastructure among all the
regions in Tanzania.
NMB bank as pointed out that, it is the largest bank in Tanzania, and it has
one hundred forty three (143) branches over the country. While CRDB bank
Ltd and NBC bank Ltd have eighty five (85) and fifty three (53) branches
respectively.
Even in Lindi NMB bank have more customers as compared to other
commercial banks.
It was observed that several studies have been conducted on the importance of SMEs
for economic growth in various countries, but no specific study has been conducted

6
on the effect of NMB financing on performance of SMEs in Lindi and their effects of
financing are not known. The similar studies which have been done in Tanzania
includes: Kessy& Urio (2006), Contribution of microfinance Institutions to poverty
alleviation to SMEs. The findings were that, there was a positive change in the
standard of living of SMEs. But what other parameters like profit, sales, new
employment, and investment, economy effect. Other study was conducted by
Kuzilwa (2005). The role of credit for small business success: A study of the
National entrepreneurship development. The findings was that, increased firm
output. What particular kind of output was not mentioned? The study was therefore
set to bridge this knowledge gap. The variables set under this study were:
income/profit, sales, investment, employment, economy effect, socio-economic
effect of the owners.
1.4.0. Objectives of the study
1.4.1 General objectives
The general objective of this study was to assess the effect of Bank Financing on
Performance of Small and Medium-Sized Enterprises (SMEs) before and after
financing which was conducted in Lindi Municipal.
1.4.2 Specific objectives
(i) To study and analyse the effects of NMB financing to SME‘s operational
performance
(ii) To study the effects of NMB financing on socio- economic status of the
borrowers (SMEs owners)
(iii) To assess the challenges that SMEs are facing on the availability of funds
from NMB.
1.5. Research question
A research question is a concise, interrogative statement. In qualitative a research
question leads in the direction of gaining a deeper understanding of the phenomenon
under study (Brink, 2001:90, Shank, 2002:99). The research questions were designed

7
to guide the study. Therefore, the research questions which were designed are as
follows:
(i) What are the effects of NMB financing on SME‘s operational
performances?
(ii) What are the effects NMB financing on socio- economic status of the
borrowers?
(iii) What are the challenges that facing SMEs on the availability of funds
from NMB?
1.6. Significant of the study
The research findings in future may be relevant with respect to the following facts:
1. The study may generate new knowledge to the researcher, other researchers
and may add value to the business community as a whole.
2. The research may help to identify SMEs key risk areas and suggest ways to
minimise in the future.
3. The expected results may help in solving the problem of SMEs performance
with regard to access to financial services.
4. The research may assist the government to effectively implement the SMEs
policy.
5. The study may help to bridge the research gap.
6. This study help or be used as reference to similar topics in future.
7. This dissertation is partial of the fulfilment of the award of Master Degree in
Accounting and Finance of Mzumbe University.
1.7. Scope of the research
The study sought to find out the effect of NMB financing on performance of SMEs.
The study was conducted in Lindi municipal and the study findings relate to the
period between 2010 and 2011. The researcher made the contact to the following
sections:
1. Head of NMB: to meet with Branch manager for familiarization of the branch
activities.
8
2. The Finance department: to meet with Branch Accountant and
3. Staff officers(Loan officers) who were responsible for receiving and
processing the application for loan
1.8: Organization of the Study
The study is divided into six chapters namely:
Chapter one is the general introduction and backgrounds. It explains on the
setup of small and medium-sized enterprises (SMEs) and it focuses on the
effects of loans on SMEs performance and presents problems identified. It also
presents the research objectives, research questions, scope of the research and
significant of the study.
Chapter two reviews literature related to the problem under study. It mainly
reviews literature on Small and medium enterprises and access to finance.
Chapter three elaborate about data collections and how and the data was
analysed and interpreted with an assistance of SPSS
Chapter Four: Presentation of the findings
Focuses on the presentation of the data and analysis of the data collected.
Chapter five: Discussions of the findings
Chapter six: Summary, conclusions, and policy implications.

9
CHAPTER TWO
2.0. LITERATURE REVIEW
2.1: Introduction In this chapter, the researcher presents the literature related to the interest of the
study and how about the other authors and researchers have said; it covered the
literatures on bank financing on performance of SMEs, conceptual definitions of
various terms which are crucial in literature, critical theories of related subject which
clearly shows related references of the subject, empirical studies which was
considered various reports of related subject conceptual framework and hypotheses.
2.2. The profile of NMB bank Ltd
In, 1997 the National Microfinance Bank LTD incorporation Act established the
National Microfinance Bank. NMB is the largest bank in Tanzania, both when
ranked by customer base and branch network. With over 143 branches which are
located in more than 80% of Tanzania's districts. This broad branch network
distinguishes NMB from other financial institutions in Tanzania. NMB bank Ltd
registered for Dar es Salaam Stock Exchange (DSE) on 6/11/2008. They are
committed to sustaining and enhancing their branch networks in order to provide
access to capital to citizens in all areas of Tanzania, including the most remote. The
bank offers a wide range of microfinance and related services which are affordable to
SMEs. Those services include:
Micro and Small Enterprises (MSE) Loans
These are small loans to Micro and Small Entrepreneurs to expand small and
sustainable business. Applicant can borrow from TZS 100,000 to a maximum of TZS
7,500,000
Small and Medium Enterprises (SMEs) Loans
These are small and medium financing from TZS seven million five hundred
thousand to TZS one billion depending on the size, nature and viability of the
enterprise to be financed. The credit tenor / term depend on repayment capacity,
anticipated cash flows, credit amount and credit purpose.

10
2.3. Conceptual Definitions
2.3.1 SMEs
The SMEs nomenclature is used to mean micro, small and medium enterprises. It is
sometimes referred to as micro, small and medium enterprises (MSMEs). The SMEs
cover non-farm economic activities mainly manufacturing, mining, commerce and
services. There is no universally accepted definition of SME. Different countries use
various measures of size depending on their level of development. SMEs are widely
defined in terms of their characteristics, which include the size of the capital
investment, the number of employees, the turnover, the management style, the
location, and the market share (Louis et al, 2003). But in the context of Tanzania,
SMEs are those engaging up to 4 people, in most cases family members or
employing capital amounting up to Tshs.5.0 million. The majority of micro
enterprises fall under the informal sector. Small enterprises are mostly formalized
undertakings engaging between 5 and 49 employees or with capital investment from
Tshs.5 million to Tshs.200 million. Medium enterprises employ between 50 and 99
people or use capital investment from Tshs.200 million to Tshs.800 million.
(Tanzania SMEs policy, 2002)
2.3.2 SME’s performance
It is also important to know the definition of the word performance so that one can
know what it is and how it can be used.
According to Brown (1996), performance measures must focus attention on what
makes, identifies and communicates the drives of success, support organization
learning and provides a basis for assessment and rewards. On the other hand (West
and Fair, 1996), define performance as a function of an organization‘s ability to meet
its goals and objectives by exploiting the available resources in an efficient and
effective way. (Stoner, 1989) adds that performance entrails effectiveness which
refers to the firm‘s ability to serve and produce what the market requires at a
particular time and efficiency, which means achieving the objectives at the lowest
cost possible with highest possible benefits. (Balunywa, 1989) looked at performance
11
in terms of competitive performance, financial performance, and quality of service,
flexibility, resource utilization and innovation. Studies by (Whyte, 1991) show that
performance can be measured at both organization and individual levels and this
measurement is sometimes referred to as performance appraisal. He urges that
organizations have desired potentials in terms of capacity attraction, market share
and financial strength and that performance is the difference between those potentials
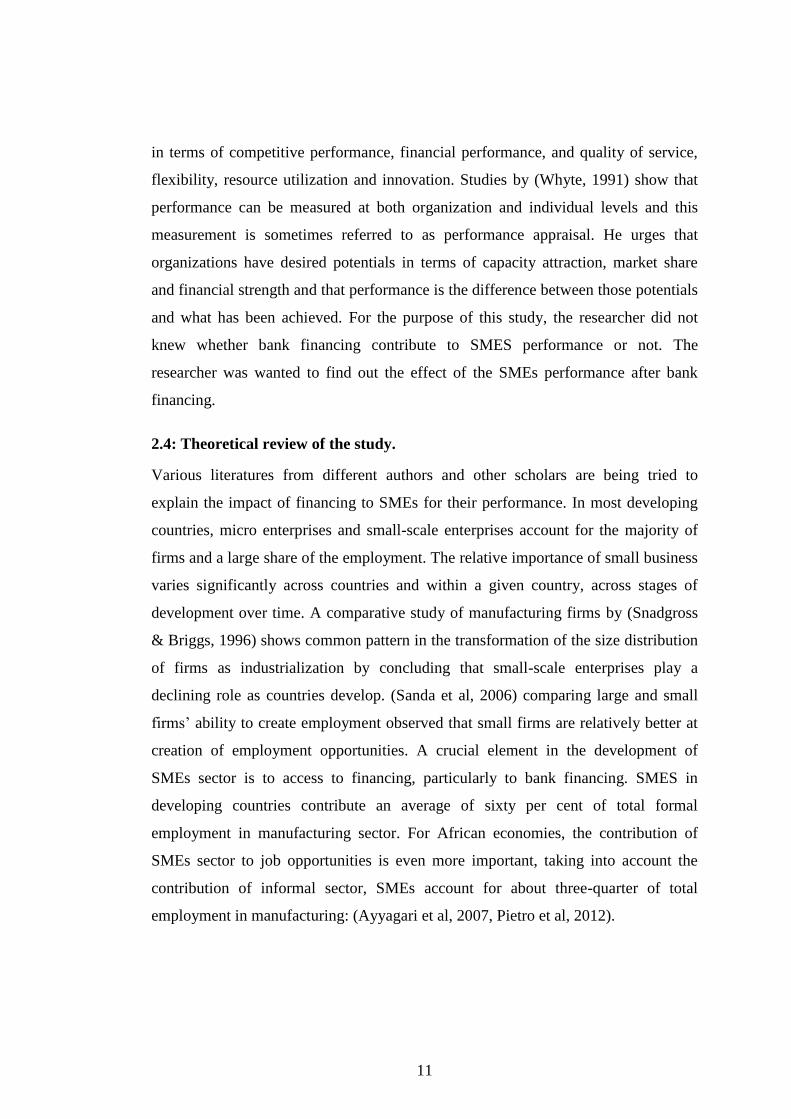
and what has been achieved. For the purpose of this study, the researcher did not
knew whether bank financing contribute to SMES performance or not. The
researcher was wanted to find out the effect of the SMEs performance after bank
financing.
2.4: Theoretical review of the study.
Various literatures from different authors and other scholars are being tried to
explain the impact of financing to SMEs for their performance. In most developing
countries, micro enterprises and small-scale enterprises account for the majority of
firms and a large share of the employment. The relative importance of small business
varies significantly across countries and within a given country, across stages of
development over time. A comparative study of manufacturing firms by (Snadgross
& Briggs, 1996) shows common pattern in the transformation of the size distribution
of firms as industrialization by concluding that small-scale enterprises play a
declining role as countries develop. (Sanda et al, 2006) comparing large and small
firms‘ ability to create employment observed that small firms are relatively better at
creation of employment opportunities. A crucial element in the development of
SMEs sector is to access to financing, particularly to bank financing. SMES in
developing countries contribute an average of sixty per cent of total formal
employment in manufacturing sector. For African economies, the contribution of
SMEs sector to job opportunities is even more important, taking into account the
contribution of informal sector, SMEs account for about three-quarter of total
employment in manufacturing: (Ayyagari et al, 2007, Pietro et al, 2012).
12
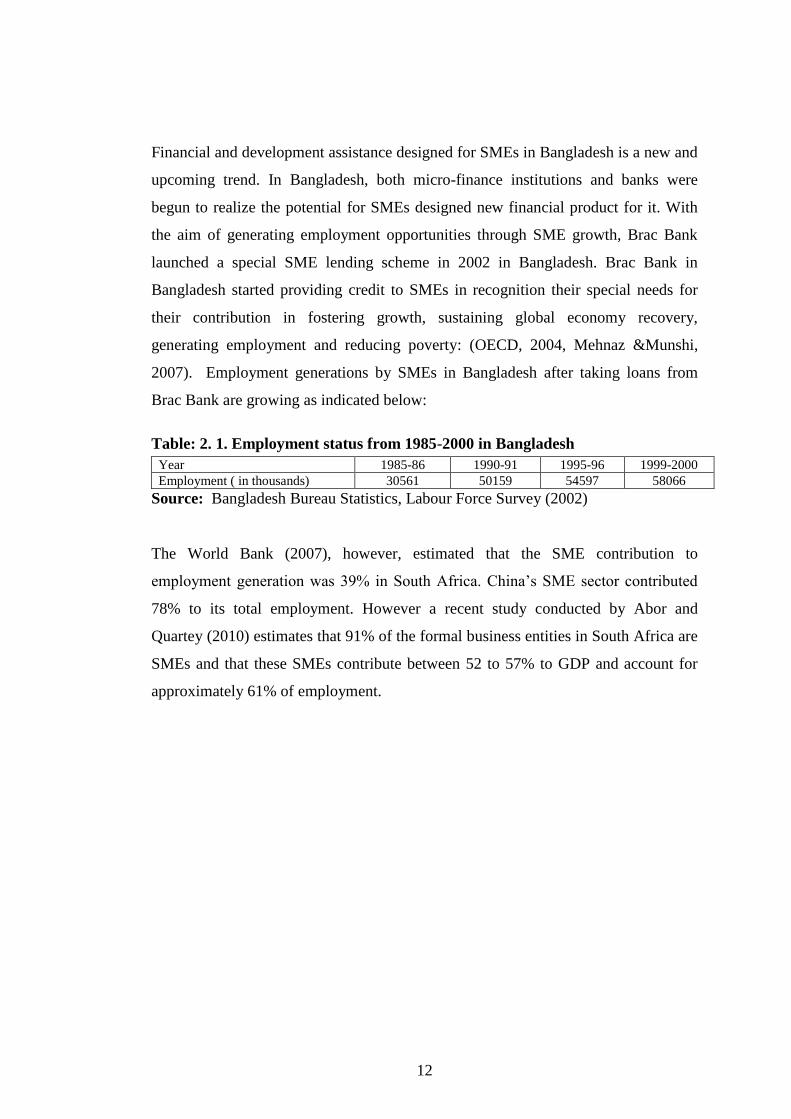
Financial and development assistance designed for SMEs in Bangladesh is a new and
upcoming trend. In Bangladesh, both micro-finance institutions and banks were
begun to realize the potential for SMEs designed new financial product for it. With
the aim of generating employment opportunities through SME growth, Brac Bank
launched a special SME lending scheme in 2002 in Bangladesh. Brac Bank in
Bangladesh started providing credit to SMEs in recognition their special needs for
their contribution in fostering growth, sustaining global economy recovery,
generating employment and reducing poverty: (OECD, 2004, Mehnaz &Munshi,
2007). Employment generations by SMEs in Bangladesh after taking loans from
Brac Bank are growing as indicated below:
Table: 2. 1. Employment status from 1985-2000 in Bangladesh
Year 1985-86 1990-91 1995-96 1999-2000
Employment ( in thousands) 30561 50159 54597 58066
Source: Bangladesh Bureau Statistics, Labour Force Survey (2002)
The World Bank (2007), however, estimated that the SME contribution to
employment generation was 39% in South Africa. China‘s SME sector contributed
78% to its total employment. However a recent study conducted by Abor and
Quartey (2010) estimates that 91% of the formal business entities in South Africa are
SMEs and that these SMEs contribute between 52 to 57% to GDP and account for
approximately 61% of employment.

13
Table: 2.2. SME participation and contribution to the economy (selected countries)
Country name SMEs SMEs employment(% total)
Brazil 4,903,268 67.0
China 8,000,000 78.0
Egypt 1,649,794 73.5
UK 4,415,260 39.6
Ghana 25,679 66.0
India 295,098 66.9
Mexico 2,891300 71.9
Malawi 747,396 38.0
Russia Federation 6,891,300 50.5
United States 5,868,737 50.9
South Africa 900,683 39.0
Source: World Bank (2007).
The main argument for favouring SMEs in developing countries is that they are
increasingly playing a strategic role in economic growth and development through
their contribution in the creation of wealth, employment, and income generation. In
more developed economies, the dynamic arguments for the existence of SMEs have
been stressed in terms of their being more innovative and constituting a seedbed for
the development of new firms. For example in Uganda, SMEs are increasingly
taking the role of the primary vehicles for the creation of employment and income
generation through self-employment, and therefore, have been tools for poverty
alleviation. SMEs also provide the economy with a continuous supply of ideas, skills
and innovation necessary to promote competition and the efficient allocation of
scarce resources (Kasende & Opondo, 2003).
The SMEs have been accepted as the engine of economic growth and for promoting
equitable development. The major advantage of the sector is its employment
potentials at low capital cost. The labour intensity of the SME constitutes over 90%
of total enterprises in most of the economies and is credited with generating the
highest rate of employment growth and account for major share of industrial
production and exports (Government of India, 2007), and the rapid expansion of
14
small enterprises in economies of developed countries in the 1980s and 1990s has
created a widespread conviction that small, new ventures are the most important
source of entrepreneurship and as a dynamic and innovative factor, they contribute
directly to economic growth. However, the SMEs sector is faced with many
constraints. Among them is the most pressing one known to be financing (Idowu. F.
Christopher, 2010).
Small and Medium Sized Enterprises are the most common employers across the
world. In 48 out of 76 nations covered in Ayyagari, Beck and Demirgüç-Kunt
(2007), SMEs employed more than 50% of the formal workforce. In addition,
(Ayyagari, Demirgüç-Kunt and Vojislav, 2011) find that small firms and mature
firms have the highest levels of total employment and small firms and young firms
have the highest rates of job creation. SMEs are a fundamental part of a dynamic and
healthy economy.
Consequently, it is important to understand the different factors that can help or
hinder SME creation and development (Veselin et al., 2012).
Small businesses are started in developing countries at a considerably high rate as
they make contribution to economic development.( Malcolm Harper, 1984) is of the
opinion that income is the outcome of employment, employment generation,
therefore, is the main goal of poor countries. The small business, according to
Harper, has displayed a remarkable capacity to absorb unemployed. Traditional
microeconomic theory treats finance as a corporate factor of production. Irrespective
of firm size and age, finance is normally required for three standard uses, that is for
capital investment (start up or expansion) in machinery and acquisition of premises
(building), financing working capital during start- up or while expanding and
purchase of operating materials. Implementation of entrepreneurial activity can only
happen when these factors are in place; otherwise the activity has to be aborted.
Financing factors of production can be undertaken from own savings (in the case of
start ups), or external funds (for start ups and on-going businesses). Credit becomes
important when internal sources of finance are inadequate for an envisaged

15
entrepreneurial activity (Kristiansen, 2001). This role is particularly critical in the
national efforts to eradicate poverty. SMEs also serve as a training ground for
emerging entrepreneurs as well as forming the backbone of the indigenous private
sector. Finance has been observed to be one of the important determinants of the
small business success. Credit is an important source of finance for the businesses
start or growth. For example, a number of support institutions have mushroomed in
Tanzania since the onset of economic reforms in mid 1980, extending credit to
SMEs, thus filling the gap left by commercial banks to large firm financing. Despite
the relatively long experience with funding micro and small enterprises in Tanzania,
little research has been conducted to assess the effect of such funding on the
businesses(SMEs Development policy,2002). Lack of access to credit has been
identified as one of the major constraints hindering the development of small
businesses, and therefore the supply of entrepreneurial activities not just Tanzania,
but in other developing countries (Bagachwa et al. 1993). Commercial banks have
traditionally concentrated on lending mainly to large formal enterprises which posses
collateral and, therefore, though to be risky.
Women World Bank (1995) estimated that worldwide, less than 2 % of low-income
entrepreneurs have access to financial services. Despite the above starting statistics
on the low rate of access to credit, there are some concerns that the role and
importance of (institutional) credit in the dynamics of business growth may be
overrated (Tomeck, 1998). Important questions are to what extent is lack or
inadequacy of credit contributing to the low level or failure of entrepreneurial
activities in Tanzania? Are enterprises that have not received credit within a given
setting? What is the effect of credit on entrepreneurial activities and how can it be
measured? These are both theoretical and empirical questions. Although the role of
credit as a determinant for successful entrepreneurial activity may look obvious when
using a partial analysis, the dynamics in the entrepreneurial process makes this role
less obvious. The analysis of an entrepreneurial activity shows that finance does not
in itself create economic opportunities. Rather it is entrepreneurial people who see
ways in which they can generate income from situations, skills or contact or other

16
push factors (Christen, 1997). It is in this context that the role of credit should be
seen that financing enhances the ability of entrepreneurs to take advantage of these
opportunities, thereby leading to success. Lack of it could lead to business failure.
Entrepreneurial success could be defined in a conventional sense in terms of a
profit‘s generation and growth in terms of employment, output, sales, etc over time.
Through growth a firm can graduate from one size to a higher one. In addition, firms
that are also realizing results like increased employment of family members,
increased household welfare (increased access to education, health, better housing)
and those that are able to survive under intense competition are also included.
2.5: Challenges Faced By SMEs in Tanzania
Despite the role played by SMEs in employment creation, income generation and
poverty alleviation, and government effort to develop the sector, SMEs in Tanzania
are currently faced with many serious challenges which act as a barrier to their
emergency and growth. These barriers or challenges to the SMEs include: perception
to risk, high interest rates, inadequate business skills, collateral, tax policy and
transaction cost. These challenges are explained below:
1. Risk perception.
The enterprises are perceived as risky, in most cases, the death of the owner leads to
the death of the business. This is because the majority of owners and the business
are the same. Also another challenge for banks is to acquire information about the
credit risk of the borrower, as borrowers have more information than the lender about
the projects (Myers & Majluf, 1984). Existing contract theory argues that banks are
not interested in offering credit to SMEs because it is particularly difficult to
overcome information asymmetries and resulting screening, monitoring, and
enforcement problems. Under asymmetric information conditions banks are
uncertain about the future behaviour of the borrower in terms of repaying the loan.
Asymmetric information problem are more likely to occur when banks deal with
SMEs due to higher opacity of these firms (Berger et al. 2001; Beck et al. 2004;
Hyytinen and Pajarinen, 2008; Cole, 2004). Information asymmetry between SME
17
borrowers and the banks is reflected in inability of the majority SMEs to provide up
to date reliable financial information and realistic business plans, which increases the
cost of lending that banks incur while dealing with these SMEs. Consequently limits
the ability of banks to assess the creditworthiness of the individual SME borrowers.
The argument of information asymmetry is supported by (Olomi, 2009) who
emphasised that poorly compiled records and financial account coupled with
inability of SMEs to properly express their knowledge about business opportunities
aggregates the lack of adequate information in bank-SME credit transactions in
Tanzania. Temu (1998) affirm that financial institutions in Tanzania are reluctant to
finance small and medium firms for fear of default risk due to unreliable financial
plans and records. (Satta ,2003; 2006) amplify this argument by pointing out the
lack of adequate and reliable collateral, lack of appropriate instrument to manage
risk, not being familiar with complicated information about SMEs and perceived risk
make banks in Tanzania become unwilling to provide the much-needed finance to
SMEs. Under these circumstances, literature shows that were information asymmetry
exist banks will ration the supply of credit and in addition will tighten requirements
such as collateral in order to protect themselves from likely opportunistic behaviour
of dishonest borrowers.
2. Borrowing interest rate
Interest rate represents the cost of borrowing or the cost of obtaining money from the
borrower‘s point of view. Those who are able to access credit are faced with high
interest rates and short repayment periods making it very difficult to embark on any
development or expansion projects. Interest rates tend to remove some of profits that
are made in business that make loans to operate. From theoretical point of view it is
expected that demand for credit is positively related to low interest rates charges.
This is because if borrowers are charged lower it is easier for them to access and
repay because will be having a low burden compared to high interest rate which
motivates default and inability to run the business. There are several schools of
thought regarding the interest rates like (Berger & Udell, 1996).
18
3. Business management skills
Managerial competencies are sets of knowledge, skills, behaviours and attitudes that
contribute to personal effectiveness (Hellriegel et al, 2008). Managerial
competencies are very important to the survival and growth of new SMEs. (Martin &
Staines, 2008) found that lack of managerial experience and skills are the main
reasons why new firms fail. The ability of managers to perform has a very important
bearing on the performance of business. The sources of many managerial problems
in SMEs are lack of education and professional training. SMEs generally lack of
managerial adequacy and competence as most of them are controlled by managers
who lack modern management techniques required by ever-changing markets and
increasing intensity of competition. Today, owners/managers of small firms must be
familiar with many aspects of management such as finance, personnel, production
etc. Many studies indicated that entrepreneurs perform poorly in many areas of
management such as bookkeeping i.e. poor and unreliable financial records which
makes financial review difficult, marketing, costing, stock control, warehousing,
production scheduling and quality control (Temtime & Pansiri, 2000).
4. Collateral
Cuevas et al (1993) indicates that access to bank credit by SMEs has been an issue
repeatedly raised by numerous studies as a major constraint to industrial growth. A
common explanation for the alleged lack of access to bank loan by SMEs is their
inability to pledge acceptable collateral. Collateral requirement has been identified
by many literatures like: (Aryeetey et al, 1994, Abor & Biekpe, 2006) the experience
from Ghana as a factor affecting the demand for credit in SMEs. Most of the SME‘s
lack sufficient collateral requirements compared to large firms. When businesses
commence, there is hardly any collateral to present for obtaining financial aid.
Lending without collateral to SMEs is extremely risky from the lender's viewpoint.
In such situation where some SMEs are able to provide collateral, they often end up
being inadequate for the amount they needed to embark on their projects as SMEs
assets- backed collateral are usually rated at ‗carcass value‘ to ensure that the loan is

19
realistically covered in the case of default due to the uncertainty surrounding the
survival and growth of SMEs (Binks et al, 1992).
5. Tax policy and transaction costs
According to Tomlin (2008), economists argue that the resources smaller companies
direct towards tax compliance are resources that could otherwise be used for
reinvestment, facilitating future growth. Hence, there is a belief that taxes and a
complex tax system put disproportionate pressure on smaller businesses. Small
taxpayers under the regular system of taxation are discriminated against, since the
compliance requirements, cost of compliance and tax rate are the same for both small
and large enterprises. Furthermore, SMEs usually have to operate in an overbearing
regulatory environment with the plethora of regulatory agencies, multiple taxes,
cumbersome importation procedure and high port charges that constantly exert
serious burden on their operations. Also high start-up costs for firms, including
licensing and registration requirements, can impose excessive and unnecessary
burdens on SMEs. Most SMEs feel they lack capacity to deal with governments in
general. Costs of compliance are high and are seen as a threat to SMEs development.
SMEs loan requirement are small so the cost of processing the loan tend to be high
relative to the loan amounts. According to Cuevas et al. (1993) cost of transaction
contributes to the inability of the SMEs to access finance.
From this study it revealed that, NMB Financing to SMEs has positive effect for new
employments (job creations), more profit generations and sales (increase of tax base)
and investment level. The findings therefore, conform to the data quoted from
Bangladesh Bureau Statistics (1985-2000) and World Bank data (2007).
2.6 Empirical Review
2.6.1 Empirical Analysis of Relevant Studies Done Inside Tanzania
Kuzilwa (2005) conducted study on the role of credit for small business success in
Tanzania. The main objective was to study the effect of special credit to small and
micro enterprises on entrepreneurial activities. The research design used was ex-post
facto research, in which it is systematic empirical inquiry in which the researcher

20
cannot have direct control of variables because their manifestations have already
occurred or because they are inherently not manipulated. This is involves of testing
theories, hypotheses, identify behavioral phenomena and study conditions under
which a phenomenon occurs. From this study the independent variables was
identified as education, gender, size of the loan, while the dependent variable was
small business performance.
The findings reveal that the output of enterprises increased following the access to
the credit. It was further observed that the enterprises whose owners received
business training and advice, performed better than those who did not receive
training. He was recommended that an environment should be created where
informal and quasi-informal financial institutions can continue to be easily be
accessed by SMEs. A knowledge gap is that the study was relating to special credit
small and micro enterprises on entrepreneurial activities funded under National
Entrepreneurial Development Fund (NEDF) in Tanzania through SIDO loan, but this
study relate to the effect of bank (NMB) financing on performance of small and
medium-sized enterprises (SMES) in Lindi. However the study employed both case
studies and survey but this study employs case study (exploratory) design. My
observation to the researcher is that, although the independent variables have been
shown as contributors to SMEs success, but there is no proper analysis as to what
extent to each variable has the effect in terms of performance. For example loan, the
researcher said contributed good small business success. He did not analyse how
much loan was applied for, how much was granted and what was the gap of the loan.
Apart from knowledge gap stated above, part of the theory together with citation it is
still relevant to this study and other studies.
Kessy &Urio (2006) conducted study on the contribution of microfinance Institutions
(MFIs) to poverty reduction in Tanzania. The general objective was to find out the
extent to which the microfinance Institutions contributes to poverty reductions in
Tanzania and whether they meet the objectives of the policies that led to their
establishment. The study was employing both primary and secondary data. The

21
study covered four regions of Tanzania that have a high concentration of MFIs.
These regions include Dar es Salaam, Zanzibar (Urban West Region), Arusha and
Mwanza. In these four regions the study covered a total number of 352 SMEs
supported by the selected MFIs and the SMEs were selected by random sampling.
From the study, the findings were revealed that, to a large extent MFIs operation in
Tanzania has brought positive changes in the standard of living of clients who
received loans services because it reduce poverty through increased income and
standards of living; empower women; develop the business sector through growth
potentials. 83.1% of the surveyed micro and small enterprises revealed that their
profits have increased after receiving the loan. My observation regarding the study is
that, the coverage of the study was on the effect of the contribution of MFLs to
poverty reduction in Tanzania, while my study was based on the effect of bank
financing on SMEs performance in Lindi. Both studies stress the importance of
equitable, sustainable individual economy, national economy growth and
improvement of the people‘s welfare.
Mwinyimvua (2002) conducted study on Policy issues and SMEs
development in Africa. It is recognized that the private sector plays a development
role as a key engine of growth and that growth is the most powerful weapon in
fighting poverty. SMEs are important in providing goods and services and
opportunities for employment for unemployed and the second source of income for
formal sector employees. It is estimated that SMEs employ over 20 per cent of the
adult population in developing countries (Kayanula & Quartey, 2000). To be able to
apply new methods and expand, firms need finance or capital. Lack of access to
capital is one of the major constraints in SMEs development; this is because of poor
domestic SME‘s policy and regulatory environment. Although capital may not by
itself solve all the key problems of SMEs, most developing country entrepreneurs,
especially those in Africa, say it is their number one need (World Bank 2001; Batra
et al 2002). In Tanzania, for example a survey of SMEs in the furniture industry
found that lack of access to finance is a binding constraint for all SMEs. Not only is
informal financing limited for the small firms even firms of adequate size and

22
experience have difficulty borrowing from banks, and if they do borrow, have
difficult relations with their lenders (Levy, 1993).
The difficulty of accessing finance by business enterprises was also noted in a year
2000 survey of 248 manufacturing establishments in Tanzania (Mbelle, 2001). The
survey found SMEs to be more disadvantaged than large-scale enterprises in
accessing finance, with 80.6 per cent of SMEs indicating that they find it difficult to
access finance compared with 61.5 per cent for large-scale enterprises. Increased
SME growth has direct effect on GDP growth to increased output, value add and
profits. As growth proceeds, private sector employment becomes the major source of
economic support for the majority of workers and their families. One of the best
ways to build the private sector is from the bottom up, focusing on small-scale
enterprises, which hold the promise of providing a base for the emergence of
dynamic and efficient large-scale firms and consequently a more flexible and
competitive domestic economy. This means listening to their concern, identifying
their biggest obstacles, and helping them compete in an increasingly global economy
(World Bank, 2001). The researcher recommended that, Government should provide
stable business environment, improving the legal and regulatory system, reducing
bureaucratic procedures, dismantling trade barriers and reforming the tax system.
According to research which was conducted by Massawe (ILO, 2002), it was
revealed that the small and medium-enterprises (SMEs) sector is one of the leading
employers (next only to peasant agriculture) in Tanzania. It is estimated that there are
over one million enterprises in this sector, employing between 3 and 4 million people
or 20-30 per cent of the total labour force. The SMEs sector is considered to have the
brightest potential for making the highest contribution to employment growth and
increased at 10 per cent per annum. Operators are able to generate between 2.5 and
10 times the minimum earnings of civil servants. The SMEs have also shown great
potential for creation wealth. Their aggregate contribution to national income is
estimated at 35 and 40 per cent of GDP (Finseth, 1998). SMEs are generally
regarded as the driving force of economic growth, jobs creation, and poverty
reduction in developing countries. They have been the means through which

23
accelerated economic growth and rapid industrialization have been achieved (Harris
& Gibson, 2002, Sauser, 2005).
In accordance with the research which was conducted by Makombe, Iddi (2004) on
the case study of Women micro and small Entrepreneurs. Entrepreneurship
development should be empowered through financing, in this case, micro and
enterprises can serve vital development functions in Africa countries (including
Tanzania). His findings were supported by Levitsky (1993) through the following
functions: to help generate employment by using more labour in relation to capital
invested, to act as seedbeds for entrepreneurial talent, to operate in less than
populated rural areas with limited markets and poor infrastructure, to be able to start
up with very limited resources, to provide ‗hands on‘ training facilities for people of
varying levels of education in both management and technical skills, to supply both
low-cost items for poor and, in certain circumstances, high cost quality products for
the rich and for export. Their flexibility enables them to weather recession, material
shortage and market changes. When translate into reality, it is found that the
economic functions of micro and small enterprises support an increasingly large
proportion of the population of many countries of the south.
Asanterabi (2009) conducted research on the role of Kilimanjaro Cooperative Bank
Limited (KCBL) in the Growth of Micro, Small and medium Enterprises. Data were
collected from staff and clients of Kilimanjaro Cooperative Bank through
questionnaires, interviews and documentary review methods. The total sample size
was 100 respondents from Moshi Municipality. Statistical package for social science
(SPSS) software was used in the data analysis. Results show that all financial
indicators (sales, investment and employment level) grew, though finance from
KCBL had significant effect on employment level. The findings also shows that most
of the respondents who participated in the study were male (57%), the remaining of
43% were female and that majority (54%) of SMEs who obtained finance from
KCBL was doing retail businesses.

24
2.6.2 Empirical Analysis of Relevant Studies Done Outside Tanzania
Trisha (2011) conducted a study in Ghana. The general objective of his study was to
investigate the contribution of loans to SMEs performance. The bank financing is
tremendously attractive and seems to be realistic and a more reliable source to SMEs.
Mensah (2004) stated that recently, as banks and other financial institutions have
sought to broaden their loan portfolio, SMEs have become an increasingly attractive
customer group. Thus, it is necessary to examine the impact of these loans on the
performance of SMEs. Are they having negative or positive impact on their
performance? Traditionally, however, financial institutions in Ghana have been
cautions with lending to SMEs groups because of high default rates and risks
associated with the sector. Few banks have therefore developed an explicit policy for
SMEs target groups taking the particular requirements and needs into consideration,
an example in the development of customized financial products and appropriate
credit management system. Inferring from the above, SMEs serve as sources of
livelihood to the poor, create employment opportunities, generate income and
contribute to economic growth at the individual level as well as national level.
It should be noted that, the largest companies over the world usually started as small
enterprises, so, the ability of SMEs to develop and invest becomes crucial to any
economy wishing to prosper. However data was collected from both primary and
secondary data. The secondary data was collected from Stanbic bank. A total of 100
SMES were sampled during the research work for analysis. The SMEs were
randomly and equal selected to represent the population. The result of findings was
that, ninety per cent (90%) of customers have access bank loan while ten per cent
(10%) do not. Furthermore, 96.3 % of the respondents indicate that, the loan have
improved the overall performance of SMEs while 3.7 % did not improved the
performance. The knowledge gap is that the study was conducted in Ghana and the
research covered the whole SME industry in Ghana since one SME was picked
randomly from each sector. Thus, the study was representative of the whole
25
Ghanaian industrial sector while this study will be conducted in Tanzania and will
focus only in one regional which is, Lindi Municipal.
From the above analysis it can be said that 10 % of the respondents did not access the
bank loan, the reason may be the conditionality of collateral/guarantee. But the
researcher did not disclose this observation. Also 3.7 % of the respondents indicate
that, after bank loan they did not improve the performance of SMEs. Here two
possible reasons can be deduced, one may be the respondents are lacking business
skills (knowledge of the business) as well as managerial skills. Second, loan secured
may be was diverted to other use such as to finance other project contrary to the
contract entered. Again the researcher did not disclose such possibilities.
Idowu (2010) conducted study in Nigeria on the impact of microfinance on SMEs.
The objective of the study was to assess the impact of Microfinance on Small and
Medium Enterprises (SMEs) in Nigeria. Simple random sampling technique was
employed in selecting the 100 SMEs that constituted the sample size of the research.
The study utilized primary sources of data in which structured questionnaires were
extensively used. Structured questionnaire was used to facilitate the availability of
relevant data which was used for analysis. Descriptive statistics which involves
simple percentage graphical charts and illustrations was applied in data presentations
and analysis. It was found that 92% of the total respondents claimed that they able to
access to microfinance loans and achieved their goals between 70%-100%. The
findings of the study reveal that significant number of the SMEs benefitted from the
MFIs loans even though only few of them were capable enough to secure the
required amount needed.
Interestingly, majority of the SMEs acknowledge positive contributions of MFIs
loans towards promoting their market share, product innovation achieving market
excellence and the overall economic company competitive advantage. Other than tax
incentives and financial supports, was recommended that Government should try to
provide sufficient infrastructural facilities such as electricity, good road network and
training institutions to support SMEs in Nigeria.
26
The research which conducted by Kanyugi, I. Ndegwa (2010) based on the impact of
Micro-Finance Credit on the Financial Performance of SMEs in Kenya. The
objective of the research was aimed at investigating the impact of micro-finance
credit on the financial performance of SMEs in Kenya. From the study findings, it
was concluded that, access of credit by SMEs from Micro-Finance Institutions
(MFIs) greatly influences their performance. The conclusion is supported by the
results from the various descriptive statistics. The descriptive statistics on net profit
indicate that the net profit after access of credit from MFIs was more than the net
profit before access of credit.
According to a research conducted by Stokes (1997), it was revealed the importance
of financing to SMEs in USA and UK for individual economic growth as well as
national economy. He linked his research with the Bolton Report (1971), in view of
the actual and potential contribution of small firms to the overall health of the
economy that was created a small division under a Ministry for small Firms. This
was implemented by the establishment of the Small Firms Service within the
Department of Industry in UK. The particular concern of the report was that
Government policies should encourage and support the sector, not accelerate its
decline through an unfair burden of regulations, paper work and taxes.
We believe that the health of the economy requires the birth of new enterprises in the
substantial numbers and the growth of some to a position from which they are able to
challenge and supplant the existing leaders of the industry. This seedbed function,
therefore, appears to be a vital contribution of the small firms sector to the long-run
health of the economy. The growth in employment in the USA between the mid
1960s and mid 1980s was phenomena, Bolton report (1971).
The World Bank has undertaken studies of small-scale enterprises (SSE) that they
financed, attempting to measure the performance of such projects. Focus has been
mainly on enterprise investment but not additionality attributable to the loan
(Levitsky 1988). Bolnick and Nelson (1990) have attempted to use survey data of
more than 1,500 enterprises in Indonesia collected between 1979 and 1982 and

27
looked at the changes in these enterprises. The study used a restricted domain and
simply shows what happened to a narrowly defined group of enterprises financed by
special credit programme in Indonesia called KIK/KMKP. They focused on
assessing the effect of credit on investment (value added) income and employment.
Their findings were that credit does lead to an increase in investment.
Ryan (1993) adopted Bolnick and Nelson‘s (1990) approach and conducted an ex
post evaluation of one financial source for small businesses, Small Enterprises
Development Organization of Malawi (SEDOM). He used a survey method
(covering 50 firms) to assess the impact firms that have received term loans from
SEDOM. In assessing the impact Ryan, in addition to other effects, looked at
whether or not the enterprises achieved the objectives listed as objectives of the
schemes. The variables used reflecting the objectives of SEDOM were employment
generation, technology employed and linkages. The results of the study showed that
the scheme as a whole created about 1,873 jobs at a relatively low cost of Malawian
Kwacha 1,000 per job. The study also found out that significant backward linkages to
the agricultural sector were created as a result of manufacturing firms receiving
loans.

28
Table 2. 3: Summary of variables from other studies
Author Focus of the
study
Variable
s
Methodology Findings
Joseph.
Kuzilwa,
2005
The role of
credit for small
business
success: A
study of the
National
entrepreneurshi
p development
Educatio
n, size of
the loan,
gender,
The study was involved
both the case study and
survey with total
population of 1032.
Sample of 250 clients was
randomly selected from
three regions with the
cluster of twenty regions
Two key results:
1.Access to credit had
increased firm output
2.Enterpreses whose
owners received business
training perform better
than those who did not
trained
Kessy &
Urio,
2006
Contribution of
microfinance
Institutions to
poverty
reduction
The survey employs both
primary and secondary
data. It covered four
regions 352 SMEs which
was selected at randomly
Positive changes in the
standard of life of the
clients who received
loans. 81.3% of the
surveyed SMEs revealed
that, their profit has
increased after receiving
the loans.
Trisha,
Kweenua
Quianoo,
2011
Examining the
impact of loans
on SMEs in
Ghana
Loan,
sales,
returns,
profits,
stock
levels
Population of 303
comprised all SMEs who
keep accounts with bank.
Simple random sampling
techniques was employed
in selecting the 100 SMEs
96.3% of the total
respondents indicated
that the loans improved
the overall performance
of their firms includes:
sales, returns, profits and
stock levels.
Idowu, F.
Christoph
er, 2010
Impact of
microfinance on
SMEs in
Nigeria
Loans,
sales,
market
share,
profit
The study utilizes primary
sources of data in which
structured questionnaire
were extensively used. To
constitute sample size out
of the population of the
study, simple random
sampling technique was
used to select 100 SMEs
operators in Nigeria.
Significant number of
the SMEs benefitted
from the MFIs loans
even though only few of
them were capable
enough to secure the
required amount needed.
Interestingly, majority of
the SMEs acknowledge
positive contributions of
MFIs loans towards
promoting their market
share, product
innovation achieving
market excellence and
the overall economic
company competitive
advantage.
Source: extracted by researcher, 2012
2.7.0. Conceptual Frame Work Model
2.7.1 Conceptual framework model
The conceptual framework of the study is the system of concepts, assumptions,
expectations, beliefs, and theories that supports and informs your research. Miles and

29
Huberman (1994) state that a conceptual framework ―explains, either graphically or
in narrative form, the main things to be studied the key factors, concepts, or
variables—and the presumed relationships among them‖ (p. 18). Thus, the
conceptual framework is a formulation of what you think is going on with the
phenomena of this study. In this study we developed a conceptual framework on the
effect of NMB financing on performance of SMEs from various SME‘s performance
theory. The focus of this conceptual frame work is to examine the relationship
between the independent variable, in this case was NMB financing and dependent
variables in this case the SMEs performance.
The performance of SMEs depends on NMB loan. The results of such performance
are income/profit, sales, investment, employment, economic effect, owner‘s
development, and social affairs. To achieve positive results there must be
intermediate variables such as adequate amount of the loan, timely availability of the
loan, proper management of the loan (utilization of loan), reasonable interest rate,
fewer requirements of collateral and bureaucracy.
2.7.2. Variables of the study
Independent variables
An independent variable is the variable researcher has control over, what researcher
can choose and manipulate. It is usually what researcher think will affect the
dependent variable. In some cases, researcher may not be able to manipulate the
independent variable. It may be something that is already there and is fixed,
something researcher would like to evaluate with respect to how it affects something
else, the dependent variable (Patton, 1990).
Dependent variables
A dependent variable is what researcher measure in the study and what is affected
during the study. The dependent variable responds to the independent variable. It is
called dependent because it depends on the independent variable (Patton, 1990). In
this study the performance of SMEs will be considered as dependent variable.

30
On the other hand the following are the dependant variables:
1. Effects of operation performance of SMEs, further, the effects of operation
performance are divided into: profits, sales, investment, employment and
economic effect.
2. Effect of social performance which includes: education, health care and family
household affairs
Figure: 2.1: Conceptual Frame Work Model:
The effect of NMB financing on performance of SMEs
Dependent variable
Independent variable
Intermediate variables:
1. Adequacy amount
2. Timely available
of fund
3. Supervision
(Management of the loan)
4. Cost of loan
5. Collateral
6. Procedures of process the loan
Source: Designed by researcher, 2012
- Profit /
income
- Sales
- Investment
- Employment
- Economy
effect
Effect of
operation
performance
of smes
NMB
Financing
to SMEs
Effect of
socio-
economic
performance
of SMEs
1. Education
2. Owner’s
development
3. House hold affairs

31
Conceptual framework designed acts as the road map of this study.
The key concepts which are applied through out of the study are NMB financing and
SMEs performance.
(a): Effects of operation performance of SMEs, further, the effects of operation
performance are divided into: profits, sales, investment, employment and economic
effect.
The above effects of operation performance of the SMEs are narrated as follows:
Profit/income generation
Profitability is the universally recognised as a measure of business success. Business
profit is considered as one of the key performance indicators which facilitate
entrepreneurial success by providing for the nourishment of competencies such as
innovativeness and ability to acquire resources. These competencies are regarded as
imperatives to success in many entrepreneurial ventures. Given that entrepreneurship
has been defined as the creation of rents through innovation (Steward, 1991), where
rents are defined as above average earnings relative to competitors (Norton, 2002),
then profitability measures particularly appealing. Therefore under this study
therefore the researcher was examined and assessed whether or not the bank
financing has influenced the SMEs profit generation or not after utilization of loan.
Sales
In order to enlarge business though working capital, the SMEs need to request bank
loan. Sales data are usually readily available and business owners themselves attach
high importance to sales as an indicator of business performance. In addition, sales
growth is also easier to measure compared with some other indices and is much more
likely to be recorded. Sales are a good indicator of size and growth. Sales may also
be considered a precise indicator of how a firm is competing relative to their market
(Barringer et al., 2005). Under this study, the researcher was investigated the sales
volume before and after the bank loan.

32
Investment
The consideration was focused on the level of investment attained. Addition of
investment may include start of new business which is different from what an
entrepreneur is doing or open branch or purchase of new machines or working tools
for the purpose of efficient running or furtherance of the business. The researcher
investigated on whether there was addition or expansion of investment after
utilization of NMB loan.
Employment
One of the most important functions small and medium-sized enterprises (SMEs)
perform in economy is their ability to create new jobs. Conditions of SME growth
became one of the focal interests of both researchers and the government‘s policy
aimed to support this sector in creation of new employment among family and non-
family members. For this study the researcher was examined whether there were
new recruitment employees or shop assistant after the utilization of bank loan. That
is to say, number of workers employed by the business before and after utilization of
the bank loan.
Economic effect
SMEs are vital for economic growth and development in both industrialised and
developing countries, by playing a key role in creating new jobs. Financing is
necessary to help them set up and expand their operations, develop new products,
and invest in new staff or production facilities. As we have noted from the theoretical
point of view that, if SMEs are adequately financed by NMB bank, they are able to
generate new business, new employments and generate profits. Growth of SMEs
increases the tax base by paying various taxes to Tanzania Revenue Authority (TRA)
like individual taxes; corporate taxes value added tax (VAT) and employment taxes.
Through the increase of tax base enables the government to finance labour market
programmes and provide basic social services, in particular health and education,
which give the poor a better chance of increasing their productivity and income
earning capacity. By so doing, that they can raise the economy of a country as well

33
as GDP. Under this study therefore, the researcher was interested to investigate
whether the NMB financing has positive effects as explained above or not.
(b): Effect of socio-economic performance
The role of SMEs is to improve the standard of living of the populace and
transforming the economy of a nation at large. It aims at improving people‘s lives by
promoting social changes. Social services or non-financial services that focus on
advancing the welfare of SMEs and this includes, Enhancing SMEs through
financing can enable to solve some of the social problems (Mair and Marti, 2006,
p.36). The social service which was considered under this study includes: education,
health care and family household affairs. The researcher examined and assessed
before and after bank loan, was there any improvement or not? Do they able to
afford social services costs? E.g. like payment of school fees, medical expenses,
improvement quality of life of family members, for instance building a modern
family house from business profit. However, in order the above variables to work
properly there must be control variables, for example supervision of the loan, timely
availability of the loan, adequate amount of the loan and cost of production
2.7.3. Hypothesis
A hypothesis is a speculation about one or more variables that can be tested to see if
it holds true. Hypothesis is a possible answer to the research question. Hypothesis
comes from the theoretical propositions and management strategy and tactics. The
idea is to seek answers only to questions or assumptions that managers are making or
will make. Hypothesis states what we are looking for and it is a proposition which
can be put to a test to determine its validity .One research question may generate
several hypothesis; they are not consistent with each other. Variables which will be
developed under this study are to seek the relationship between effect NMB
financing and the SMEs performance. In this case the independent variable will be
NMB financing to SMEs while the dependent variable will be effects of operation
performance of SMEs which in turn will produce profit, sales, investment,
employment, economic effect, technology, social affairs including education, health

34
care etc. Under this study, the researcher developed two types of hypothesis which
are null hypothesis and alternative hypothesis. A null hypothesis (Ho) is the one
which seeks to reject the results of finding. An alternative hypothesis (Ha) is the one
which seek to accept the results of findings.
1. Hypothesis I
Ha: NMB financing have positive effect on the operation performance of SMES.
Ho: NMB financing have no positive effect on the operation performance of SMEs.
2. Hypothesis II
Ha: There are positive effects NMB financing on social economic status of the
borrowers.
Ho: There are positive no effects NMB financing on social economic status of the
borrowers

35
CHAPTER THREE
RESEARCH METHODOLOGY
3.1. Introduction
Research methodology is a way to systematically of solving the research problem. It
may be understood as a science of studying that how research should it be done.
The purpose of this chapter is to discuss the methodology that will be used to collect
data and analyze .It is also shows the area of the study, research design, population
and sampling methods. The research was descriptive in nature and was employed the
survey method in assessing the impact of bank financing on SMEs development in
Lindi Municipal. In order to effectively conduct a valid analysis in the presentation
and analysis of the data, the data was collected on the research field. The study was
utilised both primary sources of data and secondary data. The purpose was to
generate data about the opinion and perceptions of SMEs owners in relation to the
effectiveness of bank loans to the performance of their businesses. Thus, in addition
provides means of analyzing the likely impact of Microfinance loans on SMEs. To
constitute sample size out of the population of the study, simple random sampling
technique was used to select 100 Small and Medium Enterprises operators in Lindi
and three (3) NMB staffs to make a total of 103. All the SMEs were served with
questionnaires together with those of NMB but with different questionnaires. The
concept of simple random procedure allows unbiased sampling and accords the
research work more scientific feature, thereby concretizing the validity of the
research findings.
3.2 Research design
The research design is the conceptual structure within which research is to be
conducted; it constitutes the blueprint for the collection, measurement and analysis of
data. Research design stands for advance planning of the methods to be adopted for
collecting the relevant data and the techniques to be used in their analysis, keeping in
view the objective of the research. The design helps the researcher to organize his
ideas in a form whereby, it was possible for him to look for flaws and inadequacies.
36
Such a design can even be given to others for their comments and critical evaluation.
In the absence of such a course of action, it will be difficult for the critic to provide a
comprehensive review of the proposed study (Kothari, 2004). The research design
was prepared to facilitate study at NMB-LINDI, being the study. The survey design
was involved the collection and analysis of data, and finding out the answers
concerning the current status of the study. This was comprises observation of facts,
collection and classification of data, interpretation of data, application of facts and
predictions.
Population
Polit and Hungler (1999:43) define population as the totality of the all subjects that
confirm to a set of specifications, comprising the entire group of persons that is of
interest of the researcher and to whom the research results can be generalized. In this
study, the population of Lindi municipal was 400 SMES those with NMB term
loans.
Sample
A sample is a finite part of a statistical population whose properties are studied to
gain information about the whole (Webster, 1985). When dealing with people, it can
be defined as a set of respondents (people) selected from a larger population for the
purpose of a survey. Under this study the researcher was employed simple random
sample in which each unit in the population has been an equal chance of being
selected. In this study, therefore the sample is 100 SMES drawn from the population
(25 per cent of 400 SMEs) and a sample of 3 drawn from NMB staffs. The focus
however was on SME clients with loan facilities, since the objective of the study was
to investigate the effect of loans on SMEs performance. Although sample selection
was randomly but researcher was tried to make it gender sound, where by population
of male and female interviewee was considered. Interview in this research was not
considered marital status, nationalism and age but will consider business of
interviewee.
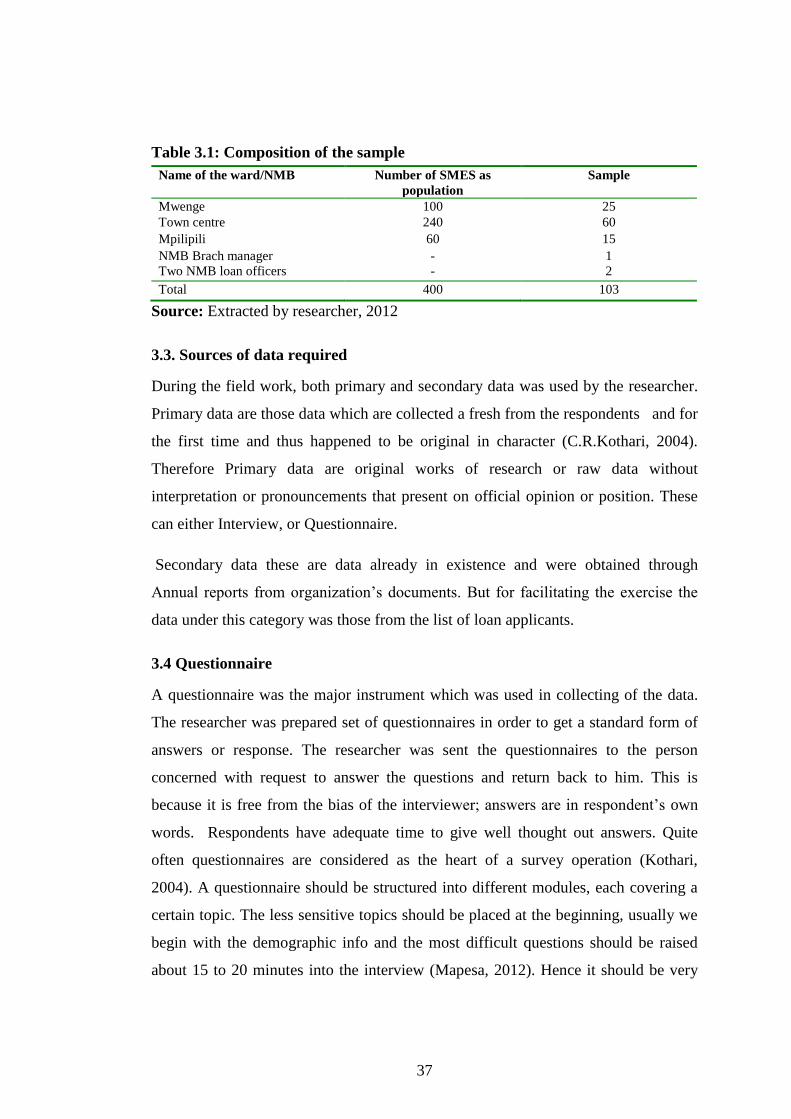
37
Table 3.1: Composition of the sample
Name of the ward/NMB Number of SMES as
population
Sample
Mwenge 100 25
Town centre 240 60
Mpilipili 60 15
NMB Brach manager
Two NMB loan officers
-
-
1
2
Total 400 103
Source: Extracted by researcher, 2012
3.3. Sources of data required
During the field work, both primary and secondary data was used by the researcher.
Primary data are those data which are collected a fresh from the respondents and for
the first time and thus happened to be original in character (C.R.Kothari, 2004).
Therefore Primary data are original works of research or raw data without
interpretation or pronouncements that present on official opinion or position. These
can either Interview, or Questionnaire.
Secondary data these are data already in existence and were obtained through
Annual reports from organization‘s documents. But for facilitating the exercise the
data under this category was those from the list of loan applicants.
3.4 Questionnaire
A questionnaire was the major instrument which was used in collecting of the data.
The researcher was prepared set of questionnaires in order to get a standard form of
answers or response. The researcher was sent the questionnaires to the person
concerned with request to answer the questions and return back to him. This is
because it is free from the bias of the interviewer; answers are in respondent‘s own
words. Respondents have adequate time to give well thought out answers. Quite
often questionnaires are considered as the heart of a survey operation (Kothari,
2004). A questionnaire should be structured into different modules, each covering a
certain topic. The less sensitive topics should be placed at the beginning, usually we
begin with the demographic info and the most difficult questions should be raised
about 15 to 20 minutes into the interview (Mapesa, 2012). Hence it should be very

38
carefully constructed. If it is not properly set up, then the survey is bound to fail. This
fact requires us to study the main aspects of a questionnaire i.e. the general form,
question sequence and question formulation and wording. The researcher used the
following approaches: open-ended questionnaire which gave respondent the chance
and freedom to express his /her view the way he/she want, closed ended
questionnaires which requires a ―yes‖ or ‖ no‖ answers only, multiple choice
questions and dichotomous questions
Questionnaire Design
The questionnaire design was based on the Effects of NMB financing on the
performance SMEs. Questionnaires are standardized form for collecting data from
respondents for the purpose of Measurement. It contains questions that were asked in
the same way to all respondents, with answers usually being recorded as numbers
using standardized sets of response categories. Questionnaires designs are more of an
art than a science. The phrasing of a question determines whether the researcher and
the respondent interpret the meaning of the question in the same way. The
questionnaire consisted of closed items, which aided understanding and simplified
the analysis of data. The questionnaire items which these researchers used were
standardized, and hence were valid and reliable enough to address issues of NMB
financing on the performance SMEs in Lindi municipal.
Interview method
Interview involves presentation of oral-verbal stimulus and in terms of oral-verbal
responses. A structured questions schedule was developed to generate the required
data. Structured interview involve the use of a set predetermined questions and
highly standardized techniques of recording. The method will be used through
personal interviews. The Interview was developed in Kiswahili, a Tanzanian
national language which is commonly spoken by nearly everybody in the country
and later was translated into English. The purpose of this type interviews was to
identify a wide range of interviewee concerns and interests.
39
3.5 Data Processing and Analysis
Data and all the information that was collected was organized in manageable and
meaningful forms through data cleaning, simple editing, coding, checking and
comparing the information to have the relevant information that was used to draw
valid conclusions (Kothari, 2004).
Editing
Editing of data is a process of examining the collected raw data (especially in
surveys) to detect errors and omissions and to correct these when possible. Editing
was done and entered in spss to assure that the data were accurate, consistent with
other facts gathered, uniformly entered, as completed as possible and have been well
arranged to facilitate coding and tabulation.(Kothari, 2004).
Coding
Coding refers to the process of assigning numerals or other symbols to answers so
that responses can be put into a limited number of categories or classes (or assigning
a code, usually a number, to each possible response to each question.. Coding was
necessary for efficient analysis and through it the several replies was reduced to a
small number of classes which contain the critical information required for analysis.
The questionnaires collected was coded in spss that enabled the researcher to run the
analysis.(Kothari, 2004).
Classification
Most research studies result in a large volume of raw data which must be reduced
into homogeneous groups if we are to get meaningful relationships. This fact
necessitates classification of data which happens to be the process of arranging data
in groups or classes on the basis of common characteristics. Data having a common
characteristic are placed in one class and in this way the entire data get divided into a
number of groups or classes (Kothari, 2004).
40
Tabulation
When a mass of data has been assembled, it becomes necessary for the researcher to
arrange the same in some kind of concise and logical order. This procedure is
referred to as tabulation. Thus, tabulation is the process of summarising raw data and
displaying the same in compact form (i.e., in the form of statistical tables) for further
analysis. In a broader sense, tabulation is an orderly arrangement of data in columns
and rows. The researcher was used both qualitative and quantitative techniques in
this area of the study.(Kothari, 2004).
3.6 Quantitative data analysis technique
Qualitative and quantitative data analysis
Quantitative data is collective data that can be measured by numbers .The
quantitative data was used to enable the researcher to concentrate on measuring
phenomena which was involved in collecting numerical data and analyzing through
statistical tools.
Qualitative data refers to all non-numeric data or data that have not been quantified
and can be a product of all research strategies (Mark Saunders et al, 2009). Basing on
the computation which was available from quantitative analysis, the researcher was
used qualitative techniques in order to analyze the data collected so as to give the
required meaning, picture and feeling by using proper interpretation.
3.7 Measurements of variables of the Study
Measurement means assigning numbers or other symbols to characteristics of objects
according to certain pre-specified rules.(Kothari, 2004). The researcher was assisted
by Statistical Package for social science (SPSS) software and Microsoft Excel for all
the analysis of the data. The researcher has chosen SPSS because it can take data
from almost any type of file and use them to generate tabulated reports, charts,
perform descriptive statistics and conduct complex statistical analyses. The data
analysis was employed various techniques of measurements scale variables such as
nominal, ordinal, interval and ratio:
41
(a) Nominal scale: Nominal scale is simply a system of assigning number symbols to
events in order to label them. There is no generally used measure of dispersion for
nominal scales. Chi-square test is the most common test of statistical significance
that can be utilized, and for the measures of correlation. Nominal scale is the least
powerful level of measurement. It indicates no order or distance relationship and has
no arithmetic origin. A nominal scale simply describes differences between things by
assigning them to categories (Kothari, 2004).
(b) Ordinal scale: The lowest level of the ordered scale that is commonly used is the
ordinal scale. The ordinal scale places events in order, but there is no attempt to
make the intervals of the scale equal in terms of some rule. Thus, the use of an
ordinal scale implies a statement of ‗greater than‘ or ‗less than‘ (an equality
statement is also acceptable) without our being able to state how much greater or less
(Kothari, 2004).
(c) Interval scale: In the case of interval scale, the intervals are adjusted in terms of
some rule that has been established as a basis for making the units equal. The units
are equal only in so far as one accepts the assumptions on which the rule is based.
Interval scales can have an arbitrary zero, but it is not possible to determine for them
what may be called an absolute zero or the unique origin. Interval scales provide
more powerful measurement than ordinal scales for interval scale also incorporates
the concept of equality of interval. As such more powerful statistical measures can be
used with interval scales. Mean is the appropriate measure of central tendency, while
standard deviation is the most widely used measure of dispersion. Product moment
correlation techniques are appropriate and the generally used tests for statistical
significance.(Kothari, 2004).
(d) Ratio scale: Ratio scales have an absolute or true zero of measurement. The term
‗absolute zero‘ is not as precise as it was once believed to be. We can conceive of an
absolute zero of length and similarly we can conceive of an absolute zero of time.
Ratio scale represents the actual amounts of variables. Generally, all statistical
techniques are usable with ratio scales and all manipulations that one can carry out

42
with real numbers can also be carried out with ratio scale values. Multiplication and
division can be used with this scale but not with other scales mentioned above.
Geometric and harmonic means can be used as measures of central tendency and
coefficients of variation may also be calculated.(Kothari, 2004).
Data was obtained from the interview, questionnaires as well as these from the
organization in question. The nature of the variables permits, the researcher to use
the scale that provides the most precise description
Table 3.2: Variables and their measurements in the SPSS
Variable Measurement scale
NMB Financing in SMEs:
Profit
Sales
Investment
Employment
Economic effect
Technology
Ordinal scale
Social performance:
Education
Health care
Family household affairs
Interval scale
Amount of the loan
Cost of production Interval scale
Others:
Supervision/management of the loan.
Adequate amount
Timely of the loan
Nominal scale
Source: extracted by researcher, 2012
From the above explanation therefore the analytical tools which were used in
analysing the data were spss which includes: Pearson‘s correlation, chi-square test
and excel.

43
CHAPTER FOUR
PRESENTATION OF THE FINDINGS
4.0. INTRODUCTION
This chapter presents the analysis of the findings from data collected through
interviews, observations and questionnaires. This chapter looks at the analysis of the
responses from respondents on the survey questionnaires administered and data
collected through interviews, following the research methodology outlined in the
previous chapter. It also aims at examining the understanding of the contribution and
impact of loans on SMEs performance. Population of the study were four hundred
(400) Lindi Municipal SMEs with NMB loans. A total of 100 SMEs were sampled
and 3 respondents from NMB bank during the research work for the analysis and the
selection was randomly. All 100 SMEs and 3 NMB staffs were served with
questionnaires in which 14 SMEs respondents did not manage to fill and return the
questionnaires for various reasons. 89 questionnaires including from NMB staffs
were returned(89% response rate), out of which 85 questionnaires were correctly
filled and which were used in the statistical analysis and four(4) returned
questionnaires from SMEs contained missing vital information(not correctly filled),
but they have no effect for the analysis. The analysis of the findings has grouped into
two parts: the first part looks at the analysis of data from the SMEs respondents (82)
and it is illustrated in the statistical representation by using simple per cent ages,
table, pie charts, histogram and figures. The second part of the analysis looks at the
respondents (3) from NMB officers, also the analysis are presented by tables and
figures.
The SMEs respondents (82) questionnaires are also further divided into three major
sections: section one contain the general information about the respondent, section
two contain information about SMEs performance before bank loans and section
three contain information about the SMEs performance after bank loan, challenges

44
that can threaten the SMEs growth and challenges that SMEs are facing when they
need bank loans.
Below are the tables and figures that show responses questionnaires administered to
SMEs respondents.
4.1.0. General information of the respondent
Gender of the respondents
Table 4.1 and Figure 4.1 show the gender of the respondents who are conducting the
small and medium-sized enterprises.
Table. 4.1: The gender of the respondent
Source: Field survey data, 2012
Figure 4.1: The gender of the respondent
53
64.6
29
35.4
0
10
20
30
40
50
60
70
Perc
en
t
Male
Female
Source: Field survey data, 2012
Gender Frequency Percent
Male 53 64.6
Female 29 35.4
Total 82 100.0

45
From the above table and figure it shows that, 53(65%) were male and 29(35%) were
female. From the data collected it indicates that the majority of the SMEs are owned
by the male.
Marital status of the respondent
Table 4.2 below show marital status of the SMEs from the study:
Table 4.2: Marital status of the respondent
Source: Field survey data, 2012
From the above table it shows that, 65(79%) of the respondents were married,
13(16%) were single, 4(5%) were widow and no divorce. From the data collected it
indicates that the majority of the respondents are married.
Age of the respondent
Table 4.3 and figure 4.2 below shows the age of the respondents from the study;
Table 4.3: Age of the respondent
Source: Field survey data, 2012
From the table and figure it indicates the age of the respondents, 49(60%) of the age
lies between 21-40 years, 29(35%) of the age lies between 41-60 years, 4(5%) of the
age lies between 61-80 years old and there was no age of above 80 years old. From
Marital status Frequency Percent
Single 13 15.9
Married 65 79.3
Widow 4 4.9
Total 82 100.0
Age of the respondent Frequency Percent
21-40 years 49 59.8
41-60 years 29 35.4
61-80 years 4 4.9
Total 82 100.0

46
the data collected it shows that the majority of the age of the respondents lies
between 21-40 years old.
Figure 4.2: Age of the respondent
60%
35%
5%
21-40 years
41-60 years
61-80 years
Source: Field survey data, 2012
Education background of the respondents
Table 4.4: The education background of the respondent
Source: Field survey data, 2012
Level of education Frequency Percent
primary school 31 37.8
form four 45 54.9
form six 2 2.4
Diploma 1 1.2
first degree/adv. Diploma 2 2.4
master degree 1 1.2
Total 82 100.0

47
Figure 4.3: The education background of the respondent
37.8
54.9
2.4 1.2 2.4 1.2
0
10
20
30
40
50
60
Percen
t
Primary school
Form four
Form six
Diploma
First degree/adv. diploma
Master degree
Source: Field survey data, 2012
From the above table and figure it shows that, form four 45(55%), primary school
31(38%), form six 2(3%), first degree/advanced diploma 2(2%), ordinary diploma
1(1%), master degree 1(1%) and no PhD holder. The majority of the respondents
their highest levels of educations are form four.
Categories of the business
Table 4.5 and Figure 4.5|: Categories of the business
Indicated below are the categories of the business
Table 4.5: Categories of the business of the respondent
Business categories Frequency Percent
sole proprietor 79 96.3
Partnership 1 1.2
limited company 2 2.4
Total 82 100.0

48
Figure 4.4: Categories of the business of the respondent
97%
1% 2%
Sole proprietor
Partnership
Limited company
Source: Field survey data, 2012
From the above table and figure it shows that, 79(96.3%) of the respondents are sole
proprietorship, 2(2.4%) of the respondents are limited companies and 1(1.2%) of the
respondent is a partnership. From the data presented it indicates that the majority of
the respondents are the sole proprietorship.
Source of funds for start-up of the business
Table 4.6 below shows the sources of capital for start-up of the business
Table 4.6: The source of funds for start-up of the business
Table 4.6: Source of funds for start-up of the business
Source: Field survey data, 2012
Source of funds Frequency Percent
from my savings 55 67.1
from my family 20 24.4
from friends 1 1.2
from bank 5 6.1
other source(specify) 1 1.2
Total 82 100.0

49
From the data presented above it indicates that, 55(67.1%) of the respondents get
funds to start up business from their savings, 20(24.4%) from family, 1(1.2%) from
friends, 5(6.1%) from bank and 1(1.2%) from other source which was actually from
pension. The majority of the respondents got capital to start up their businesses from
their own savings, from family and very few from banks.
Purpose of the loan
Table 4.7 below shows the response regarding the purpose the loan
Table 4.7: Purpose of the loan
Source: Field survey data, 2012
The data presented above shows what was actually the purpose of the loan. 3(3.7%)
of the respondent indicate they wanted to start up business, 50(61%) of the
respondent wanted to increase their working capital, 29(35.4%) wanted t expand of
their existing businesses.
4.1.1. Business experience of the respondent.
Data presented in the table 4.8 below shows business experience of the respondent.
Table 4.8: Business experience of the respondent
Source: Field survey data, 2012
Purpose of the loan Frequency Percent
start-up business 3 3.7
increase working capital 50 61.0
expansion of the existing business 29 35.4
Total 82 100.0
Business experience Frequency Percent
less than 4 years 16 19.5
5-10 years 39 47.6
11-15 years 15 18.3
16-20 years 8 9.8
more than 20 years 4 4.9
Total 82 100.0

50
From the above table it shows that, 16(19.5%) of the respondent have the business
experiences of less than four years, 39(47.6%) of the respondent have business
experiences that ranges between 5-10 years, 15(18.3%) of the respondent have
business experiences that ranges between 11-15 years, 8(9.8%) of the respondents
have business experiences that ranges between 16-20 years and 4(4.9%) of the
respondent have business experience of more than 20 years old. It was observed that
the majority of the respondents have business experience of the range between 5-10
years.
4.2. SMEs performance before taking bank loan
Introduction
This part presents the data about the effect of SMEs performance before taking bank
loans.
4.2.1 Average sale per day of the respondent before loan
Table 4.9 below shows the Average sale per day of the respondent before loan
Table 4.9: Average sales per day before taking loan
Average sales per day Frequency Percent
below tshs 15,000 per day 39 47.6
tshs 15,000 to 29,000 per day 17 20.7
tshs 30,000 to 79,000 per day 14 17.1
tshs 80,000 to 100,000 per day 12 14.6
Total 82 100.0

51
Figure 4.5: Average sales per day before taking loan
47%
21%
17%
15%below tshs 15,000 per day
tshs 15,000 to 29,000 per
day
tshs 30,000 to 79,000 per
day
tshs 80,000 to 100,000 per
day
Source: Field survey data, 2012
The data presented above revealed the respondent‘s sale per day before loan. That
39(47.6%) of the respondent said, their sale were below tshs 15,000 which are
marked as sales level one(I), 17(20.7%) of the respondent said their sales were
ranging from tshs 15,000 to tshs 29,000 which represents sales level two(II),
14(17.1%) of the respondent said their sales were ranging from tshs 30,000 to tshs
79,000 which represents sales level three(III), 12(14.6%) of the respondents said
their sales were ranging from 80,000 to 100,000 which represents sales level
four(IV) and there were no respondent who said their sales was above tshs 200,000
per day which were sales level four(V). From these data it indicates that the majority
of the respondent their sale were below tshs 15,000(Sales level one)

52
4.2.2. The average profit of the respondent before loan
Table 4.10 below shows the average profit of the respondent before loan
Table 4.10: Average profit before loan
Source: Field survey data, 2012
From the data presented above, it revealed that 5(6.1%) of respondent said they were
not getting business profit, 73(89%) of the respondent said they were getting very
small profit about 3% before loan, 4(4.9%) of the respondent said they do not know.
The data indicates that the majority (89%) of the respondent were getting profit
although was very small.
4.2.3. Employment status before bank loan
Table 4.11 bellow demonstrate Employment status of the SMEs drown from the
study
Table 4.11: Employment status before bank loan
Source: Field survey data, 2012
Average profit before loan Frequency Percent
there was no profit 5 6.1
there was very small profit about 3% 73 89.0
I do not know 4 4.9
Total 82 100.0
Employment before loan Frequency Percent
no employee 46 56.1
one employee 18 22.0
two employees 11 13.4
three employees 7 8.5
Total 82 100.0

53
Figure 4.6: Employment status before bank loan
56.1
22
13.4
8.5
0
10
20
30
40
50
60
Perc
en
t
No employee
One employee
Two employees
Three employees
Source: Field survey data, 2012
From the data presented above, it revealed that 46(56.1%) no employee employed,
18(22%) of the respondent said that they employ just one employee, 11(13.4%) of
the respondent said that they employ two employees, 7(8.5%) of the respondent said
they employ three employees. Data indicates that the majority of the respondent did
not employ before loan.
4.2.4. Level of investment before loan
Table 4.12 bellow demonstrate the level of investment before loan
Table 4.12 Level of investment before loan
Source: Field survey data, 2012
From the above table, 46(56.1%) of the respondent said that before loan the level of
investment was low, 29(35.4%) of the respondent said level of investment was very
investment before loan Frequency Percent
Low 46 56.1
very low 29 35.4
Satisfactory 7 8.5
Total 82 100.0
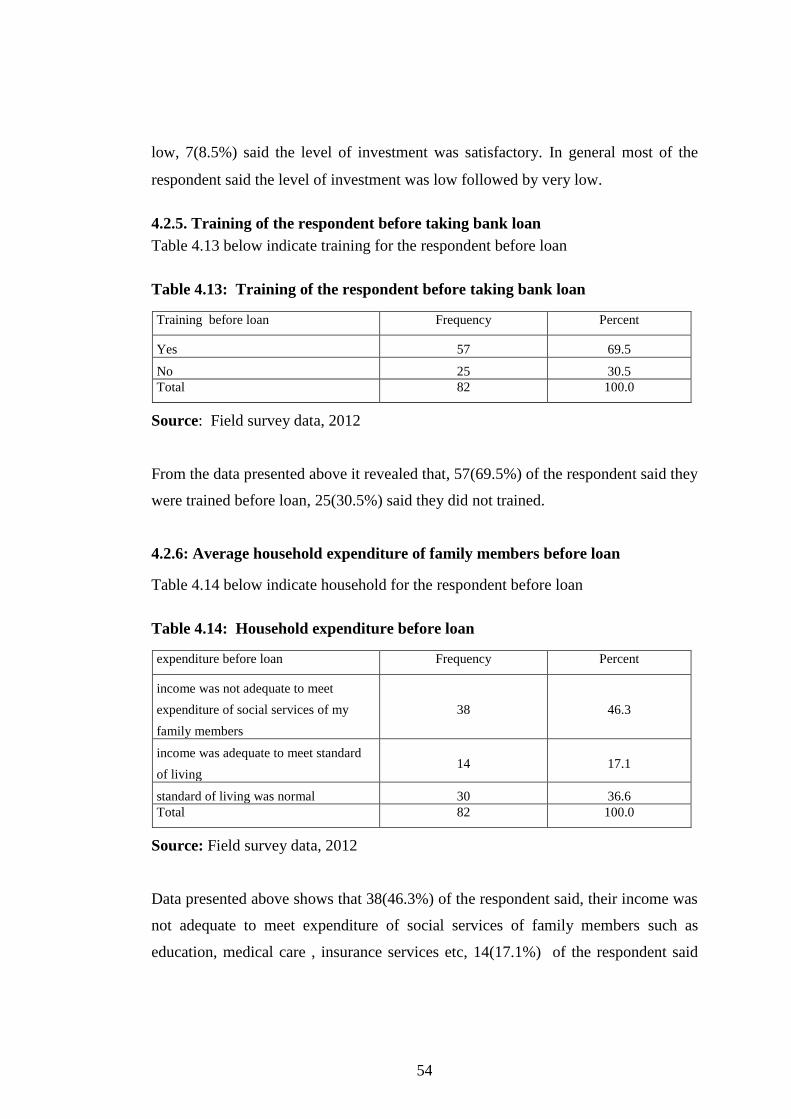
54
low, 7(8.5%) said the level of investment was satisfactory. In general most of the
respondent said the level of investment was low followed by very low.
4.2.5. Training of the respondent before taking bank loan
Table 4.13 below indicate training for the respondent before loan
Table 4.13: Training of the respondent before taking bank loan
Source: Field survey data, 2012
From the data presented above it revealed that, 57(69.5%) of the respondent said they
were trained before loan, 25(30.5%) said they did not trained.
4.2.6: Average household expenditure of family members before loan
Table 4.14 below indicate household for the respondent before loan
Table 4.14: Household expenditure before loan
Source: Field survey data, 2012
Data presented above shows that 38(46.3%) of the respondent said, their income was
not adequate to meet expenditure of social services of family members such as
education, medical care , insurance services etc, 14(17.1%) of the respondent said
Training before loan Frequency Percent
Yes 57 69.5
No 25 30.5
Total 82 100.0
expenditure before loan Frequency Percent
income was not adequate to meet
expenditure of social services of my
family members
38 46.3
income was adequate to meet standard
of living 14 17.1
standard of living was normal 30 36.6
Total 82 100.0
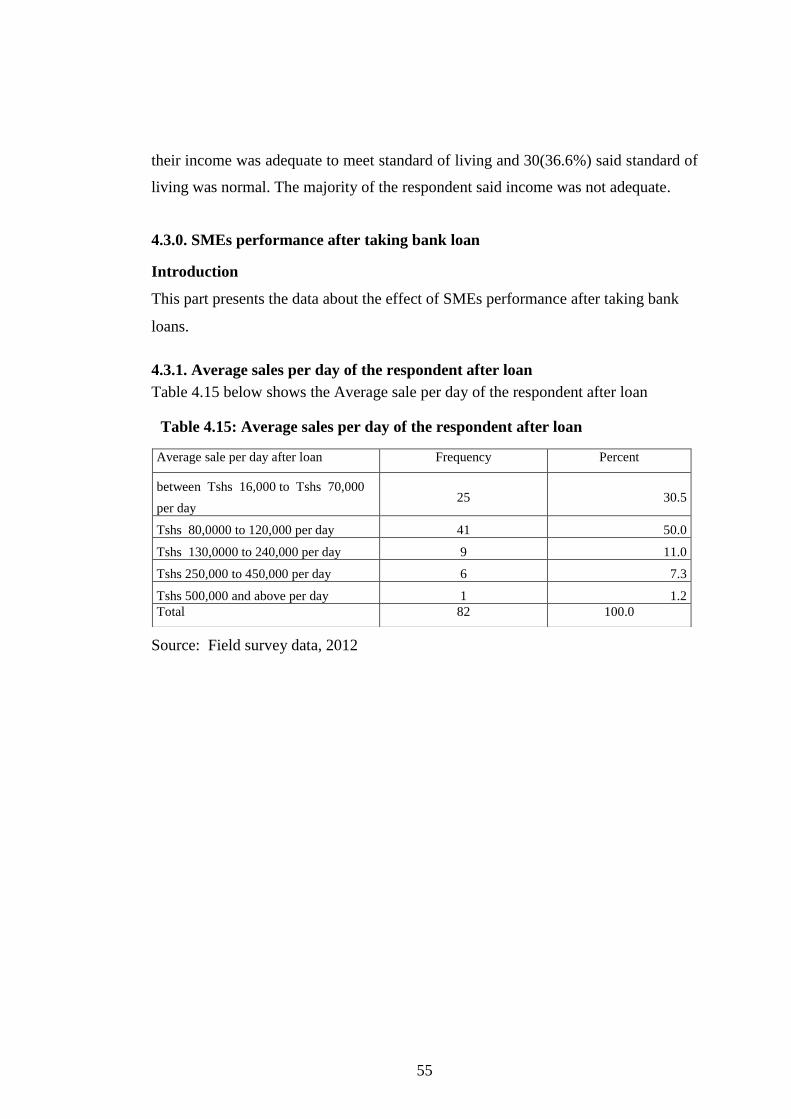
55
their income was adequate to meet standard of living and 30(36.6%) said standard of
living was normal. The majority of the respondent said income was not adequate.
4.3.0. SMEs performance after taking bank loan
Introduction
This part presents the data about the effect of SMEs performance after taking bank
loans.
4.3.1. Average sales per day of the respondent after loan
Table 4.15 below shows the Average sale per day of the respondent after loan
Table 4.15: Average sales per day of the respondent after loan
Source: Field survey data, 2012
Average sale per day after loan Frequency Percent
between Tshs 16,000 to Tshs 70,000
per day 25 30.5
Tshs 80,0000 to 120,000 per day 41 50.0
Tshs 130,0000 to 240,000 per day 9 11.0
Tshs 250,000 to 450,000 per day 6 7.3
Tshs 500,000 and above per day 1 1.2
Total 82 100.0
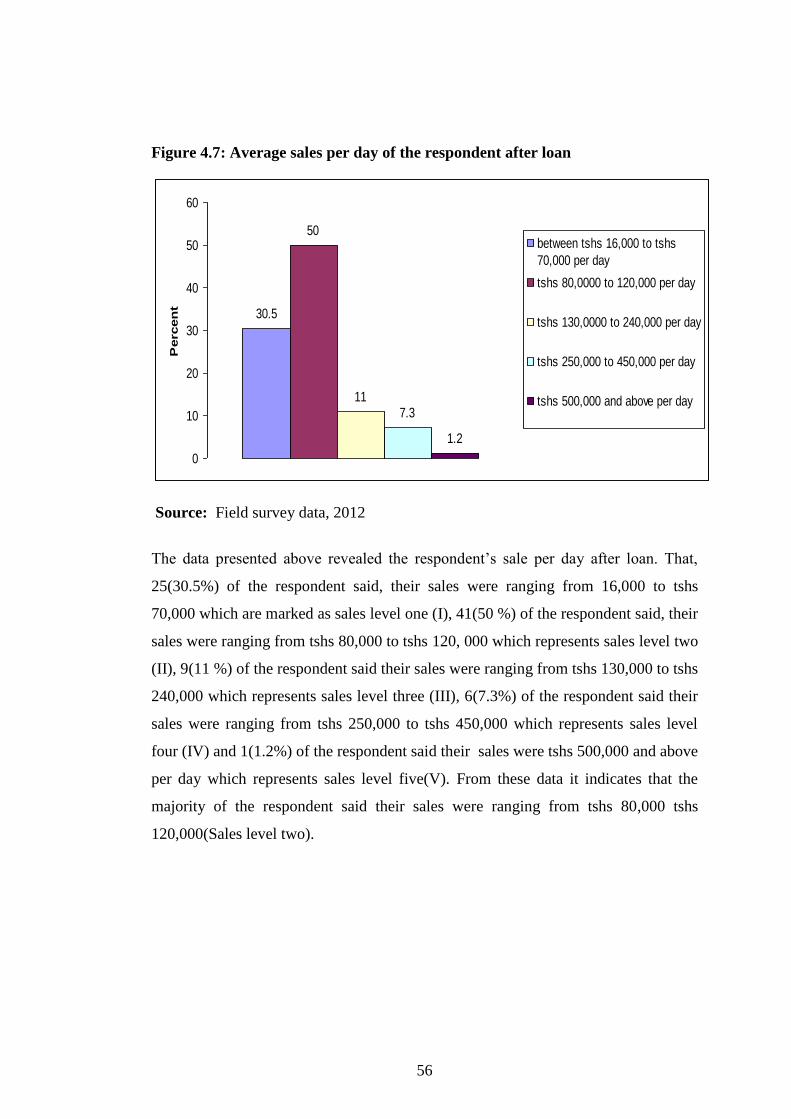
56
Figure 4.7: Average sales per day of the respondent after loan
30.5
50
117.3
1.2
0
10
20
30
40
50
60
Percen
t
between tshs 16,000 to tshs
70,000 per day
tshs 80,0000 to 120,000 per day
tshs 130,0000 to 240,000 per day
tshs 250,000 to 450,000 per day
tshs 500,000 and above per day
Source: Field survey data, 2012
The data presented above revealed the respondent‘s sale per day after loan. That,
25(30.5%) of the respondent said, their sales were ranging from 16,000 to tshs
70,000 which are marked as sales level one (I), 41(50 %) of the respondent said, their
sales were ranging from tshs 80,000 to tshs 120, 000 which represents sales level two
(II), 9(11 %) of the respondent said their sales were ranging from tshs 130,000 to tshs
240,000 which represents sales level three (III), 6(7.3%) of the respondent said their
sales were ranging from tshs 250,000 to tshs 450,000 which represents sales level
four (IV) and 1(1.2%) of the respondent said their sales were tshs 500,000 and above
per day which represents sales level five(V). From these data it indicates that the
majority of the respondent said their sales were ranging from tshs 80,000 tshs
120,000(Sales level two).
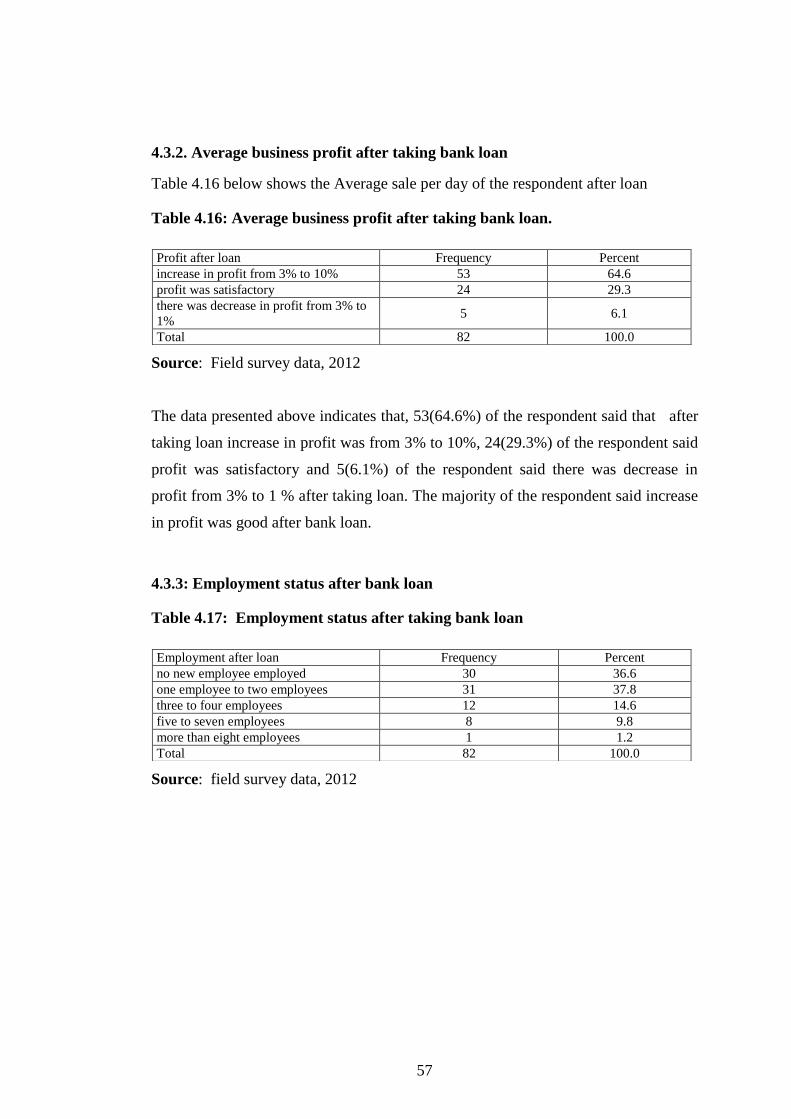
57
4.3.2. Average business profit after taking bank loan
Table 4.16 below shows the Average sale per day of the respondent after loan
Table 4.16: Average business profit after taking bank loan.
Source: Field survey data, 2012
The data presented above indicates that, 53(64.6%) of the respondent said that after
taking loan increase in profit was from 3% to 10%, 24(29.3%) of the respondent said
profit was satisfactory and 5(6.1%) of the respondent said there was decrease in
profit from 3% to 1 % after taking loan. The majority of the respondent said increase
in profit was good after bank loan.
4.3.3: Employment status after bank loan
Table 4.17: Employment status after taking bank loan
Source: field survey data, 2012
Profit after loan Frequency Percent
increase in profit from 3% to 10% 53 64.6
profit was satisfactory 24 29.3
there was decrease in profit from 3% to
1% 5 6.1
Total 82 100.0
Employment after loan Frequency Percent
no new employee employed 30 36.6
one employee to two employees 31 37.8
three to four employees 12 14.6
five to seven employees 8 9.8
more than eight employees 1 1.2
Total 82 100.0

58
Figure 4.8: Employment status after taking bank loan
36.637.8
14.6
9.8
1.2
0
5
10
15
20
25
30
35
40
Perc
en
t
no new employee employed
one employee to two employees
three to four employees
five to seven employees
more than eight employees
Source: Field survey data, 2012
The data presented above indicates that, 30(36.6%) of the respondent said no new
employee employed, 31(37.8%) of the respondent said one to two new employees
was employed, 12(14.6%) of the respondent said three to four new employees was
employed,8(9.8%) of the respondent said five to seven new employees was
employed and 1(1.2%) of the respondent said more than eight new employees was
employed.
4.3.4: Level of investment after taking bank loan
Table 4.18: Average investment after taking bank loan
Source: Field survey data, 2012
The data presented above indicates that, 42(51.2%) of the respondent said increase of
investment was good, 34(41.5%) of the respondent said increase of investment was
satisfactory, 6(7.3%) of the respondent said there was no increase in investment and
there was no respondent who said increase of investment was very good.
Average investment Frequency Percent
increase of investment was good 42 51.2
Increase of investment was satisfactory 34 41.5
no increase in investment 6 7.3
Total 82 100.0
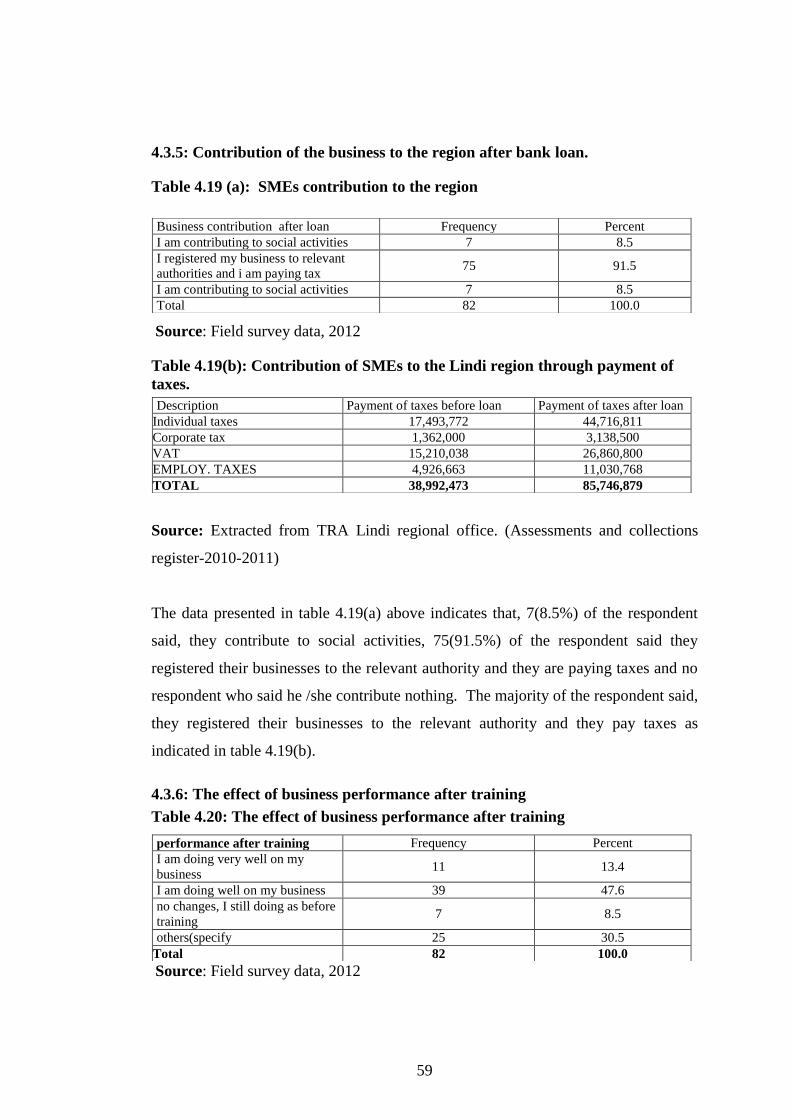
59
4.3.5: Contribution of the business to the region after bank loan.
Table 4.19 (a): SMEs contribution to the region
Source: Field survey data, 2012
Table 4.19(b): Contribution of SMEs to the Lindi region through payment of
taxes.
Source: Extracted from TRA Lindi regional office. (Assessments and collections
register-2010-2011)
The data presented in table 4.19(a) above indicates that, 7(8.5%) of the respondent
said, they contribute to social activities, 75(91.5%) of the respondent said they
registered their businesses to the relevant authority and they are paying taxes and no
respondent who said he /she contribute nothing. The majority of the respondent said,
they registered their businesses to the relevant authority and they pay taxes as
indicated in table 4.19(b).
4.3.6: The effect of business performance after training
Table 4.20: The effect of business performance after training
Source: Field survey data, 2012
Business contribution after loan Frequency Percent
I am contributing to social activities 7 8.5
I registered my business to relevant
authorities and i am paying tax 75 91.5
I am contributing to social activities 7 8.5
Total 82 100.0
Description Payment of taxes before loan Payment of taxes after loan
Individual taxes 17,493,772 44,716,811
Corporate tax 1,362,000 3,138,500
VAT 15,210,038 26,860,800
EMPLOY. TAXES 4,926,663 11,030,768
TOTAL 38,992,473 85,746,879
performance after training Frequency Percent
I am doing very well on my
business 11 13.4
I am doing well on my business 39 47.6
no changes, I still doing as before
training 7 8.5
others(specify 25 30.5
Total 82 100.0

60
The data presented above indicates that, 11(13.4%) of the respondents said they are
doing very well their businesses after getting training. 39(47.6%) of the respondent
said they are doing well their businesses after training, 7(8.5%) of the respondent
said they no changes, they still doing business as before training and 25(30.5%) they
did not attend training.
4.3.7: Average household expenditure of family members after loan
Table 4.21: The average expenditure of family members after loan
Source: Field survey data, 2012
The data presented above indicates that, 18(22%) of the respondent said after bank
loan their income is adequate to meet expenses of social services of my family
members (education, medical care, insurance services), 44(53.7%) of the respondent
said after bank loan standard of living has improved and 20(24.4%) of the respondent
said no changes in standard of living after loan.
4.3.8: Development made after taking bank loan
Table 4.22: Development made after bank loan
Source: Field survey data, 2012
The data presented above indicates that, 6(7.3%) of the respondent said they
managed to build modern family house, 51(62.2%) of the respondent they managed
Expenditure after loan Frequency Percent
income is adequate to meet expenses of social
services of my family members(education, medical
care ,insurance services)
18 22.0
standard of living has improved 44 53.7
no changes in standard of living 20 24.4
Total 82 100.0
Development after loan Frequency Percent I built modern family house 6 7.3
I paid school fees/college to my children/relatives 51 62.2
I bought family transport 3 3.7
I started/added another business 22 26.8
Total 82 100.0
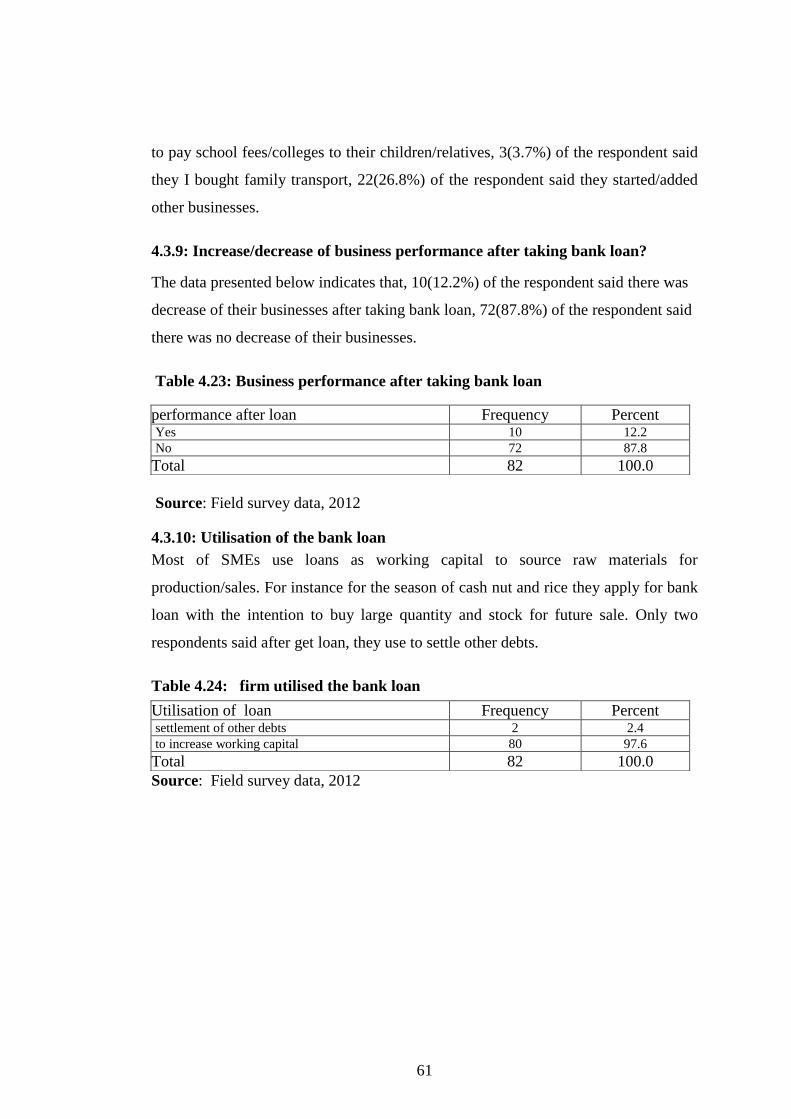
61
to pay school fees/colleges to their children/relatives, 3(3.7%) of the respondent said
they I bought family transport, 22(26.8%) of the respondent said they started/added
other businesses.
4.3.9: Increase/decrease of business performance after taking bank loan?
The data presented below indicates that, 10(12.2%) of the respondent said there was
decrease of their businesses after taking bank loan, 72(87.8%) of the respondent said
there was no decrease of their businesses.
Table 4.23: Business performance after taking bank loan
Source: Field survey data, 2012
4.3.10: Utilisation of the bank loan
Most of SMEs use loans as working capital to source raw materials for
production/sales. For instance for the season of cash nut and rice they apply for bank
loan with the intention to buy large quantity and stock for future sale. Only two
respondents said after get loan, they use to settle other debts.
Table 4.24: firm utilised the bank loan
Source: Field survey data, 2012
performance after loan Frequency Percent Yes 10 12.2
No 72 87.8
Total 82 100.0
Utilisation of loan Frequency Percent settlement of other debts 2 2.4
to increase working capital 80 97.6
Total 82 100.0
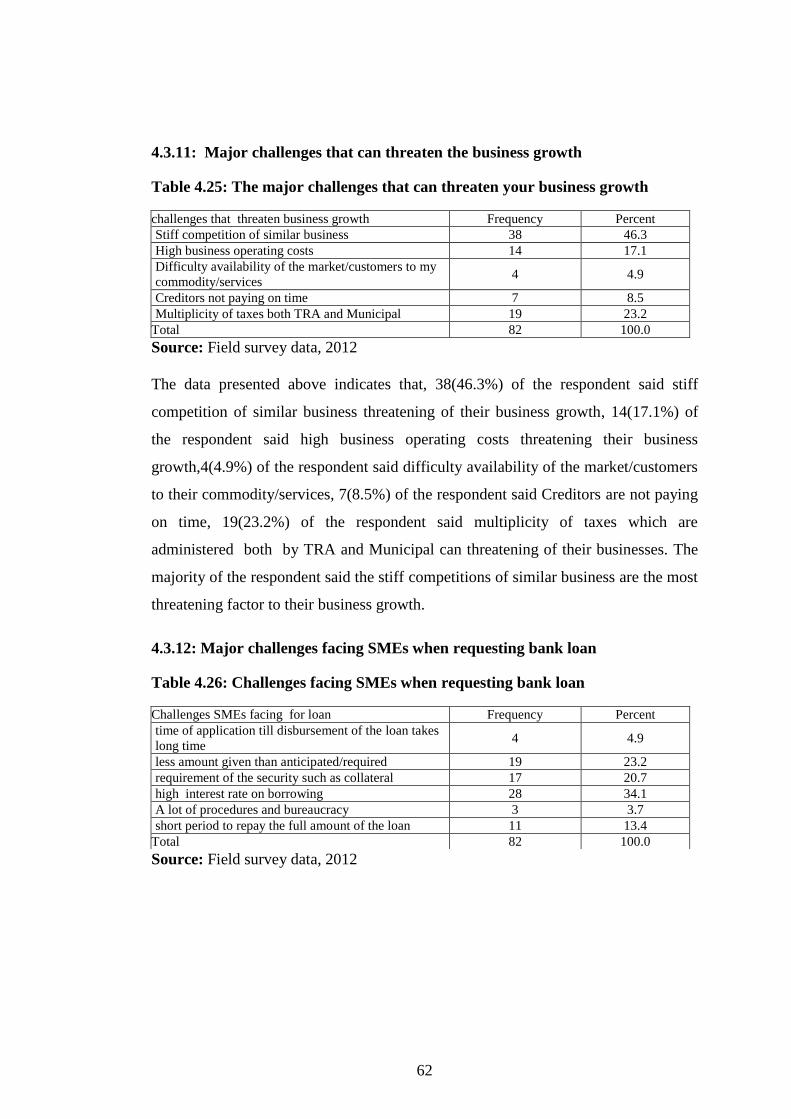
62
4.3.11: Major challenges that can threaten the business growth
Table 4.25: The major challenges that can threaten your business growth
Source: Field survey data, 2012
The data presented above indicates that, 38(46.3%) of the respondent said stiff
competition of similar business threatening of their business growth, 14(17.1%) of
the respondent said high business operating costs threatening their business
growth,4(4.9%) of the respondent said difficulty availability of the market/customers
to their commodity/services, 7(8.5%) of the respondent said Creditors are not paying
on time, 19(23.2%) of the respondent said multiplicity of taxes which are
administered both by TRA and Municipal can threatening of their businesses. The
majority of the respondent said the stiff competitions of similar business are the most
threatening factor to their business growth.
4.3.12: Major challenges facing SMEs when requesting bank loan
Table 4.26: Challenges facing SMEs when requesting bank loan
Source: Field survey data, 2012
challenges that threaten business growth Frequency Percent
Stiff competition of similar business 38 46.3
High business operating costs 14 17.1
Difficulty availability of the market/customers to my
commodity/services 4 4.9
Creditors not paying on time 7 8.5
Multiplicity of taxes both TRA and Municipal 19 23.2
Total 82 100.0
Challenges SMEs facing for loan Frequency Percent
time of application till disbursement of the loan takes
long time 4 4.9
less amount given than anticipated/required 19 23.2
requirement of the security such as collateral 17 20.7
high interest rate on borrowing 28 34.1
A lot of procedures and bureaucracy 3 3.7
short period to repay the full amount of the loan 11 13.4
Total 82 100.0

63
Figure 4.9: Challenges facing SMEs when requesting bank loan
4.9
23.220.7
34.1
3.7
13.4
0
5
10
15
20
25
30
35
40
Perc
en
t time of application till
disbursement of the loan takes
long time
less amount given than
anticipated/required
requirement of the security such
as collateral
high interest rate on borrowing
A lot of procedures and
bureaucracy
short period to repay the full
amount of the loan
Source: Field survey data, 2012
The data presented above indicates that, 4(4.9%) of the respondents said from the
time of application to disbursement of the loan takes long time, 19(23.2%0 of the
respondent said they are given less amount of the loan than anticipated/required,
17(20.7%) of the respondents said they are required to offer security such as
collateral, 28(34.1%) , there are high interest rate on borrowing 3(3.7%) of the
respondents said there a lot of a lot of procedures and bureaucracy,11(13.4%) of the
respondents said they given short period to repay the full amount of the loan.
The second part of the analysis from NMB bank
Presented below ate the data collected from NMB through questionnaires. The
questionnaires which served to NMB were differently from these of the SMEs. The
questionnaires were served to three (3) key personnel including Branch manager and
two loan officers.
4.3.13: Application of the loan by SMEs as per population
From the data presented it shows that the applications, amount applied, amount
advanced and amount not qualified are increasing as per population. The reason
given from top officers of NMB bank was that, lack of collateral value which is
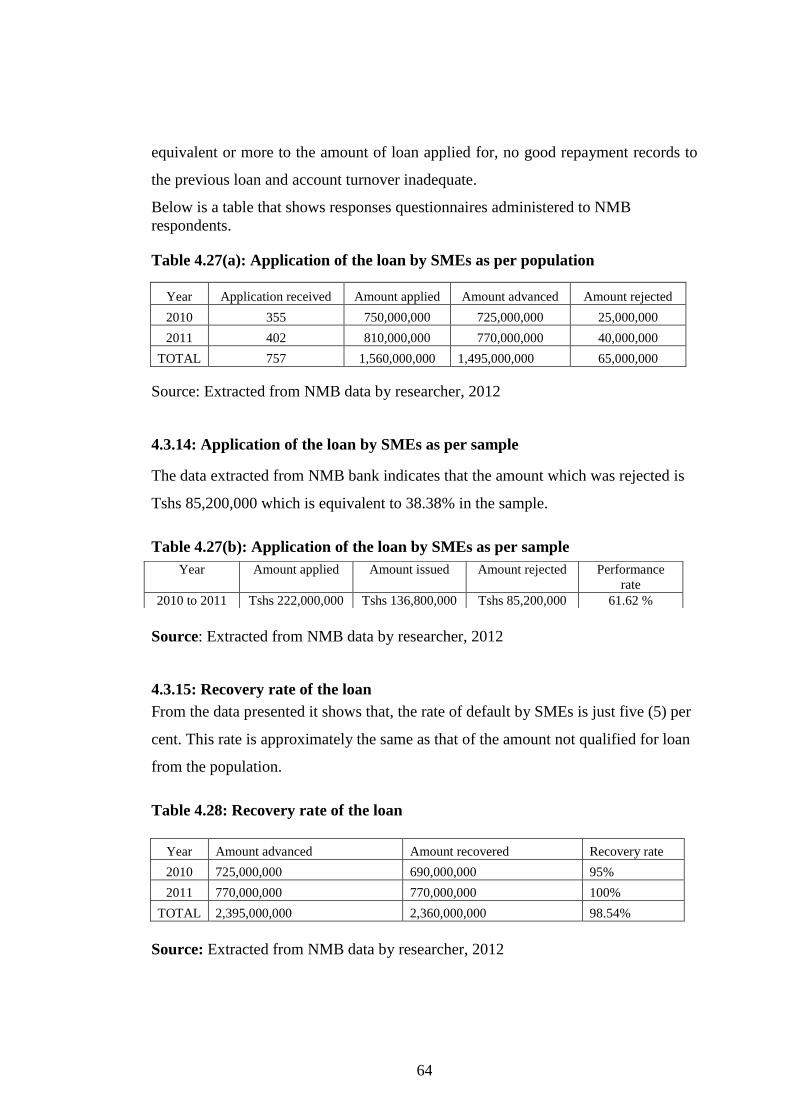
64
equivalent or more to the amount of loan applied for, no good repayment records to
the previous loan and account turnover inadequate.
Below is a table that shows responses questionnaires administered to NMB
respondents.
Table 4.27(a): Application of the loan by SMEs as per population
Year Application received Amount applied Amount advanced Amount rejected
2010 355 750,000,000 725,000,000 25,000,000
2011 402 810,000,000 770,000,000 40,000,000
TOTAL 757 1,560,000,000 1,495,000,000 65,000,000
Source: Extracted from NMB data by researcher, 2012
4.3.14: Application of the loan by SMEs as per sample
The data extracted from NMB bank indicates that the amount which was rejected is
Tshs 85,200,000 which is equivalent to 38.38% in the sample.
Table 4.27(b): Application of the loan by SMEs as per sample
Source: Extracted from NMB data by researcher, 2012
4.3.15: Recovery rate of the loan
From the data presented it shows that, the rate of default by SMEs is just five (5) per
cent. This rate is approximately the same as that of the amount not qualified for loan
from the population.
Table 4.28: Recovery rate of the loan
Year Amount advanced Amount recovered Recovery rate
2010 725,000,000 690,000,000 95%
2011 770,000,000 770,000,000 100%
TOTAL 2,395,000,000 2,360,000,000 98.54%
Source: Extracted from NMB data by researcher, 2012
Year Amount applied Amount issued Amount rejected Performance
rate
2010 to 2011 Tshs 222,000,000 Tshs 136,800,000 Tshs 85,200,000 61.62 %

65
4.3.16: Borrowing interest rate vs. lending interest rate
The data presented shows the comparison between the borrowing interest rate on the
side of the borrower and on the other side lending interest rate to someone who to
invest in the bank.
Table 4.29: Borrowing interest rate vs. Lending interest rate
Year Borrowing interest rate Lending interest rate Difference
2010 18% 3% 15%
2011 18% 3% 15%
Source: Extracted from NMB data by researcher, 2012
4.3.17: Total bank charges to borrower
The data presented shows the total charges charged to the borrower. The total
charges include the borrowing interest, bank charges and risk premium.
Table 4.30: Total bank charges to borrower
Year Borrowing interest rate Bank charges Risk premium Total charges
2010 18% 1.5% 2.0% 21.5%
2011 18% 1.5% 2.0% 21.5%
Source: Extracted from NMB data by researcher, 2012
Table 4.31: Relationship between NMB financing and SMEs performance
Correlations NMB financing SMEs performance
NMB financing
Pearson Correlation 1 .605**
Sig. (2-tailed) .000
N 82 82
SMEs performance
Pearson Correlation .605**
1
Sig. (2-tailed) .000
N 82 82
**. Correlation is significant at the 0.01 level (2-tailed).
Source: Statistical package for social science (SPSS) output.
From the above, the result revealed that the correlation is 0.605 which it is strong at
the 0.01 level (2-tailed). Thus, it interpreted that, the relationship between the NMB

66
financing and the SMEs performance is statistically significance, as NMB (loan)
financing increases to SMEs, the SMEs performance also increases.
4.4. Hypothesis test through use of chi-square
1. Hypothesis I
Ha: NMB financing have positive effect on the operation performance of SMES
Ho: NMB financing have no impact on the operation performance of SMEs
The hypothesis test was on whether NMB financing have positive effect on the
operation performance of SMES or not.
(a) The tested variable was average sales per day before securing loan from NMB
against average sales per day after securing loan from the bank.
Table 4.32: Chi-Square test on average sales before and after loan
Chi-square test Value Df Asymp. Sig. (2-sided)
Pearson Chi-Square 94.969a 12 .000
Likelihood Ratio 88.540 12 .000
Linear-by-Linear Association 46.008 1 .000
N of Valid Cases 82
a. 14 cells (70.0%) have expected count less than 5. The minimum expected count is
.15.
Source: Spss output, 2013
The main interested value from the output in this aspect was the Pearson chi-square
value which denoted by χ2. Results in table (4.32) show that the probability (p) of
chi-square test statistic (χ2 =94.97) was 0.000. To accept the null hypothesis, the
calculated χ2 value needs to be greater than (table value) 0.05 otherwise be rejected
(Pallant, 2006). In this case the value of 0. 000 is smaller than the alpha value of 0.05
as indicated in the table. From this result the null hypothesis is rejected and the
alternative hypothesis is accepted. Therefore it can be concluded that loan from the
bank have positive effect on the operation performance of SMEs.

67
(b) The tested variable was average profit before securing loan from NMB against
profit after securing loan from the bank.
Table 4.33: Chi-square test on average profit before and after loan
Chi-square test Value Df Asymp. Sig. (2-sided)
Pearson Chi-Square 12.520a 4 .014
Likelihood Ratio 8.608 4 .072
Linear-by-Linear Association 6.245 1 .012
N of Valid Cases 82
a. 7 cells (77.8%) have expected count less than 5. The minimum expected count is
.10.
Source: Spss output, 2013
Results in table (4.33) show that the probability (p) of chi-square test statistic (χ2
=12.52) was 0. 014 and was less than the alpha level of significance of 0.05. From
this result the null hypothesis is also rejected and the alternative hypothesis is
accepted. Therefore it can be concluded that loan from the bank have positive effect
on the operation performance of SMEs
(c) The tested variable was the number of employees employed before bank loan
and after bank loan.
Table 4.34:Chi-square test on employment before and after loan
Chi-square test Value Df Asymp. Sig. (2-sided)
Pearson Chi-Square 74.079a 12 .000
Likelihood Ratio 61.062 12 .000
Linear-by-Linear Association 36.086 1 .000
N of Valid Cases 82
a. 15 cells (75.0%) have expected count less than 5. The minimum expected count is
.09.
Source: Spss output, 2013
Results in table (4.34) shows that the probability (p) of chi-square test statistic (χ2
=74.079) was 0. 000 and was less than the alpha level of significance of 0.05. From
this result the null hypothesis is rejected and the alternative hypothesis is accepted.

68
Therefore it can be concluded that loan from bank have positive effect on the
operation performance of SMEs
2. Hypothesis II
Hypothesis II
Ha: There are positive effects of NMB financing on social economic status of the
borrowers.
Ho: There are no effects NMB financing on social economic status of the borrowers
(a) The tested variable was borrower‘s socio-economic development before and
after bank loan.
Table 4.35 Chi-square test on owner’s development
before and after loan
Chi-square test Value Df Asymp. Sig
(2-sided)
person chi- square
likelihood ratio
Linear-by linear Association
N of valid cases
19.326a
13.088
1.043
82
6
6
1
.004
.042
.307
Source: Spss output, 2013
Results in table (4.35) show that the probability (p) of chi-square test statistic (χ2
=19.326) was 0.004 and was less than the alpha level of significance of 0.05. From
this result the null hypothesis is rejected and the alternative hypothesis is accepted.
Therefore it can be concluded that there are positive effects of NMB financing on
social economic status of the borrowers.
4.5 Conclusion of the chapter
As explained above the objective of the chapter was to analyse the data presented
and to examine the impact of loans on SMEs performance. Based on the descriptive
statistics presented above, we observed that SMEs performance depends on the NMB
financing. The effects of bank financing to SME‘s operational performance, as most
of the SMEs have increased their sales, profits, increased the number of employees;
boost the government revenue through taxation (economic effect). Socio-economic

69
status of the owners has improved standard of living and able to make business
competition. The positive performance of the SMEs sector is closely associated with
the performance of the nation. Thus we would say that all things being equal, the
NMB loan are more efficient for poverty reduction for the majority of the poor
people, specifically for low-income countries (developing countries). However, there
are some challenges that SMEs facing on the availability of funds from NMB. These
challenges according to their weights includes: high borrowing interest rates, less
amount given than anticipated/applied, requirement of collateral as security, short
period given to repay the amount of the loan, it takes long time from the date of
application of the loan to the date of disbursement of the loan and there are a lot of
procedures and bureaucracy.
70
CHAPTER FIVE
5.0. DISCUSSION OF THE FINDINGS
5.1. Introductions
The objective of this study was to evaluate the effect of NMB financing on
performance of small and medium-sized enterprises before and after utilization of
bank loan. This chapter deals with the discussion of the findings constituent with the
research objectives in chapter one. Also in this chapter we tried to link our findings
and other studies, what other researchers said. The data presented and analysed are
drawn from the answers of the respondents on whom the questionnaires were
administered. Population of the study were four hundred (400) in Lindi Municipal
SMEs with NMB loans. As pointed out in chapter three and four that there were a
total of 100 SMEs which were sampled and three (3) respondents from NMB bank
during the research work for the analysis and the selection was randomly. All 100
SMEs were served with questionnaires in which 14 respondents did not manage to
fill and return the questionnaires for unknown reasons. 89 questionnaires were
returned(89 % response rate), out of which 85 questionnaires were correctly filled
and which were used in the statistical analysis and four(4) returned questionnaires
from SMEs were contained missing vital information(not correctly filled), but they
have no effect for the analysis as sample still sufficient. However questionnaires
were served to the top management of NMB bank including loan officers.
Questionnaires which served to the NMB bank were differently from these which
were served to SMEs. The analytical tools which used in this study were spss which
includes: Pearson correlation, chi-square test and excel. Below is the discussion of
the findings:
5.2. General background of information
Under general background of information of SMEs the discussion were made based
on the finding as follows:

71
5.2.1: Gender and marital status of the respondents
The study revealed that 53(64.6%) of the respondents were male and 29(35.4%) were
female. The majority of the businesses are owned by men. This kind of gender is
supported by the fact that women are constrained by education/training, business
experience, discriminations, socialization/networking and unwillingness to take risk
(Coleman, 2002; Fielden et al, 2003 and Nchimbi, 2002). Also the existing legal
system of Tanzania has been discriminating women. For example, statutory law had
derived from the colonial legacy, customary law which was codified soon after
independence in 1963 and religious laws notably Islamic and Hindu Laws.
Customary law and Islamic law operate side by side in many facet of life (C. Mark
and Magdalena Rwebangira, 2004).
With respect to marital status, 13(15.9%) of the respondents are single, 65(79.3%) of
the respondents are married, 4(4.9%) are widows and there was no respondent who
was divorced. The majority of the respondents are married. The married couples are
more likely to have more commitments, to avoid dangerous disease like HIV and
stable income than single. This is supported by the work of (Blank, 1997;
Furstenberg, 1990; Garfinkel & McLanahan, 1986; U.S. Bureau of the Census, 2001;
White & Rogers, 2000), they said, Marriage has a large effect on reducing the risk of
poverty. A number of studies have indicated that unmarried individuals and single-
parent families are more likely to live in poverty than their married counterparts.
5.2.2: Education and age of the respondents
The level of education and age of the respondents varies significantly. The study
revealed that, 31(37.8%) of the respondent had primary school, 45(54.9%) of the
respondent had attained form four as the highest level of education, 2(2.4%) had
attained form six (high school), 1(1.2%) attained ordinary diploma, 2(2.4%) attained
advanced diploma/first degree, 1(1.2%) attained master degree and no respondent
who attained PhD. The study indicated that the majority of the respondents had
attained form four. This is the same findings as cited by (Lena and Wong, 2003) but

72
contradicted the work of Kuzilwa (2005), he said the majority of entrepreneurs had
primary school certificate.
From the data collected from questionnaires and interviews, it was observed that, the
respondents with the primary education are lacking basic skills such as record
keeping, managerial competence, pricing, business plans, marketing, lack of
awareness through education of the products offered, terms and conditions of NMB
loans and access to technology as compared to respondents of four educations and
above. By virtue of the above findings it was also observed that those with at least
form four educations and above are doing better than those of primary education.
The results are supported by findings of (Kuzilwa, 2005; Robinson & Malach, 2004;
Ying, 2008).
With respect of the age, 49(60%) of the respondent their age lies between 21-40
years, 29(35%) of the respondent their age lies between 41-60 years, 4(5%) of the
respondent their age lies between 61-80 years old and there was no age of above 80
years old. From the data collected it shows that the majority of the age of the
respondents lies between 21-40 years old. This shows that most SMEs are
established by young individuals who are still energetic, open new ideas and have
cleared studies, but due to high unemployment end up to self employment.
5.2.3: Source of fund to start-up of the business
The study revealed that, 55(67.1%) of the respondents get funds to start up business
from their savings, 20(24.4%) from family, 1(1.2%) from friends, 5(6.1%) from bank
and 1(1.2%) from other source which was actually from pension. The majority of the
respondents got capital to start up their businesses from their own savings and
followed by friends. This finding is similar with previous studies which were done
by (Janssen & Wtterwuldghe, 1997 and Hutchinson & Xavier, 2006). Furthermore, a
researcher argues that, when new businesses (SMEs) starts it is difficult to be trusted
by banks or even friends. The data collected revealed that only one respondent out of
eighty two (82) was given a loan from friend and five(5) respondents out of eighty (

73
82) were advanced the loans from bank. The new businesses (SMEs) are considered
as highly risk due to the existence of asymmetry information. Start-up of business
seemed to have been funded from own sources. This findings are similar to the
findings which was done by (Cole, 2004, Beck et al, 2004, Berger et al, 2001, Myers
&Majluf, 1984)
5.2.4: The purpose of the loan
The data presented above shows what was actually the purpose of the loan, 3(3.7%)
of the respondent indicated that they need to start up business, 50(61%) of the
respondent said that they need to increase their working capital, 29(35.4%) wanted to
expand of their existing businesses and no respondent who applied a loan for other
purpose. The majority of the respondent requested loan to increase their working
capital.
5.2.5: Business experience of the respondent
The study revealed that, 16(19.5%) of the respondent have the business experiences
of less than four years, 39(47.6%) of the respondent have business experience that
ranges between 5 to 10 years old, 15(18.3%) of the respondent have business
experiences that ranges between 11 to 15 years old, 8(9.8%) of the respondents have
business experience that ranges between 16 to 20 years old and 4(4.9%) of the
respondent have business experience of more than 20 years old. It is observed that
the majority of the respondents have business experience which ranges between 5 to
10 years old. From the data presented, it was observed that the respondents with long
business experience are more advantageous than those with less business experience.
The benefits of respondents with long business experience against those with less
business experience include: competition- firm with long experience can able to
adjust price up and down, because price is a basic tool for competition, marketing
strategy- how to market goods and services so that can attract potential customers
and also it is easier to access to bank facilities. Young firms are not trusted with bank
because they are considered as risky.
74
5.3 SMEs performance before and after bank loan
This part presents the analysis of data by comparing the effect of SMEs performance
before and after taking bank loans.
5.3.1 Average sale per day of the respondent before and after loan
The average sales per day are known, and then it is easier to establish sales per
month and eventually sales per annum as the parameters are known.
(i) Average sales per day of the respondent before loan
The data presented revealed that, 39(47.6%) of the respondent said, their sales were
below tshs 15,000 per day which represents as sales level one(I) , 17(20.7%) of the
respondent said, their sales were ranging between tshs 15,000 to tshs 29, 000 which
represents sales level two(II), 14(17.1%) of the respondents said their sales were
ranging from tshs 30,000 to 79,000 which represents sales level three(III), 12(14.6%)
of the respondent said their sales were ranging between tshs 80,000 to tshs 100,000
which represents sales level three(IV) and there was no respondent who said their
sales was above tshs 200,000 per day which represents sales level four(V).
(ii) Average sales per day of the respondent after loan
The data presented here revealed that, 25(30.5%) of the respondent said, their sales
ranges from 16,000 to tshs 70,000 which represents as sales level one (I), 41(50 %)
of the respondent said, their sales were ranging from tshs 80,000 to tshs 120, 000
which represents sales level two (II), 9(11 %) of the respondent said their sales were
ranging from tshs 130,000 to tshs 240,000 which represents sales level four (III),
6(7.3%) of the respondent said their sales were ranging from tshs 250,000 to tshs
450,000 which represents sales level four (IV) and 1(1.2%) of the respondent said
their sales were tshs 500,000 and above per day which represents sales level five(V).
The findings revealed that, sales after taking loans was relative higher than sales
before taking bank loans in all levels. After bank loans sales have been increased due
to the fact that, the owners have expanded their business operations including
increase the level of stock, identify and selling fast moving items which meets the

75
customer needs. From this analysis it shows that the bank loans have positive effect
on the SMEs performance. The findings are similar to the work of (Idowu, 2010;
Martins, 1991; Kuzilwa, 2005, Peter, 2001, Trisha, 2011).
5.3.2 The average profit of the respondent before and after loan
(i)Average profit before loan
The data presented revealed that 5(6.1%) of respondent said they were not getting
business profit, 73(89%) of the respondent said they were getting very small profit
about 3% before loan, 4(4.9%) of the respondent said they do not know. From the
interview conducted regarding respondents who were not getting profit they argued
they are facing with high operating costs which erode small profits they get and also
some items they were selling was out of date which was sold at cost to avoid further
loss. The majority (89%) of the respondent were getting profit although was very
small they argued that, the income level of small scale enterprises was not all that
encouraging. What they normally got from their daily sales was very small. This
would not help them to take a step to expand their enterprises. Because of the low
income of these enterprises, they were not able to compete with their competitors.
(ii) Average profit after loan
The data presented revealed that, 53(64.6%) of the respondent said that after taking
loan increase in profit from 3% to 10%, 24(29.3%) of the respondent said profit was
satisfactory and 5(6.1%) of the respondent said there was decrease in profit after
taking loan. Five (5) respondents said their profits has decreased from 3% to 1%
after loan, their argument was that, one respondent said the motor vehicle which was
carried his merchandise was involved in the major accident and all goods was
destroyed. Others said high borrowing interest charged to them was eroded their
profits. The majority (64.6%) of the respondent said increase in profit was good
after bank loan. The increase in profit was due to the increase of sales after the
owners expanding their business operations, buying and selling fast moving items
which meet customer needs (creating value for targeted customers). Therefore bank
financing has positive effect on the SMEs performance because majority of the

76
businesses has increased their profits. The findings are similar to the work of
(Kessy&Urio, 2006; Kuzilwa, 2005, Martins, 1991; Mwangi .P.Wangu, 2011, Peter,
2001).
5.3.3. Employees employed by the respondent before and after loan
(i) Employment status before bank loan
The data presented revealed that 46(56.1%) of the respondent said there was no
employee employed, 18(22%) of the respondent each said that they employ just one
employee, 11(13.4%) of the respondent each said that they employ two employees,
7(8.5%) of the respondent each said they employ three employees. Data indicates
that the majority 46(56.1%) of the respondents did not employ before loan. However
in total there were sixty one (61) employees who employed before taking bank loans.
Mathematically this shown as follow : 18 respondents each employ one employee
which makes eighteen, second ,11 respondents each employ two employees which
makes twenty two(22), third , 7 respondents each employ three employees which
makes twenty one(21), hence makes the total of sixty one(61) employees.
(ii) Employment status after bank loan
The data presented indicates that, 30(36.6%) of the respondent each said there was
no new employee employed, 31(37.8%) of the respondents each said, they employ
one to two new employees, 12(14.6%) of the respondent each said three to four new
employees was employed, 8(9.8%) of the respondent each said five to seven new
employees was employed and 1(1.2%) of the respondent said more than eight new
employees was employed. The majority of the respondents employ between one to
four employees if we combine 31 respondents and 12 respondents who employ from
one to two and three to four respectively. This is similar to the work of (John
Kashangaki, 2005) and also similar to the definition of SMEs in the Tanzania context
(Tanzania SMEs policy; 2002) in which SMEs employ less than five people.
Furthermore the data analysis shows that in total there were one hundred seventy
four (174) new employees employed after taking the bank loans. Again
mathematically this shown as follow: 31 respondents each employ two employees

77
(take the maximum number) which makes sixty two(62) employees, second, 12
respondents each employ four employees which makes forty eight (48),third, 8
respondents each employ seven employees which makes fifty six(56) and one
respondent employ 8 employees, hence makes the total of 174 employees. From the
data analysed above by comparing the employment status before and after loan there
is net increase of one hundred thirteen (113) employees who contributed employment
taxes (net) of tshs 6,104,105. This result is supported by secondary data collected
from Lindi TRA Regional office with reference to table 4.19(b). The findings
revealed that NMB financing have the positive effect on the SMEs performance. This
is due to the fact that business operations have increased which eventually leads into
increase in profits and sales volume. The findings are similar to the work of
(Ayyagari et al, 2007, Bangladesh Bureau of Statistics survey, 2002, Kuzilwa 2005;
Mehnaz & Munshi 2007; Mwangi .P.Wangu 2011; Ryan1993; World Bank;2007).
5.3.4: Level of investment before and after loan
(i) Level of investment before loan
The data presented revealed that, 46(56.1%) of the respondent said that before loan
the level of investment was low, 29(35.4%) of the respondent said level of
investment was very low, 7(8.5%) said the level of investment was satisfactory. In
general most of the respondent said the level of investment was low followed by very
low.
(ii) Level of investment after loan
The data presented indicates that, 42(51.2%) of the respondent said increase of
investment was good, 34(41.5%) of the respondent said increase of investment was
satisfactory, 6(7.3%) of the respondent said there was no increase in investment and
there was no respondent who said increase of investment was very good. For these
who argued there was no increase in investment they said their creditors are not
paying on time, it takes three months or more to be paid. The majority of the
respondent said the level of investment was good. The increases of investment enable
the owners of the business to buy new equipments that facilitate to meet the

78
unsatisfied demand of customers both in short term and long run. The findings are
similar to the findings of (Bolnick and Nelson, 1990).
5.3.5: Training of the respondent before taking bank loan
(i) Training of the respondent before taking bank loan
The data presented revealed that, 57(69.5%) of the respondents said they were
trained before loan, 25(30.5%) said they did not trained. This suggested that majority
of the respondents had trained before granted loan. They said the areas which
covered on the training include: business ethics, how to record business and private
transactions, marketing and customer service/care.
(ii) The effect of business performance after training
The data presented indicates that, 11(13.4%) of the respondents said they are doing
very well their businesses after training. 39(47.6%) of the respondent said they are
doing well their businesses after training, 7(8.5%) of the respondent said no
changes, they still doing business as before training and 25(30.5%) they did not
attend training. The data indicates that the majority of the respondents have trained
and they are doing well on their businesses. The results are supported by findings
which was done by (Kuzilwa, 2005, Kessy, S and Temu, S. S. 2010, Robinson &
Malach, 2004; Ying, 2008).
5.3.6: Household expenditure before and after loan
The aim of this part is to assess the social effect of the owners of the business before
and after bank NMB loan.
(i) Household expenditure before loan
Data presented here shows that 38(46.3%) of the respondents said, their income was
not adequate to meet expenditure of social services of family members such as
education, medical care , insurance services etc, 14(17.1%) of the respondents said
their income was adequate to meet standard of living and 30(36.6%) said standard of
living was normal. The majority of the respondents said income was not adequate to

79
meet their basic needs. This findings is supported from the data presented in 5.3.2(i)
above, 89% of the respondents were getting only three (3%) per cent as business
profit. The amount was real insufficient to meet family member‘s expenditure.
(ii) Household expenditure after loan
The data presented indicates that, 18(22%) of the respondents said after bank loan
their income is adequate to meet expenses of social services of their family members
(education, medical care, insurance services), 44(53.7%) of the respondents said after
bank loan standard of living has improved and 20(24.4%) of the respondent said no
changes in standard of living after loan. Although 20 of the respondents said there
were no changes in standard of living, but the majority of the respondents have
improved their standard of living and they were able to pay on time their children
school fees, electricity bills, water bills and medical expenses. The data tell us that
the standard of living has improved on the following grounds, due to increase the
level of investments, many people have employed and they earn monthly salaries
which assist to solve some of the family member‘s problems. Also since the
business profits had increased, it helps the owners to grow more and can serve better
the society. The argument is supported by the findings in 5.3.2(ii) above. Bank loans
have positive changes in the standard of life of the clients (Kessy & Urio, 2006).
5.3.7: Contribution of the business to the region after bank loan.
The data presented indicates that, 7(8.5%) of the respondents said, they contribute to
social activities, 75(91.5%) of the respondents said they registered their businesses to
the relevant authority and they are paying taxes and no respondent who said he /she
contribute nothing. After bank loans the business grows up and generate enough
profits which enable respondents 7 (8.5%) to contribute to social activities. They said
that the activities which they contribute to social activities includes: voluntary
contributions to orphans, HIV/AIDS affected members of the society, building ward
secondary schools, building churches and mosques so that people worship for peace
of the country(political stability), employers make payments to National social
security funds(NSSF) as the contribution to their employees. On the other hand the
80
majority of the respondent said, they registered their businesses to the relevant
authority and they pay taxes. From the data presented it has observed that there was
an increase in sales, profits, and employments. These variables in turn enable the
owners of the business to pay various taxes such as individual taxes, corporate taxes,
VAT and employment taxes. The argument is supported by the data collected from
Lindi TRA regional office as per table 4.19(b) in this report. Collections of these
taxes enable the government deliver public goods and services smoothly as the
responsibility of the government to its people is to provide effective services
(Musgrave, et.al. (1989:212). Thus, the NMB financing to SMEs have positive effect
on the operation performance.
5.3.8: Development made after bank loan
The aim of this part was to assess the social effect of the owners of the business after
bank NMB loan. The data presented indicates that, 6(7.3%) of the respondents said
they managed to build modern family house, 51(62.2%) of the respondents they
managed to pay school fees/colleges to their children/relatives, 3(3.7%) of the
respondents said they bought family transport, 22(26.8%) of the respondents said
they started/added other businesses. NMB financing has the direct effect on the
growth of SMEs, as the majority of the respondents are managed to pay
school/college fees due to increase their profits from investments. Data indicates that
the respondents who decided to invest in education are on the right truck because
education is definitely important for everyone. In order to live in a civilized,
spiritualistic and ethical society, someone needs to be educated, being equipped with
good ethics is a part of the education, and education is absolutely beneficial for
society on the whole. From increase in profits other managed to add (expand) other
line of businesses.
5.3.9: Increase/decrease of business performance after taking bank loan
The data presented indicates that, 10(12.2%) of the respondents said there was
decrease of their businesses after taking bank loan, 72(87.8%) of the respondents
said there was no decrease of their businesses. For these who said their businesses

81
decreased, one of the respondent said the motor vehicle which was carried his
merchandise was involved in the major accident and all goods was destroyed. Others
said high borrowing interest charged to them and high operating costs which eroded
their profits and lack of business management skills which includes: finance,
marketing, basic costing, stock control and financial records.
5.3.10: Firm utilization of the bank loan
From the data presented the respondents were asked: how did your firm utilised the
bank loan? 80(97.6%) of the respondents said they utilise to increase their working
capital. But in surprise only two (2.4%) point blankly admitted that most of the loan
they take from the bank are used for settling other debts. This is a non-starter for
most banks. Because they expect the loans to be invested into ventures that has a
potential of meeting the requirement for loan repayments. That is investing into
projects that will easily be able to allow the borrower to repay the loans in the near
future easily.
5.3.11: The major challenges that can threaten the business growth
The respondents were asked about, what do you think can be the major challenges
that threaten your business growth? They were requested to assign/rank by numbers
according to their priorities, assign number one being the most challenge, followed
by two, etc to the last number and the researcher decided to take only these
challenges which were assign/ranked number one as the most threat. The data
presented indicates that, 38(46.3%) of the respondents assign stiff competition of
similar business threatening of their business growth as their challenge number one.
The respondents argued that the firm with large capital tends to lower the selling
prices as a result customers shift to firms with low selling prices. From this argument
it appears that the competitors (large firm) use one the five competitive forces that
was designed by( Michael E.Porter,1979) that shape the competition i.e. Bargaining
power of customers (buyers)- the ability of customers to put the firm under pressure,
this also affects the customer‘s sensitivity to price changes. 14(17.1%) of the
respondents assign high business operating costs threatening their business growth as

82
their challenge number one. Under this group they argued that the high operating
costs are caused by high electricity bills, rent charges for their business as most of
them have no premises to run their businesses, transport charges due to poor
infrusture of Lindi regional and suppliers charge them high prices. This is bargain
power of suppliers i.e. reducing selling prices and increase purchase prices by
(Michael E.Porter, 1979). 4(4.9%) of the respondent assign difficulty availability of
the market/customers to their commodity/services as their challenge number one.
7(8.5%) of the respondents assign creditors not paying them on time as their
challenge number one. Most of this group is trading with government institutions
which comprising district councils, primary and secondary schools and government
hospitals. The results may be interpreted with caution as there is no evidence on the
impact on creditors on the owner‘s business growth. May be there are other factors
such as inflation, interest rates, political events, natural hazard. 19(23.2%) of the
respondents assign multiplicity of taxes which are administered both by TRA and
Municipal threatening of their businesses as their challenge number one. Multiplicity
of taxes means paying similar taxes on the same or substantially similar tax base.
Small taxpayers under the regular system of taxation are discriminated against, since
the compliance requirements, cost of compliance and tax rate are the same for both
small and large enterprises (Vasak, 2008). The majority of the respondents said the
stiff competitions of similar business are the most threatening factor to their business
growth.
5.3.12: Challenges facing SMEs when requesting bank loan
The aim of this section was to assess the challenges facing SMEs when requesting
bank loans. The criteria of assessments were based on the education and experience
of the respondents. The respondents were asked about, what challenges are you
getting when requesting bank loans? They were requested to assign numbers
according to their priorities, assign number one being the most challenge, followed
by two, etc to the last number and the researcher decided to take only these
challenges which were assign/ranked number one as the most challenge.

83
(i) Time of application to disbursement of the loan takes long time
The data presented indicates that, 4(4.9%) of the respondents said from the time of
application to disbursement of the loan takes long time. From these respondents, one
(25%) out of 4 of the respondents, his level of education was primary school with the
business experience of 5-10 years and the remaining three (75%) their education was
form four with business experience of 16 – 20 years. From these data, one of the
respondent said it takes three months to get a loan and the remaining said it takes one
to two months. On the other side the same information collected from NMB loan
officer said it takes one week to three weeks and the maximum is one month but not
more than two months. From the evidence available it was true to say, it takes long
time to issue loans to the applicant. The delay actually distorts all the plans of the
respondents to achieve their goals. For example, time value of money may be
distorted, i.e. today‘s shilling is more value than tomorrow‘s shilling.
(ii) Less amount of the loan given than anticipated/applied
The data presented shows that, 19(23.2%) of the respondents said they are given less
amount of the loan than anticipated/applied. 8(42%) out of 19 of the respondents,
their level of education was primary school with the business experience of less than
four years, 9(47%) out of 19 of the respondents their level of education was form
four with business experience of 5-10 years and the remaining two (11%) out of 19
of the respondents, one was form six and other was first degree with experience 16-
20 years old.
Interpretation of the data shows that only 61.62 % of the total applied loan was
issued (see table 4.27(b), the 38.38% was rejected. The reasons for the rejection was
cited as lack of adequate and registered collateral, poor daily business account turn
over. The business account turn over means the owner of the business must deposit
collections frequently in his /her bank account. For these who applied for the loan of
more than ten million shillings, the account turn over should reflect at least eighty
(80 %) per cent of deposit to qualify for the entire amount, if below the requirement,
the applicant get less amount. The rejection rate under this study is high as

84
compared to the previous studies. For example Krasniqi (2010) shows that all of
SMEs in the sample that applied for loan in Kosovo 17.4 % were rejected. Hash and
Tocsi (2010) showed that from the sample of applicants, only 6.5 % was rejected in
Southern Eastern Europe countries. Levenson and Willard (2000) show that, in U.S
only 2.14 per cent of small firms did not obtain funding for which they applied in
1987-1988. From the comparative of data presented it can be concluded that, the
rejection rate in developing countries are much higher than those of the developed
countries.
(iii) Requirement of security such as collateral
The data presented shows that, 17(20.7%) of the respondents said they are required
to offer security such as collateral in order to get full amount of the loan applied.
From the data 7(41%) out of 17 of the respondents their level of education was
primary school with business experience of 11-15 years old, 9(53%) out of 17 of the
respondents their level of education was form four with business experience of 5-10
years old and the 1 (6%) out of 17 was a holder of master degree with a business
experience of above twenty years old. From the data presented it agrees with many
research findings that mention collateral as one of the factors that limiting the growth
of the SMEs. It is also evidenced from the respondents who received less amount of
the loan due to lack of collateral. Most of the SMEs they know the importance of
pledging the assets as collateral against the loan taken from bank, but they lack
sufficient collateral requirements as compared to large firms (Aryeetey et al, 1994;
Abor and Biekpe, 2006; Boughea et al,2005; Coco, 2000).
(iv). High interest rate on borrowing
The data presented shows that, 28(34.1%) of the respondent said, there are high
interest rates on borrowing. 10(36%) out of 28 of the respondents their level of
education was primary school with business experience of 11-15 years old, 16(57%)
out of 28 of the respondents their level of education was form four with business
experience of 5-10 years old,1(3.5%) out of 28 was form six with business
experience of 16-20 years old and 1(3.5%) out of 28 was a holder of first degree with

85
business experience of less than 4 years old. The majority of the respondents (34.1)
%) cited high interest rate as their big challenge. The interest rate which SMEs
charged by the NMB bank were 18 % and 19 % for year 2010 and 2011 respectively
while profit (10%) earned by SMEs was smaller than borrowing interest rates. The
data tell us that profits earned are eroded by high borrowing interest rates and
borrowers are remained with nothing.
(V) A lot of procedures and bureaucracy
The data presented shows that, 3(3.7%) of the respondents said there are a lot of
procedures and bureaucracy. 2(67%) out of 3 of the respondents their level of
education was form four with business experience of less than four years, 1(33%) out
of 3 their level of education was a ordinary diploma holder with also a business
experience less than four years.
They pointed out that, loans procedures are so long and is a problem for some of
clients especially those who are coming far from Lindi town. They mention twelve
procedures which application loans must be signed: chairperson from the area which
you are living, village executive officer, word executive officer, Land officer, court,
business plan, valuation report done by a professional valuer for assets with title
deed, loan insurance, audited financial statements for the past three years, business
insurance, registration of your title deed (if any) from zonal land officer and tax
clearance from TRA. They mentioned the issue of bribe although was not directly
requested by the staff but the way they behave it may imply they need sort of
corruption for them to process the loan application. Although there is no evidence of
such situation but the indicators are seen. These observations are similar to the
findings of Beck et al (2005) who used firm level data from World Business
Environment Survey (WEBS) in 1999, the survey shows that firms rank the bank
corruption as greater obstacle of accessing external finance. Olomi (2009) notes that
SMEs operators and some of bank officials acknowledge that corruption exists in the
banking sector and some bank officers deliberately delay processes until they are
promised something.

86
(vi): Short period to repay the full amount of the loan
The data presented shows that, 11(13.4%) of the respondents said they given short
period to repay the full amount of the loan which is twelve months. 5(45%) out of 11
of the respondents their level of education was primary school with business
experience of less than four years and 6(55%) out of 11of the respondents their
education was form four with business experience of 5-10years old. The first
installment is normally paid within a month immediately after receiving the loan, for
example if loan was received on 7 of January, the first installment must be repaid at
the end of January. They suggested that the first installment payment be extended to
two months after receiving the loan and the maximum repayment period for the full
amount be extended to twenty four (24) months. They are getting problems to pay
their installment on due dates, as borrowing interest rates are high sometimes they
delay or even to default the payments.
Conclusion, from the above findings it revealed that, the majority of disadvantage
group are these with the level of form four education and primary school with
business experience of less than four years, 5-10 years and 11-15 years old.
5.3.13: Application of the loan by SMEs to the NMB Bank.
From the data presented it shows that the applications, amount applied, amount
advanced and amount not qualified are increasing. The reason given from top
officers of NMB bank was that for the amount rejected, the reasons which advanced
was lack of collateral value which is equivalent or more to the amount of loan
applied for, no good repayment records from the previous loan and inadequate
account turnover.
5.3.14: Recovery rate of the loan
From the data presented it shows that, the rate of default by SMEs is just five (5 %)
per cent. This rate is approximately the same as that of the amount not qualified for
loan in table 4.28. In order to minimise the default rate, it is the responsibility of the
loan officer to ensure that loan is fully recovered. He/she has to remind the customer

87
in advance before the due date. When the customer did not respond, a reminder letter
is normally served; if those efforts fails, the bank normally seize the collateral
pledged as loan security. When no payment made within 21 days from the date the
collateral seized, collateral handled over to the bank auctioneers for auction.
According to data revealed to me by loan officer, for year 2010 to 2011 there were
four houses sold while other 12 houses was on the way to be auctioned, but owners
paid the loan on late hours before the auctioneer take action.
5.3.15: Borrowing interest rate vs. Lending interest rate
The data presented shows the comparison between the borrowing interest rate on the
side of the borrower and on the other side lending interest rate to someone who want
to invest in the bank (see table 4.29). The borrowing interest rate which charged to
SMEs is higher than those of lending (investing) on savings accounts. If you need to
borrow some money from bank, you will be charged an annual interest of 18 % to 19
%, and if you have your idle cash you want to deposit/ invest to the bank, they will
award you a gain of 3 % to 5 %. From this analysis there is no any proportional
between borrowing and lending interest rates. From these findings it is therefore
supported by the majority of the respondents who claimed that they charged high
interest compare to actual profits they are getting.
5.3.16: Total bank charges to borrower
The data presented shows the total charges charged to the borrower. Table 4.30 in
this report indicates that apart from borrowing interest charges, there are also extra
charges which charged to the borrower, these charges include: bank charges of 1.5 %
and risk premium of two per cent (2 %).
5.4. Conclusion of the chapter
The objective of the chapter was to evaluate the impact of NMB financing on the
performance of SMEs. Based on the above findings and empirical evidence
demonstrated from the previous studies, we conclude that the NMB financing have
the positive effect on the performance of SMEs. The findings therefore exhibit
88
significant relationship between the NMB loans and SMEs performance; hence, as
more loans will be issued to SMEs, the more SMEs will grow. Apart from positive
effect of NMB financing to SMEs growth, there are weaknesses on the side of
NMB loan officers. There were complaints raised by some of the respondents that,
there are double standards on requirements of collateral as securities. These who
know loan officers are given full amount of the loan without consideration of
collateral while others are not. This is a double standard of the treatment of the loan
applicants. These respondents they went further by saying that there are indicators of
demanding corruption among of NMB loan officers.
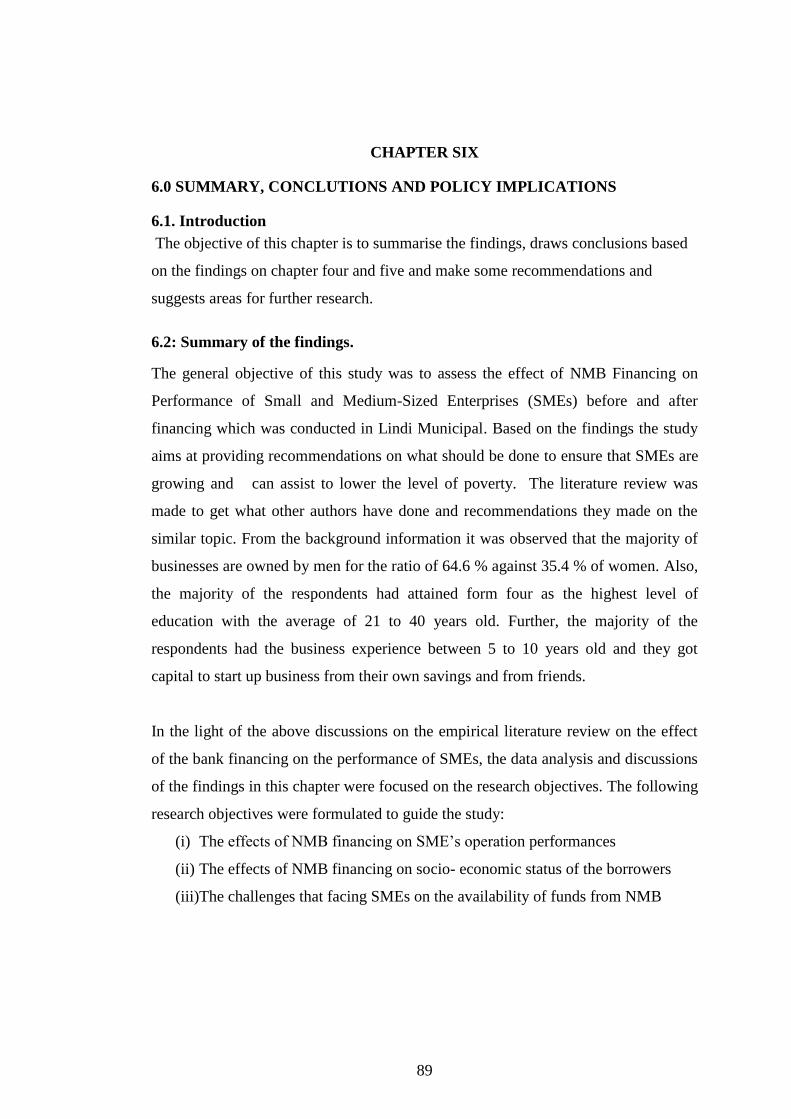
89
CHAPTER SIX
6.0 SUMMARY, CONCLUTIONS AND POLICY IMPLICATIONS
6.1. Introduction
The objective of this chapter is to summarise the findings, draws conclusions based
on the findings on chapter four and five and make some recommendations and
suggests areas for further research.
6.2: Summary of the findings.
The general objective of this study was to assess the effect of NMB Financing on
Performance of Small and Medium-Sized Enterprises (SMEs) before and after
financing which was conducted in Lindi Municipal. Based on the findings the study
aims at providing recommendations on what should be done to ensure that SMEs are
growing and can assist to lower the level of poverty. The literature review was
made to get what other authors have done and recommendations they made on the
similar topic. From the background information it was observed that the majority of
businesses are owned by men for the ratio of 64.6 % against 35.4 % of women. Also,
the majority of the respondents had attained form four as the highest level of
education with the average of 21 to 40 years old. Further, the majority of the
respondents had the business experience between 5 to 10 years old and they got
capital to start up business from their own savings and from friends.
In the light of the above discussions on the empirical literature review on the effect
of the bank financing on the performance of SMEs, the data analysis and discussions
of the findings in this chapter were focused on the research objectives. The following
research objectives were formulated to guide the study:
(i) The effects of NMB financing on SME‘s operation performances
(ii) The effects of NMB financing on socio- economic status of the borrowers
(iii)The challenges that facing SMEs on the availability of funds from NMB
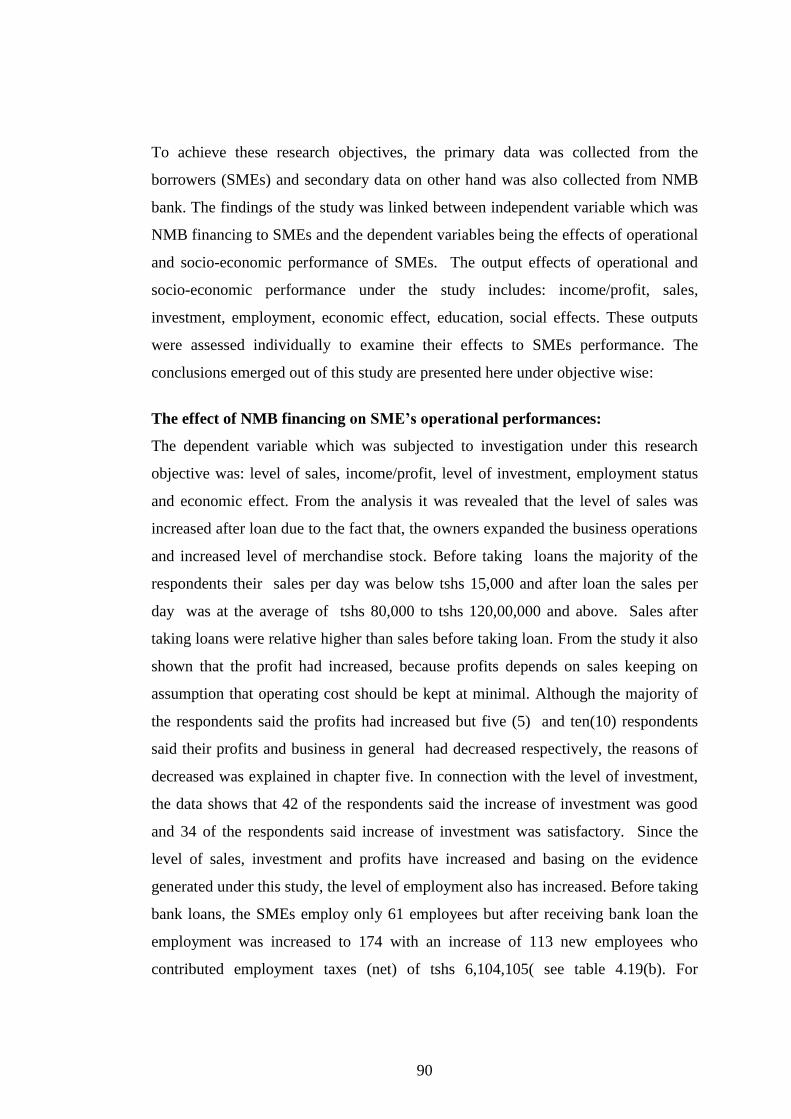
90
To achieve these research objectives, the primary data was collected from the
borrowers (SMEs) and secondary data on other hand was also collected from NMB
bank. The findings of the study was linked between independent variable which was
NMB financing to SMEs and the dependent variables being the effects of operational
and socio-economic performance of SMEs. The output effects of operational and
socio-economic performance under the study includes: income/profit, sales,
investment, employment, economic effect, education, social effects. These outputs
were assessed individually to examine their effects to SMEs performance. The
conclusions emerged out of this study are presented here under objective wise:
The effect of NMB financing on SME’s operational performances:
The dependent variable which was subjected to investigation under this research
objective was: level of sales, income/profit, level of investment, employment status
and economic effect. From the analysis it was revealed that the level of sales was
increased after loan due to the fact that, the owners expanded the business operations
and increased level of merchandise stock. Before taking loans the majority of the
respondents their sales per day was below tshs 15,000 and after loan the sales per
day was at the average of tshs 80,000 to tshs 120,00,000 and above. Sales after
taking loans were relative higher than sales before taking loan. From the study it also
shown that the profit had increased, because profits depends on sales keeping on
assumption that operating cost should be kept at minimal. Although the majority of
the respondents said the profits had increased but five (5) and ten(10) respondents
said their profits and business in general had decreased respectively, the reasons of
decreased was explained in chapter five. In connection with the level of investment,
the data shows that 42 of the respondents said the increase of investment was good
and 34 of the respondents said increase of investment was satisfactory. Since the
level of sales, investment and profits have increased and basing on the evidence
generated under this study, the level of employment also has increased. Before taking
bank loans, the SMEs employ only 61 employees but after receiving bank loan the
employment was increased to 174 with an increase of 113 new employees who
contributed employment taxes (net) of tshs 6,104,105( see table 4.19(b). For

91
economic effects, adequate financing to SMEs normally enables them to generate
new business, new employment as mentioned and generate profits, and hence
increase tax base. The increase of tax base through paying individual taxes, corporate
tax, VAT and employment taxes enable the government to have the capacity to
finance its expenditure and provide basic goods and social services, in particularly
health, education, infrastructure which give the poor a better chance of increasing
their productivity and income earning capacity. Increase in production, new
businesses, and new employment and through paying taxes, raise the economy of a
country as well as GDP. Refer to table 4.19(b) to see various taxes paid after positive
effect of NMB financing to SMEs.
The effect of NMB financing on socio- economic status of the borrowers
The dependent variables which subjected to investigation under the research
objective were: education, household expenditure, owner‘s development, employee‘s
development and contribution to social activities. 51 of the respondents out of 82
said after bank loan they managed to pay school fees and training expenses to their
children/relatives who undergo training, but before loan it was difficult to meet such
expenses. House hold expenditure, after bank loan most of the respondents said the
standard of living was improved and their income were adequately to meet basic
needs of their family members including, insurance services, and health care and
from the analysis of data presented in chapter five it shows that after the bank loan,
the owner‘s of the business managed to build the modern family house and
purchased family transport. Employee‘s development: the monthly earned salaries
assisted to progress themselves and they assist members of the family and the owners
of the business contribute to social activities which include voluntary contributions to
orphans, HIV affected members of the community, donations to churches, mosques
and secondary schools.
Challenges that facing SMEs on the availability of funds from NMB
The challenges facing SMEs when requesting loan include high borrowing interest
rates, less amount of the loan given than that which was actually applied,

92
requirement of collateral, short period required to repay the full amount of the loan;
time of application to the disbursement of the loan takes long time and a lot of
procedures and bureaucracy. From the data presented above, high borrowing interest
rates was assigned more weight by the majority of the respondents as the major
challenge to them (34.1%). The high borrowing interest together with other charges
such as bank charges and risk premium increases the operating costs to the owners of
the business which eventually erode the profits. The next challenge which assigned
more weight was less amount of the loan given than that which was actually applied
(23.2%). This challenge has negative effect on the SMEs growth and development.
They cannot achieve what they have already planned due to fewer amounts. Lack of
adequate security was also assigned more weight of 20.7%. Short period required to
repay the full amount of the loan was also challenges as cited by respondents by
assigning weight of 11.4%. The respondents fail or delay to pay the loan instalments
as scheduled because of the short period. The following also cited as the challenges
but with less weights: From time of application to the disbursement of the loan takes
long time (4.9%), takes from one month to three months and a lot of procedures and
bureaucracy (3.7%). Delaying processing the loan not only distorts the activities
planned but also business may lose contracts. For example, in Lindi municipal there
are cash nut and rice as season businesses which normally take the maximum of
three to four months.
6.3 Conclusion of the study
The purpose of the study was to assess the effect of NMB Financing on
Performance of Small and Medium-Sized Enterprises (SMEs) before and after
financing. The conclusions drawn from this study was based on the findings which
were emanating from the research objectives. From the findings, the study revealed
that the NMB loans have positive effect on the performance of SMEs in Lindi
municipal. After bank loan the majority of SMEs increased level of income/profits,
sales, investments, assets, creation of new jobs and improve standard of livings,
however few of the respondents claimed that their businesses was decreased after
taking bank loans as explained in the previous chapter. There is a general consensus

93
that the performances of small and medium enterprises are important for both
economic and social development of developing countries (Abor &Quartey, 2010;
Idowu, 2010; Kuzilwa, 2005; Trisha, 2011). Since small and medium enterprises are
labour intensive as pointed out in the literature review, they are more likely to
succeed in smaller urban centres and rural areas, where they can contribute to a
more even distribution of economic activity in a region and can help to slow the
flow of migration to large cities. The researcher concludes that, if SMES are
provided with adequate funds on time, it enable them to grow and hence can assist
the government to fulfil its responsibility to her citizens. Performance of the SME
sector is closely associated with the performance of the nation.
6.4. Recommendations
From the empirical evidence, we have seen that SMEs are the key source of
economic growth, income and employment generation for development of Tanzania.
They need therefore be supported by the government so that they can operate
consistently and become sustainable in the long run. This study provides the
following recommendations to the challenges faced SMEs in accessing finances
from financial institutions and their growth:
Inordinate delay between time of application and the time of disbursement of
the loan
NMB bank should reduce unnecessary bureaucracy to process the application loans.
Bureaucracy may be interpreted in different perceptions such as demand corruption
indirectly. Bank officials should not encourage bureaucracy and they must serve
their customers promptly. It is recommended that the loan should be given at an
appropriate time so that it can be used for the intended purpose/objectives.
Collateral
Requirement of security such as collateral has been a problem to some of the SMEs
to access to financial institutions. Lack of sufficient collateral frustrates the SME‘s
performance, because they are given fewer amounts than anticipated. By virtue of

94
this SMEs are unable to achieve their goals. In this regard the government has to
come to the rescue of the SMEs. Further it is recommended that traditional lease of
the land be accepted as collateral.
High borrowing interest rate
SMEs are the engine of growth for developing economies like in Tanzania. Bank
loans are usually one of the fastest means of acquiring credit for SMEs. This credit is
what helps them in boosting their business and in effect economy growing as a result.
Thus the cost of such loans should be reviewed downwards to enable smooth
repayment and increase in the demand for loans by SMEs to enable growth in their
business which will in effect affect the economy as a whole positively.
Short period to repay the full amount of the loan
Majority of the respondents cited that bank provide short period to recover the
amount of the loan as a problem. The recovery period of twelve months is very short
that cause business fail or delay to pay the instalment as agreed or default. The
failure or delay is actually attributed by high borrowing interest rate and economic
activities in Lindi which has poor cash flows. We recommend that the repayment
period should include the grace period and to recover the full amount be extended
from the current twelve months to twenty four months.
6.5: Policy implication
In Tanzania, government policies and regulations designed are in place but they are
coming in the survival and progress of SMEs. From this study therefore, we
recommend the following to be reviewed so that SMEs can develop:
1. Land Policy Reforms:
The current constitutional provisions have no proper guidance on how tradition
land/farm lease can be accommodated as collateral in commercial banks. The next
new constitutional should provide guidance on land usage and to streamline
land/farm ownership so that SMEs can easily access the commercial loans.
2. Borrowing and lending interest rate

95
Currently there is wide gap between borrowing interest rate and lending interest
rate. When you need to borrow money from NMB bank, they will charge at the rate
of 19%, meanwhile if you need to deposit/invest your money for a certain period of
time, they provide you 3 % to 5% as interest earned. The government should review
these two types of interest. It is recommended that the borrowing interest rate should
be lowered downs and lending rate be reviewed upwards. This however, should be
done with caution by considering the impact of lowering the borrowing interest rate
as may cause the financial institutions to operate at losses.
3. Tax policy and transaction costs
Small taxpayers under the regular system of taxation are not discriminated, since the
compliance requirements, cost of compliance and tax rate are the same for both small
and large enterprises. As a result most of informal enterprises have failed to
formalise and micro enterprises have been unable to grow and graduate into Small
and Medium Enterprises. The tax regime in Tanzania is unfavorable for SMEs
development. Taxes are many, rather than high and collected by various authorities
including Tanzania Revenue Authority and the Local Government Authorities.
Furthermore, entrepreneurs are ignorant of tax matters and the cost of complying
with tax regulations is considered high. Whereas taxation of businesses is a necessity
for national economic development, the present tax regime imposes a major burden
on SMEs. It is therefore recommended that the government should review the legal,
tax structure and regulatory framework to ensure that it encourages the development
of SMEs.
6.6. Limitations of the study
Constraints are expected to occur in any research work. First, even though it was
explained to respondents that the study was purely for academic purpose, but still
some of the respondents(both SMEs and NMB staff) was not willing to disclose
some basic information during the interviews because they regard some of the
questions were sensitive to them. Some of the respondents (SMEs) thought that the
researcher sent by management of the bank and tax officers to spy their businesses.

96
However this group was regarded to be small and I assumed that they could not
affect the overall results and conclusions.
For the case of NMB bank, they reluctant to be interviewed they believe that the
research was about comparison between them and their competitors, even after
clarifying the objective of the study.
Second, limitation may be the fact that a single researcher collected and analyzed the
data, because of this; some explanations may be skewed towards personal
interpretations to distort the meaning of the results.
Third, financial and time
Time constraint, this study was carried out in a short period of time because the
timeframe requirement was to meet the deadline of the academic calendar of
Mzumbe University (two years data are not enough to reveal the actual picture of the
performance of SMEs).
Financial limitation, Lack of adequate finances may affect the quality and quantity
of data collection during the study.
Fourth, the study was focused only on NMB financing while other providers of funds
such as cooperative rural development bank (CRDB), National bank of commerce
(NBC), and Postal bank, Other commercial banks and government agencies was not
investigated. These constraints limited the scope and coverage of the study, because
it was the researcher‘s belief that a broader scope would give a better picture.
6.7. Areas for future studies
In this study the researcher assessed the effect of NMB financing on the performance
of SMEs in Lindi municipal. The research work was specifically focused to address
SMEs which operate in Lindi municipal. Thus, findings in this study may not apply
to SMEs in rural areas. Therefore, the future research may be conducted in SMEs
which operates in rural areas. Future research should mainly focus on the current
limitations since the present findings cannot be generalized based only on the NMB
financing other than other commercial banks such as CBDB bank, NBC bank, postal

97
bank which was not investigated. It is suggested that the future research be
conducted on the effect of commercial banks financing on the performance of SMEs
in all municipals in the country to have a broader scope that will give a better picture.

98
REFERENCES
Aryeetey, Abor and Biekpe (2006). Supply and Demand for Finance of Small Scale
Enterprises in Ghana, World Bank Discussion Paper No.251.
Asanterabi,J.Msigomba(2009), The Role of Kilimanjaro cooperative Bank Limited in
the growth of SMEs, Master Dissertation Submitted to the University of Dar
es salaam, November
Ayyagari and Pietro (2012). Bank financing to SMEs in East Africa countries-Africa
Development Bank, working paper no 46 of 2012.
Bagachwa and Maliyamkono (1990). The Second economy in Tanzania, London
and Athens. James Currey and Ohio University Press.
Balunywa, J, W, (1989); Entrepreneurship and Small Business Enterprise Growth in
Uganda; A Paper presented at the Symposium on modalities for Financing
Berger, Beck, Hyytinen and Pajarinen and Cole (2004). The ability of bank to lend to
informational opaque small business. Journal of banking and finance 25,
2127- 67.
Berry (2002). Reliance of SMEs on bank debt as a source of financing.
https://www.google.co.tz/search?q=Berry.A+(2002),+reliance+of+smes+on+bank+b
ebt+as+a+source+of+financing.Accessed on 2/11/2013
Bolt, J.E. (1971). Report of the committee of Inquiry of Small Firms-London,
H.M.S.O
C. Mark and Magdalena Rwebangira (2004), Tanzania Strategic Country Gender
Assessment. Available at

99
(http://siteresources.worldbank.org/EXTAFRREGTOPGENDER/Resources/
Tanzania SCGA .pd. accessed 28/12/2012
Chijoriga, Marcelina, M. and Danny Cassimo (1999). Micro Enterprises Financing:
Is there a Best Model? In African Entrepreneurship and Small Business
Development, Dar e s salaam University Press.
Harper, Malcolm (1995) Consultancy for Small Business, Southampton Row,
Cranfied University-London.
Idowu, F. Christopher, (2010). Impact of Microfinance on Small and Medium-Sized
Enterprises in Nigeria, The 7th
International Conference on Innovation and
Management ,Wuhan University- China
Kanaan,(2000); Tanzania‘s Experience with Trade Liberalization. Quarterly
magazine of IMF, Volume 37, number 2
Kashangaki, J. (2005), Tanzania MSME Access to Finance Assessment funded by
International Finance Corporation. Accessed on 25/11/2012
Kasende &Opondo (2003) - Financing Small and Medium-scale Enterprises (SMEs):
Uganda‘s Experience.
Kessy, S and Temu, S. S (2010), The Impact of Training on Performance of Micro
and Small Enterprises Served by Microfinance Institutions in Tanzania
Research Journal of Business Management 4 (2): pp 103-111
Kessy &Urio (2006). The Contribution of Microfinance Institutions to Poverty
Reduction in Tanzania (REPOA).
Kothari, C.R. (2004). Research Methodology: Methods &Techniques, second
Edition-New Delhi.
100
Kuzilwa, J. A. (2005). The Role of Credit for Small Business Success: A Study of
the National Entrepreneurship Development Fund in Tanzania Journal of
Entrepreneurship September 2005 14: pp 131-161.
Kuzilwa, J.A and Mushi, E.K. (1997). Credit needs for Small Business in Tanzania
Banker‘s journal. Issue number 9 pp 13-16, June
Levy, B (1993); Obstacles to Development Indigenous Small and Medium
Enterprises: An Empirical Assessment, World Bank Economic Review 7(1),
pp 65-83
Makombe, Idd, A. M. (2004) Women‘s Business Performance and Empowerment,
The case of Women Micro and Small entrepreneurs for Poverty Alleviation,
Arusha Region(REPOA)
Mbelle, A.V.Y. (2001). The Imminent Challenges of Globalizing: Small and medium
manufacturing enterprises in Tanzania', Tanzania Economic Trend, vol. 14
no.1.pp 25-33
Mehnaz and Munshi (2007). Financing SMEs and its effects on employment
generation in Bangladesh.
Mittah, H. (2009). Tanzania Revenue Authority mid Year Review Meeting.
Accessed 3/1/2013
Mwangi P. Wangu (2011), Access to Finance and Performance of Small and
MediumEnterprises.http://cees.mak.ac.ug/sites/default/files/publications/mwa
ngi_wangu.pdf. accessed 28/2/2013
Mwinyimvua, Hamisi, H. (2002). Policy Issues and Small and Medium Enterprises
Development in Africa, University of Dar es salaam.
National land policy,(1997) in Tanzania

101
OECD, (2006).Financing Small and Medium-sized Enterprises (SMEs) and
Entrepreneurs [http://www.oecd.org/cfe/37704120.pdf] (accessed 12/9/2012).
OECD, (2004). Promoting Entrepreneurship and Innovative SMEs in a Global
Economy: Towards A More responsible and Inclusive Globalization.
Accessed 12/9/2012
Olomi, R (2009), African Entrepreneurship and Small Business Development.Otme
Company Ltd Dar es salaam
Rugumamu, S.M & Mutagwaba, B.B (1999), Evolution of entrepreneurial
motivation: The Transition from economic necessity to Entrepreneurship.
Rutashobya, L. K & Olomi, D.R (1999), African Entrepreneurship and small
business Development: Dar es salaam University press (DUP)
Sanda (2006), Small and Medium Scale Enterprises and Employment Generation in
Nigeria- The Role of Finance
[http://www.arabianjbmr.com/pdfs/KD_VOL_1_9/4.pdf](Accessed 13/10/2012).
Satta, T.A. (2003). Enterprise characteristics and constraints in developing countries
evidence from a sample of Tanzania micro and small scale enterprises.
International journal of entrepreneurship and innovation 4 (3): pp 175-184.
Sowah. N.K,(2003);Comments on Golden Age of Business: The Role of Banking
sector ,CEPA Research Working Paper
Stokes, David (1997). Small Business Management, Great Britain
Stoner, C, R (1989); Distinctive Competence and Competitive Advantage, journal of
Small Business management 25: pp 33-39

102
Temu, S. (1998). The impact of financial Institutions Reforms on small and micro
Enterprises Financing in Tanzania, Business Management Review 5(2): 56-
78
Trisha Kweenua Quianoo, (2011). Examining the impact of loans on SMEs in
Ghana.[http://dspace.knust.edu.gh:8080/jspui/bitstream/123456789/4460/1/T
RISHA%20QUAINOO.pdf] (accessed 11/9/2012).
URT, (2002). United Republic of Tanzania, Small and Medium Enterprises Policy
(2002).
Veselin, (2012). What have we learned from the Enterprise Surveys regarding access
to finance by SMEs?
Women‘s World Bank (1995). The Missing Links: Financial Systems that Work for
the Majority [www.cgap.org] (accessed 15/10/2012).
World Bank Report, (2001). SMEs: World Bank review Group Review of Small
Business Activities, Entrepreneurship research and development in Africa:
achievements, challenges and future prospects
Temtime, Z. T. and Pansiri, J. (2000). Why SMEs Fail? A Question of Sustainability
and Competitiveness, 6th International Conference on African
Entrepreneurship and Small Business Development, 23th-26th September,
2000, White Sands Hotel-Dar Es Salaam,
Tanzania[http://www.htbotswana.com/bezab.biz_OLD/temtime/conference.ht
m](Accessed 17/9/2012).

103
APPENDICES
Appendix 1: Questionnaires for financing for SMEs
The questionnaires are divided into two parts.
Part I of the questionnaires was distributed to SMEs community traders and part II
of the questionnaires was distributed to NMB Bank Ltd.
PART I
Dear Respondent
My name is Adam M. Ntoga, I am pursuing Master of Science Degree programme
in Accounting and Finance (MSc A& F) at Mzumbe University. I am conducting
academic study on the effect of bank Financing on performance of Small and
Medium-sized Enterprises (SMEs) in Lindi.‘ Will you please assist my study by
filling and answering all the questionnaires? I assure you that your answers will be
kept confidential and your names shall not be disclosed except for this study.
Please tick the appropriate answers or fill the space provided. Thank you in advance
for your assistance.
Section A: General information (100)
1. Name......................................................................................................
Business name (if any)....................................................................................
Address ..........................................................…………………………
Telephone number..............................................................................
2. Gender: Male (..........................), Female (.....................)
3. Marital Status: Single (..................), married (...............), widow
(.......................), divorced (....................................)

104
4. Which of the following categories describe your age?
Below 20 years(..........), 21- 40 years(.........), 41-60 years(........), 61-80
years(.........),
Above 80 years (..............................)
5. What is your highest education level?
Primary school (.….…….)Form four (…….), form six (……), Diploma(................),
1st Degree/Advanced Diploma(…..…), Master degree(………..), Others
(specify)…………………..
6 (a). Which of the following categories describes your business? (Select only one)
Sole proprietor (………) Partnership (…………) Limited company (……………)
Others (specify) ……................................................
(b) What is the nature of your business?
.........................................................................................................................................
.........................................................................................................................................
7. What was the source of fund for the start-up capital of your business?
From my savings (……….), from my family (…………), from friends (……..),
from Bank (………), others (specify)……………………………………………..
8. (a) Have you applied any loan from NMB bank?
Yes (…….......................), no (...................................)
(b)If yes, what was the purpose for the loan?
Start-up business (………….), Increase working capital (………), Expansion of the
existing business (……….), others (specify)…………………………………………

105
9. How long have you been in this business (business experience)?
Less than 4 years (……………), 5 -10 years (……………), 11- 15 years
(……………), 16- 20 years (………………), More than 20 years (………………)
Section B: SMES performance before loan (200)
1. What were your average sales for the previous two years before taking the
loans?(sales per day)
Below Tshs 15,000 per day(.........), Tshs 15,000 to Tshs 29,000 (.........), Tshs
30,000 to 79,0000 per day(.......),Tshs 80,000 to 100,000 per day(..........), Tshs
200,000 and above per day(...............)
2. What was your average business profit for the previous two years before taking
bank loan?
There was no profit (...............), there was very small profit about 3% (.............), I
don‘t know (...........)
3. How many number of employees have you employed when you started the
business before taking bank loan?
No employee(........),One employee(..........),Two employees(........),Three
employees(.........) Others (specify)…………………………………..
4. What was your average investment growth for the previous two years before
taking bank loans? Low (..................), Very low (....................), Satisfactory
(...........................)
5. Did your business contributed to the Government before taking bank loan?
Yes (…................), no (..............................................)

106
If yes, an average, how much tax and levy have you paid for the previous two
years?
(a) For central government………………………………………
(b) For Lindi municipal …………………………………………
6. (a) Have you ever attended any training before loan in order to run properly your
business? Yes (……………………..), no (.........................................)
If yes, what the nature and duration of the training?
.........................................................................................................................................
.........................................................................................................................................
7. What was your average expenditure for your family members for the previous
two years before bank loan?
Income was not adequate to meet expenditure of social services of my
family members (education, medical care, insurance
services)..........................................)
Income was adequate to meet standard of living (........................................)
Standard of living was normal
(....................................................................................)
Section C: SMEs performance after bank loan (300)
1. What were your average
sales after receiving the bank loans from NMB? (Sales Per day) Between
16,000 to Tshs 70,000 (....................), Tshs 80,000 to 120,000(....................),
between Tshs 130,000 to 240,000(..................), Tshs 250,000 to
450,000(...........................), Tshs 500,000 and above (........................)

107
2. What was your average business profit after taking bank loan?
Profit was doubled (.............), Increase in profit from 3% to 10 %(..............), profit
was Satisfactory (..............),there was decrease in profit from 3% to 1% (.................)
3. How many number of employees have you employed after bank loan?
No employee employed (.................), one employee to two employees (...............),
three employees to four employees (.............), five employees to seven employees
(..............), more than eight employees.........................................................
4. What is your average investment after taking the bank loans?
Increase of investment was very good (..........), Increase of investment was
good (.............)
Satisfactory investment (.............), No increase in investment (...............)
5. What is your business contribution to the nation after bank loan?
I am contributing to social activities (................................)
I registered my business to relevant authorities and I am paying tax
(.................)
I contributing nothing (........................................................................)
6. What can you say the effect on your business after getting the training?
I am doing very well on my business (......................)
I am doing well on my business (......................)
No changes, I still doing as before training (..............)

108
7. What is your current average expenditure for your family members after bank
loan?
Income is adequate to meet expenditure of social services of my family
members (education, medical care, and insurance
services).......................................
Standard of living has improved (............................................................)
No changes in standard of living (.......................................................)
8. After taking bank loan and your business prosperity, what development have you
made so far?
I built modern family house (..................................................)
I have paid school fees/college to my children (.....................)
I bought family transport (.................)
I started/added another business (.........................)
Others (specify).....................................................................................................
9 (a) How much amount of the loan you have applied for the purpose of your
business
……………………………………………….....................................................
(b) From 9(a) above, how much actually you have received?
…………………………………………………………......................................
10. Was there any decrease of your business performance after the bank loan?
Yes........................................................
No..........................................................
If yes what was the cause of such decrease of business performance?

109
.........................................................................................................................................
.........................................................................................................................................
.........................................................................................................................................
11. What do you think can be the major challenges that can threaten your business
growth? (Assigning by numbers according to your priorities, assign number one to
the last. Number one being your priorities followed by two etc to the last number).
Stiff competition of similar business (.......................................)
High business operating costs (...................................................)
Difficult availability of the market/customer to my commodity (.............)
Creditors not paying me on time (..................................................)
Multiplicity of taxes both TRA and municipal (.........................)
12. How did your firm utilised the bank loans?
Acquisition of non-business assets (.............), settlement of other debts (............), to
increase working capital (................), sources of raw materials (..........................)
13. What challenges are you getting when requesting bank loans? (Assigning by
numbers according to your priorities, assign number one to the last. Number one
being your priorities followed by two etc to the last number).
Time of application till disbursement of the loan takes long time (.......................)
Less amounts given than anticipated/requested (.........................................................)
Requirements of Security such as collateral (..............................................................)
High interest rate on borrowing (..................................................................................)
Lack of knowledge on how to prepare business plan as per NMB requirement
(..............................................................)

110
Lack of technology to access the market (....................................................................)
A lot of procedures and bureaucracy (...........................................................................)
Short period to repay the full amount of the loan (....................................................)
14. Would you please comment on the effect of your business before and after
taking the bank loans?
…………………………………………………………………………………………
…………………………………………………………………………………………
…….................................................................................................................................
.........................................................................................................................................
.........................................................................................................................................
.........................................................................................................................................
.....................................................................................................................................
15. What is your advice to the financial Institutions and the government as a whole

111
PART II
Dear Respondent
My name is Adam M. Ntoga, I am pursuing Master of Science Degree programme
in Accounting and Finance (MSc A& F) at Mzumbe University. I am conducting
academic study on the effect of NMB Financing on the performance of Small and
Medium-sized Enterprises (SMEs) in Lindi municipal.‘ Will you please assist my
study by filling and answering all the questionnaires? I assure you that your answers
will be kept confidential and your names shall not be disclosed except for this study.
Please tick the appropriate answers or fill the space provided. Thank you in advance
for your assistance.
B: An interview guide to Banks, Professionals and Public:
1. Name of the Bank……………………………………………..............
Address of the Bank…………………………………………...............
Email address..............................................................................
2. Gender: Male ( ) Female ( )
3. Which of the following categories describe your age?
Below 20 years(……………), 21- 40 years(…………),41-60 years(………), 61-
80 years(…………), Above 80 years(……………).
4. What is your current position in the firm?
Branch manager (..................), Loan officer (...................)
Finance/branch accountant (............), Administrative officer (...................),
Customer service officer (.............),
Others (specify)………………………………………….................
5. How long have you been working with this Bank?

112
Less than 5 years (...................), 6 -10 years (................), 11- 15 years (..................)
16- 20 years (.......................), More than 20 years (...............................)
6. What are the criteria for a new customer to access to your bank?
………………………………………………………………………………………...
………………………………………………………………………………………...
………………………………………………………………………………………...
...……………………………………....................................................................
7. How many applications from SMEs have you received from years 2010 to 2011?
Year Number of
applications
received
Amount
applied by
SMEs
Amount
advanced to
SMEs
Amount
rejected
2010
2011
8. From seven (7) above what was the reasons for the rejection?
.......................................................................................................................................
.......................................................................................................................................
.......................................................................................................................................
.......................................................................................................................................
9. (a) What was the borrowing interest rate charged to your customers under the
period of this study?
Year 2010……………...., year 2011.............................
(b) ) What was the lending interest rate for charged to your customers under the
period of this study?
Year 2010(....................), year 2011(.......................)
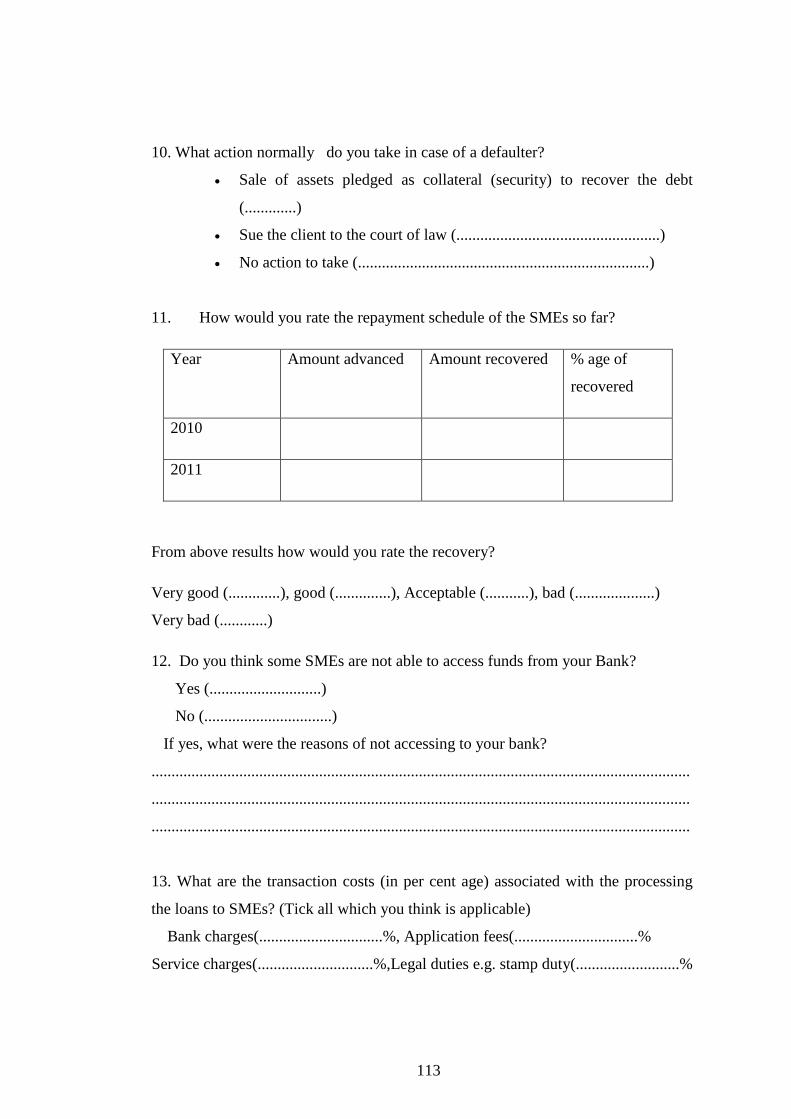
113
10. What action normally do you take in case of a defaulter?
Sale of assets pledged as collateral (security) to recover the debt
(.............)
Sue the client to the court of law (...................................................)
No action to take (.........................................................................)
11. How would you rate the repayment schedule of the SMEs so far?
Year Amount advanced Amount recovered % age of
recovered
2010
2011
From above results how would you rate the recovery?
Very good (.............), good (..............), Acceptable (...........), bad (....................)
Very bad (............)
12. Do you think some SMEs are not able to access funds from your Bank?
Yes (............................)
No (................................)
If yes, what were the reasons of not accessing to your bank?
.......................................................................................................................................
.......................................................................................................................................
.......................................................................................................................................
13. What are the transaction costs (in per cent age) associated with the processing
the loans to SMEs? (Tick all which you think is applicable)
Bank charges(...............................%, Application fees(...............................%
Service charges(.............................%,Legal duties e.g. stamp duty(..........................%

114
Document charges(..............................%, Risk premium....................................%
14. How many days does it take from the date of application to the date of
disbursements of the loan to the applicant?
.......................................................................................................................................
......................................................................................................................................
15. What difficulties you are facing with regard to issuance of loans to SMEs?
.......................................................................................................................................
.......................................................................................................................................
.......................................................................................................................................
.......................................................................................................................................
.......................................................................................................................................
.......................................................................................................................................
16. How many procedures normally do you have from an application to the
disbursement of the loan?
.........................................................................................................................................
.........................................................................................................................................
.........................................................................................................................................
.........................................................................................................................................
........................................................................................................................................

115
Appendix 2: Schedule of Activities
S/N Activity 2012 2013
M J J A S O N D J F M A M J J A S
1 Research concept note
2 Literatures review
3 Proposal write up
4 Proposal submission
5 Data collection rehearsal
6 Data collection
7 Data analysis
8 Report Writing
9 Study report submit
10 Defending dissertation
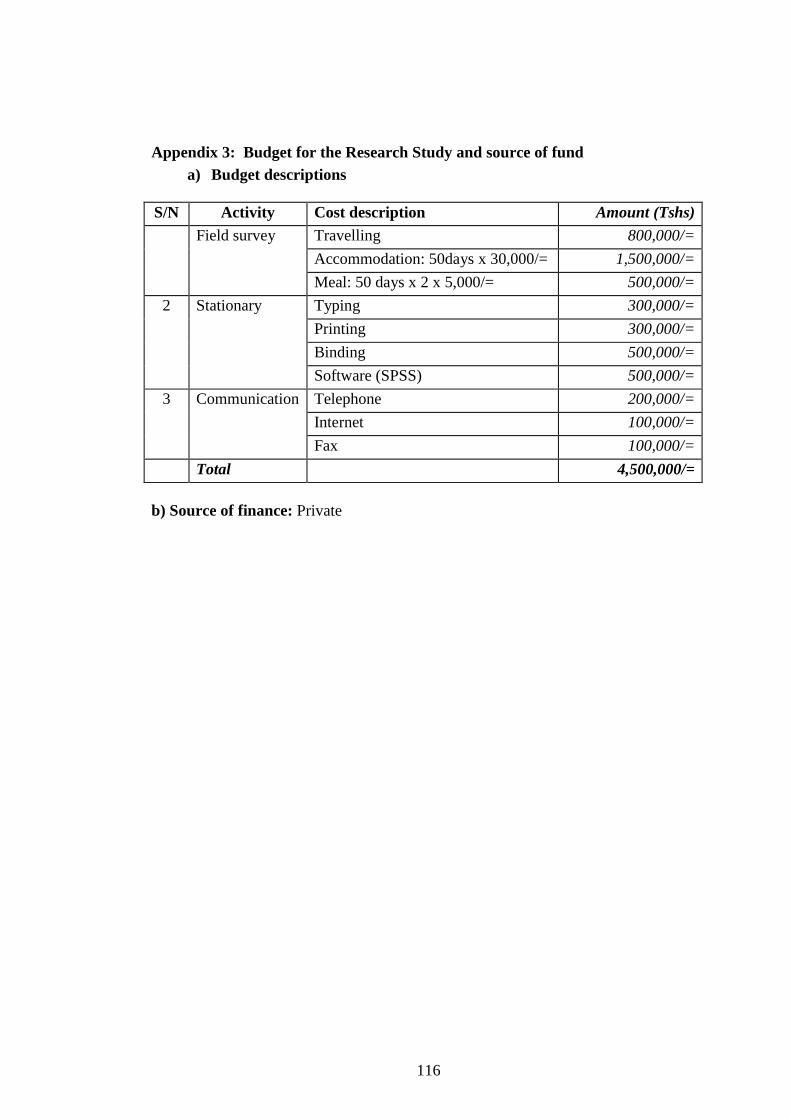
116
Appendix 3: Budget for the Research Study and source of fund
a) Budget descriptions
S/N Activity Cost description Amount (Tshs)
Field survey Travelling 800,000/=
Accommodation: 50days x 30,000/= 1,500,000/=
Meal: 50 days x 2 x 5,000/= 500,000/=
2 Stationary Typing 300,000/=
Printing 300,000/=
Binding 500,000/=
Software (SPSS) 500,000/=
3 Communication Telephone 200,000/=
Internet 100,000/=
Fax 100,000/=
Total 4,500,000/=
b) Source of finance: Private