the effect of microwave radiation on mineral processingetheses.bham.ac.uk/309/1/vorster01phd.pdf ·...
TRANSCRIPT
THE EFFECT OF MICROWAVE RADIATION ON MINERAL PROCESSING
by
Werner Vorster
A thesis submitted to
The University of Birmingham
for the degree of
Doctor of Philosophy
School of Chemical Engineering
The University of Birmingham
June 2001
University of Birmingham Research Archive
e-theses repository This unpublished thesis/dissertation is copyright of the author and/or third parties. The intellectual property rights of the author or third parties in respect of this work are as defined by The Copyright Designs and Patents Act 1988 or as modified by any successor legislation. Any use made of information contained in this thesis/dissertation must be in accordance with that legislation and must be properly acknowledged. Further distribution or reproduction in any format is prohibited without the permission of the copyright holder.
Synopsis
Between 50% and 70% of the total energy used in the extraction process may be attributed to
comminution. Microwave pre-treatment has been suggested as a means to decrease the energy
requirements. A variety of mineral ores have been investigated and the effects of microwave
radiation quantified in terms of the mineralogy, changes in the Bond Work Index, flotability and
magnetic separation. It has been shown that microwave pre-treatment is most effective for coarse
grained ores with consistent mineralogy consisting of good microwave absorbers in a transparent
gangue (up to a 90% decrease in Bond work index for Palabora copper ore) whereas fine grained
ores consisting predominantly of good absorbers are not affected as well (a reduction of only 25%
in work index for Mambula ore). Although the mineralogy of minerals are affected by exposure
to microwave radiation, flotability and magnetic separation characteristics have been shown not
to be adversely affected, unless the microstructure is completely destroyed after prolonged
microwave exposure. Computer simulations have shown that significant changes to comminution
circuits are possible as a result of microwave induced work index reductions (three mills reduced
to one). Purpose-built microwave units may hold the solution for more efficient mineral
extraction in the near future.
Dedication
In memory of Mrs AC Booysen
Acknowledgements
! I would like to take this opportunity to thank and acknowledge the Almighty God
for His support and help throughout my life and studies. Without Him and His
Presence, this thesis would not have been possible.
! Secondly I would like to thank my parents for always being there and the
opportunities they have given me.
! Dr NA Rowson for guidance and help through 3 years of studies.
! Rio Tinto Technical Services, specifically Dr Chris Cross, for their financial
support and assistance with sample preparation and mineralogical reports.
! Dr D Coertze for general assistance in the lay-out of the thesis.
Table of Contents
List of Figures . . . . . . . . . . . . . . . . . . . . . . . . . . . . . . . . . . . page i
List of Tables . . . . . . . . . . . . . . . . . . . . . . . . . . . . . . . . . . . . page vi
Nomenclature . . . . . . . . . . . . . . . . . . . . . . . . . . . . . . . . . . page viii
1) Introduction . . . . . . . . . . . . . . . . . . . . . . . . . . . . . . . page 1-1
1.1) Introduction . . . . . . . . . . . . . . . . . . . . . . . . . . . . . . . . . . . . page 1-1
1.1.1) Prologue . . . . . . . . . . . . . . . . . . . . . . . . . . . . . . . . . page 1-1
1.1.2) Present Mineral Processing Situation . . . . . . . . . . page 1-3
1.1.3) Problem Statement . . . . . . . . . . . . . . . . . . . . . . . . . page 1-6
1.2) Hypothesis and Objectives . . . . . . . . . . . . . . . . . . . . . . . . page 1-7
1.2.1) Introduction . . . . . . . . . . . . . . . . . . . . . . . . . . . . . . page 1-7
1.2.2) Objective . . . . . . . . . . . . . . . . . . . . . . . . . . . . . . . . . page 1-9
1.2.3) Hypotheses . . . . . . . . . . . . . . . . . . . . . . . . . . . . . . . page 1-9
1.3) The Importance of the Study . . . . . . . . . . . . . . . . . . . . . . . page 1-10
1.3.1) Benefits . . . . . . . . . . . . . . . . . . . . . . . . . . . . . . . . . . page 1-10
1.3.2) Feasibility . . . . . . . . . . . . . . . . . . . . . . . . . . . . . . . . page 1-10
1.4) Conceptual Clarification . . . . . . . . . . . . . . . . . . . . . . . . . . page 1-11
1.5) Ores used in this Research . . . . . . . . . . . . . . . . . . . . . . . . . page 1-12
2) Introduction to Microwave Heating Principles . . page 2-1
2.1) Introduction . . . . . . . . . . . . . . . . . . . . . . . . . . . . . . . . . . . . page 2-1
2.2) Microwave Generation . . . . . . . . . . . . . . . . . . . . . . . . . . . page 2-1
2.2.1) History . . . . . . . . . . . . . . . . . . . . . . . . . . . . . . . . . . page 2-1
2.2.2) Magnetrons . . . . . . . . . . . . . . . . . . . . . . . . . . . . . . page 2-3
2.2.3) Cavity Types . . . . . . . . . . . . . . . . . . . . . . . . . . . . . . page 2-6
2.2.4) Waveguides and Cavity Design . . . . . . . . . . . . . . . page 2-8
2.3) Mechanisms of Dielectric Heating . . . . . . . . . . . . . . . . . . page 2-10
2.4) Theoretical Aspects of Microwave Heating . . . . . . . . . . . page 2-12
2.5) Factors Affecting Dielectric Heating . . . . . . . . . . . . . . . . . page 2-16
2.5.1) Dielectric Permittivity . . . . . . . . . . . . . . . . . . . . . . page 2-17
2.5.2) Conductive Losses . . . . . . . . . . . . . . . . . . . . . . . . . page 2-17
2.5.3) Temperature and Frequency . . . . . . . . . . . . . . . . . page 2-18
2.5.4) Sample Geometry and Mineralogy . . . . . . . . . . . . page 2-18
2.5.5) Field Intensity . . . . . . . . . . . . . . . . . . . . . . . . . . . . page 2-19
2.5.6) Cavity Design . . . . . . . . . . . . . . . . . . . . . . . . . . . . . page 2-21
2.6) The Penetration Depth . . . . . . . . . . . . . . . . . . . . . . . . . . . . page 2-21
2.7) Electric Field Strength Calculations . . . . . . . . . . . . . . . . . page 2-22
2.8) Determination of Dielectric Constants
and Loss Factors . . . . . . . . . . . . . . . . . . . . . . . . . . . . . . . . page 2-25
2.9) Microwave Safety Considerations . . . . . . . . . . . . . . . . . . . page 2-26
3) Comminution and Thermally
Assisted Liberation . . . . . . . . . . . . . . . . . . . . . . . . . page 3-1
3.1) Introduction . . . . . . . . . . . . . . . . . . . . . . . . . . . . . . . . . . . . page 3-1
3.2) Comminution . . . . . . . . . . . . . . . . . . . . . . . . . . . . . . . . . . . page 3-4
3.2.1) Principles of Comminution . . . . . . . . . . . . . . . . . . page 3-4
3.2.2) Calculation of Mill Power Requirements . . . . . . . . page 3-5
3.2.3) Estimation of the Work Index . . . . . . . . . . . . . . . . . page 3-7
3.2.4) Alternative Methods . . . . . . . . . . . . . . . . . . . . . . . . page 3-10
3.2.5) Common Values of the Bond Work Index . . . . . . . page 3-12
3.2.6) Alternative Methods to Quantify Rock Strength . . . page 3-12
3.3) Thermally Assisted Liberation . . . . . . . . . . . . . . . . . . . . . page 3-20
3.3.1) Introduction . . . . . . . . . . . . . . . . . . . . . . . . . . . . . . page 3-20
3.3.2) Literature Review of T.A.L on Mineral Species . . . page 3-21
3.3.3) Microwave Assisted T.A.L. . . . . . . . . . . . . . . . . . . . page 3-24
4) Applications of Microwaves in the
Mineral Industry . . . . . . . . . . . . . . . . . . . . . . . . . . . page 4-1
4.1) History of Industrial, Scientific, Medical and Domestic
Applications of Microwave Power . . . . . . . . . . . . . . . . . . page 4-1
4.2) Application of Microwaves in the Minerals Industry . . . . page 4-3
4.2.1) The Effects of Microwave Radiation on
Metal Oxides and Sulphides . . . . . . . . . . . . . . . . . . page 4-4
4.2.2) Effects of Microwave Radiation on Coal . . . . . . . . page 4-8
4.2.3) Effects of Microwave Radiation on
Gold Processing . . . . . . . . . . . . . . . . . . . . . . . . . . . page 4-9
4.2.4) Effects of Microwave Radiation on
Iron Production . . . . . . . . . . . . . . . . . . . . . . . . . . . page 4-10
4.3) Parameters Affecting Microwave Radiation . . . . . . . . . . . page 4-11
4.3.1) The Effect of Particle Size . . . . . . . . . . . . . . . . . . . page 4-11
4.3.2) The Effect of Microwave Power . . . . . . . . . . . . . . . page 4-12
4.4) Patents in the Mineral Processing Field
Utilising Microwave Technology . . . . . . . . . . . . . . . . . . . page 4-14
4.4.1) Microwave Treatment of Metal Bearing
Ores and Concentrates . . . . . . . . . . . . . . . . . . . . . page 4-14
4.4.2) Apparatus and Method for Processing of
Dielectric Materials with Microwave Energy . . . . page 4-15
4.4.3) Process for the Recovery of Copper
from its Ores . . . . . . . . . . . . . . . . . . . . . . . . . . . . . page 4-15
5) Microwave Treatment of Neves Corvo Ore . . . . . page 5-1
5.1) Introduction . . . . . . . . . . . . . . . . . . . . . . . . . . . . . . . . . . . . page 5-1
5.2) Processing of Somincor Copper Ore . . . . . . . . . . . . . . . . . page 5-3
5.3) MC and MCZ Ore Mineralogy . . . . . . . . . . . . . . . . . . . . . page 5-4
5.3.1) Mineralogy of the MC Ore . . . . . . . . . . . . . . . . . . . page 5-5
5.3.2) Mineralogy of the MC Ore . . . . . . . . . . . . . . . . . . page 5-8
5.4) Experimental Procedure . . . . . . . . . . . . . . . . . . . . . . . . . . page 5-12
5.4.1) Investigation into the Effect of Microwave Radiation
On Mineralogy . . . . . . . . . . . . . . . . . . . . . . . . . . . . page 5-12
5.4.2) Effect of Microwave Radiation on Grindability . . . page 5-12
5.4.3) Effect of Microwave Radiation on Flotation . . . . . page 5-14
5.5) Results and Discussion . . . . . . . . . . . . . . . . . . . . . . . . . . . page 5-16
5.5.1) Effect of Microwave Radiation on Mineralogy . . . page 5-16
5.5.2) Effect of Microwave Radiation on Grindability . . . page 5-22
5.5.3) Effect of Microwave Radiation on Flotation . . . . . page 5-28
5.6) Discussion and Conclusion . . . . . . . . . . . . . . . . . . . . . . . . page 5-31
6) Effect of Microwave Radiation on Mambula Ore . page 6-1
6.1) Introduction . . . . . . . . . . . . . . . . . . . . . . . . . . . . . . . . . . . page 6-1
6.2) Mineralogy . . . . . . . . . . . . . . . . . . . . . . . . . . . . . . . . . . . . page 6-2
6.3) Experimental Procedure . . . . . . . . . . . . . . . . . . . . . . . . . . page 6-7
6.3.1) Effect of Microwave Radiation On Mineralogy . . . page 6-7
6.3.2) Effect of Microwave Radiation on Grindability . . . page 6-7
6.3.3) Effect of Microwave Radiation on Magnetic
Susceptibility . . . . . . . . . . . . . . . . . . . . . . . . . . . . . page 6-8
6.4) Results and Discussion . . . . . . . . . . . . . . . . . . . . . . . . . . . page 6-9
6.4.1) Effect of Microwave Radiation On Mineralogy . . . page 6-9
6.4.2) Effect of Microwave Radiation on Grindability . . . page 6-10
6.4.3) Effect of Microwave Radiation on Magnetic
Susceptibility . . . . . . . . . . . . . . . . . . . . . . . . . . . . . page 6-13
6.5) Conclusion . . . . . . . . . . . . . . . . . . . . . . . . . . . . . . . . . . . . . page 6-15
7) Application of Microwave Radiation for the
Exfoliation of Vermiculite . . . . . . . . . . . . . . . . . . . . page 7-1
7.1) Introduction . . . . . . . . . . . . . . . . . . . . . . . . . . . . . . . . . . . . page 7-1
7.2) Mining Operation at Palabora . . . . . . . . . . . . . . . . . . . . . . page 7-4

7.3) Uses of Vermiculite . . . . . . . . . . . . . . . . . . . . . . . . . . . . . . page 7-6
7.4) Physical Properties of Vermiculite . . . . . . . . . . . . . . . . . . page 7-6
7.5) Previous Work and Theory . . . . . . . . . . . . . . . . . . . . . . . . page 7-8
7.6) Experimental Procedure . . . . . . . . . . . . . . . . . . . . . . . . . . page 7-9
7.6.1) Exfoliation Trials . . . . . . . . . . . . . . . . . . . . . . . . . . page 7-9
7.6.2) Effect of MW Radiation on Vermiculite Structure . page 7-10
7.6.3) Economic Evaluation . . . . . . . . . . . . . . . . . . . . . . . page 7-10
7.7) Results and Discussion . . . . . . . . . . . . . . . . . . . . . . . . . . . page 7-11
7.7.1) Exfoliation Trials . . . . . . . . . . . . . . . . . . . . . . . . . . page 7-11
7.7.2) Effect of MW Radiation on Vermiculite Structure . page 7-15
7.7.3) Economic Evaluation . . . . . . . . . . . . . . . . . . . . . . . page 7-16
7.8) Conclusion . . . . . . . . . . . . . . . . . . . . . . . . . . . . . . . . . . . . . page 7-18
8) Effect of Microwave Radiation on Palabora Ore . page 8-1
8.1) Introduction . . . . . . . . . . . . . . . . . . . . . . . . . . . . . . . . . . . . page 8-1
8.2) Processing of Palabora Copper Ore . . . . . . . . . . . . . . . . . page 8-2
8.3) Mineralogy of Palabora Copper Ore . . . . . . . . . . . . . . . . . page 8-5
8.4) Experimental Procedure . . . . . . . . . . . . . . . . . . . . . . . . . . page 8-9
8.4.1) Effect of Microwave Radiation on Mineralogy . . . page 8-9
8.4.2) Effect of Microwave Radiation on Grindability . . . page 8-9
8.4.3) Effect of microwave Radiation on Flotability
and Magnetic Separation . . . . . . . . . . . . . . . . . . . . page 8-15
8.4.4) Alternative methods for the determination
of rock strength . . . . . . . . . . . . . . . . . . . . . . . . . . . page 8-16
8.5) Results and Discussion . . . . . . . . . . . . . . . . . . . . . . . . . . . page 8-19
8.5.1) Effect of Microwave Radiation on Mineralogy . . . page 8-19
8.5.2) Effect of Microwave Radiation on Grindability . . . page 8-23
8.5.3) Effect of microwave Radiation on Flotability
and Magnetic Separation . . . . . . . . . . . . . . . . . . . . page 8-38
8.5.4) Use of the drop weight rig to quantify
rock strength . . . . . . . . . . . . . . . . . . . . . . . . . . . . . page 8-42
8.6) Conclusion . . . . . . . . . . . . . . . . . . . . . . . . . . . . . . . . . . . . . page 8-45
9) Economic Implications of Microwave
Pretreatment of Minerals . . . . . . . . . . . . . . . . . . . . . . . . . page 9-1
9.1) Introduction . . . . . . . . . . . . . . . . . . . . . . . . . . . . . . . . . . . . page 9-1
9.2) USIMPAC Simulations . . . . . . . . . . . . . . . . . . . . . . . . . . . page 9-2
9.2.1) Neves Corvo Flowsheet Simulation . . . . . . . . . . . . page 9-2
9.2.2) Palabora Flowsheet Simulation . . . . . . . . . . . . . . . page 9-5
9.3) Discussion and Conclusion . . . . . . . . . . . . . . . . . . . . . . . . page 9-7
10) Conclusion and Further Work . . . . . . . . . . . . . . . . . . . . page 10-1
10.1) Conclusion . . . . . . . . . . . . . . . . . . . . . . . . . . . . . . . . . . . . . page 10-1
10.1.1) Grindability . . . . . . . . . . . . . . . . . . . . . . . . . . . . . . page 10-1
10.1.2) Flotation . . . . . . . . . . . . . . . . . . . . . . . . . . . . . . . . page 10-2
10.1.3) Magnetic Susceptibility . . . . . . . . . . . . . . . . . . . . . page 10-3
10.1.4) Vermiculite Exfoliation . . . . . . . . . . . . . . . . . . . . . page 10-3
10.1.5) Cavity Effects . . . . . . . . . . . . . . . . . . . . . . . . . . . . page 10-4
10.1.6) Flowsheet Simulation . . . . . . . . . . . . . . . . . . . . . . page 10-6
10.2) Further Work . . . . . . . . . . . . . . . . . . . . . . . . . . . . . . . . . . . page 10-6
10.2.1) Dielectric Property Calculations and Modelling . page 10-6
10.2.2) Scale-up . . . . . . . . . . . . . . . . . . . . . . . . . . . . . . . . page 10-8
10.2.3) Other Work . . . . . . . . . . . . . . . . . . . . . . . . . . . . . . page 10-9
Personal Communications . . . . . . . . . . . . . . . . . . . . . . . . . . R-1
References . . . . . . . . . . . . . . . . . . . . . . . . . . . . . . . . . . . . . . . R-2
Bibliography . . . . . . . . . . . . . . . . . . . . . . . . . . . . . . . . . . . . . R-11
Papers :
1) The effect of microwave radiation on the processing
Of Palabora copper ore . . . . . . . . . . . . . . . . . . . . . . . . . . P-1
2) The effect of microwave radiation on the processing of
Neves Corvo copper ore . . . . . . . . . . . . . . . . . . . . . . . . . . P-2
3) The effect of mineralogy on microwave assisted grinding P-3
4) Applications of microwave radiation for the
processing of minerals . . . . . . . . . . . . . . . . . . . . . . . . . . . P-4
5) The use of the three point bend test to quantify
the effects of thermal pre-treatment on rock strength . . . . P-5
6) An alternative method for the exfoliation of vermiculite . P-6
Appendices on CD :
Appendix A - Somincor Trials
Appendix B : Mambula Trials
Appendix C : Vermiculite Trials
Appendix D : Palabora Trials
Appendix E : Simulation Results
-i-
List of Figures
Figure 1.1 : Schematic representation of an interlocked mineral . . . page 1-2
Figure 2.1: Dr Spencer’s patent for a microwave oven . . . . . . . . . . page 2-2
Figure 2.2 : Photograph of a Hitachi 3891 magnetron and a diagram
of the internal sections . . . . . . . . . . . . . . . . . . . . . . . . . . page 2-4
Figure 2.3 : Motion of the electrons within a magnetron . . . . . . . . . page 2-5
Figure 2.4 : An electromagnetic wave travelling through a waveguide page 2-6
Figure 2.5 : Diagram of a multimode cavity . . . . . . . . . . . . . . . . . . . page 2-7
Figure 2.6 : Diagram of monomode cavity . . . . . . . . . . . . . . . . . . . . page 2-7
Figure 2.7 : Rieke diagram for a typical domestic magnetron . . . . . . page 2-9
Figure 2.8 : Diagram of aligned dipoles in an electric field . . . . . . . page 2-11
Figure 2.9 : Diagram showing the amplitude of the microwave
decreasing as it penetrates a material . . . . . . . . . . . . . . . page 2-22
Figure 3.1 : Intergranular and transgranular cracks . . . . . . . . . . . . . . page 3-3
Figure 3.2 : Comparison between the heating rate of a good receptor (pyrite)
and microwave transparent quartz . . . . . . . . . . . . . . . . . page 3-24
Figure 4.1 : Histogram showing the percentage change in surface
area for various minerals after 300 s microwave radiation
at 650 W (Harrison PC and Rowson NA, 1996b) . . . . . page 4-6
Figure 4.2 : Histogram showing the percentage decrease in work index for
various minerals after 300 s microwave radiation
at 650 W (Harrison PC and Rowson NA, 1996b) . . . . . page 4-7
Figure 5.1 : Schematic representation of the Somincor flowsheer . . page 5-3
Figure 5.2: False coloured backscattered SEM images of untreated
MC material . . . . . . . . . . . . . . . . . . . . . . . . . . . . . . . . . . page 5-7
-ii-
Figure 5.3 : False coloured back scattered SEM images of untreated
MCZ material . . . . . . . . . . . . . . . . . . . . . . . . . . . . . . . . page 5-11
Figure 5.4: False coloured backscattered SEM images of treated
MC ore . . . . . . . . . . . . . . . . . . . . . . . . . . . . . . . . . . . . . . page 5-18
Figure 5.5 : False coloured backscattered SEM images of treated
MCZ ore. . . . . . . . . . . . . . . . . . . . . . . . . . . . . . . . . . . . . page 5-21
Figure 5.6 : Difference in particle size distribution after milling between samples
exposed to microwave radiation (S5 & S7) and reference
samples (S6 & S8). . . . . . . . . . . . . . . . . . . . . . . . . . . . . . page 5-24
Figure 5.7 : Work index vs microwave exposure time for MC ore . . page 5-25
Figure 5.8 : Work index vs microwave exposure time for MCZ ore showing
the effect of quenching on work index reduction . . . . . . page 5-25
Figure 5.9 : Work index vs microwave exposure time for MCZ ore showing
the effect of loading during microwave exposure on work
index reduction . . . . . . . . . . . . . . . . . . . . . . . . . . . . . . . page 5-27
Figure 5.10 : Percentage copper recovery versus flotation
time for MC material . . . . . . . . . . . . . . . . . . . . . . . . . . . page 5-29
Figure 5.11 : Percentage copper recovery versus flotation
time for MCZ material. . . . . . . . . . . . . . . . . . . . . . . . . . page 5-29
Figure 6.1 : A digitised scanned image of particles from S1 (top) and S2 (bottom).
S2 exhibits a darker, more metallic grey colour as well as a greater
degree of oxidation than S1. . . . . . . . . . . . . . . . . . . . . . . page 6-3
Figure 6.2 : SEM image of untreated Mambula ore . . . . . . . . . . . . . page 6-6
Figure 6.3 : SEM image of microwave products . . . . . . . . . . . . . . . . page 6-10
Figure 6.4 : Effect of microwave radiation on work index after different
milling times (ball mill) . . . . . . . . . . . . . . . . . . . . . . . . . page 6-11
Figure 6.5 : Bar chart showing the recovery of iron of the
different samples . . . . . . . . . . . . . . . . . . . . . . . . . . . . . . page 6-13
Figure 6.6 : Bar chart showing the recovery of titanium of the
different samples . . . . . . . . . . . . . . . . . . . . . . . . . . . . . . page 6-14
-iii-
Figure 7.1 : Unexpanded vermiculite “book” with some exfoliated
“books” shown on the right. . . . . . . . . . . . . . . . . . . . . . page 7-2
Figure 7.2 : 350× magnification of a single book illustrating the
layers comprising a “book” . . . . . . . . . . . . . . . . . . . . . . page 7-3
Figure 7.3 : Plot of volume to mass ratio versus energy to mass ratio
for coarse grained vermiculite exfoliated at 2.6 kW . . . page 7-14
Figure 7.4 : Shown above are two scanning electron microscope images of a
microwave exfoliated large grade vermiculite booklet (200×) on the left
and compared to a thermally exfoliated large grade vermiculite
booklet (350×) on the right. . . . . . . . . . . . . . . . . . . . . . . page 7-15
Figure 8.1 : Dimensions of the Open Cast Copper mine in the Palabora
Igneous Complex (Public Relations Department Palabora
Mining Company Ltd, 1998) . . . . . . . . . . . . . . . . . . . . . page 8-1
Figure 8.2 : Geology of the Open Pit at 122 m (External Affairs
Department of Rio Tinto South Africa Ltd, 1985) . . . . . page 8-2
Figure 8.3 : Schematic process flowsheet of the Palabora Mining
Company (Public Relations Department Palabora
Mining Company Ltd, 1998) . . . . . . . . . . . . . . . . . . . . . page 8-3
Figure 8.4 : Schematic representation of the processes
in the concentrator at PMC . . . . . . . . . . . . . . . . . . . . . . . page 8-4
Figure 8.5 : False coloured backscattered electron images of
untreated ore . . . . . . . . . . . . . . . . . . . . . . . . . . . . . . . . . . page 8-8
Figure 8.6 : Photograph showing the pilot scale 6.6 kW microwave
unit used for the pilot scale studies . . . . . . . . . . . . . . . . page 8-10
Figure 8.7 : Schematic of the microwave cavity, indicating
dimensions . . . . . . . . . . . . . . . . . . . . . . . . . . . . . . . . . . . page 8-11
Figure 8.8 : Pilot scale rod mill used for pilot scale milling trials . . . page 8-12
Figure 8.9 : Diagram showing the division of the 2.6 kW microwave
into different areas . . . . . . . . . . . . . . . . . . . . . . . . . . . . . page 8-14
Figure 8.10 : Schematic of the three point bend test . . . . . . . . . . . . . . page 8-16
-iv-
Figure 8.11 : Schematic of the drop weight test rig . . . . . . . . . . . . . . . page 8-17
Figure 8.12 : False coloured backscattered electron images of
untreated ore . . . . . . . . . . . . . . . . . . . . . . . . . . . . . . . . . . page 8-22
Figure 8.13 : Reduction in work index achieved in different
microwave units changes with time . . . . . . . . . . . . . . . . page 8-23
Figure 8.14 : Diagram comparing the reduction in work index in the 6.6 kW
unit with previous results (after Kingman SW, 2000). . . page 8-24
Figure 8.15 : Plot of %passing 300µm for treated and untreated
Palabora ore . . . . . . . . . . . . . . . . . . . . . . . . . . . . . . . . . . page 8-25
Figure 8.16 : Graph showing the size distribution for various mill throughputs
(in kg/hr) . . . . . . . . . . . . . . . . . . . . . . . . . . . . . . . . . . . . . page 8-26
Figure 8.17 : No significant change in 80% passing size of the
treated ore . . . . . . . . . . . . . . . . . . . . . . . . . . . . . . . . . . . page 8-27
Figure 8.18 : Change in mass loading on the available power for work
index reduction for the initial semi continuous trials . . . page 8-29
Figure 8.19 : Graph showing less reduction in work index for progressively
smaller particles . . . . . . . . . . . . . . . . . . . . . . . . . . . . . . . page 8-30
Figure 8.20: Fraction of work index vs milling time on different
areas . . . . . . . . . . . . . . . . . . . . . . . . . . . . . . . . . . . . . . . . page 8-31
Figure 8.21 : Copper content of Palabora ore . . . . . . . . . . . . . . . . . . . page 8-33
Figure 8.22 : A plot of 80% passing size versus milling time for references (unexposed)
and microwave irradiated ore for magnetic and non magnetic fractions
of the ore . . . . . . . . . . . . . . . . . . . . . . . . . . . . . . . . . . . . . page 8-34
Figure 8.23 : Plot of relative work done versus microwave
exposure time . . . . . . . . . . . . . . . . . . . . . . . . . . . . . . . . . page 8-37
Figure 8.24 : Effect of microwave radiation on copper recovery . . . . . page 8-39
Figure 8.25 : Effect of microwave radiation on copper recovery . . . . . page 8-40
Figure 8.26 : Effect of different power level microwave radiation
on recovery of ferrous Fe . . . . . . . . . . . . . . . . . . . . . . . . page 8-41
-v-
Figure 8.27 : Plot of t10 vs Ecs for different size fractions . . . . . . . . . page 8-42
Figure 9.1 : Layout of the comminution circuit at Somincor . . . . . . . page 9-2
Figure 9.2 : Plot of circulation load vs work index for the closed
circuit ball mill . . . . . . . . . . . . . . . . . . . . . . . . . . . . . . . . page 9-3
Figure 9.3 : Plot of 100% passing size of the product stream from the closed
circuit section versus work index . . . . . . . . . . . . . . . . . . page 9-4
Figure 9.4 : Simplified flowsheet of the conventional milling circuit
at Palabora . . . . . . . . . . . . . . . . . . . . . . . . . . . . . . . . . . . page 9-5
Figure 9.5 : Plot of work index versus circulating load . . . . . . . . . . page 9-6
-vi-
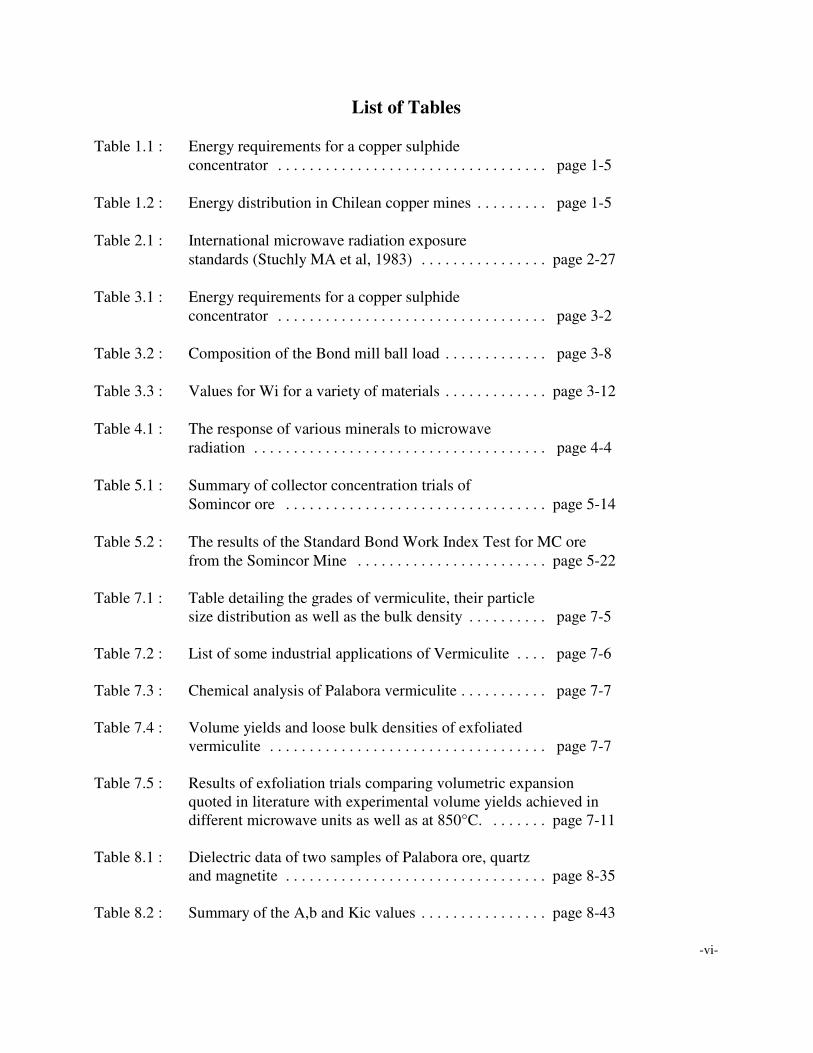
List of Tables
Table 1.1 : Energy requirements for a copper sulphide
concentrator . . . . . . . . . . . . . . . . . . . . . . . . . . . . . . . . . . page 1-5
Table 1.2 : Energy distribution in Chilean copper mines . . . . . . . . . page 1-5
Table 2.1 : International microwave radiation exposure
standards (Stuchly MA et al, 1983) . . . . . . . . . . . . . . . . page 2-27
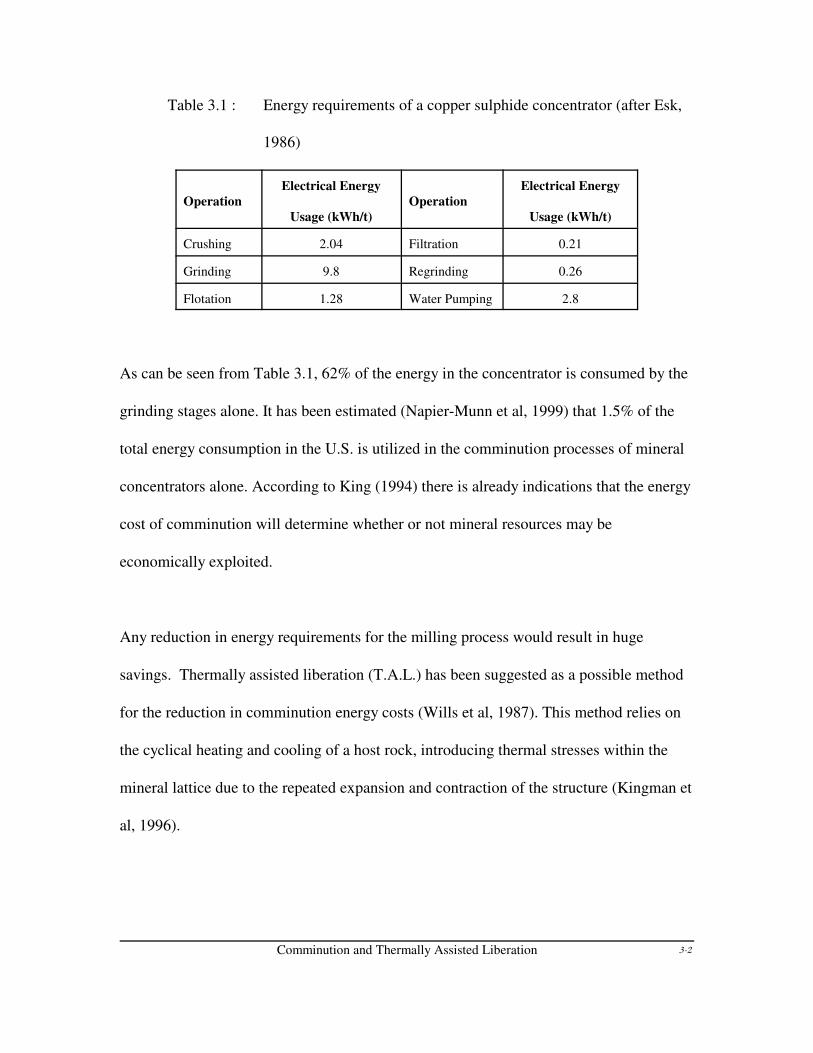
Table 3.1 : Energy requirements for a copper sulphide
concentrator . . . . . . . . . . . . . . . . . . . . . . . . . . . . . . . . . . page 3-2
Table 3.2 : Composition of the Bond mill ball load . . . . . . . . . . . . . page 3-8
Table 3.3 : Values for Wi for a variety of materials . . . . . . . . . . . . . page 3-12
Table 4.1 : The response of various minerals to microwave
radiation . . . . . . . . . . . . . . . . . . . . . . . . . . . . . . . . . . . . . page 4-4
Table 5.1 : Summary of collector concentration trials of
Somincor ore . . . . . . . . . . . . . . . . . . . . . . . . . . . . . . . . . page 5-14
Table 5.2 : The results of the Standard Bond Work Index Test for MC ore
from the Somincor Mine . . . . . . . . . . . . . . . . . . . . . . . . page 5-22
Table 7.1 : Table detailing the grades of vermiculite, their particle
size distribution as well as the bulk density . . . . . . . . . . page 7-5
Table 7.2 : List of some industrial applications of Vermiculite . . . . page 7-6
Table 7.3 : Chemical analysis of Palabora vermiculite . . . . . . . . . . . page 7-7
Table 7.4 : Volume yields and loose bulk densities of exfoliated
vermiculite . . . . . . . . . . . . . . . . . . . . . . . . . . . . . . . . . . . page 7-7
Table 7.5 : Results of exfoliation trials comparing volumetric expansion
quoted in literature with experimental volume yields achieved in
different microwave units as well as at 850°C. . . . . . . . page 7-11
Table 8.1 : Dielectric data of two samples of Palabora ore, quartz
and magnetite . . . . . . . . . . . . . . . . . . . . . . . . . . . . . . . . . page 8-35
Table 8.2 : Summary of the A,b and Kic values . . . . . . . . . . . . . . . . page 8-43
-vii-
Table 9.1 : Energy requirements of a copper sulphide concentrator page 9-1

-viii-
NOMENCLATURE
A ore breakage parameter
As sample area, m2
b ore breakage parameter
c denotes the speed of light
Cp is the specific heat capacity in
Cs fraction of critical mill speed
D’ mill diameter in ft
average size of particles, m
e emmisivity of the material
E is the root mean square intensity of the external electric field in
E0 is the root mean square intensity of the external electric field in
Ei is the root mean square intensity of the electric field inside the mineral in
Ecs is the specific comminution energy, kWh/t
f0 is the resonant frequency, Hz
f denotes the frequency in Hz
fc is the crushing strength, N
-ix-
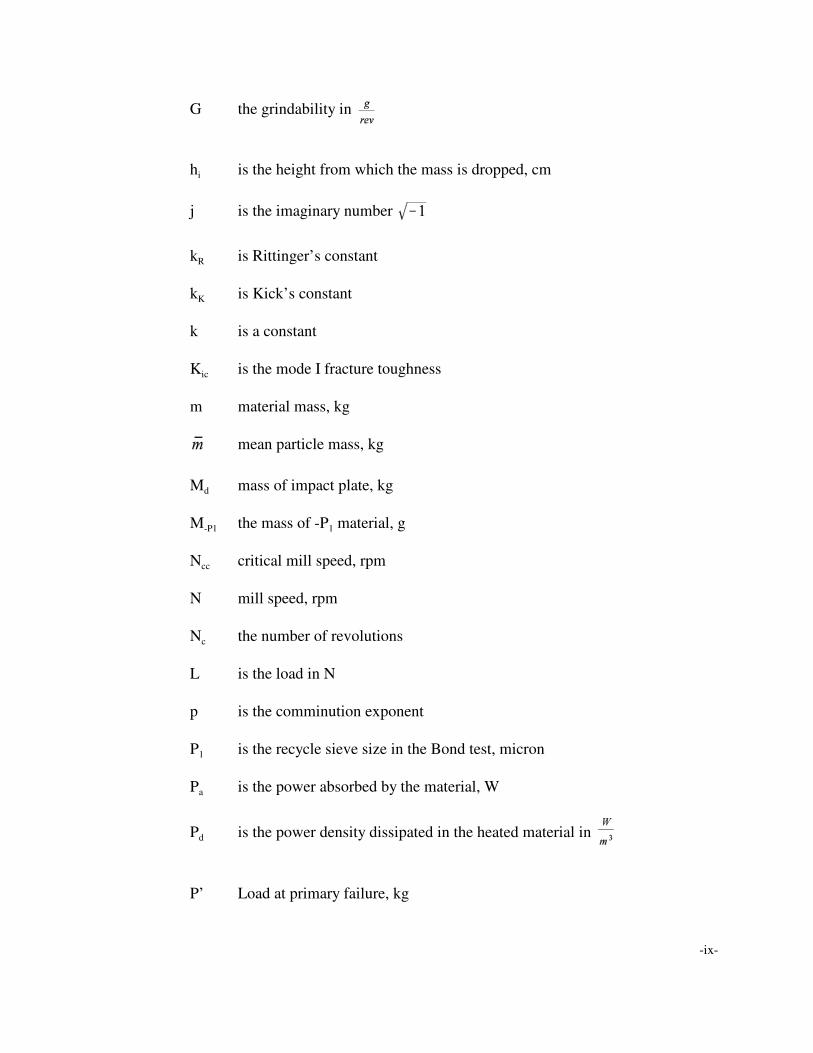
G the grindability in
hi is the height from which the mass is dropped, cm
j is the imaginary number
kR is Rittinger’s constant
kK is Kick’s constant
k is a constant
Kic is the mode I fracture toughness
m material mass, kg
mean particle mass, kg
Md mass of impact plate, kg
M-P1 the mass of -P1 material, g
Ncc critical mill speed, rpm
N mill speed, rpm
Nc the number of revolutions
L is the load in N
p is the comminution exponent
P1 is the recycle sieve size in the Bond test, micron
Pa is the power absorbed by the material, W
Pd is the power density dissipated in the heated material in
P’ Load at primary failure, kg
-x-
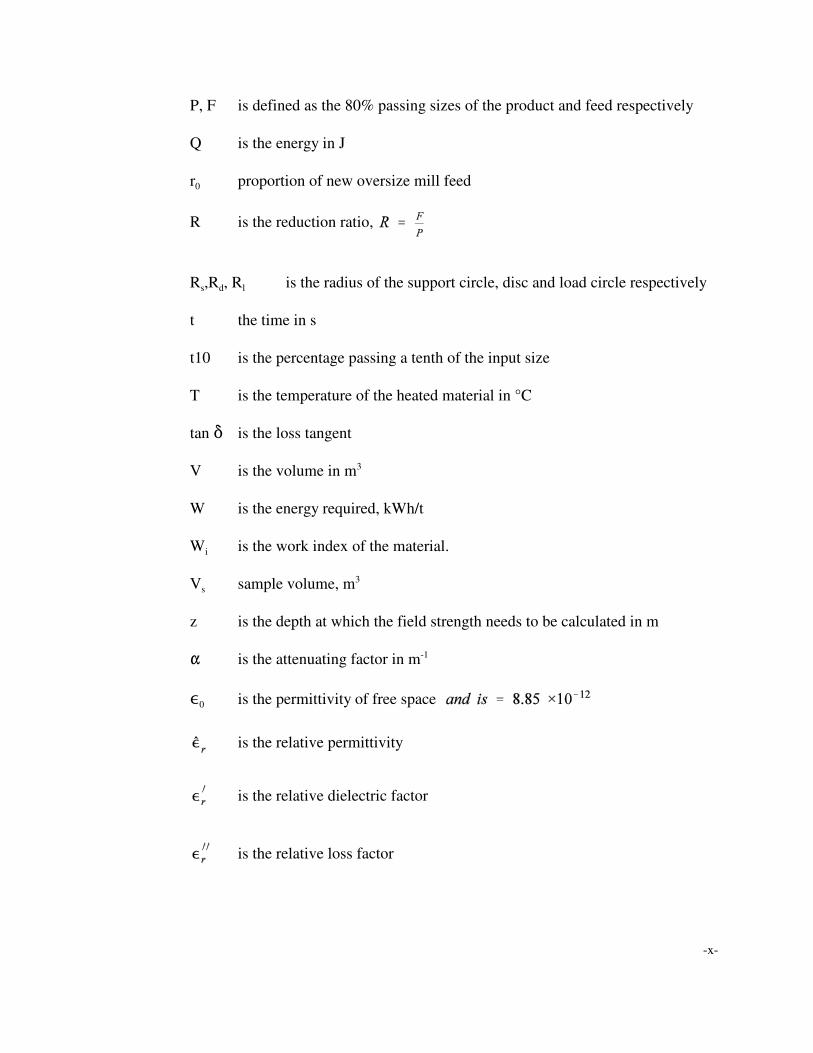
P, F is defined as the 80% passing sizes of the product and feed respectively
Q is the energy in J
r0 proportion of new oversize mill feed
R is the reduction ratio,
Rs,Rd, Rl is the radius of the support circle, disc and load circle respectively
t the time in s
t10 is the percentage passing a tenth of the input size
T is the temperature of the heated material in °C
tan * is the loss tangent
V is the volume in m3
W is the energy required, kWh/t
Wi is the work index of the material.
Vs sample volume, m3
z is the depth at which the field strength needs to be calculated in m
" is the attenuating factor in m-1
,0 is the permittivity of free space
is the relative permittivity
is the relative dielectric factor
is the relative loss factor
-xi-
is the complex permittivity in
Is the effective permittivity,
,’ is the real part of the complex permittivity and is called the dielectric or
dispersion factor in
,” is the imaginary part of the complex permittivity and is called the loss
factor in
8 denotes the wavelength in m
D is the density of the material in
*X denotes a change in property X
< Poison’s ratio
F equivalent conductivity, S/m
Fsb Stefan-Bolzman constant,
Fr is the stress in the radial direction, MPa
J is the thickness in m
o is the angular frequency
Subscripts
r,t refers to the reference and test ores respectively
Introduction 1-1
CHAPTER 1
INTRODUCTION
1.1) Introduction
1.1.1) Prologue
Engineering may be defined as "the science by which the properties of matter and the sources of
power in nature are made useful to humans in structure, devices, machines and products" (New
York Public Library, 1995). This is especially well illustrated in the field of minerals engineering.
Man is dependent on his environment for survival. Our environment supplies us with the basic
requirements for life (oxygen, water, food and clothes) as well as the luxuries of civilization
(computers, electricity and microwave ovens).
In contrast with the basic requirements, which, to a reasonable extent, are unchanged by human
intervention (i.e. oxygen and water), the luxury items follow a longer route before ending up in
our homes. Most of these materials have to be mined and undergo extensive physical and
chemical modification before they are utilized. As an example, an everyday commodity, steel, is
made from iron, which in turn is extracted from iron ore (magnetite/hematite) which requires
huge mining operations to extract it from the earth's crust in the quantities required by the earth’s
growing population. In addition, modern technology requires steel with vastly superior
characteristics than would have been satisfactory a few short decades, or even years, ago.

Introduction 1-2
Valuable minerals do not, as a rule, occur freely in nature, but are frequently locked away within
gangue particles. As an example, gold (yellow Figure 1.1) usually occurs in extremely low
concentrations in nature and are finely dispersed within the host rock (mostly gangue) as is
shown in the scanning electron micrograph (Fig 1.1).
Figure 1.1: Scanning electron micrograph showing a gold particle (yellow) interlocked in gangue
Introduction 1-3
The mineral processing industry is responsible for the production and supply of the raw materials
in sufficient quantity and grade required for further processing. In order to accomplish this, the
valuable mineral needs to be effectively and efficiently separated from the gangue material before
it can be processed further.
1.1.2) Present Mineral Processing Situation
The dramatic increase of industrialization since the 18th century, has caused an exponential rise in
metal demand - in particular for the base metals. Copper and aluminium output have increased by
a factor of 250 and 900 respectively (Wills, 1997). As a result, most metal reserves will be
depleted in approximately 50 or 60 years. Therefore, ever decreasing grades of ores have to be
mined to satisfy the needs of the more than six billion people on earth (Cable News Network,
1999). This affects the cost of mineral extraction - causing many mining ventures to become
uneconomical.
Furthermore, a closer look at the mineral processing industry reveals that vast amounts of
valuable material is wasted daily, because of physical and chemical constraints preventing the
complete separation of values from gangue.
A typical mineral beneficiation circuit (or concentrator) would reduce the particle size
distribution of the primary crusher product by comminution. The comminution circuit is usually
followed by a flotation circuit before smelting (other processes such as magnetic or dense media
separation and leaching may also be used).
Introduction 1-4
As an example of the sheer scale of mining operations and the subsequent minerals engineering
processes required for the extraction of the valuable metals from ore, some facts from the
Palabora Mining Company (the largest producer of copper in South Africa) are given. The mine
is an open pit (underground mining operations are due to start in 2002), the dimensions of the
approximately ellipsoidal pit being 1800m ×1400m with a current depth (1999/2000) of around
650m. Around 80000 tonnes of copper ore are extracted daily, containing less than 0.5% of
copper, yielding 113 200 tonnes of refined copper in 1997. The flotation stage in the concentrator
consists of more than 900 flotation cells (PMC, 1998).
In general, comminution is extremely important as it is the main step where liberation of the
valuable mineral from the gangue would occur. It would be of no use to attempt to separate the
valuable mineral from the gangue using only flotation (as is shown in Fig 1.1). The valuable
mineral needs to be liberated from the gangue first. This is accomplished by the comminution
process - consisting of a series of open and closed circuit mills and screens. However,
comminution is energy intensive, with typically only 1% of the energy input available for
breakage. This results in energy requirements between 50% and 70% of the total energy used in
the extraction process (Wills, 1992).
To illustrate Esk (1986) compared the electrical energy requirements of various stages in a
Chilean copper concentrator:
Introduction 1-5
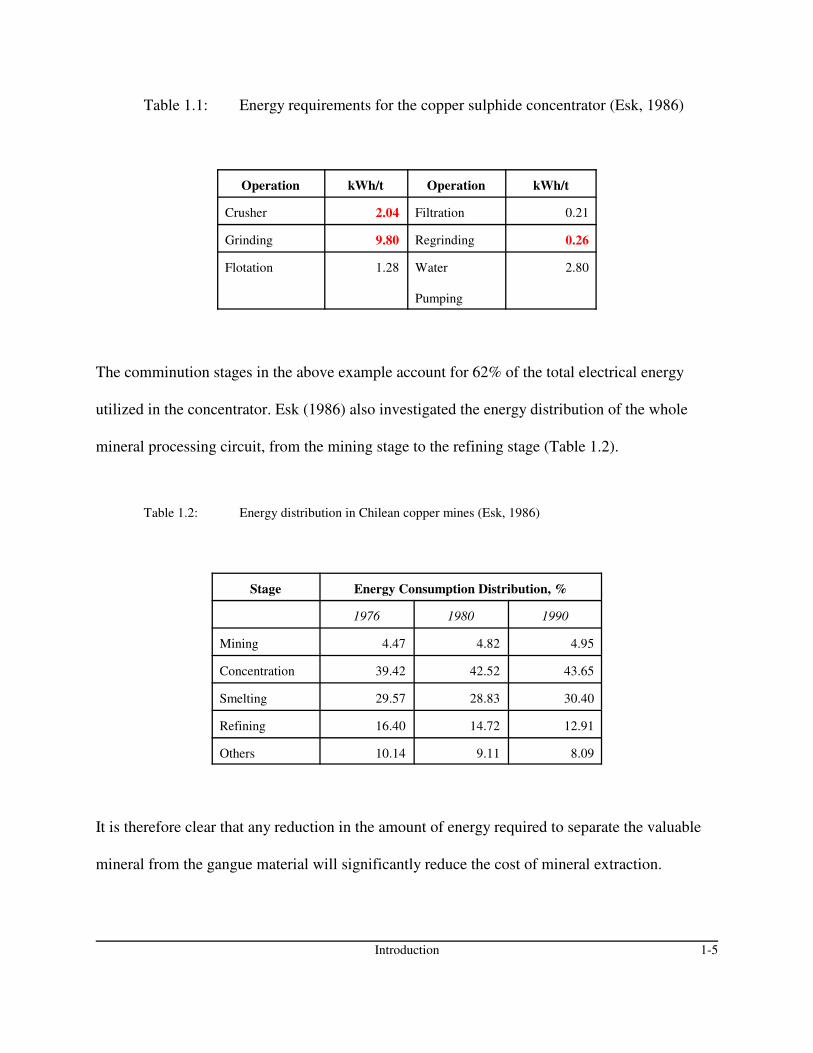
Table 1.1: Energy requirements for the copper sulphide concentrator (Esk, 1986)
Operation kWh/t Operation kWh/t
Crusher 2.04 Filtration 0.21
Grinding 9.80 Regrinding 0.26
Flotation 1.28 Water
Pumping
2.80
The comminution stages in the above example account for 62% of the total electrical energy
utilized in the concentrator. Esk (1986) also investigated the energy distribution of the whole
mineral processing circuit, from the mining stage to the refining stage (Table 1.2).
Table 1.2: Energy distribution in Chilean copper mines (Esk, 1986)
Stage Energy Consumption Distribution, %
1976 1980 1990
Mining 4.47 4.82 4.95
Concentration 39.42 42.52 43.65
Smelting 29.57 28.83 30.40
Refining 16.40 14.72 12.91
Others 10.14 9.11 8.09
It is therefore clear that any reduction in the amount of energy required to separate the valuable
mineral from the gangue material will significantly reduce the cost of mineral extraction.

Introduction 1-6
The Bond Work Index of an ore defines the theoretical amount of energy required to break the
rock from an infinite size down to 100% passing 100µm. Typically the Bond Work Index ranges
between 10 kWh.t-1 and 20 kWh.-1. Reducing the work index by 50% would theoretically reduce
the amount of energy required in the comminution circuit by 50% and, again theoretically,
double the throughput of the comminution circuit (Wills, 1997). However, although processes
are available to lower the work index of ores, electrical, radioactive and ultrasonic techniques as
well as thermally assisted liberation (Veasey and Wills, 1986), these methods themselves require
energy, always in excess of that by which the work index has been lowered - making these
processes economically unfeasible.
1.1.3) Problem Statement
In the preceding section the main problems with the current mineral processing situation have
been discussed:
• High energy consumption of comminution equipment
• Low efficiency of comminution equipment
• Limited reserves and ever decreasing ore grades
• Limited liberation of valuable minerals and subsequent waste of valuable material
The practical implications if these problems are not addressed are that mineral processing circuits
continue to operate inefficiently and that large quantities of valuable mineral are lost to the waste
stream.

Introduction 1-7
If these problems are solved, however, then huge economic savings is possible. This will enable
higher plant throughout, production rates and subsequent increases in revenue.
The limiting factor in the investigation is of an economic nature. Procedures investigated in the
past, although effective in decreasing energy cost of comminution circuits and increases in
mineral liberation, have always been uneconomical themselves - requiring energy input in excess
of the savings made possible.
1.2) Hypothesis and Objectives
1.2.1) Introduction
Table 1.1 shows that the three-stage comminution process, crushing, grinding and regrinding,
contribute to 62% of the total concentrator energy consumption. If the grinding process may be
altered such that valuable minerals are liberated more effectively and with 50% less energy
required, then the total energy requirements will decrease from 16.39 kWh.t-1 to 6.33 kWh.t-1.
Thus, the total contribution of the grinding circuit is only 44%.
Introduction 1-8
Thermally assisted liberation has been suggested as a means towards reducing costs and
increasing efficiency of process of separating the minerals from the gangue material. This
method relies on the cyclical heating and cooling of a host rock, introducing thermal stresses
within the mineral lattice due to the repeated expansion and contraction of the structure (Wills
1987, Tavares and King, 1995). This results in intergranular and intragranular fractures which
increases the ore’s grindability and decreases both the amount of energy required and the
percentage of minerals in the wasted gangue material (Walkiewicz, 1993). In addition to
increases in ore grindability, the following claims have also been made (Wills, 1987; Tavares and
King, 1995; Walkiewicz, 1993):
• increased mineral liberation
• reduction in fines in downstream processes
• reduced plant wear is reduced.
The technique proposed in this thesis is a modification of the thermally assisted liberation
technique. Instead of using conventional methods to heat the ore, the dielectric properties of the
mineral constituents of the ore will be utilised and heating will be by microwave radiation
(dielectric heating is further explained in Chapter 2). This allows for extremely short treatment
times (as some of the minerals have extremely quick response times), thermally shocking the
mineral ore (first by heating and subsequent quenching), producing fractures inside the mineral
structure, thereby lowering the amount of grinding energy (Chapter 3). The application of
microwave radiation has found a niche in speciality applications in a wide range of industries (as
is shown in Chapter 4). Previous work illustrated that microwave thermally assisted liberation
has the potential to achieve a reduction in work index of up to 90% (on laboratory scale).
Introduction 1-9
1.2.2) Objective
The purpose of this investigation is to evaluate the viability of microwave energy in the
comminution process with reference to the cost of mineral processing, efficiency of mineral
extraction and downstream processing in order to optimise the mineral extraction process.
1.2.3) Hypotheses
Hypothesis One
If the application of microwave energy can be optimised then the energy requirements in the
comminution circuit will be reduced sufficiently to reduce the cost of mineral processing.
Hypothesis Two
It is hypothesised that if an optimum amount of energy can increase the efficiency of mineral
extraction, then the mineral content in the wasted gangue material will be reduced.
Hypothesis Three
If an optimum amount of microwave energy is applied to the grinding process to reduce the total
energy consumption of the process, then the downstream processes in the concentrator will not
be adversely affected.
Introduction 1-10
1.3) The Importance of the Study
1.3.1) Benefits
This study is concerned with the thermal effects if microwave radiation on minerals, in a
modification of thermally assisted liberation. From literature (Walkiewicz, 1991) the benefits of
thermally assisted liberation may be summarized as:
• increases in grindability (i.e. reductions in energy consumption)
• reductions in the amount of fines (i.e. more efficient downstream processing)
• increases in mineral liberation (i.e. higher recovery)
• reductions in plant wear (i.e. lower operating cost).
1.3.2) Feasibility
Large scale microwave heaters may be adequate for drying purposes as they have been
specifically designed for the dielectric properties for water, but the dielectric properties of
minerals differ vastly from that of water. Industrial scale microwave equipment is available that
will produce about 75kW in continuous operation. For mineral processing plants such as copper
concentrators, many generators would be required and the capital cost of such a system will
undoubtedly be significant. It will be vital that energy input to the system be minimized.
Introduction 1-11
The comminution circuit is merely the first in a series of processes aimed at separating the
valuable material from the gangue. Flotation, magnetic separation and leaching are some of the
processes that may be employed after the comminution stage in the concentrator. In order for the
proposed microwave treatment of the ore to be technologically and economically viable, these
downstream processes must be either unaffected or affected favourably.
1.4) Conceptual Clarification
Microwave effects have become a highly controversial issue in recent years (Rybakov and
Semenov, 1999). The nature of the energy sources is the main difference between so-called
conventional processes and microwave processes.
Conventional processes rely on conduction, convection and radiation to heat materials. In
contrast, dielectric (or microwave) heating relies on molecular vibration to heat materials from
the inside (due to internal friction). Microwave effects should therefore denote only those
deviations between conventional and MW processes under exact temperature conditions
(Rybakov and Semenov, 1999). However, this study is mainly concerned with the thermal effects
of microwaves on minerals.
Introduction 1-12
1.5) Ores Tested in this Research Work
Five different materials have been tested during this research project. These are :
S Mambula ore from Richards Bay in South Africa
S Massive copper ore from Neves Corvo (Somincor) in Portugal
S Massive copper-zinc from Neves Corvo (Somincor) in Portugal
S Vermiculite from Palabora in South Africa
S Copper ore from Palabora in South Africa
Rio Tinto sponsored this research project - therefore all the ores were tested on their request. A
query was received by Rio Tinto regarding the magnetic susceptibility of Mambula ore and
whether or not microwave radiation will have a beneficial effect upon it. The Neves Corvo
material as well as the Palabora material (copper ores) were investigated as part of ongoing
research at the University of Birmingham (following on from the work of Dr Kingman). The
vermiculite test work started off as a laboratory demonstration (the material was received from
Mandoval - the distributors of Palabora vermiculite in the UK) and work continued regarding the
alternative method for exfoliation of vermiculite.
The majority of the work consisted of trying to optimise and scale-up treatment of Palabora
copper ore. It is of little use to investigate the entire downstream process after microwave
radiation if the comminution section is largely unaffected (as this will be the major cost reduction
stage). Therefore, most of the work on Palabora material focussed on optimising the reduction in
work index (thereafter the downstream processes can be further investigated).
Introduction to Microwave Heating Principles 2-1
CHAPTER 2
INTRODUCTION TO MICROWAVE HEATING PRINCIPLES
2.1) Introduction
Microwaves is the name for electromagnetic waves arising as radiation from electrical
disturbances at high frequencies. Chablinsky (1989) suggested that microwave power is
THE technology of the future - with economical benefits including energy conservation
and reduced processing time as well as being more environmentally acceptable.
Although this might be an overly optimistic view of the benefits of microwave energy,
microwave technology is used successfully in a number of applications including the food
and telecommunications industry. After the second world war (during which microwaves
were first used for radar applications) intensive research into the application of
microwaves in domestic and industrial appliances started (Osepchuk, 1984).
2.2) Microwave Generation
2.2.1) History
In 1888 Hertz produced the first generated microwave radiation with frequencies of up to
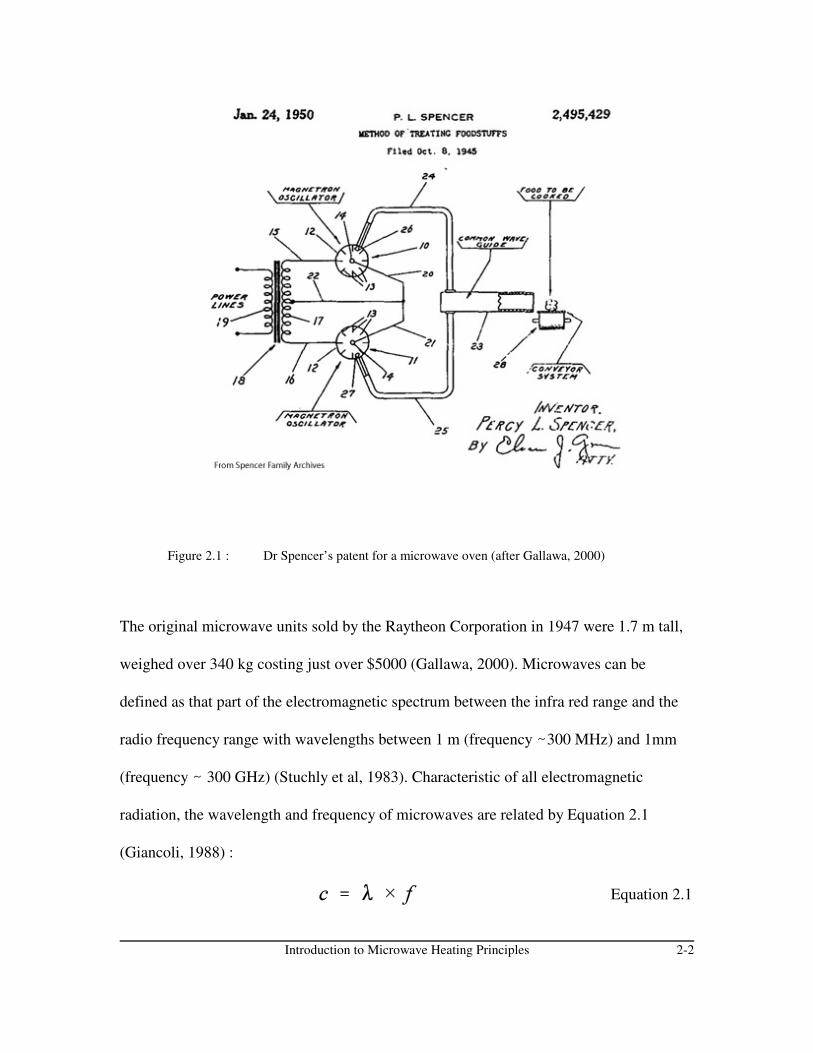
500 MHz by oscillatory spark discharges. In 1946, Dr P Spencer, with the Raytheon
Corporation experimented with a vacuum tube called a magnetron and noticed a candy
bar in his pocket had melted. This led to the first microwave oven patent (Fig 2.1).
Introduction to Microwave Heating Principles 2-2
Equation 2.1
Figure 2.1 : Dr Spencer’s patent for a microwave oven (after Gallawa, 2000)
The original microwave units sold by the Raytheon Corporation in 1947 were 1.7 m tall,
weighed over 340 kg costing just over $5000 (Gallawa, 2000). Microwaves can be
defined as that part of the electromagnetic spectrum between the infra red range and the
radio frequency range with wavelengths between 1 m (frequency -300 MHz) and 1mm
(frequency - 300 GHz) (Stuchly et al, 1983). Characteristic of all electromagnetic
radiation, the wavelength and frequency of microwaves are related by Equation 2.1
(Giancoli, 1988) :
Introduction to Microwave Heating Principles 2-3
Where : c denotes the speed of light, 3 × 10⁸ m.s-1
8 denotes the wavelength, m
f denotes the frequency, Hz
Currently microwaves are generated using a variety of different devices including
magnetrons, klystrons, cystrons and other solid state devices (Rowson, 1986; Cober
Electronics, 1998; Ishii, 1995). As the microwave units used for experimentation in this
work used only magnetrons, these are the only devices discussed in more detail.
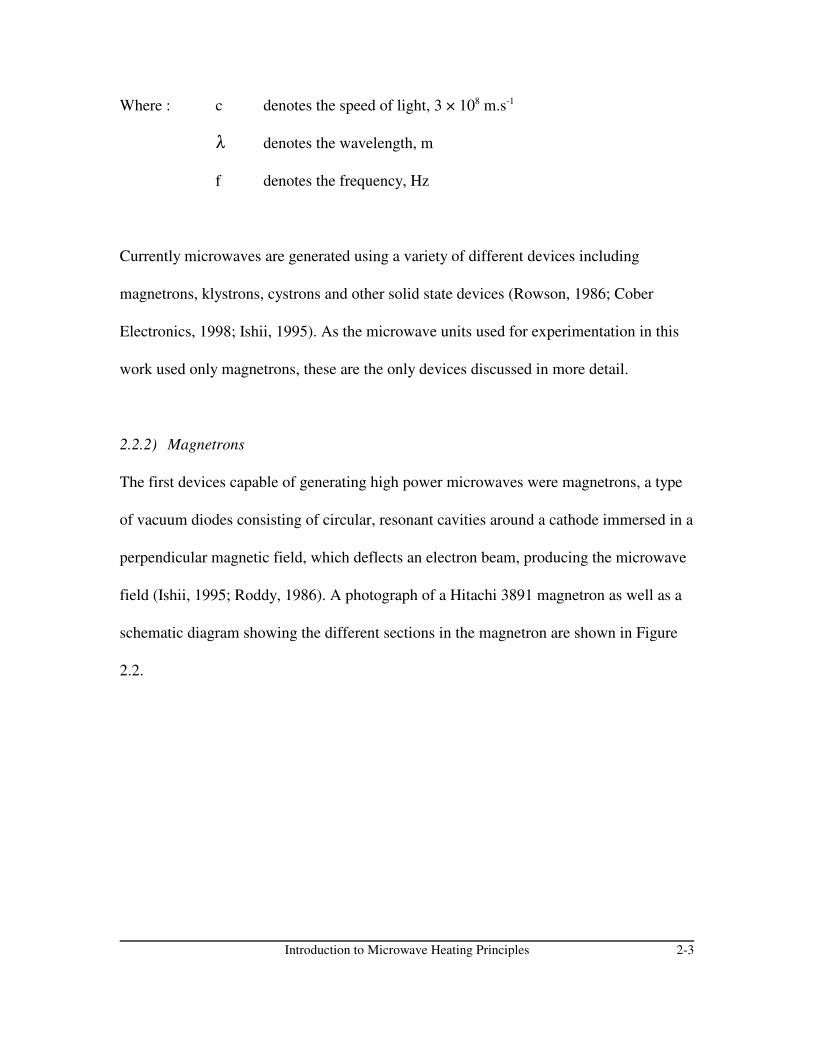
2.2.2) Magnetrons
The first devices capable of generating high power microwaves were magnetrons, a type
of vacuum diodes consisting of circular, resonant cavities around a cathode immersed in a
perpendicular magnetic field, which deflects an electron beam, producing the microwave
field (Ishii, 1995; Roddy, 1986). A photograph of a Hitachi 3891 magnetron as well as a
schematic diagram showing the different sections in the magnetron are shown in Figure
2.2.
Introduction to Microwave Heating Principles 2-4
Figure 2.2 : Photograph of a Hitachi 3891 magnetron (water cooled) as well as a diagram
showing the different sections within the magnetron.
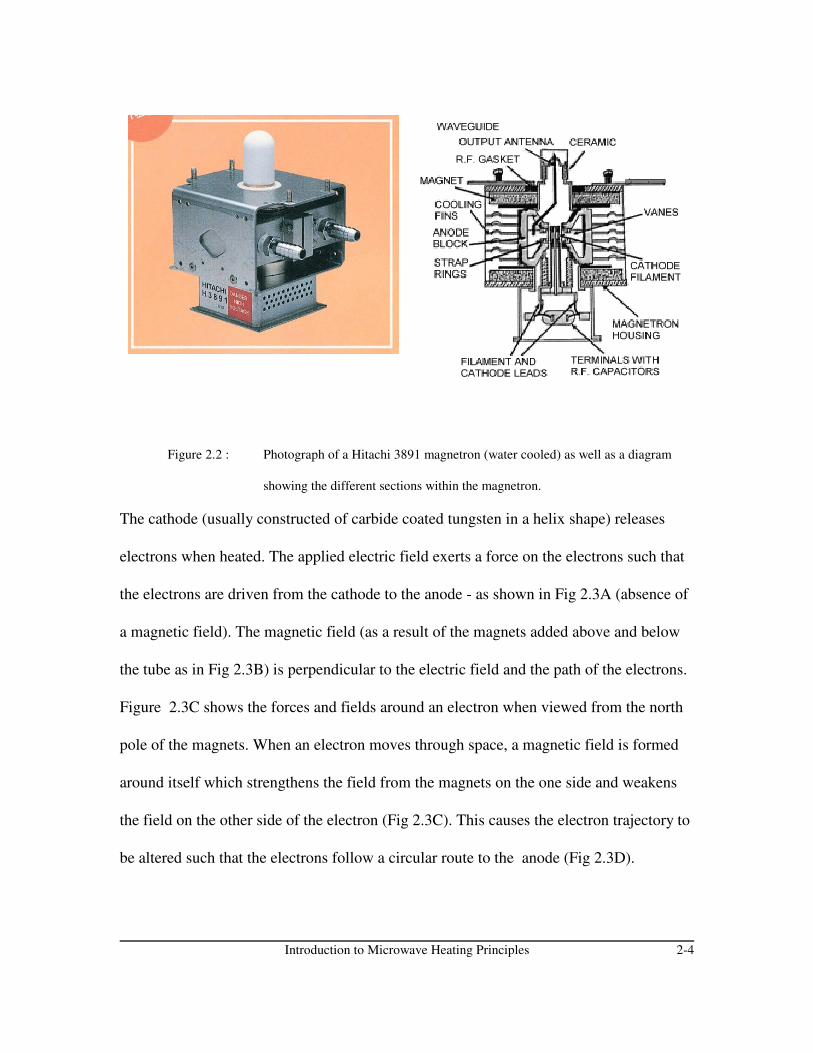
The cathode (usually constructed of carbide coated tungsten in a helix shape) releases
electrons when heated. The applied electric field exerts a force on the electrons such that
the electrons are driven from the cathode to the anode - as shown in Fig 2.3A (absence of
a magnetic field). The magnetic field (as a result of the magnets added above and below
the tube as in Fig 2.3B) is perpendicular to the electric field and the path of the electrons.
Figure 2.3C shows the forces and fields around an electron when viewed from the north
pole of the magnets. When an electron moves through space, a magnetic field is formed
around itself which strengthens the field from the magnets on the one side and weakens
the field on the other side of the electron (Fig 2.3C). This causes the electron trajectory to
be altered such that the electrons follow a circular route to the anode (Fig 2.3D).
Introduction to Microwave Heating Principles 2-5
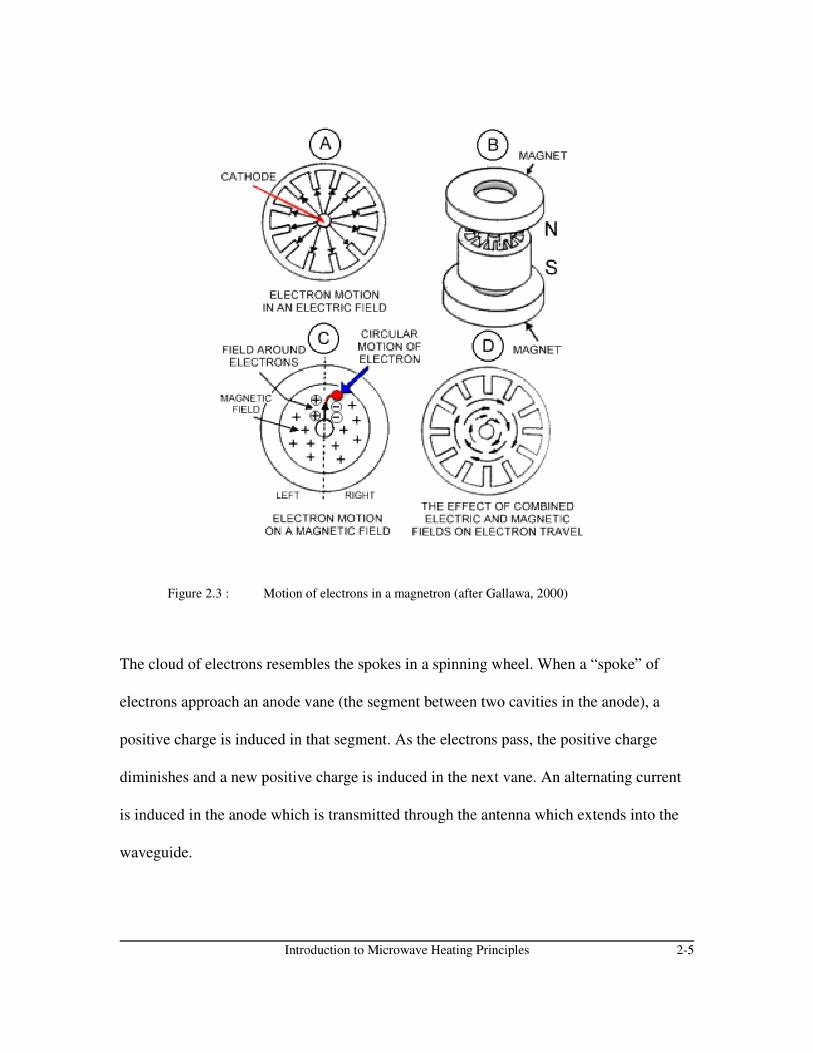
Figure 2.3 : Motion of electrons in a magnetron (after Gallawa, 2000)
The cloud of electrons resembles the spokes in a spinning wheel. When a “spoke” of
electrons approach an anode vane (the segment between two cavities in the anode), a
positive charge is induced in that segment. As the electrons pass, the positive charge
diminishes and a new positive charge is induced in the next vane. An alternating current
is induced in the anode which is transmitted through the antenna which extends into the
waveguide.

Introduction to Microwave Heating Principles 2-6
The induced current is responsible for the generation of an electromagnetic field, which
propagates through a waveguide as a sinusoidal wave, to an applicator (metallic
enclosures containing the materials to be exposed to microwave radiation) (Cober
Electronics, 1998; Bradshaw et al, 1998; Gallawa, 2000).
Figure 2.4 : The electromagnetic wave travelling through the wave guide (Gallawa, 2000)
2.2.3) Cavity Types
The first of two types of applicators is a multimode cavity, used in most domestic
microwave ovens. In this type of oven the microwaves are typically scattered using a
mode stirrer and heating uniformity is ensured by placing the load on a turntable.

Introduction to Microwave Heating Principles 2-7
Magnetron Waveguide Sample
magnetron
turntable
waveguide stirrer
microwaves
In the second type, a monomode cavity, the microwaves are “focussed” on the load -
allowing for much faster heating rates (Cober Electronics, 1998, Personal
Communication : Dr Kingman, 1998).A diagram of a multimode microwave oven is
shown in Figure 2.5 :
Figure 2.5 : A diagram of a multimode microwave heater
A diagram of a monomode microwave oven is shown in Figure 2.3 :
Figure 2.6 : A diagram of a monomode microwave heater
The power output of a magnetron can be adjusted in several ways. These include, pulsing
the power output (the most common method), adjusting the anode current, changing the
magnetic field and attenuating the microwave energy.
Introduction to Microwave Heating Principles 2-8
The last method does not affect the magnetron at all, but are purely mechanical in nature
(it attenuates the microwave energy between the magnetron and load) and is very
expensive (Ishii, 1995).
2.2.4) Waveguides and Cavity design
The life of the magnetron is dependent on the design of the microwave cavity to optimise
the load impedance to the magnetron. Microwaves may be directed along waveguides or
co-axial cables, in a similar way as water through a pipe. Waveguides are often preferred
as they are capable of transmitting higher powers. Waveguides are metallic tubes, either
circular or rectangular in cross section, the dimensions determines the frequency of the
microwaves. The microwaves propagate through the waveguide, in the form of a
sinusoidal wave, until it reaches the load. If the load absorbs the wave completely, then
there is no reflection of the wave back down the waveguide. This only occurs when if the
resistive load and the source load have equal impedance, and is called a matched load
(Ishii, 1995).
In the case of unequal load and source impedances, absorption of the radiation is
incomplete and the wave is reflected. The reflected load combines with the transmitted
wave, resulting in a standing wave. The ratio of the maximum and minimum amplitudes
is called the voltage standing wave ratio (VSWR). A high VSWR means that a significant
amount of energy is reflected (the magnetron may be damaged), thus it is important to
calculate the VSWR of any load during the design phase (Ishii, 1995).
Introduction to Microwave Heating Principles 2-9
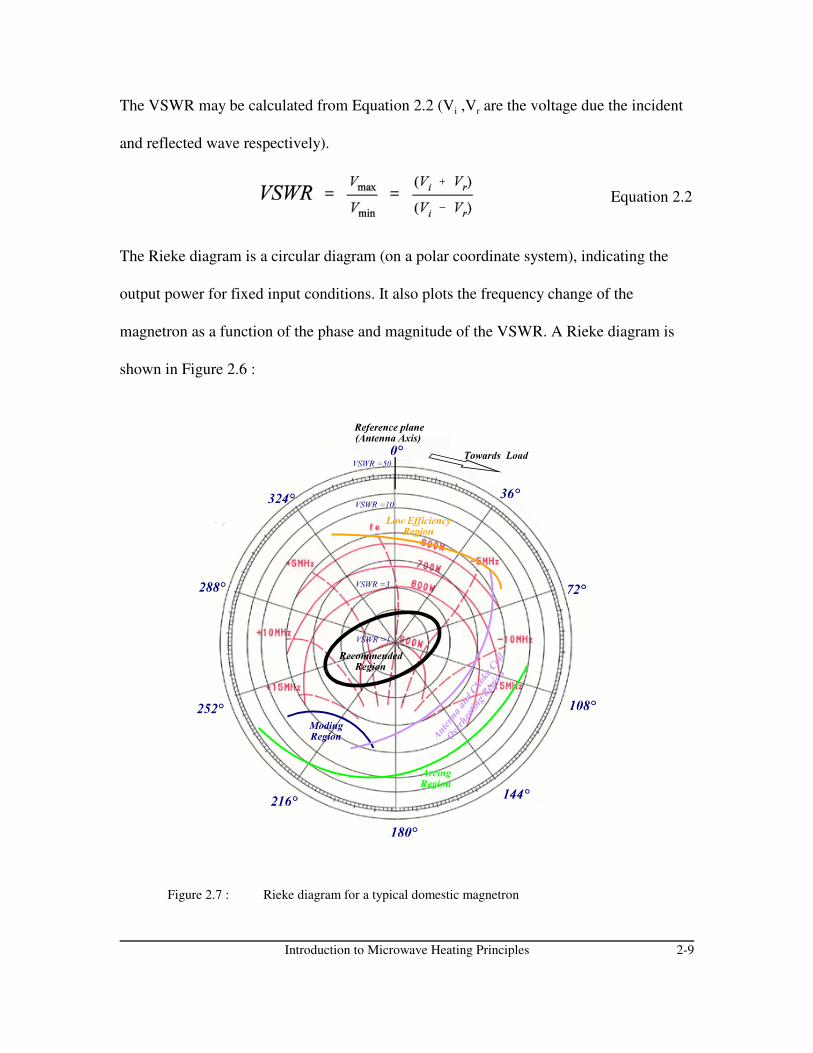
Equation 2.2
The VSWR may be calculated from Equation 2.2 (Vi ,Vr are the voltage due the incident
and reflected wave respectively).
The Rieke diagram is a circular diagram (on a polar coordinate system), indicating the
output power for fixed input conditions. It also plots the frequency change of the
magnetron as a function of the phase and magnitude of the VSWR. A Rieke diagram is
shown in Figure 2.6 :
Figure 2.7 : Rieke diagram for a typical domestic magnetron
Introduction to Microwave Heating Principles 2-10
Sometimes recommended operating regions as well as several restricted regions (such the
moding, arcing and overheating regions) are indicated on the Rieke diagram..The moding
region is the place where moding may occur if the impedance loci are in the region and if
the length of the waveguide for the connecting magnetron to the cavity is short (Ishii,
1995). The arcing region is the region where arcing may occur around the antenna of the
magnetron is the load impedance loci are in the region. The arc may occur between the
antenna and the inside wall of the waveguide.
The antenna and choke coil parts may be overheated if the impedance loci are in the
overheating region. Even if the loci are only near the region, the antenna and choke coil
may be considerably overheated. If the magnetron is operated for extended time periods
in the low-efficiency region, the output power will be low and the magnetron will
overheat. It is recommended that the impedance loci under the load conditions of normal
use are in the recommended region, as the highest efficiency and stable oscillation will be
obtained.
2.3) The Mechanism of Dielectric Heating
According to Hulls (1992), two frequency bands can be used for dielectric heating - radio
frequencies (below 300 MHz) and microwaves (above 300 MHz). In this work, dielectric
heating refers to heating induced by microwave radiation only.
Introduction to Microwave Heating Principles 2-11
Microwave heating occurs at molecular or atomic level and is be due to a combination of
4 methods (Cober Electronics, 1998) :
Dipole Rotation Electromagnetic Heating
Resistive Heating Dielectric Heating
As the 4 heating mechanisms are very similar in nature - all depend on internal friction to
generate heat - the term dielectric heating will hereafter be used to refer to the heating of
materials using microwaves.
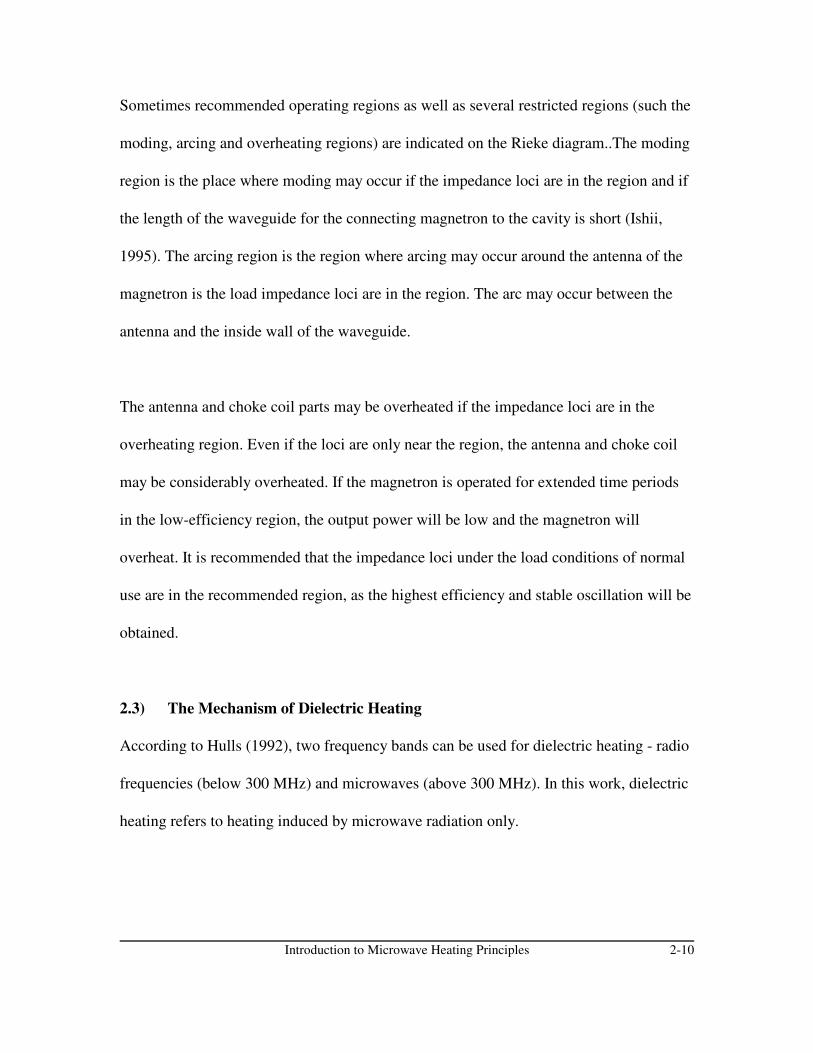
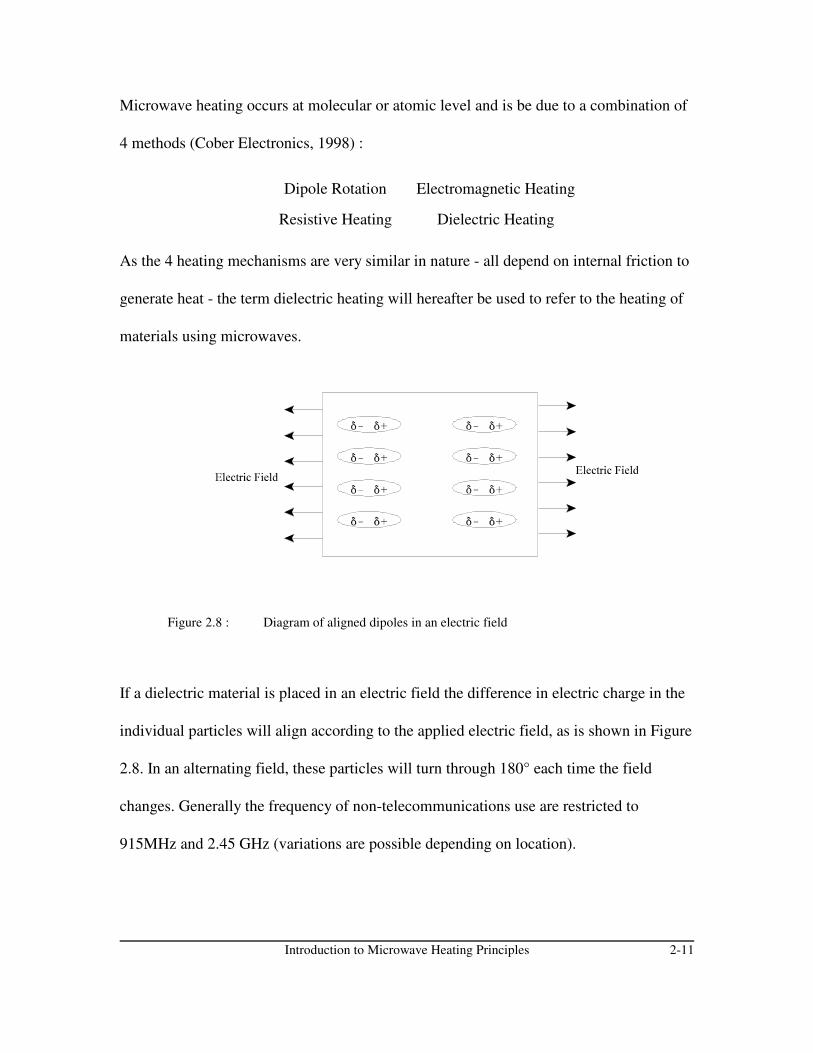
Figure 2.8 : Diagram of aligned dipoles in an electric field
If a dielectric material is placed in an electric field the difference in electric charge in the
individual particles will align according to the applied electric field, as is shown in Figure
2.8. In an alternating field, these particles will turn through 180° each time the field
changes. Generally the frequency of non-telecommunications use are restricted to
915MHz and 2.45 GHz (variations are possible depending on location).
Introduction to Microwave Heating Principles 2-12
Equation 2.3
Therefore the particles will re-align themselves 915 million times per second (or 2.45
billion times - depending on the frequency). This causes internal friction which, in turn,
heats up the material. Materials that heats in a microwave field are called dielectrics or
lossy materials.
Conventional heating methods are dependent on conduction for heating the material. This
process is relatively inefficient and problematic especially when heating non-conducting
materials need to heated as the surface may overheat because of the small conductivity.
However, dielectric heating generates the heat from “within” (as explained in Section 2.5)
and are thus capable of rapidly heating most dielectric materials (Hulls, 1992).
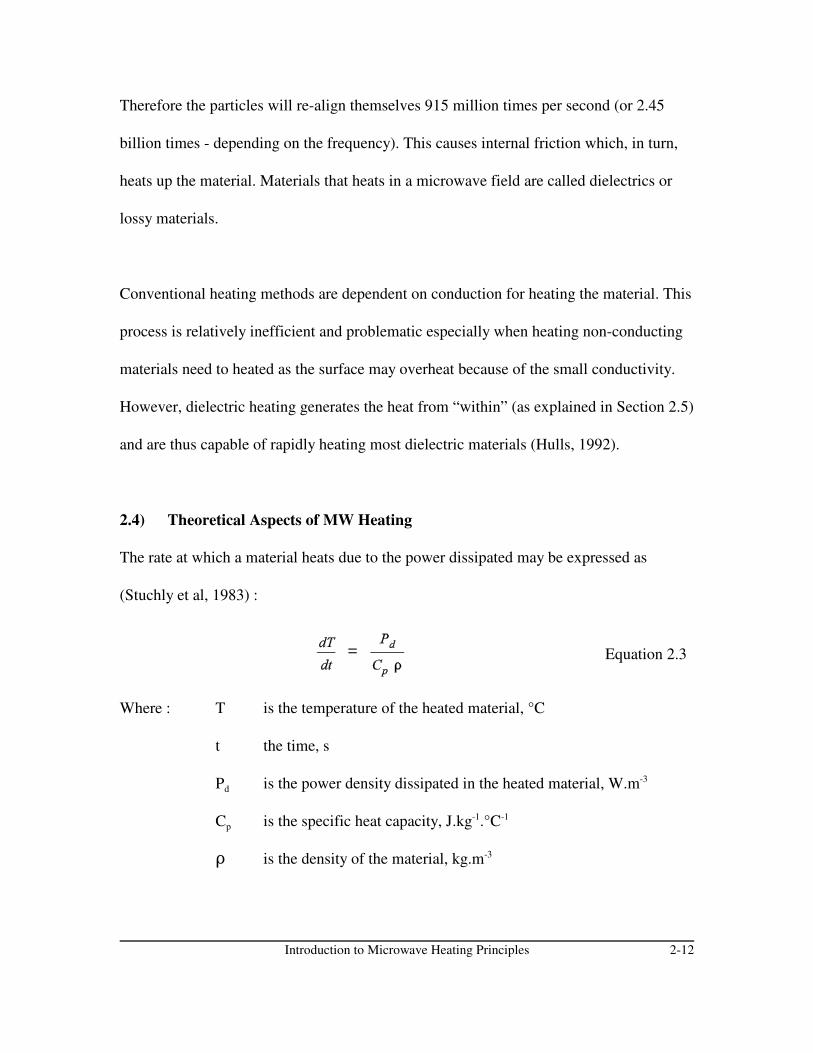
2.4) Theoretical Aspects of MW Heating
The rate at which a material heats due to the power dissipated may be expressed as
(Stuchly et al, 1983) :
Where : T is the temperature of the heated material, °C
t the time, s
Pd is the power density dissipated in the heated material, W.m-3
Cp is the specific heat capacity, J.kg-1.°C-1
D is the density of the material, kg.m-3
Introduction to Microwave Heating Principles 2-13
Equation 2.4
Equation 2.5
Equation 2.6
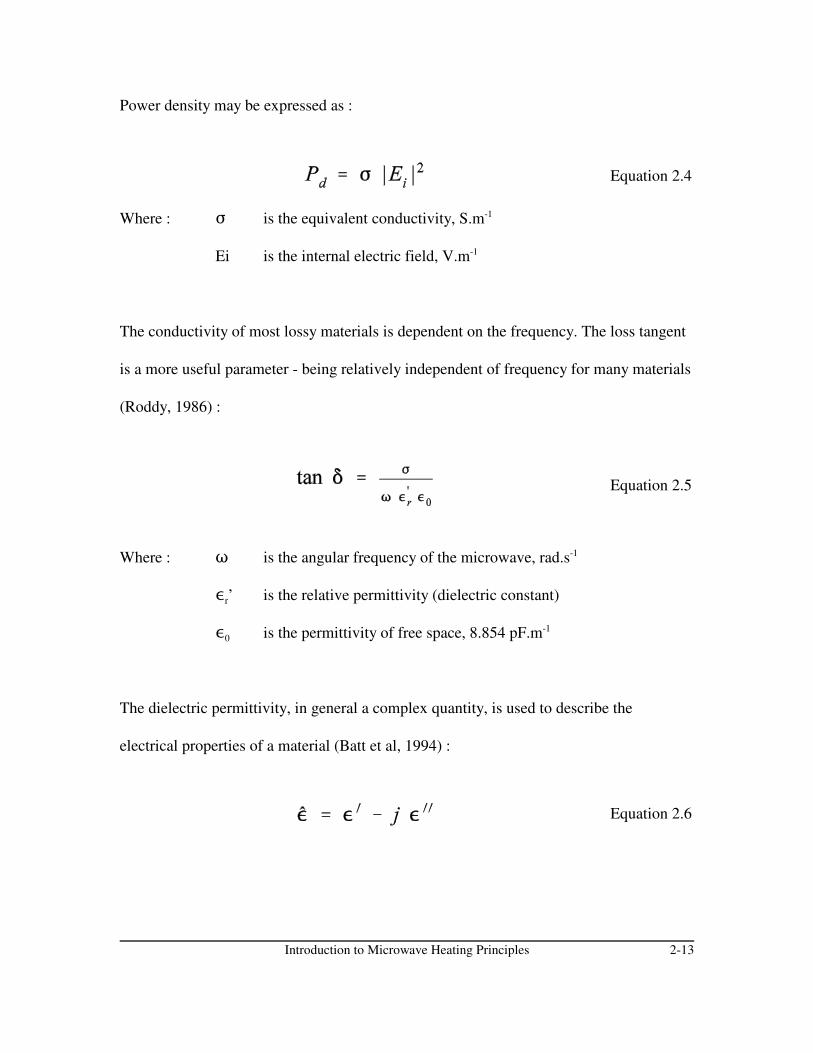
Power density may be expressed as :
Where : F is the equivalent conductivity, S.m-1
Ei is the internal electric field, V.m-1
The conductivity of most lossy materials is dependent on the frequency. The loss tangent
is a more useful parameter - being relatively independent of frequency for many materials
(Roddy, 1986) :
Where : T is the angular frequency of the microwave, rad.s-1
,r’ is the relative permittivity (dielectric constant)
,0 is the permittivity of free space, 8.854 pF.m-1
The dielectric permittivity, in general a complex quantity, is used to describe the
electrical properties of a material (Batt et al, 1994) :

Introduction to Microwave Heating Principles 2-14
Equation 2.7
Where : is the complex permittivity, F.m-1
,’ is the real part of the complex permittivity, called the dielectric or
dispersion factor, F.m-1
,” is the imaginary part of the complex permittivity , called the loss
factor, F.m-1
j is the imaginary number
The real term, ,’, describes the energy stored within the material and the imaginary term,
,”, is the loss factor and quantifies the dipolar relaxation loss, the conduction and
Maxwell-Wagner losses (Bradshaw et al, 1998; Batt et al, 1994). As the permittivities are
generally very small numbers it is customary to divide by the permittivity of free space,
,0, to give the relative permittivities :
is the relative permittivity
is the relative dielectric factor
is the relative loss factor
Introduction to Microwave Heating Principles 2-15
Equation 2.8
Equation 2.9
Equation 2.10
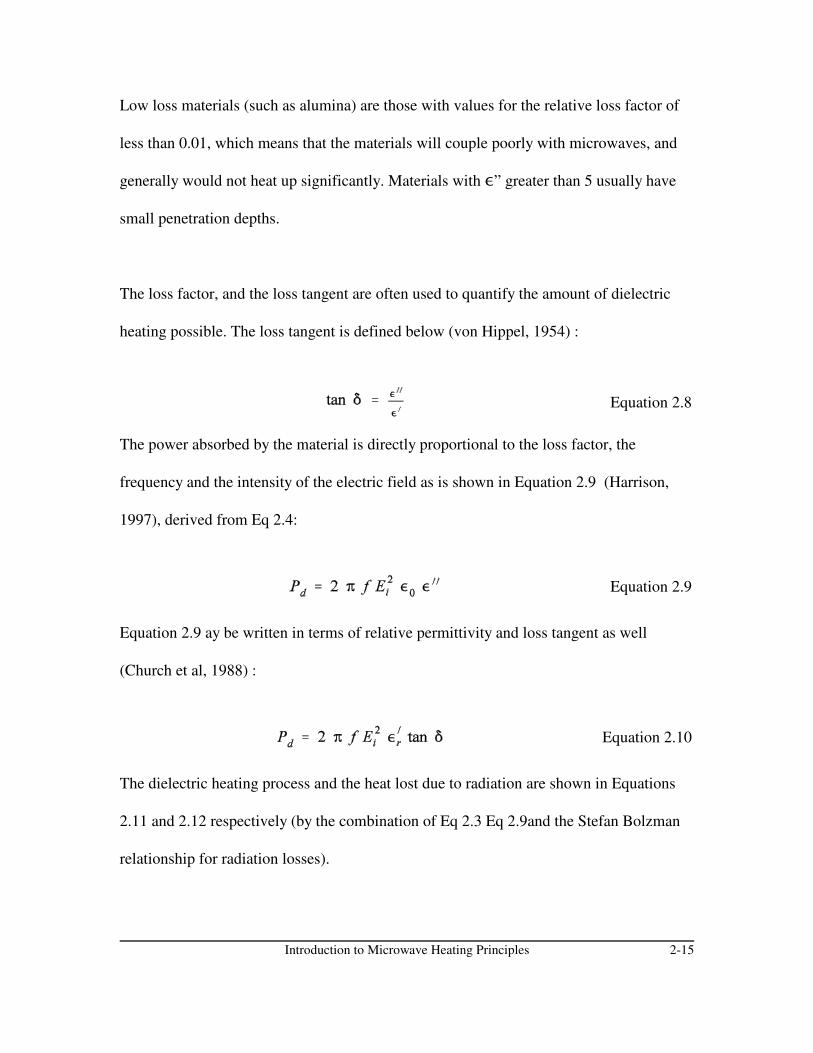
Low loss materials (such as alumina) are those with values for the relative loss factor of
less than 0.01, which means that the materials will couple poorly with microwaves, and
generally would not heat up significantly. Materials with ,” greater than 5 usually have
small penetration depths.
The loss factor, and the loss tangent are often used to quantify the amount of dielectric
heating possible. The loss tangent is defined below (von Hippel, 1954) :
The power absorbed by the material is directly proportional to the loss factor, the
frequency and the intensity of the electric field as is shown in Equation 2.9 (Harrison,
1997), derived from Eq 2.4:
Equation 2.9 ay be written in terms of relative permittivity and loss tangent as well
(Church et al, 1988) :
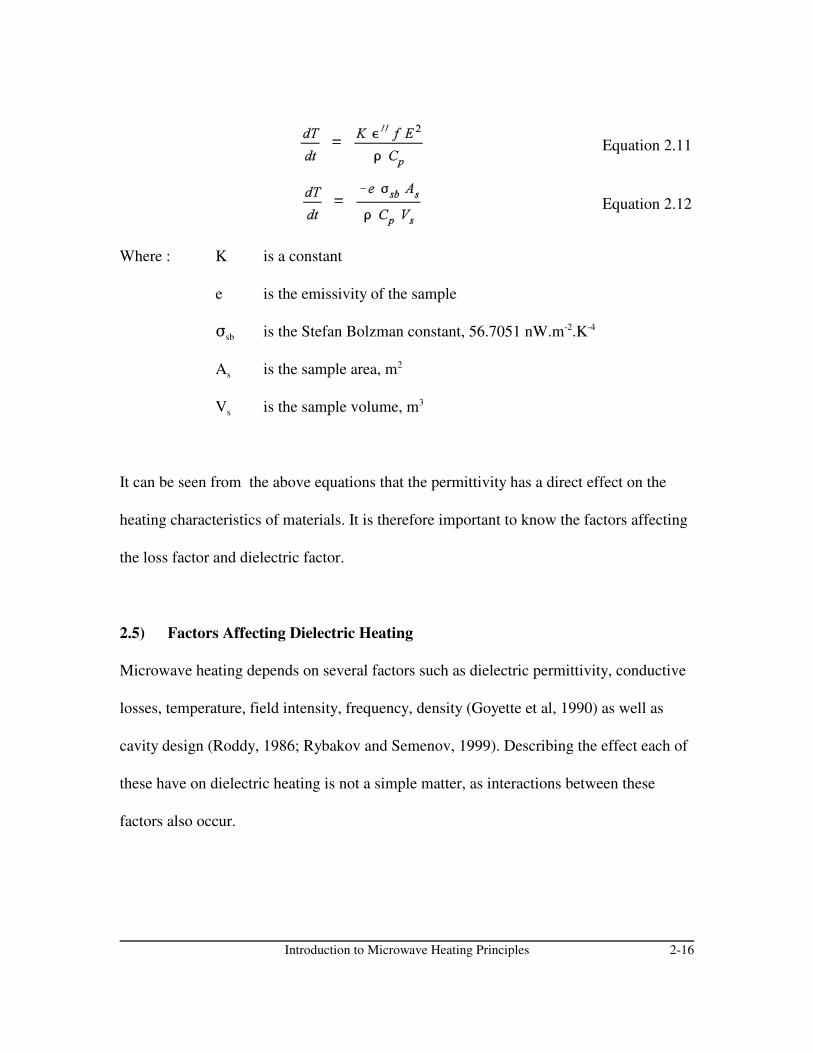
The dielectric heating process and the heat lost due to radiation are shown in Equations
2.11 and 2.12 respectively (by the combination of Eq 2.3 Eq 2.9and the Stefan Bolzman
relationship for radiation losses).
Introduction to Microwave Heating Principles 2-16
Equation 2.12
Equation 2.11
Where : K is a constant
e is the emissivity of the sample
Fsb is the Stefan Bolzman constant, 56.7051 nW.m-2.K-4
As is the sample area, m2
Vs is the sample volume, m3
It can be seen from the above equations that the permittivity has a direct effect on the
heating characteristics of materials. It is therefore important to know the factors affecting
the loss factor and dielectric factor.
2.5) Factors Affecting Dielectric Heating
Microwave heating depends on several factors such as dielectric permittivity, conductive
losses, temperature, field intensity, frequency, density (Goyette et al, 1990) as well as
cavity design (Roddy, 1986; Rybakov and Semenov, 1999). Describing the effect each of
these have on dielectric heating is not a simple matter, as interactions between these
factors also occur.

Introduction to Microwave Heating Principles 2-17
Equation 2.13
Equation 2.14
Equation 2.15
2.5.1) Dielectric Permittivity
The power absorbed by a unit volume of dielectric material may be described by
(Goyette, et al, 1990)
Where : E100 is the local electric field in V.m-1
,eff” is the effective permittivity given by :
The effective permittivity describes the combination of capacitive losses in the heated
material and the conductive losses. The real part of the permittivity also affects the
dielectric heating as it has a direct effect on the applied electric field, E0 :
2.5.2) Conductive Losses
Conductive losses affects the effective permittivity as described in Eq 2.14 (Goyette et al,
1990).
Introduction to Microwave Heating Principles 2-18
2.5.3) Temperature and Frequency
Nelson et al (1989) showed that the dielectric properties of metal oxides such as hematite,
ilmenite and manganese oxide are strong functions of the frequency of radiation, while
the dielectric properties of pyroxene and goethite is independent of frequency.
The permittivity is dependant on temperature (Rowson, 1986; Goyette et al, 1990). This
is intuitively correct as the alignment of the dipoles becomes increasingly more difficult
as the temperature increase due to the increasing kinetic energy of the dipoles.
Heating ethanol at 2.2 GHz is a good example of the temperature dependance of dielectric
heating. At room temperature, ethanol relaxes at 1 GHz. As temperature increases, its
relaxation frequency increases. Initially, the value of ,” increases as well at 2.2 GHz, but
at 50°C, the relaxation frequency exceeds 2.2 GHz, which results in a decreasing ,”.
Therefore the dielectric losses increase and heating becomes increasingly inefficient at
2.2 GHz.
2.5.4) Sample Geometry and Mineralogy
For some geometries in the above example, the real part of the permittivity increases with
temperature, affecting the local field within the sample. As the field within the samples
increases, the substance will increase in temperature at a steadily increasing rate. This is
called a thermal avalanche. Thermal avalanche’s are of particular importance in
composites, as different materials respond differently to dielectric heating.
Introduction to Microwave Heating Principles 2-19
Walkiewicz et al (1988) reported on the effect of particle size on heating properties of
graphite. It was found that finer size graphite responds better to microwave radiation that
the larger sizes. Gasner (1984) findings on the pyrolysis of bituminous coal confirmed the
results of Walkiewicz. Particle size also affects the voidage and thus the bulk density of
the sample. The bulk density of the sample affects the heating characteristics. Kingman et
al, 2000, reported on the effect of mineralogy on microwave assisted grinding, which is
dependant on the heating properties of the material.
2.5.5) Density and Composition
The composition of the dielectric material is also affects the permittivity. This can be
explained as the mechanism for dielectric heating depends on the presence and relative
freedom of dipoles in the material (Goyette et al, 1990).
To illustrate, in the literature some authors stated that hematite (Fe2O3) is a good absorber
of microwave energy (Chen et al, 1984; Walkiewicz, 1988). Others (Wright et al, 1989)
stated the opposite. Hematite occurs in different mineral forms, having different crystal
latices and impurities. The different mineral forms affects the dielectric properties of
hematite.
Introduction to Microwave Heating Principles 2-20
Arai et al (1995) developed mathematical models based on mixture equations for the
estimation of complex permittivities in ceramic materials. Theoretically, these mixture
equations may be used to estimate the dielectric constant of a mixture of known
composition and knowing the dielectric properties of the individual components.
Kraszewski and Nelson, 1999, showed that similar techniques may be used to determine
the composition of a coal-limestone mixture, accurately and more quickly than the
traditional combustion techniques.
Nelson (1996) showed that the permittivity of solid coal and limestone may be calculated
from measurements of permittivity of pulverized samples and applying mixture
equations, showing that the permittivity is a function of composition. Florek and Lovas
(1995) showed that the permittivity is also a function of the particle grain size.
Church and Webb (1986), Flemming et al (1989) and Batt et al (1994) describes different
techniques for the measurement of dielectric properties. Church (1989) developed a
model to predict the amount of microwave radiation absorbed for different minerals. This
was then used to prove that mineral properties may selectively be modified to improve
separation.

Introduction to Microwave Heating Principles 2-21
Equation 2.16
2.5.6) Cavity Design
Rybakov and Semenov al (1999) stated that for industrial utilization of microwave
technology it is important to implement the homogenous processing (heating) of large
volumes. It is also claimed that this may be achieved using millimetre-wave radiation
and super multimode cavities as applicators.
2.6) The Penetration Depth
It has been stated that microwaves heat materials from the inside out (Hulls, 1992). This
implies penetration of the microwaves into the dielectric. Two measures for indication of
microwave penetration into materials are in use : the penetration depth and the skin depth.
The distance over which the electric field is reduced to e-1 is called the skin depth whereas
the penetration depth is the distance over which the power is reduced by e-1. As power is
proportional to the square of electric field, the penetration depth is half of the skin depth.
Penetration depth may be expressed by Equation 2.16 (Bradshaw et al, 1998) :
Where d is the penetration depth, m.
Introduction to Microwave Heating Principles 2-22
Increasing depth
Am
pli
tud
e
Inside Mineral
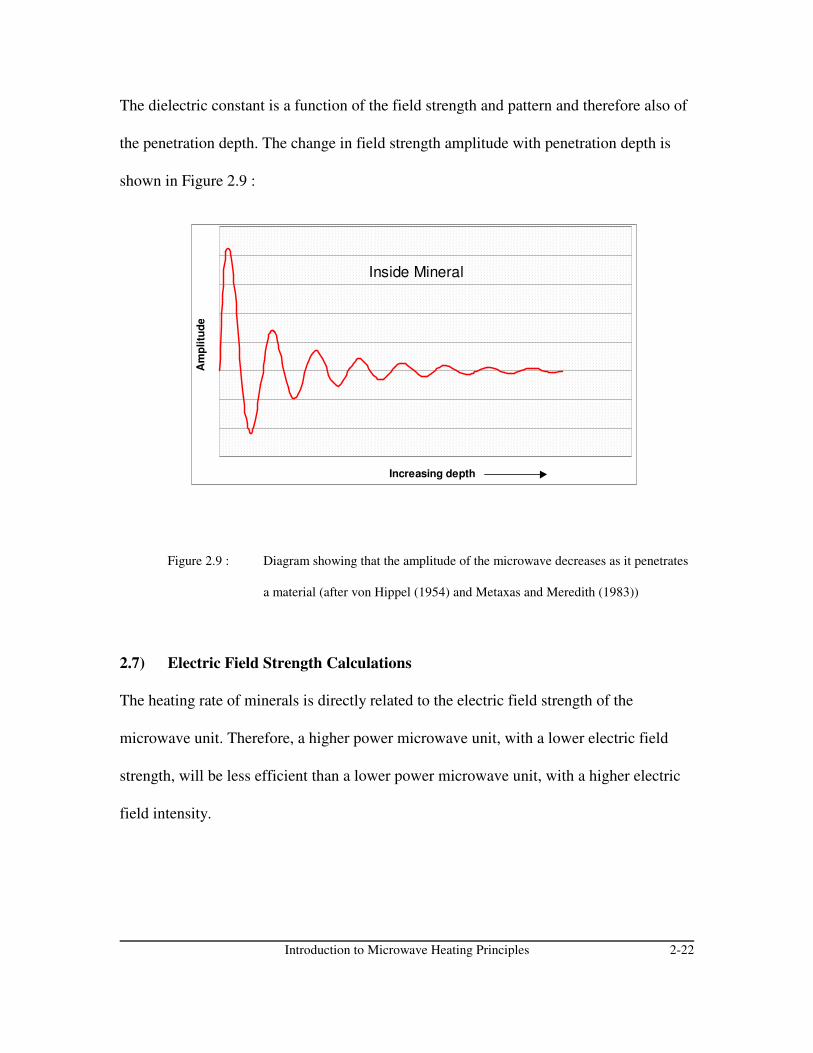
The dielectric constant is a function of the field strength and pattern and therefore also of
the penetration depth. The change in field strength amplitude with penetration depth is
shown in Figure 2.9 :
Figure 2.9 : Diagram showing that the amplitude of the microwave decreases as it penetrates
a material (after von Hippel (1954) and Metaxas and Meredith (1983))
2.7) Electric Field Strength Calculations
The heating rate of minerals is directly related to the electric field strength of the
microwave unit. Therefore, a higher power microwave unit, with a lower electric field
strength, will be less efficient than a lower power microwave unit, with a higher electric
field intensity.
Introduction to Microwave Heating Principles 2-23
Equation 2.17
Equation 2.18
Equation 2.19
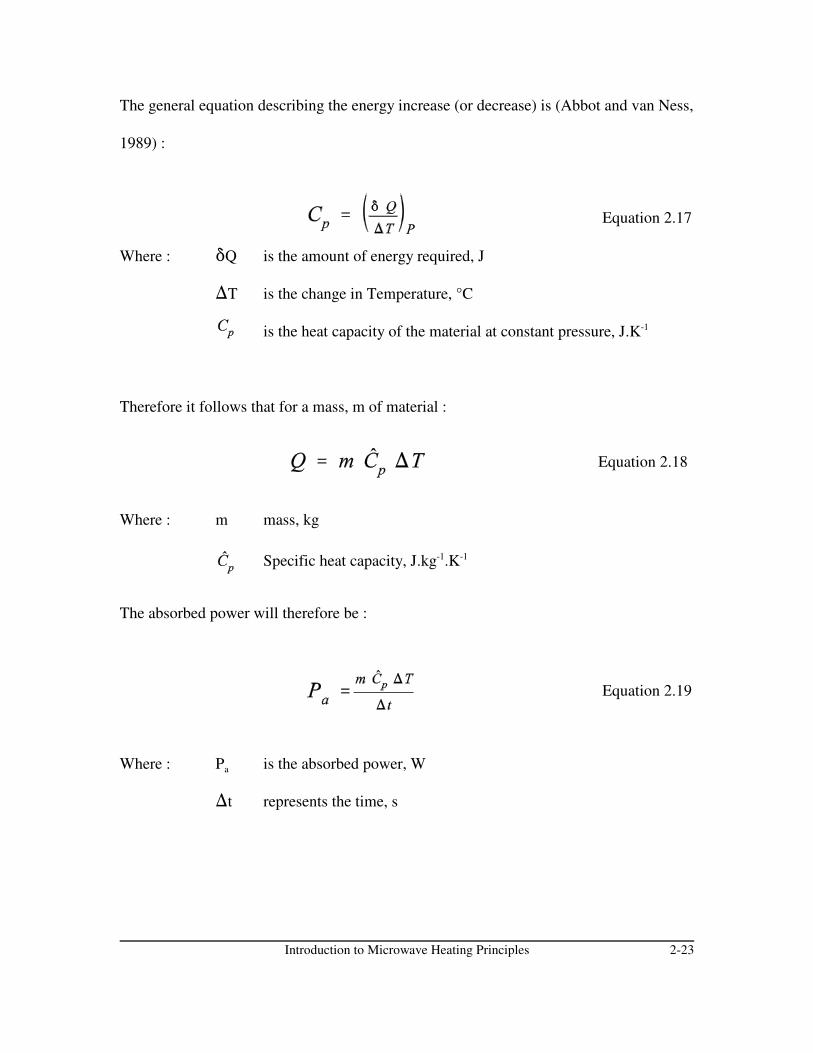
The general equation describing the energy increase (or decrease) is (Abbot and van Ness,
1989) :
Where : *Q is the amount of energy required, J
)T is the change in Temperature, °C
is the heat capacity of the material at constant pressure, J.K-1
Therefore it follows that for a mass, m of material :
Where : m mass, kg
Specific heat capacity, J.kg-1.K-1
The absorbed power will therefore be :
Where : Pa is the absorbed power, W
)t represents the time, s
Introduction to Microwave Heating Principles 2-24
Equation 2.20
Equation 2.21
Equation 2.22
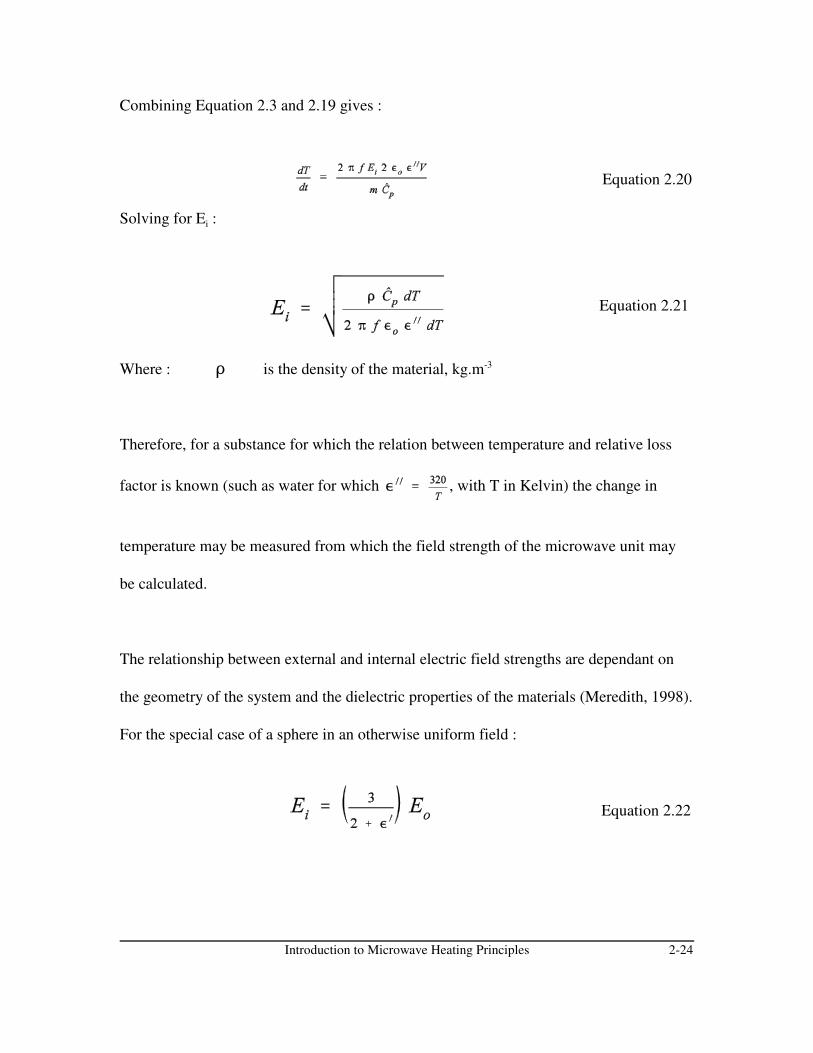
Combining Equation 2.3 and 2.19 gives :
Solving for Ei :
Where : D is the density of the material, kg.m-3
Therefore, for a substance for which the relation between temperature and relative loss
factor is known (such as water for which , with T in Kelvin) the change in
temperature may be measured from which the field strength of the microwave unit may
be calculated.
The relationship between external and internal electric field strengths are dependant on
the geometry of the system and the dielectric properties of the materials (Meredith, 1998).
For the special case of a sphere in an otherwise uniform field :
Introduction to Microwave Heating Principles 2-25
2.8) Determination of Dielectric Constants and Loss Factors.
A material’s dielectric properties at microwave frequencies can be estimated by the
measurement of the propagation characteristics of an electromagnetic wave through the
medium. Different techniques exist for the measurement, the choice of any particular
method depends on the frequency, the properties of the material as well as the form and
availability of the sample (Lance, 1964).
The dielectric properties of Palabora ore was measured (at 915MHz and 298K) using the
resonant cavity method, which is based on the perturbation theory. Perturbation methods
are used to study the effects of small changes. Because of the small perturbation, it is
assumed that the solution deviates little from the ideal, therefore the effect of the small
changes can be calculated from the ideal. The permittivity is dependent on the frequency
it is measured at as well as the temperature. For future work regarding the measurement
of dielectric properties, it is recommended that these properties are measured at the
frequency of the microwave unit used over a whole range of temperatures.
This method is based on the perturbation of a TMono cavity. Variable frequency
multimode cavities are used to give spot frequencies of 650 MHz, 1410 MHz and 2215
MHz.. A sample (heated in a conventional heater) is moved rapidly into a high electric
field area. The change in resonant frequency is a function of the dielectric constant, and
the change in cavity Q gives an indication of the loss factor for the material (Lance, 1964,
Baden- Fuller, 1979).
Introduction to Microwave Heating Principles 2-26
Eq 2.23
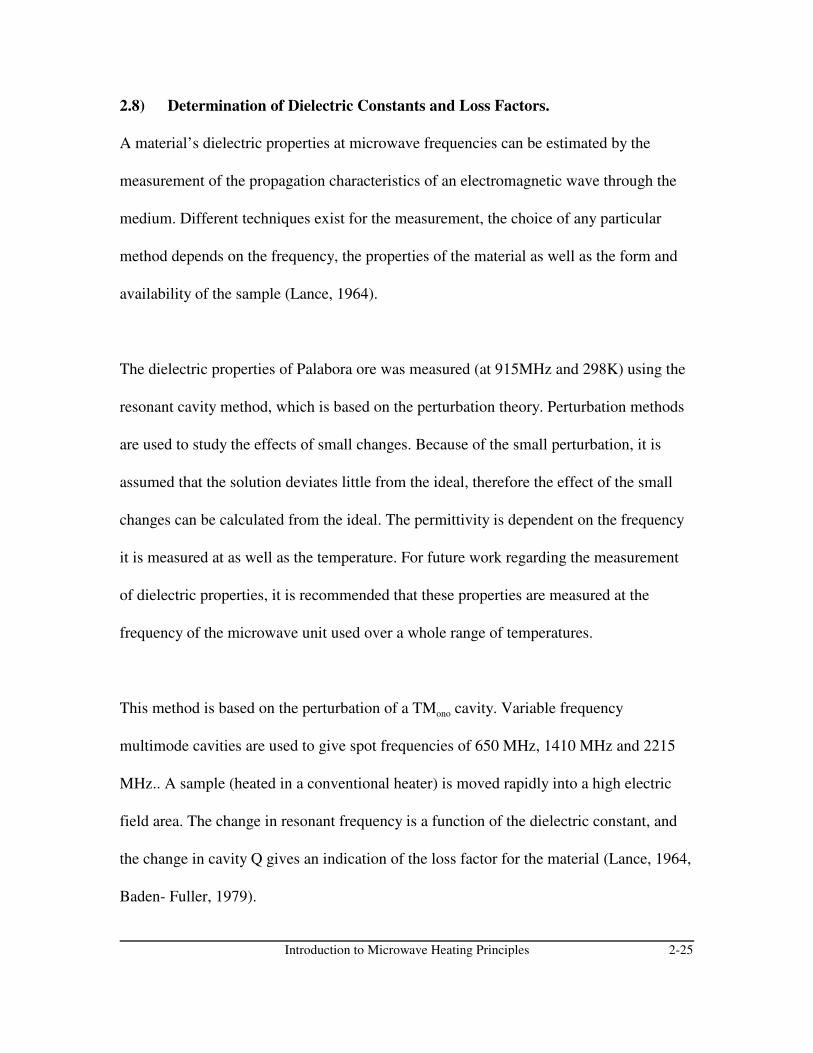
The Q-factor for a cavity is the ratio of the energy stored to the energy dissipated as is
described by the formula :
Batt et al (1994) reports that the repeatability of this type of measurement for ,’ < 40 is
good. However, the measurement for materials of higher permittivities are not as
repeatable. There is also poor agreement between different methods for the calculation of
,”.
2.9) Microwave Safety Considerations
Microwaves are potentially hazardous : their effect may not be noticed until damage to
living organisms has been done. The body is designed to warn against excessive external
heat not internally generated heat as would be the case if microwave radiation penetrates
the skin causing internal heating (Baden-Fuller, 1979).
Energy balance considerations (based on a standard man in standard conditions) suggest
that 10 W.cm-3 (or 100 W.m-2) is a safe upper limit, even in the case of infinite exposure.
The reason for this is because thermoregulatory systems compensate for the absorbed
power. A power level as low as 10 W.m-2 may be considered as having no heating effect -
even in extreme conditions of temperature and humidity (Baden-Fuller, 1979).
Introduction to Microwave Heating Principles 2-27
However, evidence (disputed) suggests non-thermal effects through the nervous system.
Claims are made that exposure over a period of years to power levels in excess of 2 W.m-
2 lead to nervous system disturbances - even though occupational exposure to healthy
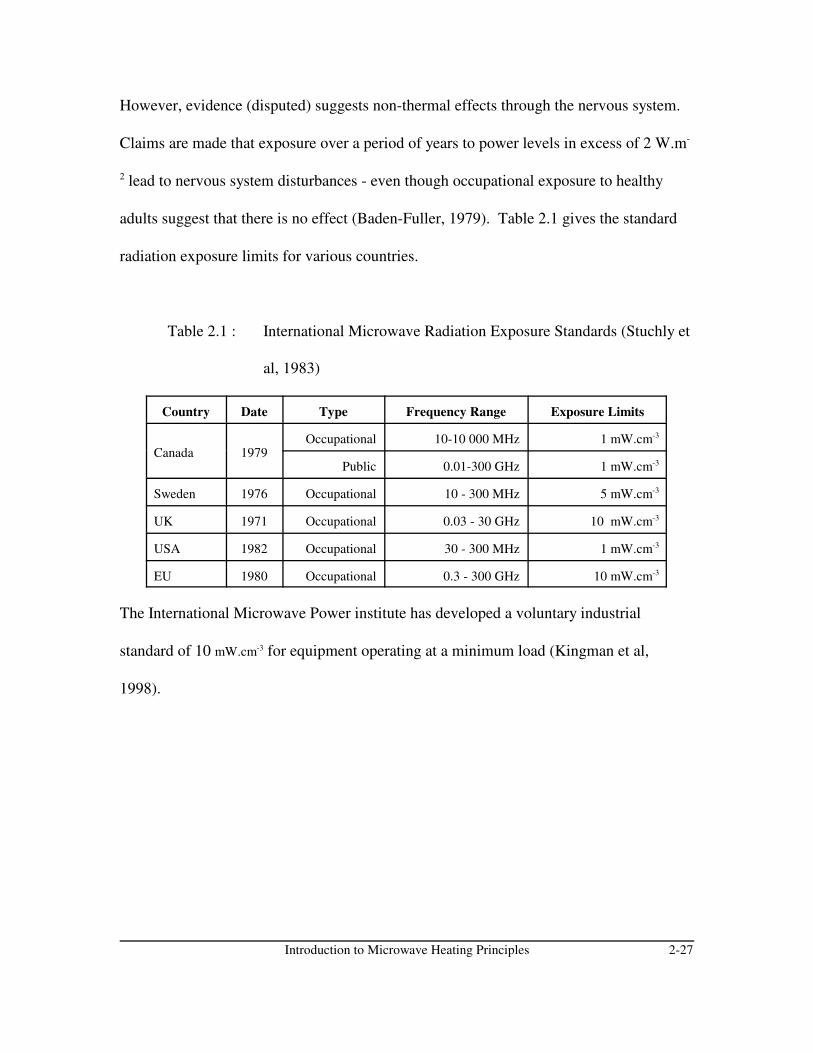
adults suggest that there is no effect (Baden-Fuller, 1979). Table 2.1 gives the standard
radiation exposure limits for various countries.
Table 2.1 : International Microwave Radiation Exposure Standards (Stuchly et
al, 1983)
Country Date Type Frequency Range Exposure Limits
Canada 1979Occupational 10-10 000 MHz 1 mW.cm-3
Public 0.01-300 GHz 1 mW.cm-3
Sweden 1976 Occupational 10 - 300 MHz 5 mW.cm-3
UK 1971 Occupational 0.03 - 30 GHz 10 mW.cm-3
USA 1982 Occupational 30 - 300 MHz 1 mW.cm-3
EU 1980 Occupational 0.3 - 300 GHz 10 mW.cm-3
The International Microwave Power institute has developed a voluntary industrial
standard of 10 mW.cm-3 for equipment operating at a minimum load (Kingman et al,
1998).
Comminution and Thermally Assisted Liberation 3-1
CHAPTER 3
COMMINUTION AND THERMALLY ASSISTED LIBERATION
3.1) Introduction
Comminution, derived from the Latin comminuere, refers to the mechanical breakdown
of solids into smaller particles (Napier-Munn et al, 1999). Comminution encompasses all
crushing units, tumbling mills, stirred mills as well as sizing processes (Napier-Munn,
1999). The role of comminution is not only size reduction, but more importantly, the
liberation of minerals from each other (Wills and Atkinson, 1993).
Only approximately 1% of the energy input into comminution equipment is available for
size reduction, making the comminution process one of the most intensively researched
areas in the world (Wills and Atkinson, 1993). Esk (1986) conducted a study on the
energy requirements of mineral processing circuits. Of particular interest is the
breakdown in energy consumption for a copper sulphide concentrator.
Comminution and Thermally Assisted Liberation 3-2
Table 3.1 : Energy requirements of a copper sulphide concentrator (after Esk,
1986)
Operation
Electrical Energy
Usage (kWh/t)
Operation
Electrical Energy
Usage (kWh/t)
Crushing 2.04 Filtration 0.21
Grinding 9.8 Regrinding 0.26
Flotation 1.28 Water Pumping 2.8
As can be seen from Table 3.1, 62% of the energy in the concentrator is consumed by the
grinding stages alone. It has been estimated (Napier-Munn et al, 1999) that 1.5% of the
total energy consumption in the U.S. is utilized in the comminution processes of mineral
concentrators alone. According to King (1994) there is already indications that the energy
cost of comminution will determine whether or not mineral resources may be
economically exploited.
Any reduction in energy requirements for the milling process would result in huge
savings. Thermally assisted liberation (T.A.L.) has been suggested as a possible method
for the reduction in comminution energy costs (Wills et al, 1987). This method relies on
the cyclical heating and cooling of a host rock, introducing thermal stresses within the
mineral lattice due to the repeated expansion and contraction of the structure (Kingman et
al, 1996).

Comminution and Thermally Assisted Liberation 3-3
Figure 3.1 shows intergranular fracture (on the left) which causes increased liberation, a
reduction in fines and an increase in grindability. On the right a picture of transgranular
fracture is shown - i.e. the cracks go through the middle of the particles - also increasing
the grindability, but increasing the amount of fines produced and does not necessarily aid
the recovery of valuable mineral species.
Conventional T.A.L. has the fundamental problem that the total mass of ore is heated. In
a microwave heating process, the ore’s dielectric properties are utilized and therefore
specific mineral phases respond at different rates. This allows for extremely short
treatment times (as some of the minerals have extremely quick response times), thermally
shocking the ore (first by heating and subsequent quenching), producing fractures at the
grain boundaries, thereby lowering the grinding energy required for liberation.
Figure 3.1 : Intergranular (left) and transgranular (right) cracks
Comminution and Thermally Assisted Liberation 3-4
3.2) Comminution
The main concern here is the grinding stage. Consequently the focus of this section is the
description of grindability and methods used to quantify grindability. The comminution
phase may be made more efficient if the grindability, a measure of the ease of grinding
(Deniz et al, 1996), can be increased.
3.2.1) Principles of Comminution
Bond (1961) described comminution in terms of 3 principles. The First Principle of
Comminution is that each particle has an energy level associated with it. Therefore, the
total energy input into the crushing device must be equal to the difference between the
energy level of the product and the feed.
The Second Principle recognises the fact the useful energy input in the comminution
phase is proportional to the increase in length of the cracks. The Third Principle relates to
the fact that the breaking strength of a rock is determined by the weakest flaw in the
mineral structure (Bond, 1961a,b). Bond (1961a) describes various methods and
equations that may be used to estimate the work index. These include the Crushing Test,
the Rod Mill Grindability Test, the Ball Mill Grindability Test and the Hardgrove
Grindability Rating.

Comminution and Thermally Assisted Liberation 3-5
Equation 3.1
Equation 3.2
Equation 3.3
3.2.2) Calculation of Mill Power Requirements
The energy (dW) required for a small change in size (dD) of a unit mass may be
described as a power function of the particle size (D) (Coulson et al, 1996; Wills, 1997) :
Where : k is a constant
p comminution exponent
In 1867, von Rittinger (Coulson et al, 1996) proposed that p = -2 in Eq 3.1 and derived :
Where : fc is the crushing strength
kR is Rittinger’s constant
As can be seen from Equation 3.2, von Rittinger believed that the energy required for the
size reduction is proportional to the increase in surface area. Kick, in 1885 (Coulson et al,
1996), proposed that p = -1 in Eq 3.1 which gives :
Where : kK is Kick’s constant
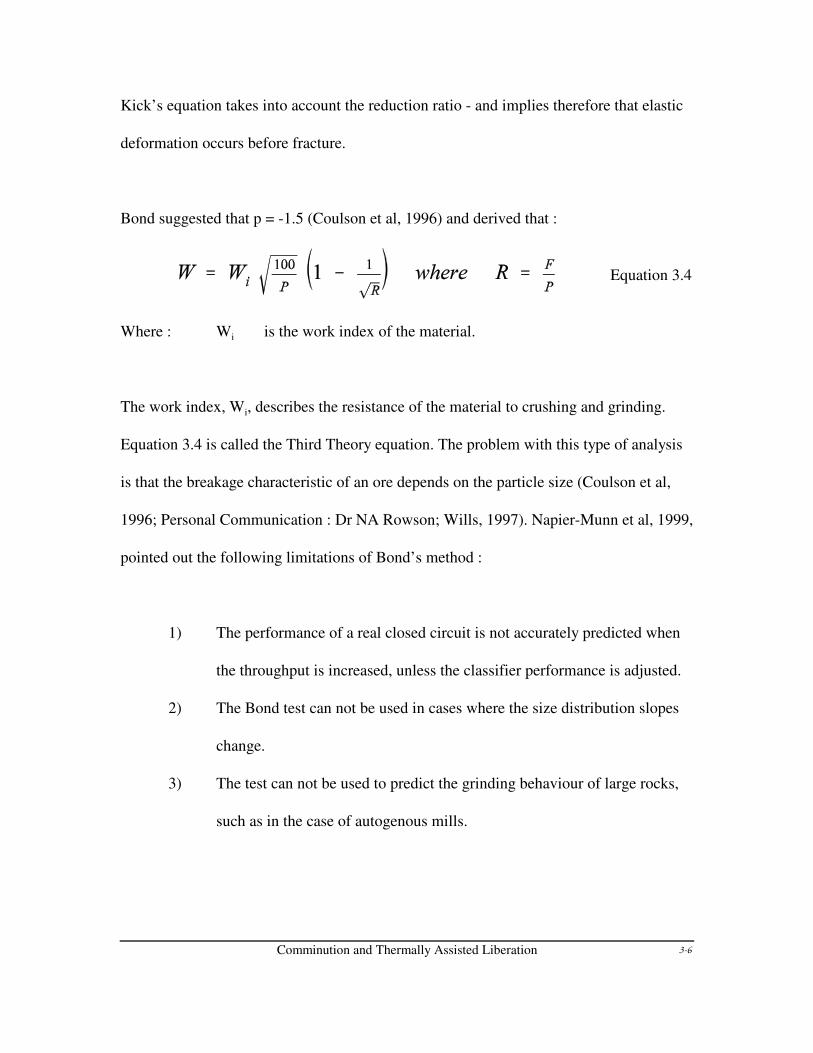
Comminution and Thermally Assisted Liberation 3-6
Equation 3.4
Kick’s equation takes into account the reduction ratio - and implies therefore that elastic
deformation occurs before fracture.
Bond suggested that p = -1.5 (Coulson et al, 1996) and derived that :
Where : Wi is the work index of the material.
The work index, Wi, describes the resistance of the material to crushing and grinding.
Equation 3.4 is called the Third Theory equation. The problem with this type of analysis
is that the breakage characteristic of an ore depends on the particle size (Coulson et al,
1996; Personal Communication : Dr NA Rowson; Wills, 1997). Napier-Munn et al, 1999,
pointed out the following limitations of Bond’s method :
1) The performance of a real closed circuit is not accurately predicted when
the throughput is increased, unless the classifier performance is adjusted.
2) The Bond test can not be used in cases where the size distribution slopes
change.
3) The test can not be used to predict the grinding behaviour of large rocks,
such as in the case of autogenous mills.
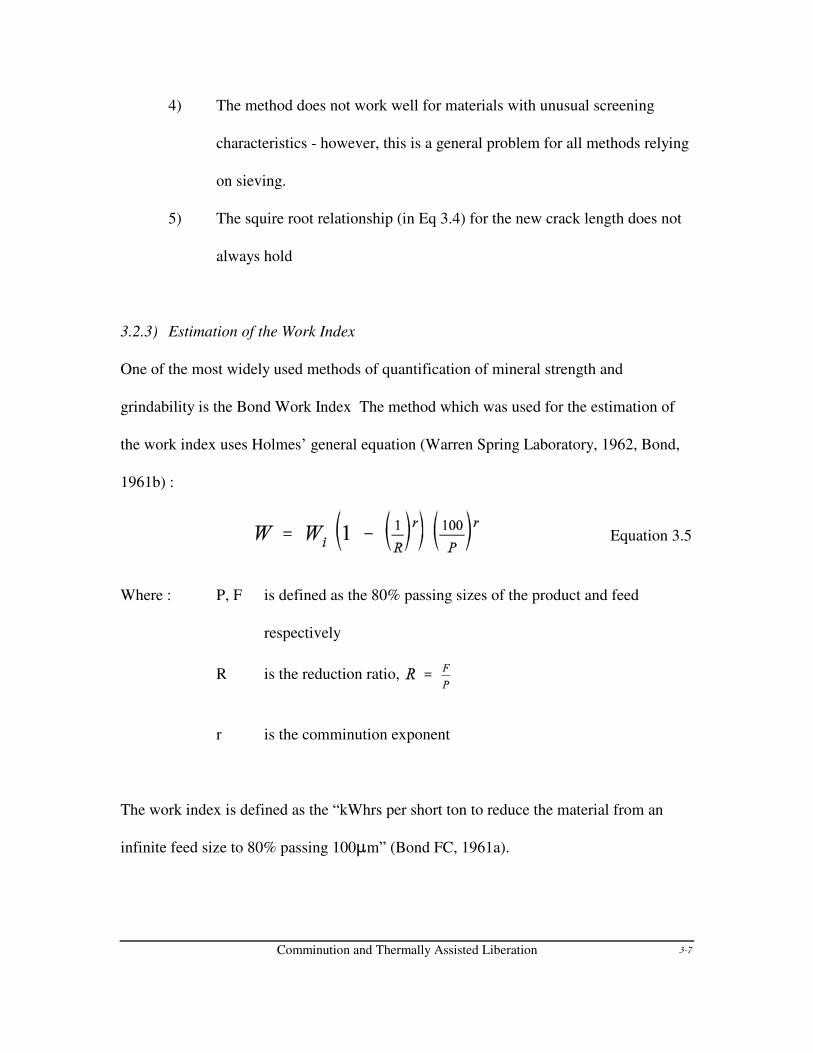
Comminution and Thermally Assisted Liberation 3-7
Equation 3.5
4) The method does not work well for materials with unusual screening
characteristics - however, this is a general problem for all methods relying
on sieving.
5) The squire root relationship (in Eq 3.4) for the new crack length does not
always hold
3.2.3) Estimation of the Work Index
One of the most widely used methods of quantification of mineral strength and
grindability is the Bond Work Index The method which was used for the estimation of
the work index uses Holmes’ general equation (Warren Spring Laboratory, 1962, Bond,
1961b) :
Where : P, F is defined as the 80% passing sizes of the product and feed
respectively
R is the reduction ratio,
r is the comminution exponent
The work index is defined as the “kWhrs per short ton to reduce the material from an
infinite feed size to 80% passing 100:m” (Bond FC, 1961a).
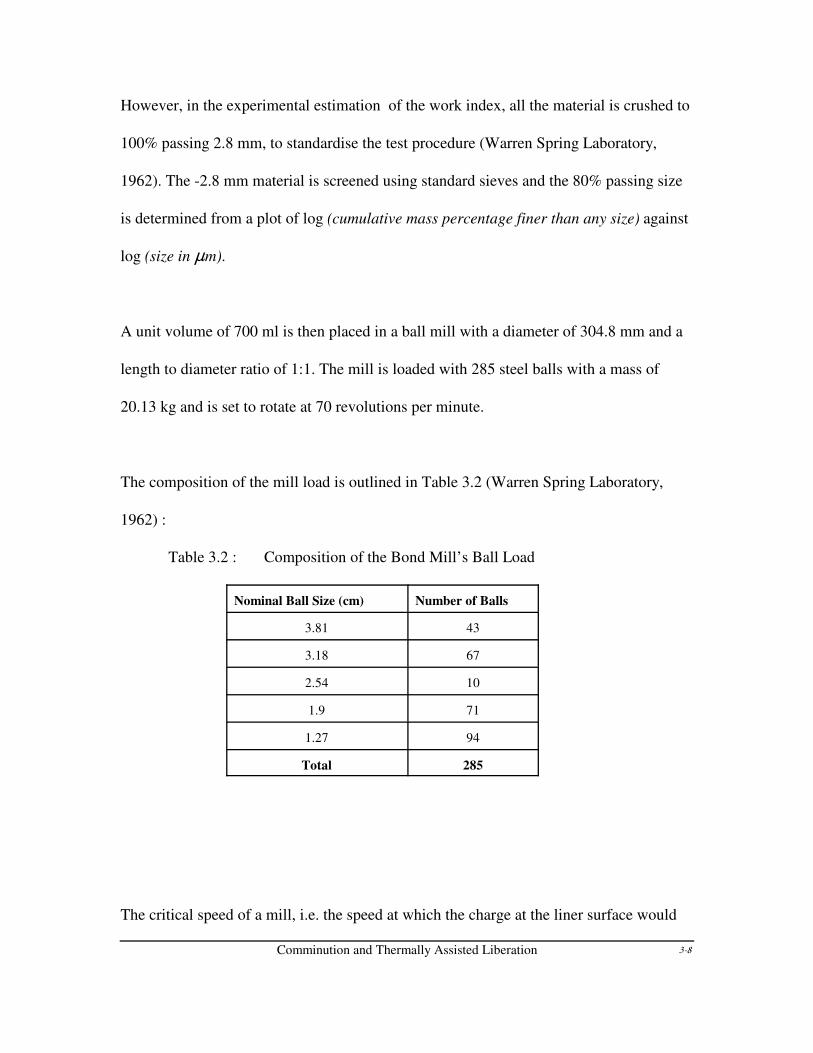
Comminution and Thermally Assisted Liberation 3-8
However, in the experimental estimation of the work index, all the material is crushed to
100% passing 2.8 mm, to standardise the test procedure (Warren Spring Laboratory,
1962). The -2.8 mm material is screened using standard sieves and the 80% passing size
is determined from a plot of log (cumulative mass percentage finer than any size) against
log (size in :m).
A unit volume of 700 ml is then placed in a ball mill with a diameter of 304.8 mm and a
length to diameter ratio of 1:1. The mill is loaded with 285 steel balls with a mass of
20.13 kg and is set to rotate at 70 revolutions per minute.
The composition of the mill load is outlined in Table 3.2 (Warren Spring Laboratory,
1962) :
Table 3.2 : Composition of the Bond Mill’s Ball Load
Nominal Ball Size (cm) Number of Balls
3.81 43
3.18 67
2.54 10
1.9 71
1.27 94
Total 285
The critical speed of a mill, i.e. the speed at which the charge at the liner surface would
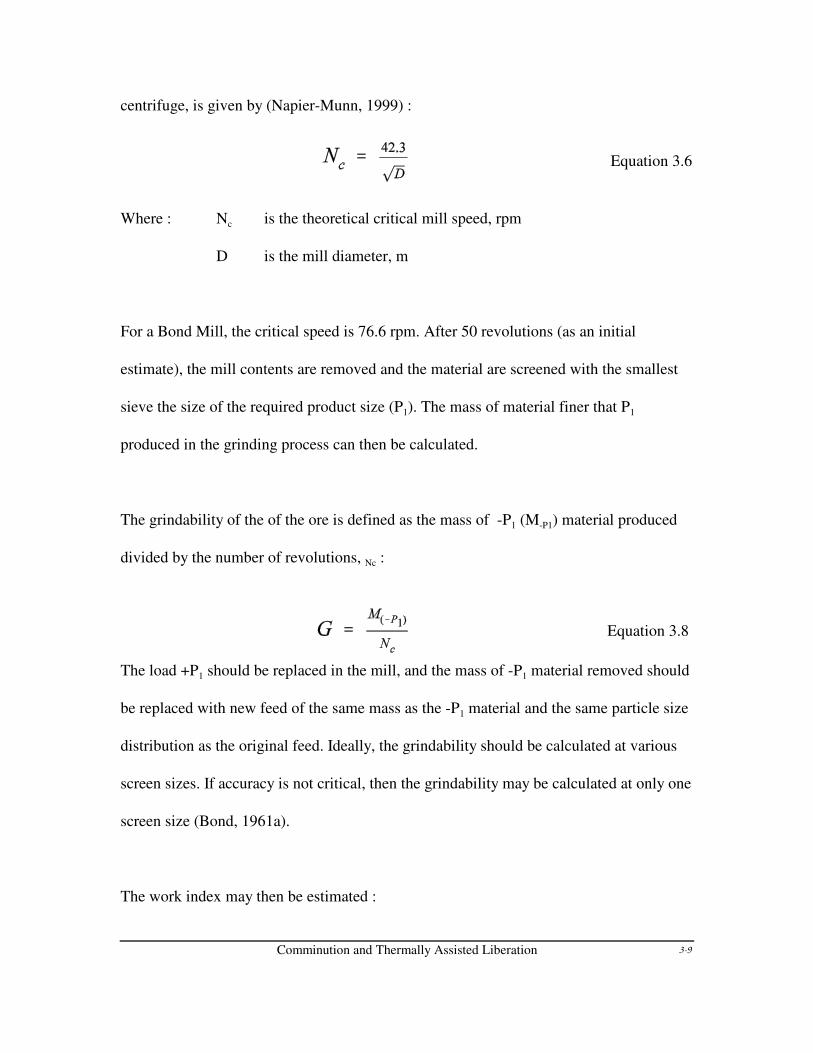
Comminution and Thermally Assisted Liberation 3-9
Equation 3.6
Equation 3.8
centrifuge, is given by (Napier-Munn, 1999) :
Where : Nc is the theoretical critical mill speed, rpm
D is the mill diameter, m
For a Bond Mill, the critical speed is 76.6 rpm. After 50 revolutions (as an initial
estimate), the mill contents are removed and the material are screened with the smallest
sieve the size of the required product size (P1). The mass of material finer that P1
produced in the grinding process can then be calculated.
The grindability of the of the ore is defined as the mass of -P1 (M-P1) material produced
divided by the number of revolutions, Nc :
The load +P1 should be replaced in the mill, and the mass of -P1 material removed should
be replaced with new feed of the same mass as the -P1 material and the same particle size
distribution as the original feed. Ideally, the grindability should be calculated at various
screen sizes. If accuracy is not critical, then the grindability may be calculated at only one
screen size (Bond, 1961a).
The work index may then be estimated :
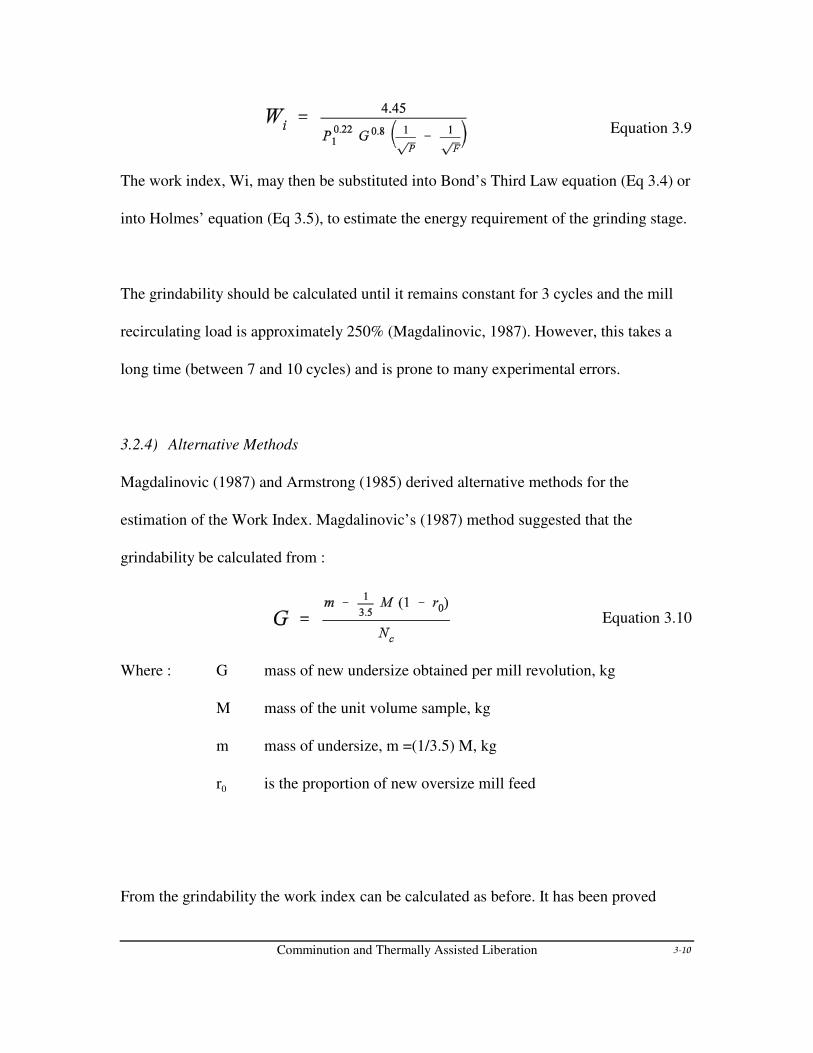
Comminution and Thermally Assisted Liberation 3-10
Equation 3.9
Equation 3.10
The work index, Wi, may then be substituted into Bond’s Third Law equation (Eq 3.4) or
into Holmes’ equation (Eq 3.5), to estimate the energy requirement of the grinding stage.
The grindability should be calculated until it remains constant for 3 cycles and the mill
recirculating load is approximately 250% (Magdalinovic, 1987). However, this takes a
long time (between 7 and 10 cycles) and is prone to many experimental errors.
3.2.4) Alternative Methods
Magdalinovic (1987) and Armstrong (1985) derived alternative methods for the
estimation of the Work Index. Magdalinovic’s (1987) method suggested that the
grindability be calculated from :
Where : G mass of new undersize obtained per mill revolution, kg
M mass of the unit volume sample, kg
m mass of undersize, m =(1/3.5) M, kg
r0 is the proportion of new oversize mill feed
From the grindability the work index can be calculated as before. It has been proved
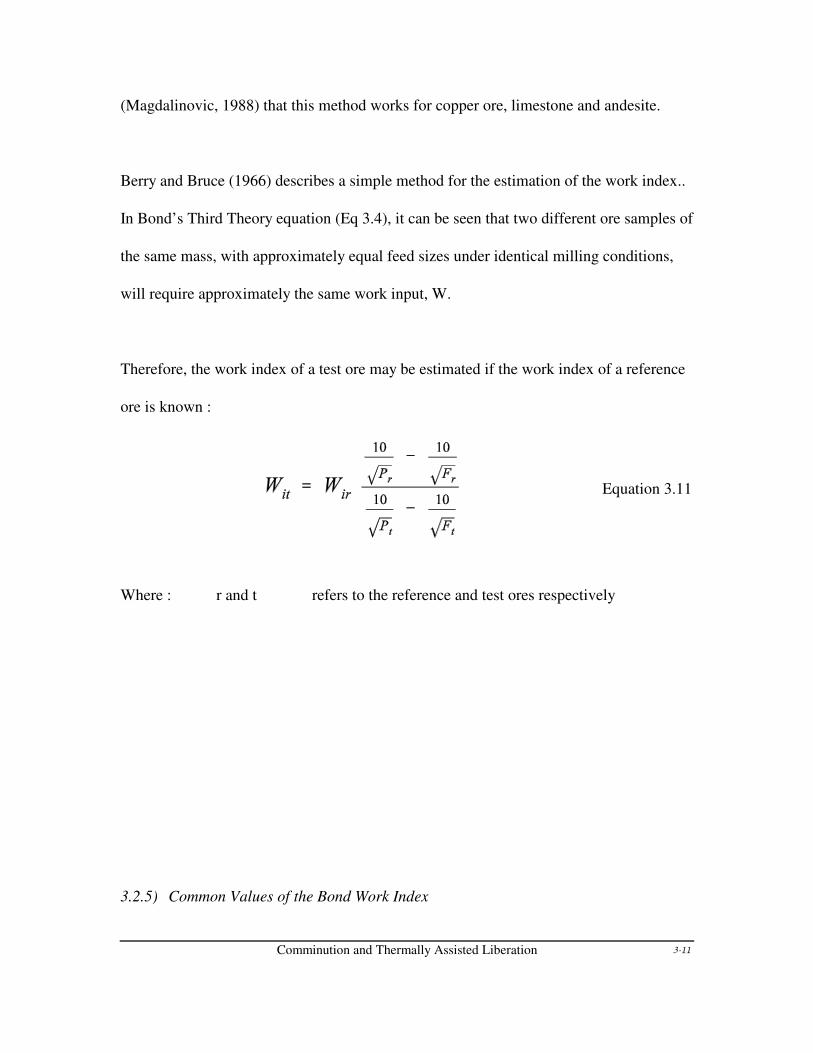
Comminution and Thermally Assisted Liberation 3-11
Equation 3.11
(Magdalinovic, 1988) that this method works for copper ore, limestone and andesite.
Berry and Bruce (1966) describes a simple method for the estimation of the work index..
In Bond’s Third Theory equation (Eq 3.4), it can be seen that two different ore samples of
the same mass, with approximately equal feed sizes under identical milling conditions,
will require approximately the same work input, W.
Therefore, the work index of a test ore may be estimated if the work index of a reference
ore is known :
Where : r and t refers to the reference and test ores respectively
3.2.5) Common Values of the Bond Work Index
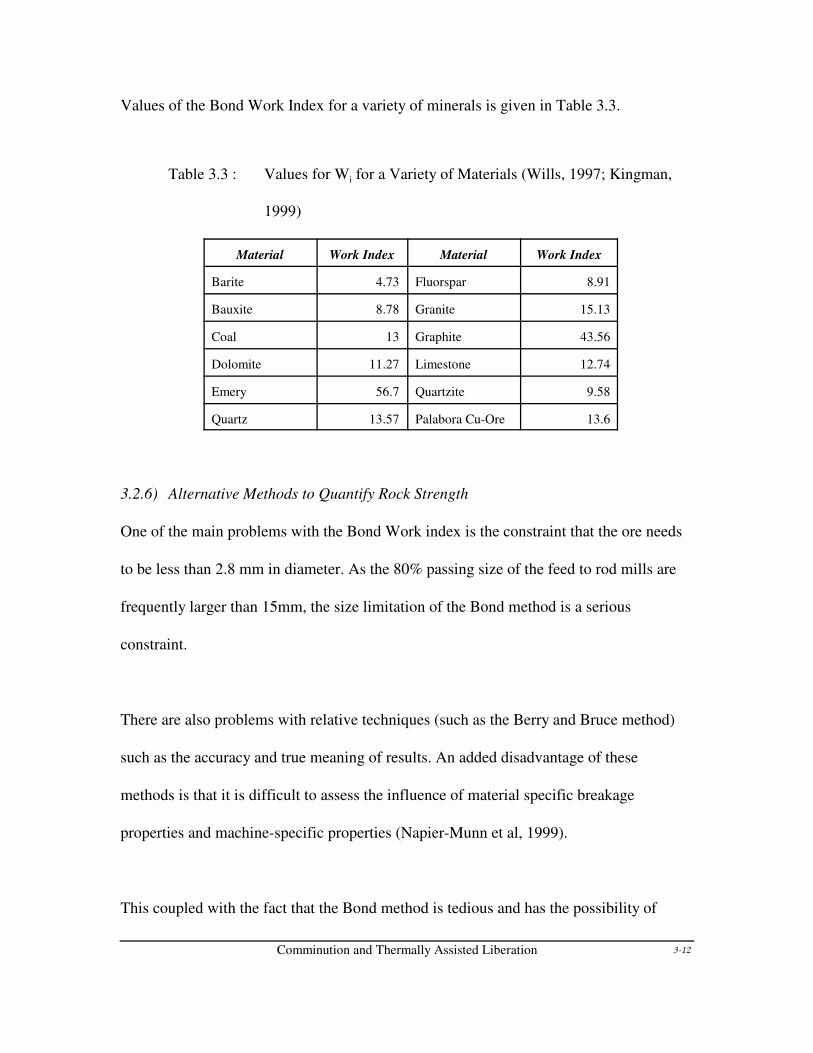
Comminution and Thermally Assisted Liberation 3-12
Values of the Bond Work Index for a variety of minerals is given in Table 3.3.
Table 3.3 : Values for Wi for a Variety of Materials (Wills, 1997; Kingman,
1999)
Material Work Index Material Work Index
Barite 4.73 Fluorspar 8.91
Bauxite 8.78 Granite 15.13
Coal 13 Graphite 43.56
Dolomite 11.27 Limestone 12.74
Emery 56.7 Quartzite 9.58
Quartz 13.57 Palabora Cu-Ore 13.6
3.2.6) Alternative Methods to Quantify Rock Strength
One of the main problems with the Bond Work index is the constraint that the ore needs
to be less than 2.8 mm in diameter. As the 80% passing size of the feed to rod mills are
frequently larger than 15mm, the size limitation of the Bond method is a serious
constraint.
There are also problems with relative techniques (such as the Berry and Bruce method)
such as the accuracy and true meaning of results. An added disadvantage of these
methods is that it is difficult to assess the influence of material specific breakage
properties and machine-specific properties (Napier-Munn et al, 1999).
This coupled with the fact that the Bond method is tedious and has the possibility of
Comminution and Thermally Assisted Liberation 3-13
many experimental errors, other techniques have to be found to quantify the effect of
microwave radiation on the ore.
Single particle breakage tests have been developed for the determination of the
comminution behaviour of rock material. These tests are typically either slow, indirect
tensile tests or high velocity impact tests. It is the tensile strength of rock governs its
ultimate failure as rocks are much weaker in tension than in compression (Napier-Munn
et al, (1999) claim that the tensile strength of a material is only equal to approximately
10% of its compressive strength).
The point load test may be used to determine the tensile strength. A standardised, point-
load strength test was initially developed by Broch & Franklin (1972) although the actual
stress distribution within rock cores under point load still remains ambiguous (Chau and
Wong, 1996)
The stresses in point-loaded specimens was analysed mathematically and photoelastically
by Hiramatsu & Oka (1966). An equation for the calculation of the tensile strength was
suggested although the method of testing was not perfect due to the stresses in the test
piece. Generally there are few theoretical solutions for the point load test, due to these
complexities of the resultant stress distributions developed within.
Peng (1976) attempted to model the stress distribution in cylindrical discs subjected to
Comminution and Thermally Assisted Liberation 3-14
double point loading. Biaxial tensile and compressive stress regions were observed within
the test specimens, but the exact stress at which crack propagation initiated was not
determined. This was mainly due to the complex nature of the stress distributions within
the specimen. Peng stated, however, that the method was a reliable means of determining
the preferred orientation of a fracture plane.
Mellor and Hawkes (1971) found that failure initiated away from the compressive regions
under loaded platens. Vutukuri (1974) and Hudson et al (1972) both questioned the
validity of the Brazilian test. Vutukuri (1974) found that under certain experimental
conditions crack propagation could initiate at the loading points and thus invalidate the
test.
Hudson (1969) suggests that the compressive component of the stress field does not
influence the tensile fracture of the test specimen within the Brazilian test. Hudson et al
(1972) argued that the propagation originates from the crushed zone below the loading
points and considered the Brazilian test being invalid for tensile strength measurement.
Clark (1992) used numerical modelling techniques to evaluate the principal stress
difference within test specimens in the Brazilian test. Progressive changes in stress
concentration were calculated and presented as contour plots. In addition to a central
tensile crack, shear cracks that initiate and propagate from the loaded surface into the
sample was observed.
Comminution and Thermally Assisted Liberation 3-15
During the impact test the rock sample is crushed between two hard surfaces. The rate of
loading is substantially greater than in the relatively slow indirect tensile tests. Many
types of impact tests have been described in the literature i.e. the Ultra fast load cell and
the Hopkinson pressure bar. Such tests have all been designed to relate the size
distribution or new surface of the comminuted products to the specific fracture energy.
Early pendulum tests were conducted to study the effects of velocity on single particle
breakage. Vutukuri et al (1974) concluded that an increase in impact velocity produced a
greater amount of fines upon breakage. A twin pendulum test was developed at the Julius
Kruttschnitt Mineral Research Centre (Napier-Munn et al, 1999). The twin pendulum
device was used to fracture single particles and relate the comminution energy required to
the resultant progeny. The test was used to develop ore-specific breakage functions for
various comminution models.
Brown (1997) used a similar swing pendulum device to fracture rock cores. The resultant
product size distribution was described by a fragmentation fractal dimension, and an
attempt was made to relate this to the size of the parent particle. The twin pendulum
device consists of an impact and a rebound pendulum which are suspended from a rigid
framework. The impact pendulum is raised to a certain height and released onto the test
specimen, which is located on the rebound pendulum.
Comminution and Thermally Assisted Liberation 3-16
The specific comminution energy (Ecs), is then evaluated by determining the input energy
associated within the impact pendulum, the residual energy within the impact pendulum
after impact and the energy transmitted to the rebound pendulum (Napier-Munn et al,
1999).
Napier-Munn et al (1999) discussed the twin pendulum test and identified some
limitations with this device. The range of input energy and particle size range is restricted
and the test procedure is somewhat time-consuming. There is also an inherent error with
the calculation of the breakage energy as a secondary motion of the rebound pendulum is
sometimes observed.
Among the first widely accepted drop weight tests, was the test developed by
Protodyakonov in 1962 (Napier-Munn et al, 1999) and was used to determine the
resistance of rock to failure. The test, consisted of a laboratory scale cylinder, into which
test specimens were placed. A known mass was then repeatedly released from a certain
height onto the sample. A strength coefficient was obtained, which could be related to the
compressive strength of the rock specimen.
Evans and Pomeroy developed a similar procedure to that of Protodyakonov for
measuring the strength of coal - namely the Impact Strength Index (ISI) . The authors
proposed correlations of ISI values and the compressive strength of cubed specimens.

Comminution and Thermally Assisted Liberation 3-17
More recently, a drop weight test was developed at the Julius Kruttschnitt Mineral
Research Centre as an alternative to the twin pendulum test. The test itself serves to
overcome many of the inherent limitations associated with twin pendulum devices.
Bearman et al (1997) related the specific comminution energy to the material fracture
toughness. He concluded that correlations should exist between any tensile test and the
drop weight tester, as the method of breakage is similar. The drop weight test rig consists
of an impact plate mounted on guide rails. The impact mass falls under gravity, crushing
a single rock particle, which is located on a hardened steel impact plate, mounted on a
concrete block. A wide range of input energies, related to the progeny size, can be
produced by varying the release height of the impact plate.
Napier-Munn et al (1999) stated that the drop weight tester provide analogous data to the
twin pendulum device and has several advantages. The extended range of input energies
and particle size, reduced testing time, greater precision and amount of test applications
make the drop weight test rig the favoured testing device.
Some of the advantages of the drop weight apparatus above the pendulum devices are
listed below (Bearman et al, 1997) :
- extended input energy range compared to the twin pendulum devices.
- reduction in experiment time
- a wider particle size range can be tested
- particle bed breakage tests may be conducted
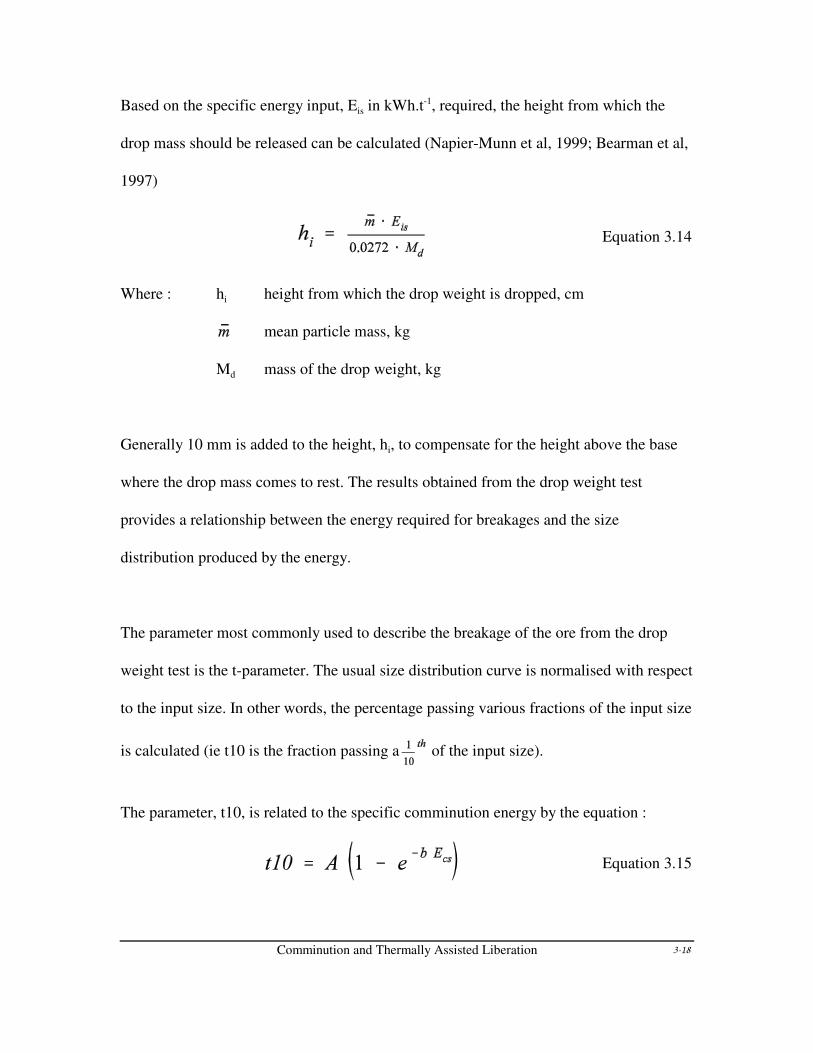
Comminution and Thermally Assisted Liberation 3-18
Equation 3.14
Equation 3.15
Based on the specific energy input, Eis in kWh.t-1, required, the height from which the
drop mass should be released can be calculated (Napier-Munn et al, 1999; Bearman et al,
1997)
Where : hi height from which the drop weight is dropped, cm
mean particle mass, kg
Md mass of the drop weight, kg
Generally 10 mm is added to the height, hi, to compensate for the height above the base
where the drop mass comes to rest. The results obtained from the drop weight test
provides a relationship between the energy required for breakages and the size
distribution produced by the energy.
The parameter most commonly used to describe the breakage of the ore from the drop
weight test is the t-parameter. The usual size distribution curve is normalised with respect
to the input size. In other words, the percentage passing various fractions of the input size
is calculated (ie t10 is the fraction passing a of the input size).
The parameter, t10, is related to the specific comminution energy by the equation :
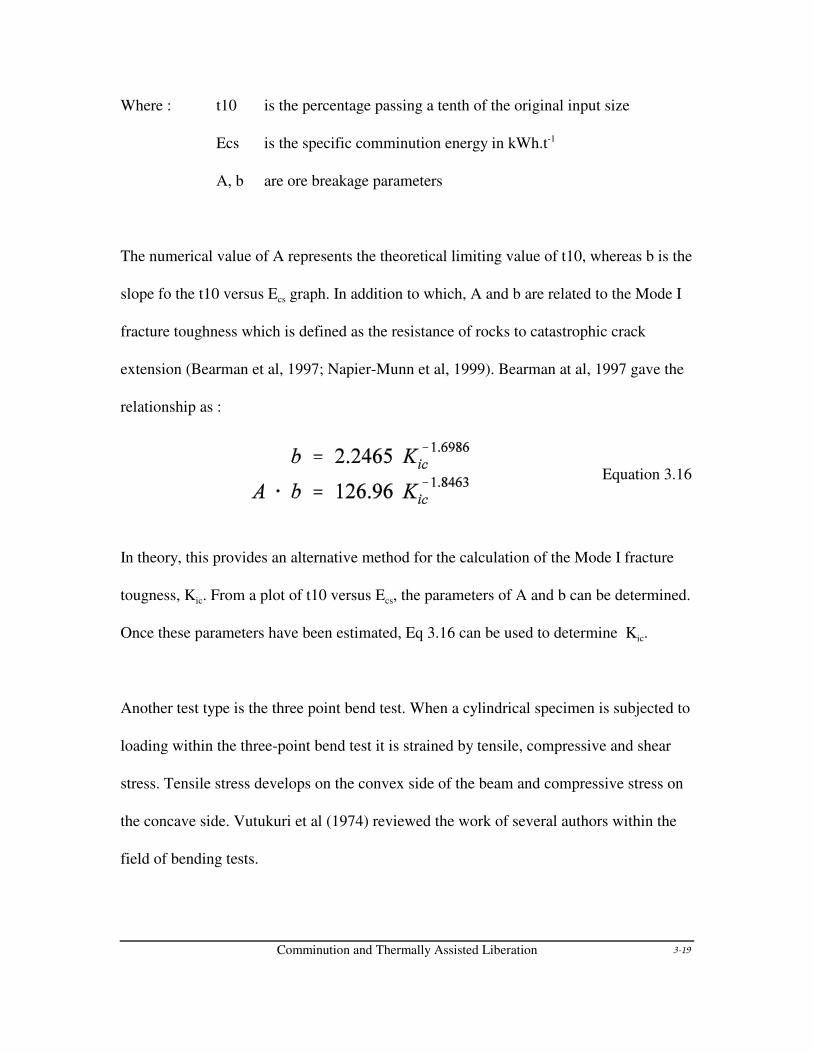
Comminution and Thermally Assisted Liberation 3-19
Equation 3.16
Where : t10 is the percentage passing a tenth of the original input size
Ecs is the specific comminution energy in kWh.t-1
A, b are ore breakage parameters
The numerical value of A represents the theoretical limiting value of t10, whereas b is the
slope fo the t10 versus Ecs graph. In addition to which, A and b are related to the Mode I
fracture toughness which is defined as the resistance of rocks to catastrophic crack
extension (Bearman et al, 1997; Napier-Munn et al, 1999). Bearman at al, 1997 gave the
relationship as :
In theory, this provides an alternative method for the calculation of the Mode I fracture
tougness, Kic. From a plot of t10 versus Ecs, the parameters of A and b can be determined.
Once these parameters have been estimated, Eq 3.16 can be used to determine Kic.
Another test type is the three point bend test. When a cylindrical specimen is subjected to
loading within the three-point bend test it is strained by tensile, compressive and shear
stress. Tensile stress develops on the convex side of the beam and compressive stress on
the concave side. Vutukuri et al (1974) reviewed the work of several authors within the
field of bending tests.
Comminution and Thermally Assisted Liberation 3-20
Numerous practical limitations existed in the test, such as wedging beneath the
concentrated loads, stress concentration at surface cracks and flaws, torsional stress
during the application of load and frictional forces between loading points and the
specimen surface. A high-speed image and thermal stress analysis has shown crack
propagation to initiate in the tensile area of the loaded specimen and the mechanism of
failure is not dependent upon such factors.
The test consists of cylindrical rock core specimens which are supported by two end
plates and diametrically applied load. The support and load plates are fabricated from
mild steel, in order not to induce excessive compressive and shear stresses within test
specimens at points of contact. This is necessary in ensuring that crack propagation
occurs in the convex side of the specimen, within the area of pure tension. The span of
the support platens can easily be adjusted, enabling a wide range of sample sizes to be
tested.
3.3) Thermally Assisted Liberation
3.3.1) Introduction
Thermally assisted liberation (T.A.L.) has been studied as a potential method to improve
liberation and comminution characteristics. Various authors (Walkiewicz et al, 1991;
Veasey and Wills, 1991; Walkiewicz, 1993; Tavares and King, 1996) studied this
phenomena and the results were positive.
Comminution and Thermally Assisted Liberation 3-21
Thermally assisted liberation is the process of cyclical heating and quenching of ore to
introduce fractures in the mineral lattice. As different minerals respond at different rates
to temperature changes (rate of expansion or contraction), differential stresses is created
at the grain boundaries. These localised stresses in the mineral lattice weakens the
structure of the mineral, thereby facilitating comminution as well as assisting in liberation
of mineral species.
The major disadvantage of conventional T.A.L. has always been the economics of the
process. Conventional furnaces and kilns require vast amounts of energy and/or fuel to
heat the entire particle. Wonnacott and Wills (1990) calculated the reduction in work
index of Cornish tin ore achieved by heating the ore to different temperatures. The cost of
heating the ore (based on the heat capacity of each constituent) was found to be between
364 pence per ton and 439 pence per ton, depending on the final temperature of the ore.
The reduction in required milling power was calculated to be 0.31 pence per ton.
3.3.2) Literature Review of TAL on Mineral Species
One of the most common gangue minerals is quartz. A large amount of studies have
therefore been devoted to determine the effect of temperature changes on quartz structure
(Tavares and King, 1995). It was found that thermal pretreatment alone did not have any
significant change on breakage strength of quartz. However, water quenching of quartz
after heating, had the effect of significantly reducing the strength (measured using an
ultra fast load cell) of the quartz.

Comminution and Thermally Assisted Liberation 3-22
Air quenching did not significantly affect the strength of the material. It was found that
quartz can accommodate temperature changes of up to 100°C/min (air cooling only
produced around 80°C/min. The rapid cooling rates associated with water quenching
(several hundred degrees Celsius per minute) produced intense cracking due to high
stresses.
The high stresses within the material structure is attributed to rapid contraction of the
outer layers of the quartz along with compression in the centre of the particle. Due to the
increased heat transfer coefficients of salt water, quenching in a 10% NaCl solution
further reduces the material strength.
It was found that the quartz particle size affects the efficiency of TAL as well. More
pronounced effects are observed for smaller particles. This indicates the very
disseminated nature of the microflaws produced during TAL.
The reduction in fracture energies of quartz have been attributed to " to $-quartz phase
inversion (at 573°C) with a volume change of 0.86%.
Significant effects on hematite particle strength were observed. Air quenching affected
particle strength but only marginally. However, fracture energies were reduced by up to
90% upon water quenching. The "-$ phase transformation may have contributed to the
weakening (Tavares and King, 1995).
Comminution and Thermally Assisted Liberation 3-23
Both iron and copper ore showed reductions in fracture energy of approximately 30%
following heating to 600°C and 800°C, respectively, and quenching (Tavares and King,
1995).
Wills et al, 1987, investigated thermally assisted liberation of cassiterite. It was found
that heat treatment at 650°C followed by quenching decreasing the grinding energy
requirement by up to 55%. However, this is off-set by the cost of heat treatment.
It was reported that an economic process, involving heat treatment would have to
improve recovery as well. An increase in recovery of only 1% in the case of tin from
South Crofty would make thermal pre-treatment an economical alternative.
Wonnacott and Wills (1990) investigated the effects of thermally assisted liberation of
cassiterite. It was reported that dense liquid analysis and shaking table separation failed to
determine an effect on processing. From photomicrography, a large number of
transgranular cracks were observed (see Fig 3.1). A possible explanation for the lack of
evidence for changes in metallurgical processing due to transgranular fracture have been
ascribed to the indiscriminate rod milling process.
Ôener and Äzbayo™lu, 1998, investigated the effect of thermal pre-treatment on the
grindability of ulexite (NaCaB5O9A8H2O) and colemanite (Ca2B6O11AH2O), reporting
changes in grinding characteristics for both minerals after thermal treatment in the
temperature range 200°C to 360°C.
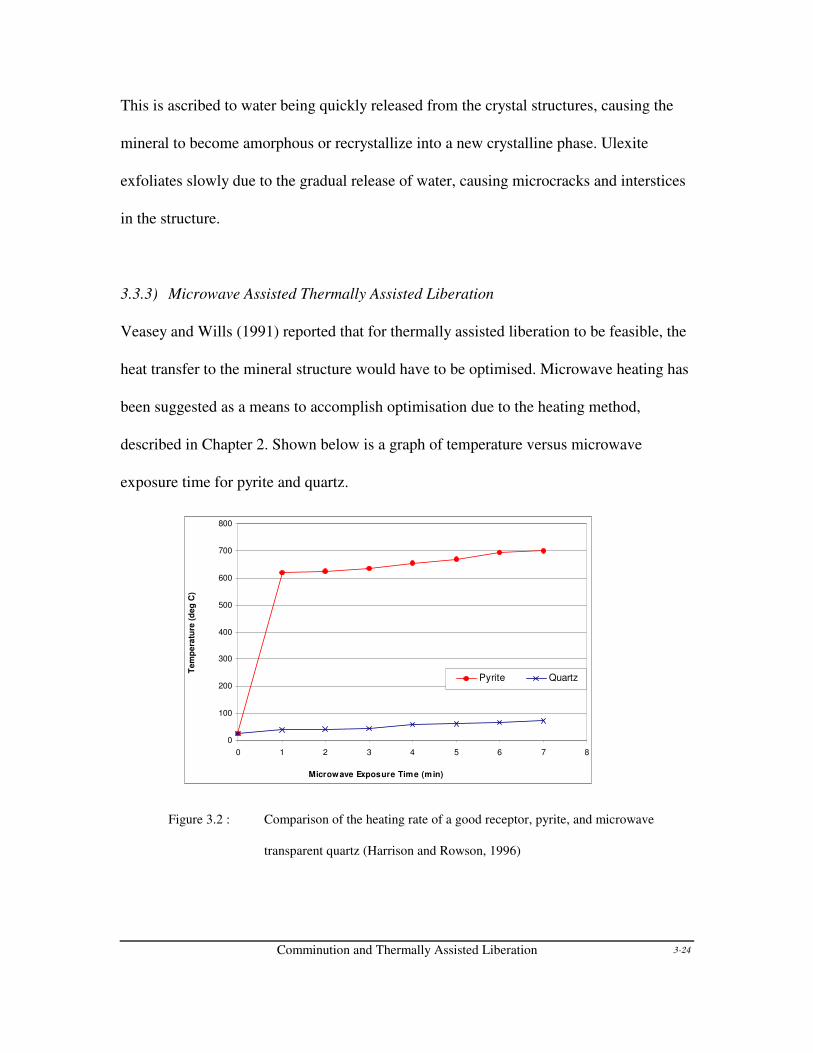
Comminution and Thermally Assisted Liberation 3-24
0
100
200
300
400
500
600
700
800
0 1 2 3 4 5 6 7 8
Microwave Exposure Time (min)
Te
mp
era
ture
(d
eg
C)
Pyrite Quartz
This is ascribed to water being quickly released from the crystal structures, causing the
mineral to become amorphous or recrystallize into a new crystalline phase. Ulexite
exfoliates slowly due to the gradual release of water, causing microcracks and interstices
in the structure.
3.3.3) Microwave Assisted Thermally Assisted Liberation
Veasey and Wills (1991) reported that for thermally assisted liberation to be feasible, the
heat transfer to the mineral structure would have to be optimised. Microwave heating has
been suggested as a means to accomplish optimisation due to the heating method,
described in Chapter 2. Shown below is a graph of temperature versus microwave
exposure time for pyrite and quartz.
Figure 3.2 : Comparison of the heating rate of a good receptor, pyrite, and microwave
transparent quartz (Harrison and Rowson, 1996)

Comminution and Thermally Assisted Liberation 3-25
Because of the different heating rates, of pyrite (value) and quartz (gangue), a mineral ore
consisting of these two species need only be exposed to microwave radiation for a short
interval to accomplish differential heating and therefore induce the necessary stresses at
the grain boundaries to weaken the mineral. Of added advantage is that most valuable
minerals are good microwave receptors, whereas gangue are typically transparent. No
bulk heating of the material is therefore necessary as is the case for conventional heating.
Güngör and Atalay, 1998, states that “to create cracks and micro-fractures at the mineral
grain, the ore must be composed of minerals which have different heating characteristics
when they are exposed to microwave radiation”.
Walkiewicz et al, 1988, reported on the advantages of thermally assisted liberation :
i) Fines Reduction in Downstream Processing
ii) Increases Ore Grinding
iii) Increased Liberation
iv) Reduced Plant Wear
Bonometti et al, 1998, reported on additional advantages such as volumetric heating
instead of surface absorption as is the case with conventional heating, uniform heating as
well as high heating rates. With the main disadvantage of T.A.L. being economic in
nature, microwave technology may offer a unique solution.
Application of Microwave Energy in Mineral Processing 4-1
CHAPTER 4
APPLICATION OF MICROWAVE ENERGY IN MINERAL PROCESSING
4.1) History of Industrial, Scientific, Medical and Domestic Applications of
Microwave Power
Research into industrial, scientific, medical and domestic (ISM&D) applications of
microwaves developed at slow rate (Stuchly et al, 1983). The first reference to the
industrial application of microwaves can be found in the patent literature around 1937 by
Kassner (Osepchuk, 1984), who suggested the use of microwaves to heat materials. This
idea was first commercially exploited by the Raytheon company in the 1940s. However,
the original units were bulky, heavy and expensive : the original microwave units sold by
the Raytheon Corporation in 1947 were 1.7 m tall, weighed over 340 kg costing just over
$5000 (Gallawa, 2000).
During 1973 a large number of publications appeared in the Journal of Microwave Power
relating to food processing in various countries (Schiffman, 1973; Meisel, 1973; Suzuki
and Oshima, 1973; Giles, 1973; Kase, 1973). The general finding of these articles are
that although the amount of research being carried out in this field is notably less than in
the telecommunications industry, some advances have been made and due to the
increasing labour cost and energy shortages of the era, microwaves became increasingly
attractive.
Application of Microwave Energy in Mineral Processing 4-2
The production of ceramics depend on heating a compacted powder to such temperatures
that sintering occurs, forming a dense, strong solid (McPherson, 1988). The conventional
process of heating the powder up slowly to the required temperature before allowing it to
cool down slowly, was carried out in kilns. It was realised that microwaves could be used
to achieve similar effects - albeit at a much faster rate. This would result in huge energy
savings, increasing yield and better quality control (Chablinksy, 1989, McPherson, 1988).
Agrawal (1999) reports on the use of microwave heating for sintering of ceramics,
composites, metals and transparent materials. It was found that microwaves offer an
alternative method for the sintering of tungsten-carbide composites. Microwaves have
advantages over the conventional methods as well, as they produce finer microstructures
and lower the sintering conditions. Although most metals are excellent reflectors of
microwaves at room temperature, in powdered form, most metals and alloys couple
extremely well with microwaves, producing sinters of improved quality. Slower sintering
times for ceramics have also been reported, with an acceptable quality.
Goldstein et al, 1999, studied the sintering of Al2O3/TiC powders in air. Reduced
sintering times have been achieved that can not be reproduced in a conventional system.
Scharz et al (1973) and Dalton (1973) respectively showed that microwaves may be
successfully applied in the vulcanization of rubber and in non-contact measurement in the
steel industry.
Application of Microwave Energy in Mineral Processing 4-3
Measurement devices which were developed include a Doppler-based length
measurement device, a thickness gauge and a blast furnace rangemeter (Dalton, 1973).
Many other uses have also been suggested ranging from agriculture to the textile and
paper industries (Stuchly et al, 1983; Chablinsky, 1989). Agricultural applications
includes insect control. Grain containing insects can be treated in a microwave heater,
killing the insects without damaging the grain (as insects and grain have different
dielectric loss factors).
Seeds with water impermeable seedcoats germinate late and have not developed
sufficiently by harvesting time. Irradiation of these seeds results in improved germination
without side-affects. Morozov et al, 1999, conducted experiments on the effect of
different band frequencies of microwave radiation on sowing properties and plant growth.
It was found that improvements on the seed germination as well as growth properties is
possible, with an increased carrot harvest of up to 16% is possible.
4.2) Applications of Microwaves in the Mineral Industry
Most of the industrial applications of microwave technology, excluding those in the
telecommunications industry, are based on heating of water molecules such as in
domestic microwave ovens. However, as Roddy (1986) states that “ovens and heaters for
industrial applications generally have to be custom made for the particular application”.
Large scale microwave heaters may be adequate for drying purposes as they have been
specifically designed for the dielectric properties for water, but the dielectric properties of
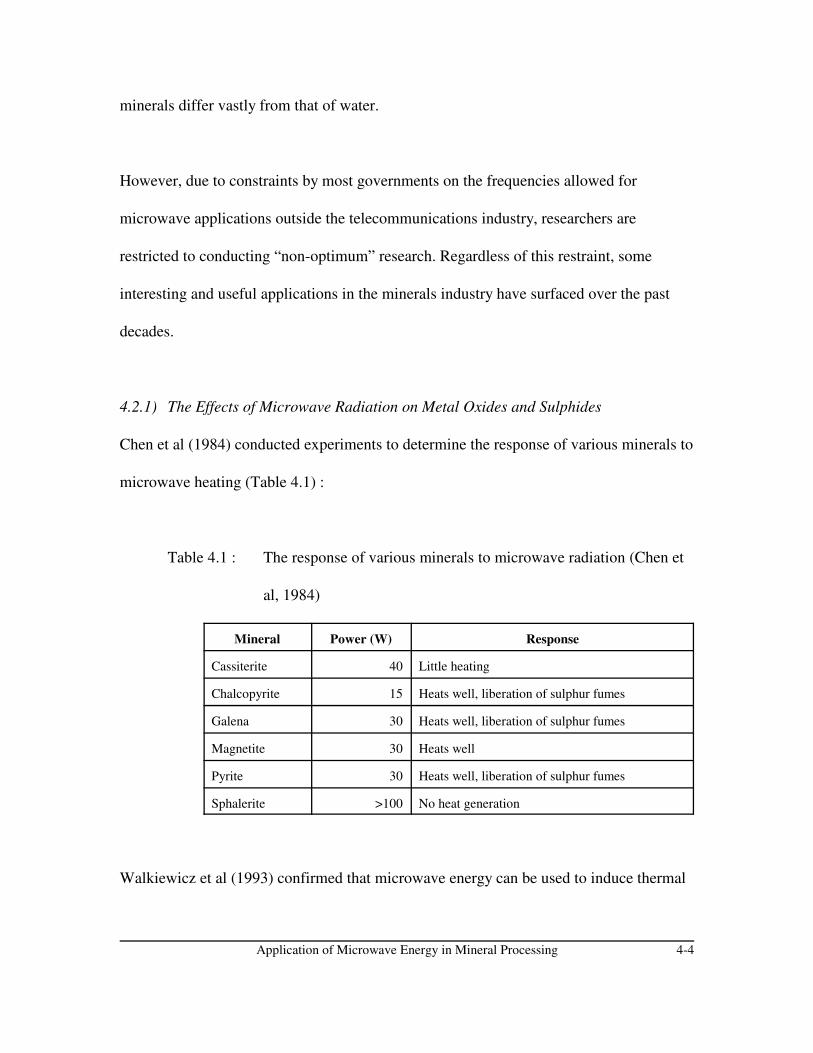
Application of Microwave Energy in Mineral Processing 4-4
minerals differ vastly from that of water.
However, due to constraints by most governments on the frequencies allowed for
microwave applications outside the telecommunications industry, researchers are
restricted to conducting “non-optimum” research. Regardless of this restraint, some
interesting and useful applications in the minerals industry have surfaced over the past
decades.
4.2.1) The Effects of Microwave Radiation on Metal Oxides and Sulphides
Chen et al (1984) conducted experiments to determine the response of various minerals to
microwave heating (Table 4.1) :
Table 4.1 : The response of various minerals to microwave radiation (Chen et
al, 1984)
Mineral Power (W) Response
Cassiterite 40 Little heating
Chalcopyrite 15 Heats well, liberation of sulphur fumes
Galena 30 Heats well, liberation of sulphur fumes
Magnetite 30 Heats well
Pyrite 30 Heats well, liberation of sulphur fumes
Sphalerite >100 No heat generation
Walkiewicz et al (1993) confirmed that microwave energy can be used to induce thermal

Application of Microwave Energy in Mineral Processing 4-5
stress cracking. Taconite was heated in a microwave chamber at 2.45 GHz at 3 kW. It
was found that the work index may be reduced at all tested bulk sample temperatures,
with a 13% decrease at 197°C.
It was also shown that the samples do not need to be heated to high temperatures. The
only requirement would be that the heating be rapid and selective.
Gasnier et al (1994) used a monomode microwave to conduct chemical synthesis
experiments on oxide and hydroxide powders. It was found that reduction and oxidation
occurs readily, but that the exposure time, volume of mineral powder, the dielectric
properties and microwave power play a vital role in the processes involved.
Tavares and King (1996) irradiated a sample of copper bearing ore. They found no
significant weakening of the ore, although a small amount of fracture along the grain
boundaries was observed.
Florek et al (1996a) found that microwave heating induces phase changes on the grain
boundaries of the minerals, which change in the magnetic properties of the mineral. It was
suggested that pyrite, chalcopyrite and carbonate siderite undergoes either oxidation or
sulphatization to form new phases which differ in magnetic susceptibility.
Kingman (1996) showed that the work index of Norwegian ilmenite can be reduced by
approximately 80% if the sample is quenched after 60 s of microwave treatment at 1.3
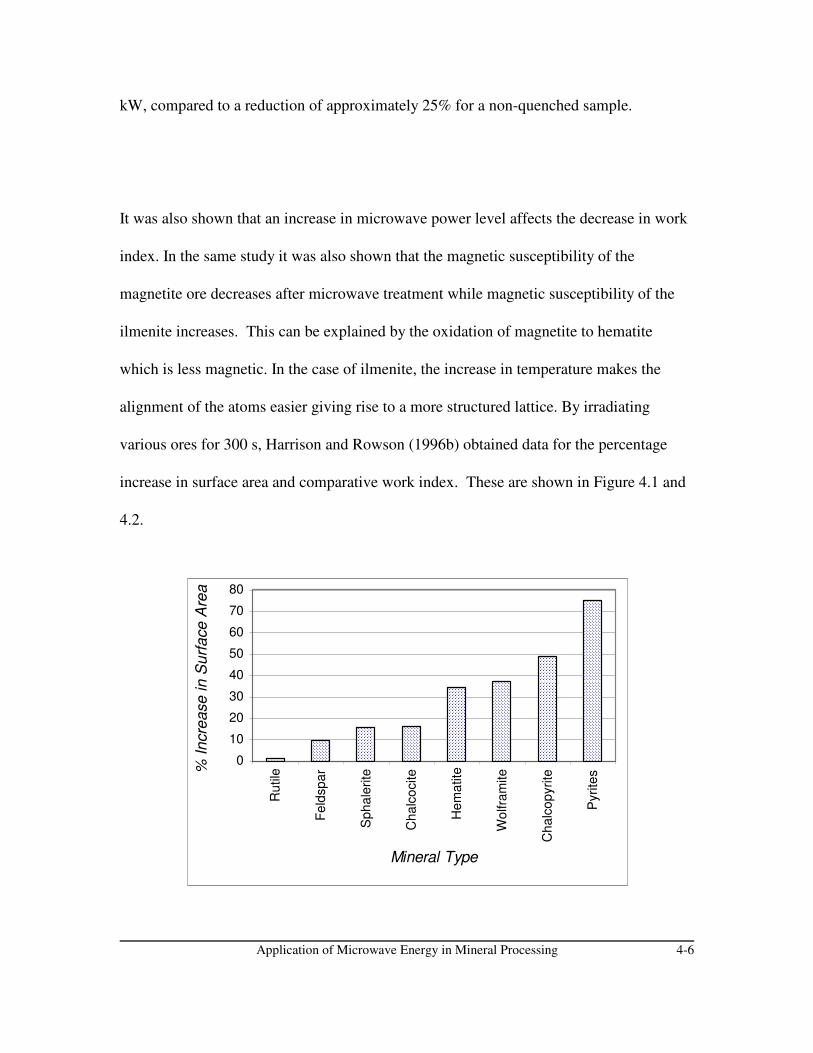
Application of Microwave Energy in Mineral Processing 4-6
0
10
20
30
40
50
60
70
80
Ru
tile
Fe
ldsp
ar
Sp
ha
lerite
Ch
alc
ocite
He
ma
tite
Wo
lfra
mite
Ch
alc
op
yrite
Pyrite
s
Mineral Type
% I
ncre
ase
in
Su
rfa
ce
Are
a
kW, compared to a reduction of approximately 25% for a non-quenched sample.
It was also shown that an increase in microwave power level affects the decrease in work
index. In the same study it was also shown that the magnetic susceptibility of the
magnetite ore decreases after microwave treatment while magnetic susceptibility of the
ilmenite increases. This can be explained by the oxidation of magnetite to hematite
which is less magnetic. In the case of ilmenite, the increase in temperature makes the
alignment of the atoms easier giving rise to a more structured lattice. By irradiating
various ores for 300 s, Harrison and Rowson (1996b) obtained data for the percentage
increase in surface area and comparative work index. These are shown in Figure 4.1 and
4.2.
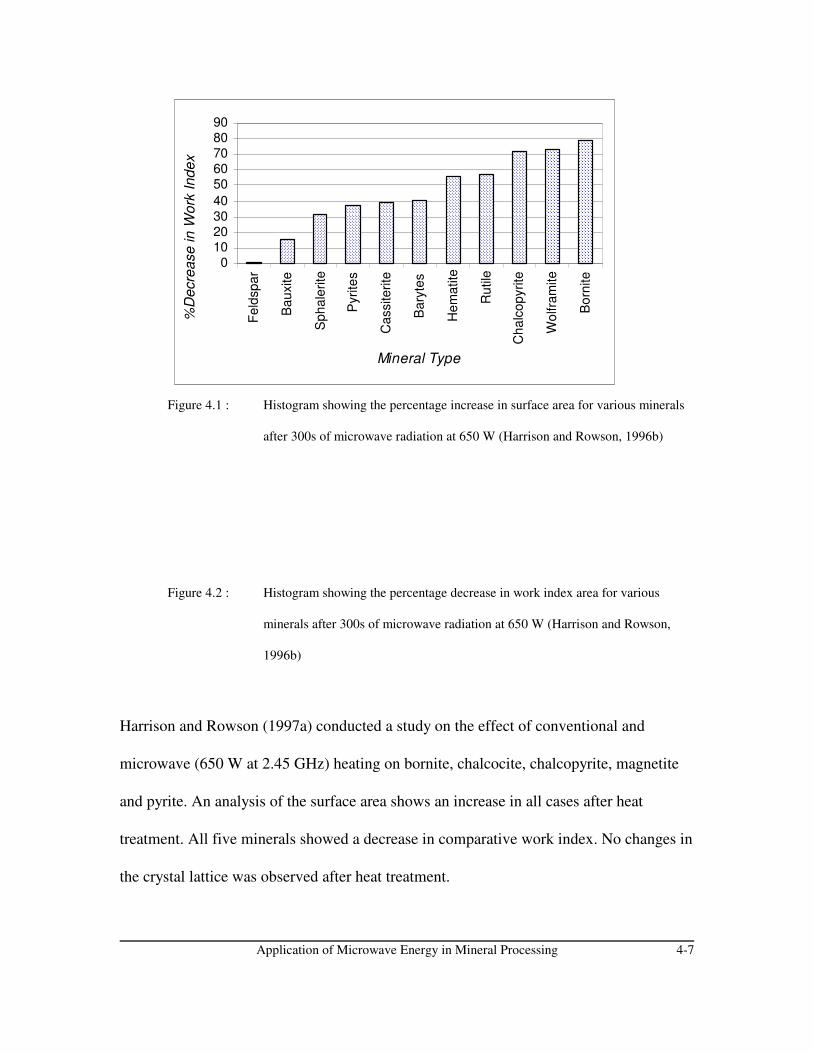
Application of Microwave Energy in Mineral Processing 4-7
010203040
5060708090
Fe
ldsp
ar
Ba
uxite
Sp
ha
lerite
Pyrite
s
Ca
ssite
rite
Ba
ryte
s
He
ma
tite
Ru
tile
Ch
alc
op
yrite
Wo
lfra
mite
Bo
rnite
Mineral Type
%D
ecre
ase
in
Wo
rk I
nd
ex
Figure 4.1 : Histogram showing the percentage increase in surface area for various minerals
after 300s of microwave radiation at 650 W (Harrison and Rowson, 1996b)
Figure 4.2 : Histogram showing the percentage decrease in work index area for various
minerals after 300s of microwave radiation at 650 W (Harrison and Rowson,
1996b)
Harrison and Rowson (1997a) conducted a study on the effect of conventional and
microwave (650 W at 2.45 GHz) heating on bornite, chalcocite, chalcopyrite, magnetite
and pyrite. An analysis of the surface area shows an increase in all cases after heat
treatment. All five minerals showed a decrease in comparative work index. No changes in
the crystal lattice was observed after heat treatment.
Application of Microwave Energy in Mineral Processing 4-8
An investigation into the magnetic properties of the minerals confirms the result by
Kingman (1996) that oxidation along the grain boundaries affect the magnetic
susceptibility. The results for conventional and microwave heating are similar, although
the changes occurs in a much shorter time period when microwaves are used.
Experiments were conducted on chalcopyrite (Florek et al, 1996a; Florek et al, 1997)
from RudÁany - which is not susceptible to magnetic treatment. However, after
microwave treatment at 750W for 40 s, the magnetic susceptibility was increased 100
fold. Analysis of the microwaved product confirmed the formation of new phases such as
maghemite and magnetite.
Joret et al, 1997, investigated the non-thermal effects of microwave radiation on the
dissolution rate of metal oxides (in particular Co3O4, and CeO2) in nitric acid. It was
found that microwave energy does not provide any activation for the dissolution
reactions, but only acts to heat up the solution. However, it was stated that this does in an
indirect way affect the activation of the reaction, as an increase in temperature,
accelerates the reaction.
Peng J and Liu C, 1992, report on the leaching kinetics of sphalerite with ferric chloride
in a microwave field. It was found that due to the fast rate of internal heating, the kinetics
of the leaching system is positively affected.
Application of Microwave Energy in Mineral Processing 4-9
4.2.2) Effects of Microwave Radiation on Coal
Rowson and Rice (1990) used a low power microwave (500W) to desulphurise coal.
It was found that although the pyrite (FeS2) was preferentially heated, the final
temperature reached was insufficient to convert the non magnetic pyrite to the magnetic
pyrrhotite.
However, mixing the coal with NaOH or KOH, resulted in a sufficient increase in
temperature to enhance the magnetic properties of the pyrite and to dissolve the pyrite and
organic sulphur, resulting in a reduction of sulphur content of approximately 70%.
Harrison and Rowson (1996a) showed that the comparative work index of coal can be
reduced by up to 30% in a 650W, 2.45 GHz microwave.
Harrison and Rowson (1996a) and Harrison and Rowson (1997b) showed that
conventional and microwave treatment of coal improves the grindability to a similar
extent. However, microwave treatment of coal has the added benefit of reducing the
sulphur and ash content as well as a safer, more controllable form of drying (Butcher and
Rowson, 1995; Harrison and Rowson, 1997b).
4.2.3) Effects of Microwave Radiation on Gold Processing
Woodcock et al (1989) investigated the effect of microwave radiation on various parts of
a gold processing circuit. Microwave radiation may be applied in the roasting phase to
remove the arsenic and sulphur. Mixing the concentrate with sodium hydroxide before
Application of Microwave Energy in Mineral Processing 4-10
microwave treatment resulted in the formation of various soluble salts of sulphur and
arsenic and a high recovery gold.
One of the most common methods for gold extraction is the carbon-in-pulp method,
where the gold is adsorbed onto the activated carbon. Adsorbed gold is then removed by
elution and the carbon treated in acid bath to remove contaminants before being
regenerated at approximately 660°C in a steam atmosphere. The re-activated carbon is
then returned to the CIP circuit.
Conventionally, activated carbon is regenerated in rotary kilns or vertical tube furnaces.
However, the granulated activated carbon can be easily heated by microwave radiation.
The advantages of microwave heating in this application is that the carbon may be heated
rapidly with better temperature control and possible energy savings (Bradshaw et al,
1998). Initial test work by Bradshaw et al (1998) indicates that microwave regeneration of
activated carbon is economically feasible and gives activated carbon with high abrasion
resistance.
4.2.4) The Effects of Microwave Radiation on Iron Production

Application of Microwave Energy in Mineral Processing 4-11
The reduction of iron ores is dependant on the surface area available for gas-solid contact
(Standish and Pramasunto, 1991; Xia and Pickles, 1997). Because of the differential
heating and subsequent stress cracking caused by microwave radiation of minerals and
the increase in surface area which results, microwave radiation may be applied in the
reduction of iron ore particles in a CO atmosphere.
It was found (Standish and Pramasunto, 1991) that microwave treatment at 1300 W for 6
minutes gives the optimum enhancement of reduction and that microwave pretreatment of
iron ore may be an alternative to sintering or pelletising.
Zhong et al, 1996, conducted experiments on the reduction of iron ore with coal in a 15
kW microwave cavity of volume 0.06 m3 in an inert nitrogen atmosphere to inhibit re-
oxidation of the iron.. It was found that microwave heating has the potential for
significantly reducing the reaction time compared to conventional heating. Comparing the
time required for 80% of the reduction to occur, the conventional case requires almost 30
min whereas the microwave case requires only 7.5 min, a reduction of more than 75%.
It is also stated that one of the major advantages of using microwaves is that the
microwave energy dissipates rapidly throughout the whole volume of the sample, heating
it directly, and not by conduction as is normally the case. The last of the advantages of
the application of microwave heating above conventional heating mentioned, is the fact
Application of Microwave Energy in Mineral Processing 4-12
that a dust free, high energy flue gas is produced.
4.3) Parameters Affecting Microwave Radiation
4.3.1) The Effect of Particle Size on Microwave Radiation
Standish (1989) conducted experiments in order to verify the effects of particle size on
the heating rate. It was found that particle size does in fact affect the heating rate,
although literature presents some contradictory results.
Walkiewicz et al (1991) treated Michigan magnetite, martitic hematite, specular hematite
and Minnesota taconite ores in a 2.45 GHz microwave at 3 kW. Optical evaluation of the
treated samples showed that stress cracking does occur in the iron ores after 25 s of
microwave treatment. It was also found that based on energy savings only, microwave
treatment is not cost effective.
However, a decrease in grindability, will result in less wear of the mill, mill liner and
milling medium. An increase in the mill throughput and decrease in the recycled ore will
also result.
Salsman et al (1996) showed the heating rate of sulfide ores to be directly proportional to
the mass of high loss material - indicating that shielding of mineral grains does not affect
the rate of microwave heating. It was also shown that the heating rate was directly
proportional to the grain size of the sulfide ores.

Application of Microwave Energy in Mineral Processing 4-13
4.3.2) The Effect of Microwave Power on Mineral Treatment
Dobson et al, 1992, conducted experiments with a variety of minerals to determine the
optimum frequency to heat different minerals. It was shown that minerals may have
specific frequencies where energy may be absorbed more efficiently. Because the
telecommunications industry utilises such a wide band of frequencies, ISM&D
applications have been restricted to frequencies of 915 MHz and 2.45 GHz, so it is
unlikely that the optimum microwave heating frequency for any mineral will ever be
utilised.
Worner et al (1989) reported that only approximately 70% of the electrical power input
into a microwave can be utilised. However, Worner et al (1989) considered that the many
advantages of microwave power outweigh the low electrical efficiency.
The advantages of microwave heating in the minerals industry include (Worner et al,
1989) :
S If minerals can be heated by microwave radiation, heating to very high
temperatures in a short period of time is possible.
S Generally, minerals couple better with microwaves as the temperature
increase.
S Lower bulk temperatures are required for high temperature reactions.
S Microwaves in the pyrometallurgical industry enables quick start-up and
shutdown which would assist in increasing the degree of control
Application of Microwave Energy in Mineral Processing 4-14
S Selective heating of mineral ores.
McGill et al (1988) conducted experiments to determine the effect of microwave power
level on the heating rate of minerals. It was found that, except for low-loss materials
(such as SiO2 and CaCO3 which does not heat well) or high loss materials (such as PbS or
Fe3O4 which heats extremely well), the heating rates increase with an increase in power
level.
4.4) Patents in the Mineral Processing Field Utilizing Microwave Technology
4.4.1) Microwave Treatment of Metal Bearing Ores and Concentrates
Tranquila (1996) filed a patent for “bringing about a metallurgical effect in a metal-
containing ore or concentrate” by treating the ore or concentrate in a microwave cavity
with a maximised electrical field strength in the region occupied by the ore.
Tranquila, 1996, states that the cavity and magnetron needs to be tuned to maximise the
electric field strength inside the ore or concentrate. In addition to this, it is mentioned that
in contrast to previous methods, this method seeks to minimise the energy dissipation in
the process while maximising the field strength in the cavity.
In short, the inventor proposes to process a “thin stream of said ore rapidly through a
Application of Microwave Energy in Mineral Processing 4-15
resonant microwave cavity”. The process will be able to treat ore with particles smaller
less than 6 mm in size and a concentrate containing particles smaller than 75µm. The
residence time of the ore/concentrate in the 50kW microwave unit will be around 6
seconds.
4.4.2) Apparatus and Method for Processing Dielectric Materials with Microwave
Energy
Haagensen et al, 1985, filed a patent for the continuous heating, drying, curing and de-
infesting a wide variety of materials. The process utilizes a number of tunable cavity
devices, fitted with a movable piston, arranged vertically with a dielectric conduit running
vertically through each cavity. The purpose of the movable piston is to tune the
microwave in each cavity to ensure the maximum possible efficiency. Various microwave
power levels and frequencies may be chosen for the best possible operation.
4.4.3) Process for the Recovery of Copper from its Ores
Kruesi et al, 1980, filed a patent for the recovery of copper from its ores in conventional
processes requiring heat, which is generated by microwave energy.

Application of Microwave Energy in Mineral Processing 4-16
Conventional mining and processing of copper ore, requires vast amounts of energy, as
the ore typically has to be ground very finely to ensure liberation. In addition to which,
the ore still has to be smelted or converted to copper. Many processes rely on the
oxidation of copper sulphide concentrates. Often, the copper sulphides are overlain by
mixed copper oxide, copper sulphide ore, in which case recovery of copper is difficult.
However, such ores may be treated with a chlorine ion donor, in the absence of air, to
form soluble copper chlorides from which copper recovery is easier. Kruesi et al, 1980,
proposes the use of microwave energy to heat the copper minerals to reaction
temperatures in order for the formation of water soluble chlorides.

Microwave Treatment of Neves Corvo Ore 5-1
CHAPTER 5
MICROWAVE TREATMENT OF NEVES CORVO ORE
(Appendix A : Somincor Trials is on the CD at the back of this thesis)
5.1) Introduction
Somincor Pty Ltd is located in the Iberian Pyrite Belt, in the Alentjo region of southern
Portugal, approximately 220 km southeast of Lisbon. The ore body, basically a massive
polymetallic sulphide body, was discovered in 1977 and is similar to other deposits in the
Pyrite Belt, but its high copper and tin grades make it unique (Byrne et al, 1995,
Somincor, 1994).
More than 150 000 tonnes of copper metal in a 25% copper concentrate are produced
annually from approximately 1.8 million tonnes of massive sulphide ore mined (Byrne et
al, 1995; Somincor, 1994).
Systematic exploration of the western parts of the Iberian Pyrite Belt began in 1972. This
led to the identification of several gravimetric anomalies. Analysis of the drill cores led to
the discovery of the Neves ore body in 1977, situated 350 m below the surface, and the
Corvo ore body, 500 m below the surface. During 1978 and 1979 identified the Graça and
Zambujal ore bodies. In 1988, the Lombador ore body was discovered.

Microwave Treatment of Neves Corvo Ore 5-2
The Neves-Corvo ore bodies can best be described as lenses of massive sulphides -
similar to the other deposits in the Pyrite Belt, but unique due to the high copper and tin
grades and the strong metal zonation.
The sulphide lens in the Corvo ore body is 30 m at depths of between 230 m and 800 m,
overlain by barren pyrite. Cassiterite, the main tin ore, is closely associated with the
copper ores. Zinc mineralization develops laterally to the southeast of the copper and tin
ores within the massive sulphide.
Linked to the Corvo by a “bridge” of continuous sulphide mineralisation, is the 80 m
thick Graça ore body at a depth of between 230 m and 450 m. Following the trend in
Corvo, massive sulphide tin ores occur through the copper ores.
The Neves ore body, consists of two lenses joined by a thin bridge. The maximum
thickness of the body is 55 m and is approximately 350 m below the surface. The
southern lens contains predominantly zinc ore with high lead, silver and copper grades,
underlain by tin bearing copper ore. The northern lens consists of predominantly copper
ore.
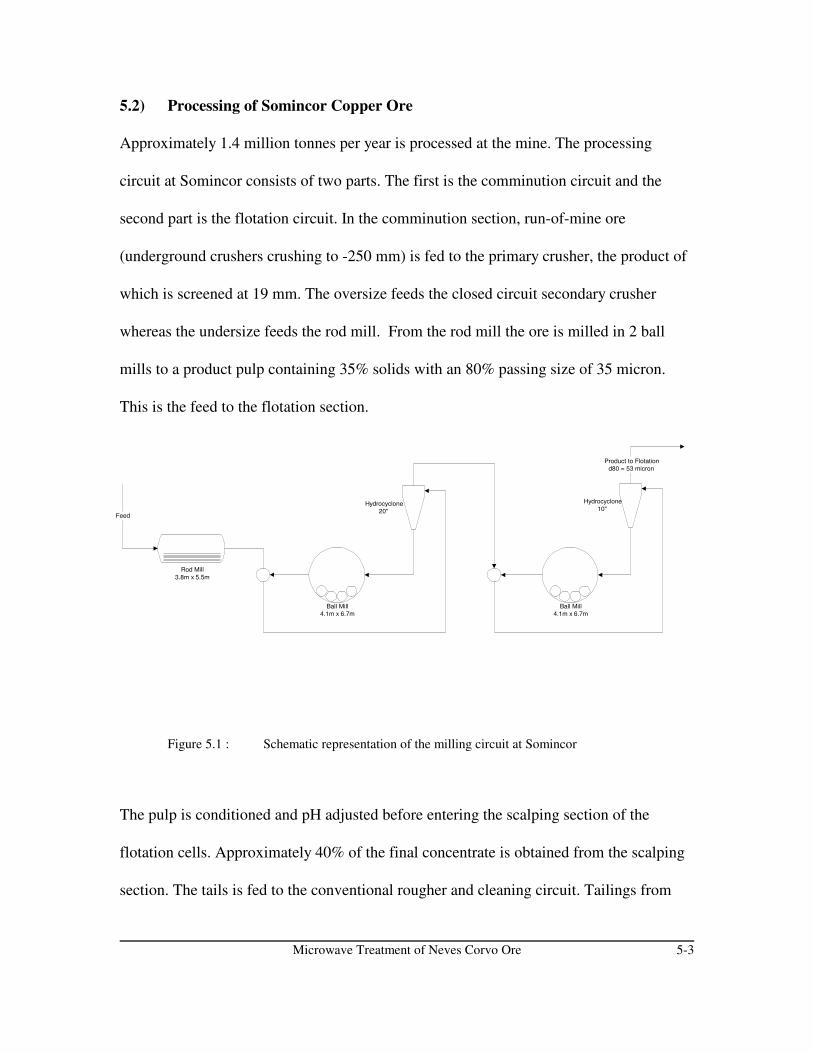
Microwave Treatment of Neves Corvo Ore 5-3
Ball Mill
4.1m x 6.7m
Ball Mill
4.1m x 6.7m
Hydrocyclone
20"
Hydrocyclone
10"
Rod Mill
3.8m x 5.5m
Feed
Product to Flotation
d80 = 53 micron
5.2) Processing of Somincor Copper Ore
Approximately 1.4 million tonnes per year is processed at the mine. The processing
circuit at Somincor consists of two parts. The first is the comminution circuit and the
second part is the flotation circuit. In the comminution section, run-of-mine ore
(underground crushers crushing to -250 mm) is fed to the primary crusher, the product of
which is screened at 19 mm. The oversize feeds the closed circuit secondary crusher
whereas the undersize feeds the rod mill. From the rod mill the ore is milled in 2 ball
mills to a product pulp containing 35% solids with an 80% passing size of 35 micron.
This is the feed to the flotation section.
Figure 5.1 : Schematic representation of the milling circuit at Somincor
The pulp is conditioned and pH adjusted before entering the scalping section of the
flotation cells. Approximately 40% of the final concentrate is obtained from the scalping
section. The tails is fed to the conventional rougher and cleaning circuit. Tailings from
Microwave Treatment of Neves Corvo Ore 5-4
the rougher is pumped to a thickener ahead of the scavenger.
The scavenger concentrate and tailings from the first cleaner are pumped to a regrind
section (2 closed circuit ball mills), producing a product of 80% passing size of 20
micron. This is fed to a separate circuit, the concentrate joining the rougher concentrate in
the cleaner circuit. The tailings join the rougher tail in the thickener and the scavenger tail
is pumped to the tailings dam.
Tin is also mined at the mine and after the initial crushing stage, the ores are each fed to
its own grinding and flotation circuits. Copper is also recovered from the tin processing
plant, but this is not in the scope of the current work.
At present, only the massive copper (MC) ore is mined. However, large massive copper
zinc (MCZ) deposits are present, but have yet to be mined and processed. Part of the
project is to quantify the effect of microwaves on the 2 different types of ore and the
effect on the processing. Therefore, a detailed mineralogical evaluation have been carried
out on representative samples of MC and MCZ material (by Rio Tinto Technical
Services).
5.3) Mineralogy of the MC and MCZ Ores
Even though the composition of the MC and MCZ material are similar, a mineralogical
examination on each is necessary. Small changes in mineralogy may result in a
Microwave Treatment of Neves Corvo Ore 5-5
completely different response to microwave radiation.
5.3.1) Mineralogy of the MC Ore
The MC material consists mainly of chalcopyrite (CuFeS2) and pyrite (FeS2) together with
lesser amounts of sphalerite (ZnS), galena (PbS), arsenopyrite (FeAsS), tin bearing phases
and gangue. Ferroan dolomite (ideally CaMg(CO3)2) and quartz (SiO2) comprises the bulk
of the transparent gangue in the head sample. These occur as discrete, euhedral crystals
that represent growth in open pore spaces, which have typically been filled by the more
common minerals such as chalcopyrite. This is shown in Figure 5.2A.
Pyrite is the major gangue mineral and typically occurs as sub rounded grains and
subhedral crystals, which may exhibit a degree of fracturing. These fractures are
commonly filled by chalcopyrite, galena or sphalerite, with chalcopyrite occurring along
the grain boundaries. The rounded pyrite grains and crystals occur within chalcopyrite
rich regions, indicating that the pyrite may have been subjected to a degree of dissolution
and replacement by the chalcopyrite, as is shown in Figure 5.2B.
The dominant ore mineral is chalcopyrite which occurs mainly along fractures and along
the grain boundaries of pyrite. Aggregates of chalcopyrite may exceed several millimetres
in diameter. The chalcopyrite has been subjected to a degree of recrystallization and
remobilization forming simple grain boundaries with galena, sphalerite and stannite
Microwave Treatment of Neves Corvo Ore 5-6
(Cu2FeSnS4). Where galena, sphalerite and stannite are present in minor amounts, they
occur as film like aggregates along the margins of chalcopyrite grains as is shown in
Figure 5.2C and 5.2D.
The dominant zinc bearing mineral is sphalerite, occurring as recrystallised aggregates
within chalcopyrite. The small amounts of lead present in this sample occur as fine-
grained, disseminated galena. The presence of discrete tin bearing phases is characteristic
of the Neves Corvo ores. These euhedral crystals and granular aggregates generally occur
as finely disseminated grains. The second common tin bearing mineral is stannite, which
may be locally abundant (Figure 5.2C). The main arsenic bearing mineral is arsenopyrite,
occurring as euhedral crystals exhibiting acicular and rhomb shaped morphologies. These
particles are fine grained with a small degree of dissolution and replacement by
chalcopyrite (Figure 5.2D).
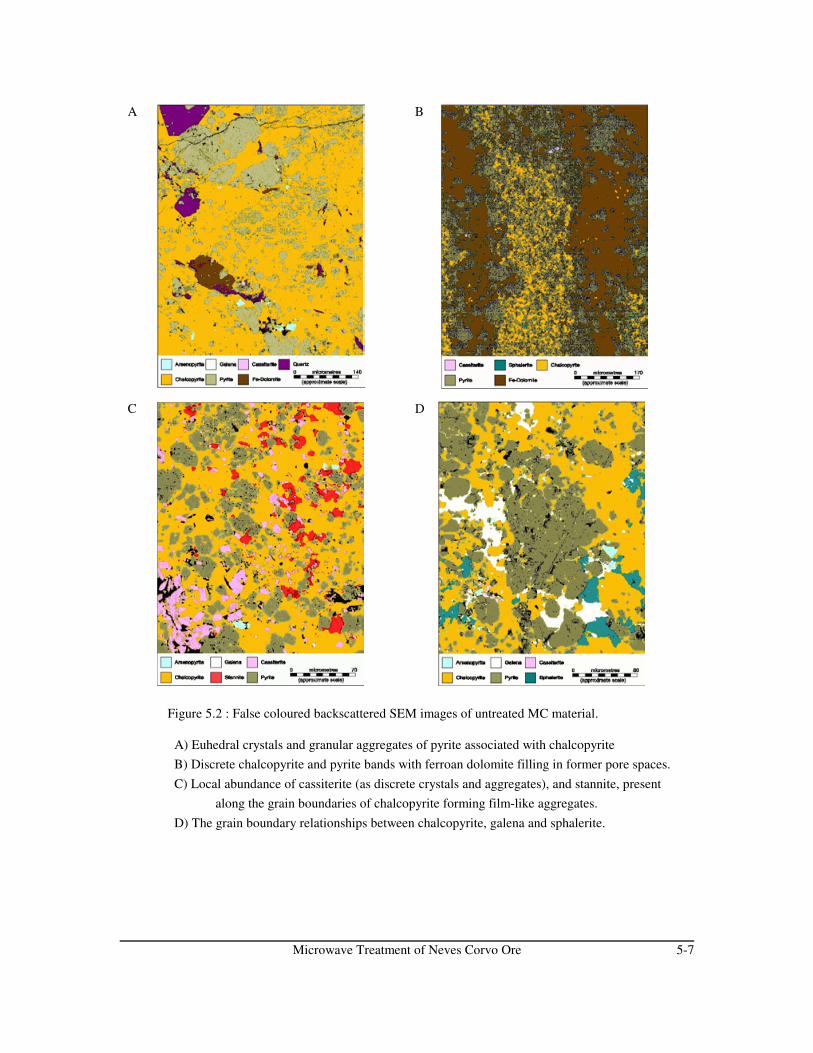
Microwave Treatment of Neves Corvo Ore 5-7
A B
C D
Figure 5.2 : False coloured backscattered SEM images of untreated MC material.
A) Euhedral crystals and granular aggregates of pyrite associated with chalcopyrite
B) Discrete chalcopyrite and pyrite bands with ferroan dolomite filling in former pore spaces.
C) Local abundance of cassiterite (as discrete crystals and aggregates), and stannite, present
along the grain boundaries of chalcopyrite forming film-like aggregates.
D) The grain boundary relationships between chalcopyrite, galena and sphalerite.

Microwave Treatment of Neves Corvo Ore 5-8
5.3.2) The Mineralogy of MCZ Ore
The general mineralogy of the material is similar to the massive sulphide ore discussed in
Section 5.3.1. However, the MCZ material is particularly rich in Zn and consists mainly
of pyrite and sphalerite with lesser amounts of chalcopyrite, galena, arsenopyrite and
transparent gangue. Trace amounts of cassiterite and members of the tetrahedrite-
tennantite solid solution series (ideally Cu12Sb4S13(Cu,Fe)12As4S13) are also present.
Siderite (FeCO3) and muscovite (KAl2(Si3Al)O10(OH)2) are present in minor quantities.
Muscovite is the dominant transparent gangue mineral, occurring as fine grained
micaceous aggregates often intimately intergrown with one or more of the sulphide
minerals (Fig 5.3A). Siderite typically occurs within the sulphide rich aggregates or in
association with the muscovite (Fig 5.3A).
Pyrite is the dominant gangue minerals and typically occurs as granular aggregates and
euhedral crystals (Fig 5.3A-D). The bulk of the pyrite have been subjected to some degree
of recrystallisation.. The pyrite is generally fine-grained in nature with discrete crystals
rarely exceeding 100µm in maximum dimension. The larger pyrite aggregates are
typically fine-grained with discrete crystals less than 50µm in size. These aggregates are
more abundant in former open pore spaces that have largely been filled by transparent
gangue, sphalerite, galena and chalcopyrite (Fig 5.3B). Pyrite may contain some fractures
which have been filled by one or more of chalcopyrite, galena and sphalerite.
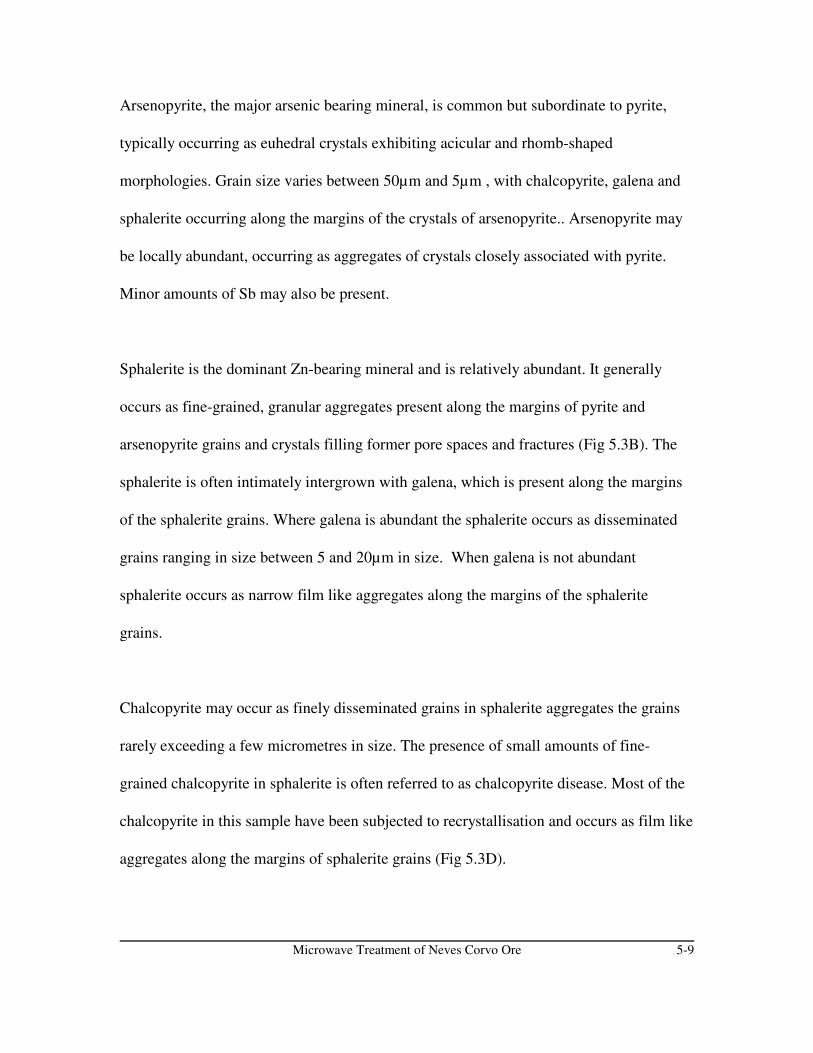
Microwave Treatment of Neves Corvo Ore 5-9
Arsenopyrite, the major arsenic bearing mineral, is common but subordinate to pyrite,
typically occurring as euhedral crystals exhibiting acicular and rhomb-shaped
morphologies. Grain size varies between 50µm and 5µm , with chalcopyrite, galena and
sphalerite occurring along the margins of the crystals of arsenopyrite.. Arsenopyrite may
be locally abundant, occurring as aggregates of crystals closely associated with pyrite.
Minor amounts of Sb may also be present.
Sphalerite is the dominant Zn-bearing mineral and is relatively abundant. It generally
occurs as fine-grained, granular aggregates present along the margins of pyrite and
arsenopyrite grains and crystals filling former pore spaces and fractures (Fig 5.3B). The
sphalerite is often intimately intergrown with galena, which is present along the margins
of the sphalerite grains. Where galena is abundant the sphalerite occurs as disseminated
grains ranging in size between 5 and 20µm in size. When galena is not abundant
sphalerite occurs as narrow film like aggregates along the margins of the sphalerite
grains.
Chalcopyrite may occur as finely disseminated grains in sphalerite aggregates the grains
rarely exceeding a few micrometres in size. The presence of small amounts of fine-
grained chalcopyrite in sphalerite is often referred to as chalcopyrite disease. Most of the
chalcopyrite in this sample have been subjected to recrystallisation and occurs as film like
aggregates along the margins of sphalerite grains (Fig 5.3D).
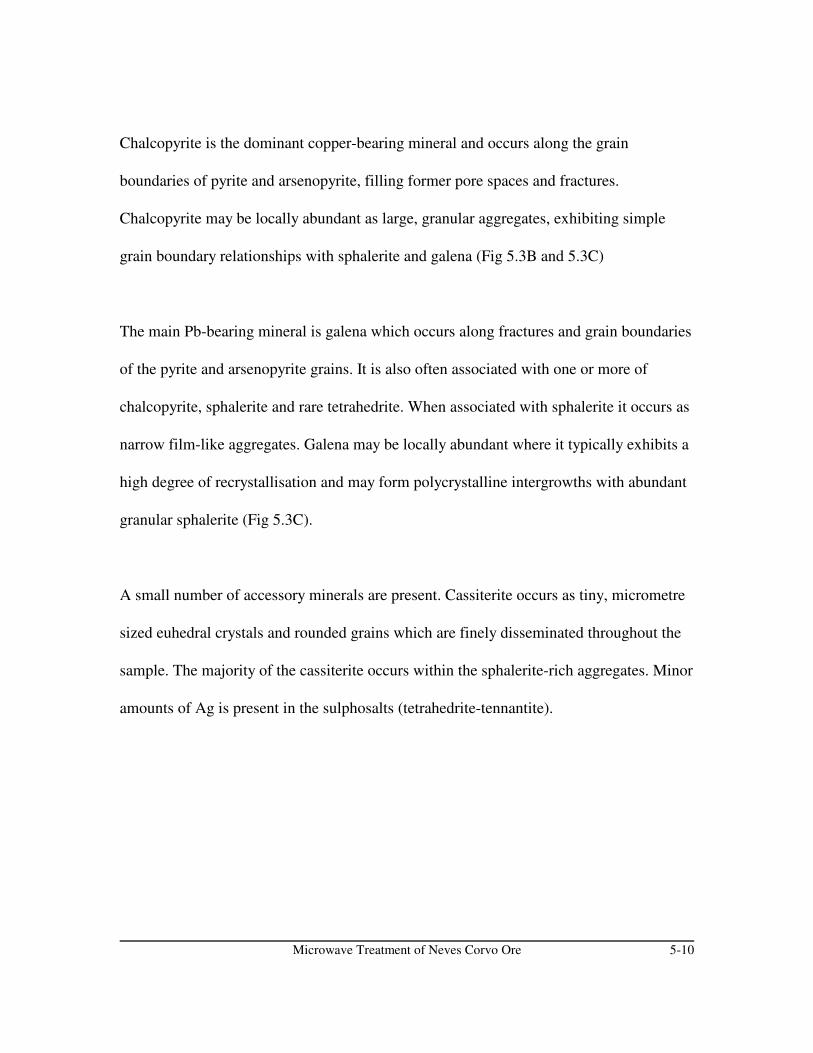
Microwave Treatment of Neves Corvo Ore 5-10
Chalcopyrite is the dominant copper-bearing mineral and occurs along the grain
boundaries of pyrite and arsenopyrite, filling former pore spaces and fractures.
Chalcopyrite may be locally abundant as large, granular aggregates, exhibiting simple
grain boundary relationships with sphalerite and galena (Fig 5.3B and 5.3C)
The main Pb-bearing mineral is galena which occurs along fractures and grain boundaries
of the pyrite and arsenopyrite grains. It is also often associated with one or more of
chalcopyrite, sphalerite and rare tetrahedrite. When associated with sphalerite it occurs as
narrow film-like aggregates. Galena may be locally abundant where it typically exhibits a
high degree of recrystallisation and may form polycrystalline intergrowths with abundant
granular sphalerite (Fig 5.3C).
A small number of accessory minerals are present. Cassiterite occurs as tiny, micrometre
sized euhedral crystals and rounded grains which are finely disseminated throughout the
sample. The majority of the cassiterite occurs within the sphalerite-rich aggregates. Minor
amounts of Ag is present in the sulphosalts (tetrahedrite-tennantite).

Microwave Treatment of Neves Corvo Ore 5-11
A B
C D
Figure 5.3 : False coloured back scattered SEM images of untreated MCZ material
A) The nature of muscovite and siderite present in pyrite-sphalerite-chalcopyrite rich rock
fragments
B-a) The presence of sphalerite and chalcopyrite along the margins of pyrite rich aggregates
B-b) A sphalerite rich area containing arsenopyrite and cassiterite.
C) Granular sphalerite rich areas with chalcopyrite and galena along the margins.

Microwave Treatment of Neves Corvo Ore 5-12
D) is a colour light reflected photomicrographs of film-like chalcopyrite along sphalerite grains.
5.4) Experimental Procedure
5.4.1) Investigation into the Effect of Microwave Radiation on Mineralogy
Experimental work started with the quantification of the effect of microwave radiation on
the mineralogy of Somincor copper ore. Samples of 50g were exposed to microwave
radiation for different time periods in a 1.5 kW monomode microwave unit. Although
further tests were conducted in a 2.6 kW multimode cavity, these small samples caused
severe arcing. This was overcome by using a water cooled magnetron and monomode
cavity. The 80% passing size of the MC and MCZ material was 6300µm and 5700µm
respectively.
5.4.2) Effect of Microwave Radiation on Grindability
Not all ores respond to microwave radiation in the same way (Kingman et al, 2000). To
determine whether the MC and MCZ material are affected by microwave radiation and to
quantify any possible changes in grindability, representative samples were exposed to
microwave radiation for different time periods. After the treatment, the samples were
water quenched and dried before being milled in a rod mill. From the size distributions
before and after grinding, the change in grindability may be assessed, using the Berry and
Bruce method (as discussed in Chapter 3).
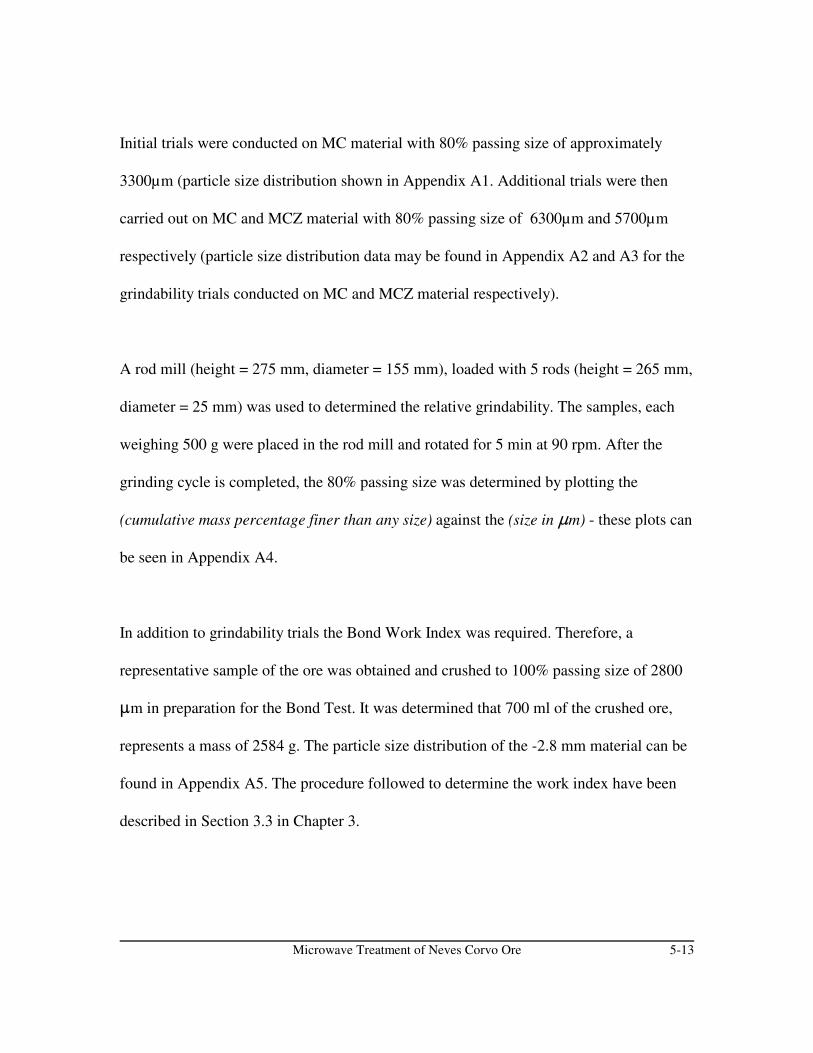
Microwave Treatment of Neves Corvo Ore 5-13
Initial trials were conducted on MC material with 80% passing size of approximately
3300µm (particle size distribution shown in Appendix A1. Additional trials were then
carried out on MC and MCZ material with 80% passing size of 6300µm and 5700µm
respectively (particle size distribution data may be found in Appendix A2 and A3 for the
grindability trials conducted on MC and MCZ material respectively).
A rod mill (height = 275 mm, diameter = 155 mm), loaded with 5 rods (height = 265 mm,
diameter = 25 mm) was used to determined the relative grindability. The samples, each
weighing 500 g were placed in the rod mill and rotated for 5 min at 90 rpm. After the
grinding cycle is completed, the 80% passing size was determined by plotting the
(cumulative mass percentage finer than any size) against the (size in :m) - these plots can
be seen in Appendix A4.
In addition to grindability trials the Bond Work Index was required. Therefore, a
representative sample of the ore was obtained and crushed to 100% passing size of 2800
:m in preparation for the Bond Test. It was determined that 700 ml of the crushed ore,
represents a mass of 2584 g. The particle size distribution of the -2.8 mm material can be
found in Appendix A5. The procedure followed to determine the work index have been
described in Section 3.3 in Chapter 3.

Microwave Treatment of Neves Corvo Ore 5-14
5.4.3) Effect of Microwave Radiation on Flotation Characteristics
Microwave radiation may reduce the flotability of the ore to such an extent that flotation
is no longer an economically viable concentrator option. Therefore, flotation trials were
conducted on the low zinc Somincor material to determine and quantify any reduction in
flotation efficiency.
In practice the 80% passing size of the ore for flotation is approximately 53 :m, with a
slurry pH of 10.5 (adjusted using calcium hydroxide). Byrne et al (1995) conducted
experiments using Aero3501 (Iso Amyl Diothiophosphate) and KAX (Potassium Amyl
Xanthate) as collectors and MIBC as frother. Various dosages was used to determine the
effect on reagent concentration and type on recovery. A brief summary of reagent type
and concentration is given in Table 5.1 :
Table 5.1 : Summary of collector concentration trials on Somincor ore (after
Byrne et al, 1995)
Collector and Concentration Conclusion
KAX 100 g/t
150 g/t
200 g/t
Aero3501 100 g/t
150 g/t
200 g/t
KAX gives higher Cu recoveries than Aero at the
same concentration. Aero may be better for
selective flotation of chalcopyrite. Stagewise
addition of collector is preferred due to the
separate production of 2 concentrate streams (high
and low antimony)
Microwave Treatment of Neves Corvo Ore 5-15
The samples to be used for flotation analysis were crushed to an 80% passing diameter of
53:m. A Denver batch flotation cell have been used for all experiments. Two and a half
litres of water was added to the three litre cell. The ore sample (450g) was the added to
the water and the stirrer switched on. The slurry was conditioned for three minutes to
allow for particle wetting - adjusting the pH to 10.5 using lime (plant practice). The
collector, KAX (Potassium Amyl Xanthate), was then added at a dose of 300 ppm and
two minutes extra was allowed for conditioning.
Five drops of the frother MIBC (Methyl IsoButyl Carbinol) were then added and the
slurry conditioned for one minute more. The air flow was turned on and the first
concentrate was then obtained by collecting the froth for one minute (keeping the water
level approximately constant). The second and third concentrate was obtained in the same
manner for the same time period. The air flow was then turned off, 300 ppm of collector
was added and the slurry left for two minutes for conditioning while the pH was
readjusted to 10.5. After two minutes, three more drops of MIBC was added as frother.
One minute more was then allowed for conditioning.
Scavenging was carried out for two minutes and the tails collected for three and a half
minute (by which time the froth was barren). For the MCZ material, the scavenging and
tail collection was combined for five minutes.
Microwave Treatment of Neves Corvo Ore 5-16
The collected froths were then filtered and dried overnight before being analysed for
copper content by acid digestion (Donaldson, 1973; Schoeler and Powel, 1955).
Representative samples (between 0.25 and 0.9 g each) were obtained from the dried
froths. Each sample was digested by 10mR of a 50% HNO3 solution on a hot plate until
only a dry pulp remained. The pulp was dissolved in 25 mR dilute (10%) HNO3 solution.
The resulting solution was diluted and analysed by atomic adsorption. The digestion trials
were the repeated to ensure repeatability of the method as well as accuracy. In addition,
selected samples were analysed independently by SGS Laboratories.
5.5) Results and Discussion
5.5.1) Effect of MW Radiation on Mineralogy
Effect of Microwave Radiation on the Mineralogy of MC Ore
The majority of grains in the 15s microwave-treated sample were not affected by the
radiation. A small number of pyrite grains have been altered to a Fe-S phase along the
boundaries (shown in Figure 5.4A). The Fe-S phase is a common alteration product of
pyrite according to the reaction :
Changes due to microwave radiation occurs mostly at the margins of the ore fragments. A
small number of chalcopyrite grains have undergone partial melting with the development
of gas cavities and an increase in Fe content. The increase in Fe content seems to be
related to the partial melting of the associated pyrite grains.
Microwave Treatment of Neves Corvo Ore 5-17
Higher power magnification of the partially melted chalcopyrite confirms that the altered
chalcopyrite is not homogenous but consists of tiny rounded grains of a Cu rich Fe-S
phase. At temperatures greater than 557°C chalcopyrite decomposes to form a mixture of
pyrite and a Cu-Fe-S solid solution (the intermediate solid solution). A number of pyrite
grains exhibit extensive replacement by the Fe-S phase (Figure 5.4A) Microwave
treatment for 45 seconds yields an increased number of altered particles. A large number
of ore fragments illustrates partial melting, extensive replacement and fracturing.
Generally, chalcopyrite-rich ore fragments undergoes either partial melting or fracturing
(Figure 5.4B).
A number of particles shows the development of bornite and covellite phases on the
margins of altered chalcopyrite-rich fragments (Figure 5.4C). After 75 s of microwave
radiation, extensive partial melting have occurred within the chalcopyrite aggregate.
These aggregates typically exhibit highly irregular morphologies and numerous gas
cavities. Relict sphalerite, galena, and stannite grains survive within these fragments. In
some cases stannite and sphalerite have been subjected to partial melting. A small
percentage of the dolomite has also been subjected alteration. Dolomite exhibits alteration
along the grain boundaries. Microwave radiation of the samples for 90s yields similar
products as in the case of 75s treatment, although the proportion of altered fragments are
slightly higher. Bornite and covellite alteration products are present in a number of
partially melted chalcopyrite-rich aggregates. A Si-rich glass phase was also observed
(Figure 5.4D).
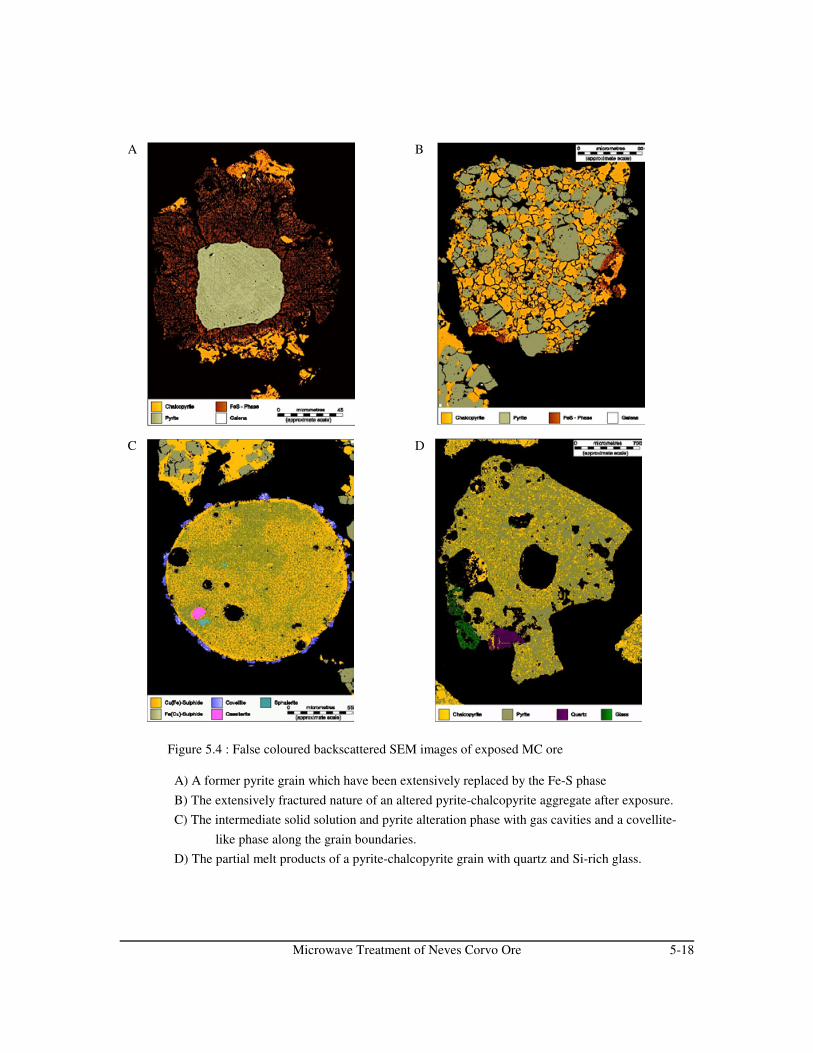
Microwave Treatment of Neves Corvo Ore 5-18
A B
C D
Figure 5.4 : False coloured backscattered SEM images of exposed MC ore
A) A former pyrite grain which have been extensively replaced by the Fe-S phase
B) The extensively fractured nature of an altered pyrite-chalcopyrite aggregate after exposure.
C) The intermediate solid solution and pyrite alteration phase with gas cavities and a covellite-
like phase along the grain boundaries.
D) The partial melt products of a pyrite-chalcopyrite grain with quartz and Si-rich glass.
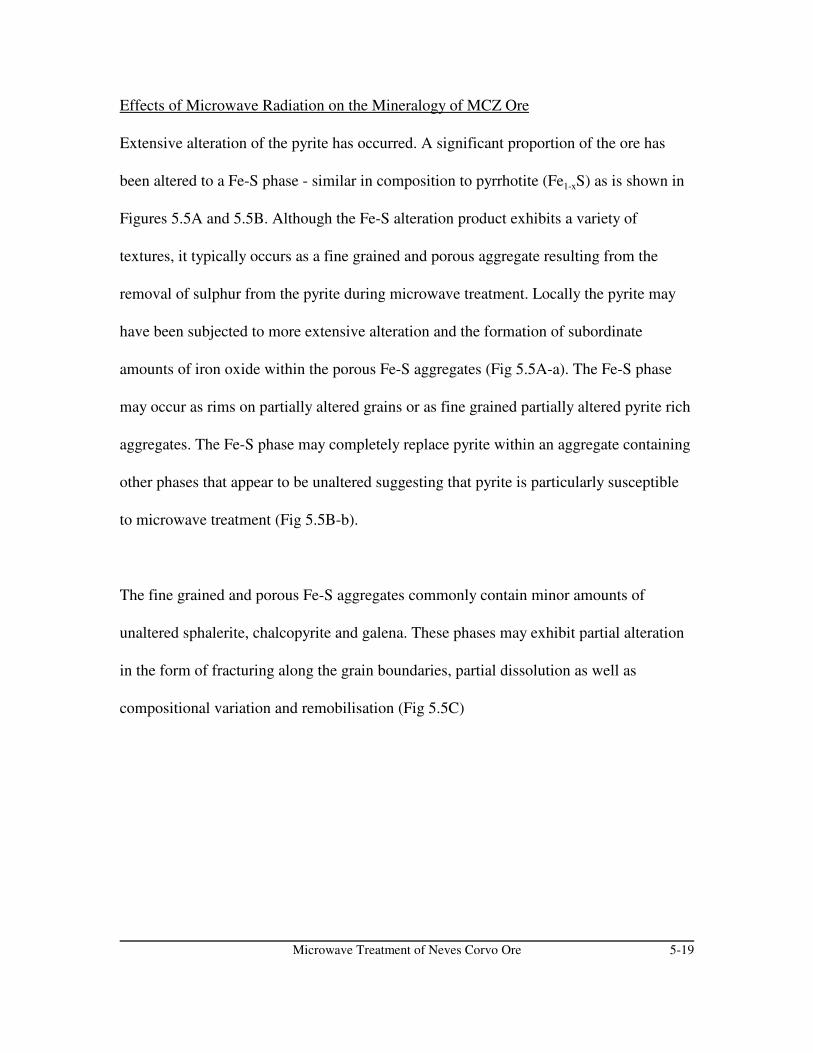
Microwave Treatment of Neves Corvo Ore 5-19
Effects of Microwave Radiation on the Mineralogy of MCZ Ore
Extensive alteration of the pyrite has occurred. A significant proportion of the ore has
been altered to a Fe-S phase - similar in composition to pyrrhotite (Fe1-xS) as is shown in
Figures 5.5A and 5.5B. Although the Fe-S alteration product exhibits a variety of
textures, it typically occurs as a fine grained and porous aggregate resulting from the
removal of sulphur from the pyrite during microwave treatment. Locally the pyrite may
have been subjected to more extensive alteration and the formation of subordinate
amounts of iron oxide within the porous Fe-S aggregates (Fig 5.5A-a). The Fe-S phase
may occur as rims on partially altered grains or as fine grained partially altered pyrite rich
aggregates. The Fe-S phase may completely replace pyrite within an aggregate containing
other phases that appear to be unaltered suggesting that pyrite is particularly susceptible
to microwave treatment (Fig 5.5B-b).
The fine grained and porous Fe-S aggregates commonly contain minor amounts of
unaltered sphalerite, chalcopyrite and galena. These phases may exhibit partial alteration
in the form of fracturing along the grain boundaries, partial dissolution as well as
compositional variation and remobilisation (Fig 5.5C)

Microwave Treatment of Neves Corvo Ore 5-20
Galena is mainly unaltered by microwave exposure except for the formation gas cavities
in larger ore fragments. In addition the galena have been subjected to some degree of
remobilisation and partial melting. The melted galena may cement together particles of
pyrite and sphalerite. Remobilisation may also cause the galena to fill in the fractures
along the grain boundaries of altered sphalerite and chalcopyrite aggregates.
Sphalerite, may exhibit a marked degree of fracturing occurring along the sphalerite grain
boundaries (Fig 5.5B). This is particularly evident in sphalerite-rich aggregates. The
fracturing may relate to the reduction in volume associated with the removal of sulphur
from the sphalerite during microwave treatment.
Chalcopyrite exhibits a wide range of textures indicative of microwave treatment. It may
occur as relatively unaltered grains within extensively altered pyrite aggregates. The bulk
of the chalcopyrite exhibits little or no partial melting - but partial melting may occur
with no change in textural or compositional evidence (Fig 5.5C). Fracturing along the
grain boundaries of the chalcopyrite is present in minor amounts.
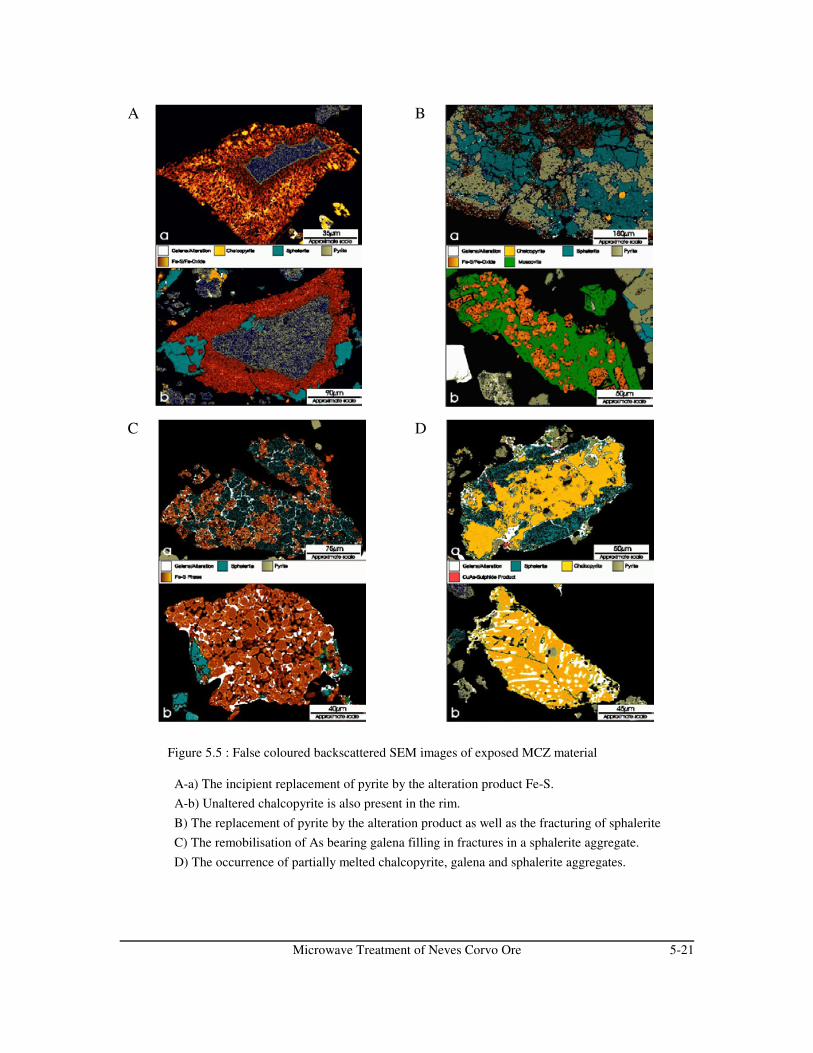
Microwave Treatment of Neves Corvo Ore 5-21
A B
C D
Figure 5.5 : False coloured backscattered SEM images of exposed MCZ material
A-a) The incipient replacement of pyrite by the alteration product Fe-S.
A-b) Unaltered chalcopyrite is also present in the rim.
B) The replacement of pyrite by the alteration product as well as the fracturing of sphalerite
C) The remobilisation of As bearing galena filling in fractures in a sphalerite aggregate.
D) The occurrence of partially melted chalcopyrite, galena and sphalerite aggregates.
Microwave Treatment of Neves Corvo Ore 5-22
A B C D E F G H
MILL FEED MILL DISCHARGE
1 2584.072 178.553 50 226.680 48.12656156 4.53 1039.96
2 226.668 15.663 200 305.15 289.487 1.45 746.82
3 305.15 21.085 250 580.11 559.025 2.24 345.45
4 580.11 40.084 300 658.44 618.356 2.06 292.45
5 658.44 45.497 325 782.56 737.063 2.27 230.21
6 782.56 54.07 312 767.38 713.31 2.29 236.74
7 767.38 55.747 312 806.78 751.033 2.41 220.29
8 806.78 51.79 304 749.52 697.73 2.30 244.76
9 749.52 50.864 305 736.12 685.256 2.25 251.04
10 736.12 50.864 304 731.32 680.456 2.24 253.34
% Circ LoadUndersize
(g/rev)
<75µM
Produced
<75µM
Present<75 µM (g)
New
feed (g)
Grinding
CycleRevs
5.5.2) Effect of Microwave Radiation on Grindability
Calculation of Bond Work Index
The -75 :m particles were removed after each grinding cycle (i.e. P1 = 75 :m in Eq 3.9).
Table 5.2 summarizes the data obtained for the work index (an Excel worksheet
containing the full set of results and calculations may be found in Appendix A6) :
Table 5.2 : The results of the Standard Bond Work Index Test for MC ore from
the Somincor Mine (green shaded cells show that the last three grinding
cycles gave similar circulating loads - as required for the calculation of the Bond
Work Index).
Using these values, a Bond work index of 9.7 kWh.t-1 was determined for the MC
material (using Equation 3.9). The accepted values on the plant is between 12 and 14
kWh.t-1.
Microwave Treatment of Neves Corvo Ore 5-23
Equation 3.11
The value determined does not fall in this range of values, however, as the work index
depends on the individual components of the ore body, it is thought that the sample used
to determine the work index was not a representative sample of the ore body. Due to the
grinding characteristics of the two material types - it took approximately te same time to
grind to the same particle size distribution - it was concluded that the work index of the
MC material is the same as that of the MCZ material.
The Effect of Microwave Radiation on MC and MCZ Ore
From the Berry and Bruce method discussed in Chapter 3, the relative work index may be
calculated from :
(where P and F refers to the product and feed 80% passing sizes). In this case, the
reference ore (indicated by the subscript r) is the untreated material and the test ore
(indicated by the subscript t) refers to the material exposed to microwave radiation. To
illustrate the effect of microwave radiation on the 80% passing size of the material, a plot
of cumulative fraction vs particle size (µm) is shown below :
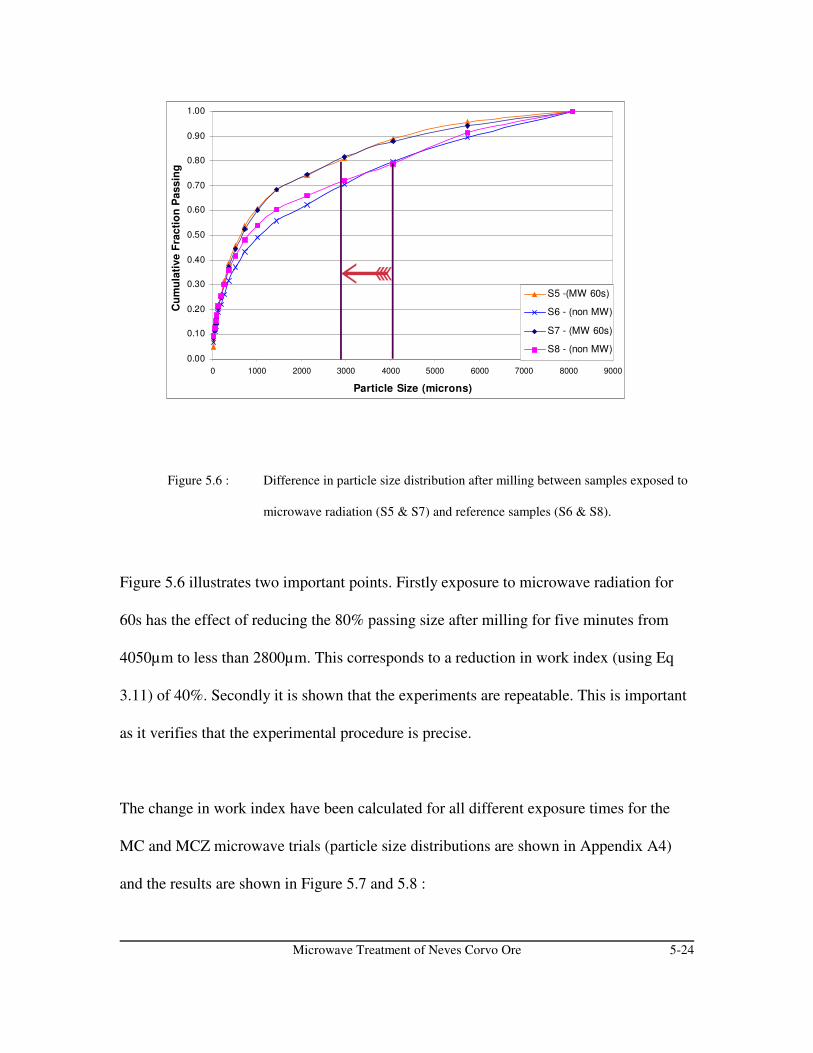
Microwave Treatment of Neves Corvo Ore 5-24
0.00
0.10
0.20
0.30
0.40
0.50
0.60
0.70
0.80
0.90
1.00
0 1000 2000 3000 4000 5000 6000 7000 8000 9000
Particle Size (microns)
Cu
mu
lati
ve
Fra
cti
on
Pa
ss
ing
S5 -(MW 60s)
S6 - (non MW)
S7 - (MW 60s)
S8 - (non MW)
Figure 5.6 : Difference in particle size distribution after milling between samples exposed to
microwave radiation (S5 & S7) and reference samples (S6 & S8).
Figure 5.6 illustrates two important points. Firstly exposure to microwave radiation for
60s has the effect of reducing the 80% passing size after milling for five minutes from
4050µm to less than 2800µm. This corresponds to a reduction in work index (using Eq
3.11) of 40%. Secondly it is shown that the experiments are repeatable. This is important
as it verifies that the experimental procedure is precise.
The change in work index have been calculated for all different exposure times for the
MC and MCZ microwave trials (particle size distributions are shown in Appendix A4)
and the results are shown in Figure 5.7 and 5.8 :
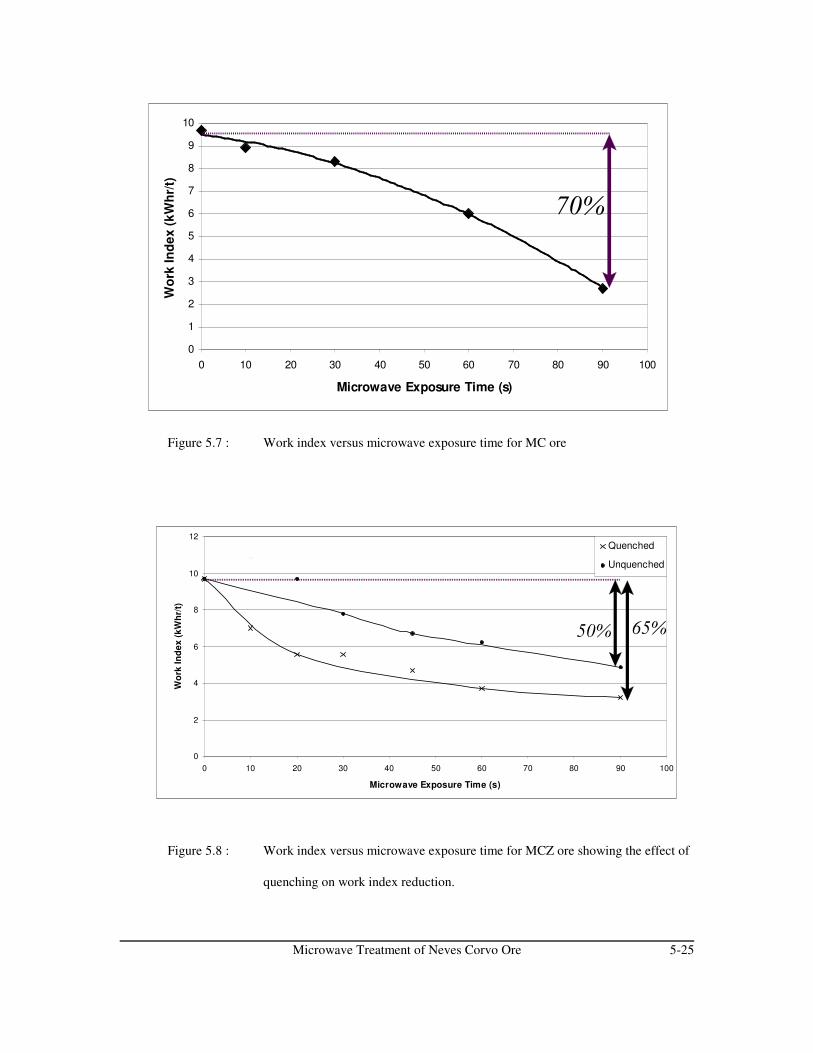
Microwave Treatment of Neves Corvo Ore 5-25
0
1
2
3
4
5
6
7
8
9
10
0 10 20 30 40 50 60 70 80 90 100
Microwave Exposure Time (s)
Wo
rk In
de
x (
kW
hr/
t)
0
2
4
6
8
10
12
0 10 20 30 40 50 60 70 80 90 100
Microwave Exposure Time (s)
Wo
rk I
nd
ex
(k
Wh
r/t)
Quenched
Unquenched
Figure 5.7 : Work index versus microwave exposure time for MC ore
Figure 5.8 : Work index versus microwave exposure time for MCZ ore showing the effect of
quenching on work index reduction.
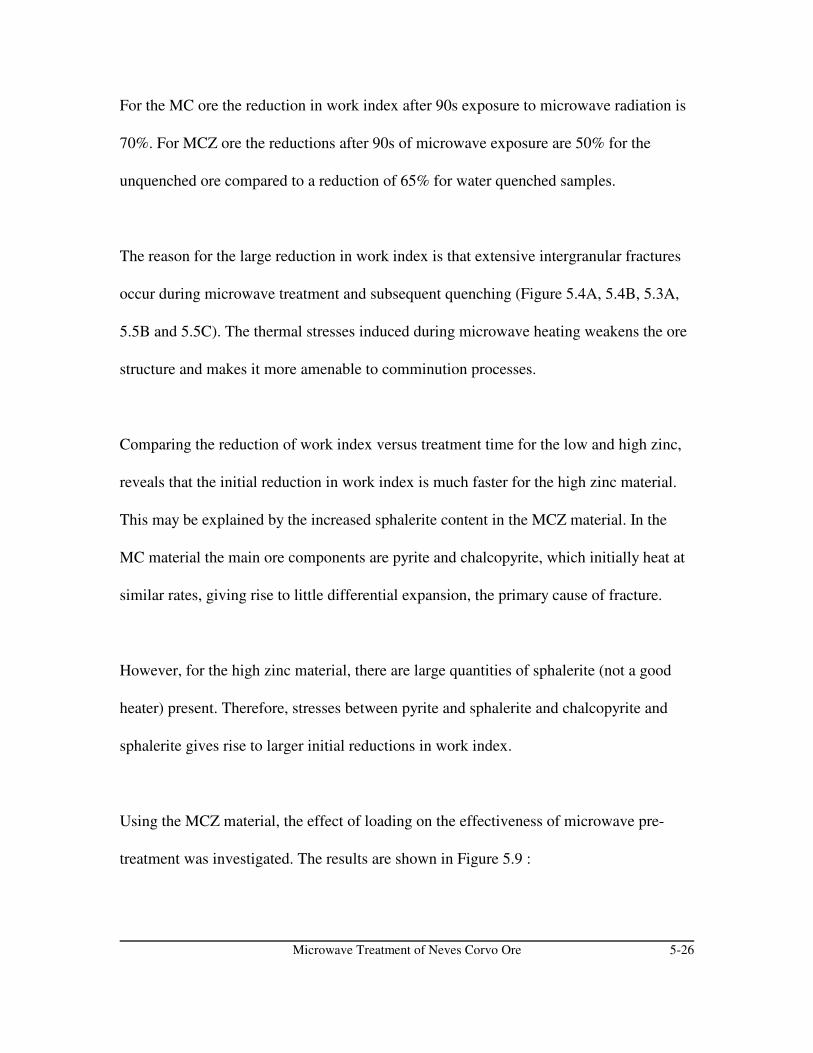
Microwave Treatment of Neves Corvo Ore 5-26
For the MC ore the reduction in work index after 90s exposure to microwave radiation is
70%. For MCZ ore the reductions after 90s of microwave exposure are 50% for the
unquenched ore compared to a reduction of 65% for water quenched samples.
The reason for the large reduction in work index is that extensive intergranular fractures
occur during microwave treatment and subsequent quenching (Figure 5.4A, 5.4B, 5.3A,
5.5B and 5.5C). The thermal stresses induced during microwave heating weakens the ore
structure and makes it more amenable to comminution processes.
Comparing the reduction of work index versus treatment time for the low and high zinc,
reveals that the initial reduction in work index is much faster for the high zinc material.
This may be explained by the increased sphalerite content in the MCZ material. In the
MC material the main ore components are pyrite and chalcopyrite, which initially heat at
similar rates, giving rise to little differential expansion, the primary cause of fracture.
However, for the high zinc material, there are large quantities of sphalerite (not a good
heater) present. Therefore, stresses between pyrite and sphalerite and chalcopyrite and
sphalerite gives rise to larger initial reductions in work index.
Using the MCZ material, the effect of loading on the effectiveness of microwave pre-
treatment was investigated. The results are shown in Figure 5.9 :

Microwave Treatment of Neves Corvo Ore 5-27
0
2
4
6
8
10
12
0 200 400 600 800 1000 1200 1400 1600
Sample Mass (g)
Wo
rk In
de
x (
kW
hr/
t)
Quenched
Unquenched
Figure 5.9 : Work index versus microwave exposure time for MCZ ore showing the effect of
loading during microwave exposure on work index reduction (exposure time in
all cases was 45s at 2.6 kW).
The observed trend, for both quenched and non-quenched material is a maximum
reduction in work index at 500g sample mass with progressively smaller reductions in
work index as the sample mass increase - with the smallest reductions for the case of non-
quenched material. The reduction in work index for the 250g in both cases are slightly
higher than the reduction for the 500g sample. The fact that the reduction in work index
decreases with an increase in mass loading, makes sense intuitively. More energy is
required to heat increased loads. The reason for the lower reduction in work index in the
case of the smallest sample size requires a closer look at the mineralogy of the samples
exposed to microwave radiation for prolonged periods of time.
Microwave Treatment of Neves Corvo Ore 5-28
Figures 5.4D and 5.5D illustrate partial melt products as well as the formation of a glass
phase (formed as a result of the melting of quartz). Both of these affects the strength of
the material. In addition, there is a critical mass associated with microwave treatment of
materials. At masses below a certain threshold mass, treatment becomes ineffective.
5.5.3) Effect of Microwave Radiation on Flotation Characteristics
The first result to be obtained from the flotation trials are the mass recovery per stage, as
shown in the graphs in Appendix A7. However, flotation efficiency is quantified by the
recovery of the valuable mineral, not by mass recovery alone. The copper content of each
stage of flotation was determined by acid digestion and atomic adsorption (results in
Appendix A8).
Shown in Figures 5.10 and 5.11, are plots of the copper recoveries versus flotation time
for a sample exposed to microwave radiation for 60s and a reference sample for the MC
material and quenched and unquenched copper recoveries after 45s microwave exposure
for the MCZ material :
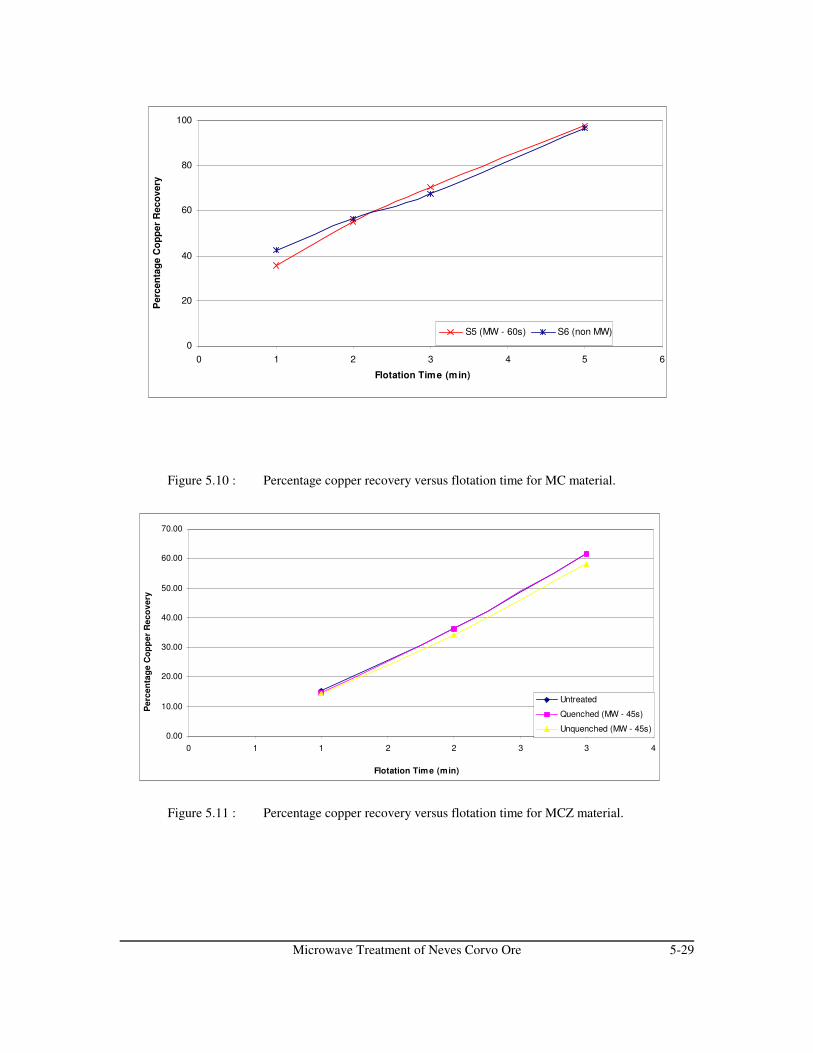
Microwave Treatment of Neves Corvo Ore 5-29
0
20
40
60
80
100
0 1 2 3 4 5 6
Flotation Time (min)
Perc
en
tag
e C
op
per
Reco
very
S5 (MW - 60s) S6 (non MW)
0.00
10.00
20.00
30.00
40.00
50.00
60.00
70.00
0 1 1 2 2 3 3 4
Flotation Time (min)
Pe
rce
nta
ge
Co
pp
er
Re
co
ve
ry
Untreated
Quenched (MW - 45s)
Unquenched (MW - 45s)
Figure 5.10 : Percentage copper recovery versus flotation time for MC material.
Figure 5.11 : Percentage copper recovery versus flotation time for MCZ material.

Microwave Treatment of Neves Corvo Ore 5-30
Figure 5.4C shows the formation of a covellite-like phase on the particle surface. Figure
5.4A and 5.5 A shows the formation of a Fe-S alteration product replacing the pyrite
phase. All these mineralogical changes suggest that the surface properties of the material
would have changed as well.
As flotation is a surface chemistry dependent process, it was initially thought that these
surface changes would affect the flotation characteristics of the ore. The results of
laboratory scale flotation trials have shown that this is not the case.
No significant effect on the copper grade after flotation can be observed. Microwave
exposure does not seem to affect the hydrophobicity of ore. This is of vital importance, as
even small changes on the flotability of an ore will significantly change the economics of
the process. Negative implications of microwave radiation on the flotability of the ore
would have voided any cost reductions in the grinding circuit.

Microwave Treatment of Neves Corvo Ore 5-31
5.6) Conclusion
The work index of the reference low zinc material was determined to be 9.7 kWh.t-1. The
variation from the accepted values of 12 and 14 kWh.t-1 indicates that the work index is
variable across the geological breadth of the ore deposit. If the material used during
laboratory testing have been mined at a different location or are not representative of the
ore body, the calculated work index of 9.7 kWh.t-1 will be feasible.
From the grindability trials, it is concluded that the material is responsive to microwave
radiation. For the MC ore the reduction in work index after 90s exposure to microwave
radiation is 70% (all MC-samples were quenched after microwave treatment, due to lack
of samples, these trials could not be repeated for the unquenched case). For MCZ ore the
reductions after 90s of microwave exposure are 50% for the unquenched ore compared to
a reduction of 65% for water quenched samples.
No significant effect on the copper grade after flotation can be observed. Microwave
exposure does not seem to affect the hydrophobicity of ore. This is of vital importance, as
even small changes on the flotability of an ore will significantly change the economics of
the process. Negative implications of microwave radiation on the flotability of the ore
would have voided any cost reductions in the grinding circuit.
Microwave Treatment of Neves Corvo Ore 5-32
The following papers regarding work in this chapter have been published/accepted for
publication :
1) “The effect of microwave radiation on the processing of Neves Corvo ore” by
Vorster, Kingman and Rowson in International Journal of Mineral Processing,
2001, vol 63, p 29-44.
2) “The influence of mineralogy on microwave assisted grinding” by Kingman,
Vorster and Rowson, Minerals Engineering, 2000, vol 13, no 3, pp 313-327,
Pergamon
3) “Applications of microwave radiation for the processing of minerals” by
Vorster, Kingman and Rowson in the Proceedings of the 9th SAICHE National
Meeting, 2000
These papers have been included in the back of this thesis, under the “Papers”-section.
In addition two presentations have been delivered regarding this work (both of these
presentations have been included on the CD at the back of this thesis) :
1) “The effect of microwave radiation on the processing of Neves Corvo ore” was
delivered at the UMIST Research Day in 1999 (umist99.exe)
2) “Applications of microwave radiation for the processing of minerals” was
delivered at the 9th SAICHE National Meeting in October 2000 (saiche00.exe)
The Effect of Microwave Radiation on Fe-Ti Ore From the Mambula Complex 6-1
CHAPTER 6
THE EFFECT OF MICROWAVE RADIATION ON FE-TI ORE FROM THE
MAMBULA COMPLEX
(Appendix B : Mambula Trials is on the CD at the back of this thesis)
6.1) Introduction
Richards Bay Minerals, RBM, was formed in 1976 to exploit the minerals wealth of the dunes
surrounding Richards Bay in south-eastern South Africa. It is jointly owned by Rio Tinto plc
(50%) and Billiton plc (50%).
The presence of relevant heavy metal minerals (for the production of Zircon, high purity iron and
titanium) in beach sand were first reported in the 1920's, but a detailed investigation of the 17 km
long, 2 km wide coastal area was only carried out in 1971. The mining rights to the Mambula ore
reserve (north and south of the original deposit) was acquired in 1985. Currently only beach sand
is commercially mined, using a dredge mining operation (RBM Ltd, 2000).
Original trials by RBM produced poor results for the recovery of ilmenite and high recoveries of
magnetite/titanium magnetite of the Mambula complex. Microwave radiation have been
suggested as a possible method for increasing the liberation of the granular ilmenite (RBM Ltd,
2000, Personal Communication : Kevin Pietersen, 2000).

The Effect of Microwave Radiation on Fe-Ti Ore From the Mambula Complex 6-2
The major minerals in the Fe-Ti ore from the Mambula complex are magnetite, ilmenite,
hematite and pleonaste (aFe-Mg spinel) with clinochlore (a chlorite), magnesiohastingsite (a
Ti-bearing Amphibole), diaspore (Al-oxyhydroxide) comprising the minor mineral component of
the ore body. Trace Minerals consists of gahnite (Zn-spinel), akermanite (CaMg-silicate),
periclase (MgO) and pyrrhotite (Fe-sulphide). The ilmenite grade of the ore is between 23% and
30% (14-15% TiO2) with between 60 and 65% iron oxides. Some of the magnetite contains up to
2% TiO2, this may be due to lamellae, and also due to some substitution of TiO2 into
magnetite/hematite (i.e. titano-magnetite) (Personal Communication Kevin Pieterse, 2000).
The main liberation required is that of the granular ilmenite from the granular spinel and
magnetite. The lamellae and inclusions of magnetite and spinel need not be liberated from the
ilmenite. To date only 80% liberation of the ilmenite has been achieved by conventional
processing.
6.2) Mineralogy
Two types of material from the Mambula complex have been examined. The first type of
material (Referred to as S1) is light grey in colour with little or no oxidation and replacement by
hematite. The second type of material (referred to as S2) is darker in colour with a higher degree
of oxidation as well as evidence of secondary iron-oxides/hydroxides on the surface of ore
fragments. Figure 6.1 illustrates the difference in appearance between the 2 samples.
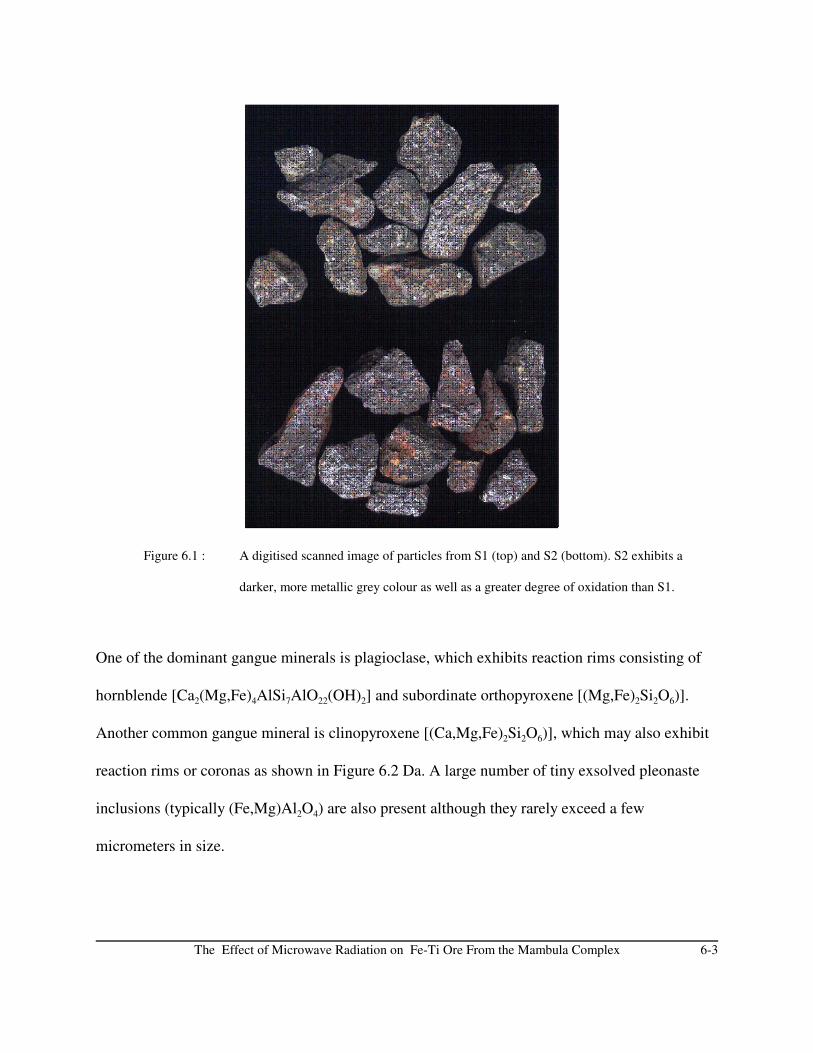
The Effect of Microwave Radiation on Fe-Ti Ore From the Mambula Complex 6-3
Figure 6.1 : A digitised scanned image of particles from S1 (top) and S2 (bottom). S2 exhibits a
darker, more metallic grey colour as well as a greater degree of oxidation than S1.
One of the dominant gangue minerals is plagioclase, which exhibits reaction rims consisting of
hornblende [Ca2(Mg,Fe)4AlSi7AlO22(OH)2] and subordinate orthopyroxene [(Mg,Fe)2Si2O6)].
Another common gangue mineral is clinopyroxene [(Ca,Mg,Fe)2Si2O6)], which may also exhibit
reaction rims or coronas as shown in Figure 6.2 Da. A large number of tiny exsolved pleonaste
inclusions (typically (Fe,Mg)Al2O4) are also present although they rarely exceed a few
micrometers in size.
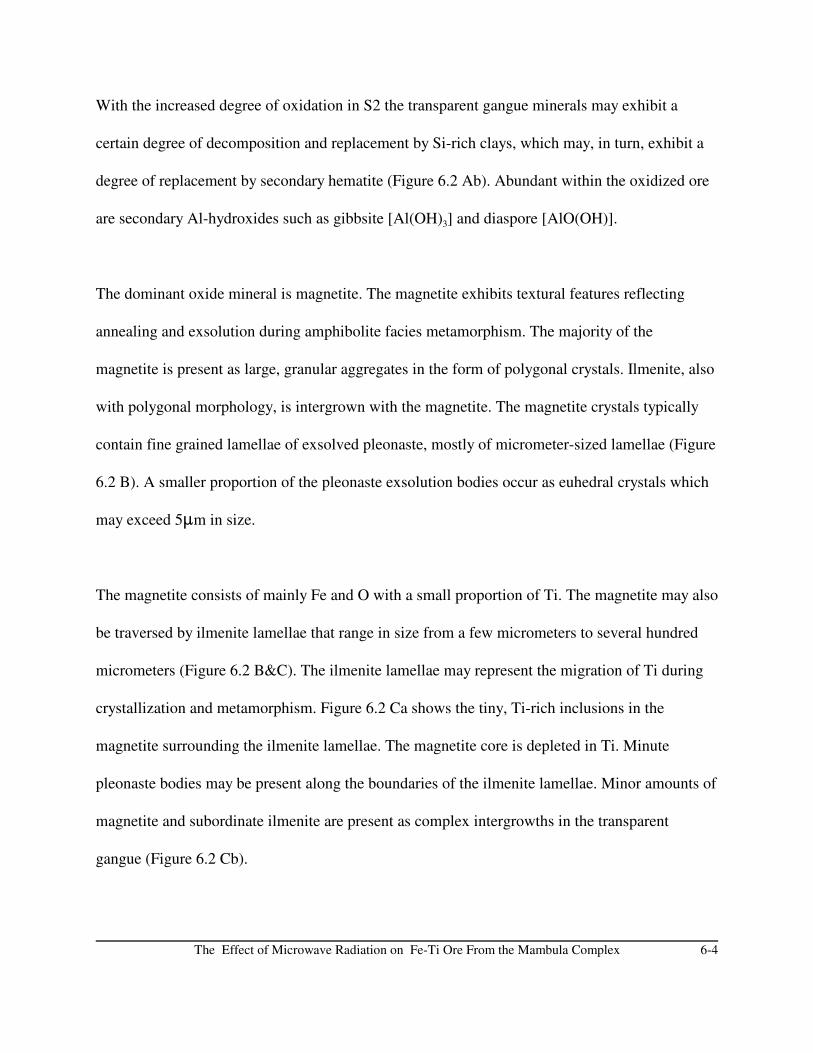
The Effect of Microwave Radiation on Fe-Ti Ore From the Mambula Complex 6-4
With the increased degree of oxidation in S2 the transparent gangue minerals may exhibit a
certain degree of decomposition and replacement by Si-rich clays, which may, in turn, exhibit a
degree of replacement by secondary hematite (Figure 6.2 Ab). Abundant within the oxidized ore
are secondary Al-hydroxides such as gibbsite [Al(OH)3] and diaspore [AlO(OH)].
The dominant oxide mineral is magnetite. The magnetite exhibits textural features reflecting
annealing and exsolution during amphibolite facies metamorphism. The majority of the
magnetite is present as large, granular aggregates in the form of polygonal crystals. Ilmenite, also
with polygonal morphology, is intergrown with the magnetite. The magnetite crystals typically
contain fine grained lamellae of exsolved pleonaste, mostly of micrometer-sized lamellae (Figure
6.2 B). A smaller proportion of the pleonaste exsolution bodies occur as euhedral crystals which
may exceed 5:m in size.
The magnetite consists of mainly Fe and O with a small proportion of Ti. The magnetite may also
be traversed by ilmenite lamellae that range in size from a few micrometers to several hundred
micrometers (Figure 6.2 B&C). The ilmenite lamellae may represent the migration of Ti during
crystallization and metamorphism. Figure 6.2 Ca shows the tiny, Ti-rich inclusions in the
magnetite surrounding the ilmenite lamellae. The magnetite core is depleted in Ti. Minute
pleonaste bodies may be present along the boundaries of the ilmenite lamellae. Minor amounts of
magnetite and subordinate ilmenite are present as complex intergrowths in the transparent
gangue (Figure 6.2 Cb).
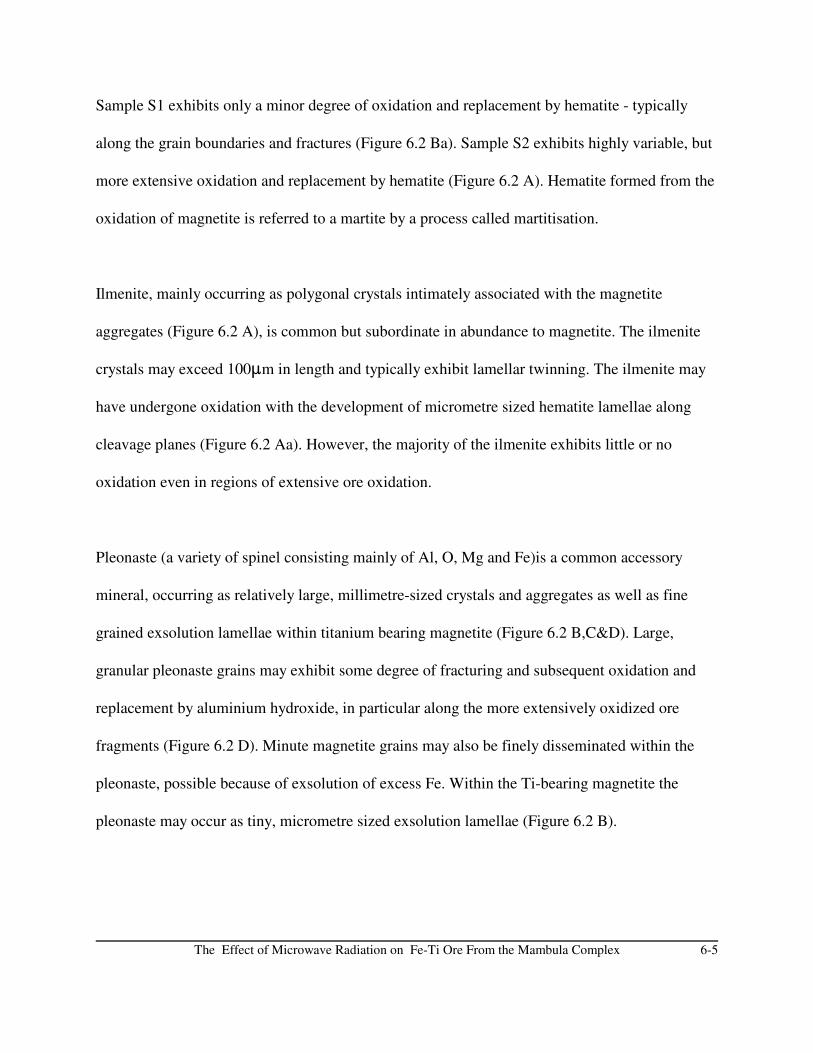
The Effect of Microwave Radiation on Fe-Ti Ore From the Mambula Complex 6-5
Sample S1 exhibits only a minor degree of oxidation and replacement by hematite - typically
along the grain boundaries and fractures (Figure 6.2 Ba). Sample S2 exhibits highly variable, but
more extensive oxidation and replacement by hematite (Figure 6.2 A). Hematite formed from the
oxidation of magnetite is referred to a martite by a process called martitisation.
Ilmenite, mainly occurring as polygonal crystals intimately associated with the magnetite
aggregates (Figure 6.2 A), is common but subordinate in abundance to magnetite. The ilmenite
crystals may exceed 100:m in length and typically exhibit lamellar twinning. The ilmenite may
have undergone oxidation with the development of micrometre sized hematite lamellae along
cleavage planes (Figure 6.2 Aa). However, the majority of the ilmenite exhibits little or no
oxidation even in regions of extensive ore oxidation.
Pleonaste (a variety of spinel consisting mainly of Al, O, Mg and Fe)is a common accessory
mineral, occurring as relatively large, millimetre-sized crystals and aggregates as well as fine
grained exsolution lamellae within titanium bearing magnetite (Figure 6.2 B,C&D). Large,
granular pleonaste grains may exhibit some degree of fracturing and subsequent oxidation and
replacement by aluminium hydroxide, in particular along the more extensively oxidized ore
fragments (Figure 6.2 D). Minute magnetite grains may also be finely disseminated within the
pleonaste, possible because of exsolution of excess Fe. Within the Ti-bearing magnetite the
pleonaste may occur as tiny, micrometre sized exsolution lamellae (Figure 6.2 B).

The Effect of Microwave Radiation on Fe-Ti Ore From the Mambula Complex 6-6
A B
C D
Figure 6.2 : SEM images of untreated Mambula ore
Aa) Extensive oxidation of the magnetite (darker grey) within the ore
Ab) Decomposition and replacement of transparent gangue minerals (dark grey) by hematite (light grey).
Ba) Ilmenite lamella (pale, pinkish brown) present in the magnetite (light grey).
Bb) Tiny ilmenite (medium grey) and pleonaste (dark grey) within the magnetite.
C) Migration of Ti-rich inclusions (mottled patches) to 2 ilmenite lamella (medium grey) in a Ti-bearing
magnetite grain (light grey).
D) Nature of a large, fractured pleonaste (medium grey) grain is shown within polygonal magnetite (light
grey). Reaction rims may be observed around the clinopyroxene grains (medium grey).
Db) Gangue (dark grey) replaced by hematite (light grey/white).
The Effect of Microwave Radiation on Fe-Ti Ore From the Mambula Complex 6-7
6.3) Experimental Procedure
6.3.1) Mineralogy
Microwaves may change the mineralogy of the ore to such an extent that mineral processing is no
longer feasible (Kingman et al, 2000; Vorster et al, 2000). In order to determine whether changes
to mineralogy did occur and to quantify the type of changes, 500g samples of the material were
exposed to microwave radiation for 90s in a 2.6 kW multimode microwave cavity and the
products examined using a scanning electron microscope.
6.3.2) Grindability
The ‘as-received’ material was too large for mineral processing (+10cm). They were crushed in a
laboratory scale jaw crusher to a 80% passing size of 15mm. The first set of trials involved
samples made up of the full particle size distribution (-19.6,+0mm) and two samples were
exposed to microwave radiation for 60s before being water quenched after heating and dried
overnight. The samples were then milled in a rod mill and the particle size distribution
determined at different time intervals. Because the majority of the fine material is lost when
quenching occurs, the next set of trials involved only material greater than 1.7mm in diameter
and samples were exposed to microwave radiation for 90s. In addition, milling was carried out in
a ball mill as opposed to a rod mill. The final set of experiments consisted only of -9.6+1.7mm
material. After milling, the particle size distributions were determined by sieve analysis and the
effect of microwave treatment on grindability assessed (the initial particle size distributions are
shown in Appendix B1).
The Effect of Microwave Radiation on Fe-Ti Ore From the Mambula Complex 6-8
6.3.3) Magnetic Susceptibility
Two stage magnetic separation trials were then conducted on 50g sub-samples. The milled
product was screened at 1.18 mm and the fines were riffled (on spinning riffles) to obtain the
sub-samples. It was decided to carry out the magnetic separation trials wet, as this would
overcome the problems of bridging in the high intensity separator as well as being more efficient.
The 50g material was then mixed with water (approximately 500mR) before being subjected to
low intensity magnetic separation, the purpose of which was to remove the highly magnetic
magnetite (forming the first concentrate - C1).
The low intensity stage was followed by high intensity wet separation at 0.8T. The pulp was fed
to the high intensity separator, the magnetic fraction of the material forming the second
concentrate (C2) and the non-magnetic fraction the tails (T).
The first and second concentrates as well as the tails were then filtered in a pressure filter, before
being dried overnight. After drying, the material was riffled and small samples (between 0.5 and
1g) were sent for FeO and Ti analysis.
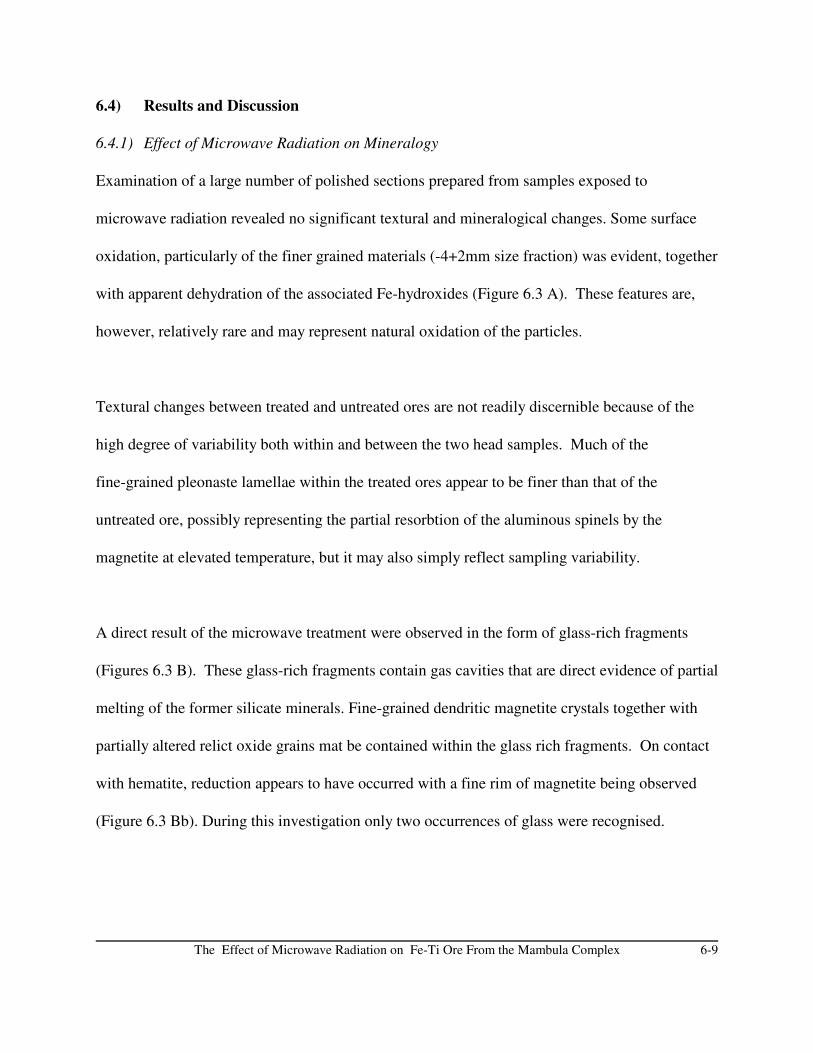
The Effect of Microwave Radiation on Fe-Ti Ore From the Mambula Complex 6-9
6.4) Results and Discussion
6.4.1) Effect of Microwave Radiation on Mineralogy
Examination of a large number of polished sections prepared from samples exposed to
microwave radiation revealed no significant textural and mineralogical changes. Some surface
oxidation, particularly of the finer grained materials (-4+2mm size fraction) was evident, together
with apparent dehydration of the associated Fe-hydroxides (Figure 6.3 A). These features are,
however, relatively rare and may represent natural oxidation of the particles.
Textural changes between treated and untreated ores are not readily discernible because of the
high degree of variability both within and between the two head samples. Much of the
fine-grained pleonaste lamellae within the treated ores appear to be finer than that of the
untreated ore, possibly representing the partial resorbtion of the aluminous spinels by the
magnetite at elevated temperature, but it may also simply reflect sampling variability.
A direct result of the microwave treatment were observed in the form of glass-rich fragments
(Figures 6.3 B). These glass-rich fragments contain gas cavities that are direct evidence of partial
melting of the former silicate minerals. Fine-grained dendritic magnetite crystals together with
partially altered relict oxide grains mat be contained within the glass rich fragments. On contact
with hematite, reduction appears to have occurred with a fine rim of magnetite being observed
(Figure 6.3 Bb). During this investigation only two occurrences of glass were recognised.
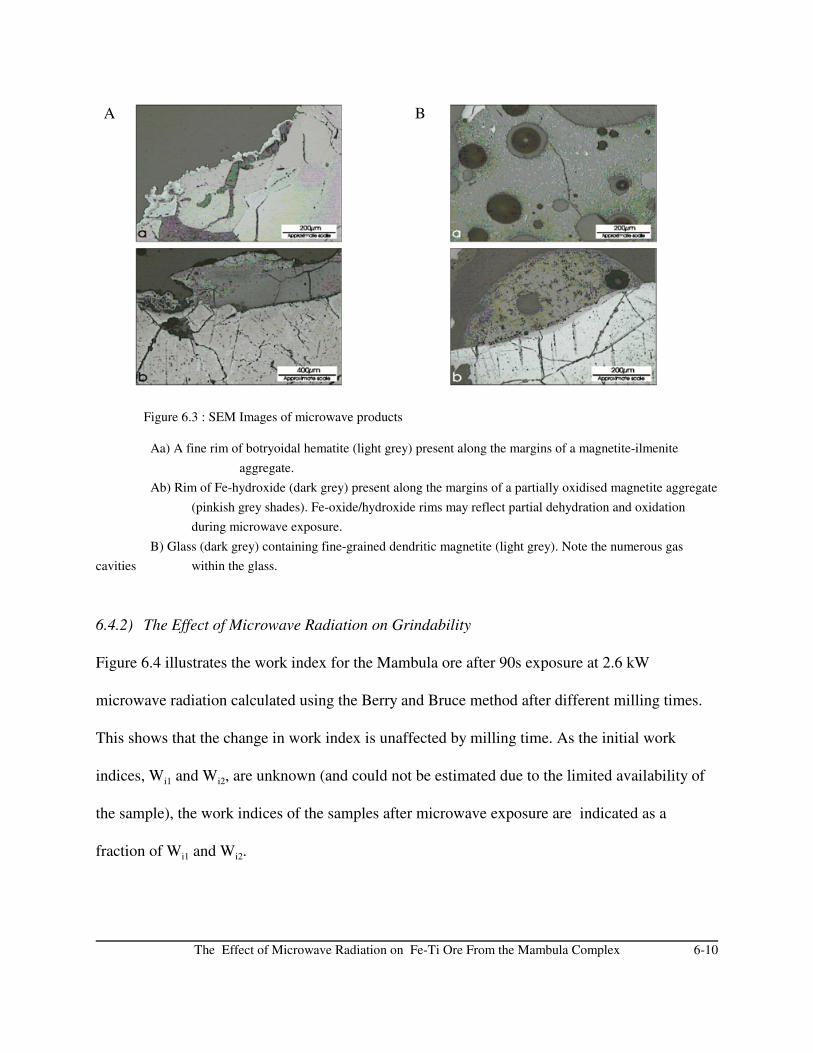
The Effect of Microwave Radiation on Fe-Ti Ore From the Mambula Complex 6-10
A B
Figure 6.3 : SEM Images of microwave products
Aa) A fine rim of botryoidal hematite (light grey) present along the margins of a magnetite-ilmenite
aggregate.
Ab) Rim of Fe-hydroxide (dark grey) present along the margins of a partially oxidised magnetite aggregate
(pinkish grey shades). Fe-oxide/hydroxide rims may reflect partial dehydration and oxidation
during microwave exposure.
B) Glass (dark grey) containing fine-grained dendritic magnetite (light grey). Note the numerous gas
cavities within the glass.
6.4.2) The Effect of Microwave Radiation on Grindability
Figure 6.4 illustrates the work index for the Mambula ore after 90s exposure at 2.6 kW
microwave radiation calculated using the Berry and Bruce method after different milling times.
This shows that the change in work index is unaffected by milling time. As the initial work
indices, Wi1 and Wi2, are unknown (and could not be estimated due to the limited availability of
the sample), the work indices of the samples after microwave exposure are indicated as a
fraction of Wi1 and Wi2.
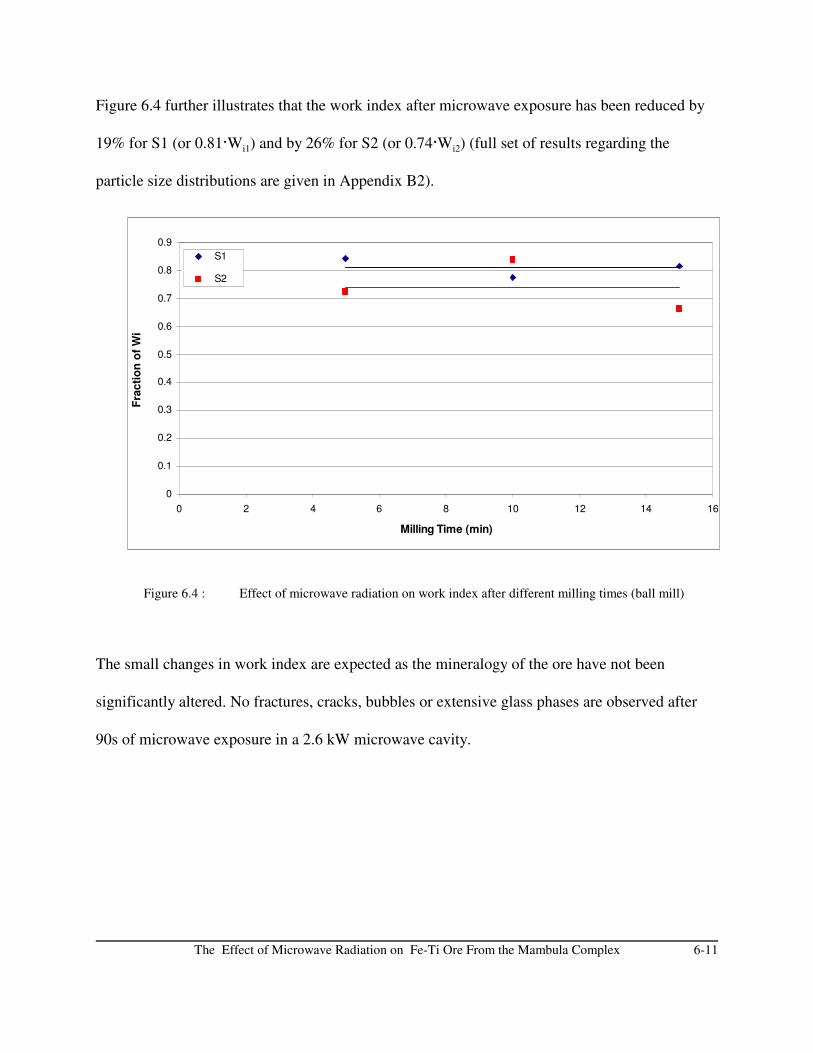
The Effect of Microwave Radiation on Fe-Ti Ore From the Mambula Complex 6-11
0
0.1
0.2
0.3
0.4
0.5
0.6
0.7
0.8
0.9
0 2 4 6 8 10 12 14 16
Milling Time (min)
Fra
cti
on
of
Wi
S1
S2
Figure 6.4 further illustrates that the work index after microwave exposure has been reduced by
19% for S1 (or 0.81@Wi1) and by 26% for S2 (or 0.74@Wi2) (full set of results regarding the
particle size distributions are given in Appendix B2).
Figure 6.4 : Effect of microwave radiation on work index after different milling times (ball mill)
The small changes in work index are expected as the mineralogy of the ore have not been
significantly altered. No fractures, cracks, bubbles or extensive glass phases are observed after
90s of microwave exposure in a 2.6 kW microwave cavity.
The Effect of Microwave Radiation on Fe-Ti Ore From the Mambula Complex 6-12
Comparison of the 50-70% reduction in work index achieved on Somincor copper ore (Vorster
et al, 2001) after 45s exposure in the same microwave cavity, confirms the finding by Kingman
et al (2000) that the mineralogy determines whether or not an ore’s grindability may be
significantly reduced by microwave radiation. Kingman et al (2000) stated that an ore with
consistent mineralogy containing good microwave absorbers in a transparent gangue matrix are
most responsive to microwave radiation, whereas ores containing small, finely disseminated
particles respond poorly. Mambula ore type have a consistent mineralogy of good absorbers
(~62% magnetite and ~26% ilmenite - Personal Communication : K Pietersen, 2000) but lacks a
transparent gangue matrix. As a result the bulk of the ore heats up at similar rates when heated
and intergranular fracture do not occur readily, resulting in small changes in work index.
Although even a 20% reduction in work index may be considered significant regarding energy
savings on the comminution circuit, the microwave energy input exceeds the reduction in energy
costs by far. Exposure of 500g ore for 90s in a 2.6kW microwave cavity corresponds to 130
kWh.t-1. For break-even cost, i.e. where the reduction in work index equals the microwave energy
input, the ore would need to have a work index of 650 kWh.t-1. Most mineral ores have work
indices between 10 and 30 kWh.t-1. Extremely difficult to grind and hard minerals such as
graphite and emery have work indices of only 43.5 and 56.7 kWh.t-1 respectively (Wills, 1997).
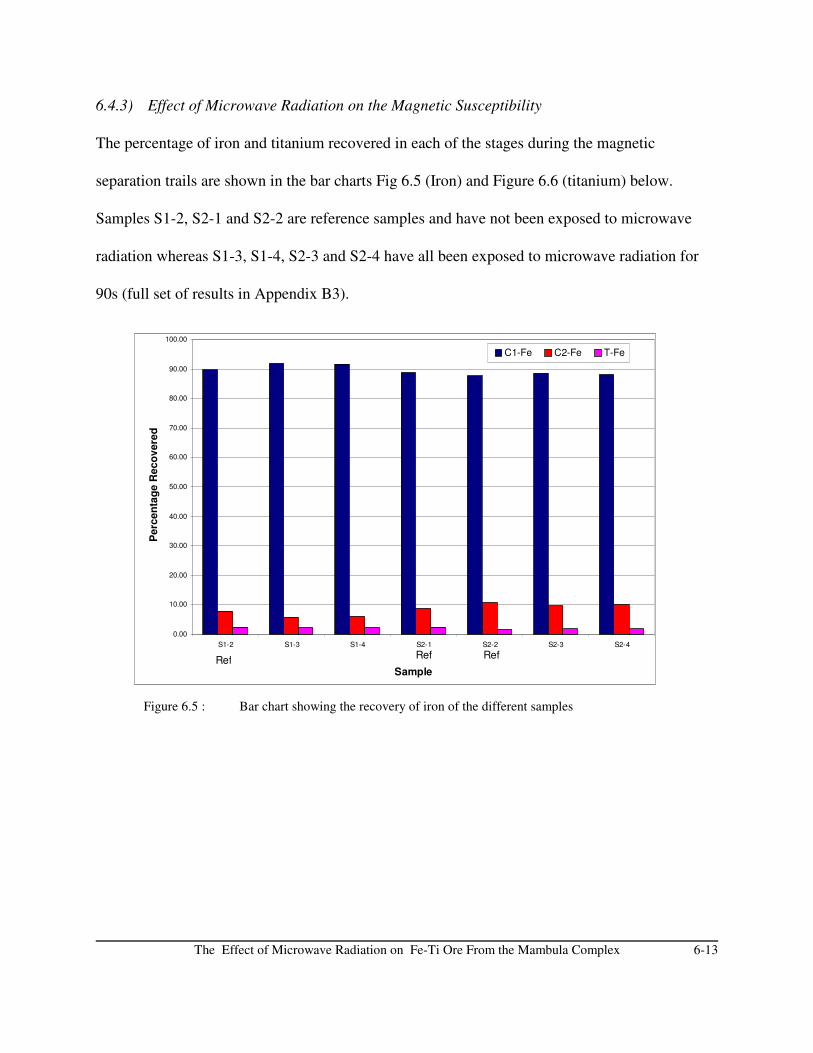
The Effect of Microwave Radiation on Fe-Ti Ore From the Mambula Complex 6-13
0.00
10.00
20.00
30.00
40.00
50.00
60.00
70.00
80.00
90.00
100.00
S1-2 S1-3 S1-4 S2-1 S2-2 S2-3 S2-4
Sample
Pe
rce
nta
ge
Re
co
ve
red
C1-Fe C2-Fe T-Fe
RefRef Ref
6.4.3) Effect of Microwave Radiation on the Magnetic Susceptibility
The percentage of iron and titanium recovered in each of the stages during the magnetic
separation trails are shown in the bar charts Fig 6.5 (Iron) and Figure 6.6 (titanium) below.
Samples S1-2, S2-1 and S2-2 are reference samples and have not been exposed to microwave
radiation whereas S1-3, S1-4, S2-3 and S2-4 have all been exposed to microwave radiation for
90s (full set of results in Appendix B3).
Figure 6.5 : Bar chart showing the recovery of iron of the different samples
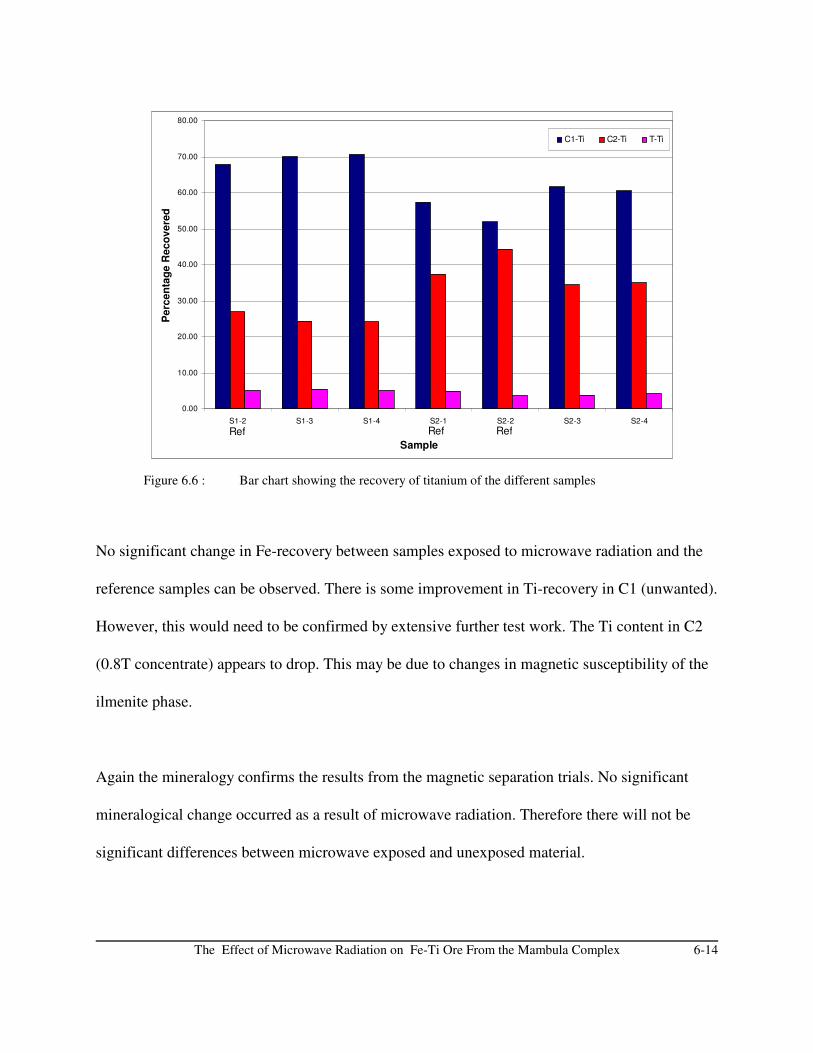
The Effect of Microwave Radiation on Fe-Ti Ore From the Mambula Complex 6-14
0.00
10.00
20.00
30.00
40.00
50.00
60.00
70.00
80.00
S1-2 S1-3 S1-4 S2-1 S2-2 S2-3 S2-4
Sample
Pe
rce
nta
ge
Re
co
ve
red
C1-Ti C2-Ti T-Ti
Ref Ref Ref
Figure 6.6 : Bar chart showing the recovery of titanium of the different samples
No significant change in Fe-recovery between samples exposed to microwave radiation and the
reference samples can be observed. There is some improvement in Ti-recovery in C1 (unwanted).
However, this would need to be confirmed by extensive further test work. The Ti content in C2
(0.8T concentrate) appears to drop. This may be due to changes in magnetic susceptibility of the
ilmenite phase.
Again the mineralogy confirms the results from the magnetic separation trials. No significant
mineralogical change occurred as a result of microwave radiation. Therefore there will not be
significant differences between microwave exposed and unexposed material.
The Effect of Microwave Radiation on Fe-Ti Ore From the Mambula Complex 6-15
6.5) Conclusion
The reduction in work indices of the 2 samples from the Mambula-complex after 90s exposure to
2.6 kW microwave radiation are 19% for S1 and 26% for S2. The small magnitude of the
changes after such a prolonged exposure time as well as no significant structural or mineralogical
changes of the ore (confirmed by the SEM examination) suggests that no further investigation
into possible reductions in work index is required. Partial melting and a small degree of
oxidation did occur, but these did not affect the grindability significantly.
The microwave energy input into achieving a 20% reduction in work index is 130 kWh.t-1. This
again confirms that microwave radiation is not the solution for this problem.
There is no evidence of changes in magnetic susceptibility of the mineral species within the
sample as a result of microwave radiation. Again this is confirmed by the mineralogy. Oxidation
did occur to a small extent, as did partial melting and the formation of gas bubbles. But these
changes are not frequent throughout the sample and do not affect the magnetic susceptibility of
the Mambula ore.
The Effect of Microwave Radiation on Palabora Vermiculite 7-1
CHAPTER 7
THE EFFECT OF MICROWAVE RADIATION ON PALABORA VERMICULITE
(Appendix C : Vermiculite Trials is on the CD at the back of this thesis)
7.1) Introduction
Phlogopite, muscovite and biotite are the most common species of the mica group. All minerals
in this group have perfect crystallographic basal cleavage and, as a result, are “flaky”. The
individual flakes adhere to form “books” and are pliable, resilient and tough with extremely
smooth surfaces and high reflectivity. Individual flakes may be as thin as 20µm. All the minerals
in the mica group have extremely low electrical and heat conductivities [Hamilton et al, 1974;
Mineral Data, 1999].
Vermiculite, a hydrated laminar magnesium-aluminium-ironsilicate, is formed by the hydration
(weathering) of phlogopite, essentially by the loss of alkali and addition of water [Hamilton et al,
1974] :
When heated, vermiculite has the unusual property of exfoliating perpendicularly to the cleavage
plane by up to 3000% (maximum). An unexfoliated “book” (thickness approximately 2mm) as
well as exfoliated books (approximately 10mm thick) are illustrated in Figure 7.1.
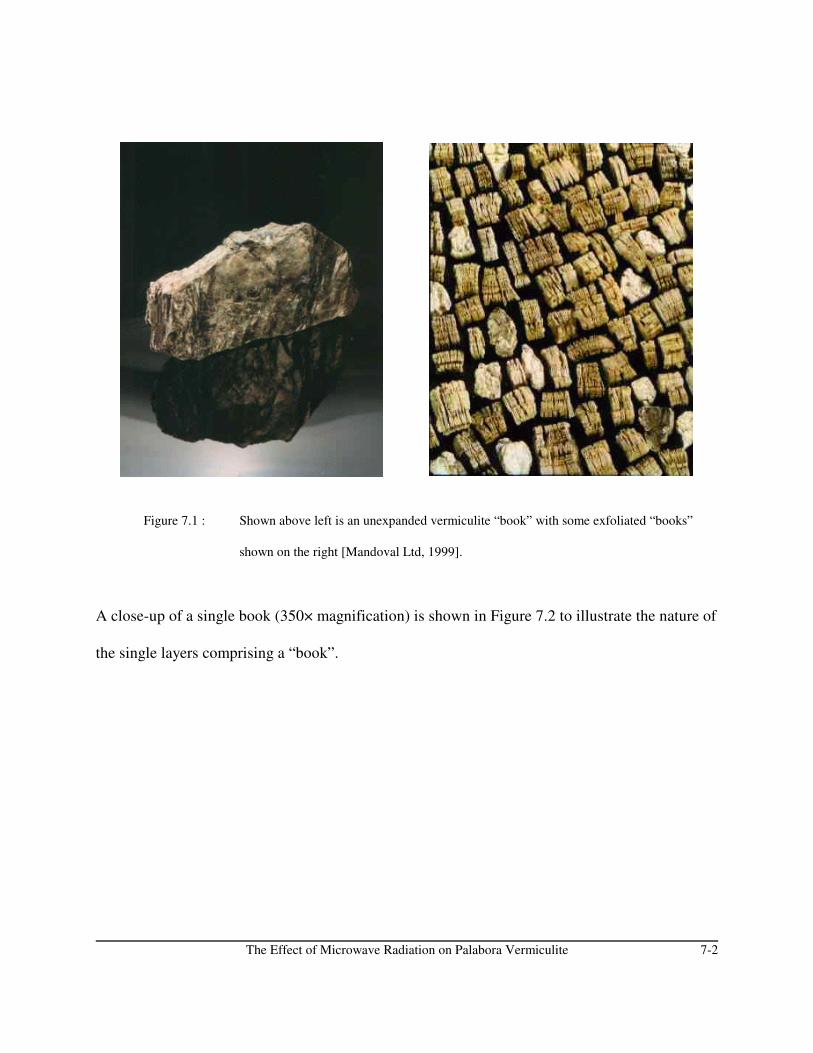
The Effect of Microwave Radiation on Palabora Vermiculite 7-2
Figure 7.1 : Shown above left is an unexpanded vermiculite “book” with some exfoliated “books”
shown on the right [Mandoval Ltd, 1999].
A close-up of a single book (350× magnification) is shown in Figure 7.2 to illustrate the nature of
the single layers comprising a “book”.
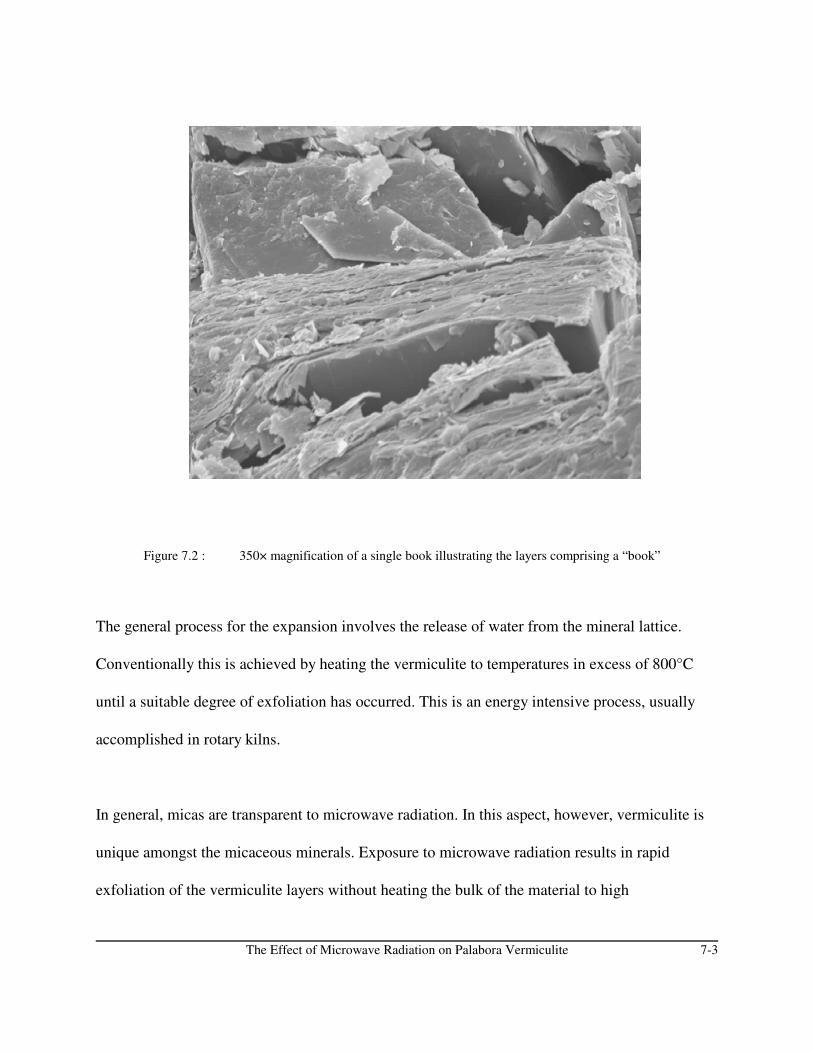
The Effect of Microwave Radiation on Palabora Vermiculite 7-3
Figure 7.2 : 350× magnification of a single book illustrating the layers comprising a “book”
The general process for the expansion involves the release of water from the mineral lattice.
Conventionally this is achieved by heating the vermiculite to temperatures in excess of 800°C
until a suitable degree of exfoliation has occurred. This is an energy intensive process, usually
accomplished in rotary kilns.
In general, micas are transparent to microwave radiation. In this aspect, however, vermiculite is
unique amongst the micaceous minerals. Exposure to microwave radiation results in rapid
exfoliation of the vermiculite layers without heating the bulk of the material to high
The Effect of Microwave Radiation on Palabora Vermiculite 7-4
temperatures.
7.2) Mining Operation at Palabora
In excess of two million tonnes of vermiculite ore is mined per annum, containing approximately
20% vermiculite. Vermiculite is mined from three sources at Palabora.
The first is the Palabora Vermiculite Operation Department (VOD) open pit (the ore body
consists of a serpenetised olivine-phlogopite pegmatoid surrounded by a diopside-phlogopite
pegmatoid). Up to a depth of 50m the phlogopite has been weathered to vermiculite, mainly
through a leaching process whereby the Mg and K have been replaced by water [PMC Ltd,
1996]. The second source is the Phalaborwa Phosphate and Vermiculite (PP&V) deposits, a
diopside-phlogopite pegmatoid with the first 50m weathered to vermiculite. The third source of
vermiculite is the original VOD plant dump consisting of tailings which have become
economically mineable [PMC Ltd, 1996].
Sizing and drying are the main components of the Ore Preparation Plant whereas winnowing
occurs in the Ore Treatment Plant. The Ore Preparation Plant consists of a main grizzly situated
over a 450 tonne surge bin. From the surge bin the ore is fed to a mineral sizer. From the sized
ore, a primary double deck screen (50mm aperture top deck, 20mm aperture bottom deck) is used
to retrieve the -20mm material. Oversize material from either deck can be crushed to -20mm or
be routed to waste dumps.
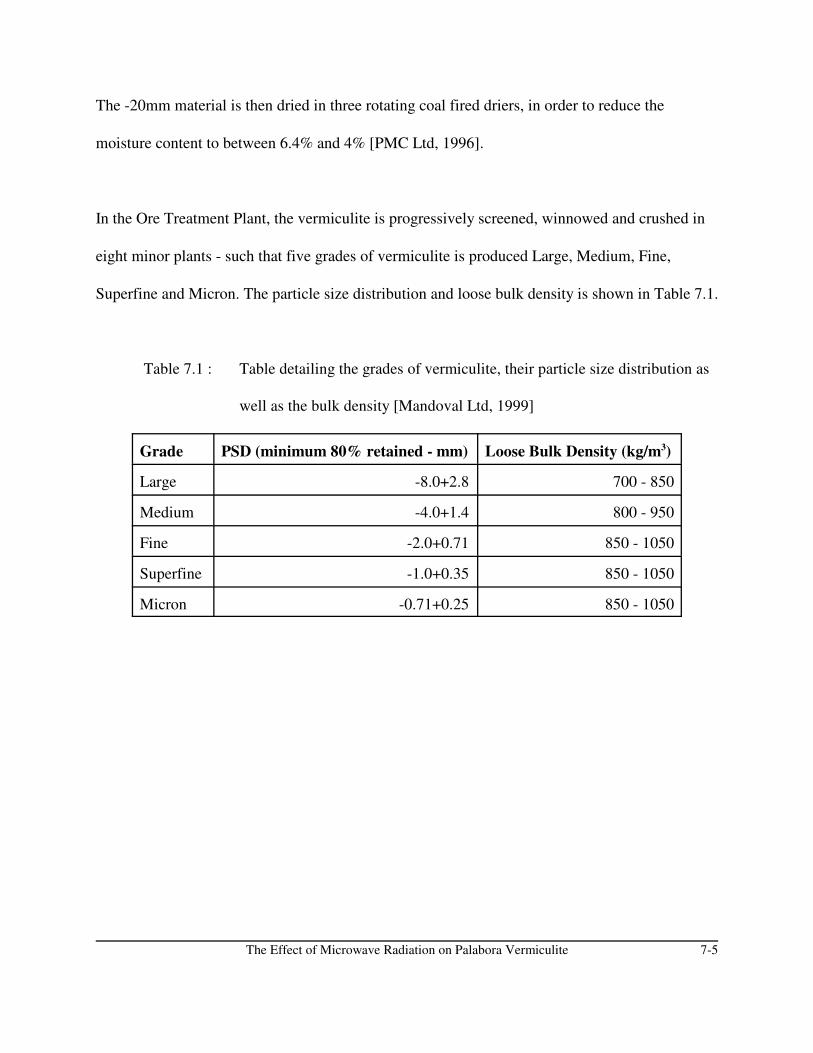
The Effect of Microwave Radiation on Palabora Vermiculite 7-5
The -20mm material is then dried in three rotating coal fired driers, in order to reduce the
moisture content to between 6.4% and 4% [PMC Ltd, 1996].
In the Ore Treatment Plant, the vermiculite is progressively screened, winnowed and crushed in
eight minor plants - such that five grades of vermiculite is produced Large, Medium, Fine,
Superfine and Micron. The particle size distribution and loose bulk density is shown in Table 7.1.
Table 7.1 : Table detailing the grades of vermiculite, their particle size distribution as
well as the bulk density [Mandoval Ltd, 1999]
Grade PSD (minimum 80% retained - mm) Loose Bulk Density (kg/m3)
Large -8.0+2.8 700 - 850
Medium -4.0+1.4 800 - 950
Fine -2.0+0.71 850 - 1050
Superfine -1.0+0.35 850 - 1050
Micron -0.71+0.25 850 - 1050

The Effect of Microwave Radiation on Palabora Vermiculite 7-6
7.3) Uses of Vermiculite
Vermiculite is used in a multitude of industries (Table 7.2) ranging from agriculture to
construction to the horticultural.
Table 7.2 : List of some industrial applications of Vermiculite
Agricultural
animal feed
Horticultural
blocking mixes
anti-caking material hydroponics
bulking agent micro-propagation
fertilizer potting mixes
pesticide rooting cuttings
soil conditioner seed germination
Construction
acoustic finishes
Other
absorbent packing
air setting binder brake pads/shoes
board drilling muds
fire protection filtration
floor and roof screeds fireproof safes
insulating roof screed insulation
loft insulation nuclear waste disposal
7.4) Physical Properties of Vermiculite
Vermiculite has a perfect cleavage plane [001] with a monoclinic crystal system and a Mohs
hardness of 1.5. Crude vermiculite from Palabora Open Pit, is golden brown in colour (Figure
7.1) with a loose bulk density of between 700 and 1050 kg/m3, however when compacted this

The Effect of Microwave Radiation on Palabora Vermiculite 7-7
increases to ±1250 kg/m3. Exfoliated vermiculite has a range of densities from 60 to 135 kg/m3,
and chemical analysis of crude and exfoliated vermiculite are the same (Hamilton, 1974).
Approximate compositions of major and minor components are listed in Table 7.3 :
Table 7.3 : Chemical analysis of Palabora vermiculite [Mandoval Ltd, 1999]
Major
Components
SiO2 35 - 41%
Minor
Components
CaO 2.0 - 6.0%
CO2 0.6 - 2.5%
Al2O3 6.0 - 9.5% TiO2 0.6 - 1.4%
Fe2O3 6.0 - 9.5% F 0.2 - 0.8%
MgO 21.5 - 25.5% Cr2O3 0.01 - 0.15%
K2O 3.0 - 6.0% P2O5 0.2 - 2.0%
Cl 0 - 0.5%
Different grades of vermiculite has different volume yields, as specified in m3 per tonne as is
shown in Table 7.4. In addition to the loose bulk density and the volume yield, Table 7.4 also
lists the values for the specific surface area (m2/g).
Table 7.4 : Volume yields and loose bulk densities of exfoliated vermiculite
[Mandoval Ltd, 1999]
Grade Volume Yield (m3/t) Loose Bulk Density (kg/m3) Surface Area (m2/g)
Large 13.0 - 14.5 60 - 75 3.8
Medium 11.5 - 13.0 70 - 85 4.0
Fine 10.5 - 11.5 75 - 85 4.4

The Effect of Microwave Radiation on Palabora Vermiculite 7-8
Eq 7.1
Superfine 8.5 - 10.0 85 - 100 5.4
Micron 7.5 - 9.0 105 - 135 6.4
The occupational exposure limits for vermiculite according to Mandoval Ltd (1999) are specified
as 10hg/m3 inhalation dust and 1 mg/m3 respirable dust. Vermiculite is non-combustible, not
readily biodegradable, non-toxic and is not classified as hazardous under CHIP regulations 1994.
7.5) Previous Work and Theory
Very little research has been carried out regarding the application of microwave assisted
exfoliation of vermiculite. In a 1970 patent, Wada described the application of electromagnetic
radiation for the exfoliation of vermiculite with additional benefits such as ion exchangeability,
humidity control, high water retention and odour elimination. Wada (1970) further describes that
“much less energy is required for a certain expansion per unit volume of vermiculite as compared
to hitherto known methods”. He further states that the expansion is more effective in the presence
of polar molecules or cations with a lower molecular weight than 5000.
Most micas are transparent to microwave radiation. However, vermiculite is a hydrated form of
phlogopite. Water is an extremely good microwave receptor. When vermiculite is exposed to
microwave radiation, the water molecules in the structure is released and the vermiculite
expands. The process may be described as shown below :
The Effect of Microwave Radiation on Palabora Vermiculite 7-9
7.6) Experimental Procedure
7.6.1) Exfoliation
Different masses of each of the five grades have been exposed to microwave radiation for
different time periods, and the volume of the exfoliated vermiculite was measured in a measuring
cylinder. A 2.6 kW multimode cavity, a 1.5 kW monomode cavity as well as a conventional,
laboratory scale furnace at 850°C have been used to exfoliate vermiculite samples.
In order to facilitate the exfoliation process of the finer grade material, a small amount of active
carbon (2.5g in a 20g sample) was added for the microwave assisted exfoliation trials. As active
carbon is an extremely good microwave receptor, the addition of active carbon would result in
the mixture being heated much more rapidly initially, possibly increasing the volumetric yield
and reducing residence time.
Due to constraints as to available sample mass, furnace size and exfoliated volume only
relatively small batches of fine, superfine and micron grade material were exfoliated at any one
time. In all cases exfoliation was continued until such time that no more visible exfoliation
occurred.
The Effect of Microwave Radiation on Palabora Vermiculite 7-10
In addition, batches of known mass were exposed to microwave radiation for fixed periods of
time and the resulting volume measured. The volume per mass ratio were then plotted against the
power per mass ratio in an attempt to determine the optimum exposure time.
The Effect of Microwave Radiation on Palabora Vermiculite 7-11
7.6.2) The Effect of Microwave Radiation on Vermiculite Structure
As vermiculite is predominantly used for insulation purposes, changes to the thermal
conductivity of vermiculite could have adverse effect on its applications in this industry. To
assess any possible changes, the structure of microwave exfoliated vermiculite was compared to
the structure of vermiculite exfoliated at 850°C using a scanning electron microscope.
7.6.3) Economic Evaluation of the Alternative Exfoliation Process
The power requirements of the process was estimated from the power rating and efficiency of the
microwave units and the time used for exfoliation. A pilot scale microwave unit with a conveyer
belt, have been used to continuously treat a mixture of large and medium grade vermiculite. The
results from this experiment was used to estimate more accurately the economic feasibility of
microwave exfoliation.
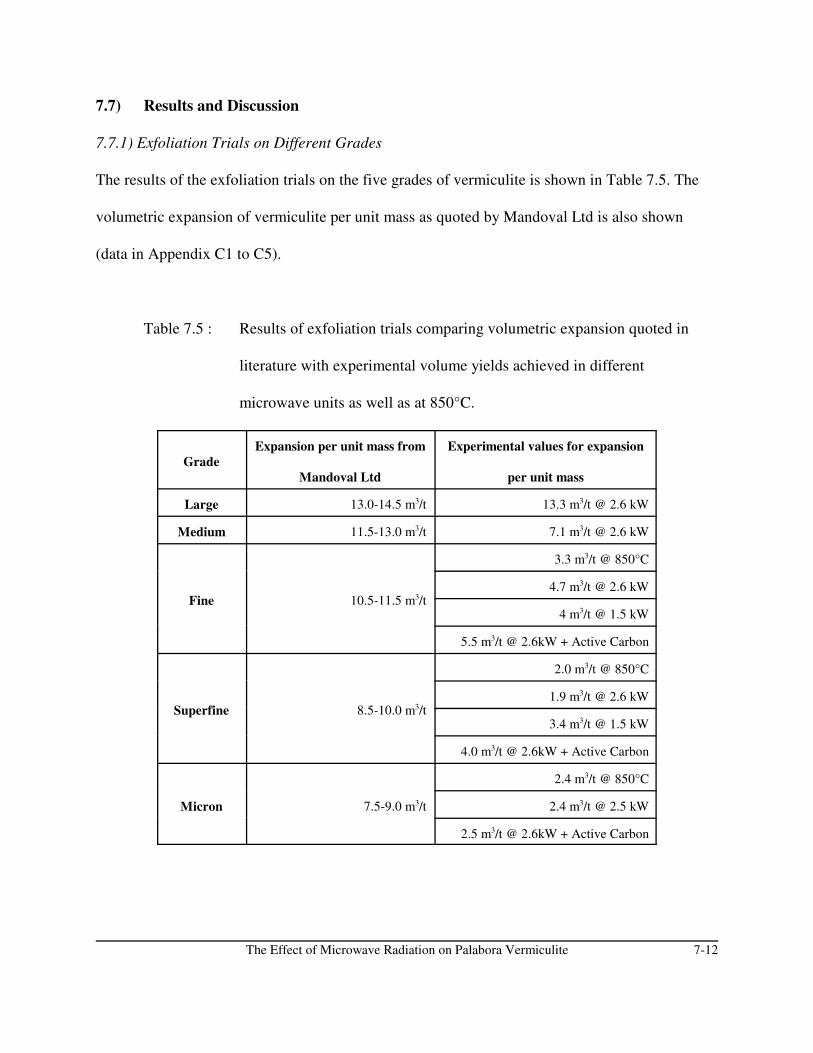
The Effect of Microwave Radiation on Palabora Vermiculite 7-12
7.7) Results and Discussion
7.7.1) Exfoliation Trials on Different Grades
The results of the exfoliation trials on the five grades of vermiculite is shown in Table 7.5. The
volumetric expansion of vermiculite per unit mass as quoted by Mandoval Ltd is also shown
(data in Appendix C1 to C5).
Table 7.5 : Results of exfoliation trials comparing volumetric expansion quoted in
literature with experimental volume yields achieved in different
microwave units as well as at 850°C.
Grade
Expansion per unit mass from
Mandoval Ltd
Experimental values for expansion
per unit mass
Large 13.0-14.5 m3/t 13.3 m3/t @ 2.6 kW
Medium 11.5-13.0 m3/t 7.1 m3/t @ 2.6 kW
Fine 10.5-11.5 m3/t
3.3 m3/t @ 850°C
4.7 m3/t @ 2.6 kW
4 m3/t @ 1.5 kW
5.5 m3/t @ 2.6kW + Active Carbon
Superfine 8.5-10.0 m3/t
2.0 m3/t @ 850°C
1.9 m3/t @ 2.6 kW
3.4 m3/t @ 1.5 kW
4.0 m3/t @ 2.6kW + Active Carbon
Micron 7.5-9.0 m3/t
2.4 m3/t @ 850°C
2.4 m3/t @ 2.5 kW
2.5 m3/t @ 2.6kW + Active Carbon
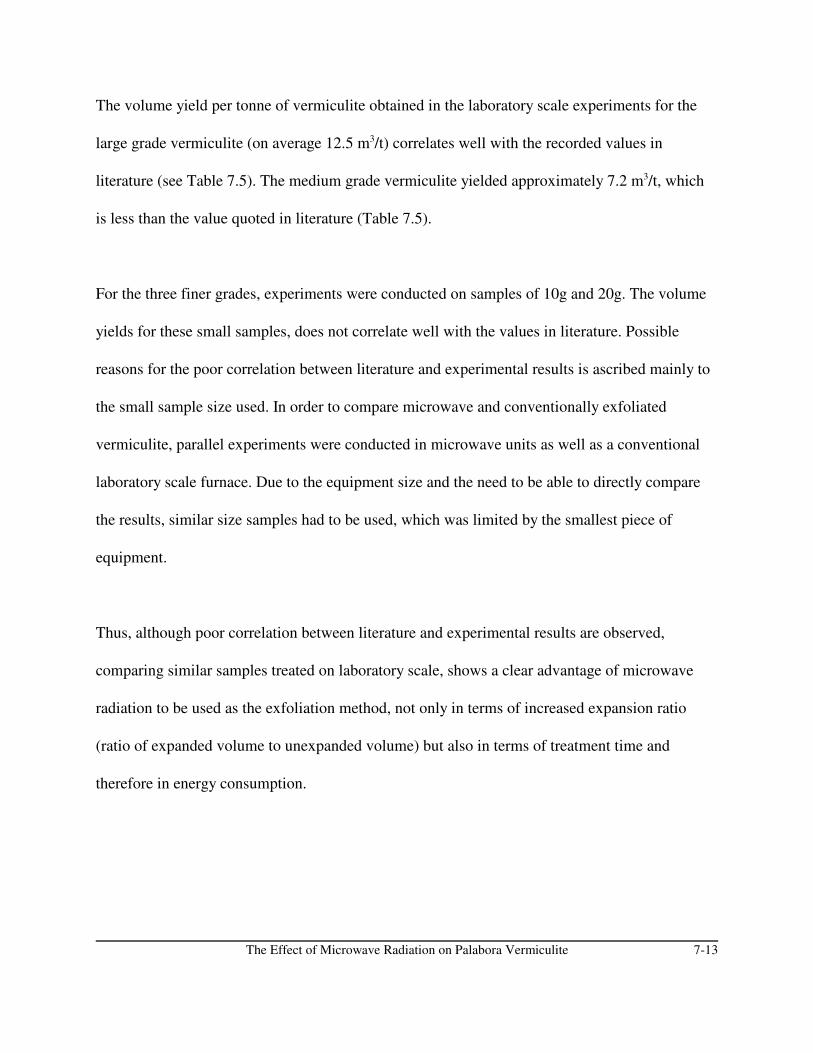
The Effect of Microwave Radiation on Palabora Vermiculite 7-13
The volume yield per tonne of vermiculite obtained in the laboratory scale experiments for the
large grade vermiculite (on average 12.5 m3/t) correlates well with the recorded values in
literature (see Table 7.5). The medium grade vermiculite yielded approximately 7.2 m3/t, which
is less than the value quoted in literature (Table 7.5).
For the three finer grades, experiments were conducted on samples of 10g and 20g. The volume
yields for these small samples, does not correlate well with the values in literature. Possible
reasons for the poor correlation between literature and experimental results is ascribed mainly to
the small sample size used. In order to compare microwave and conventionally exfoliated
vermiculite, parallel experiments were conducted in microwave units as well as a conventional
laboratory scale furnace. Due to the equipment size and the need to be able to directly compare
the results, similar size samples had to be used, which was limited by the smallest piece of
equipment.
Thus, although poor correlation between literature and experimental results are observed,
comparing similar samples treated on laboratory scale, shows a clear advantage of microwave
radiation to be used as the exfoliation method, not only in terms of increased expansion ratio
(ratio of expanded volume to unexpanded volume) but also in terms of treatment time and
therefore in energy consumption.
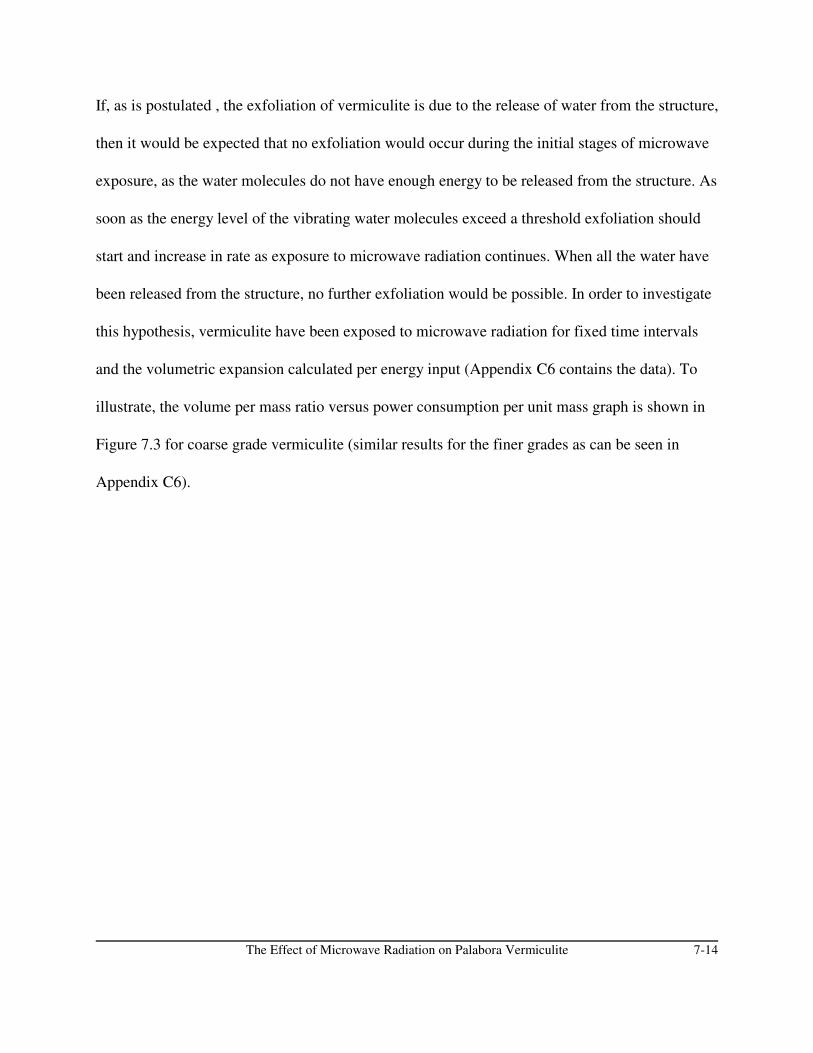
The Effect of Microwave Radiation on Palabora Vermiculite 7-14
If, as is postulated , the exfoliation of vermiculite is due to the release of water from the structure,
then it would be expected that no exfoliation would occur during the initial stages of microwave
exposure, as the water molecules do not have enough energy to be released from the structure. As
soon as the energy level of the vibrating water molecules exceed a threshold exfoliation should
start and increase in rate as exposure to microwave radiation continues. When all the water have
been released from the structure, no further exfoliation would be possible. In order to investigate
this hypothesis, vermiculite have been exposed to microwave radiation for fixed time intervals
and the volumetric expansion calculated per energy input (Appendix C6 contains the data). To
illustrate, the volume per mass ratio versus power consumption per unit mass graph is shown in
Figure 7.3 for coarse grade vermiculite (similar results for the finer grades as can be seen in
Appendix C6).
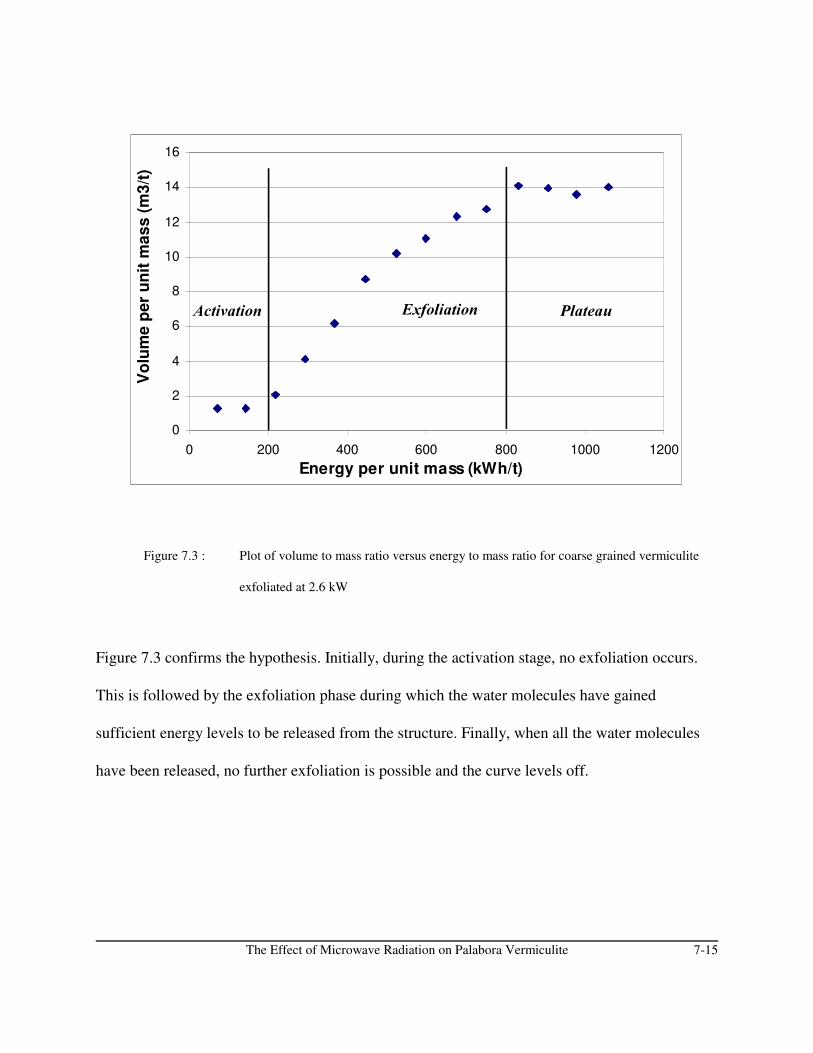
The Effect of Microwave Radiation on Palabora Vermiculite 7-15
0
2
4
6
8
10
12
14
16
0 200 400 600 800 1000 1200
Energy per unit mass (kWh/t)
Vo
lum
e p
er
un
it m
as
s (
m3
/t)
Figure 7.3 : Plot of volume to mass ratio versus energy to mass ratio for coarse grained vermiculite
exfoliated at 2.6 kW
Figure 7.3 confirms the hypothesis. Initially, during the activation stage, no exfoliation occurs.
This is followed by the exfoliation phase during which the water molecules have gained
sufficient energy levels to be released from the structure. Finally, when all the water molecules
have been released, no further exfoliation is possible and the curve levels off.
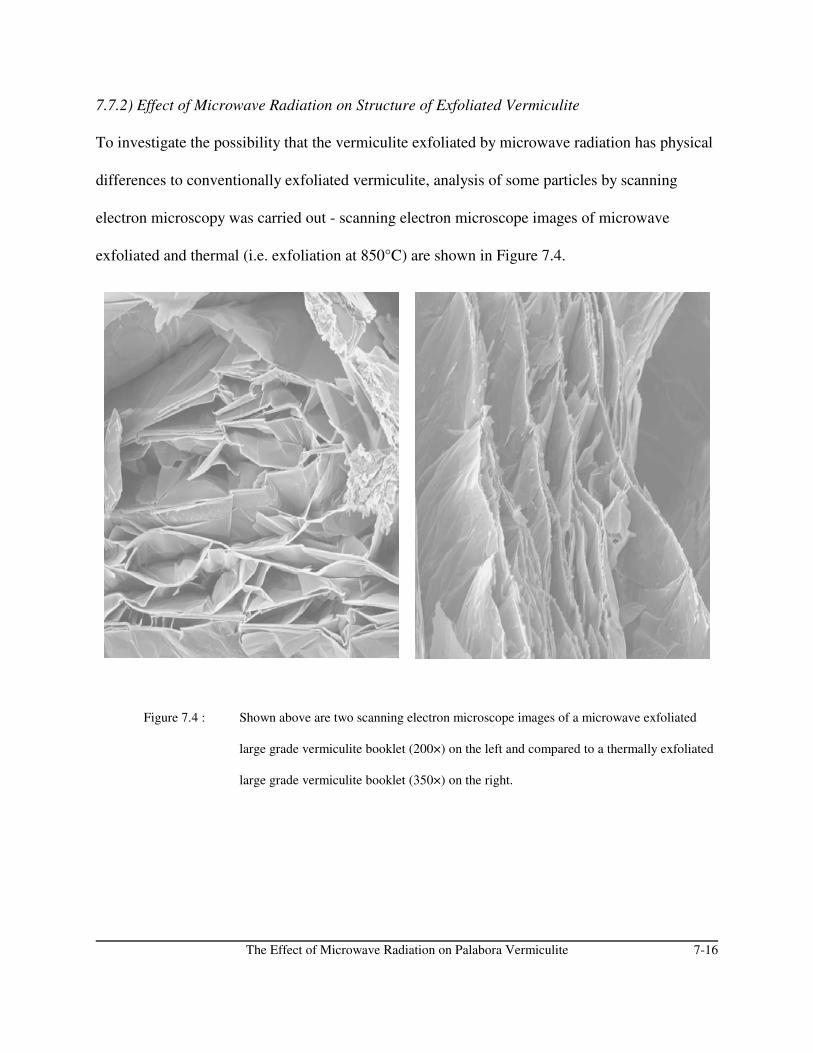
The Effect of Microwave Radiation on Palabora Vermiculite 7-16
7.7.2) Effect of Microwave Radiation on Structure of Exfoliated Vermiculite
To investigate the possibility that the vermiculite exfoliated by microwave radiation has physical
differences to conventionally exfoliated vermiculite, analysis of some particles by scanning
electron microscopy was carried out - scanning electron microscope images of microwave
exfoliated and thermal (i.e. exfoliation at 850°C) are shown in Figure 7.4.
Figure 7.4 : Shown above are two scanning electron microscope images of a microwave exfoliated
large grade vermiculite booklet (200×) on the left and compared to a thermally exfoliated
large grade vermiculite booklet (350×) on the right.
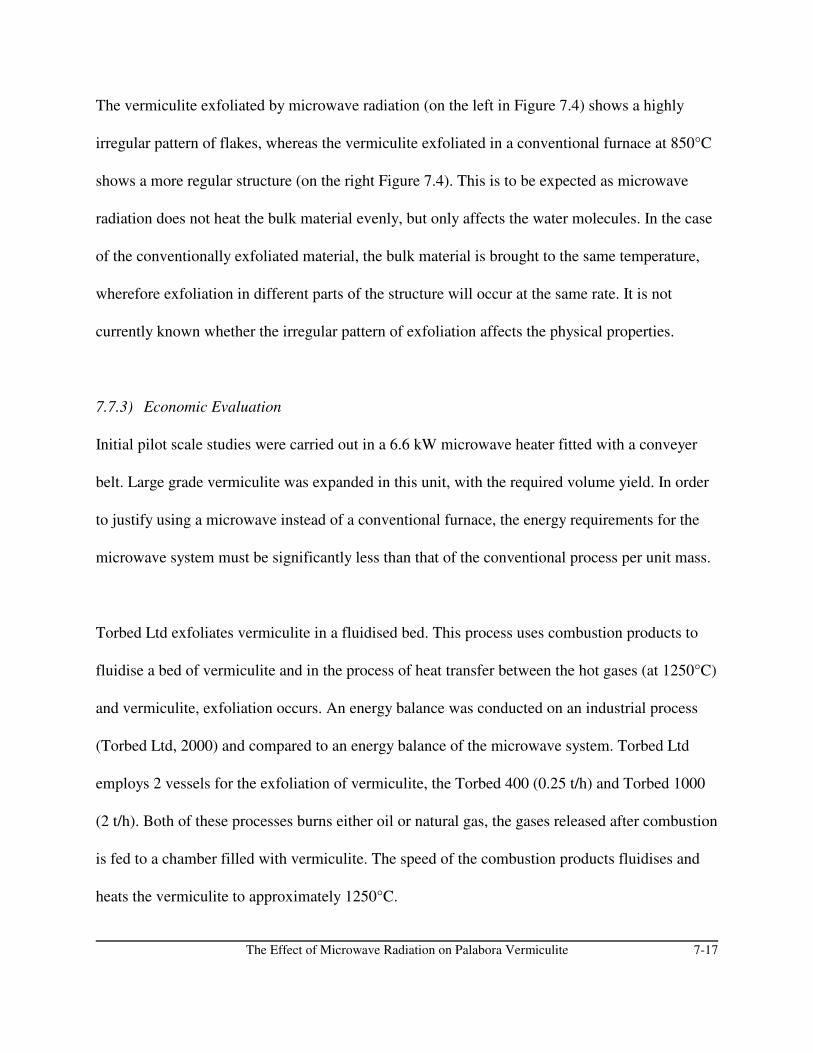
The Effect of Microwave Radiation on Palabora Vermiculite 7-17
The vermiculite exfoliated by microwave radiation (on the left in Figure 7.4) shows a highly
irregular pattern of flakes, whereas the vermiculite exfoliated in a conventional furnace at 850°C
shows a more regular structure (on the right Figure 7.4). This is to be expected as microwave
radiation does not heat the bulk material evenly, but only affects the water molecules. In the case
of the conventionally exfoliated material, the bulk material is brought to the same temperature,
wherefore exfoliation in different parts of the structure will occur at the same rate. It is not
currently known whether the irregular pattern of exfoliation affects the physical properties.
7.7.3) Economic Evaluation
Initial pilot scale studies were carried out in a 6.6 kW microwave heater fitted with a conveyer
belt. Large grade vermiculite was expanded in this unit, with the required volume yield. In order
to justify using a microwave instead of a conventional furnace, the energy requirements for the
microwave system must be significantly less than that of the conventional process per unit mass.
Torbed Ltd exfoliates vermiculite in a fluidised bed. This process uses combustion products to
fluidise a bed of vermiculite and in the process of heat transfer between the hot gases (at 1250°C)
and vermiculite, exfoliation occurs. An energy balance was conducted on an industrial process
(Torbed Ltd, 2000) and compared to an energy balance of the microwave system. Torbed Ltd
employs 2 vessels for the exfoliation of vermiculite, the Torbed 400 (0.25 t/h) and Torbed 1000
(2 t/h). Both of these processes burns either oil or natural gas, the gases released after combustion
is fed to a chamber filled with vermiculite. The speed of the combustion products fluidises and
heats the vermiculite to approximately 1250°C.

The Effect of Microwave Radiation on Palabora Vermiculite 7-18
After exfoliation the products is cooled to approximately 35°C. For the two systems the energy
requirements are :
Torbed 400 0.25 t/h oil fired 1.99 GJ/t
Torbed 400 0.25 t/h gas fired 1.67 GJ/t
Torbed 1000 2 t/h oil fired 1.84 GJ/t
Torbed 1000 2 t/h gas fired 1.24 GJ/t
In addition cooling energy from 1200°C to 35°C requires approximately 1.2 GJ/t. The microwave
system upon which the energy balance is based, was a 6.6 kW unit fitted with a conveyer belt.
The unit itself has an electrical efficiency of 45%, thus increasing the power draw to 14.5 kW.
For the worst case scenario (most energy inefficient), the energy requirements per ton is 352 MJ/t
which is 3.5 times less than the energy requirements of the Torbed reactors (1.25kg exposed for
30s).
Additional experiments were conducted to verify the proposed exfoliation reaction Eq 7.1.
Known masses of vermiculite (large and medium grade for the purposes of calculations) were
exfoliated until no more visible exfoliation were observed. It was then assumed that further
exposure to microwave radiation will only result in dehydration and not any further exfoliation.
The vermiculite sample was then weighed and the percentage “mass loss” calculated. The mass
loss was between 3.5g and 5.0g (average 4.25g) per 100g of non-exfoliated vermiculite. 100g of
vermiculite equates to 0.24 mol. According to Eq 7.1, for every 0.24 mol vermiculite exfoliated,
the same number of moles of water should be released. If the “mass loss” is attributed solely to
water being released from the structure, then 0.24 mol of water should be released. 4.25g water is
The Effect of Microwave Radiation on Palabora Vermiculite 7-19
equivalent to 0.236 mol. Therefore, experimental results confirms that reaction (Eq 7.1) holds.
7.8) Conclusion
The volume yield per tonne of vermiculite obtained in the laboratory scale experiments for the
large grade vermiculite (on average 12.5 m3/t) correlates well with the recorded values in
literature (see Table 7.4). The medium grade vermiculite yielded approximately 7.2 m3/t, which
is less than the value quoted in literature (Table 7.4). For the three finer grades, experiments were
conducted on samples of 10g. The volume yields for these small samples, does not correlate well
with the values in literature.
Although poor correlation between literature and experimental results are observed, comparing
similar samples treated on laboratory scale, shows a clear advantage of microwave radiation to be
used as the exfoliation method, not only in terms of increased expansion ratio (ratio of expanded
volume to unexpanded volume) but also in terms of treatment time and therefore in energy
consumption. It has also been shown that the exfoliation of vermiculite by microwave radiation
consist of three phases : activation, exfoliation and an exfoliation plateau. This may be used to
calculate the optimum exfoliation time for vermiculite.
Structural differences between microwave exfoliated and thermally exfoliated vermiculite exist.
Microwave exfoliation results in a highly irregular pattern compared to thermal exfoliation but it
is not yet known to what extent (if any) this affects the physical properties of vermiculite.
The Effect of Microwave Radiation on Palabora Vermiculite 7-20
The following paper has been accepted for publication in Materials Science and
Engineering :
1) “An alternative method for the exfoliation of vermiculite” by Vorster, Marland,
Kingman and Rowson.
The paper has been included in the “papers” section of this thesis. The following
presentation has been delivered regarding this work (the presentation is included in the
CD at the back of this thesis) :
1) “A novel technique for the exfoliation of vermiculite” at UMIST Research Day
2000 (umist00.exe)
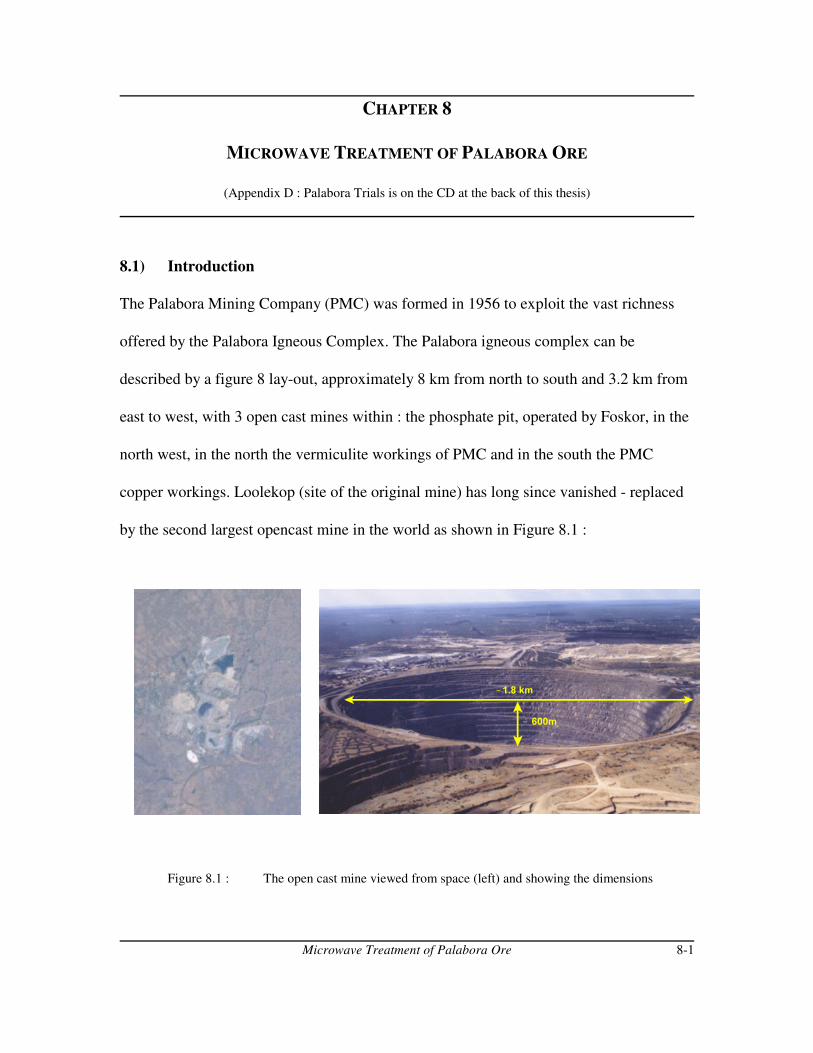
Microwave Treatment of Palabora Ore 8-1
CHAPTER 8
MICROWAVE TREATMENT OF PALABORA ORE
(Appendix D : Palabora Trials is on the CD at the back of this thesis)
8.1) Introduction
The Palabora Mining Company (PMC) was formed in 1956 to exploit the vast richness
offered by the Palabora Igneous Complex. The Palabora igneous complex can be
described by a figure 8 lay-out, approximately 8 km from north to south and 3.2 km from
east to west, with 3 open cast mines within : the phosphate pit, operated by Foskor, in the
north west, in the north the vermiculite workings of PMC and in the south the PMC
copper workings. Loolekop (site of the original mine) has long since vanished - replaced
by the second largest opencast mine in the world as shown in Figure 8.1 :
Figure 8.1 : The open cast mine viewed from space (left) and showing the dimensions
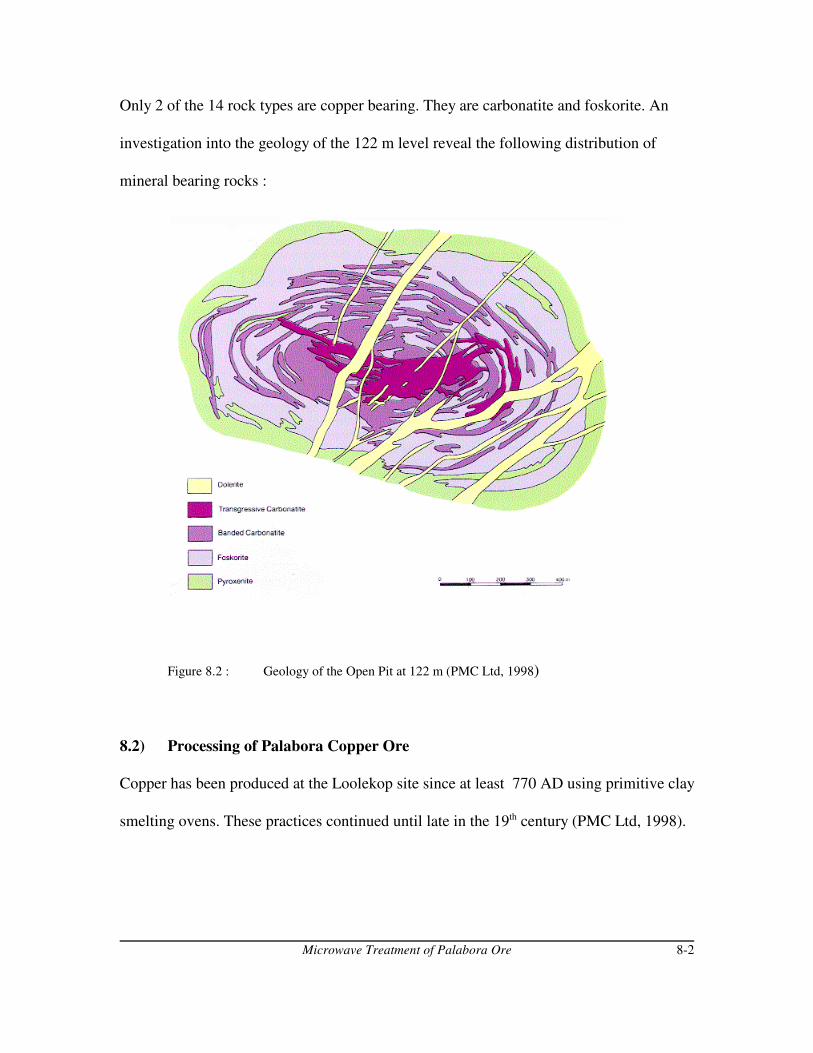
Microwave Treatment of Palabora Ore 8-2
Only 2 of the 14 rock types are copper bearing. They are carbonatite and foskorite. An
investigation into the geology of the 122 m level reveal the following distribution of
mineral bearing rocks :
Figure 8.2 : Geology of the Open Pit at 122 m (PMC Ltd, 1998)
8.2) Processing of Palabora Copper Ore
Copper has been produced at the Loolekop site since at least 770 AD using primitive clay
smelting ovens. These practices continued until late in the 19th century (PMC Ltd, 1998).
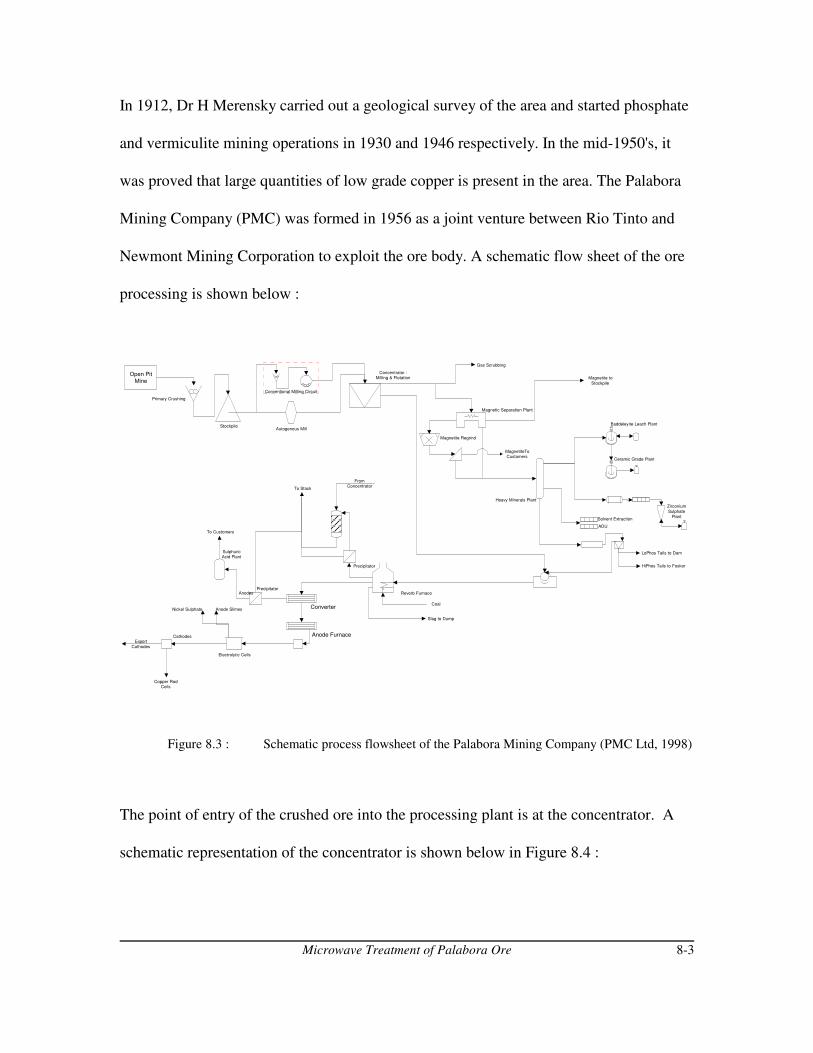
Microwave Treatment of Palabora Ore 8-3
Open Pit
Mine
Primary Crushing
StockpileAutogenous Mill
Conventional Milling Circuit
Concentrator :Milling & Flotation
Gas Scrubbing
Magnetic Separation Plant
Magnetite to
Stockpile
Magnetite Regrind
MagnetiteToCustomers
Heavy Minerals Plant
Baddeleyite Leach Plant
Ceramic Grade Plant
Solvent Extraction
ADU
HiPhos Tails to Foskor
Zirconium
SulphatePlant
LoPhos Tails to Dam
Reverb Furnace
Coal
Slag to Dump
To Stack
Precipitator
FromConcentrator
Converter
Anode FurnaceCathodes
Precipitator
SulphuricAcid Plant
To Customers
Electrolytic Cells
Nickel Sulphate Anode Slimes
Anodes
Export
Cathodes
Copper RodCoils
In 1912, Dr H Merensky carried out a geological survey of the area and started phosphate
and vermiculite mining operations in 1930 and 1946 respectively. In the mid-1950's, it
was proved that large quantities of low grade copper is present in the area. The Palabora
Mining Company (PMC) was formed in 1956 as a joint venture between Rio Tinto and
Newmont Mining Corporation to exploit the ore body. A schematic flow sheet of the ore
processing is shown below :
Figure 8.3 : Schematic process flowsheet of the Palabora Mining Company (PMC Ltd, 1998)
The point of entry of the crushed ore into the processing plant is at the concentrator. A
schematic representation of the concentrator is shown below in Figure 8.4 :

Microwave Treatment of Palabora Ore 8-4
Secondary Crushers
2 × 7' Standard Symons
Secondary and
5 × 7' Shorthead Symons Tertiary Crushers
Conventional Milling
6 × 12' × 16' Allis Chalmers Rod Mills12 × 12' × 12' Marcy Grate Discharge Ball Mills
12 × 27' Spargo Cyclones
Autogenous Mills
2 × 32" × 115 Kloppers
Surface Stock Piles
Fine Ore Bins
6 × 9000 t Capacity
Flotation
630 × 48" Agitair
147 × 120" Fagergren
20 × PMC OK's2 × OK 38"
Hydro Separators10 × 23' × 6' Eimco
Hydro Separators
Copper Filter PlantTails
Overflow
Cyclones
5 Clusters of 165 cm
Multotec Cyclone s
Underflow
5 × Disc
Filters
Tailings Thickeners
3 × 300' Dorr Oliver Thickeners
Tailings Dams
426 Hectares
Magnetic Separator
14 Sala Triple Drum Separators
Feed Preparation
Cyclones
Non Mags
Magnetite Dams
HiTi : 75 Hectares
LoTi : 34 Hectares
Magnetite Regrind
Mags
Regrind Magnetite
Second Stage Cyclones
Overflow OverflowTo Tailings
Thickeners
Heavy Minerals Plant
5 Stages Reichert Cones
2 Stages Deister TablesTriple Deck Tables
Underflow
ZrO2 Concentrate
U3O
2 Concentrate
Overflow Ball Mills
3 × 12' × 22' Allis Chalmers
Sands Treatment Plant
83 Fagergren 120
Flotation Cells
3 × 100' Eimco
Thickeners
Zirconia Plants
BaddeleyiteZST
Foskor Thickener
1 × 300' Dorr Oliver Thickener
Foskor Pumping
5 Stage Pumping to Foskor
Figure 8.4 : Schematic representation of the processes in the concentrator at PMC (PMC Ltd,
1998)
There are two grinding circuits at Palabora, as can be seen in Figure 8.3 and 8.4. The first,
the conventional milling circuit consist of 6 identical parallel circuits, each consisting of
one rod mill, two ball mills and 2 cyclones. (Henderson, 1990).
Power is supplied by 900 kW motors, with the rod mill at 64% and ball mills at 72% of
critical speed. Each rod mill grinds 380 t/h at 80% solids. The feed size are 19 mm and
the discharge at 80% -1.2 mm. Cyclone underflow is 80% solids and the overflow 56%
solids at 80% -300:m.
Microwave Treatment of Palabora Ore 8-5
The second grinding circuit is the autogenous milling circuit, which consists of 2
autogenous mills of dimensions 9.76m × 3.81m Koppers mills. Each mill is driven by 2
3.5 MW motors at -10 revs/min at 70% solids.
Run-of-mine ore are fed at a rate of 600 t/h at 175 mm and discharged at 80% -300 :m.
The mill product is screened at 2.5 mm, with the oversize recycled to the mill and the
undersize cycloned. The cyclone overflow is pumped to the flotation section and the
underflow is recycled to the mill (Henderson, 1990)
Two gangue minerals have a significant impact on the milling rate is dolorite and
magnetite. Dolorite, with a work index of 30 kWh.t-1 represents a high resistance to
milling and has no economic importance. It causes specific problems in autogenous
milling as grinds at a slower rate than the rest of the material, causing a build up of
dolorite in the mill, which reduces the feed rate.
8.3) Mineralogy of the Palabora Copper Ore
A detailed mineralogical characterization of a head sample of Palabora copper ore was
obtained from Rio Tinto Technology Development Ltd. The head sample contained
approximately 25 % magnetite and 1 % copper sulphides such as chalcocite (Cu2S),
bornite (Cu5FeS4), chalcopyrite (CuFeS2), cubanite (CuFe2S3), valleriite
(4(Fe,Cu)S@3(Mg,Al)(OH)2) and pyrite (FeS) are also present.
Microwave Treatment of Palabora Ore 8-6
However, transparent gangue minerals makes up the majority of the ore. Qualitative SEM
analysis of the gangue minerals reveals that they consist of mainly calcite (CaCO3),
dolomite (CaMg(CO3)2, apatite (Ca5(PO4)3(F,Cl,OH)), olivine ((Fe,Mg)2SiO4), phlogopite
(KMg3AlSi3O10(F,OH)2), serpentine (Mg3Si2O5(OH)4), pyroxines and plagioclase
feldspar.
Carbonate minerals, most frequently calcite and dolomite, usually occur as intergrowths
with magnetite, sulphides or gangue - as is shown in Figure 8.5A. The main phosphate
bearing mineral, apatite, occurs abundantly as rounded grains associated with magnetite,
transparent gangue and sulphide minerals, as is shown in Figure 8.5B.
Olivine is also present in the sample, although partial replacement of olivine by
serpentine has occurred. Much of the serpentine forms a fine grained aggregates which in
some cases filles the fractures in magnetite and apatite.
Phlogopite, a Mg rich mica, occurs as flake-like aggregates associated with magnetite,
sulphide minerals and transparent gangue. A small number of rock fragments consist
mainly of plagioclase feldspar, pyroxene and skeletal magnetite - aggregates of which
represents microgabbro - or dolorite - which is present as intrusions in the ore body (see
Figure 8.2).
Other gangue minerals include ilmenite, which occurs along the grain boundaries of
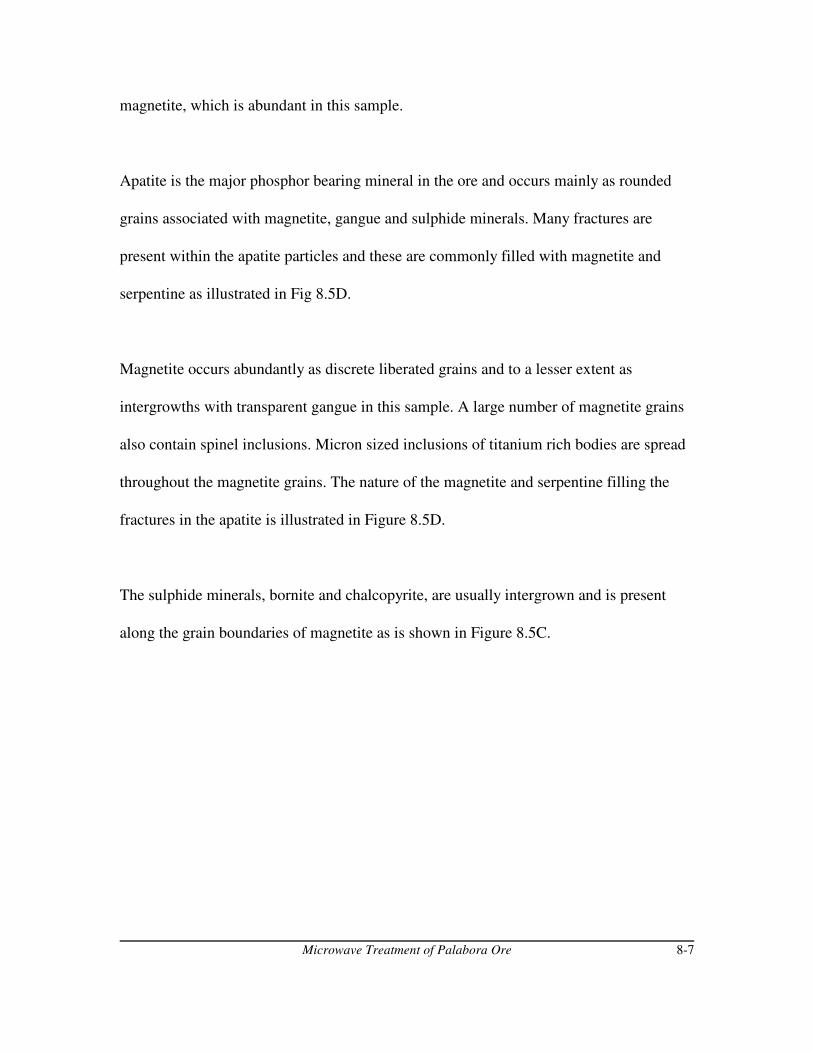
Microwave Treatment of Palabora Ore 8-7
magnetite, which is abundant in this sample.
Apatite is the major phosphor bearing mineral in the ore and occurs mainly as rounded
grains associated with magnetite, gangue and sulphide minerals. Many fractures are
present within the apatite particles and these are commonly filled with magnetite and
serpentine as illustrated in Fig 8.5D.
Magnetite occurs abundantly as discrete liberated grains and to a lesser extent as
intergrowths with transparent gangue in this sample. A large number of magnetite grains
also contain spinel inclusions. Micron sized inclusions of titanium rich bodies are spread
throughout the magnetite grains. The nature of the magnetite and serpentine filling the
fractures in the apatite is illustrated in Figure 8.5D.
The sulphide minerals, bornite and chalcopyrite, are usually intergrown and is present
along the grain boundaries of magnetite as is shown in Figure 8.5C.
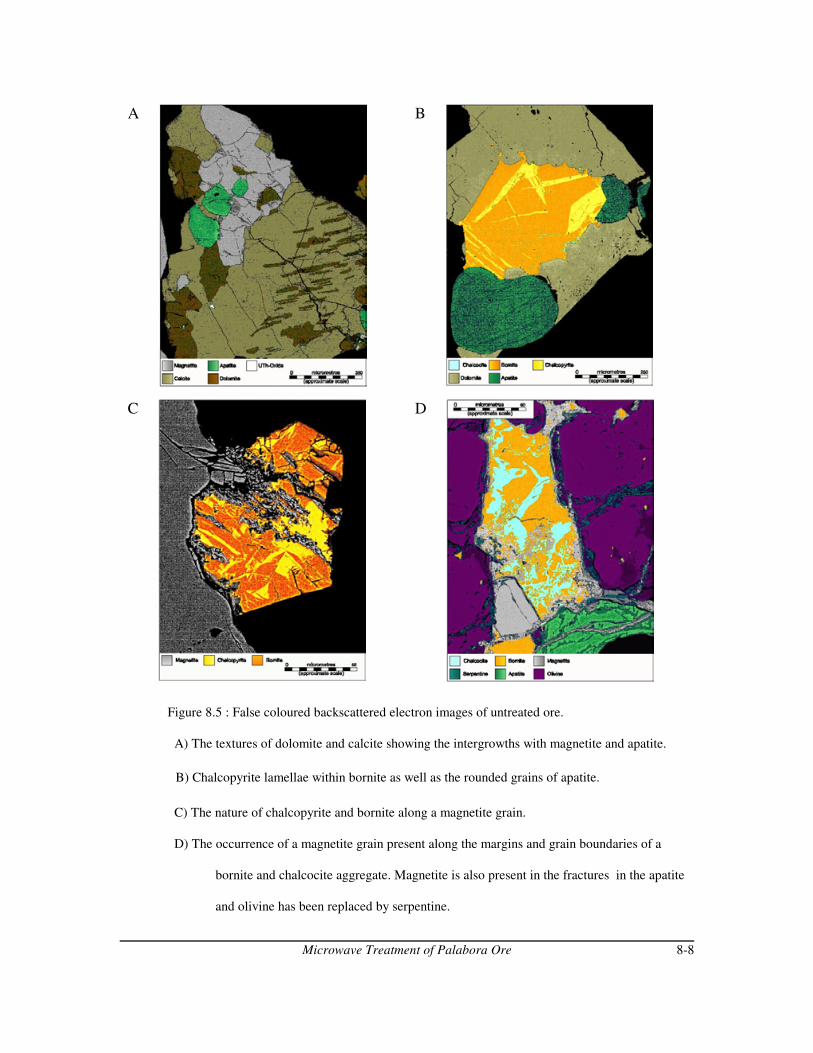
Microwave Treatment of Palabora Ore 8-8
A B
C D
Figure 8.5 : False coloured backscattered electron images of untreated ore.
A) The textures of dolomite and calcite showing the intergrowths with magnetite and apatite.
B) Chalcopyrite lamellae within bornite as well as the rounded grains of apatite.
C) The nature of chalcopyrite and bornite along a magnetite grain.
D) The occurrence of a magnetite grain present along the margins and grain boundaries of a
bornite and chalcocite aggregate. Magnetite is also present in the fractures in the apatite
and olivine has been replaced by serpentine.

Microwave Treatment of Palabora Ore 8-9
8.4) Experimental Procedure
8.4.1) Effect of Microwave Radiation on Mineralogy
As the mineralogy of an ore determines whether or not it can be successfully mined, it is
important to know whether or not exposure to microwave irradiation affects the
mineralogy. If microwave energy can be successfully utilized to reduce the cost of
comminution, but at the same time change the mineralogy to such an extent that the
valuables can no longer be extracted effectively, all the downstream processes will be
adversely affected and processing of the ore might become uneconomical. Samples of
Palabora copper ore were exposed to microwave radiation for different time periods in a
2.6 kW microwave unit, quenched and dried before being studied under a scanning
electron microscope.
8.4.2) Effect of Microwave Radiation on Grindability
Previous work (Kingman et al, 2000), showed that Palabora ore responded well to
microwave radiation with large decreases in work index possible. However, as all the
studies were conducted on laboratory scale, it was decided to conduct a pilot scale study.
Initial trials were carried out on 5 kg batch samples in a 6.6 kW microwave unit at the
Midlands Electricity Board (MEB) research facility in Halesowen, Birmingham. The
microwave unit was fitted with a turntable as well as a Kevlar conveyer belt for
continuous operation. The microwave unit is shown in Figure 8.6 :
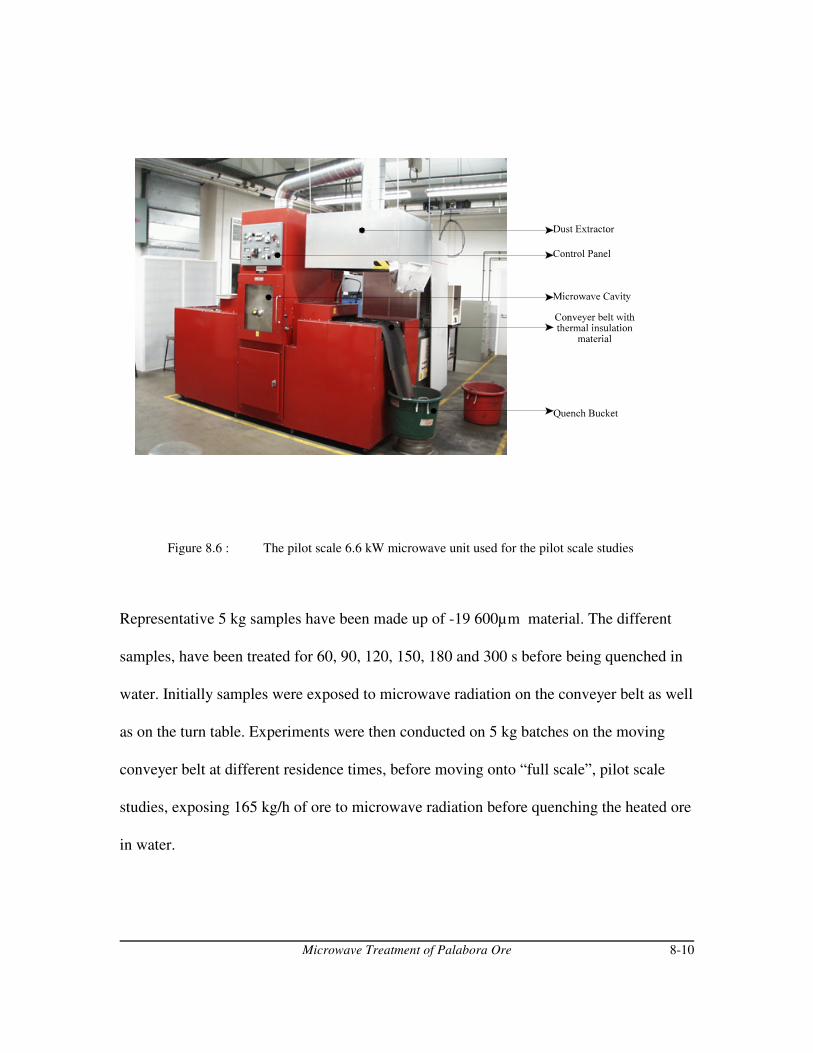
Microwave Treatment of Palabora Ore 8-10
Figure 8.6 : The pilot scale 6.6 kW microwave unit used for the pilot scale studies
Representative 5 kg samples have been made up of -19 600µm material. The different
samples, have been treated for 60, 90, 120, 150, 180 and 300 s before being quenched in
water. Initially samples were exposed to microwave radiation on the conveyer belt as well
as on the turn table. Experiments were then conducted on 5 kg batches on the moving
conveyer belt at different residence times, before moving onto “full scale”, pilot scale
studies, exposing 165 kg/h of ore to microwave radiation before quenching the heated ore
in water.
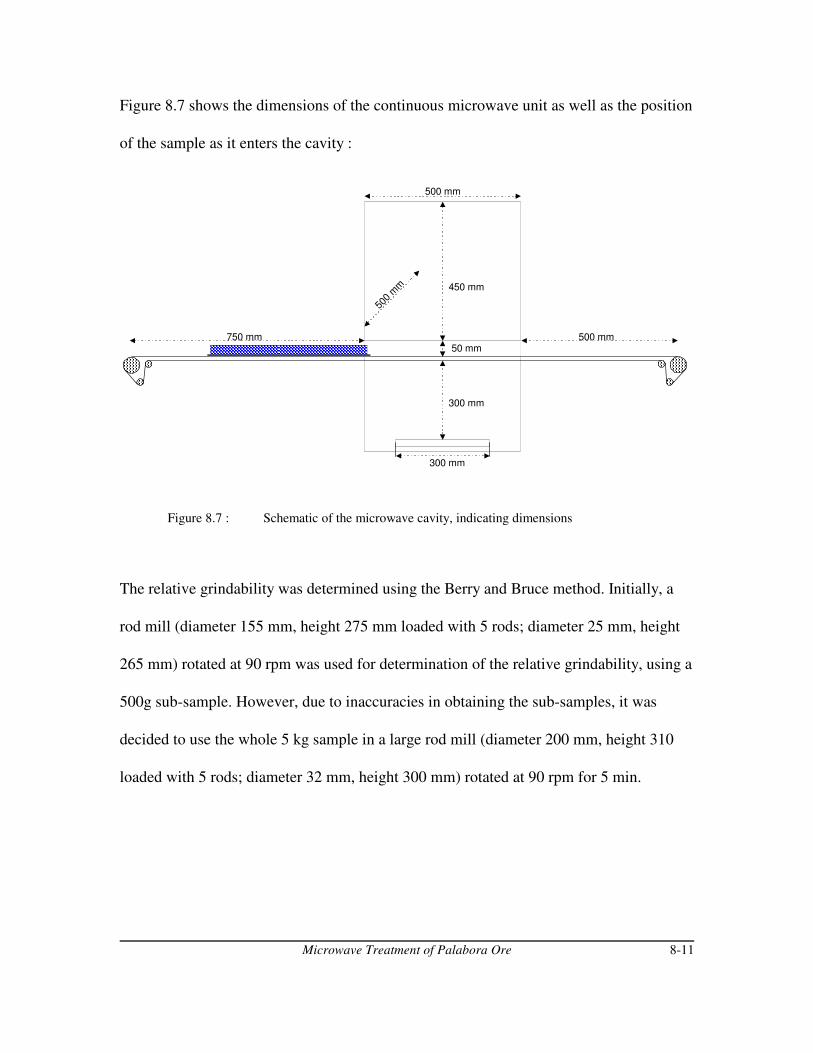
Microwave Treatment of Palabora Ore 8-11
500 mm
450 mm
300 mm
500
mm
750 mm 500 mm50 mm
300 mm
Figure 8.7 shows the dimensions of the continuous microwave unit as well as the position
of the sample as it enters the cavity :
Figure 8.7 : Schematic of the microwave cavity, indicating dimensions
The relative grindability was determined using the Berry and Bruce method. Initially, a
rod mill (diameter 155 mm, height 275 mm loaded with 5 rods; diameter 25 mm, height
265 mm) rotated at 90 rpm was used for determination of the relative grindability, using a
500g sub-sample. However, due to inaccuracies in obtaining the sub-samples, it was
decided to use the whole 5 kg sample in a large rod mill (diameter 200 mm, height 310
loaded with 5 rods; diameter 32 mm, height 300 mm) rotated at 90 rpm for 5 min.
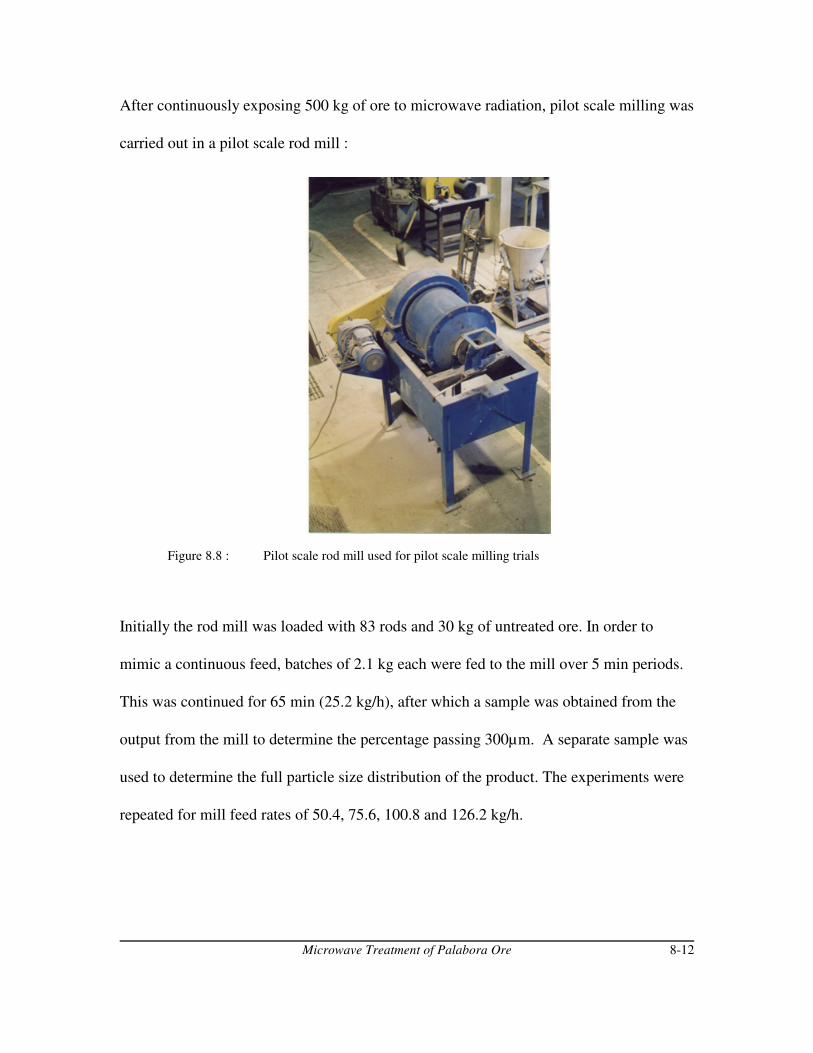
Microwave Treatment of Palabora Ore 8-12
After continuously exposing 500 kg of ore to microwave radiation, pilot scale milling was
carried out in a pilot scale rod mill :
Figure 8.8 : Pilot scale rod mill used for pilot scale milling trials
Initially the rod mill was loaded with 83 rods and 30 kg of untreated ore. In order to
mimic a continuous feed, batches of 2.1 kg each were fed to the mill over 5 min periods.
This was continued for 65 min (25.2 kg/h), after which a sample was obtained from the
output from the mill to determine the percentage passing 300µm. A separate sample was
used to determine the full particle size distribution of the product. The experiments were
repeated for mill feed rates of 50.4, 75.6, 100.8 and 126.2 kg/h.
Microwave Treatment of Palabora Ore 8-13
The grinding trials were then repeated for ore exposed to microwave radiation (with mill
fed rates of 126.2 and 100.8 kg/h). Representative 5 kg samples were made up from the
treated and untreated material and grindability trials conducted using the large rod mill.
The effects of particle size on the reductions in work index due to microwave treatment
was investigated. 500g of material consisting of a single size fraction were exposed to
microwave radiation for 60s before being quenched and dried overnight. The relative
grindability of each fraction (+1700-2360µm, +2360-3350µm, +3350-4750µm, +4750-
6700µm, +6700-9500µm and +9500-13600µm) was then determined.
The power absorbed by the material in the microwave cavity is proportional to the square
of the electric field strength according to Equation 2.8. The electric field strength of the
2.6 kW and 6.6 kW microwave cavities were then determined using the method explained
in Chapter 2.
The effect of sample container were also investigated by exposing samples in different
containers (pyrex, mortar, no container) and comparing the grindability. Different masses
were also exposed to determine any mass loading effects. The effect of sample area on the
effectiveness of microwave radiation have also been investigated by dividing the
microwave unit into areas as shown in Figure 8.9 :

Microwave Treatment of Palabora Ore 8-14
A BB
C
C
DD
EE
EE
310 mm
530 mm
Figure 8.9 : The division of the 2.6 kW microwave into different areas
500g samples were placed on different areas (A, A+B, A+B+C, A+B+D and
A+B+C+D+E) within the cavity, thus varying the thickness of the sample. The relative
grindability was then determined to determine the optimum lay-out for sample treatment
in the cavity.
The copper and iron content of different size fractions were also determined as this would
affect the response of the material to microwave radiation. Additional experiments were
conducted on the magnetic and non-magnetic sections of the material to quantify any
possible effects on microwave response.
Microwave Treatment of Palabora Ore 8-15
The dielectric constant and permittivity of the ore as well as the major individual
components were determined at the Department of Electrical Engineering at the
University of Nottingham (Chapter 2). Mixture equations were used to estimate the
dielectric constants of the ore from its components and compare direct measurements.
In order to investigate alternative methods for the quantification of the effects of
microwave radiation on Palabora ore, two types single particle breakage tests were
conducted. Firstly, batches of 50 particles (-13600+9500µm) were exposed to microwave
radiation (60s, 2.6kW) before being quenched. These particles were then individually
broken on a load frame and the energy and work done for breakage recorded. Secondly
the three point bend test (as described in Chapter 3) was used to determine particle
strength. Core samples, 60mm in length of different diameters (19, 27 and 35mm) were
obtained from R.O.M. ore. The cores were heated in a 1.3 kW microwave heater different
exposure intervals before being quenched. The core samples were supported at their end-
points on two mild steel plates. A third plate was used to apply a load diametrically. A
‘load versus displacement’ curve is continually recorded by a computer during the
operation and results compared to the Berry and Bruce method for relative grindability.
8.4.3) Effect of microwave radiation on flotation and magnetic separation
Kingman et al, 2000, investigated the effects of microwave radiation on the flotability and
magnetic separation of Palabora copper ore. Ore was exposed to microwave radiation at
2.6 kW before being ground and batch flotation trials conducted.
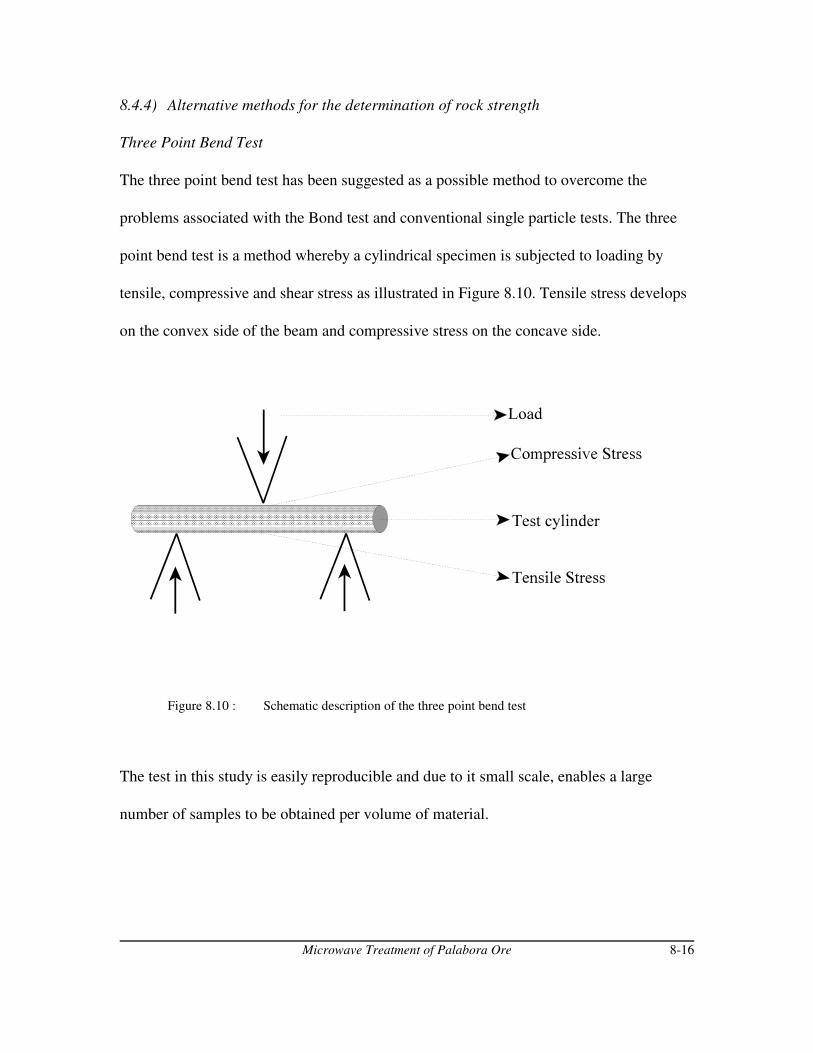
Microwave Treatment of Palabora Ore 8-16
8.4.4) Alternative methods for the determination of rock strength
Three Point Bend Test
The three point bend test has been suggested as a possible method to overcome the
problems associated with the Bond test and conventional single particle tests. The three
point bend test is a method whereby a cylindrical specimen is subjected to loading by
tensile, compressive and shear stress as illustrated in Figure 8.10. Tensile stress develops
on the convex side of the beam and compressive stress on the concave side.
Figure 8.10 : Schematic description of the three point bend test
The test in this study is easily reproducible and due to it small scale, enables a large
number of samples to be obtained per volume of material.

Microwave Treatment of Palabora Ore 8-17
Palabora core samples, 60mm in length and 19, 27 and 35mm in diameter were also
tested. Batches of 15 such cores were heated in a 1.3 kW microwave heater at 2.45 GHz
for different exposure intervals. Upon removal from the microwave the specimens were
quenched. The strength values (work required to induce catastrophic fracture) of the
sample cores, were measured using a three-point bend test, as shown in Figure 8.10. A
‘load versus displacement’ curve is continually recorded by a computer during operation.
Drop Weight Tests
A drop weight test rig has been constructed and is shown schematically in Figure 8.11 :
Figure 8.11 : Diagram of the drop weight tester
Microwave Treatment of Palabora Ore 8-18
Fifty particles of similar size (in the same size class in a standard sieve series) comprised
one sample. Each sample of 50 particles were weighed. A single particle was placed on
the impact plate, the impact mass raised or lowered to the specified height and the impact
mass released. After the drop, the impact plate was cleared of debris and the process
repeated from the same height for all 50 particles. Five samples were used for each size
class, the material in each sample was crushed at different energy levels (see Eq 3.14).
After breakage the debris was sized, the particle size distribution plotted and the value of
t10 (the fraction passing a tenth of the input size) calculated for each energy input level
(Eq 3.15 defines t10 in terms of ore parameters A and b). Using the graph of t10 versus
specific energy input the values of the ore parameters may be calculated and the mode
one fracture toughness (Kic) may be calculated from the parameters (using Eq 3.16).
Tests were conducted on three different particle sizes to determine the effect of particle
size on results. In addition green granite and Yorkstone was used to determine the
accuracy of the results. One size fraction of Palabora ore was exposed to microwave
radiation for 60s at 2.6 kW to determine the whether or not the drop weight test is
sensitive enough to detect changes in strength due to microwave pre-treatment.
The t10 values were calculated automatically in Mathcad by use of the cubic spline curve
fitting function and A and b were calculated from the t10 and Ecs values by the least
squares method.
Microwave Treatment of Palabora Ore 8-19
Reaction 8.1
Reaction 8.2
8.5) Results and Discussion
8.5.1) Effect of Microwave Radiation on Mineralogy
Seven samples, subjected to microwave treatment for various time periods have been
investigated for mineralogical changes. The samples of material treated for 10 and 30
seconds exhibit no evidence of changes due to microwave treatment. The majority of
grains in the sample treated for 60 seconds are also unaffected, although a minute
quantity of magnetite have been oxidised to hematite (according to Reaction 8.1) along
the grain boundaries (Figure 8.12A) :
Some, of the sulphide grains also show a small degree of oxidation on the grain
boundaries. Metallic copper has formed on the grains boundaries of a few of the copper
containing grains. Microwave treatment for 90 seconds did not affect the mineralogy of
the majority of the grains. Oxidation did occur along a few grain boundaries - notably that
of magnetite to hematite, although the number of grains affected are still very small.
Some of the copper bearing particles have been oxidized along the grain boundaries
(Figure 8.12B and D). A small number of glass rich particles have also formed (Figure
8.12B). After 120 seconds of microwave heating, the number of grains affected by
microwave heating have increased. The mineral grains affected most obviously are the
bornite and chalcocite particles, which have metallic copper and hematite on the
boundaries. Some of the pyrite grains have also been oxidized according to Reaction 8.2 :
Microwave Treatment of Palabora Ore 8-20
Partial melting along the grain boundaries is proof of the high temperatures reached. The
partial melting of the magnetite typically results in the formation of bleb like and
dendritic (skeletal) magnetite. The fine grained melted magnetite exhibits a difference in
chemical composition compared to the original magnetite, in that the reflectivity is less -
implying the presence of magnesium enrichment from the magnesium spinels. Glass rich
fragments are abundant in this product, shown in Figure 8.12B.
After 180 and 240 seconds, the number of particles affected by microwave radiation has
increased significantly. Partial melting along the grain boundaries of magnetite grains can
be observed and oxidation to hematite can be more readily observed. Glass rich fragments
have also increased in these samples. It was also noted that fractures are abundant in the
non-microwaved samples. This made the recognition of extra fractures in the microwaved
samples very difficult.
Figure 8.12A shows the partial oxidation and replacement of a magnetite grain (medium
grey) by hematite (light grey/white). Oxidation is most prominent along the margins but
also toward the core regions of this grain. The partial melting of magnetite results in the
development of bleb-like dendritic magnetite that occur within the Ca-Si-rich glass (Fig
8.12B).
Microwave Treatment of Palabora Ore 8-21
A large amount of carbonate in this sample have been altered to CaOH. These porous
aggregates occur as liberated grains, intergrowths with the ore or as porous spheroids
associated with intergranular calcium ferrite, which may form as a result of the reaction
between carbonates and magnetite during microwave treatment.
Some copper bearing sulphide minerals have been altered as a result of microwave
treatment. For instance, pyrite may be decomposed to a porous iron-sulphur phase as
illustrated in Figure 8.12C. Certain sulphide minerals, in particular bornite, chalcopyrite
and chalcocite, exhibit corroded grain boundaries with hematite and copper formation
along these boundaries (Fig 8.12D).Valleriite, a copper bearing mineral with low
flotability, occurs along the margins and as intergrowths with the more abundant ore and
gangue and is largely unaffected by microwave radiation.. However, a small proportion
shows an increase in porosity. Sulphates are fairly common in this sample and may
represent the alteration products of former sulphide and carbonate aggregates.
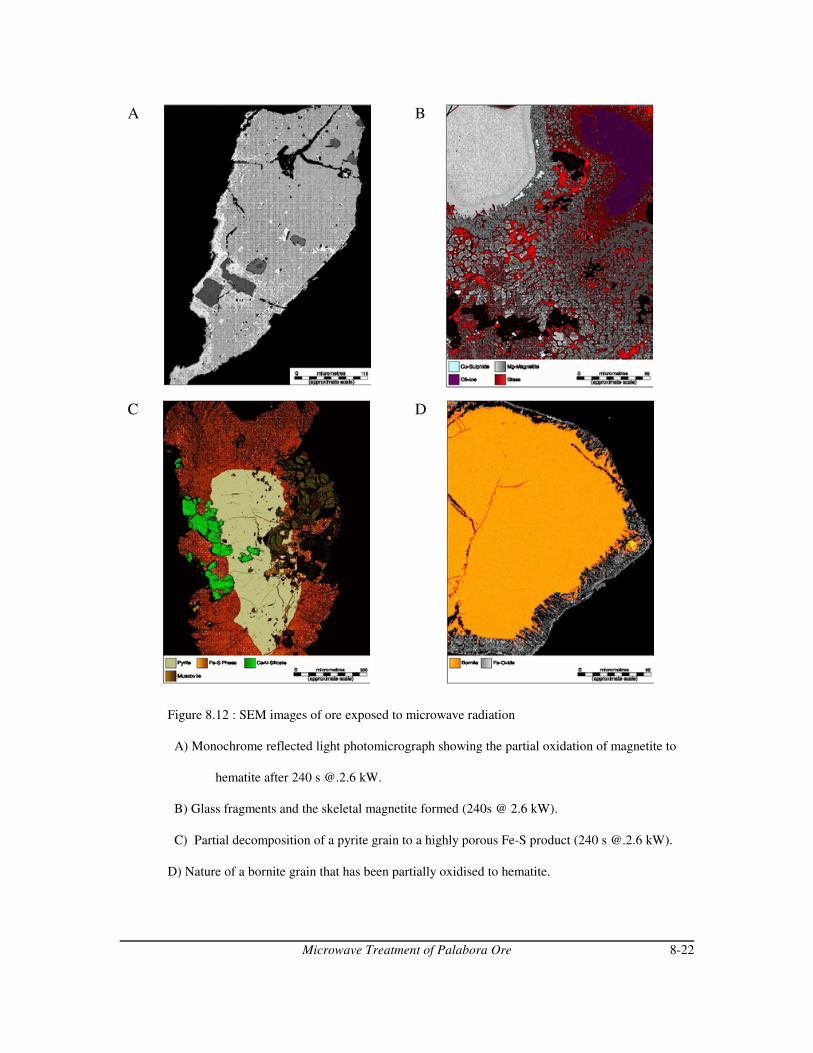
Microwave Treatment of Palabora Ore 8-22
A B
C D
Figure 8.12 : SEM images of ore exposed to microwave radiation
A) Monochrome reflected light photomicrograph showing the partial oxidation of magnetite to
hematite after 240 s @.2.6 kW.
B) Glass fragments and the skeletal magnetite formed (240s @ 2.6 kW).
C) Partial decomposition of a pyrite grain to a highly porous Fe-S product (240 s @.2.6 kW).
D) Nature of a bornite grain that has been partially oxidised to hematite.

Microwave Treatment of Palabora Ore 8-23
0
2
4
6
8
10
12
14
16
0 50 100 150 200 250 300
Exposure Time (s)
Wo
rk I
nd
ex (
kW
h/t
)
2.6 kW 1.3 kW 1.5 kW
8.5.2) Effect of Microwave Radiation on Grindability
It has been shown (Kingman et al, 2000) that microwave radiation effectively reduces the
work index of Palabora ore, as is shown in Figure 8.13 :
Figure 8.13 : The reduction in work index achieved in different microwave units as a function
of time (after Kingman et al, 2000), using 1 kg batches
It should be noted from Figure 8.13, that long microwave exposure times are not
necessarily equivalent to larger reductions in work index. This is because the rapid
differential heating during the first few seconds of radiation is sufficient to cause
intergranular fracture. Longer exposure times only serves to melt the ore, as was shown
from the mineralogy report, which has detrimental effects on down stream processing.
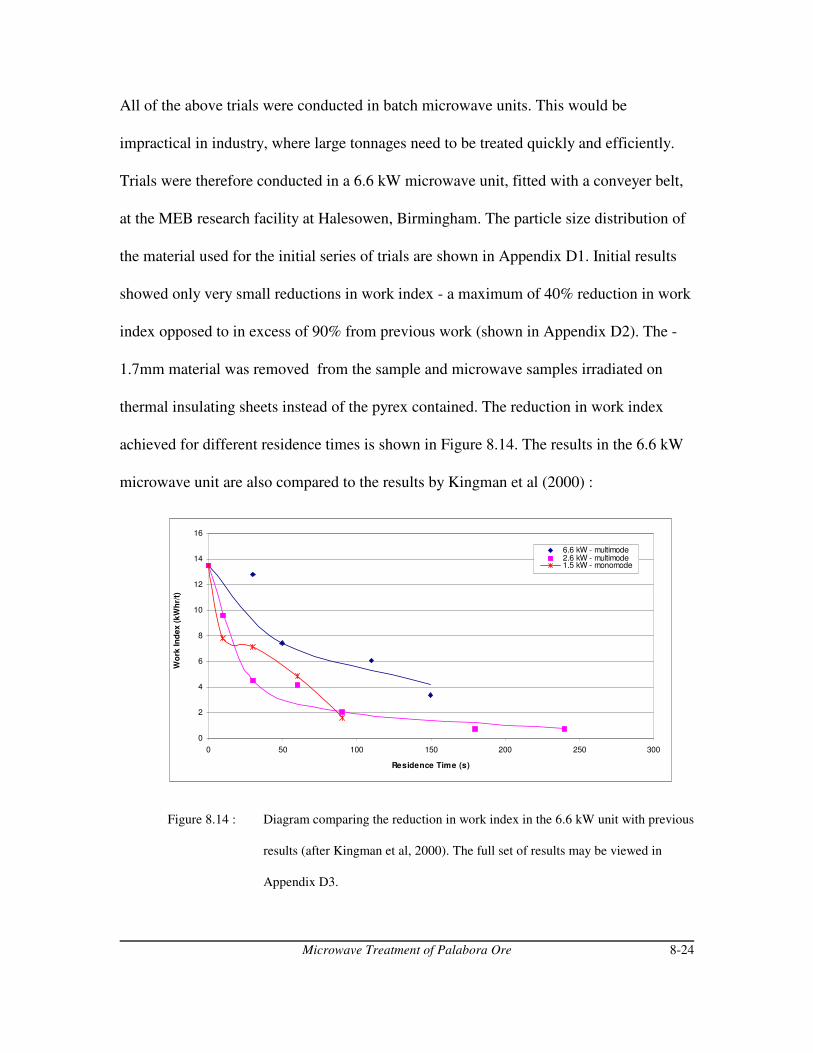
Microwave Treatment of Palabora Ore 8-24
0
2
4
6
8
10
12
14
16
0 50 100 150 200 250 300
Residence Time (s)
Wo
rk In
dex (
kW
hr/
t)
6.6 kW - multimode2.6 kW - multimode1.5 kW - monomode
All of the above trials were conducted in batch microwave units. This would be
impractical in industry, where large tonnages need to be treated quickly and efficiently.
Trials were therefore conducted in a 6.6 kW microwave unit, fitted with a conveyer belt,
at the MEB research facility at Halesowen, Birmingham. The particle size distribution of
the material used for the initial series of trials are shown in Appendix D1. Initial results
showed only very small reductions in work index - a maximum of 40% reduction in work
index opposed to in excess of 90% from previous work (shown in Appendix D2). The -
1.7mm material was removed from the sample and microwave samples irradiated on
thermal insulating sheets instead of the pyrex contained. The reduction in work index
achieved for different residence times is shown in Figure 8.14. The results in the 6.6 kW
microwave unit are also compared to the results by Kingman et al (2000) :
Figure 8.14 : Diagram comparing the reduction in work index in the 6.6 kW unit with previous
results (after Kingman et al, 2000). The full set of results may be viewed in
Appendix D3.
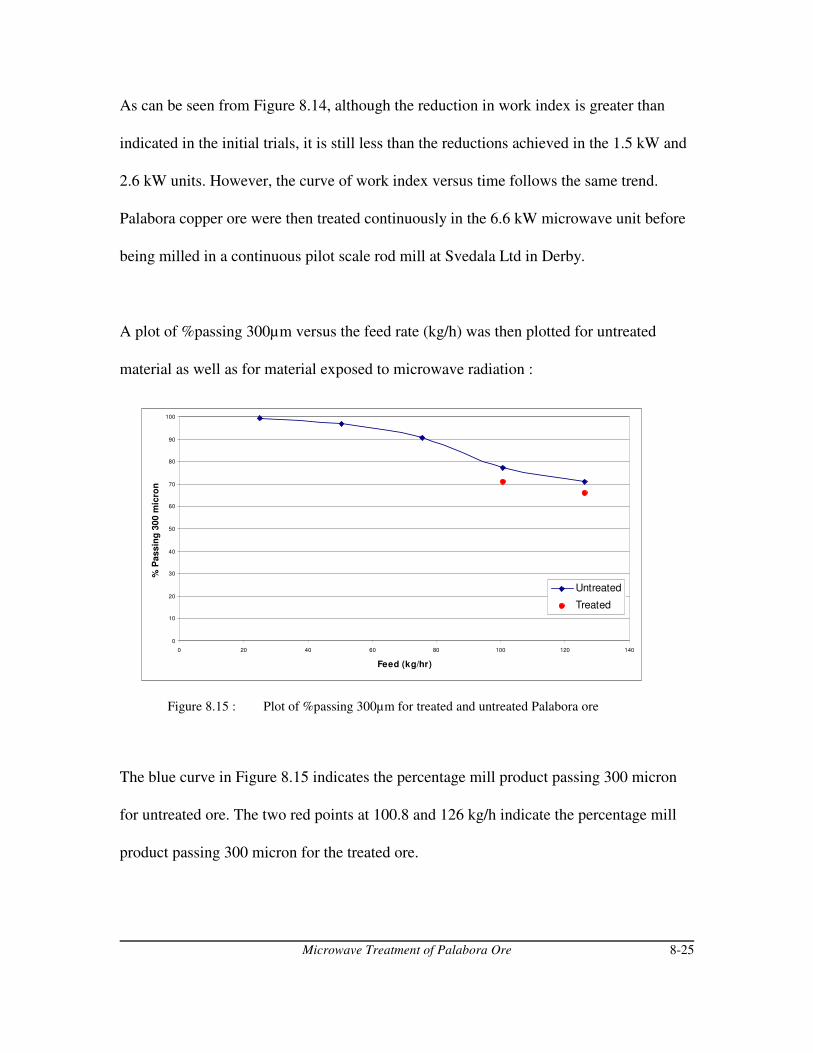
Microwave Treatment of Palabora Ore 8-25
0
10
20
30
40
50
60
70
80
90
100
0 20 40 60 80 100 120 140
Feed (kg/hr)
% P
assin
g 3
00 m
icro
n
Untreated
Treated
As can be seen from Figure 8.14, although the reduction in work index is greater than
indicated in the initial trials, it is still less than the reductions achieved in the 1.5 kW and
2.6 kW units. However, the curve of work index versus time follows the same trend.
Palabora copper ore were then treated continuously in the 6.6 kW microwave unit before
being milled in a continuous pilot scale rod mill at Svedala Ltd in Derby.
A plot of %passing 300µm versus the feed rate (kg/h) was then plotted for untreated
material as well as for material exposed to microwave radiation :
Figure 8.15 : Plot of %passing 300µm for treated and untreated Palabora ore
The blue curve in Figure 8.15 indicates the percentage mill product passing 300 micron
for untreated ore. The two red points at 100.8 and 126 kg/h indicate the percentage mill
product passing 300 micron for the treated ore.
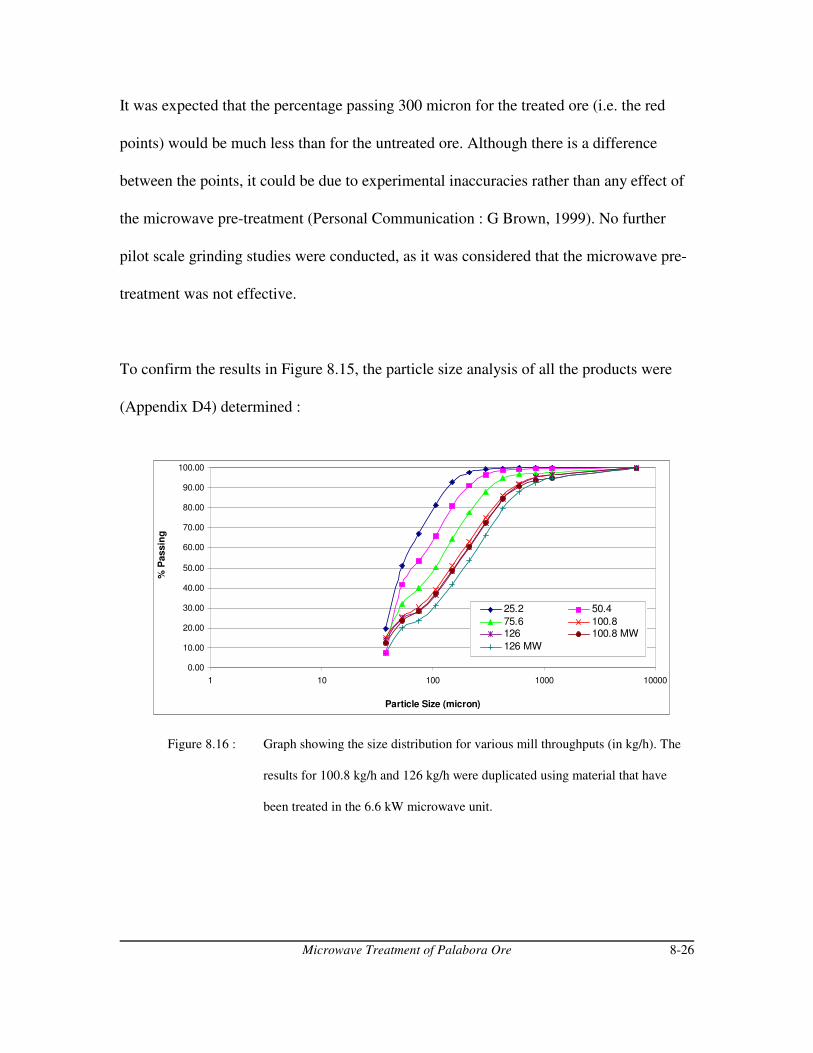
Microwave Treatment of Palabora Ore 8-26
0.00
10.00
20.00
30.00
40.00
50.00
60.00
70.00
80.00
90.00
100.00
1 10 100 1000 10000
Particle Size (micron)
% P
assin
g
25.2 50.4
75.6 100.8126 100.8 MW
126 MW
It was expected that the percentage passing 300 micron for the treated ore (i.e. the red
points) would be much less than for the untreated ore. Although there is a difference
between the points, it could be due to experimental inaccuracies rather than any effect of
the microwave pre-treatment (Personal Communication : G Brown, 1999). No further
pilot scale grinding studies were conducted, as it was considered that the microwave pre-
treatment was not effective.
To confirm the results in Figure 8.15, the particle size analysis of all the products were
(Appendix D4) determined :
Figure 8.16 : Graph showing the size distribution for various mill throughputs (in kg/h). The
results for 100.8 kg/h and 126 kg/h were duplicated using material that have
been treated in the 6.6 kW microwave unit.
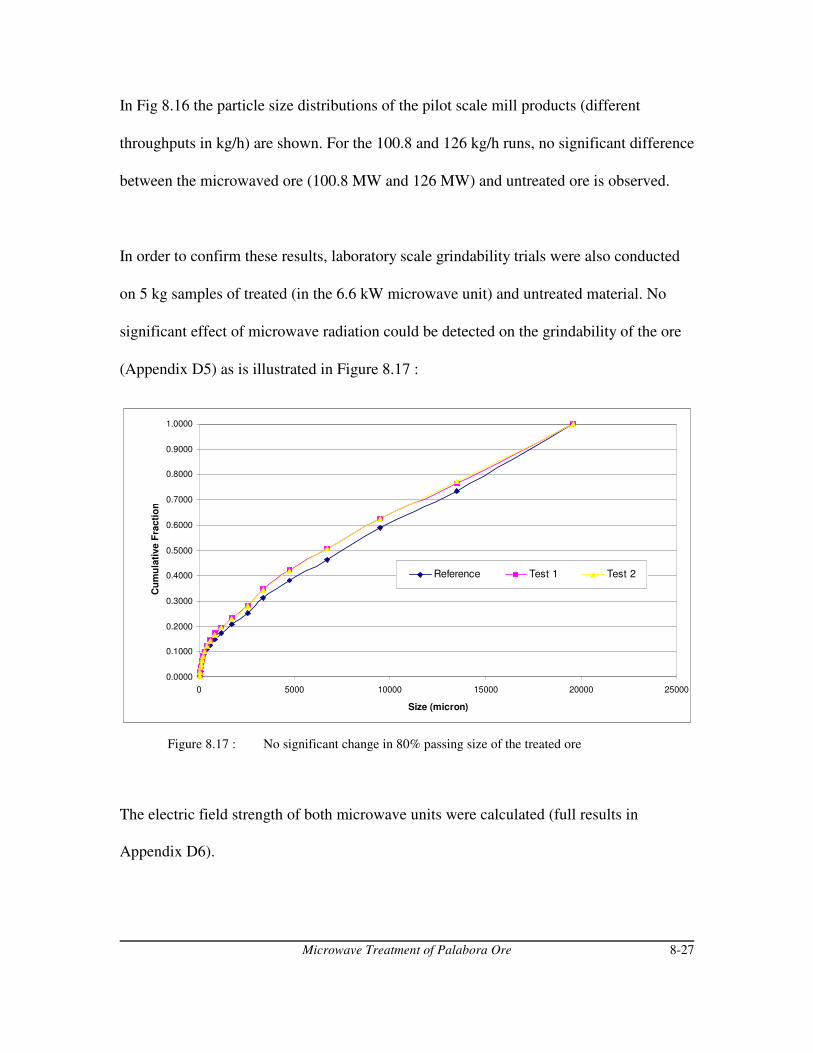
Microwave Treatment of Palabora Ore 8-27
0.0000
0.1000
0.2000
0.3000
0.4000
0.5000
0.6000
0.7000
0.8000
0.9000
1.0000
0 5000 10000 15000 20000 25000
Size (micron)
Cu
mu
lati
ve F
racti
on
Reference Test 1 Test 2
In Fig 8.16 the particle size distributions of the pilot scale mill products (different
throughputs in kg/h) are shown. For the 100.8 and 126 kg/h runs, no significant difference
between the microwaved ore (100.8 MW and 126 MW) and untreated ore is observed.
In order to confirm these results, laboratory scale grindability trials were also conducted
on 5 kg samples of treated (in the 6.6 kW microwave unit) and untreated material. No
significant effect of microwave radiation could be detected on the grindability of the ore
(Appendix D5) as is illustrated in Figure 8.17 :
Figure 8.17 : No significant change in 80% passing size of the treated ore
The electric field strength of both microwave units were calculated (full results in
Appendix D6).
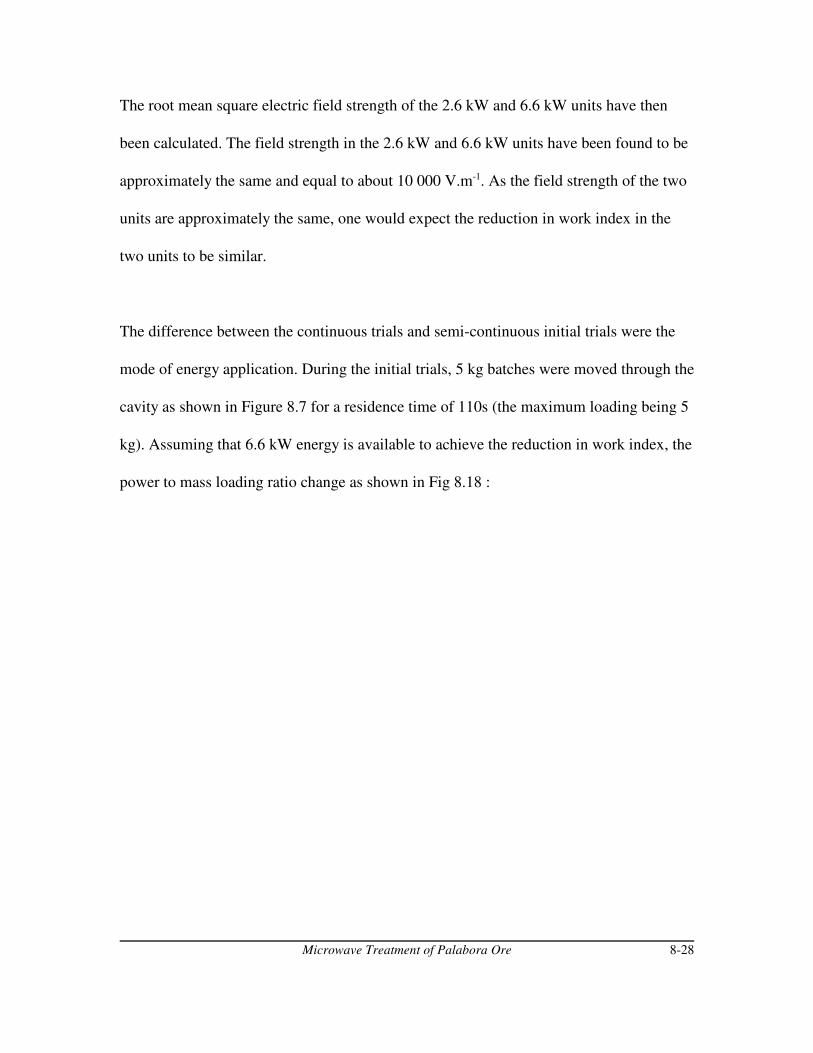
Microwave Treatment of Palabora Ore 8-28
The root mean square electric field strength of the 2.6 kW and 6.6 kW units have then
been calculated. The field strength in the 2.6 kW and 6.6 kW units have been found to be
approximately the same and equal to about 10 000 V.m-1. As the field strength of the two
units are approximately the same, one would expect the reduction in work index in the
two units to be similar.
The difference between the continuous trials and semi-continuous initial trials were the
mode of energy application. During the initial trials, 5 kg batches were moved through the
cavity as shown in Figure 8.7 for a residence time of 110s (the maximum loading being 5
kg). Assuming that 6.6 kW energy is available to achieve the reduction in work index, the
power to mass loading ratio change as shown in Fig 8.18 :

Microwave Treatment of Palabora Ore 8-29
0
10
20
30
40
0.00 20.00 40.00 60.00 80.00 100.00
Time (s)
Po
wer
Availab
le (
kW
/kg
)
Figure 8.18 : The change in mass loading has on the available power for work index reduction
for the initial semi continuous trials
For the continuous trials, the mass of material exposed to microwave radiation at any one
time was 5 kg. The weighted average of available power for the semi-continuous trials is
5.2 kW/kg as compared to the minimum value (the value for the continuous trials) of 1.32
kW/kg (calculations in Appendix D7).
Particle size effect of microwave treatment
Shown below is a plot of reduction in work index for a variety of initial particle sizes
(particle size distributions and calculations in Appendix D8) :
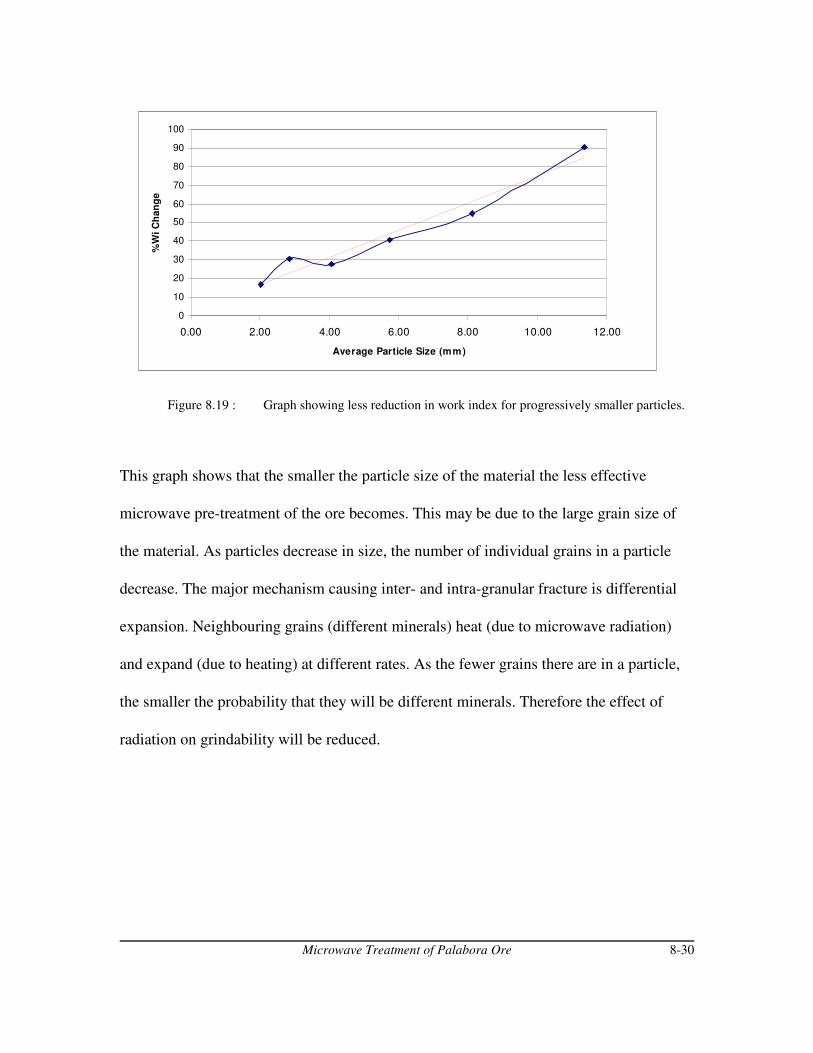
Microwave Treatment of Palabora Ore 8-30
0
10
20
30
40
50
60
70
80
90
100
0.00 2.00 4.00 6.00 8.00 10.00 12.00
Average Particle Size (mm)
%W
i C
han
ge
Figure 8.19 : Graph showing less reduction in work index for progressively smaller particles.
This graph shows that the smaller the particle size of the material the less effective
microwave pre-treatment of the ore becomes. This may be due to the large grain size of
the material. As particles decrease in size, the number of individual grains in a particle
decrease. The major mechanism causing inter- and intra-granular fracture is differential
expansion. Neighbouring grains (different minerals) heat (due to microwave radiation)
and expand (due to heating) at different rates. As the fewer grains there are in a particle,
the smaller the probability that they will be different minerals. Therefore the effect of
radiation on grindability will be reduced.
Microwave Treatment of Palabora Ore 8-31
0.00
0.20
0.40
0.60
0.80
1.00
1.20
1.40
0 100 200 300 400 500 600 700
Milling Time (s)
Fra
cti
on
of
Wo
rk In
dex
Area A Area AB Area ABC Area ABD Area ABCDE
The first property to be studied was the effect of sample area exposed to microwave
radiation. The microwave cavity (2.6 kW) was divided into different areas as shown in
Figure 8.9. Samples of 500g material were placed on the different areas and exposed to
microwave radiation for 60s before being quenched and dried overnight. The relative
grindability was then determined (results and calculations are shown in Appendix D13) :
Figure 8.20 : Fraction of work index versus milling time for samples exposed to microwave
radiation on different areas in the cavity
Figure 8.20 illustrates a few important characteristics. It confirms that the reduction in
work index is independent on the milling time (within reason). Generally it shows that the
larger reduction in work index occur on area AB followed by area A with the least effect
on area ABC.
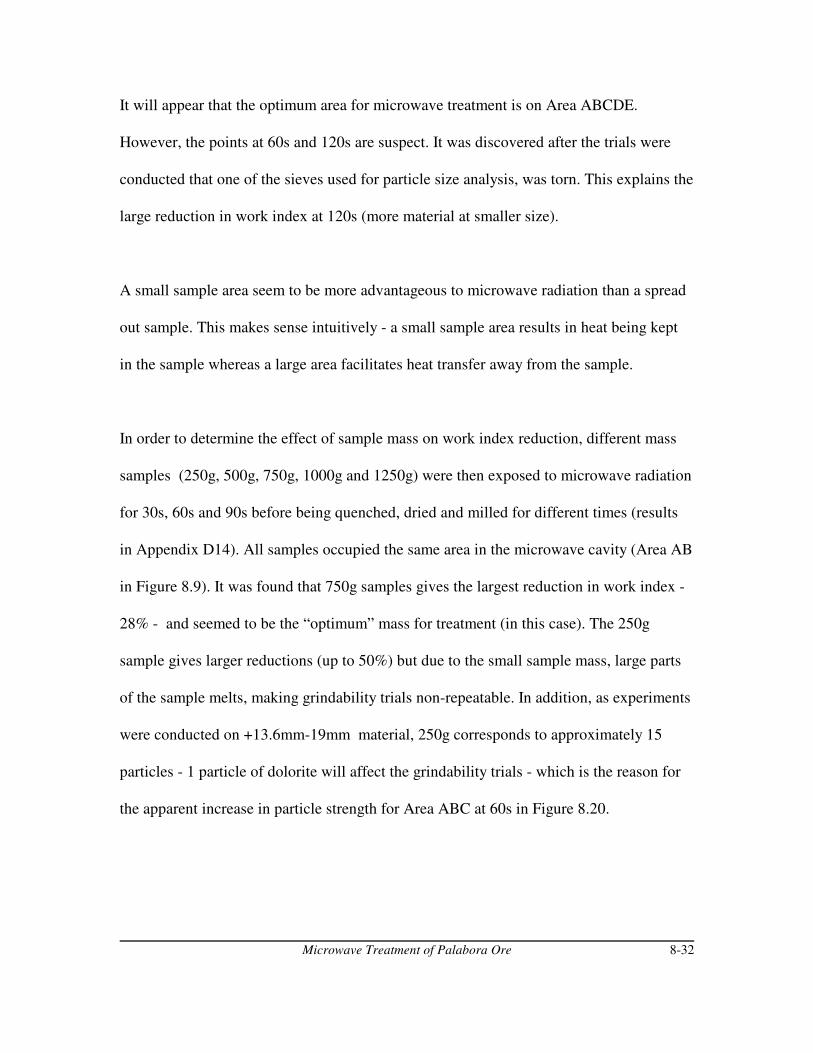
Microwave Treatment of Palabora Ore 8-32
It will appear that the optimum area for microwave treatment is on Area ABCDE.
However, the points at 60s and 120s are suspect. It was discovered after the trials were
conducted that one of the sieves used for particle size analysis, was torn. This explains the
large reduction in work index at 120s (more material at smaller size).
A small sample area seem to be more advantageous to microwave radiation than a spread
out sample. This makes sense intuitively - a small sample area results in heat being kept
in the sample whereas a large area facilitates heat transfer away from the sample.
In order to determine the effect of sample mass on work index reduction, different mass
samples (250g, 500g, 750g, 1000g and 1250g) were then exposed to microwave radiation
for 30s, 60s and 90s before being quenched, dried and milled for different times (results
in Appendix D14). All samples occupied the same area in the microwave cavity (Area AB
in Figure 8.9). It was found that 750g samples gives the largest reduction in work index -
28% - and seemed to be the “optimum” mass for treatment (in this case). The 250g
sample gives larger reductions (up to 50%) but due to the small sample mass, large parts
of the sample melts, making grindability trials non-repeatable. In addition, as experiments
were conducted on +13.6mm-19mm material, 250g corresponds to approximately 15
particles - 1 particle of dolorite will affect the grindability trials - which is the reason for
the apparent increase in particle strength for Area ABC at 60s in Figure 8.20.
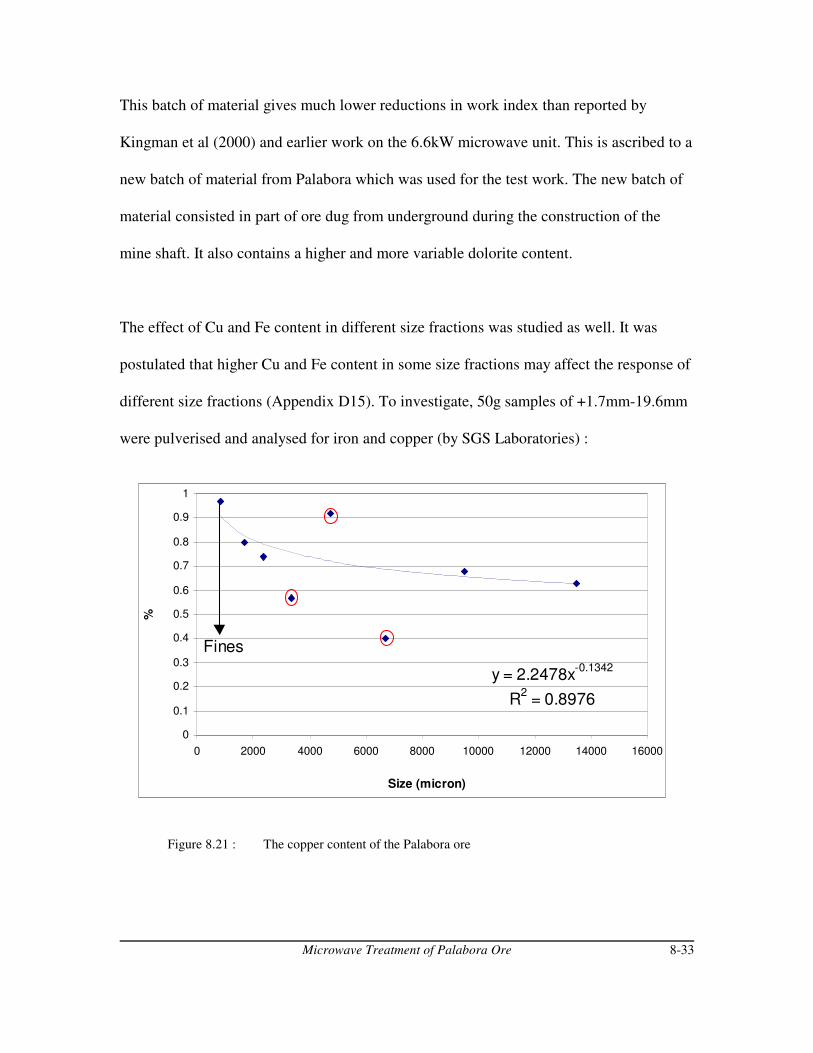
Microwave Treatment of Palabora Ore 8-33
y = 2.2478x-0.1342
R2 = 0.8976
0
0.1
0.2
0.3
0.4
0.5
0.6
0.7
0.8
0.9
1
0 2000 4000 6000 8000 10000 12000 14000 16000
Size (micron)
%
Fines
This batch of material gives much lower reductions in work index than reported by
Kingman et al (2000) and earlier work on the 6.6kW microwave unit. This is ascribed to a
new batch of material from Palabora which was used for the test work. The new batch of
material consisted in part of ore dug from underground during the construction of the
mine shaft. It also contains a higher and more variable dolorite content.
The effect of Cu and Fe content in different size fractions was studied as well. It was
postulated that higher Cu and Fe content in some size fractions may affect the response of
different size fractions (Appendix D15). To investigate, 50g samples of +1.7mm-19.6mm
were pulverised and analysed for iron and copper (by SGS Laboratories) :
Figure 8.21 : The copper content of the Palabora ore

Microwave Treatment of Palabora Ore 8-34
0
1000
2000
3000
4000
5000
6000
0 100 200 300 400 500 600 700
Milling Time
80%
Passin
g S
ize
Ref, -9.5+1.7, Mag
Ref, -9.5+1.7, non-Mag
60s, -9.5+1.7, Mag
60s, -9.5+1.7, non-Mag
The average iron content is 19% and is not indicated on this graph (see Appendix D15).
Assuming that the three points circled in red are due to inaccurate sampling (50g from
500kg), it can be seen that there is a decrease in copper content with increasing particle
size. This makes intuitively sense as the milling size on site is 300µm (liberation size for
the copper for flotation). The fines (-1.7mm) would therefore register more copper.
The effect of magnetic and non-magnetic fractions in different size fractions was also
studied. It was postulated that the magnetic fractions would respond far better to
microwave radiation as the bulk of magnetite (an extremely good microwave receptor)
should be in the magnetic fraction. The magnetic and non magnetic fractions were
separated in different particle sizes, using a rare-earth magnet.
Figure 8.22 : 80% passing size versus milling time for references (unexposed) and microwave
irradiated ore for magnetic and non magnetic fractions of the ore

Microwave Treatment of Palabora Ore 8-35
From Figure 8.22 it can be seen that there is no great difference in microwave response
for the magnetic and non-magnetic fractions. The non-magnetic sample has a lower
grindability (possibly due to dolorite) than the magnetic sample. A new sample was
received (which was used for this test work). As this sample comes from a different
location (far away from the original sample locations in the open pit), it is thought that
this material contains material susceptible to microwave radiation - explaining the small
reductions in work index.
The dielectric properties of Palabora ore, as well as that of magnetite and calcite, were
estimated using a TM010 cavity at the University of Nottingham (as described in Chapter
2). The values are tabulated in Table 8.1 :
Table 8.1 : Dielectric data of two samples of Palabora ore, quartz and
magnetite
Mineral Dielectric Constant Mineral Dielectric Constant
Palabora 1 3.100 - 0.0379@i Quartz 2.862 - 0.216@i
Palabora 2 2.76 - 0.0424@i Magnetite 6.418 - 0.150@i
Microwave Treatment of Palabora Ore 8-36
Arai et al, 1995, proposed that the dielectric properties of a binary mineral mixture may
be estimated from the dielectric permittivities of the individual components and the
following equations :
Using these equations, the permittivity of the Palabora ore may be estimated assuming
that the ore consists of 75% quartz and 25% magnetite. The two estimates are 3.157 +
0.031@i and 3.139 + 0.03@i, which correspond well with the measured values in Table 8.3
(full calculations and results in Appendix D17).
The heterogenous nature of the Palabora ore made single particle breakage tests on the
load frame nearly impossible. Results are shown in Appendix D18. The average value of
the force required for breakage was 1.625 kN with a standard deviation of 1112. No
further tests were done on single particles using the load frame.
Figure 8.23 shows the percentage decrease in work index to induce catastrophic fracture
of different diameter cores versus microwave exposure time. This graph indicates that the
strength of Palabora ore is significantly affected by exposure to microwave radiation and
that the three point bend test is able to register this change (results and calculations are
shown in Appendix D19).
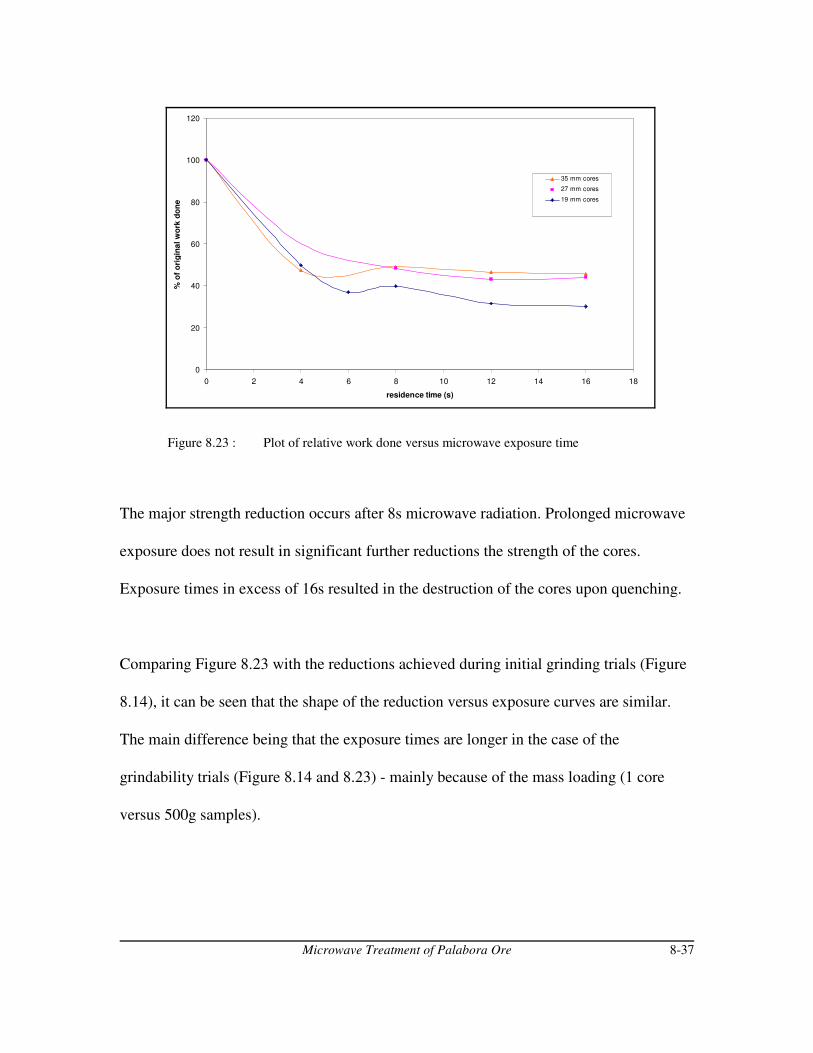
Microwave Treatment of Palabora Ore 8-37
0
20
40
60
80
100
120
0 2 4 6 8 10 12 14 16 18
residence time (s)
% o
f o
rig
ina
l w
ork
do
ne
35 mm cores
27 mm cores
19 mm cores
Figure 8.23 : Plot of relative work done versus microwave exposure time
The major strength reduction occurs after 8s microwave radiation. Prolonged microwave
exposure does not result in significant further reductions the strength of the cores.
Exposure times in excess of 16s resulted in the destruction of the cores upon quenching.
Comparing Figure 8.23 with the reductions achieved during initial grinding trials (Figure
8.14), it can be seen that the shape of the reduction versus exposure curves are similar.
The main difference being that the exposure times are longer in the case of the
grindability trials (Figure 8.14 and 8.23) - mainly because of the mass loading (1 core
versus 500g samples).
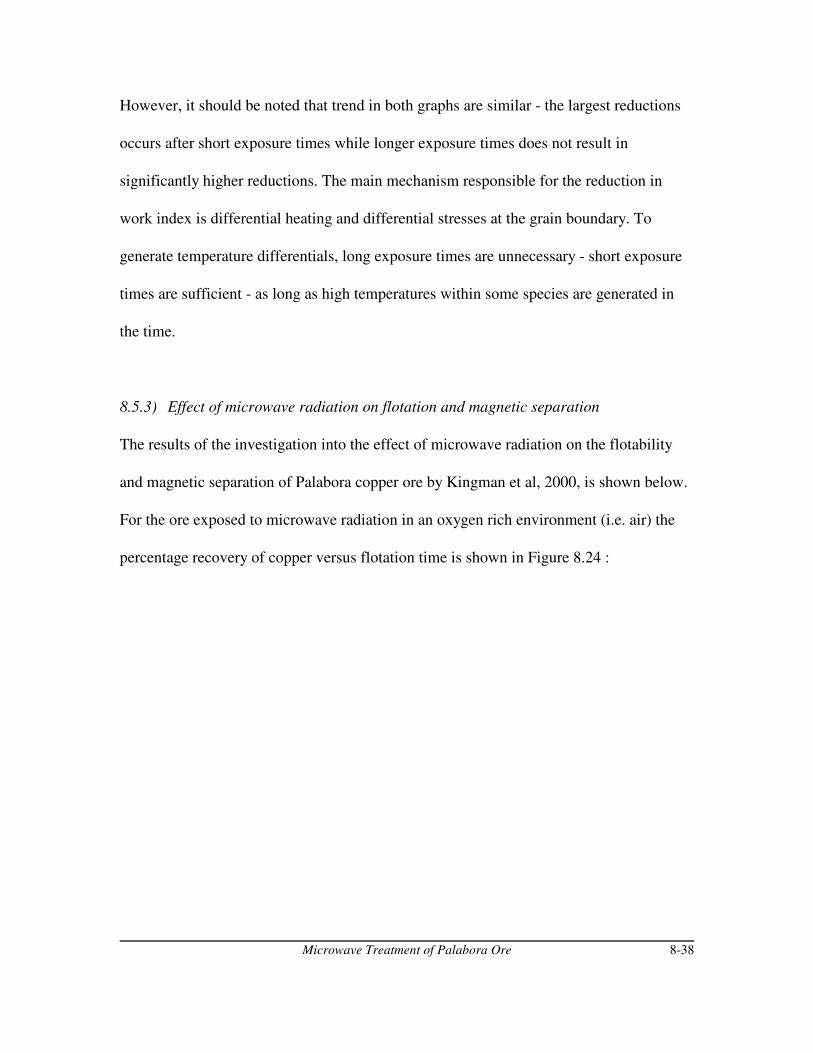
Microwave Treatment of Palabora Ore 8-38
However, it should be noted that trend in both graphs are similar - the largest reductions
occurs after short exposure times while longer exposure times does not result in
significantly higher reductions. The main mechanism responsible for the reduction in
work index is differential heating and differential stresses at the grain boundary. To
generate temperature differentials, long exposure times are unnecessary - short exposure
times are sufficient - as long as high temperatures within some species are generated in
the time.
8.5.3) Effect of microwave radiation on flotation and magnetic separation
The results of the investigation into the effect of microwave radiation on the flotability
and magnetic separation of Palabora copper ore by Kingman et al, 2000, is shown below.
For the ore exposed to microwave radiation in an oxygen rich environment (i.e. air) the
percentage recovery of copper versus flotation time is shown in Figure 8.24 :
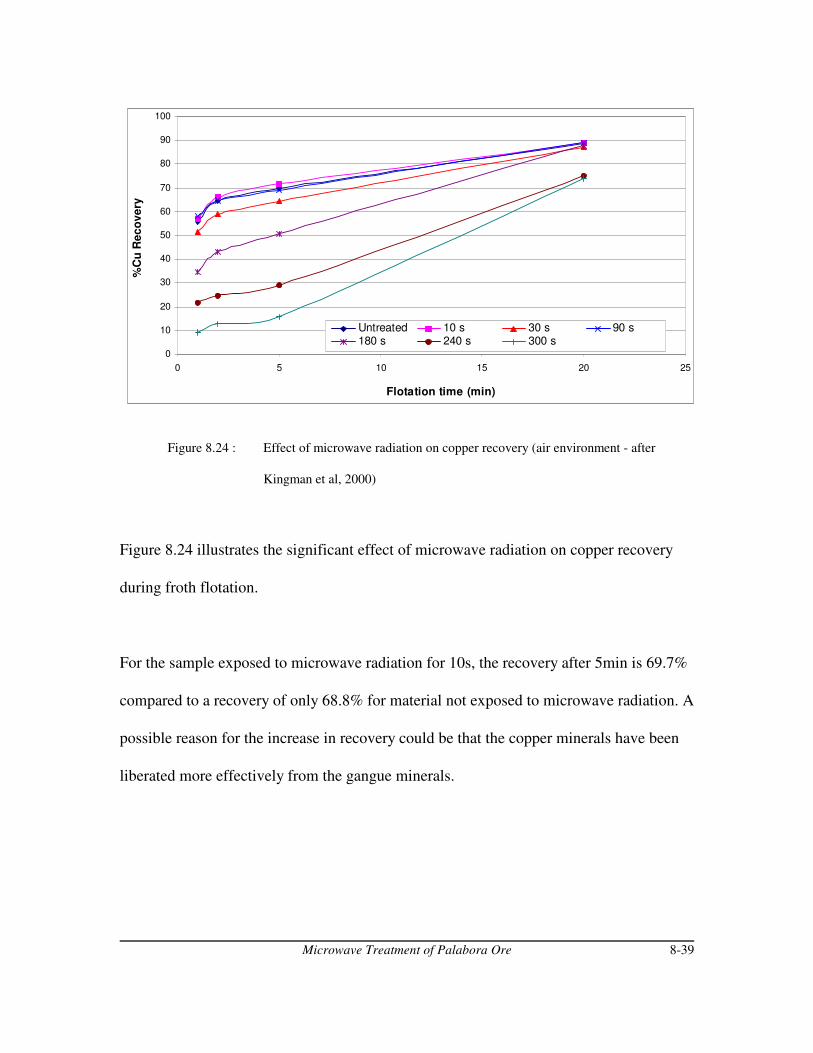
Microwave Treatment of Palabora Ore 8-39
0
10
20
30
40
50
60
70
80
90
100
0 5 10 15 20 25
Flotation time (min)
%C
u R
ec
ov
ery
Untreated 10 s 30 s 90 s180 s 240 s 300 s
Figure 8.24 : Effect of microwave radiation on copper recovery (air environment - after
Kingman et al, 2000)
Figure 8.24 illustrates the significant effect of microwave radiation on copper recovery
during froth flotation.
For the sample exposed to microwave radiation for 10s, the recovery after 5min is 69.7%
compared to a recovery of only 68.8% for material not exposed to microwave radiation. A
possible reason for the increase in recovery could be that the copper minerals have been
liberated more effectively from the gangue minerals.
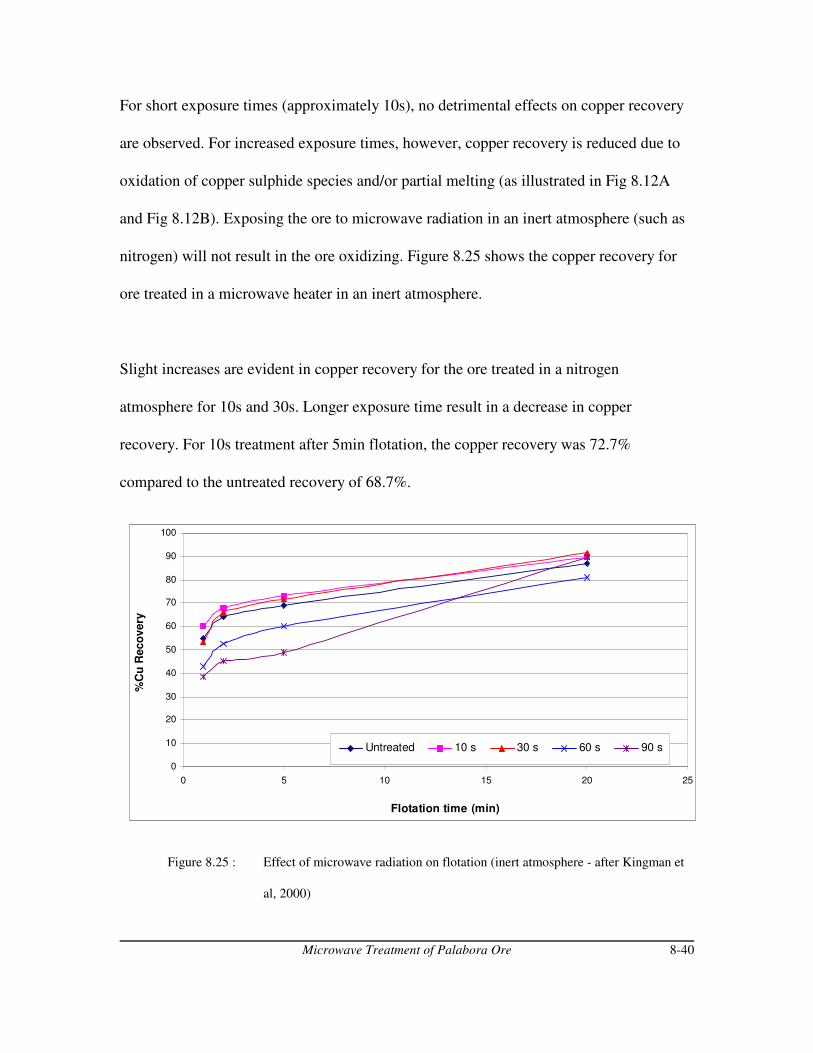
Microwave Treatment of Palabora Ore 8-40
0
10
20
30
40
50
60
70
80
90
100
0 5 10 15 20 25
Flotation time (min)
%C
u R
eco
very
Untreated 10 s 30 s 60 s 90 s
For short exposure times (approximately 10s), no detrimental effects on copper recovery
are observed. For increased exposure times, however, copper recovery is reduced due to
oxidation of copper sulphide species and/or partial melting (as illustrated in Fig 8.12A
and Fig 8.12B). Exposing the ore to microwave radiation in an inert atmosphere (such as
nitrogen) will not result in the ore oxidizing. Figure 8.25 shows the copper recovery for
ore treated in a microwave heater in an inert atmosphere.
Slight increases are evident in copper recovery for the ore treated in a nitrogen
atmosphere for 10s and 30s. Longer exposure time result in a decrease in copper
recovery. For 10s treatment after 5min flotation, the copper recovery was 72.7%
compared to the untreated recovery of 68.7%.
Figure 8.25 : Effect of microwave radiation on flotation (inert atmosphere - after Kingman et
al, 2000)

Microwave Treatment of Palabora Ore 8-41
70
72
74
76
78
80
82
84
0 10 20 30 40 50 60 70 80 90 100Microwave Exposure Time (s)
%R
ec
ov
ery
of
Fe
rro
us
Fe
1.3 kW (air) 2.6 kW (air) 1.5 kW (N2)
Figure 8.26 illustrates the effect of microwave radiation on recovery of ferrous Fe during
magnetic separation trials.
Figure 8.26 : Effect of different power level microwave radiation treatment on the recovery of
ferrous Fe (after Kingman et al, 2000)
Figure 8.26 illustrates that microwave radiation had significant effects on the recovery of
iron during magnetic separation trials. Within 10s of microwave exposure (at 2.6kW) the
recovery is 77% compared to only 72% for untreated ore. For prolonged microwave
radiation (in excess of 90s) the recovery of iron would have decreased due to the
oxidation and partial melting of mineral species in the ore. Increased recoveries are most
likely due to increased mineral liberation due to microwave exposure.
Microwave Treatment of Palabora Ore 8-42
67.805
21.487
t10_1319i
t10_1924i
t10_2436j
2.5010.065 et_1319i
et_1924i
, et_2436j
,
0 0.5 1 1.5 2 2.5 320
30
40
50
60
70
Specific Input Energy (kWh/t)
t10
Equation 3.15
8.5.4) The use of the Drop Weight Testing Rig to quantify rock strength
The results and calculations may be seen in Appendix D20. The plot of t10 versus for the
Palabora ore is shown in Fig 8.27 :
Figure 8.27 : Plot of t10 vs Ecs for 3 size classes of Palabora ore (red 13-19mm, blue 19-
24mm, black 24-36mm)
Using the method of least squares to fit the curve (described by Eq 3.15, see Chapter 3) :
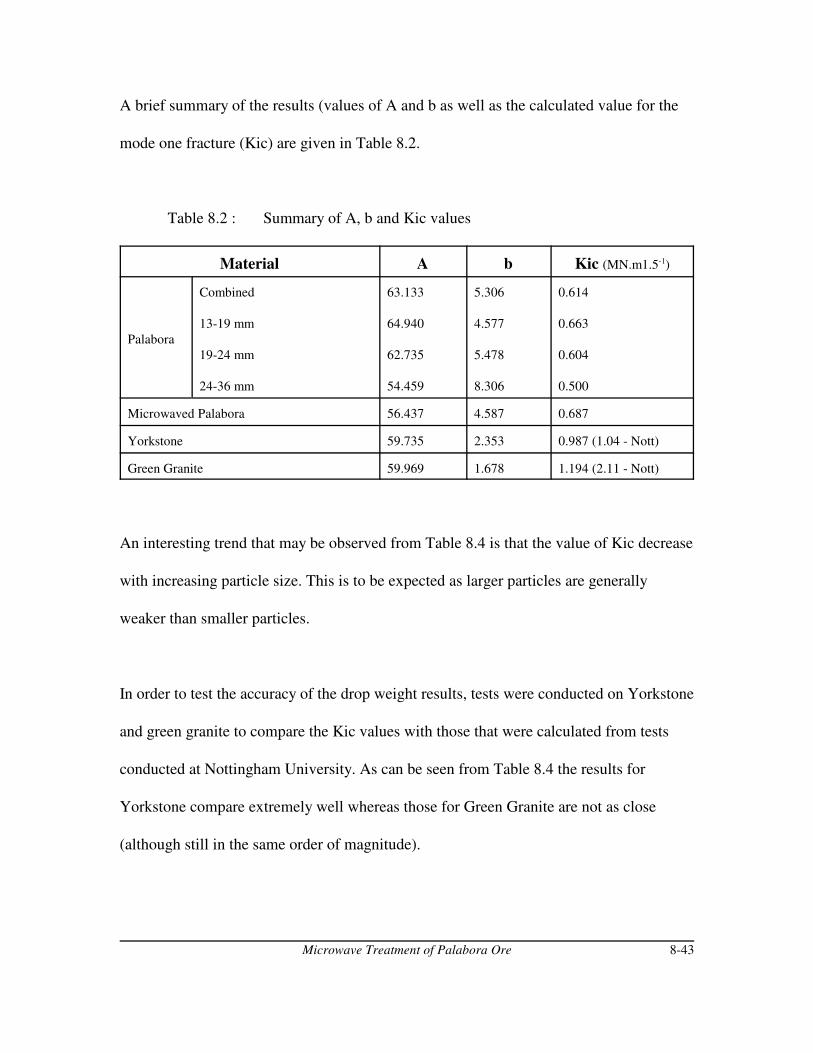
Microwave Treatment of Palabora Ore 8-43
A brief summary of the results (values of A and b as well as the calculated value for the
mode one fracture (Kic) are given in Table 8.2.
Table 8.2 : Summary of A, b and Kic values
Material A b Kic (MN.m1.5-1)
Palabora
Combined
13-19 mm
19-24 mm
24-36 mm
63.133
64.940
62.735
54.459
5.306
4.577
5.478
8.306
0.614
0.663
0.604
0.500
Microwaved Palabora 56.437 4.587 0.687
Yorkstone 59.735 2.353 0.987 (1.04 - Nott)
Green Granite 59.969 1.678 1.194 (2.11 - Nott)
An interesting trend that may be observed from Table 8.4 is that the value of Kic decrease
with increasing particle size. This is to be expected as larger particles are generally
weaker than smaller particles.
In order to test the accuracy of the drop weight results, tests were conducted on Yorkstone
and green granite to compare the Kic values with those that were calculated from tests
conducted at Nottingham University. As can be seen from Table 8.4 the results for
Yorkstone compare extremely well whereas those for Green Granite are not as close
(although still in the same order of magnitude).
Microwave Treatment of Palabora Ore 8-44
Tests were also conducted on Palabora ore (13-19mm) treated in a microwave heater at
2.6 kW for 60s. Previous work have indicated that large reductions in work index are
possible for Palabora ore. However, tests conducted using the drop weight tester,
indicates that the microwaved ore is stronger than the untreated ore. As the ore was not
exposed to such an extent that partial melting should have occurred - it was expected that
the ore would have been weakened. However, Palabora ore consists of large proportions
of non-microwave receptive dolorite which are extremely hard. It is conceivable that the
50 particles used for microwave treatment and subsequent testing, consisted of slightly
more dolorite particles and would therefore not be weakened by the pre-treatment.
In addition, it is also possible that the mass was being released from an excessive height,
i.e. an excessive amount of energy was being used to crush the ore, making small changes
in strength impossible to detect.
Microwave Treatment of Palabora Ore 8-45
8.6) Conclusions
Experimental work has shown that the mineralogy of Palabora ore may be affected by
microwave radiation, the extent of the change are dependant on the time of exposure.
Extended exposure times do not necessarily yield larger reductions in work index, with
the main reduction in work index taking place in the initial period.
It has been shown that treatment of up to 165 kg/h of Palabora ore is possible on a pilot
scale microwave unit. No reduction in work index was noticed during pilot scale milling
or laboratory trials after continuous microwave treatment. This is attributed to the
constant load in the microwave heater.
It is postulated that a semi-continuous system of treating batches of 5 kg (continuously
changing the load in the cavity) will overcome this problem, although it will result in only
half the feed (i.e. 83 kg/h) on the current system. A pulsating power source might also be
used to achieve the same effect.
Various experiments regarding the area and mass loading in the microwave cavities, were
conducted. These showed that each microwave cavity has an optimum area of treatment
as well as an optimum mass load. These should be found for any microwave unit before
full scale operation will be possible.
Microwave Treatment of Palabora Ore 8-46
Thus far all microwave units were basically domestic microwave units - designed with
the dielectric properties of water. More care will have to be taken in future design of
cavities - to adapt to the specific properties of the ore.
The mixture equations of Arai et al, 1995, has been shown to hold for the Palabora ore.
This ore is “ideal” in that it consists of mainly 2 components - magnetite and gangue
(assumed to be calcite). It has also been shown that the three point bend test may be used
as an alternative method to quantify the effect of microwave radiation on the ore.
It has also been illustrated that, in order to do a full economic evaluation of the feasibility
of microwave pre-treatment of Palabora ore, attention will need to be paid to possible
increases in recovery in downstream processing, in addition to the benefits regarding
comminution energy.
Overall this study has shown the three-point bend test to be as reliable as the Berry and
Bruce grinding method, in terms of its ability to quantify a decrease in rock strength due
to thermal pre-treatment. Furthermore the Three-point bend test surpasses the Berry and
Bruce method in that it is easily reproducible, requiring little sample preparation and
considerably less time to conduct. In addition a large number of specimens can be
produced from a relatively small volume of rock material, be it bulk sample or expensive
drill core.
Microwave Treatment of Palabora Ore 8-47
Initial trials conducted on Palabora ore, Yorkstone and green granite indicates that the
drop weight test rig is capable of detecting different material strengths. It detects slightly
different values for different particle sizes in the case of Palabora (increased particle size
corresponding to lower values for Kic). This makes intuitively sense as larger particles
are generally weaker than larger ones. Acceptable mode I fracture toughness values have
been calculated for Yorkstone and green granite.
Further work is required to assess definitively the affect of various factors (particle size,
ore strength, input energy etc) on the accuracy of the drop weight test procedure.
Microwave Treatment of Palabora Ore 8-48
The following papers regarding work in this chapter have been published/accepted for
publication :
1) “The effect of microwave radiation on the processing of Palabora copper ore”
by Kingman, Vorster and Rowson in the Journal of SAIMM, May/June 2000
vol 100, no 3
2) “The influence of mineralogy on microwave assisted grinding” by Kingman,
Vorster and Rowson, Minerals Engineering, 2000, vol 13, no 3, pp 313-327,
Pergamon
3) “Applications of microwave radiation for the processing of minerals” by
Vorster, Kingman and Rowson in the Proceedings of the 9th SAICHE National
Meeting, 2000
4) “The use of the three point bend test to quantify the effects of thermal pre-
treatment on rock strength” by Campbell, Vorster, Merchant and Rowson in
Minerals Engineering
These papers have been included in the back of this thesis, under the “Papers”-section.
In addition two presentations have been delivered regarding this work (both of these
presentations have been included on the CD at the back of this thesis) :
1) “Applications of microwave radiation for the processing of minerals” was
delivered at the 9th SAICHE National Meeting in October 2000 (saiche00.exe)
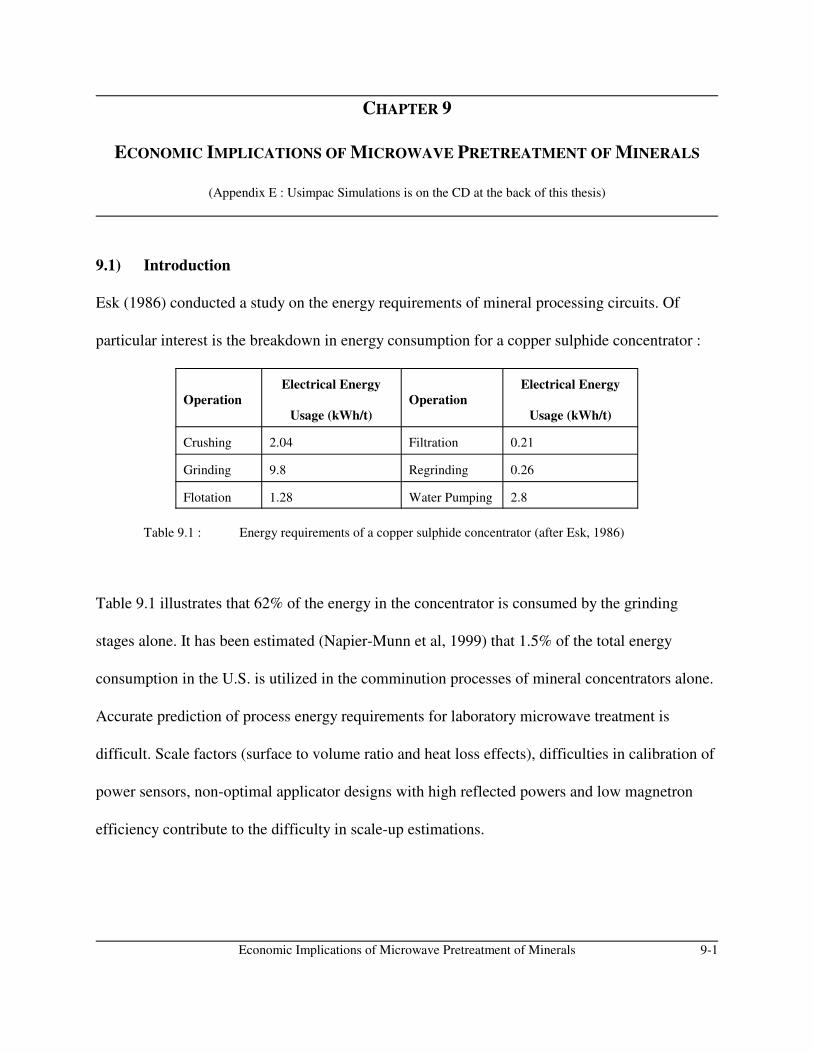
Economic Implications of Microwave Pretreatment of Minerals 9-1
CHAPTER 9
ECONOMIC IMPLICATIONS OF MICROWAVE PRETREATMENT OF MINERALS
(Appendix E : Usimpac Simulations is on the CD at the back of this thesis)
9.1) Introduction
Esk (1986) conducted a study on the energy requirements of mineral processing circuits. Of
particular interest is the breakdown in energy consumption for a copper sulphide concentrator :
Operation
Electrical Energy
Usage (kWh/t)
Operation
Electrical Energy
Usage (kWh/t)
Crushing 2.04 Filtration 0.21
Grinding 9.8 Regrinding 0.26
Flotation 1.28 Water Pumping 2.8
Table 9.1 : Energy requirements of a copper sulphide concentrator (after Esk, 1986)
Table 9.1 illustrates that 62% of the energy in the concentrator is consumed by the grinding
stages alone. It has been estimated (Napier-Munn et al, 1999) that 1.5% of the total energy
consumption in the U.S. is utilized in the comminution processes of mineral concentrators alone.
Accurate prediction of process energy requirements for laboratory microwave treatment is
difficult. Scale factors (surface to volume ratio and heat loss effects), difficulties in calibration of
power sensors, non-optimal applicator designs with high reflected powers and low magnetron
efficiency contribute to the difficulty in scale-up estimations.
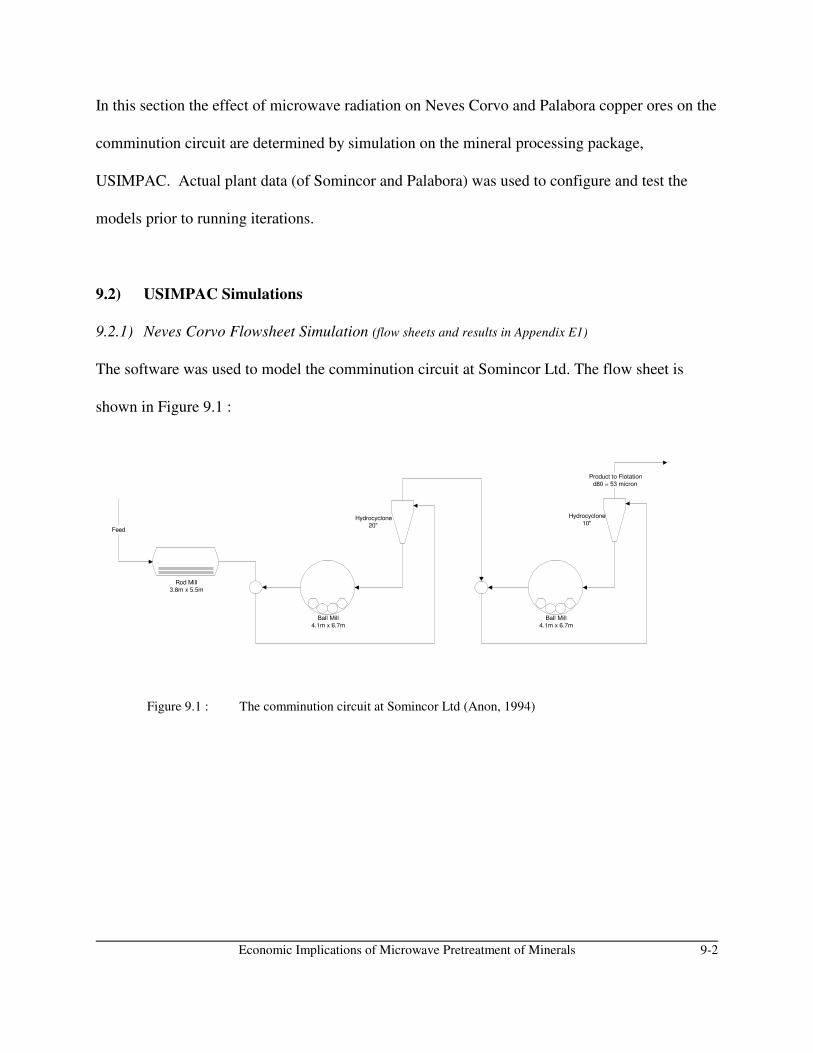
Economic Implications of Microwave Pretreatment of Minerals 9-2
Ball Mill
4.1m x 6.7m
Ball Mill
4.1m x 6.7m
Hydrocyclone
20"
Hydrocyclone
10"
Rod Mill
3.8m x 5.5m
Feed
Product to Flotation
d80 = 53 micron
In this section the effect of microwave radiation on Neves Corvo and Palabora copper ores on the
comminution circuit are determined by simulation on the mineral processing package,
USIMPAC. Actual plant data (of Somincor and Palabora) was used to configure and test the
models prior to running iterations.
9.2) USIMPAC Simulations
9.2.1) Neves Corvo Flowsheet Simulation (flow sheets and results in Appendix E1)
The software was used to model the comminution circuit at Somincor Ltd. The flow sheet is
shown in Figure 9.1 :
Figure 9.1 : The comminution circuit at Somincor Ltd (Anon, 1994)
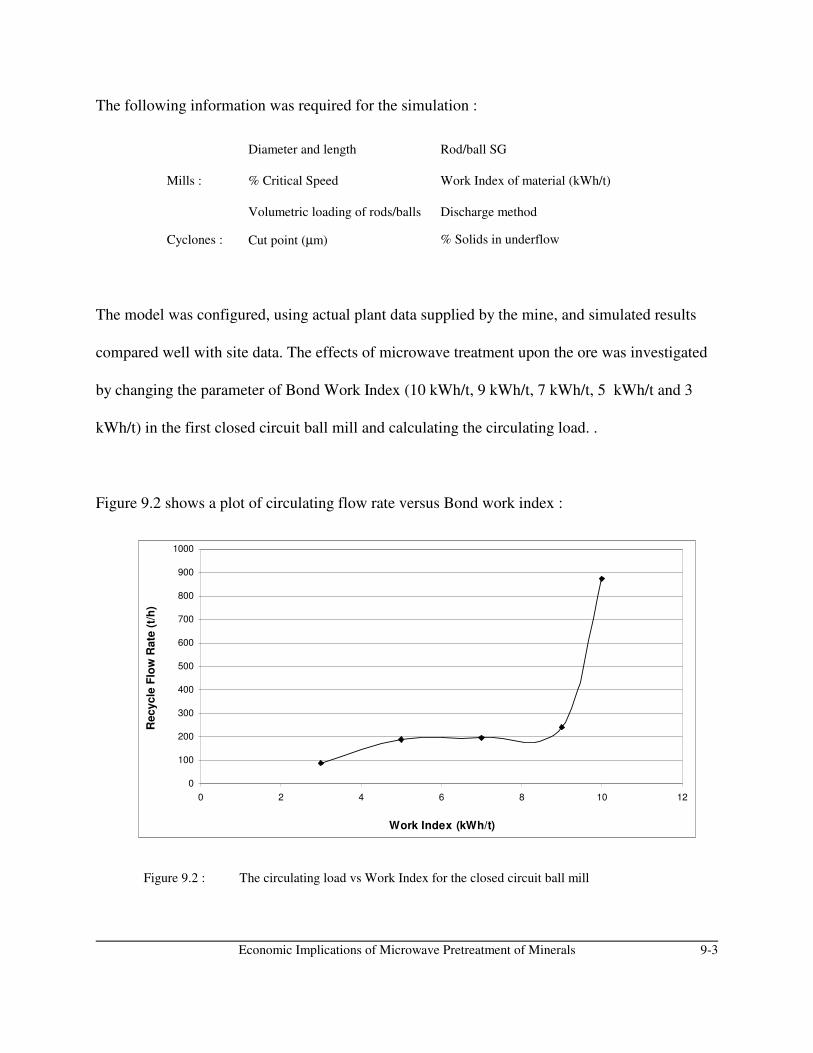
Economic Implications of Microwave Pretreatment of Minerals 9-3
0
100
200
300
400
500
600
700
800
900
1000
0 2 4 6 8 10 12
Work Index (kWh/t)
Recycle
Flo
w R
ate
(t/
h)
The following information was required for the simulation :
Mills :
Diameter and length
% Critical Speed
Volumetric loading of rods/balls
Rod/ball SG
Work Index of material (kWh/t)
Discharge method
Cyclones : Cut point (µm) % Solids in underflow
The model was configured, using actual plant data supplied by the mine, and simulated results
compared well with site data. The effects of microwave treatment upon the ore was investigated
by changing the parameter of Bond Work Index (10 kWh/t, 9 kWh/t, 7 kWh/t, 5 kWh/t and 3
kWh/t) in the first closed circuit ball mill and calculating the circulating load. .
Figure 9.2 shows a plot of circulating flow rate versus Bond work index :
Figure 9.2 : The circulating load vs Work Index for the closed circuit ball mill
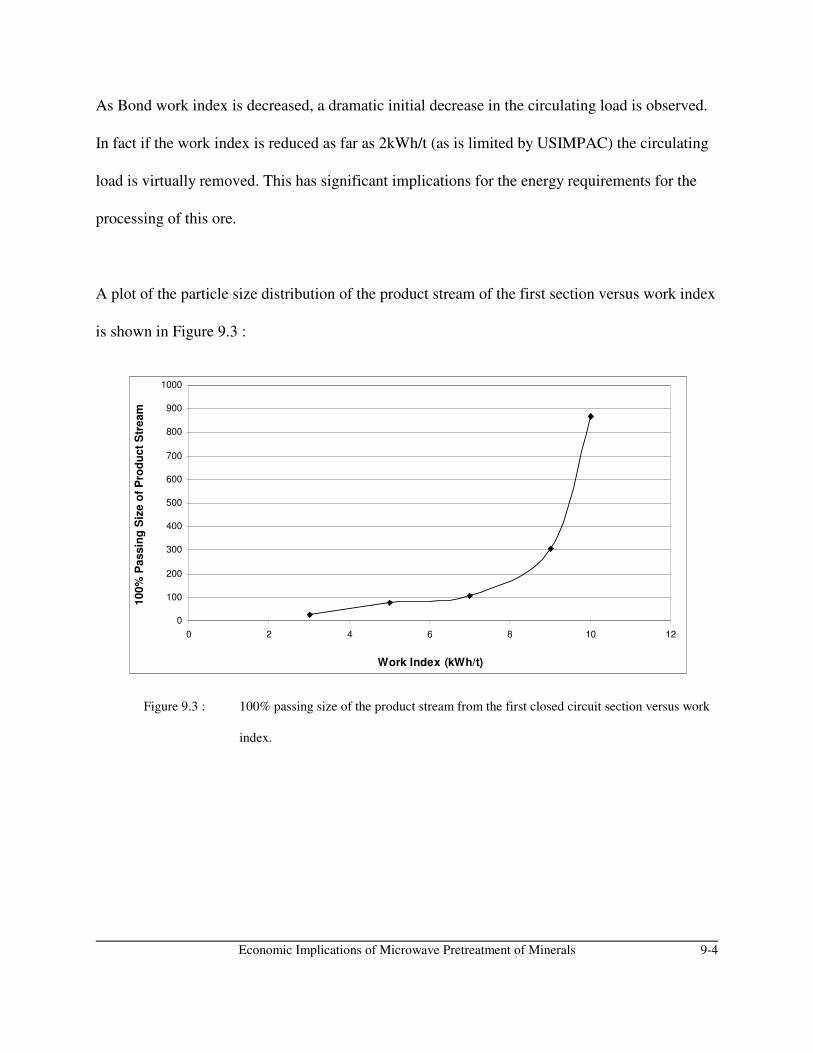
Economic Implications of Microwave Pretreatment of Minerals 9-4
0
100
200
300
400
500
600
700
800
900
1000
0 2 4 6 8 10 12
Work Index (kWh/t)
100%
Passin
g S
ize o
f P
rod
uct
Str
eam
As Bond work index is decreased, a dramatic initial decrease in the circulating load is observed.
In fact if the work index is reduced as far as 2kWh/t (as is limited by USIMPAC) the circulating
load is virtually removed. This has significant implications for the energy requirements for the
processing of this ore.
A plot of the particle size distribution of the product stream of the first section versus work index
is shown in Figure 9.3 :
Figure 9.3 : 100% passing size of the product stream from the first closed circuit section versus work
index.
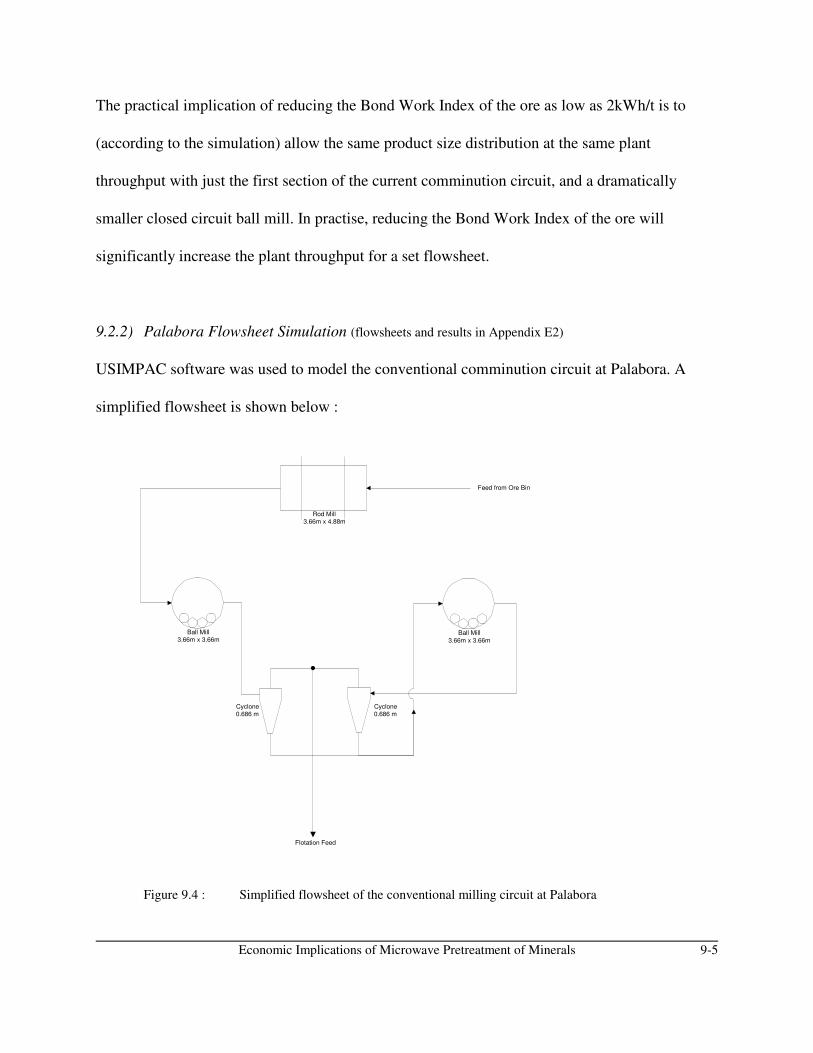
Economic Implications of Microwave Pretreatment of Minerals 9-5
Cyclone
0.686 m
Cyclone
0.686 m
Ball Mill
3.66m x 3.66m
Rod Mill
3.66m x 4.88m
Ball Mill
3.66m x 3.66m
Flotation Feed
Feed from Ore Bin
The practical implication of reducing the Bond Work Index of the ore as low as 2kWh/t is to
(according to the simulation) allow the same product size distribution at the same plant
throughput with just the first section of the current comminution circuit, and a dramatically
smaller closed circuit ball mill. In practise, reducing the Bond Work Index of the ore will
significantly increase the plant throughput for a set flowsheet.
9.2.2) Palabora Flowsheet Simulation (flowsheets and results in Appendix E2)
USIMPAC software was used to model the conventional comminution circuit at Palabora. A
simplified flowsheet is shown below :
Figure 9.4 : Simplified flowsheet of the conventional milling circuit at Palabora
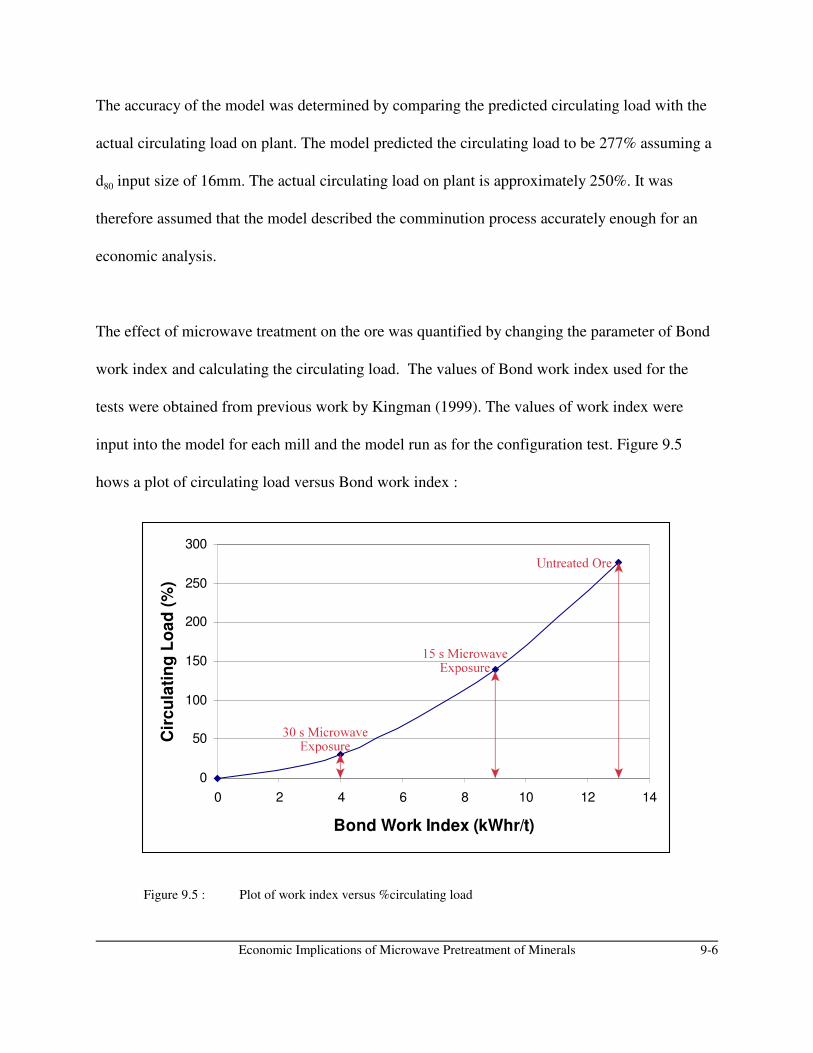
Economic Implications of Microwave Pretreatment of Minerals 9-6
0
50
100
150
200
250
300
0 2 4 6 8 10 12 14
Bond Work Index (kWhr/t)
Cir
cu
lati
ng
Lo
ad
(%
)
The accuracy of the model was determined by comparing the predicted circulating load with the
actual circulating load on plant. The model predicted the circulating load to be 277% assuming a
d80 input size of 16mm. The actual circulating load on plant is approximately 250%. It was
therefore assumed that the model described the comminution process accurately enough for an
economic analysis.
The effect of microwave treatment on the ore was quantified by changing the parameter of Bond
work index and calculating the circulating load. The values of Bond work index used for the
tests were obtained from previous work by Kingman (1999). The values of work index were
input into the model for each mill and the model run as for the configuration test. Figure 9.5
hows a plot of circulating load versus Bond work index :
Figure 9.5 : Plot of work index versus %circulating load
Economic Implications of Microwave Pretreatment of Minerals 9-7
As Bond work index is decreased so does the circulating load. In fact if the work index is
reduced as far as 2 kWh/t (as is indicated possible by the experimental tests) the circulating load
is removed.
9.3) Discussion and Conclusion
The effect of reducing the work index of both ores on the comminution circuits are illustrated. In
the case of the Neves Corvo material, the second closed circuit ball mill may be removed after
microwave treatment of the ore. The conventional grinding circuit at Palabora, currently
consisting of 1 rod mill, 2 ball mills, the second ball mill with a recycle, can be reduced to only 1
mill in closed circuit, clearly having favourable economic implications. The removal of a mill
from the current flowsheet is, however, impractical. Increased plant throughput (and hence
increased production) is possible however.
However, one of the main protests against ongoing research in the application of microwave
assisted thermally assisted liberation is that longer grinding times to increase the fineness of
grind will also improve the metallurgical characteristics by increasing liberation. Exposing
mineral ores to microwave radiation is at best simply application of energy in a different form
which (it is argued) should rather be added to current comminution processes.

Economic Implications of Microwave Pretreatment of Minerals 9-8
However, grinding minerals for extended time periods has the disadvantage of causing the
production of slimes and therefore losses in down stream processing (gravity, magnetic
separation and froth flotation being particularly sensitive to the presence of slimes).
Microwave pre-treatment of the ore has the effect of causing liberation at a higher particle d80
therefore giving rise to less slimes production. It is important to note that increases in recovery
after microwave treatment are not solely due to the enhanced liberation of particles but also to
liberation at a higher particle d80. Increased grinding times would also give rise to lower plant
throughput (for the same flowsheet) and increases in wear to mill, media and liner. All these
items are significant operating costs in any mineral processing plant. In contrast with increased
grinding periods, microwave pretreatment increases plant throughput.
In the case of the Palabora ore the work index may be reduced from 13.1 kWh/t to 1 kWh/t in
180s at 2.6 kW, which corresponds to 130 kWh/t. For an exposure time of 10s, and a reduction in
work index of 4.1 kWh/t, the energy input is reduced to only 7.2 kWh/t. Apart from the fact that
130kWh/t is extremely uneconomical, exposure for 180s is pointless as the micro structure as
well as the mineralogy is destroyed. However, an exposure time of 10s gives a reduction in work
index of 4.1 kWh/t compared to an microwave energy input of 7.2 kWh/t.
Economic Implications of Microwave Pretreatment of Minerals 9-9
For an industrial concentrator, 62% of the total energy input is utilized in the comminution
circuit (see Table 9.1). If a microwave system may be devised to increase the grindability of the
ore by 50%, the energy requirements of the comminution circuit is reduced to 44% of the total
energy cost. A total of 5 kWh/t is saved in comminution energy - which may be used for the
microwave units.
The benefits of microwave treatment of ores do not extend solely to potential reductions in
required grinding energy. Consideration must be given to increases in grade and recovery of
valuable minerals, increases in plant throughput, liberation of valuable minerals at higher grind
sizes therefore reducing slimes production, and also reductions in plant wear (particularly media
and liner). In carrying out a full techno-economic assessment, however, the following points
must also be considered. This test work was carried out using laboratory scale equipment. Such
equipment is unlikely to have an energy efficiency of much above 45%. Industrial scale
microwave systems have the advantage that they operate at 915MHz, with typical magnetron
efficiencies of 85%. Penetration depths at 915MHz are also superior to those at 2.45GHz which
would also provide greater flexibility in the design of the system.
Most of the industrial applications of microwave technology, excluding those in the
telecommunications industry, are based on heating of water molecules. However, as Roddy
(1986) states that “ovens and heaters for industrial applications generally have to be custom made
for the particular application”.
Economic Implications of Microwave Pretreatment of Minerals 9-10
Large scale microwave heaters may be adequate for drying purposes as they have been
specifically designed for the dielectric properties for water, but the dielectric properties of
minerals differ vastly from that of water. Industrial scale microwave equipment is available that
will produce about 75kW in continuous operation. For mineral processing plants such as copper
concentrators, many generators would required and the capital cost of such a systems will
undoubtedly be significant. It will be vital, therefore, that energy input to the system be
minimized
Although microwave technology is well established for domestic applications [Kingman et al,
2000], various obstacles hinders its acceptance for industrial applications. The practical
application of the technology on the scale required to treat many thousands of tonnes per day -
continuously - is one of the most difficult obstacle to overcome. Coupled with the safety aspects
of operating such a piece of equipment makes for a daunting project. However, with the ever
decreasing grades and reserves of ore, microwave technology may offer a unique solution.
Conclusion and Further Work 10-1
CHAPTER 10
CONCLUSION AND FURTHER WORK
10.1) Conclusion
Experiments were conducted on four different types of material - Palabora carbonatite copper
ore, Neves Corvo massive copper and massive copper-zinc ore, Mambula iron-titanium ore and
vermiculite from Palabora. The following conclusions has been drawn from the series of
experiments conducted on these materials.
10.1.1) Grindability
The work index of the Neves Corvo massive copper ore has been determined to be 9.7 kWh/t.
Of the grindability trials, which were conducted on Palabora, Neves Corvo and Mambula, the
Palabora ore showed the largest reduction in work index - up to 80% (in a 6.6kW microwave
cavity with a load of 5kg and exposure of 110s followed by quenching). The maximum reduction
in work index achieved in the case of Neves Corvo was 70% (for 500g massive copper-zinc
material) after 90s exposure at 2.6kW, whereas the Mambula material only showed a reduction in
work index of 26% after 90s exposure at 2.6kW.

Conclusion and Further Work 10-2
This highlights the importance of the mineralogy of the ore on the effectiveness of microwave
pre-treatment of minerals (as is reported in Kingman et al, 2000). Ores of consistent mineralogy
containing a good microwave absorber in a transparent gangue matrix are most responsive to
microwave treatment, whereas ores containing small, finely disseminated particles in discrete
elements respond poorly and yields only small reductions in work index.
The reduction in work index has been shown to be due to extensive intergranular fracture which
occurs when different species within a particle respond (i.e. heat up) at different rates to the
applied field. This causes differential expansion which generates internal stresses at the grain
boundaries, weakening the mineral structure. In the case of the Mambula ore, none (or very little)
structural and mineralogical changes due to microwave exposure occurred. Partial melting and a
small degree of oxidation did occur, but these changes were not significant enough to affect the
grindability.
10.1.2) Flotation
Flotation trials have only been carried out in the case of the massive copper and copper-zinc ore
form Neves Corvo. Although extensive intergranular fracture occurred (which might have led to
increased mineral liberation) as well as some changes to the mineral surfaces (bornite formation,
oxidation and partial melting) no change was detected in the recovery of copper during laboratory
froth flotation trials.
Conclusion and Further Work 10-3
10.1.3) Magnetic Susceptibility
No significant change in Fe-recovery between samples exposed to microwave radiation and the
reference samples can be observed in the case of Mambula ore. There is some improvement in
Ti-recovery in the first concentrate (unwanted). However, this would need to be confirmed by
extensive further test work. The Ti content in the second concentrate (0.8T concentrate) appears
to drop. This may be due to changes in magnetic susceptibility of the ilmenite phase.
This has been confirmed by the mineralogy. Oxidation did occur to a small extent, as did partial
melting and the formation of gas bubbles. But these changes are not frequent throughout the
sample and do not affect the magnetic susceptibility of the Mambula ore.
10.1.4) Vermiculite Exfoliation
It was discovered that the Palabora vermiculite has the unique (amongst micaceous minerals)
property of being responsive to microwave exposure. When exposed to microwave radiation of
sufficient power level, rapid exfoliation occurs.
It was found that the large and medium grade material respond best (in comparison to the fine,
superfine and micron grade material). The volumetric expansion of the large and medium garde
vermiculite obtained in the 2.6kW microwave cavity correspond well to values quoted in
literature.

Conclusion and Further Work 10-4
In the case of the finer grades of vermiculite, the volumetric expansion is much less than the
values quoted in literature. However, comparative tests in a conventional furnace regarding the
volumetric expansion, showed that microwave exposure yielded a larger volume per unit mass of
vermiculite in a shorter period of time.
From experimental work, it was determined that large grade vermiculite may be exfoliated
continuously, utilizing a total 352 MJ/t without the need for additional cooling. In the case of
current industrial microwave exfoliation equipment the energy consumption ranges between 1.24
and 1.99 GJ/t and yields a product which needs to be cooled down from 1200°C to 35°C utilising
an additional 1.2 GJ/t.
10.1.5) Cavity Effects
Experimental work revealed that the design of the cavity constitutes an important section in the
economical application of microwave technology. The way in which the material is presented to
the electric field also plays an important role.
There seems to exist a correlation between percentage reduction in work index and the particle
size of the material. The larger the particles, the higher the reduction in work index. This makes
sense intuitively, as the larger material will have a greater probability of consisting of a mixture
of microwave receptors and insulators which would assist in the reduction in work index. There
would be an upper limit to the particle size, related to the penetration depth and exposure time
required for heating.
Conclusion and Further Work 10-5
For smaller particles, there is a higher probability that the particles will consist of only a single
phase and therefore differential heating will not occur, and subsequently the reduction in work
index will be lower.
Therefore it may be deduced that there will be an optimum size for microwave pre-treatment of
minerals to ensure a maximum reduction in work index.
The mass and area of the material in the microwave cavity also plays an important part in the
effectiveness of microwave pre-treatment. Under similar exposure conditions (residence time) a
small sample mass would respond faster than a large mass of material. In addition there is an
optimum area within multimode microwave cavities where the best response of the minerals to
the applied electric field is achieved.
It has also been illustrated that the size of the microwave cavity and the electric field strength has
a large effect on the efficiency of microwave pre-treatment. A high power, large volume cavity
may be less efficient than a lower power, small cavity with a higher electric field strength. This is
due to the fact that the absorbed power is proportional to the square of the electric field strength.
Conclusion and Further Work 10-6
10.1.6) Flowsheet Simulation
It has been illustrated that the simulation package USIMPAC, may be used to accurately model
an existing plant operation as well as predict changes to the flow sheet as a result of reduced
Bond Work Index.
In the case of the Palabora flowsheet, the plant consisting of a rod mill, ball mill and a second
closed circuit ball mill, may be reduced to a single closed circuit mill to achieve the same final
particle size distribution after a reduction in work index. In practise, microwave pre-treatment
would not be used to reduce the work index of the material to such a great extent (as this affects
downstream processing), but plant throughput may be increased.
10.2) Further Work
The following areas have been identified for further investigation regarding the economic and
industrial application of microwave pre-treatment of minerals.
10.2.1) Dielectric Property Calculations and Modelling
The dielectric properties of a material determines its response to microwave radiation with
respect to heating rate, penetration and skin depth. Accurate data regarding the dielectric
properties of minerals are required to calculate these fundamental parameters.
Conclusion and Further Work 10-7
However, ores seldom consist of single mineral species. In reality, ores may contain dozens of
mineral species as is the case in Palabora copper ore which contains at least 30 different
minerals.
Calculation of the dielectric properties of the bulk of the ore is extremely difficult. The main
problem lies with finding a representative sample of the ore to be used to calculate the bulk
dielectric properties. Arai et al, 1995, developed a model which may be used to estimate the
dielectric properties of a binary mixture of mineral species.
This work may be extended to include more species, which would make the calculation of the
dielectric properties possible using the composition of an ore and the dielectric properties of the
individual components. It should also be noted that when using the dielectric mixture equations
(for powders) that there is a third component - air - in between the solid particles. This will affect
the dielectric properties. It would be advisable to determine the dielectric properties of pure, solid
minerals in the form of drill cores.
Once data has been collected for a certain ore type, calculation of the heating rate, penetration
depth and skin depth may be carried out. Data on the penetration depth and skin depth may be
combined with experimental data to determine the optimum particle size for microwave pre-
treatment. Data regarding the heating rate may be used to predict temperatures of different
species within the ore material after exposure for different time periods. If the heating rates of the
individual species are known then it may be predicted to what extent the constituents of the ore
will expand on heating and contract upon quenching.

Conclusion and Further Work 10-8
Once the volumetric response of the mineral species have been determined, the magnitude of the
stresses induced by the expansion and contraction on the grain boundaries may be evaluated
(possibly by the finite element method). This may assist in determining the susceptibility of a
certain ore body to microwave radiation and whether or not a significant reduction in work index
is possible or not - without the need for experimental work.
The thermal and volumetric response of the material may also be used to calculate the effects of
thermal pre-treatment due to microwave exposure, on the surface properties of the material,
which affects processes like flotation and magnetic separation.
10.2.2) Scale-up
Before any process can be applied to an industrial process it need to be tested at pilot scale.
Therefore pilot scale testing need to be conducted on the ore types from Palabora, Neves Corvo
and Mambula with regard to microwave exposure. This should be done at high power level and
electric field to ensure the shortest possible exposure times (for economic benefits).
After microwave exposure, these materials need to be milled in pilot scale milling equipment en
results (particle size distribution, throughput, energy consumption etc) compared to unexposed
material, milled in the same equipment.
Tests also need to be conducted to ensure that downstream processing such as flotation and
Conclusion and Further Work 10-9
magnetic separation are unaffected (or affected positively).
10.2.3) Other Work
• Walkiewicz (1991) claimed that microwave pre-treatment will result in reduction in plant
wear and increased mineral liberation. Thus far, work mainly focussed on the economical
application of microwave assisted grinding.
Work need to be carried out to investigate and quantify the effects of work index
reduction on both plant throughput and plant wear. Increases in plant throughput may be
quantified using the simulation package USIMPAC.
Experimental work and modelling will be required to quantify the effects on plant wear
due to a reduction in work index.
• The structural differences between vermiculite exfoliated in a microwave cavity and those
exfoliated in conventional furnaces need to be further investigated.
• The use of the drop weight test rig need to be further investigated. In particular the effects
of the release height, friction losses, rebound energy impact and particle size need to be
further investigated before in order to be used to effectively determine the effect of
microwave radiation on ore weakening.
Conclusion and Further Work 10-10
It should be noted that just because an ore is judged unresponsive to microwave radiation (such
as in the case of Mambula ore), this does not necessarily imply that the ore will never be affected
by microwave radiation. In the case of Norwegian Ilmenite (not tested in this thesis) the
composition is very similar to that of the Mambula ore. However, the ilmenite responds
extremely well to microwave treatment - giving large reductions in work index. However,
investigating the mineralogy of the ore reveals that included more unresponsive gangue materials
in the matrix (whereas Mambula consists predominantly of good microwave receptors).
In the case of Norwegian Ilmenite, differential heating and expansion thus occurs readily,
whereas the Mambula material heats up rapidly, but no differential expansion occurs. It may
therefore be quite feasible that as the grade of the material decreases that the amount of gangue in
the matrix increases and the mineralogy gets closer to that of Norwegian Ilmenite and microwave
treatment becomes a viable option once again.

Personal Communications, References and Bibliography R-1
Personal Communication
1
Mr K Pietersen, 2000
Richards Bay Minerals Ltd
Richards Bay, South Africa
Topic : The effect of microwave treatment on the grindability and magnetic
susceptibility of Fe-Ti ore from Richards Bay, South Afric
Email : [email protected]
2
Mr G Brown, 1999
Then at Svedala Ltd
Derby, UK
Topic : Continuous pilot scale milling of Palabora copper ore in a rod mill
3
Dr NA Rowson, 1998-2001
Department of Chemical Engineering, University of Birmingham
Birmingham, UK
Topic : General discussions of microwave pre-treatment of mineral ore
Email : [email protected]
4
Dr SW Kingman, 1998-1999
Then at the Department of Chemical Engineering, University of Birmingham
Birmingham, UK
Topic : General discussions of microwave pre-treatment of mineral ore
Email : [email protected]
Personal Communications, References and Bibliography R-2
References
Abbot MM and van Ness HC, 1989, Schaum’s ouline of theory and problems of
thermodynamics, 2nd Edition, McGraw-Hill (Schaum’s Outline Series), New York,
ISBN 0 07 000042 5
Agrawal D, 1999, Microwave sintering of ceramics, composites, metals and transparent
materials : recent developments at MRL/PSU, Proceedings of the 7th International
Conference on Microwave and High Frequency Heating, Valencia, Spain
Arai M et al, 1995, Use of mixture equations for estimating theoretical complex
permittivities from measurements on porous or powder ceramic specimens, Japanese
Journal of Applied Physics, vol 34, p 6463 - 6467, Japan Society of Applied Physics,
ISSN 0021 4922
Armstrong DG, 1985, An alternative grindability test. An improvement of the Bond
procedure, International Journal of Mineral Processing, vol 16, p 195 - 208, Elsevier,
ISSN 0301 7516
Baden Fuller AJ, 1979, Microwaves : an introduction to microwave theory and
techniques, 2nd Edition, Pergamon, Oxford, ISBN 0 08 024228 6
Batt J et al, 1994, A parallel measurement program in high temperature dielectric
property measurement : an update, Microwaves III, p 243 - 250
Bearman RA et al, 1997, The application of rock mechanics parameters to the
prediction of comminution behaviour, Minerals Engineering, vol 10, no 3, p 255 - 264,
Pergamon, ISSN 0892 6875
Berry TF and Bruce RW, 1966, A simple method of determining the grindability of
ores, Canadian Mining Journal, July 1996, p 63 - 65, Southam Magazine Group,
ISSN 0008 4492
Bond FC, 1961a, Crushing and grinding calculations : part 1, British Chemical
Engineering, June 1961, vol 6, no 6, p 387 - 385, Heywood, ISSN 0007 0424
Bond FC, 1961b, Crushing and grinding calculations : part 2, British Chemical
Engineering, August 1961, vol 6, no 8, p 543 - 548, Heywood, ISSN 0007 0424
Bonometti E et al, 1998, Synthesis of mixed oxides assisted by microwave heating,
Innovations in Mineral and Coal Processing : Proceedings of the 7th International
Mineral Processing Symposium (ed : Atak et al, 1998), ISBN 9058090132
Bradshaw SM et al, 1998, Microwave heating principles and the application to the
regeneration of granular activated carbon, The Journal of the South African Institute of
Mining and Metallurgy, July/August 1998. p 201 - 210, SAIMM, ISSN 0038 223X
Personal Communications, References and Bibliography R-3
Broch E and Franklin JA, 1972, The point load strength test, International Journal of
Rock Mechanics and Mining Science, vol 9, p 669-697, Pergamon, ISSN 0148 9062
Brown GJ, 1997, Technical note : a fractal description of the progeny of double impact
single particle breakage, Minerals Engineering, vol 10, no 2, p 229-235, Pergamon,
ISSN 0892 6875
Buthcer DA and Rowson NA, 1995, The desulphurisation of coal using microwave
energy, The 1995 ICHEME Research Event : First European Conference
Byrne M et al, 1995, Process development for the separation of tetrahedrite from
chalcopyrite in the Neves Corvo ore of Somincor SA, Portugal, Minerals Engineering,
Vol 8, No 12, p 1571 - 1581, Pergamon
Cable News Network, Accessed in Oct 1999, World Population, http://www.cnn.com
Chablinksy IJ, 1989, Microwaves - the energy form with a future, 1st Australian
Symposium on Microwave Power
Chau KT and Wong RHC, 1996, Technical note : uniaxial compressive strength and
point load strength of rocks, International Journal of Rock Mechanics and Mining
Science, vol 33, p 183-188, Pergamon, ISSN 0301 7516
Chen TT et al, 1984, The relative transparency of minerals to microwave radiation,
Canadian Mining Quarterly, vol 23, no 3, p 349 - 351, Pergamon, ISSN 0008 4433
Church RH et al, 1988, Dielectric properties of low-loss minerals, US Bureau of Mines
Report of Investigations, RI 9194
Church RH and Webb WE, 1986, Measurement of dielectric properties of minerals at
microwave frequencies, US Bureau of Mines Report of Investigations, RI 9035
Clark IH, 1993, The role of rock fabric in controlling crushing strength : numerical
experiments, XVIII International Mineral Processing Congress, May 1993, Sydney,
p 187 - 192
Cober Elecronics, Accessed in Oct 1998, http://www.cober.xom
Coulson JM et al, 1996, Coulson and Richardson’s chemical engineering - particle
technology and separation, vol 2, 4th Edition, Butterworth Heinemann,
ISBN 0 7506 2942 8
Dalton BL, 1973, Microwave non-contact measurement and instrumentation in the steel
industry, Journal of Microwave Power and Electromagnetic Energy, vol 8, no 3, p 235
- 244, International Microwave Power Institute, ISSN 0832 7823

Personal Communications, References and Bibliography R-4
Deniz V et al, 1996, The interrelationships between Bond grindability of coals and
impact strength index (ISI), Point load index (Is) and friability index (FD), Changing
Scopes in Mineral Processing, Rotterdam, ISBN 9054108290
Dobson RM, 1992, Mineral behaviour in microwave energy fields, Undergraduate
Project Report, the University of Birmingham
Donaldson EM, 1973, Methods for the analysis of ores, rocks and related materials,
US Department of Energy, Mines Branch Monograph 881
Esk CS, 1986, Energy usage in mineral processing, Mineral processing at a
crossroads, Wills BA and Barley RW (ed), pp 133 - 155, Martinus Nijhoff Publishers,
Dordrecht, ISBN 90 247 3410 X
Evans I and Pomeroy CD, 1966, The strength, fracture and workability of coal,
Pergamon, Oxford
Flemming et al, 1989, Dielectric measurement techniques at microwave frequencies,
Harwell Laboratory, AERE M 3776
Florek I et al, 1996, The effect of microwave radiation on magnetic properties of
frained iron containing minerals, Proceedings of the 31st Microwave power Symposium,
Boston
Florek I and Lovás M, 1995, The influence of the complex electric permittivity and
grain size on microwave drying of the grained minerals, Fizykochemiczne Problemy
Mineralurgii (Slovakian Journal), vol 29, p 127 - 133
Florek I et al, 1997, Intensification of magnetic separation of chalcopyrite ore by
microwave radiation, Proceedings of the 4th Conference on Dielectric Heating and
Microwave, Italy
Gallawa JC, 1999, Accessed in Oct 2000, How stuff works, http://www.gallawa.com
Gasnier M et al, 1994, New developments in the field of energy transfer by means of
monomode microwaves for various oxides and hydroxides, Journal of Alloys and
Compounds, 204, p 165 - 172, Elsevier, ISSN 0925 8388
Giancoli DC, 1988, Physics for scientists and engineers, 2nd Edition, Prentice-Hall,
ISBN 0 13 674045 6
Giles PG, 1973, Microwave food applications in the food industry in the United
Kingdom : domestic and commercial microwave ovens, Journal of Microwave Power
and Electromagnetic Energy, vol 8, no 2, p 129 - 132, International Microwave Power
Institute, ISSN 0832 7823

Personal Communications, References and Bibliography R-5
Goldstein A et al, 1999, MW sintering at 2.45 GHz in air of Al2O3/TiC composite
ceramics, 7th International Conference on Microwave and High Frequency Heating,
Valencia, Spain
Goyette J et al, 1990, Importance of the Dielectric Properties of materials for
Microwave Heating, Drying Technology, 8(5), p 1111 - 1121, Marcel Dekker Journals,
ISSN 0737 3937
Güngör A and Ü Atalay, 1998, Microwave processing and grindability, Innovations in
Mineral and Coal Processing : Proceedings of the 7th International Mineral Processing
Symposium (ed : Atak et al, 1998), ISBN 90 5809 0132
Haagensen DB et al, 1985, US Patent : apparatus and method for processing dielectric
materials with microwave energy, US Patent Number : 4 714 812, Patent Date : 22 Dec
1987, Filed : 1985
Hamilton WR et al, 1974, The Hamlyn Guide to Minerals, Rocks and Fossils, The
Hamlyn Publishing Group, Barcelona, ISBN 0 600 34398 7
Harrison PC, 1997, A Fundamental Study of the Heating Effect of 2.45 GHz Radiation
on Minerals, PhD Thesis, University of Birmingham
Harrison PC and Rowson NA, 1997a, Improvements in mineral beneficiation using
conventional and microwave treatment, The 1997 ICHEME Jubilee Research Event
Harrison PC and Rowson NA, 1996b, The use of dielectric heating to alter mineral
properties, The 1996 ICHEME Research Event : The Second European Conference
Harrison PC and Rowson NA, 1996a, The effect of heat treatment on the grindability of
coals, The 1996 ICHEME Research Event : The Second European Conference
Harrison PC and Rowson NA, 1997b, The Effect of Microwave Treatment on the
Comminution of Coal, The 1997 ICHEME Jubilee Research Event
Henderson K, 1990, Milling and Concentrating - Process Description, PMC in-house
publication
Hiramatsu Y and Oka Y, 1966, Determination of the tensile strength of rock by a
compression test of an irregular test piece, International Journal of Rock Mechanics
and Mining Science, vol 3, p 89-99, Pergamon, ISSN 0148 9062
Hudson JA, 1969, Tensile strength and the ring test, International Journal of Rock
Mechanics and Mineral Science, vol 6, p 91-97, Pergamon
Hulls P, 1992, Dielectric Heating for Industrial Processes, U.I.E
Ishii TK, 1995, Handbook of Microwave Technology - Volume 2 - Applications,
Academic Press, San Diego, p 33 - 50, p 249 - 285, ISBN 0 12 374696 5
Personal Communications, References and Bibliography R-6
Joret L et al, 1997, Effect of microwaves on the rate of dissolution of metal oxides in
nitric acid, Hydrometallurgy 45, p1 - 12, Elsevier, ISSN 0304 386X
Kase Y, 1973, Microwave power applications in japan : domestic microwave ovens,
Journal of Microwave Power and Electromagnetic Energy, vol 8, no 2, p 133 - 135,
International Microwave Power Institute, ISSN 0832 7823
King RP, 1994, Comminution and the liberation of minerals, Minerals Engineering,
vol 7, no 2/3, p129 - 140, Pergamon, ISSN 0892 6875
Kingman SW et al, 1998, Applications of microwave radiation to enhance performance
of mineral separation processes, Innovations in Physical Separation Processes, p 339 -
352, Institute of Mining and Metallurgy
Kingman SW, 1999, The effect of microwave radiation upon the comminution and
beneficiation of minerals, PhD Thesis, University of Birmingham
Kingman SW et al, 2000, The influence of mineralogy on microwave assisted grinding,
Minerals Engineering, vol 13, no 3, p 313 - 327, Pergamon, ISSN 0892 6875
Kraszweski AW and Nelson SO, 1999, Microwave properties of powdered coal in
mixtures, 7th International Conference on Microwave and High Frequency Heating,
Valencia, Spain
Kruesi PR et al, 1980, US Patent : process for the recovery of copper from its ores, US
Patent Number : 4 324 582, Patent Date : 13 April 1982, Filed : 1980
Lance AL, 1964, Introduction to microwave theory and measurements, McGraw-Hill,
New York, ISBN b650 0765
Magdalinovic N, 1987, A procedure for the rapid determination of the Bond Work
Index, International Journal of Mineral Processing, vol 27, p 125 - 132, Elsevier,
ISSN 0301 7516
Mandoval Ltd, Accessed in Jul 1999, Mandoval Ltd - Zirconia Sales (UK) ,
http://www.mandoval.com/
McGill SL et al, 1988, The effects of power level on the microwave heating of selected
chemicals and minerals, Materials Research Society Proceedings, vol 124,
p 247 - 252
McPherson R, 1988, Microwave Processing of Ceramics, Department of Materials
Engineering, Monash University
Meisel N, 1973, Microwave applications to food processing in Europe, Journal of
Microwave Power and Electromagnetic Energy, vol 8, no 2, p 143 - 148, International
Microwave Power Institute, ISSN 0832 7823
Personal Communications, References and Bibliography R-7
Mellor M and Hawkes I, 1971, Measurement of tensile strength by diametrical
compression of discs and annuli, Engineering Geology, vol 5, no 3, p 173-235,
Elsevier, ISSN 0013 7952
Meredith RJ, 1998, Engineers handbook of industrial microwave heating, Institute of
Electrical Engineers, ISBN 0 85296 916 3
Metaxas AC and Meredith RJ, 1983, Industrial microwave heating, Peter Peregrinus,
London
Mineral Data, Accessed in Jun 1999, Vermiculite,
http://web.wt.net/~data/Mineral/data/vermiculite.html
Morozv GA et al, 1999, Microwave seeds pre-treatment, 7th International Conference
on Microwave and High Frequency Heating, Valencia, Spain
Napier-Munn TJ et al, 1999, Mineral Comminution Circuits - Their Operation and
Optimisation, Julius Kruttschnitt Mineral Research Center, ISBN 0 646 28861 X
Nelson SO, 1996, Determining dielectric properties of coal and limestone by
measurements on pulverized samples, Journal of Microwave Power and
Electromagnetic Energy, vol 31, no 4, p 215-220, International Microwave Power
Institute, ISSN 0832 7823
Nelson SO et al, 1989, Dielectric properties of selected and purified minerals at 1 to 22
GHz, , Journal of Microwave Power and Electromagnetic Energy, vol 24, no 4,
p 213 - 220, International Microwave Power Institute, ISSN 0832 7823
Osepchuk JM, 1984, A history of microwave heating applications, IEEE Transactions
on Microwave Theory and Techniques, vol 32, no 9, p 1200 - 1224, IEEE
Peng J and Liu C, 1992, The kinetics of ferric chloride leaching of sphalerite in the
microwave field, Transactions of the Non Ferrous Society, vol 2, no 1, Non-Ferrous
Society
Peng SS, 1976, Stress analysis of cylindrical rock discs subject to axial double point
loads, International Journal of Rock Mechanics and Mining Science, vol 13, p 97-101,
Pergamon, ISSN 0148 9062
PMC Ltd, 1996, Palabora’s vermiculite operations - brochure
PMC Ltd, 1998, Palabora mining company Ltd - brochure
RBM Ltd, Accessed in Apr 2000, Richards Bay minerals Pty Ltd,
http://www.richardsbayminerals.co.za
Roddy D, 1986, Microwave technology, Prentice Hall, New Jersey, p 363 - 377, p521 -
584, Prentice-Hall, New Jersey, ISBN 0 8359 4390 9
Personal Communications, References and Bibliography R-8
Rowson NA and Rice NM, 1990, Technical note : desulphurization of coal using low
power microwave energy, Minerals Engineering, vol 3, no 3/4, p 363 - 368, Pergamon
Rowson NA, 1986, Desulphurization of coal by microwave energy, PhD thesis -
University of Leeds
Salsman JB et al, 1995, Short pulse microwave treatment of disseminated sulfide ores,
Minerals Engineering, vol 9, No 1, p 43 - 54, Pergamon, ISSN 0892 6875
Scharz HF et al, 1973, Microwave curing of synthetic rubbers, Journal of Microwave
Power and Electromagnetic Energy, vol 8, no 3/4, p 303 - 322, International
Microwave Power Institute, ISSN 0832 7823
Schiffmann RF, 1973, The applications of microwave power in the food industry in the
USA, Journal of Microwave Power and Electromagnetic Energy, vol 8, no 2, p 137 -
142, International Microwave Power Institute, ISSN 0832 7823
Schoeler WR and Powel AR, 1955, Analysis of minerals and Ores of the rarer
elements, 3rd Edition, p21, Charles Griffen & Company
Rybakov KI and Semenov VE, 1999, On the identification of microwave field non-
thermal effects in solids, 7th International Conference on Microwave and High
Frequency Heating, Valencia, Spain
Ôener S and Özbayo—lu G, 1998, Effect of heat treatment on the grindability of Ulexite,
Innovations in Mineral and Coal Processing : Proceedings of the 7th International
Mineral Processing Symposium (ed : Atak et al, 1998), ISBN 9058090132
Somincor SA, 1994, General mine infrastructure - brochure
Standish N, 1989, Unusual effects of microwave irradiation in granular materials,
Proceedings of the First Australian Symposium on Microwave Power Applications,
p 227 - 234
Standish N and Pramasunto, 1991, Reduction of microwave irradiated iron ore particles
in CO, Journal of the International Iron and Steel Institute of Japan, vol 31, no 1, p 11
- 16, International Iron and Steel Institute
Stuchly MA et al, 1983, Industrial, scientific, medical and domestic applications of
microwaves, IEE Proceedings, vol 30, no 8, p 467 - 503, IEE
Suzuki T and Oshima K, 1973, The applications of microwave power to the food
industry in the Japan, Journal of Microwave Power and Electromagnetic Energy, vol 8,
no 2, p 149 - 159, International Microwave Power Institute, ISSN 0832 7823
Tavares LM and King RP, 1996, Fracture energies of copper ore subject to microwave
heating, Utah Comminution Center
Personal Communications, References and Bibliography R-9
Taveres LM and King RP, 1995, Microscale investigation of thermally assisted
comminution, Proceedings of the XIX International Mineral Processing Congress -
Comminution and Simulation and Control, Vol 1, Chapter 36, Society of Mining,
Metallurgy and Exploration
The New York Public Library, 1995, Science Desk Reference, Barnes-Svarney P (ed),
Macmillan, New York, ISBN 0 02 860 403 2
Torbed Ltd, 2000, Torbed Pty Ltd - brochure
Tranquila JM, 1996, US Patent : Microwave treatment of metal bearing ores and
concentrates, US Patent Number : 5 824 133, Patent Date : 20 Oct 1998, Filed 1996
Veasey TJ and Wills BA, 1991, Review of methods of improving mineral liberation,
Minerals Engineering, vol 4, no 7, pp 747 - 752, Pergamon, ISSN 0892 6875
Von Hippel A, 1954, Dielectric materials and applications, p 3 - 45, Technology Press
MIT and John Wiley and Sons, New York, ISBN 5401 1021
Vorster W et al, 2000, Applications of microwave radiation for the processing of
minerals, Proceedings of the 9th National Meeting of the South African Institute of
Chemical Engineers, Secunda
Vutukuri VS et al, 1974, Handbook on mechanical properties of rocks, 1st Edition,
Trans Tech Publications, ISBN 0 87849 010 8
Wada T, 1970, A method for the expansion of vermiculite, Patent Number 714652,
Filed in South Africa
Walkiewicz JW et al, 1991, Microwave assisted grinding, IEEE Transactions on
Industrial Applications, vol 27, no 2, p 239 - 242, IEE
Walkiewicz JW et al, 1988, Microwave heating characteristics of selected minerals and
compounds, Minerals and Metallurgical Processing, Feb 1988, p 39 - 42, American
Society of Mining Engineers, ISSN 0747 9182
Walkiewicz JW et al, 1993, Grindability of taconite rod mill feed enhanced by
microwave induced cracking, Society for Mining, Metallurgy and Exploration Inc
Warren Spring Laboratory, 1962, Grindability test procedure and ball mill size
selection
Wills BA, 1997, Mineral Processing Technology, 6th Edition, Butterworth Heinemann,
Oxford, ISBN 0 7506 2838 3
Wills BA and Atkinson K, 1993, Some observations on the fracture and liberation of
mineral assembles, Minerals Engineering, vol 6, no 7, p 697 - 706, Pergamon,
ISSN 0892 6875
Personal Communications, References and Bibliography R-10
Wills BA et al, 1987, Thermally assisted liberation of cassiterite, Minerals and
Metallurgical Processes, May 1987, p 94 - 96, American Institute of Mining Engineers,
ISSN 0747 9182
Wonnacott G and Wills, 1990, Optimization of thermally assisted liberation of a tin ore
with the aid of computer simulation, Minerals Engineering, vol 3, no 1, pp187-198,
Pergamon, ISSN 0892 6875
Woodcock JT et al, 1989, Possibilities for using microwave energy in the extraction of
gold, Proceedings First Australian Symposium on Microwave Power Applications,
p 139 - 153
Worner HK et al, 1989, Microwaves in prometallurgy, Proceedings of the 1st
Australian Symposium on Microwave Power Applications, p 179 - 184
Wright RA et al, 1989, Thermal processing of ilmenite and titania doped hematite
using microwave energy, Journal of Materials Science, p 1337 - 1342, Chapman and
Hall Ltd, ISSN 0444 8660
Xia DK and Pickles CA, 1997, Applications of microwave energy in extractive
metallurgy : a review, Canadian Institute of Mining Bulletin, June 1997, vol 90, No
1011, p 96 - 107
Zhong S et al, 1996, Reduction of iron ore with coal by microwave heating, Minerals
and Metallurgical Processing, American Institute of Mining Engineers, ISSN 0747
9182

Personal Communications, References and Bibliography R-11
Bibliography
Addison J, 1994, Vermiculite is not asbestos (http://www.vermiculite.org, accessed in
Jul 1999)
Al-Rizzo et al, 1998, Finite-difference time-domain modelling of longitudinal resonant
slot-pair geometries in a WR975 waveguide, (http://www.emrmicrowave.com,
accessed in Jun 1999)
Al-Rizzo et al, 1998, finite-difference time-domain modelling of an aperture-coupled
TE10n rectangular cavity resonator for high power microwave processing,
(http://www.emrmicrowave.com, accessed in Jun 1999)
Andres U and Timoshkin I, 1998, Dielectric separation of solids in water polarized by
a pulsating electrical field, Innovations in Mineral and Coal Processing : Proceedings
of the 7th International Mineral Processing Symposium, Atak et al (ed),
ISBN 9058090132
EMR Microwave Technology Corp, Accessed in Apr 2000, EMR Microwave
Technology http://www/emrmicrowave.com
Mineral Data, Accessed in Aug 1999, Vermiculite Mineral Data
http://web.wt.net/~daba/Mineral/data
The Vermiculite Association, Accessed in Apr 2000, Vermiculite : health, safety and
environmental aspects, The Vermiculite Association, http://www.vermiculite.org
Department of Chemical Engineering - Stellenbosch University, Accessed in Apr
2000, Dielectric Heating, http://ee.sun.ac.za/microheat
Austin LG, 1987, Approximate calculation of specific fracture energies for grinding,
Powder Technology, vol 53, Elsevier, ISSN 0461 5721
Barbery G, 1991, Liberation 1,2,3 : Theoretical analysis of the ef ect of space
dimension on mineral liberation by size reduction, Minerals Engineering, vol 5, no 2
Pergamon, ISSN 0892 6875
Barlow HM, 1947, Microwaves and wave guides, Constable and Company Ltd,
London, ISBN x279 0696
Barnsley BP et al, Iron and steelmaking with microwaves, Microwave Applications
Research Centre, p 189, p 212
Bearman RA et al, 1997, The application of rock mechanics parameters to the
prediction of comminution behaviour, Minerals Engineering, vol 10, no 3, Pergamon,
ISSN 0892 6875

Personal Communications, References and Bibliography R-12
Bearman RA et al, 1991, Prediction of power consumption and product size in cone
crushing, Minerals Engineering, vol 4, Pergamon, ISSN 0892 6875
Bonometti E et al, 1999, Synthesis of mixed oxides assisted by microwave heating, 7th
International Conference on Microwave and High Frequency Heating,Valencia, Spain
Bows JR et al, 1999, Measurement of three-dimensional temperature distributions and
spatial heterogeneity in microwave heated foods by magnetic resonance imaging, 7th
International Conference on Microwave and High Frequency Heating, Valencia,
Spain
Briggs CA and Bearman RA, 1996, An investigation of rock breakage and damage in
comminution equipment, Minerals Engineering, vol 9, no 5, Pergamon,
ISSN 0892 6875
Brittan MI, 1975, Variable activation energy model for leaching kinetics, International
Journal of Mineral Processing, Elsevier, ISSN 0301 7516
Bulatovic SM and Wyslouzil DM, 1982, Process development for complex copper lead
zinc ores - laboratory and pilot scale studies, XIV International Minerals Processing
Congress, Toronto
Catala-Civera JM et al, 1999, Microwave rubber vulcanization in a novel three zone
pressure-aided cylindrical cavity, 7th International Conference on Microwave and High
Frequency Heating, Valencia, Spain
Cavanna M et al, 1982, Bulk flotation as an alternative to the beneficiation of very
finely disseminated complex sulphide ores in a massive pyrite matrix, XIV
International Mineral Processing Congress, Toronto
Chernet T, 1999, Mineralogical and textural constraints on mineral processing of the
Koivusaarenneva ilmenite ore, Kälviä, western Finland, International Journal of
Mineral Processing, vol 57, p153-165, Elsevier, ISSN 0301 7516
Choi WZ et al, 1987, Liberation analysis using a simple image processing system,
Proceedings of Particulate and Multiphase Processes Vol 3 : Colloidal and Interfacial
Phenomena, Hemisphere publishing corporation, Washington DC,
ISBN 0 89 116 6572
Choi WZ et al, 1988, Estimation of model parameters for liberation and size reduction,
Minerals and Metallurgical Processing, American Society of Mining Engineers,
ISSN 0747 9182
Clark IH, Microstructural control on crushing strength and mineral liberation potential
: numerical experiments, CSIRO, Australia
Personal Communications, References and Bibliography R-13
Collins DN and Bonney CF, 1998, Separation of coarse particles, International Mining
and Minerals, IMM, vol 1, no 4, p104-112, ISSN 1461 4715
Cresko WC and Booth CL, 1998, Dielectric processing of ceramics for foundry
applications, Mineral and Coal Processing : Proceedings of the 7th International
Mineral Processing Symposium, Atak et al (ed), ISBN 9058090132
Cristea N et al, 1998, Evaluation of autogenous grinding of ores, Innovations in
Mineral and Coal Processing, ISBN 90 5809 013 2
Cutting GW, 1979, The characterisation of mineral release during comminution
processes, The Chemical Engineer, ICHEME, ISSN 0009 2452
Dutrizac JE, 1989, Elemental sulphur formation during the ferric sulphate leaching of
chalcopyrite, Canadian Metallurgical Quarterly, Pergamon, ISSN 0008 4433
Dutrizac JE, 1978, The kinetics of dissolution of chalcopyrite in ferric sulfate
solutions, Metallurgical Transactions B, vol 9B, no 3, p 431 - 439
Dutrizac JE et al, 1970, The kinetics of dissolution of bornite in acidified ferric sulfate
solutions, Metallurgical Transactions, vol 1, no 1, p 225 - 231
Ehlers RA et al, 1999, Inclusion of wall losses in the numerical simulation of
microwave heating problems, 7th International Conference on Microwave and High
Frequency Heating, Valencia, Spain
Fandrich RG et al, 1998, The CSIRO hopkinson bar facility for large diameter particle
breakage, Minerals Engineering, vol 11, no 9, Pergamon, ISSN 0892 6875
Fuerstenau DW and Kapur PC, 1994, A new approach to assessing the grindability of
solids and the energy efficiency of grinding mills, Minerals and Metallurgical
Processing, American Institute of Mining Engineers, ISSN 0747 9182
Goldstein A et al, 1999, MW Sintering at 2.45 GHz in air, of Al2O3/TiC composite
ceramics, 7th International Conference on Microwave and High Frequency Heating,
Valencia, Spain
Griffin LK et al, 1993, Chalcopyrite flotation and liberation characteristics before and
after autogenous grinding at Mount Isa Mines Ltd, XVIII International Mineral
Processing Congress, Sydney
Gupta SK et al, 1991, Phase transformations during heating of ilmenite concentrates,
Metallurgical Transactions, vol 22B
Hajek M, 1998, Microwaves and Catalysis, Mineral and Coal Processing :
Proceedings of the 7th International Mineral Processing Symposium, Atak et al (ed),
ISBN 9058090132
Personal Communications, References and Bibliography R-14
Hallac A and Metaxas AC, 1999, A fully explicit whitney element time domain
formulation for the electromagnetic analysis, 7th International Conference on
Microwave and High Frequency Heating, Valencia, Spain
Haque KE et al, 1999, Microwave energy for mineral treatment processes - a brief
review, International Journal of Mineral Processing, vol 57, Elsevier, ISSN 0301
7516
Harris WG and Hollien KA, 1988, Reversible and irreversible dehydration of hydroxy
interlayered vermiculite from coastal plain soils, Soil Science Society of America
Journal
Harris CC, 1971, Graphical presentation of size distribution data : an assessment of
current practice, Institute of Mining and Metallurgy
Haskett PR et al, 1973, Copper recovery from chalcopyrite by a roast leach procedure,
US Bureau of Mines
Haughton SH (Ed), 1964, The geology of some ore deposits in Southern Africa, The
Geological Society of South Africa, Johannesburg
HoÕten Ç and Özbay C, 1998, Technical note : a comparison of particle bed breakage
and rod mill grinding with regard to mineral liberation and particle shape effects,
Minerals Engineering, vol 11, no 9, p 871-874, Pergamon, ISSN 0892 6875
Kapur PC, 1970, Analysis of the bond grindability Test, Institution of Mining and
Metallurgy
Kelebek S and Francis J, Evaluation of aeration in the processing of complex copper
zinc sulphide ores containing iron sulphides, Mineral and Coal Processing :
Proceedings of the 7th International Mineral Processing Symposium, Atak et al (ed),
ISBN 9058090132
King RP and Scheider CL, Mineral liberation and the batch comminution equation,
Minerals Engineering, vol 11, no 12, p1143-1160, Pergamon, ISSN 0892 6875
King RP and Bourgeois F, 1993, Measurement of fracture energy during single particle
dracture, Minerals Engineering, vol 6, no 4, Pergamon, ISSN 0892 6875
Kingman SW et al, 1996, The effect of dielectric heating on the ring loaded strength of
Norwegian ilmenite, MIRO : Microwave Workshop, Nov 1996, University of
Birmingham
Kraszewski AW and Nelson SO, 1999, Microwave properties of powdered coal in
mixtures, 7th International Conference on Microwave and High Frequency Heating,
Valencia, Spain

Personal Communications, References and Bibliography R-15
Lanigan PG, Microwave energy potential uses in mineral extraction industries, BHP
CRL
Laplante AR et al, 1988, Error analysis for Bond work index determinations : part 1 -
accuracy and reproducibility, Minerals Engineering, vol 1, no 2, Pergamon,
ISSN 0892 6875
Lewis FM et al, 1976, Comminution : a guide to size reduction system design, Mining
Engineering
Link G et al, 1999, Hot wall 30GHz cavity for homogenous high temperature heating,
7th International Conference on Microwave and High Frequency Heating, Valencia,
Spain
Lo YC et al, 1995, Cost reduction in grinding plants through process optimization and
control, Minerals and Metallurgical Processing, vol 13, American Society of Mining
Engineers, ISSN 0747 9182
Lorenzen L and Tumilty JA, 1992, Diagnostic leaching as an analytical tool for
evaluating the effects of reagents on the performance of a gold plant, Mineral
Engineering, vol 5, Pergamon, ISSN 0892 6875
Lundberg B, 1976, A split Hopkinson bar study of energy absorption in dynamic rock
fragmentation, International Journal of Rock Mechanics, vol 13, p 187-197,
Pergamon, ISSN 0148 9062
McClintock WW et al, 1995, Release of a stratiform copper sulphide ore using column
flotation, Minerals and Metallurgical Processing, American Society of Mining
Engineers, ISSN 0747 9182
McGill SL et al, 1988, The effects of power level on the microwave heating of selected
chemicals and minerals, Mat Res Soc Symp Proceedings, vol 124
Mehta RK et al, 1990, Liberation modelling and parameter estimation for
multicomponent mineral systems, Minerals and Metallurgical Processing, American
Society of Mining Engineers, ISSN 0747 9182
Middlemiss S and King RP, Investigation of the Microfracture Characteristics of
Geological Materials by Indentation Techniques, International Journal of Mineral
Processing, vol 44-45, p 43-58, Elsevier, ISSN 0301 7516
Morozov GA et al, 1999, Microwave seeds treatment, 7th International Conference on
Microwave and High Frequency Heating, Valencia, Spain
Morozov OG et al, 1999, Studying of temperature field distribution in microwave
operating camera, 7th International Conference on Microwave and High Frequency
Heating, Valencia, Spain
Personal Communications, References and Bibliography R-16
Moys MH Skorupa J, 1993, Measurement of the radial and tangential forces exterted
by the load on a liner in a ball mill as a function of load volume and mill speed,
International Journal of Mineral Processing, vol 37, Elsevier, ISSN 0301 7516
Mulak W, 1998, Oxidative leaching of polymetallic sulphide concentrates, Innovations
in Mineral and Coal Processing, ISBN 90 5809 013 2
Narayanan SS et al, 1987, Relationship between breakage parameters and process
variables in ball milling - an industrial case study, International Journal of Mineral
Processing, vol 20, Elsevier, ISSN 0301 7516
Oka Y and Majima H, A theory of size reduction involving fracture mechanics,
Canadian Metallurgical Quarterly, vol 9 no 2, Pergamon, ISSN 0008 4433
Özkahraman T and Ôirin M, 1998, The use of brittleness test in determination of
grindability and crushing resistance of rocks and marbles, Mineral and Coal
Processing : Proceedings of the 7th International Mineral Processing Symposium,
Atak et al (ed), ISBN 905809013 2
Palomero FG, Rio Tinto deposits - geology and geological models for the exploration
and ore reserve evaluation, sulphide deposits - their origin and processing, Gray,
Bowyer, Castle, Vaughan, Warner (ed’s), IMM
Pauw OG, 1988, Optimization of Individual Events in Grinding Mills During Which
Breakages Occur, Powder Technology, vol 55, p 247 - 257, Elsevier, ISSN 0032 5910
Pauw OG and Mare MS, 1988, The determination of optimum impact breakage routes
for an ore, Powder Technology, vol 54, p 3-13, Elsevier, ISSN 0032 5910
Peng J and Liu C, 1992, The kinetics of ferric chloride leaching of sphalerite in the
microwave field, Transactions of NFsoc
Petruk W, 1991, Measurements to determine mineral liberation by image analysis,
Minerals and Metallurgical Processing, American Society of Mining Engineers,
ISSN 0747 9182
Powell MS and Vermeulen LA, The influence of liner design on the rate of production
of fines in a rotary mill, Minerals Engineering, vol 7, Pergamon, ISSN 0892 6875
Radziszewski P and Tarasiewicz S, 1993, Simulation of ball charge and liner wear,
Wear, vol 169, p 77 - 85, ISSN 0043 1648
Radziszewski P, 1997, Predictive model for ball mill wear, Canadian Metallurgical
Quarterly, vol 36, no 2, Pergamon, ISSN 0008 4433
Regier M and Schubert H, 1999, A partially filled cylindrical TE011 cavity to measure
dielectric properties as MW frequencies, 7th International Conference on Microwave
and High Frequency Heating, Valencia, Spain
Personal Communications, References and Bibliography R-17
Semenov VE et al, 1999, Microwave field distribution inside an oversized cavity :
comparison of calculations within the ray tracing method with exact solutions, 7th
International Conference on Microwave and High Frequency Heating, Valencia,
Spain
Ôener S and Özbayo—lu G, 1998, Effect of heat treatment on the grindability of
Ulexite, Innovations in Mineral and Coal Processing : Proceedings of the 7th
International Mineral Processing Symposium, Atak et al (ed), ISBN 9058090132
Standish N and Worner H, 1990, Microwave application in the reduction of metal
oxides with carbon, Journal of Microwave Power and Electromagnetic Energy,
International Microwave Power Institute, ISSN 0832 7823
Starkey J, 1997, Getting more from drill core preliminary SAG design, Randoli Gold
Forum ‘97
Tranquilla JM et al, 1999, A Cartesian-cylindrical hybrid FD-TD analysis of composite
microwave applicator structures, Journal of Microwave Power and Electromagnetic
Energy, vol 34, no 2, International Microwave Power Institute, ISSN 0832 7823
Tranquilla JM and Gordon M, Microwave Treatment - Economic Sense
(http://www.emrmicrowave.com )
Tranquilla JM et al, 1998, An engineering and economic model for microwave
processing of mine tailings (http://www.emrmicrowave.com )
Tranquilla JM and Haque KE, 1998, Alkaline cyanide leaching of an atypical
refractory gold contained in mill tailings (http://www.emrmicrowave.com )
Uuem4is H et al, 1996, Wear in high speed impact mills, International Journal of
Mineral Processing, vol 44-45, Elsevier, ISSN 0301 7516
Veasey TJ et al, 1993, The physical separation and recovery of metals from wastes,
Gordon and Breach Science Publishers, ISBN 2881 249169
Venkatachalam S, 1991, Treatment of chalcopyrite concentrates by hydrometallurgical
techniques, Minerals Engineering, vol 4, Pergamon, ISSN 0892 6875
Vileno EM et al, 1998, Microwave processing of glass ceramics, Innovations in
Mineral and Coal Processing : Proceedings of the 7th International Mineral
Processing Symposium, Atak et al (ed), ISBN 9058090132
Vileno EM et al, 1999, Microwave processing of glass ceramics, 7th International
Conference on Microwave and High Frequency Heating, Valencia, Spain
Vriezinga CA, 1999, Thermal runaway in microwave heated slabs of foodstuffs and
ceramics : a comparison, 7th International Conference on Microwave and High
Frequency Heating, Valencia, Spain

Personal Communications, References and Bibliography R-18
Wäppling-Raaholt B et al, 1999, FD-TD simulation of a microwave heating process :
effects of food parameters, 7th International Conference on Microwave and High
Frequency Heating , Valencia, Spain
Weller KR et al, 1996, Use of grinding and liberation models to simulate tower mill
circuit performance in a lead/zinc concentrator to increase flotation recovery,
International Journal of Mineral Processing, vol 44-45, Elsevier, ISSN 0301 7516
Wills BA and Atkinson K, 1993, Some observations on the fracture and liberation of
mineral assemblies, Minerals Engineering, vol 6, no 7 Pergamon, ISSN 0892 6875
Worner H et al, Microwaves in Pyrometallurgy
Yigit E, 1976, Three mathematical comminution models based on strain energy,
International Journal of Mineral Processing, vol 3, Elsevier, ISSN 0301 7516
Young RJ and Veasey TJ, 2000, Technical note : application of the ring loaded
strength disc test to monitor the effects of thermal pretreatments on ore grindability,
Minerals Engineering, vol 13, no 7, Pergamon, ISSN 0892 6875