the effect of maternal education on child health · the effect of maternal education on child...
TRANSCRIPT

The Effect of Maternal Education on Child Health
December, 2006
Prepared for 2007 American Economic Association Annual Meetings
PRELIMINARY; PLEASE DO NOT CITE
Dean R. Lillard Kosali Simon Maki Ueyama Department of Policy Analysis Department of Policy Analysis Department of Policy Analysis
and Management and Management and Management 432B MVR Hall 106 MVR Hall 426C MVR Hall
Cornell University Cornell University Cornell University Tel. 607 255 9290 tel: 607 255 7103 tel: 607 254 6328
email: [email protected] email: [email protected] email: [email protected]
.

Abstract We use an IV approach to examine the causal effect of mother’s high school education on child health using the 1979-2002 waves of the NLSY79 and the 1990-2002 waves of the NLSY79CY. We instrument education with a rich set of education policy variables. We find that mothers who complete high school are more likely to report their child was ill enough to need a doctor, that their child was ill more times, and that their child was more likely to have fractured or dislocated a bone in the past 12 months that required medical attention or treatment. Across samples of mothers who dropped out of high school and who completed high school, we find no difference in the date of their children’s last routine health checkup, percentiles for weight-for-age, height-for-age, BMI-for-age, or in the probability of children at risk of overweight and of being overweight. When we examined the possible mechanisms, we found that mother’s high school education increases mother’s age at child’s birth, health insurance coverage and child care use. We also find suggestive evidence of a much more complex set of behaviors that are causally related to education (child care use, health insurance status, fertility decisions) and that likely affect child health. This preliminary evidence suggests that much more work needs to be done before one can strongly conclude that child health does or does not systematically vary with differences in maternal education on the margin we study.
2
1. Introduction and Background
Scientists and policy makers have long been interested in the theoretical and empirical
relationship between education and social and economic outcomes not directly tied to labor
markets. Among other outcomes of interest, empirical researchers have studied not only whether
a person improves her own health when she gets more education but also whether the health of
her children improves (Grossman and Kaestner 1997; Grossman 2005). Although researchers
long ago developed theoretical models of household and health production functions that include
a role for education (Becker 1960; Grossman 1972), the empirical literature has yielded a limited
and conflicting body of evidence on the causal effect of education on health.
The body of empirical evidence is yet unsettled in part because theory suggests not only
that education can improve health but also that health can affect education. This simultaneous
causal relationship has meant that empirical studies must find a way to separate the causal effect
of health on education from the causal effect of education on health. In addition to potential
problems of simultaneity, investigations of the causal role of education on health must confront
classical omitted variable bias – the usual candidates being unobserved ability (Behrman and
Rosenzweig 2002) and rates of time preference (Fuchs 1982, de Walque 2004, 2005). To
confront these empirical challenges researchers have used three methods: the inclusion of past
health measures (Wagstaff 1993, Bolin et al 2002, Hurd and Kapteyn 2003); exploiting
differences between siblings or twins (Wolfe and Behrman 1987, Strauss 1990, Behrman and
Rosenzweig 1999); and the method of instrumental variables (IV) (Berger and Leigh 1989;
Currie and Moretti 2003; Kenkel, Lillard and Mathios 2006). Of these, the IV approach imposes
the fewest assumptions and has produced the most reliable estimates (Grossman, 2005).
IV studies of outcomes in developing economies generally find that education is
3
associated with better child health. Using variation in education that resulted from the
construction of new primary schools and other education policy changes, researchers find that,
when women get more education, child mortality falls (Breierova and Duflo 2004; Blunch 2005)
and children’s height-for-age increases (Ahmad and Iqbal 2005).
IV studies using US data yield more mixed evidence. Using variation in education that
resulted when colleges were opened nearby, Currie and Moretti (2003) find that white women
who got more education had healthier children. However, McCrary and Royer (2006) find that
women with an additional year of education below high school (predicted from the interaction
between compulsory schooling laws and dates of birth), gave birth to children whose health did
not differ from children born to women with fewer years of education. Limitations in both
studies leave open the question of whether more educated US women produce healthier children.
In both the developing and developed economy context, a better understanding of the
causal relationship between education and health is a key input to several ongoing public policy
debates because it affects estimates of the public and private benefits of education. Knowing
whether and how education affects the production of health – especially the health of children -
will affect not only decisions about the public financing of education but also decisions about
how to target and deliver health inputs. Although several researchers are focused on whether
education affects health input delivery in the developing world context (Schultz 1993; Strauss
1990), the issue figures as prominently in debates about public health of children in more
developed economies (Currie and Moretti 2003; McCrary and Royer 2006).
In this study we follow a well-established literature that uses the IV approach to
contribute in several ways to a sparser set of studies that use US data to investigate whether a
child’s health improves when his mother gets more education. Like several recent studies, we
4
use state education policies as instruments that likely satisfy the exogeneity assumption required
by the IV method.1 In particular, like Kenkel, Lillard, and Mathios (2006), we use high school
graduation requirements and policies governing testing for and issuance of certificates of General
Educational Development (GED). We also exploit aspects of compulsory education laws similar
to those used by Adams (2002), Lleras-Muney (2005), Chevalier (2004), Black, Devereux, and
Salvanes (2004), Arendt (2005), and McCrary and Royer (2006).2 What distinguishes our set of
instruments from those used in other studies is that, because we have exact dates of changes in
education policies, we exploit the full variation in these laws.3
Our study also contributes because it uses nationally representative data from the 1979-
2002 waves of the National Longitudinal Survey of Youth 1979 (NLSY79) and the1990-2002
waves of the NLSY79 Child and Young Adult Surveys (NLSY79CY). These data allow us to
investigate the effect of a mother’s high school education on her child’s health for women of all
races and across a wide range of ages. Our results therefore complement the results of Currie
and Moretti (2003) who, because so few black women attended and completed college during
their sample period, could only use their instrument for a sample of white mothers. Because we
examine birth outcomes of women as old as 40, our study extends the analysis of McCrary and
1 An older literature uses instruments with questionable exclusion restrictions because they are the outcome of individual or parental choices. These instruments have included parental schooling (Berger and Leigh 1989; Sander 1995a, 1995b; Leigh and Dhir 1997), ability test scores, scores on tests of knowledge about occupations (Berger and Leigh 1989), number of siblings (Sander 1995a, 1995b), and parental income (Leigh and Dhir 1997). A second set of instruments, slightly less questionable because they reflect choices families made in the more distant past, includes whether a family lives in a rural area, region of residence at age 16 (Sander 1995a, 1995b), and state of residence in childhood (Leigh and Dhir 1997). 2 Other instruments used in the more recent literature include per capita state income, education spending in one’s childhood state of residence (Berger and Leigh 1989), child labor laws, and state characteristics at age 14 (Lleras-Muney 2005, Adams 2002), college openings (Currie and Moretti 2003); primary school construction programs (Chou, Grossman, and Liu 2003, Breierova and Duflo 2004); and Vietnam War draft induction risk (DeWalque 2004, MacInnis 2006). 3 Except for Kenkel, Lillard, and Mathios (2006), who also use exact dates of changes, previous studies rely on snapshots of a few provisions of compulsory education laws compiled every several years. They assign the same laws to all children in the same cohort (Acemoglu and Angrist 2000, Lleras-Muney 2005, Lochner and Moretti 2004).
5
Royer (2006) - who limit their sample to mothers aged 23 or younger – to a broader population.
Finally, to the best of our knowledge, ours is the first study to examine whether
completing high school education affects child health not only in infancy but also through
childhood and into adolescence. Our preliminary results indicate that the causal relationship
between a child’s health and whether his mother completes high school is a complicated is either
unaffected or worse when his mother completed high school compared to when she drops out.
The remainder of the paper proceeds as follows. In section 2 we sketch the basic model
and conceptual framework underlying the study. In section 3 we outline the identification
strategy. We describe the data in section 4. We present results from the main analysis in section
5 and results from a set of robustness checks in section 6. In section 7 we discuss the results,
conclude, and discuss what our results imply for future research.
2. Basic Model and Conceptual Framework
Researchers have incorporated a causal role for education in theoretical health production
and health demand models in two ways. A number of researchers have posited that more
educated mothers might produce better health because they combine health inputs more
efficiently (Rosenzweig and Schultz 1982, Rosenzweig and Schultz 1989, Kenkel 1991, Kenkel
2000, Rosenzweig 1995, Goldman and Lakdawalla 2002, Glied and Lleras-Muney 2003). For
example, more educated mothers may buy the optimal amount of preventative care by visiting
doctors at a rate that more effectively prevents serious illnesses. Similarly, when they have
children, more educated women may consciously consume less of goods, such as tobacco or
alcohol, because the negative externalities associated with the consumption of those goods raises
what it costs to produce a healthy child. This causal pathway has been given the label “allocative
efficiency.” Other researchers have posited that education directly affects the amount of health a
6
woman can produce with a given set of inputs (Grossman 1972a, 1972b, 2000). A more
educated woman might produce more health from a given set of inputs if, for example, her
education taught her what combinations of food yield the most nutrients. Similarly, more
educated women might produce more health from given inputs because their education makes it
more likely that they carefully follow the treatment plan that doctors prescribe. This causal
pathway has been given the label “productive efficiency.”
These two pathways are easily incorporated into extensions of Grossman’s (1972) health
production model used by Blunch (2005), Gilleskie and Harrison (1998) and Kennedy (2003).
We follow those authors by assuming that each mother’s utility (U) depends on her own
consumption (X) and the health of her child (H). That is ),( HXuU = (1). A child’s health (H)
is produced with purchased (medical) inputs (M) (including the time of others), and a mother’s
time (Tc) and it varies systematically with age (A), and unobserved characteristics (η). We
include a mother’s education (E) in the health production function to reflect its “productive
efficiency” in the production of health (i.e. it shifts the health production function). The formal
relationship is given by: ),,;,( ηAETMhH c= (2) where variables before the semicolon are
choice variables and those after the semicolon are predetermined.
Mothers are constrained in the time they can invest and the amount of money they have
to purchase inputs. All available time (normalized to 1) is spent either investing in her child’s
health or working (Tw). The time constraint is given by: wc TT +=1 (3).
A woman earns a wage W that depends on her education (E) so that W=W(E). All
earnings are spent buying goods she consumes and medical inputs. That is the budget constraint
is given by: (4) where PMPXPEWT mxw +=)( x is the price of consumption, and Pm is the price
of medical inputs.
7
A mother chooses the time she devotes to her child’s health production, the amount of
purchased medical inputs, and her own consumption to maximize (1) subject to (2)-(4). Solving
the model yields first-order conditions that show the standard result – she allocates time to
production of child health, consumes, and buys medical inputs until the ratio of marginal utility
of each pair of choices just equals the ratio of the price of those inputs. That is, she allocates
resources to satisfy: xx
TH
PEW
UHU )(
= (5), x
M
x
MH
PP
UHU
= (6), and MM
T
PEW
HH )(
= (7)
where Ui and Hi denotes the partial derivatives of the utility and health production functions with
respect to the corresponding argument. (5)-(7) imply that women with more education invest
less of their own time into the production of their child’s health because they earn more in the
labor market. They therefore rationally buy more medical inputs.
Of course this simple model fails to include other possible channels through which
education may affect child health input allocation. For example, the model does not include a
the possibility that more educated women may get access to more resources because they are
able to marry higher quality spouses. We also do not model how education alters fertility
decisions (directly or through income effects) as in quantity-quality models of fertility which
suggests that the changes in income induces a shift in mother’s preference from quantity to
quality of children (Becker 1960, Becker 1991, Becker and Lewis 1973, Behrman and
Rosenzweig 2002, Angrist, Lavy and Schlosser 2005). In those models, women with more
education want fewer but higher quality children because the opportunity cost of her time
increases as her education increases.
The empirical work that follows is generally guided by the above model but, for now, we
have only crude empirical counterparts to proxy for purchased inputs and no measure of time
8

inputs. In the future, however, we will examine some of the pathways, such as the use of
prenatal care, cigarette use, alcohol consumption, etc.
3. Identification strategy
The effect of mother’s education on child health is estimated using an IV approach. In
the first stage, we estimate mother’s education using state’s education policies as instruments:
εαα ++= IVE 10 (8)
where E is mother’s education (an indicator variable for high school completion or more) and IV
is a vector of state policy variables that capture the state’s compulsory education environment
including: including: the minimum age of compulsory entry, the minimum age of permitted
school leaving, the difference in the cutoff month for school entry and child's birth month (i.e.
cutoff month minus birth month), interaction of this difference with the minimum age of
compulsory entry, the difference in the child's birth month from June (i.e. counting back from
June), interaction of this difference with the minimum age of permitted school leaving, total
number of courses required for high school graduation, an indicator variable for states that do not
set a statewide minimum number of courses for high school graduation, first factor calculated
from factor analysis using the number of academic courses required for high school graduation,4
first factor obtained from factor analysis using the number of elective courses required for high
school graduation, an indicator variable for states that do not set a statewide minimum number of
courses for high school graduation, an indicator variable for mothers whose compulsory school
entry policies were assigned assuming that she lived in the same state as her first reported state
of residence, and an indicator variable for mothers whose compulsory school entry policies were
4 Our intention here is to generate variation in the probability of completing high school rather than to gauge the effect of the specific policies. However, it should be kept in mind that the instruments we use could capture differences in both the quality and quantity of education because one of them captures changes in the composition of required courses.
9

assigned assuming that she lived in the same state as her first reported state of residence.5 We
merge our data with the instruments using mother’s state of residence, date of birth and relevant
year. The algorithm used to assign the instruments to the mothers is explained in the appendix.
The source of identification is variation in the compulsory schooling laws across states over time
and across mothers born in different months within a given year that is uncorrelated with
children’s health.
In the second stage, we estimate the effect of mother’s education on child health using
her predicted education from (8) and other exogenous variables:
εββββ ++++=∧
SCEH 2110 (9)
where H is one of the several infant health outcomes including: an indicator variable for whether
the last checkup was 1 year ago or more, an indicator variable for whether the child had any
illness that required medical attention or treatment in past 12 months, the number of illnesses
requiring medial attention or treatment in past 12 months, an indicator variable for whether the
child had any fractured or dislocated bones that required medical attention or treatment in past 12
months, percentile for height-for-age, percentile for weight-for-age, percentile for body mass
index-for-age, an indicator for whether the child is at risk of overweight, and an indicator for
whether the child is overweight.6 ∧
E is mother’s predicted education. C is a vector of child and
mother’s characteristics including: child’s sex, race, age, family size, number of siblings, and
5 In NLSY79 geographic code data, all mothers have information on: state of birth, state of residence at age 14, state of residence at the time of interview and several variables on the past several interstate moves. We used the algorithm used in Lillard and Molloy (2006) to assign state of residence for each year since birth for each mother. However, for mothers with missing information on either state of birth or state of residence at age 14 or both, our algorithm does not work. For these mothers, we assumed that she lived in the same state as the state she first reported as her state of residence. For details on the algorithm used to determine mother’s state of residence, refer to Lillard and Molloy (2006). 6 We used percentile for body mass index-for-age to define at risk of overweight (85th percentile and above) and overweight (95th percentile and above).
10

mother’s age and marital status. One must keep in mind that some of these control variables
such as mother’s age and marital status could themselves be causally affected by education and
therefore part of the effect of maternal education could be acting through the coefficients of these
variables. We discuss more about this issue later in the paper. S is a vector of characteristics of
the child’s state of residence when the child health measures were taken including: the ratio of
employed men to women; the seasonally-adjusted unemployment rate; real median wages; the
maximum value of the federal and state EITC for a single mother with two children; the income
eligibility limit for Medicaid eligibility for pregnant women; the annual employment growth rate;
and the amount of federal housing money spent per 1,000 residents in the state; and a vector of
characteristics of the mother’s state of residence when she was affected by compulsory school
leaving laws including: personal income, per capita personal income, average earning from
industries, construction, manufacturing and service, a vector of characteristics of the child’s
county of residence when the child health measures were taken including: total active non-
federal MDs, total patient care by non-fed MDs, total number of hospitals, and total number of
hospital admissions and total number of hospital beds. These variables capture state by year
differences that may otherwise be confounded with the variation in state educational policies.
Finally, ε is the error term that captures the remaining unobserved factors that are not captured in
the equation.
Equations (8) and (9) are estimated using a linear probability model for dummy
dependent variables and a simple linear model for continuous dependent variables. While the
use of linear probability model will produce inefficient coefficient estimates because the error
term is not normally distributed for categorical dependent variables, Greene (1993) suggests that
estimates from linear models are generally similar to those produced by nonlinear models when
11

evaluated at the sample means. Also, Angrist (2001) suggests that the use of linear probability
models in the first stage do not produce fundamentally different results as the use of nonlinear
probability models in the first stage. The equations are clustered at the state level (i.e. mother’s
state of residence when she was affected by school exit laws). We include fixed effects for
mother’s state of residence when she is affected by school entry policies.
4. Data
The data for this study comes from the 1979-2002 waves of the National Longitudinal
Survey of Youth 1979 (NLSY79) and 1990-2002 waves of the NLSY79 Child and Young Adult
(NLSY79CY). The NLSY79 is a nationally representative dataset that consists of 12,686
individuals who were ages 14-21 as of December 31, 1978. They have been interviewed annually
from 1979 to 1994 and biennially since 1994. In 1986, a survey of children born to female
NLSY79 respondents began and has been conducted biannually since then. In 1994, information
on children ages 15 and older was collected separately and has been conducted biannually since
then. The NLSY79CY includes several details of child's current health conditions and health
history, from mostly mother’s reports for younger children and from self reports for older
children. The only child health measures that were partly measured by survey staff are weight
and height information. In our sample, 33.9%, 38.1%, 51.4% and 47.2% of the percentile for
weight-for-age, percentile for height-for-age, percentile for weight-for-height and obesity
measures (percentile for body mass index-for-age, an indicator for whether the child is at risk of
overweight, and an indicator for whether the child is overweight) were calculated using
measured height and weight information.
Data on state education policies regarding compulsory education laws on school entry
and school exit, collected by Lillard and a colleague, cover the complete history of published
12

compulsory education laws for each state. This compilation of these data was facilitated by the
presence at Cornell University of one of the most complete collections of state statutes in the
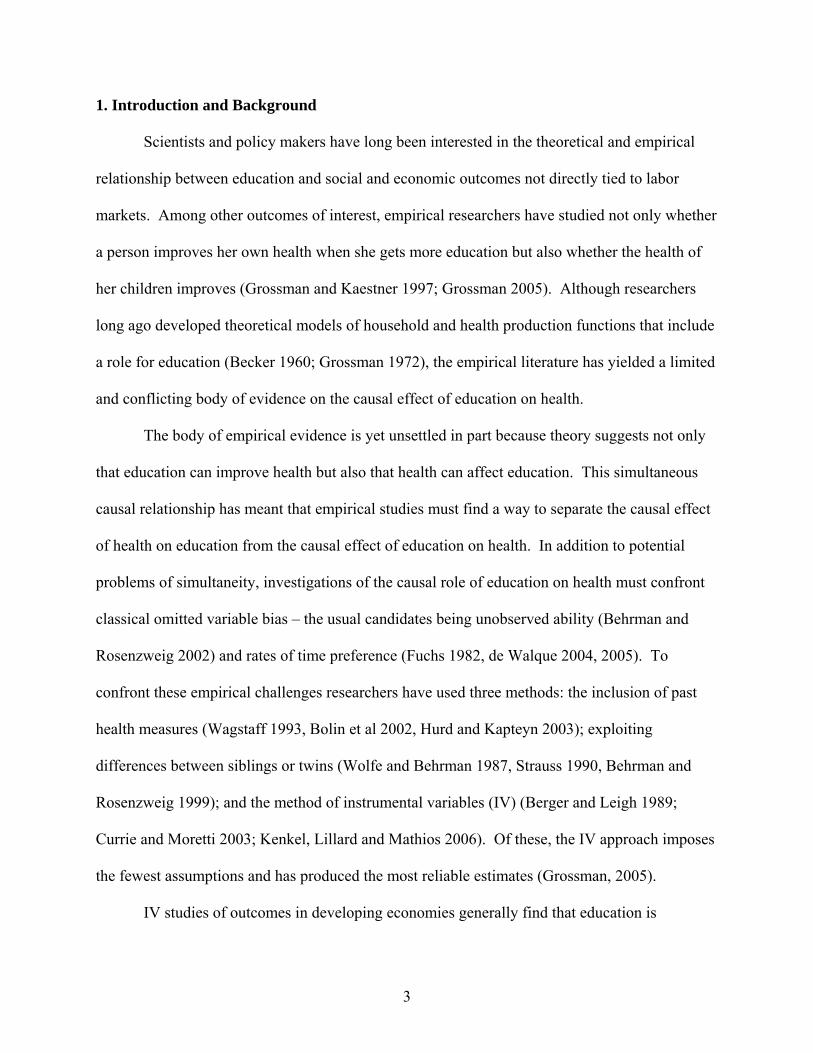
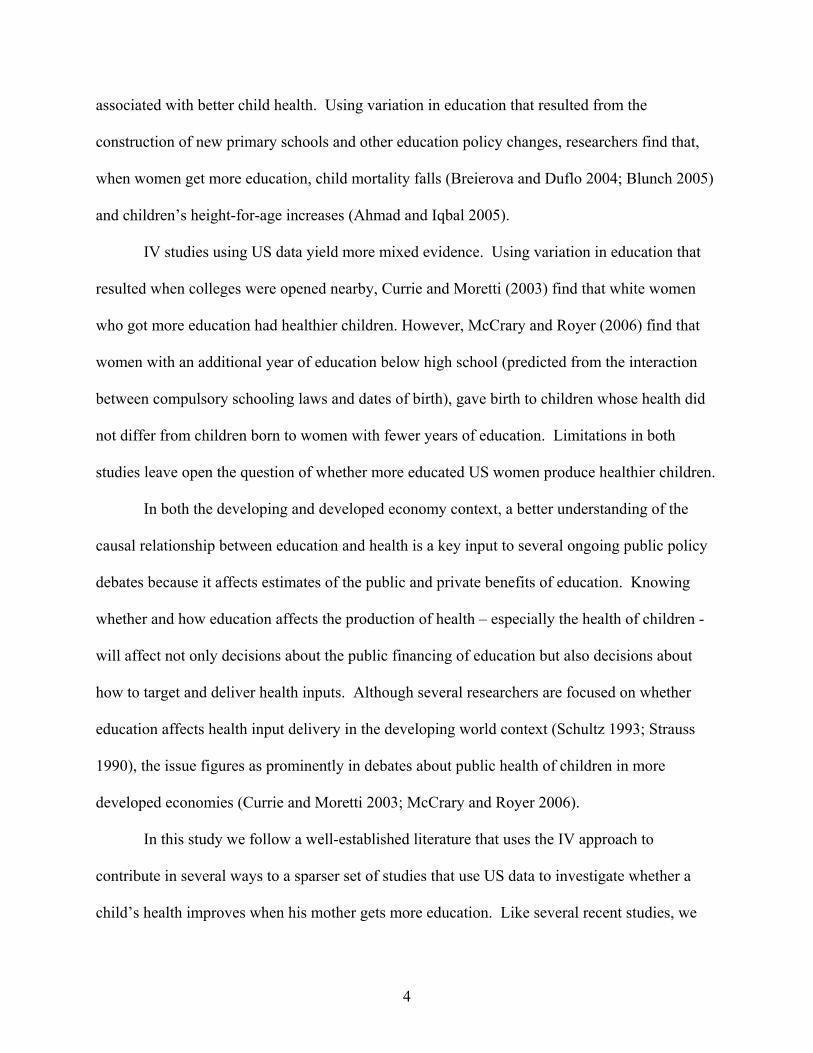
United States. Figures 1 and 2 graphically illustrate the changes in the state compulsory
education policies from 1930 to 2002 and show changes in policies in the average state during
the time period our sample of women were affected by policies governing school entry and exit.
We use several sample restrictions for the study. We exclude observations if their
mothers were living abroad when the compulsory schooling laws most likely took effect and
those for whom data were missing. Each observation is at the child-year level. Sample sizes
vary with the dependent variable we use. The sample size for whether the child had any illness
that required medical attention or treatment in past 12 months was the largest with 43,154 child-
year observations.
Table 1a and 1b show selected descriptive statistics for children and mothers for the
whole sample and for samples of mothers who are high school dropouts and mothers who
completed high school. Overall, mothers have an average of 12.3 years of education. High
school dropout mothers are slightly younger, less likely to be married and more likely to be
Hispanic or black.
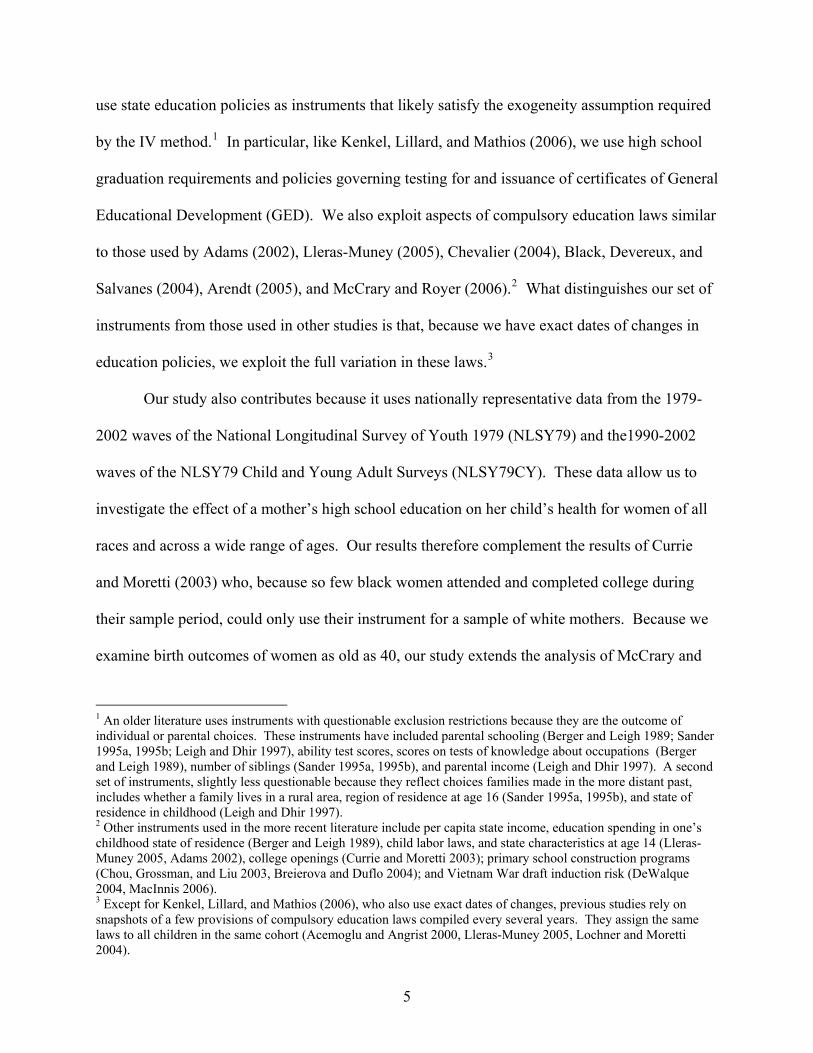
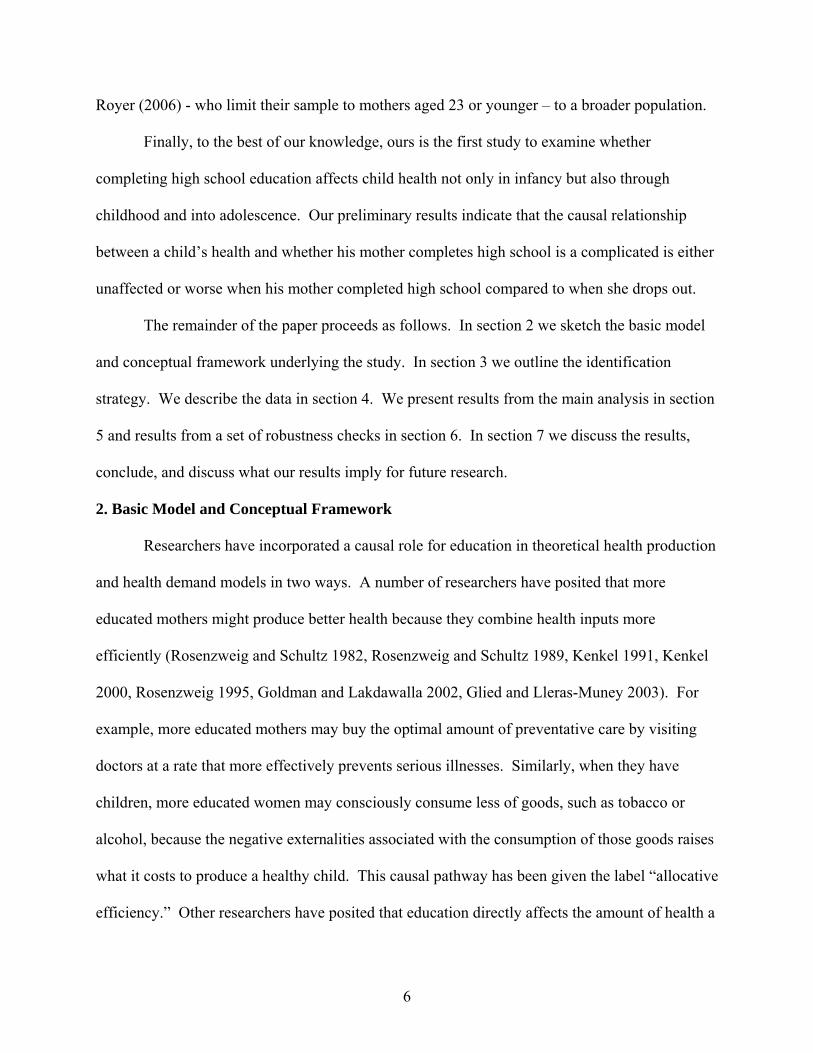
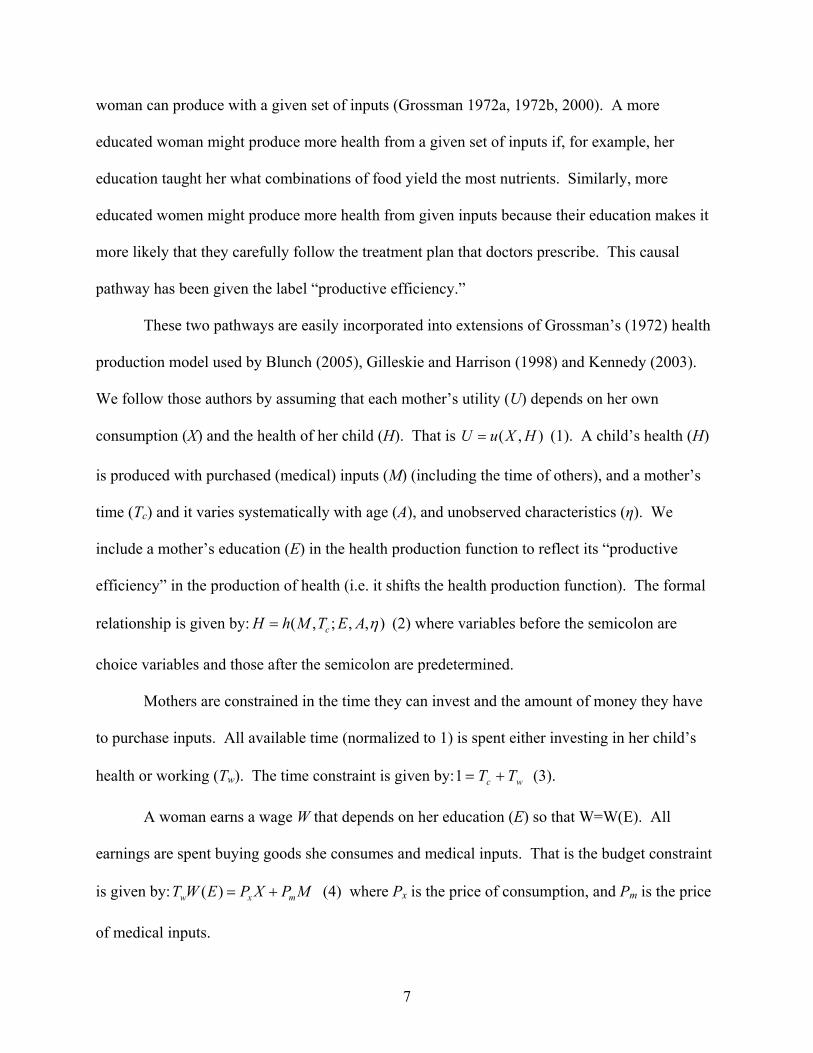
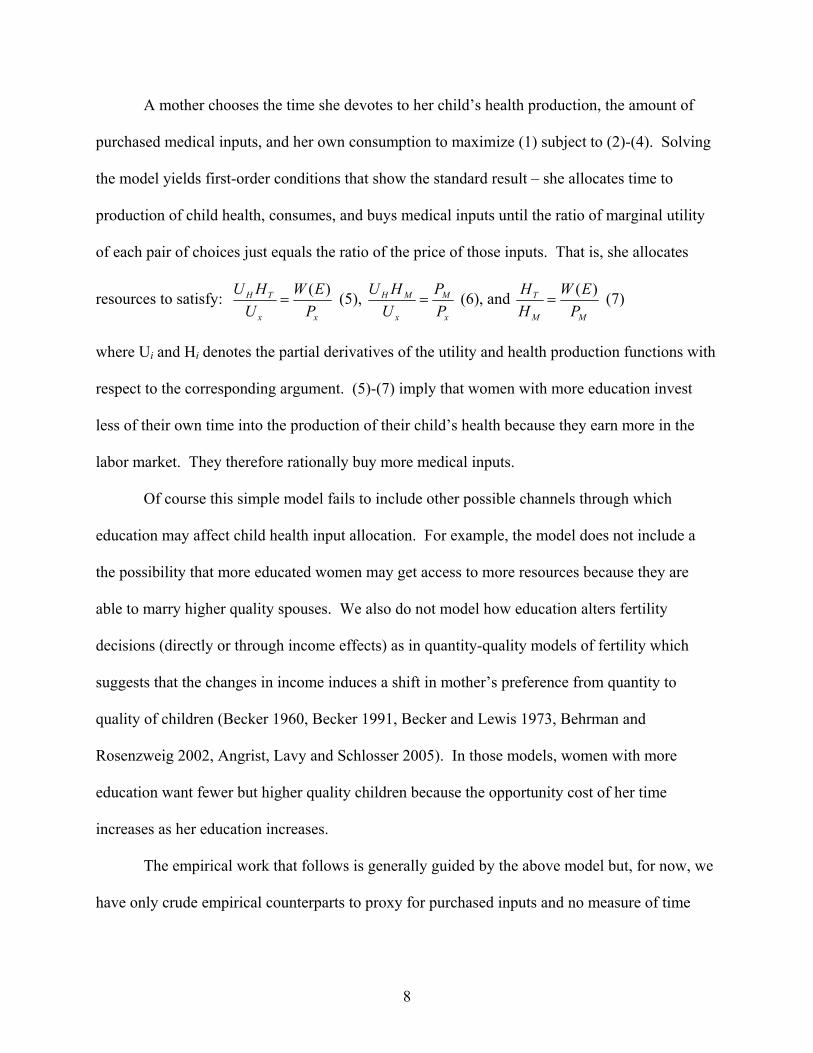
In Figures 3 to 10 we present a first cut of the data. There we plot the bivariate
relationship between children’s health measures and mother’s education across the whole
education distribution. While the bivariate relationships show no clear trend for most outcomes,
mothers who are high school dropouts were less likely to have reported that their child had an
illness that required a doctor’s care and they reported that their child was ill less than mothers
who graduated from high school. As we will show below in the multi-variate analyses, these
data likely reflect some of the complicated tradeoffs to which our simple model above points.
13

5. Results
5.1 OLS Results
The first row of Table 2 shows the results from OLS regressions. Each column
represents a separate regression with a different child health measure as the dependent variable.
The coefficient and robust standard error on the mother’s education variable are shown.
The OLS results in Table 2 suggest that when the marginal woman completes high school
instead of dropping out, she is more likely to report that her child had an illness that required
medical attention or treatment in past 12 months, reports that her child had more such illnesses,
and it is more likely that her child broke or dislocated a bone in the past year. The OLS results
also suggest that women who complete high school will have children who are heavier and taller
for their age than the average child of women who dropped out. To try to identify whether this
relationship is causal, we turn to the instrumental variable regression results reported in the
second row of Table 2.
5.2 IV Results
The second row in Table 2 shows results from our IV regressions.7 The magnitude and
even the sign of our IV estimates vary from our OLS estimates. Except for the results on weight
of age and height for age, there is stronger evidence that children are more likely to be have seen
a doctor for treatment (more times) and are more likely to have broken or dislocated a bone if
their mothers completed high school. The F-statistics reported in the bottom row show that our
policy variables jointly predict the probability a woman completes high school in all samples.
Mother’s high school completion increases by 17.6 percentage points (51 percent) the
probability that a mother reported her child was ill enough that she sought medical care in the
7 Appendix Table 1 presents results from one of our 1st stage regressions. All instruments except for permitted school exit age (where there is only cross-sectional variation) have expected signs.
14

past 12 months. The results suggest that children of mothers who complete high school are ill
slightly more often (0.523 times more) than children whose mothers drop out. The results also
suggest that mothers who complete high school have children who are substantially more likely
to dislocate or fractured a bone over a 12 month period. Once one accounts for the endogeneity
of high school completion, children of mothers who complete high school are no more or less
likely to be heavier or taller for their age than are children of mothers who dropped out of high
school.
As our simple model suggests above, the mix of time and medical inputs should vary
with educational attainment but it is not immediately obvious how. We suggest that the data we
have on health “outcomes” is actually a mixture of medical treatment that more educated
mothers choose rather than spending time themselves treating the illnesses at home. Our
analysis does not control for other behavioral differences of high school educated and high
school dropout mothers that may cause their children to be at greater risk of getting sick and/or
breaking a bone. For example, we do not control for whether a child participates in high risk
sports (e.g. skiing, hockey) that may be more prevalent among children with better educated
mothers. We also do not directly investigate how employment probabilities and wages
(opportunity costs) differ for women who complete high school. Another possibility is that
higher maternal education changes the opportunity cost of maternal time, increasing employment
and decreasing direct time with children. The literature on the effect of maternal employment on
child health shows some negative effects related to overweight (Anderson Butcher and Levine,
2002) and accidents (Currie and Hotz, 2001, for African American mothers), and universal
Canadian daycare on a variety of child health outcomes (Baker, Gruber, and Milligan, 2005).
6. Robustness Checks
15

To test the validity of our instrumental approach, we report, in Table 3, results from
models of behavior that we expect to be uncorrelated with a mother’s educational attainment.
The outcomes we explore as “anti-tests” include whether a child uses his left or right hand to
write, throw a ball, or brush his teeth. Our instrumented education measure is uncorrelated with
all of these outcomes.
In Table 4 we examine our conjecture that education may not only affect the mix of
health inputs (time and purchased inputs) that a mother chooses but that education also affects
other choices that affect a child’s health. We run 2SLS models of a mother’s age at child birth,
whether she is covered by health insurance, whether her child was in child care from age 0 to age
2, and whether the mother is working (when the child outcome is measured). In each case we
test whether those outcomes systematically differ for women who complete high school relative
to women who drop out of high school. Not surprisingly, women who complete high school are
more likely to be older when they first give birth, have health insurance, and have her son or
daughter in child care at younger ages. The results suggest that women who graduate from high
school are not more likely to be working than are women who dropped out.
In Table 5 we rerun the models of weight, BMI, and height for age using a subsample of
the children whose height and weight were measured by interviewers (rather than self-reported).
Both the OLS and 2SLS results are very similar to the earlier findings. The only difference is
that now, mother’s high school completion increases percentile for height-for-age by 9.494. The
similarity of the results may imply that earlier results do not suffer from reporting bias.
Finally, in Table 6, we run a set of regressions that include as right-hand side variables
the behaviors examined in Table 5 (child care use, health insurance status, and employment) plus
a variable that indicated whether the child was ever in child care and a variable to flag those
16

children who have a chronic condition that requires regular treatment. We interact each of these
variables with the instrument education variable to see capture the correlation between education
and these outcomes. While we recognize that these are largely outcomes of choice, we run the
regressions as a tentative exploration of the more complex picture of how maternal education
might be affecting child health.
The results show a generally consistent pattern. Children are more likely to be ill enough
to see a doctor (more often) and are more likely to have broken a bone if they have a chronic
condition, are in child care now or ever, live in a family that has health insurance, or have
mothers who work. However, the association between these factors and the health outcome is
lower for children whose mothers are high school graduates relative children whose mothers are
high school dropouts. These patterns are preliminary evidence that much more digging needs to
be done to understand how child health varies with maternal differences in education (on this
margin).
7. Conclusions
We use an IV approach to examine the causal effect of mother’s high school education on
child health using the 1979-2002 waves of the NLSY79 and the 1990-2002 waves of the
NLSY79CY. To instrument education, we use state compulsory education and high school
graduation requirement policies. We find that mothers who complete high school are more
likely to report their child was ill enough to need a doctor, that their child was ill more times, and
that their child was more likely to have fractured or dislocated a bone in the past 12 months that
required medical attention or treatment. Across samples of mothers who dropped out of high
school and who completed high school, we find no difference in the date of their children’s last
routine health checkup, percentiles for weight-for-age, height-for-age, BMI-for-age, or in the
17

probability of children at risk of overweight and of being overweight. When we examined the
possible mechanisms, we found that mother’s high school education increases mother’s age at
child’s birth, health insurance coverage and child care use. We also find suggestive evidence of
a much more complex set of behaviors that are causally related to education (child care use,
health insurance status, fertility decisions) and that likely affect child health. This preliminary
evidence suggests that much more work needs to be done before one can strongly conclude that
child health does or does not systematically vary with differences in maternal education on the
margin we study (or on other educational margins).
18

References
Acemoglu, D., and J. Angrist (2000), “How large are human-capital externalities? Evidence from compulsory schooling laws”, in: B. S. Bernanke and K. Rogoff, eds., NBER Macroeconomics Annual Vol. 15 (MIT Press, Cambridge, Massachusetts) 9-59. Adams, S. J. (2002) “Educational attainment and health: evidence from a sample of older adults.” Education Economics 10: 97-109. Ahmad, M. and K. Iqbal. (2005) “Mother’s Education and Child Health: Is There Any Threshold?” Mimeo, University of Washington. Anderson, P., Kristin F. Butcher, and Phillip B. Levine. 2002. "Maternal Employment and Overweight Children" NBER Working Paper No. 8770 Angrist, J. (2001) “Estimation of limited dependent variable models with dummy endogenous regressors: Simple strategies for empirical practice.” Journal of Business & Economic Statistics 19, no. 1: 2-16. Angrist, J. D., V. Lavy, and A. Schlosser. (2005) “New Evidence on the Causal Link Between the Quantity and Quality of Children.” NBER Working Paper No. 11835. Arendt, J. N. (2005) “Does education cause better health? A panel data analysis using school reform for identification.” Economics of Education Review 24:149-160. Baker, M., J. Gruber, and K. Milligan. 2005. Universal Childcare, Maternal Labor Supply, and Family Well-Being” NBER Working Paper No. 11832 Becker, G. S. (1960) “An economic analysis of fertility.” in: Demographic and Economic Change in Developed Countries (Princeton University Press for the National Bureau of Economic Research, Princeton, NJ) 209-231. Becker, G. S. and H. G. Lewis. (1973) “On the interaction between the quantity and quality of children.” Journal of Political Economy 81:S279-S288. Becker, G. S. (1991) A Treatise on the Family. Second edition (Harvard University Press, Cambridge, MA). Behrman, J. R. and M. R. Rosenzweig. (2002) “Does Increasing Women’s Schooling Raise the Schooling of the Next Generation?” American Economic Review. 92(1):323–334. Berger, M.C. and J. P. Leigh. (1989), “Schooling, self-selection, and health”, Journal of Human Resources 24:433-455. Black, S. E., P. J. Devereaux, and K. Salvanes. (2004) "Fast Times at Ridgemont High? The Effect of Compulsory Schooling Laws on Teenage Births." NBER Working Paper No. 10911.
19
Blunch, N. (2005) “Maternal Schooling and Child Health Revisited: Does Non-Formal Education Matter?” Mimeo, George Washington University. Bolin, K., L. Jacobson, and B. Lindgren. (2002) “The demand for health and health investments in Sweden.” in: B. Lindgren, ed., Individual Decisions for Health (Routledge, London) 93-112. Breierova, L. and E. Duflo. (2004) “The impact of education on fertility and child mortality: do fathers really matter less than mothers?” Working Paper No. 10513. Chevalier, A. (2004) “Parental education and child’s education: A natural experiment.” Mimeo, University College Dublin. Chou, S., J, Liu, M. Grossman, and T. Joyce. (2004) “Parental Education and Child Health: Evidence from a Natural Experiment in Taiwan." Mimeo, City University of New York. Currie,J., and J. Hotz, 2001. "Accidents Will Happen? Unintentional Injury, Maternal Employment, and Child Care Policy" NBER Working Paper No. 8090 Currie, J. and E. Moretti. (2003) “Mother’s education and the intergenerational transmission of human capital: evidence from college openings.” Quarterly Journal of Economics. 118:1495-1532. Cutler, David M. and Andriana Leras-Muney. (2006) “Education and Health: Evaluating Theories and Evidence.” NBER Working Paper Series, #12352. de Walque, D. (2004) “Education, information, and smoking decisions: Evidence from smoking histories, 1940-2000.” World Bank Working Paper No. 3362. de Walque, D. (2005) “How does the impact of an HIV/AIDS information campaign vary with educational attainment? Evidence from rural Uganda.” World Bank Working Paper No. 3289. Fuchs, V.R. (1982) “Time preference and health: an exploratory study.” in: V.R. Fuchs, ed., Economic Aspects of Health (University of Chicago Press, Chicago) 93-120. Gilleskie, D.B. and A.L. Harrison. (1998) “The effect of endogenous health inputs on the relationship between health and education.” Economics of Education Review 17: 279-297. Glied, S. and A. Lleras-Muney. (2003) “Health inequality, education and medical innovation.” NBER Working Paper No. 9738. Goldman, D. and D. Lakdawalla. (2002) “Health disparities and medical technology.” Working paper (RAND Corporation, Santa Monica, CA). Greene, W. H. (1993) Econometric Analysis, 2nd ed., New York: Macmillan Publishing Company.
20

Grossman, M. (1972a) “On the concept of health capital and the demand for health”, Journal of Political Economy 80:223-255. Grossman, M. (1972b) “The Demand for Health: A Theoretical and Empirical Investigation.” (Columbia University Press for the National Bureau of Economic Research, New York). Grossman, M. (2000) “The human capital model.” in: A.J. Culyer and J.P. Newhouse, eds., Handbook of Health Economics, vol. 1A (Elsevier, Amsterdam) 347-408. Grossman, M. (2005) “Education and Nonmarket Outcomes.” NBER Working Paper No. 11582. Grossman, M. and R. Kaestner. (1997) “Effects of education on health.” in: J.R. Behrman and N. Stacey, eds., The Social Benefits of Education (University of Michigan Press, Ann Arbor, Michigan) 69-123. Hartog, J. and H. Oosterbeek. (1998) “Health, Wealth and Happiness: Why Pursue a Higher Education?” Economics of Education Review. 17(3):245-256. Hurd, M. and A. Kapteyn. (2003) “Health, wealth, and the role of institutions.” Journal of Human Resources 38:387-415. Kenkel, D.S. (1991) “Health behavior, health knowledge, and schooling.” Journal of Political Economy 99:287-305. Kenkel, D.S. (2000) “Prevention.” in: A.J. Culyer and J.P. Newhouse, eds., Handbook of Health Economics, vol. 1B (Elsevier, Amsterdam) 1675-1720. Kenkel, Donald, Lillard, Dean R., and Mathios, Alan. 2006. “The Roles of High School Completion and GED Receipt in Smoking and Obesity.” Journal of Labor Economics. Vol. 24 (3): 635-660. (also NBER working paper 11990). Kennedy, S. (2003) “The Relationship between Education and Health in Australia and Canada.” SEDAP Research Paper No. 93. Kuziemko, Ilyana. (2006) “Using shocks to school enrollment to estimate the effect of school size on student achievement.” Economics of Education Review, 25: 63–75. Lee, V. E., B. A. Smerdon, C. Alfeld-Liro and S. L. Brown. (2000) “Inside Large and Small High Schools: Curriculum and Social Relations.” Educational Evaluation and Policy Analysis, Vol. 22, No. 2, pp. 147-171. Leigh, J.P. and R. Dhir. (1997) “Schooling and frailty among seniors.” Economics of Education Review 16:45-57.
21

Lillard, D. R. and DeCicca, P. (2001) "Higher Standards, More Dropouts? Evidence Within and Across Time." Economics of Education Review, Vol.20, no.5, pp 459-473. Lillard, D. R. and Gerner, J. (2007) “Lemonade from Lemons? Making the Most of Quasi-Exogenous Variation in Compulsory Schooling Policies” Manuscript. Department of Policy Analysis and Management. Cornell University. Lleras-Muney, A. (2005), “The relationship between education and adult mortality in the United States”, Review of Economic Studies 72:189-221. Lochner, L. and E. Moretti (2004), “The effect of education on crime: evidence from prison inmates, arrests, and self-reports”, American Economic Review 94:155-189. MacInnis, B. (2006) “Does College Education Impact Health? Evidence From the Pre-Lottery Vietnam Draft.” Job market paper, Department of Agricultural and Resource Economics, University of California, Berkeley. Downloaded from: http://are.berkeley.edu/~macinnis/macinnis_jobmarketpaper.pdf McCrary, J. and H. Royer. (2006) “The Effect of Female Education on Fertility and Infant Health: Evidence From School Entry Policies Using Exact Date of Birth.” NBER Working Paper No. 12329. Rosenzweig, M. R. (1995) “Why are there returns to schooling?” American Economic Review, 85(2): 153-158. Rosenzweig, M.R. and T.P. Schultz. (1982) “The behavior of mothers as inputs to child health: the determinants of birth weight, gestation, and rate of fetal growth.” in: V.R. Fuchs, ed., Economic Aspects of Health (University of Chicago Press for the National Bureau of Economic Research, Chicago) 53-92. Rosenzweig, M.R. and T.P. Schultz. (1989) “Schooling, information and nonmarket productivity: contraceptive use and its effectiveness.” International Economic Review 30:457-477. Sander, W. (1995a) “Schooling and quitting smoking.” Review of Economics and Statistics 77:191-199. Sander, W. (1995b) “Schooling and smoking.” Economics of Education Review 14:23-33. Schultz, T.P. (1993) “Returns to women’s education.” in: E.M. King and M.A. Hill, eds., Women’s education in developing countries: barriers, benefits, and policy. Baltimore: Johns Hopkins University Press. Strauss, J. (1990) “Households, Communities, and Preschool Children’s Nutrition Outcomes: Evidence from Rural Cote d’Ivoire.” Economic Development and Cultural Change. 38:231-62.
22

Wagstaff, A. (1986) “The demand for health: some new empirical evidence.” Journal of Health Economics 5:195-233. Wagstaff, A. (1993) “The demand for health: an empirical reformulation of the Grossman Model.” Health Economics 2:189-198.
23

Figure 1:
Average State-Mandated Age of First Enrollment,1930-2002
5.80
6.00
6.20
6.40
6.60
6.80
7.00
7.20
7.40
1930
1933
1936
1939
1942
1945
1948
1951
1954
1957
1960
1963
1966
1969
1972
1975
1978
1981
1984
1987
1990
1993
1996
1999
2002
Year
Age
Age
Age on Sept. 1
Source: Lillard and Gerner (2007)
Period NLSY79 sample entered school
Figure 2:
Average State-Mandated Minimum Age of Permitted School Leaving,1930-2002
14.50
15.00
15.50
16.00
16.50
17.00
17.50
1930
1933
1936
1939
1942
1945
1948
1951
1954
1957
1960
1963
1966
1969
1972
1975
1978
1981
1984
1987
1990
1993
1996
1999
2002
Year
Age
Age
Age on Sept. 1
Source: Lillard and Gerner (2007)
Period NLSY79 sample could leave school
24

Figure 3:
Average Percentages of Children with Different Times of Last Routine Checkup by Mother's Years of Education
0
0.05
0.1
0.15
0.2
0.25
0.3
0-11 Years 12 Years or More
Mother's Years of Education
<1 month ago1-3 months ago4-6 months ago7-11 months ago1 year-23 months ago2 years ago or morenever
Figure 4:
Percentage of Children Ever Had Illness Past 12 Months by Mother's Years of Education
0
0.05
0.1
0.15
0.2
0.25
0.3
0.35
0.4
0.45
0.5
>=9 10 11 12 13 14 15 16 17 18 19 20
Mother's Years of Education
25
Figure 5:
Number of Illnesses Past 12 Months by Mother's Years of Education
0
0.2
0.4
0.6
0.8
1
1.2
1.4
>=9 10 11 12 13 14 15 16 17 18 19 20
Mother's Years of Education
Figure 6: Average Percentiles for Weight-for-Age by Mother’s Education
Average Percentile for Weight-for-Age by Mother's Years of Education
0
10
20
30
40
50
60
70
<=9 10 11 12 13 14 15 16 17 18 19 20
Mother's Years of Education
26

Figure 7:
Average Percentile for Height-for-Age by Mother's Years of Education
0
10
20
30
40
50
60
70
<=9 10 11 12 13 14 15 16 17 18 19 20
Mother's Years of Education
Figure 8:
Average Percentile for BMI-for-Age by Mother's Years of Education
48
50
52
54
56
58
60
62
<=9 10 11 12 13 14 15 16 17 18 19 20
Mother's Years of Education
27

Figure 9:
Percentage of Children At Risk of Overweight Mother's Years of Education
0.22
0.23
0.24
0.25
0.26
0.27
0.28
0.29
0.3
<=9 10 11 12 13 14 15 16 17 18 19 20
Mother's Years of Education
Figure 10:
Percentage of Overweight Children by Mother's Years of Education
0
0.02
0.04
0.06
0.08
0.1
0.12
0.14
0.16
0.18
<=9 10 11 12 13 14 15 16 17 18 19 20
Mother's Years of Education
28

Table 1a: Child’s and Mother’s Characteristics: All Children and by Mother’s Education (Dependent Variable: Ever Ill in Past Year) Variable All HS dropout HS or more
child's age 7.449 (4.345)
8.150 (4.454)
7.196 (4.278)
child's sex: female 0.492 (0.500)
0.494 (0.500)
0.491 (0.500)
child's race: Hispanic 0.202 (0.401)
0.303 (0.460)
0.165 (0.372)
child's race: black 0.305 (0.460)
0.348 (0.476)
0.289 (0.453)
child's race: non-black, non-hispanic 0.493 (0.500)
0.348 (0.477)
0.546 (0.498)
mother's education in years 12.349 (2.505)
9.464 (1.760)
13.389 (1.828)
mother's age 32.880 (4.914)
31.352 (4.804)
33.430 (4.836)
mother’s marital status: never married 0.148 (0.355)
0.238 (0.426)
0.115 (0.320)
mother’s marital status: married 0.644 (0.479)
0.481 (0.500)
0.703 (0.457)
mother’s marital status: separated 0.079 (0.270)
0.131 (0.338)
0.060 (0.238)
mother’s marital status: divorced 0.120 (0.325)
0.134 (0.341)
0.115 (0.319)
mother’s marital status: widowed 0.009 (0.093)
0.015 (0.121)
0.007 (0.081)
N 43154 11430 31724 Note: An observation is a person-year at the child level.
29

Table 1b: Child Health Outcomes: All Children and by Mother’s Education Variable All HS dropout HS or more
last check up: 1yr ago or more 0.326 (0.469)
0.356 (0.479)
0.315 (0.465)
N 42889 11330 31559
ever been ill past year 0.346 (0.476)
0.264 (0.441)
0.376 (0.484)
N 43154 11430 31724
# of times ill past year 0.821 (1.948)
0.627 (1.935)
0.890 (1.948)
N 43094 11409 31685
ever had bone fractures past year 0.025 (0.157)
0.020 (0.140)
0.027 (0.163)
N 35361 8795 26566
percentile: weight-for-age 56.682 (30.417)
54.684 (30.790)
57.681 (30.180)
N 21626 7203 14423
percentile: height-for-age 55.041 (31.598)
51.931 (31.589)
56.730 (31.476)
N 17893 6297 11596
percentile: BMI-for-age 55.883 (33.076)
54.839 (33.088)
56.449 (33.058)
% at risk of overweight 0.268 (0.443)
0.258 (0.438)
0.273 (0.446)
% overweight 0.137 (0.344)
0.134 (0.341)
0.139 (0.346)
N 17786 6256 11530
30

Table 2: OLS and 2SLS Regressions lastcheckup ill past year bone fracture past year >=1yr ago ever number ever
OLS -0.005 (0.009)
0.053*** (0.006)
0.089*** (0.028)
0.006*** (0.002)
2SLS 0.009 (0.060)
0.180** (0.072)
0.542*** (0.183)
0.035*** (0.009)
N 42889 43154 43094 40851 F(k, N-k) 87, 42801 87, 43066 87, 43006 87, 43763 Fstat 142.06 142.81 142.57 135.00
Percentiles
wt-for-age ht-for-age BMI-for-age
at risk of overwt Overwt
OLS 1.928** (0.843)
4.152*** (0.939)
0.179 (0.901)
-0.008 (0.013)
-0.016* (0.009)
2SLS -2.537 (5.903)
8.122 (5.577)
-4.843 (6.839)
-0.091 (0.078)
-0.030 (0.053)
N 27885 24140 23939 23939 23939 F(k, N-k) 87, 27797 87, 24052 87, 23851 87, 23851 87, 23851 Fstat 89.74 77.86 77.59 77.59 77.59
Note: *** Significant at 1% level, *** Significant at 5% level, * Significant at 10% level Robust standard errors are in parenthesis. Each regression includes controls for child’s sex, race, age, family size, number of siblings and mother’s age and marital status, characteristics of the child’s state of residence when the child health measure was taken (the ratio of employed men to women, the seasonally-adjusted unemployment rate, real median wages, the maximum value of the federal and state EITC for a single mother with two children, the income eligibility limit for Medicaid eligibility for pregnant women, the annual employment growth rate, and the amount of federal housing money spent per 1,000 residents in the state), a vector of characteristics of the mother’s state of residence when she was affected by compulsory school leaving laws (personal income, per capita personal income, average earning from industries, construction, manufacturing and service) and a vector of characteristics of the child’s county of residence when the child health measures were taken (total active non-federal MDs, total patient care by non-fed MDs, total number of hospitals, and total number of hospital admissions and total number of hospital beds). Standard errors are clustered at the state level (i.e. mother’s state of residence when she was affected by school exit laws). All regressions include fixed effects for mother’s state of residence when she is affected by school entry policies. Instruments used in 2SLS regressions are: the minimum age of compulsory entry, the minimum age of permitted school leaving, the difference in the cutoff month for school entry and child's birth month (i.e. cutoff month minus birth month), interaction of this difference with the minimum age of compulsory entry, the difference in the child's birth month from June (i.e. counting back from June), interaction of this difference with the minimum age of permitted school leaving, total number of courses required for high school graduation, an indicator variable for states that do not set a statewide minimum number of courses for high school graduation, first factor calculated from factor analysis using the number of academic courses required for high school graduation, first factor obtained from factor analysis using the number of elective courses required for high school graduation, an indicator variable for states that do not set a statewide minimum number of courses for high school graduation, an indicator variable for mothers whose compulsory school entry policies were assigned assuming that she lived in the same state as her first reported state of residence, and an indicator variable
31

for mothers whose compulsory school entry policies were assigned assuming that she lived in the same state as her first reported state of residence.
32

Table 3: Anti-Test: Second Stage Regression right/left handedness writing throwing brushing
2SLS -0.089 (0.057)
0.194 (0.169)
0.272 (0.176)
N 14354 14344 14330 F(k, N-k) 85, 14268 85, 14258 85, 14244 Fstat 34.74 34.66 34.61
Note: *** Significant at 1% level, *** Significant at 5% level, * Significant at 10% level Control variables included in these models are the same as those described in the note to Table 2. Table 4: Mechanisms mother’s age at
child birth health
insurance child care Mother working
OLS 0.028* (0.016)
0.072*** (0.009)
0.133***(0.012)
0.147*** (0.010)
2SLS 0.825** (0.356)
0.452*** (0.064)
0.315***(0.090)
0.096 (0.154)
N 57829 43281 4750 57829 F(k, N-k) 87, 57741 87, 43193 85, 4664 87, 57741 Fstat 195.40 143.30 19.38 195.40
Note: *** Significant at 1% level, *** Significant at 5% level, * Significant at 10% level Control variables included in these models are the same as those described in the note to Table 2. Table 5: OLS and 2SLS Regressions Only for Children with Measured Values percentiles
wt-for-age ht-for-age BMI-for-age
at risk of overwt overwt
OLS 2.735*** (0.932)
4.999*** (0.997)
0.775 (0.993)
-0.0008 (0.014)
-0.009 (0.009)
2SLS -0.337 (5.429)
9.494* (5.399)
-4.501 (5.763)
-0.091 (0.075)
-0.027 (0.051)
N 22991 21850 20492 20492 20492 F(k, N-k) 85, 22905 85, 21764 85, 20406 85, 20406 85, 20406 Fstat 62.17 59.98 56.29 56.29 56.29
Note: *** Significant at 1% level, *** Significant at 5% level, * Significant at 10% level Control variables included in these models are the same as those described in the note to Table 2.
33

Table 6: 2SLS Regressions with intervening behaviors and interactions lastcheckup ill past year bone fracture past year >=1yr ago ever number Ever
Hs 0.237 (0.215)
0.458*** (0.168)
1.356*** (0.495)
0.108*** (0.035)
require treatment
-0.199*** (0.032)
0.367*** (0.025)
1.891*** (0.270)
0.031*** (0.008)
require treatment*hs
0.018 (0.038)
-0.076***(0.027)
-0.204 (0.304)
-0.023** (0.011)
childcare now
-0.160*** (0.030)
0.054 (0.059)
1.417* (0.760)
-0.009 (0.005)
childcare now*hs
0.050 (0.030)
0.032 (0.065)
-0.834 (0.765)
0.009 (0.007)
childcare ever
0.033 (0.029)
0.075*** (0.019)
0.154** (0.073)
0.011 (0.007)
childcare ever*hs
-0.049 (0.033)
-0.066***(0.020)
-0.157* (0.078)
-0.013* (0.007)
insurance 0.006 (0.101)
0.224*** (0.080)
0.712*** (0.220)
0.052*** (0.018)
Insurance*hs -0.172 (0.166)
-0.283** (0.126)
-0.874** (0.376)
-0.079*** (0.026)
work 0.079 (0.050)
0.082** (0.039)
0.240** (0.174)
0.017* (0.009)
work*hs -0.080 (0.074)
-0.154** (0.062)
-0.512** (0.175)
-0.027** (0.012)
N 36241 36179 36132 29925 F(k, N-k) 96, 36144 96, 36082 96, 36035 96, 29828 Fstat 2987.72 2909.17 2902.26 2499.52
Note: *** Significant at 1% level, *** Significant at 5% level, * Significant at 10% level Control variables included in these models are the same as those described in the note to Table 2.
34

Appendix Table 1: 1st Stage Results from 2SLS Regression using Sample from Regression using Ever Ill in Past Year as Dependent Variable HS or more
Compulsory school entry age 0.005 (0.009)
Permitted school exit age -0.040*** (0.005)
Cutoff month-birth month 0.012* (0.006)
Interaction: entry age*(cutoff month-birth month) -0.002* (0.001)
Difference between June & birth month -0.024*** (0.007)
Interaction: entry age*(June-birth month) 0.004*** (0.001)
Total # of courses for HS graduation -0.001 (0.004)
1st factor from academic courses for HS graduation -0.002 (0.009)
1st factor from elective courses for HS graduation 0.005 (0.012)
No statewide requirement for HS graduation 0.007 (0.009)
Assumed mother lived in the same state as her 1st reported state of residence for school entry policy
-0.075*** (0.009)
Assumed mother lived in the same state as her 1st reported state of residence for school exit policy
-0.258*** (0.015)
N 43154 F(k, N-k) 86, 43067 Fstat 119.65
35

Appendix A1: Algorithms Used to Merge in the Instruments
To estimate the IV model, instruments (compulsory education policies on school entry and school leaving and high school graduation policies) were merged with the mother’s record by mother’s state of residence in the relevant years. The instruments were used in the first stage regression on mother’s own education. Below, we explain how we merged mother’s data with each type of instruments.
1. Compulsory Education Policies: School Entry We assign the minimum age of compulsory entry, to each mother using her state of birth and the year she was required to enter school in her state of birth. Consider mother A who was born in state X in 1960. She became age 4 in 1964, age 5 in 1965, age 6 in 1966, age 7 in 1967, age 8 in 1968, age 9 in 1969, and age 10 in 1970. The minimum age of compulsory entry in state X in 1964 was 5, in 1965 was 6, in 1966 was 6, in 1967 was 6, in 1968 was 6, in 1969 was 6, and in 1970 was 6. Therefore she was required to enter school in 1966. If the same mother A were born in state Y, she will be required to enter school in 1967. 2. Compulsory Education Policies: School Leaving We assign the minimum age of permitted school leaving to each mother using her state of birth and the year she became eligible to drop out from school in her state of birth. Again consider mother A who was born in state X in 1960. She became age 12 in 1972, age 13 in 1973, age 14 in 1974, age 15 in 1975, age 16 in 1976, age 17 in 1977, and age 18 in 1978. The minimum age of permitted school leaving in state X in 1972 was 14, in 1973 was 14, in 1974 was 15, in 1975 was 15, in 1976 was 15, in 1977 was 15, and in 1978 was 15. Therefore she became eligible to drop out from school in 1975. If the same mother A were born in state Y, she will be eligible to drop out from school in 1974. Note that although state Y increased the minimum age of permitted school leaving to age 16 in 1975 when she is still age 15, she does not need to go back to school since she has already reached age 14 when age 14 was the minimum age of permitted school leaving in state Y.
36

State X State Y
year age
min age of comp entry
max age of perm leaving
min age of comp entry
max age of perm leaving
1960 0 5 14 7 14 1961 1 5 14 7 14 1962 2 5 14 7 14 1963 3 5 14 7 14 1964 4 5 14 7 14 1965 5 6 14 7 14 1966 6 6 14 7 14 1967 7 6 14 7 14 1968 8 6 14 8 14 1969 9 6 14 8 14 1970 10 6 14 8 14 1971 11 6 14 8 14 1972 12 6 14 8 14 1973 13 6 14 8 14 1974 14 6 15 8 14 1975 15 6 15 8 16 1976 16 6 15 8 16 1977 17 6 15 8 16 1978 18 6 15 8 16
3. High School Graduation Requirement Policies Four graduation requirement policy variables were used as instruments: total number of courses required for high school graduation, an indicator variable for states that do not set a statewide minimum number of courses for high school graduation (they instead let school districts set the minimum), first factor calculated from factor analysis using the number of academic courses required for high school graduation, and first factor obtained from factor analysis using the number of elective courses required for high school graduation. We assign these instruments to each mother using her state of birth and the year she was age 15.
37