the effect of dropout intervention strategies on the
TRANSCRIPT

THE EFFECT OF DROPOUT INTERVENTION STRATEGIES ON THE GRADUATION
RATE IN SELECTED RURAL SCHOOL DISTRICTS IN NEW YORK STATE
A Doctoral Research Project
Presented to
Assistant Professor Daniel Alemu, Ph. D.
Doctoral Research Committee Chair
Esteves School of Education
The Sage Colleges
In Partial Fulfillment of the
Requirements for the
Degree of Doctor of Education
In Educational Leadership
Stacey A. DeLaney
September 20, 2013

© Copyright by Stacey A. DeLaney, 2013
All Rights Reserved

THE EFFECT OF DROPOUT INTERVENTION STRATEGIES ON THE GRADUATION
RATE IN SELECTED RURAL SCHOOL DISTRICTS IN NEW YORK STATE
We represent to Sage Graduate School that this thesis/dissertation and abstract are the original
work of the author and do not infringe on the copyright or other rights of others.
Stacey A. DeLaney Date of Signature
Dr. Daniel Alemu Date of Signature
Assistant Professor
Dissertation Chair

i
Abstract
Rural school education in the nation comprises about a third of public school enrollment.
In New York State (NYS), rural school education represents about one-third of public school
education. This study provided the opportunity to discern which dropout intervention strategies
may benefit rural schools in NYS so that students can best be helped to stay in school to meet
graduation standards. Students who stay in school provide significant economic and social
benefits to the state and to the nation (Alliance for Excellent Education, 2011; Brimley,
Verstegen, & Garfield, 2012; Deyé, 2011; Dianda, 2008; Rouse, 2005; Rumberger, 2011). To
determine which intervention strategies may be of benefit, a researcher developed survey
instrument was developed based on the 15 effective strategies derived from Schargel (2012).
Schargel’s work sought to determine effective practices of schools to alleviate the dropout crisis
that exist in the nation’s schools. Overall, this study indicated that the select rural school
districts in the study employed dropout intervention strategies optimally. School districts
employed such strategies either within the district or outside the district. There was a key
finding revealed in this study. This study indicated that districts facing diminishing fiscal
resources, while at the same time being challenged to meet tougher new graduation standards
established by NYS, utilized Distance Learning Courses to improve their graduation rates.
Keywords: dropout prevention strategies; rural school communities; rural school education;
graduation rates in New York State

ii
Acknowledgements
This report has been a work in progress for the past thirty years of my educational
journey and is the capstone of what I have long desired to accomplish. This endeavor could not
have been possible without the love and support of many who have played a significant part of
this journey and been an integral part of my life.
I would like to recognize the support and help from those in the Sage Educational
Leadership program, especially Dr. Alemu and Dr. Bradley for all of their feedback, their
guidance, and challenging me with the necessary critical feedback in order to accomplish and
produce a refined research project to be proud of. Also, Dr. Starr for his feedback and
willingness to serve on my dissertation committee.
The Schoharie Central School District and my “work home” for the past ten years, I
sincerely appreciate the entire community support I received as I pursued this endeavor. Carrie
Brooks, your sense of humor which often broke the tension as I persevered through all those re-
writes; Dr. John Styles, for your continuous, invaluable wisdom and feedback. The Schoharie
Jr. / Sr. High School Publications class, I am so proud of you and your advisors Ms. Schaefer and
Mrs. Takacs, for printing and binding my dissertation. To Don Holmes and Kurt Verderber, my
new friends; your “statistical wisdom” has been priceless.
My Uncle, Frank Grasso, who provided me both emotional and financial support to
pursue my dream of going to college and graduate school. My mom, and best friend, Mary Lou
Casso, the wind beneath my wings and who has always provided me with amazing love and
encouragement; she has been an incredible inspiration to me. My “other mother,” my Aunt
Barbara J. Grasso, who has also supported my endeavors with great love. To dad, Anthony J.
Casso, (aka “Pa”) who passed away during this journey, who I know was proud of my work.

iii
My children, Daniel Adams and Roberta Flaherty, for their love and understanding of my
academic pursuits. My husband, David E. DeLaney, you are “the gift” in my life. I could not
have done this without you, your love, your support, and the beautiful space in my heart, my
head, and our home in which you created for me to work in and accomplish my long sought after
dream.
iv
Table of Contents
Abstract ............................................................................................................................................ i
Acknowledgements ......................................................................................................................... ii
List of Tables ................................................................................................................................. ix
Chapter 1: Introduction ...................................................................................................................1
Background ..........................................................................................................................1
Research Problem ................................................................................................................3
Purpose Statement ................................................................................................................4
Research Questions ..............................................................................................................5
Definition of Terms Used for This Study ............................................................................6
Significance of the Study .....................................................................................................8
Limitations of the Study.......................................................................................................8
Organization of the Study ....................................................................................................9
Chapter 2: Literature Review ........................................................................................................10
Reform Efforts ...................................................................................................................12
Leadership ..............................................................................................................15
Leadership for change ............................................................................................19
New York State Regents Reform Agenda .............................................................20
Public School Enrollment Data ..........................................................................................22
New York State enrollment data ............................................................................23
Economic Costs of High School Dropouts ........................................................................23
Economic Benefits of High School Graduation.................................................................24
National High School Graduation Data .............................................................................25

v
New York State graduation data ............................................................................26
Rural School Communities ................................................................................................26
Rural School Education .....................................................................................................27
Rural education in New York State .......................................................................28
The Causes of High School Dropouts ................................................................................30
Addressing the dropout crisis.................................................................................31
Dropout intervention strategies ..............................................................................32
Summary ............................................................................................................................35
Chapter 3: Methods ........................................................................................................................37
Research Design.................................................................................................................38
Sample and Sampling Procedures ......................................................................................38
Instrumentation ..................................................................................................................39
Survey construct.....................................................................................................39
Survey validity and reliability ................................................................................42
Data Collection ..................................................................................................................42
Data Analysis .....................................................................................................................44
Research Bias .....................................................................................................................46
Summary ............................................................................................................................46
Chapter 4: Data Analysis ...............................................................................................................48
Demographics ....................................................................................................................50
Graduation Rates ................................................................................................................52
Research Question One Results .........................................................................................52
Strategies identified by districts .............................................................................53

vi
Level One Basic Core Strategies ...........................................................................53
Level Two Instructional Strategies ........................................................................54
Level Three Alternative Schooling Strategies .......................................................56
Level Four Building-Wide Strategies ....................................................................56
Summary of research question one ........................................................................58
Research Question Two Results ........................................................................................60
Level One Basic Core Strategies Results ...............................................................62
Level Two Instructional Strategies Results ...........................................................64
Level Three Alternative Schooling Strategies Results ..........................................65
Level Four Building-Wide Strategies Results .......................................................67
Summary of research question two ........................................................................69
Research Question Three Results .........................................................................................72
Research question 3a: Building enrollment ...........................................................73
Research question 3b: Administrative experience .................................................75
Research question 3c: Type of schedule ................................................................77
Research question 3d: Building configuration .......................................................79
Research question 3e: Type of rural school ...........................................................81
Summary of research questions 3a-3e ...................................................................83
Building enrollment ...................................................................................84
Administrative experience .........................................................................84
Type of schedule ........................................................................................86
Building configuration ...............................................................................86
Type of rural school ..................................................................................87

vii
Research question three conclusion .......................................................................87
Chapter 5: Summary of Findings, Conclusions, and Recommendations .......................................89
Summary of Findings .........................................................................................................90
Finding one ............................................................................................................90
Level One Basic Core Strategies: Results .................................................91
Level Two Instructional Strategies: Results ..............................................91
Level Three Alternative Schooling Strategies: Results .............................92
Level Four Building-Wide Strategies: Results ..........................................92
Finding two ............................................................................................................93
Finding three ..........................................................................................................95
Building enrollment ...................................................................................96
Administrative experience .........................................................................96
Type of schedule ........................................................................................96
Building configuration ...............................................................................97
Type of rural school ...................................................................................97
Conclusions ........................................................................................................................98
Conclusion one.......................................................................................................98
Conclusion two ......................................................................................................99
Conclusion three ..................................................................................................100
Conclusion four ....................................................................................................101
Conclusion five ....................................................................................................101
Conclusion six ......................................................................................................102
Recommendations ............................................................................................................103
viii
Recommendation one...........................................................................................103
Recommendation two ..........................................................................................103
Recommendation three ........................................................................................103
Recommendation four ..........................................................................................103
Recommendations for Future Research ...........................................................................104
Future research recommendation one ..................................................................104
Future research recommendation two ..................................................................104
Future research recommendation three ................................................................104
Future research recommendation four .................................................................104
Future research recommendation five ..................................................................105
Future research recommendation six ...................................................................105
Closing Statement ............................................................................................................105
References ....................................................................................................................................107
Appendix A: Permission to use Schargel’s Strategies .................................................................117
Appendix B: Survey Instrument ..................................................................................................118
Appendix C: Initial Superintendent Letter ...................................................................................121
Appendix D: Follow up Superintendent Letter ............................................................................122
Appendix E: Second Follow up Superintendent Letter ...............................................................123
Appendix F: Chi Square Table Graduation Rate, Intervention Strategy, and Demographic
Feature..............................................................................................................................124
Appendix G: Chi Square Significance of Intervention Strategies Paired with Graduation Rates
and Demographic Features (When not divided into categories) ......................................128
Appendix H: SPSS Reliability Test Data.....................................................................................130

ix
List of Tables
Table 1: New York State June 2007 District Cohort Membership and Graduation Rates ..............3
Table 2: Leadership Dimensions Aligned with Leadership Attributes ..........................................18
Table 3: The Projected Economic Benefits of Students Earning a High School Diploma
for the United States and for New York State: Per Year ...................................................25
Table 4: Demographic Features of Participating Districts .............................................................51
Table 5: Level One Basic Core Strategies – Responses and Percentages of Strategies
Employed and Not Employed ............................................................................................54
Table 6: Level Two Instructional Strategies – Responses and Percentages of Strategies
Employed and Not Employed ............................................................................................55
Table 7: Level Three Alternative Schooling Strategies – Responses and Percentages
of Strategies Employed and Not Employed ......................................................................57
Table 8: Level Four Building-Wide Strategies – Responses and Percentages of Strategies
Employed and Not Employed ............................................................................................58
Table 9: Level One Basic Core Strategies – Chi Square Results for Strategies Employed
and Not Employed ............................................................................................................63
Table 10: Level Two Instructional Strategies – Chi Square Results for Strategies Employed
and Not Employed ............................................................................................................66
Table 11: Level Three Alternative Schooling Strategies – Chi Square Results for Strategies
Employed and Not Employed ............................................................................................68
Table 12: Level Four Building-Wide Strategies – Chi Square Results for Strategies
Employed and Not Employed ............................................................................................70

x
Table 13: Significant Chi Square Results Based on Graduation Rate, Intervention Strategy, and
Demographic Feature .........................................................................................................85

1
Chapter 1: Introduction
Background
National, state, and local graduation rates of urban, suburban, and rural schools are of
great concern to policymakers in states and schools (Princiotta & Reyna, 2009). Across the
nation, students are dropping out of high school by the thousands on a daily basis (Alliance for
Excellent Education, 2010, p. 1). This phenomenon is cause for great concern and is referred to
as a “dropout crisis” (Deyé, 2011, p. 1). Policymakers at the federal, state, and local levels are
facing daunting challenges of cutting programs as a result of significant budgetary constraints
while, at the same time, steadfastly addressing the dropout issue that persists. According to the
Alliance for Excellent Education (2010), it is estimated that about 7,000 students drop out of
school every day.
Students that drop out of high school will most likely not make it to a post secondary
school and will be limited in their ability to be self-sufficient. Students who are unsuccessful in
school are an economic cost to society (Alliance for Excellent Education, 2011c; Deyé, 2011;
Dianda, 2008; Rouse, 2005; Rumberger, 2011). This population of high school dropouts most
likely will struggle to be self-sufficient individuals and will more likely depend on public entities
for housing, food, and medical care. Education is a critical element of our society, producing
citizens who can contribute positively. These students deserve immediate attention and
intervention to alleviate the dropout epidemic (Deyé, 2011).
The nation’s public education system is defined by Brimley et al. as “the most important
producer of human capital in the United States” (2012, p. 1). Brimley et al. (2012) further
describe this human capital as being essential to the “creation of wealth” (p. 2). Education,
therefore, is an essential facet of our society that provides the impetus to increase the wealth of

2
our society by producing high school graduates. Brimley et al. indicate that “Education is the key
to improving the quality of life for individuals, for improving the climate of economic
development, and for maintaining and improving this nation’s democracy and economic
competitiveness” (2012, p. 42). Thus, students need to be provided with the necessary tools to
complete high school and to prepare them for college and career ready skills as indicated by
Commissioner King in his press release statement in June 2012 (NYSED, Office of
Communications [OC], 2012).
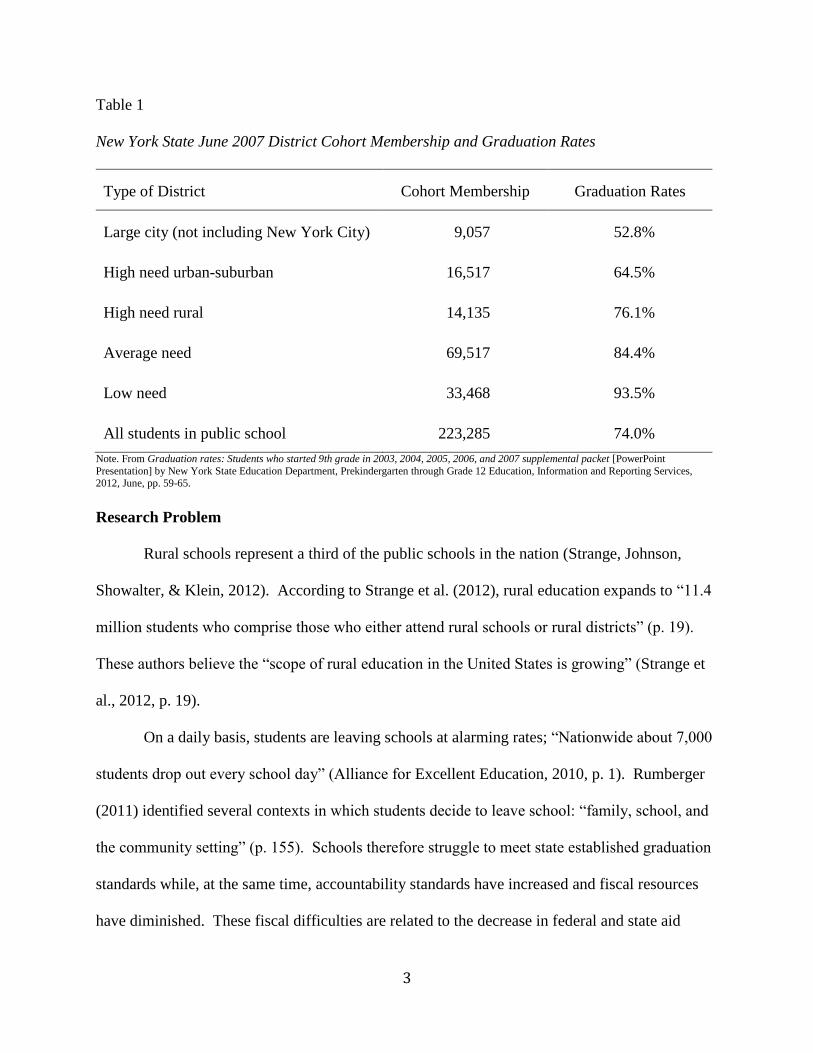
Graduation rates of NYS schools, especially in rural school districts, are lower than the
state established rate of 80%. NYS graduation rates, as reported by NYSED, indicate a total
public school graduation rate for the June 2007 cohort of 74% (NYSED P12 IRS, 2012c). This
cohort was comprised of a total of 223,285 students. High need urban-suburban school districts
in NYS indicated a graduation rate of 64.5%. Rural schools in NYS, indicated a 76.1%
graduation rate. The 2007 cohort in rural schools in NYS was comprised of 14,135 students (see
Table 1).
Students who leave high school and the dropout prevention measures that influence
graduation rates were the focus of attention in this study. “The National event dropout rate (the
percent of 9th-12th graders who dropped out during 2008-2009) is 4.11% and 4.2% for New
York State” (Snyder & Dillow, 2012, p. 180). The National “status dropout rate (i.e. the
percentage of individuals who are not enrolled in high school and have not earned a high school
credential such as a diploma or equivalency credential) for rural is 11%” (Provasnik et al., 2007,
p. 58). Princiotta and Reyna (2009) also reported that there was not one state that had a
graduation rate higher than 88%. Some states are reported to have a graduation rate as low as
66%.
3
Table 1
New York State June 2007 District Cohort Membership and Graduation Rates
Type of District Cohort Membership Graduation Rates
Large city (not including New York City) 9,057 52.8%
High need urban-suburban 16,517 64.5%
High need rural 14,135 76.1%
Average need 69,517 84.4%
Low need 33,468 93.5%
All students in public school 223,285 74.0%
Note. From Graduation rates: Students who started 9th grade in 2003, 2004, 2005, 2006, and 2007 supplemental packet [PowerPoint
Presentation] by New York State Education Department, Prekindergarten through Grade 12 Education, Information and Reporting Services, 2012, June, pp. 59-65.
Research Problem
Rural schools represent a third of the public schools in the nation (Strange, Johnson,
Showalter, & Klein, 2012). According to Strange et al. (2012), rural education expands to “11.4
million students who comprise those who either attend rural schools or rural districts” (p. 19).
These authors believe the “scope of rural education in the United States is growing” (Strange et
al., 2012, p. 19).
On a daily basis, students are leaving schools at alarming rates; “Nationwide about 7,000
students drop out every school day” (Alliance for Excellent Education, 2010, p. 1). Rumberger
(2011) identified several contexts in which students decide to leave school: “family, school, and
the community setting” (p. 155). Schools therefore struggle to meet state established graduation
standards while, at the same time, accountability standards have increased and fiscal resources
have diminished. These fiscal difficulties are related to the decrease in federal and state aid
4
given to schools in the last several years while, at the same time, accountability standards have
increased. Due to the role these rural schools play in educating a large population, singling out
these districts for research on dropout prevention is important.
Districts in NYS have further been challenged by a cap on the tax levy limit that they are
allowed to impose on local taxpayers to support rural school districts (NYSED P12, Office of
School Operations [SO], Educational Management Services [EMS], 2012). These schools are
held to the same accountability standards as those that have more financial means available to
them. Exploring rural school district practices to achieve graduation rates serves as a benefit to
such schools faced with the challenge of meeting the state’s graduation rate of 80%.
The intention of this study was to determine which strategies may benefit rural schools so
that students can best be helped to stay in school to meet graduation standards. Students who
stay in school provide significant economic and social benefits to the state and to the nation
(Alliance for Excellent Education, 2011c; Brimley, Verstegen, & Garfield, 2012; Deyé, 2011;
Dianda, 2008; Rouse, 2005; Rumberger, 2011).
Purpose Statement
The purpose of this quantitative study was to determine if graduation rates were
influenced by the availability of dropout prevention intervention strategies employed in selected
rural school districts in New York State (NYS). Rural school districts in central NYS were of
particular concern and the focus of this study, based on the 76.1% of students who graduated in
the 2007 Cohort as reported by the New York State Education Department (NYSED)
(Prekindergarten through Grade 12 Education [P12], Information and Reporting Services [IRS],
2012c). The state standard graduation rate for the 2005 Cohort in the 2010-2011 school year was
80% (New York State Education Department [NYSED], P12 IRS, 2011a). This graduation rate

5
was a change from the 2004 Cohort in the 2009-2010 school year, which was 55% as reported in
the NYS Report Cards (NYSED P12 IRS, 2009). Rural schools face graduation rates that are
below the established state standard of 80%, and at the same time, face the dilemma of
diminishing resources allocate to these districts by the federal and state governments.
There were 299 rural school districts identified in NYS at the time of this study. There
were 245 rural districts belonging to the Rural School Association (RSA) of NYS who were
invited to participate (Rural Schools Association of New York State [RSA of NYS], 2012). A
survey was sent out to a total of 311 middle and high school principals belonging to RSA of
NYS.
Research Questions
This study was guided by three basic research questions. These questions are directly
related to strategies or interventions school districts employ to improve, meet, or exceed NYS
graduation rates. The questions were:
1. What intervention strategies are school districts using to improve graduation rates of
all students?
2. Is there a relationship between dropout prevention strategies and graduation rates?
3. Is there any association between graduation rates and the choice of specific
intervention strategies and the following demographic features:
a. Size of the school;
b. Experience of the administrator/principal;
c. Type of school schedule (i.e. traditional, block, modified block, semestered);
d. Building configuration;
e. Type of rural school district.

6
Definitions of Terms Used for This Study
Dropout in NYS.
A dropout is any student, regardless of age, who left school prior to graduation for any
reason except death or leaving the country and has not been documented to have entered
another program leading to a high school diploma or an approved program leading to a
high school equivalency diploma. (NYSED P12 IRS, 2011b, p. 3)
Graduation rates. “The percentage of students who graduate within, four, five, or six years of
entering high school” (Dynarski et al., 2008, p. 14).
Dropout rates. “The percentages of students who leave school without graduating after four
years, five, or six years since entering high school” (Dynarski et al., 2008, p. 14).
Comprehensive approaches to school reform.
The most common approach is to reform existing schools by developing a comprehensive
set of practices and programs locally or adopting an externally developed comprehensive
school reform (CSR) model. A second approach is to create new schools, by establishing
a new school locally or adopting an externally developed whole school model. . . . The
third approach, which can be combined with the other two is to create collaborative
relationships between schools and outside government agencies and local community
organizations to provide services and programs for students and their families.
(Rumberger, 2011, p. 12)
System approaches to school reform. “Making changes to the entire educational system under
the assumption that such changes can transform how all schools function in the system.
System reform can occur at the federal, state, or local level of government” (Rumberger,
2011, p. 214).
7
Dropout prevention strategies. Schargel (2012) identified 15 effective dropout prevention
strategies that are field tested, researched-based, data driven practices. These strategies
include:
Early interventions: family engagement, early childhood education, early literacy
development;
Basic core strategies: mentoring and tutoring, service learning, alternative schooling,
after-school opportunities;
Instruction: professional development, educational technology, active learning,
individualized instruction, career and technical education (CTE);
School-community: systematic renewal, school-community collaboration, safe
learning environment. (Schargel, 2012, p. xxiii-xxiv)
Rural school Definitions.
Fringe: a rural territory that is less than or equal to 5 miles from an urbanized area, as
well as rural territory that is less than or equal to 2.5 miles from an urban cluster;
Distant: a rural territory that is more than 5 miles but less than or equal to 25 miles
from an urbanized area, as well as rural territory that is more than 2.5 miles but less
than or equal to 10 miles from an urban cluster;
Remote: a rural territory that is more than 25 miles from an urbanized area and is also
more than 10 miles from an urban cluster. (New York State Center for Rural Schools
[NYSCRS], 2012, About rural schools section)

8
Significance of the Study
The information collected from this study was intended to inform policymakers, school
district leaders, and district community members in determining necessary funding for identified
programs that may be viable in rural districts for the effort of improving their graduation rates.
This study may provide school district leaders with information on effective dropout
prevention strategies that may influence graduation rates. This information is especially
important to district leaders who are faced with challenging fiscal circumstances. This study
may be relevant to policymakers of rural schools that may be struggling to meet the graduation
requirements mandated by NYS during a time of diminishing financial resources from federal,
state, and local governments during difficult economic times as described by Brimley et al.
(2012).
Limitations of the Study
There are several limitations to be discussed regarding the limitations to the study. The
first limitation had to do with the selective nature of this study. Only select rural school districts
in NYS were invited to participate in the study. Opening up the study to all rural school districts
in the state may have been more advantageous in order to obtain responses from all rural school
districts.
Another limitation of this study was the fact that elementary administrators were not
specifically included in the study. Inviting this level of administrators would have provided
them the opportunity to contribute data based on potential intervention strategies used at the
elementary level.
The response rate of the surveys was also another limitation in the study. There were 245
school districts eligible to participate, with 311 possible responders to the survey. There were

9
108 responses derived from the survey of the 311 possible responders. It would have been more
desirable to elicit a higher rate of responses and a wider scope of individuals. Whereas this was
acceptable data in which to conduct analyses on, the number of responses was considered low by
this researcher.
Another limitation of this study included the use of data targeting the 2007 cohort.
Examining data from other cohorts may have provided a more expansive data set for analysis.
Organization of the Study
This study consists of five distinct chapters. Chapter 1 is the background and overview
of the study, as well as the purpose and significance of the study. Chapter 1 also includes
definitions and relevant terms involved in the study, along with the research questions and the
organization of the study. Chapter 2 presents a review of the literature on dropout prevention
strategies and systematic reform efforts as it relates to the dropout problem at the national, state,
and local levels. Chapter 3 includes the methods of the study, which also includes the specific
research design, sample and sampling procedures, instrumentation used, survey instrument
validity, data collection, data analysis, and research bias. Chapter 4 includes a presentation and
discussion of the results of the data collected from the research study, specifically as they relate
to the three research questions of the study. Chapter 5 includes a summary of the findings of the
study along with the conclusions and recommendations.

10
Chapter 2: Literature Review
The nation’s schools are in the midst of a serious dropout problem. According to the
Alliance for Excellent Education (2010), approximately 1.3 million students drop out of school
each year. Based on a 185 day school year, this means approximately 7,000 students drop out of
school on a daily basis.
The dropout problem is not new and has long been a concern for our nation. In 1983, the
nation was first identified as A nation at risk by the National Commission on Excellence in
Education (NCEE) (U.S. Department of Education [USDOE] NCEE, 1983). This report
indicated the need for large-scale reform in order to remediate the concern for education and to
transform America’s schools (USDOE, 1983). NCEE was directed to “define problems which
must be faced and overcome if we are successfully to pursue the course of excellence in
education” (USDOE NCEE, 2012, p. 7).
The nation’s schools continue to struggle with the problem with students dropping out of
high school after efforts to reform schools since 1983. In A nation accountable: Twenty-five
years after a nation at risk, the United States (US) was identified as being at even greater risk of
students dropping out of school because of the lack of school improvement efforts (USDOE,
2008). Princiotta and Reyna (2009) also corroborate the findings of the nation at risk reports,
underscoring the lack of school improvement efforts and the nationwide dropout problem.
Based on the evidence from these two national reports, one could argue that schools may
have attempted large-scale reform efforts but that these efforts have failed as a result of the
inability to successfully identify and address the root cause of the dropout problem in the
nation’s schools. In the USDOE follow up report A Nation Accountable, it was noted “Twenty
five years later, these warning signs remain relevant and poignant” (USDOE, 2008, p. 2). To

11
reiterate this concern, the report indicated “20 students who were born in 1983 started school in
1988, only 14 would have graduated on time, and only five would have earned a college degree
by 2007” (USDOE, 2008, p. 2).
According to Ammerman (1998), it is important to distinguish between the primary root
cause and the contributing causes in order to develop the necessary corrective actions to prevent
them from reoccurring (p. 64). Ammerman believes “that without thorough investigation of the
problematic situation, you may initiate corrective action that does not eliminate or alleviate the
problem and wastes valuable resources” (1998, p. 64).
A great deal of research has been conducted leading to the development and
implementation of several dropout prevention strategies to alleviate the drop out problem.
Despite attempts at reform efforts, schools across the nation continue to struggle to help students
successfully meet state mandated graduation standards which have been indicated in the
literature (Deyé, 2011; Princiotta & Reyna, 2009; Strange et al., 2012).
The social and economic costs of the nation’s dropouts are concerning. Students who
drop out of school have a detrimental effect on themselves and society (Alliance for Excellent
Education, 2011b; Dianda, 2008; Rouse, 2005; Rumberger, 2011). These effects include
limitations on the individual’s earning capacity and access to adequate housing and health care.
These individuals are often dependent on assistance from the government to sustain them and,
therefore, are not contributing economically to society.
Of particular interest is NYS, which has not been immune from the dropout issue. The
percentage of graduates last reported in NYS is 74% (NYSED OC, 2012). There are 299 rural
schools in NYS; this represents 42% of the state’s schools (NYSCRS, 2012).

12
Reform Efforts
Since the dropout problem has been identified, this problem has remained a focus for
system leaders. This effort towards systematic reform has not always achieved the desired
results. Reform efforts, therefore, need to include the identification of the exact cause of the
dropout problem within the nation’s schools. Smink (2004) stated, “Systematic renewal focuses
on discovering the root causes, directing efforts to remove them, and preventing their
recurrence” (p. 25). In other words if students are dropping out, then the reason why they are
doing so needs to be clearly defined and addressed. Harris (2010) indicated that “reforms fail
not because they are ill conceived or under-resourced but because the wrong model of change is
being deployed” (p. 198).
In August 2002, the USDOE articulated 11 components of a CSR model that were tied to
school funding (Office of Elementary and Secondary Education [OESE], Comprehensive School
Reform Program Office [CSRP], 2002). This reform model was designed to help schools
improve their performance. These components, although tied to school funding, represent
reform efforts that would be beneficial to any school system attempting to improve student
academic achievement and graduation rates (Rumberger, 2011). These 11 identified components
include outside expert assistance in the following areas: effective instructional practices based on
scientific research; an aligned curriculum and assessment program and practices; appropriate
professional development and continued support to accomplish reform efforts; a well designed
plan of implementation; and an evaluation of the achievement efforts to determine the success of
these reform.
The USDOE also indicated that a comprehensive school reform model is “built on the
premise that schools can improve when they provide a unified, coherent approach to reform, and

13
when they implement practices and programs that are grounded in scientifically based research”
(USDOE OESE CSRP, 2002, p. 12). The researchers stressed the importance of utilizing their
model for two reasons. This comprehensive school model is considered to be valuable because it
was believed that such reform would bring about the desired outcome, and because funding
available under the CSR program mandated these practices.
The elements of a CSR model, as identified previously, play an integral part in school
improvement efforts. Marzano, Waters, and McNulty (2005) reiterate the value of a CSR model
and indicate that these factors lead to reform by including: “high quality professional
development, provides for meaningful involvement of parents and community, and employs
proven methods for student learning, teaching, and school management” (p. 77).
Rumberger (2011) indicated that there have been many attempts to address the dropout
issue. These have included large scale reform that defines specific effective strategies and
programs. Rumberger (2011) believes that, in addition to these efforts at the national, state, and
local levels, the current interventions are just not sufficient. He contends there are five
recommendations that are critical to this effort: redefining high school success; changing
accountability systems to provide incentives to educate all students; building capacity of the
educational system; desegregating schools; and strengthening families and communities
(Rumberger, 2011).
Princiotta and Reyna (2009) made another attempt towards identifying strategies to
remedy the dropout concern. Their guide focused on designing actions for low performing
schools facing severe fiscal challenges. These new efforts included the following: “promote high
school graduation for all; target youth at risk of dropping out; reengage youth who have dropped

14
out of school; and provide rigorous, relevant, options for earning a high school diploma”
(Princiotta & Reyna, 2009, p. 17).
School reform efforts, at the local level, must be focused on specific elements according
to Dianda (2008) and Dynarski et al. (2008). These elements include the following: “examining
longitudinal data; identification of at risk students; monitoring students’ academic and social
performance; monitoring student sense of social engagement and belonging in school; collecting
accurate information about dropout rates” (Dianda, 2008, pp. 90-91).
There are benefits to providing successful interventions. Christenson and Thurlow
(2004) indicated that successful interventions do more than increase student attendance; they
help students and families who feel marginalized in their relations with teachers and peers to
become better academically connected to the school. Families and communities have been
identified as playing a vital role in student success.
School reform is indicative of change. In order to bring about such change efforts,
successful preparedness and effective leadership capacities of school leaders are indicated in the
literature (Bridges, 2009; Fullan, 2008; Kotter & Cohen, 2002; Marzano et al., 2005; Marzano &
Waters, 2009). Change happens, and leaders need to anticipate change, monitor change, adapt to
change quickly, change, enjoy the change, and be ready to change quickly (Johnson, 2002).
Systemic change in school reform efforts must take place utilizing a definitive change process.
Just “the change knowledge itself does not assure success” (Harris, 2010, p. 198). Leaders are
responsible for making these substantive changes in the nation’s schools using deliberate
processes. When change is necessary, the research indicated that “institutions have the sufficient
capacity to implement and sustain school reform” (Rumberger, 2011, p. 273). Marzano et al.
(2005) state the “message for leaders is that in order to have a positive impact on student

15
achievement they need only to focus and understand the magnitude of change implied in the
change efforts” (pp. 6-7). Marzano et al. (2005) further state, “the right focus of change is the
key to improving schools and increasing student achievement” (p. 5). The urgency to change has
long been justified since the issuance of the April 1983 report identifying explicitly the
“Imperative for Educational Reform” (USDOE NCEE, 1983, p. 1).
Leadership. Leadership plays an integral role in school reform efforts, especially in
dropout prevention efforts. In order for a leader to bring about change, a leader must possess
specific leadership capacities in which to do so. These leadership capacities include the abilities
to identify root causes of systemic problems, to work collaboratively, and to be proficient in
navigating the complexities of a school environment. There are identified models for leaders in
which to bring about change and to engage in continuous improvement efforts.
Bambrick-Santoyo and Peiser (2012) discuss how to create an effective school utilizing
the principles of seven identified levers of leadership. The levers are delineated into two
categories. The first, Instructional Levers, include data-driven instruction, observation and
feedback, instructional planning, and professional development. The second, Cultural Levers,
include student culture, staff culture, and managing school leadership teams.
Marzano and Waters (2009) indicate their leadership behaviors focus on the alignment of
goal setting within a district. Other leadership behaviors in the literature are identified by
Murphy, Elliott, Goldring, and Porter (2007). Murphy, Elliott, Goldring, and Porter (2007)
present eight principles of leadership for improvement efforts. These eight principles include a
vision for learning, the instructional program, curricular program, assessment program,
communities of learning, resource acquisition and use, organizational culture, and social
advocacy (p. 182).

16
Silky and Merrins (2007), note “on a daily basis a leader must navigate a very complex
environment that consists of the district, the community, and the personal environment” (pp. 4-
5). In addition to the environment, it is also incumbent upon a leader to have the ability to
understand and operate successfully in four essential areas. These four domains of leadership
consist of strategic, organizational, political and instructional environments (Silky & Merrins,
2007). These entities are intertwined and do not function in isolation. According to Bennis
(2003) the “first step in becoming a leader is to recognize the context” (p. 19), as this leadership
capacity plays an integral role in a leader’s success.
The research indicated that leaders must not only respond to elements in the present
environment, but they must also have the ability to anticipate the future (Scharmer, 2009). The
leaders’ capacity to respond this way in an organization will seek to meet the needs of the
community and remain viable in an ever changing world (Bennis, 2003). Leadership
responsibilities including the willingness and the ability to embrace and work with constituents
without bias are also critical (Gao & Mager, 2011). This notion of unbiased leadership
exemplifies the need for leaders to be keen observers of the context in order to make informed
decisions (Bennis 2003). Bennis indicated that if leaders are not cognizant of this context, it
might ultimately lead to their demise.
Bennis (2003) refers to the importance of leadership values in his work. Bennis (2003)
indicates a leader must possess four essential competencies: to engage others by creating shared
meaning, to have a distinctive voice, integrity, and an adaptive capacity. Systemic leadership
change processes allow for viable decision making to take into account the organization and its
constituents. A leader must be cognizant of the culture of the organization and the people for
17
whom they serve so as not to alienate anyone from this change process; thus, the district leader
has a vital role as the system leader (Carver, 1990).
Murphy et al. (2007) conducted research on leadership models that bring about school
improvement efforts. Their leadership model is referred to as the “Learning Centered Leadership
Framework” (Murphy et al., 2007, p. 180). In this framework, the authors indicate the “left side
of the framework consists of leadership behaviors: experience, knowledge, personal
characteristics, and values and belief; while the right side of the model influences the student
outcomes: school, classroom, leadership behaviors, and student success” (Murphy et al., 2007,
pp. 180-181).
Murphy et al. (2007) additionally derive from their research eight dimensions that
characterize successful leadership practices. These dimensions include “a vision for learning, the
instructional program, the curricular program, the assessment program, communities of learning,
resource acquisition and use, organizational culture, and social advocacy” (Murphy et al., 2007,
p. 182). These leadership dimensions are aligned with leadership attributes identified in the
literature (see Table 2). These leadership attributes and dimensions exemplify the necessary
skills a leader must employ to bring about school reform efforts as previously described
previously.
Marzano and Waters (2009) found, “after examining research that there is a strong
correlation between district leadership and student achievement” (p. 4). In conducting their
research, Marzano and Waters (2009) were able to identify five leadership responsibilities
directly related to student achievement:
1. Ensure collaborative goal setting.
2. Establish nonnegotiable goals for achievement and instruction.

18
3. Create board alignment with and support of district goals.
4. Monitor achievement and instructional goals.
5. Allocate resources to support the goals for achievement and instruction. (p. 6)
Table 2
Leadership Dimensions Aligned with Leadership Attributes
Leadership Dimensions
Leadership Attributes
Vision: Developing, articulating,
implementing, and stewarding
Establishment of a vision, and adherence to it, establishing
attainable goals, modeling, communication, building
capacity to learn.
Instructional Program: Knowledge and
involvement, hiring and allocating
staff, supporting staff, and
instructional time
Leader involvement, monitoring, alignment, feedback, data.
These leadership efforts are synonymous to progress in
student achievement and improvement.
Curriculum Program: Knowledge and
involvement, expectation and
standards, opportunity to learn, and
curriculum alignment
Alignment with instruction and assessment, curriculum,
must be rigorous and relevant.
Assessment Program: Knowledge and
involvement, assessment procedures,
monitoring Curriculum and
instruction, and communication and
use of data
Alignment with instruction and curriculum, focus on student
improvement, these elements are carefully selected and
crafted.
Communities of Learning: Professional
development, communities of
professional practice, and
community anchored schools
Theories and models of best practices used. Leadership,
empowerment, culture of values, shared decision
making, governance, professional development, high
expectations, shared beliefs, continuous improvement,
focused on results.
Resource Acquisition and Use:
Acquiring resources, allocating
resources, and using resources
Recruitment and retention of high quality teachers,
professional development used towards strengthening
student performance. District emphasis on fiscal
responsibility and accountability.
Organizational Culture: Production
emphasis, learning environment,
personalized environment, and
continuous improvement
Attention to all stakeholders in the organization. Upkeep of
the physical plant. A culture of learning and continuous
improvement is emphasized for all stakeholders.
Social Advocacy: Stakeholder
engagement, diversity,
environmental context, and ethics
System leadership capacities such as leading with integrity,
communication, respect for diversity. Forging
partnerships with the school and community at large.
Note. Adapted from “Leadership for learning: A research-based model and taxonomy of behaviors” by J. Murphy, S. N. Elliott, E. Goldring, and
A. C. Porter, 2007, School Leadership & Management, 27(2), 179-201.
19
These five leadership behaviors of Marzano and Waters align with the identified 11
components of a CSR model identified by USDOE OESE CSRP (2002). Marzano and Waters
(2009), like the USDOE, discovered an essential factor of system leadership. They found that
there was a strong correlation between system leadership and student achievement. Marzano and
Waters stated “Specifically, this finding implies that the longevity of the superintendent has a
positive effect on the average academic achievement of students in the district” (2009, p. 9).
Leadership for change. The USDOE (2008) report suggests that continued efforts
towards school improvement need to be sought as the nation’s schools continue to struggle with
the successful and sustainable change first indicated in its original report in 1983. The research
indicated that, indeed, the responsibility for such change rests with system leaders, which can be
accomplished by initiating change efforts (Bambrick- Santoyo & Peiser, 2012; Bennis, 2003;
Fullan, 2008; Kotter & Cohen, 2002; Marzano et al. 2005). The Alliance for Excellent
Education (2011a) also supports the role of leadership. The Alliance states that “In order to
fundamentally transform education, attention must be given to articulating explicitly the nature
of leadership and teaching needed to create the conditions for powerful learning environments”
(Alliance for Excellent Education, 2011a, p. 17).
According to Fullan, Cuttress, and Kilcher (2005), change efforts have not been
successful because implementing change takes a great deal of time, effort, and knowledge.
Fullan et al. (2005) identified eight forces for leaders of change. These eight forces consist of:
“engaging people’s moral purposes, building capacity, understanding the change process,
developing cultures for learning, developing cultures of evaluation, focus on leadership for
change fostering coherence making, and cultivating tri-level development” (Fullan et al., 2005,
p. 54). Fullan et al. state:

20
A missing ingredient in most failed cases is appreciation and use of what we call change
knowledge: understanding and insight about the process of change and the key drivers
that make for successful change in practice. The presence of change knowledge does not
guarantee success, but its absence ensures failure. (2005, p. 54)
There are many change models are available to system leaders. Fullan (2008) identified
six change efforts in his model. These six change efforts include love your employees, connect
peers with a purpose, capacity building prevails, learning is the work, transparency rules, and
systems learn (pp. 11-14). Kotter and Cohen (2002) also identified a change model that system
leaders can utilize. This change model involves eight identified stages. “Increase urgency, build a
guiding team, get the vision right, communicate for buy-in, empower action, create short-term
wins, don’t let up and make change stick” (p. 7).
Bridges (2009) identified how to manage difficult transitions during change that includes
three stages. These stages are comprised of “letting go of the old ways and the old identity
people had, going through an in-between time when the old is gone but the new isn’t fully
operational referred to as the neutral zone, and coming out of the transition and making a new
beginning” (pp. 4-5).
With a variety of models available to leaders, along with methods of implementation, the
burden is on leaders to bring about the necessary changes so that students will be successful and
college and career ready for the 21st century.
NYS Regents Reform Agenda. The Regents Reform Agenda includes the following
facets of intervention, as stated by the NYSED (P12, Race to the Top [RTTT], Network Team
Institute [NTI], n.d.).
The implementation of common core standards.
21
Developing curriculum and assessments aligned to those standards to prepare students
for success in college and the workplace.
Building instructional data systems that measure student success and inform teachers
and principals how they can improve their practice in real time.
Recruiting, developing, retaining, and rewarding effective teachers and principals.
Turning around the lowest achieving schools.
The reform efforts instituted included the focus of high school completion. In June 2012,
the graduation rate for the 2007 cohort was 74%, and 8.7% dropped out of school that year
(NYSED P12 IRS, 2012c). The NYSED Commissioner made the argument, in a 2012 press
release, that one of the keys to student success is keeping students engaged (NYSED OC, 2012).
Commissioner King further indicated that engaging students and keeping them in school is
essential in addressing the economic and societal burden of students who drop out of school in
NYS.
Commissioner King referred to engagement as providing students with educational
opportunities in “advanced math and science courses, career and technical educational programs,
or a focus on humanities” (NYSED OC, 2012, p. 1). At the same time, fiscal resources allocated
for schools to maintain standards and meet mandates has changed dramatically in the reduction
of these resources. One of the ways in which this change has occurred has been the
implementation of the tax levy limit imposed on NYS school districts by the legislature in 2011.
Additionally, reduction in state aid has changed how school districts operate fiscally (NYSED
P12 SO EMS, 2012).
Since the inception of the recent Regents Reform Agenda and the Race to the Top Grant
application, college and career readiness standards have been implemented by NYSED to

22
address the preparedness of students for college and career readiness, as well as those efforts to
improve graduation rates (NYSED P12 RTTT NTI, n.d.). The new rigorous standards within the
Regents Reform efforts and change in resource allocations are two elements that are critical to
this study. It is essential that school districts are prudent with both programmatic resources as
well as their fiscal resources to ensure schools meet the newly established graduation standards.
Public School Enrollment Data
Millions of students attend school every day across our nation, and the literature indicated
students who complete school are an economic benefit to society (Alliance for Excellent
Education, 2011c; Brimley et al., 2012; Deyé, 2011; Dianda, 2008; Rouse, 2005; Rumberger,
2011). When one student drops out of school, this is both an individual loss, as well as a societal
loss, on both personal and economic levels (Rouse, 2005; Rumberger, 2011).
Snyder and Dillow (2012) report that there are 98,817 public schools that comprise our
nation’s public school system. Thirty four million four hundred thousand students are enrolled
in public institutions in the US. Snyder and Dillow (2012) report that the “average freshman
graduation rates for public secondary schools through 2008-2009 is 75.5%” (p. 179).
High school graduates, according to Snyder and Dillow (2012), are those students who
earn their high school diploma in four years. This does not include students who have earned a
General Educational Development (GED) credential.
Nationally, according to Snyder and Dillow (2012), dropouts are considered students
between the ages of 16-24 years old who left school and did not earn their high school diploma.
The term used to define the group of students who left school and did not earn a high school
diploma is referred to as the status dropout rate. Snyder and Dillow (2012) report a national
“dropout rate of 4.1%” (p. 180).

23
New York State enrollment data. NYS has been actively engaged in educational
reform. There have been many changes, such as the adoption and implementation of new
common core learning standards and the new annual professional performance review of
teachers and principals, sought by the NYS Board of Regents and Commissioner King to
improve NY’s graduation rates in urban, suburban, and rural districts. NYS school graduation
rates are ranked tenth (from the top) in the nation, according to Commissioner King (NYSED
OC, 2012).
The NYS Report card accountability and overview report for 2010-2011 indicated a total
of 2,689,969 students attended public or charter schools from kindergarten through 12th grade in
697 school districts throughout the state (NYSED P12 IRS, 2012a).
Economic Costs of High School Dropouts
The literature indicates that students who drop out of high school and who do not earn a
high school diploma impact the individual, society, and the economy (Alliance for Excellent
Education, 2011b; Dianda, 2008; Rouse, 2005; Rumberger, 2011). These impacts include those
on a personal level, as well as those on a societal level; literacy, employment, healthcare, crime,
economics, and standard of living are such examples.
One of the significant impacts of dropping out of school identified by Rumberger (2011)
is related to the “individual consequences” (p. 86). Individual consequences associated with
dropping out of school include the difficulty of finding a job. When a job is attained though, the
wages are primarily low. Dianda (2008) reports “the struggle for dropouts to find employment is
attributed to the lack of required skills and lack of a diploma” (p. 28). These individuals,
Rumberger (2011) indicates, are less likely to be motivated to procure training to improve their
employment skills. The research has also indicated that individuals who do not graduate from

24
school work less than those with higher levels of education and have fewer benefits (Rouse,
2005).
The social consequences of dropping out of high school, according to Rumberger (2011),
involve these individuals being more likely to be involved in crime and incarceration.
Rumberger (2011) also indicates that these individuals are more likely to have poorer health, and
they are less likely to be involved in community and civic activities, such as volunteering and
voting.
In summary, dropouts earn less and contribute less to society. Furthermore, according to
Dianda (2008), these individuals also are often on “some sort of public assistance” (p. 30),
resulting in an additional cost to society.
Economic Benefits of High School Graduation
The accomplishment of high school graduation is advantageous for many reasons. It
benefits not only the individual, but also society (Alliance for Excellent Education, 2011c;
Dianda, 2008; Rouse, 2005; Rumberger 2011). The Alliance for Excellent Education indicated,
“Everyone benefits from increased graduation rates” (2011c, p. 1). According to its report,
graduates themselves will have the capacity to earn higher wages and enjoy more comfortable,
healthy, and secure lifestyles. Dianda (2008) indicated, “High school graduates earn 43 percent
more than non-graduate students, and college graduates earn more than 150 percent; one and a
half times more than high school dropouts” (p. 28).
The nation also benefits from this achievement. Those individuals that complete a high
school education are in a better position to contribute economically to society. They have
increased purchasing power, pay taxes, and demonstrate a higher level of worker productivity
(Alliance for Excellent Education, 2011c). Rouse (2005) indicated that education has a direct

25
effect on earnings: “If an individual is somehow able to complete another year of schooling, his
or her income will rise by approximately 10%” (p. 24). This earning capacity is the social
benefit associated with increased education. Table 3 illustrates this economic benefit for
completing school on both the state and national levels.
National High School Graduation Data
Dianda (2008) reported that graduation rates have remained stable for the past 35 years.
Dianda also indicated that during this time, 70-75% of students completed high school in four
years. The 25-30% of these students who do not complete high school contribute to the societal
economic cost.
Table 3
The Projected Economic Benefits of Students Earning a High School Diploma for the United
States and for New York State: Per Year
Projected Economic Benefits for
New York State United States
Earnings $316,000,000 $7,600,000,000
Spending $244,000,000 $5,600,000,000
Housing sales $583,000,000 $19,000,000,000
Car sales $37,000,000 $741,000,000
Increased gross state product $415,000,000 $2,000,000,000
(in investments)
Increased sales tax revenue $34,000,000 $713,000,000
New jobs 2,150 54,000
Note. From The economic benefits of helping high school dropouts earn both high school diplomas and college degrees by Alliance for Excellent Education, 2011, December, p. 1.

26
NYS graduation data. Until 2009, NYS had an established state standard graduation
rate of 55%. This rate was changed to 80% in the 2009-2010 school year and accountability
reporting period. As previously discussed higher standards for NYS schools were established,
by NYS Regents in the adoption of a new reform agenda and at the same time NYS participated
in the federal Race To The Top (RTTT) grant opportunity.
The most recent NYS graduation rate reported by the NYSED was 74% for those
students who started school in grade nine in 2007 and graduated in June of 2011 (NYSED OC,
2012). The previous cohort (2006) graduation rate reported was 73.4%; while the graduation
rate for the 2003 cohort was 69.3% (NYSED OC, 2012).
Rural School Communities
Rural school community settings serve a third of students who attend school in the
nation. As indicated by Strange et al. (2012), 33% of students are educated in a rural school
setting.
The characteristics of rural schools and their rural communities are closely intertwined.
According to Lyson (2002), the “school setting is not only the social hub of the village, but the
school setting also contributes to the sense of survival of adults in the culture” (p. 1). Rural
communities, Lyson states, “are symbols of community autonomy, community vitality,
community integration, personal control, community tradition, and community identity” (2002,
p. 1). The features that describe these communities are unlike those characteristics of schools in
other settings because of where these schools are located. These features, according to Lyson
(2002), include communities that are described as “trade and service centers, and places that
nurture participation in civic and social affairs” (p. 2). Lyson further contends the school
community provides social, cultural, and recreational activities” (2002, p. 2). Community
27
members in rural settings are closely tied to the school and often choose to maintain this unique
connection.
Malhoit (2005) indicated:
the school is the most important public institution in a rural community; a rallying point
for services to poor families and children, a polling place, the library, and the community
center. Rural schools represent the economic lifeblood of the community, often serving
as a rural area’s largest employer and customers for small businesses. (p. 10)
Malhoit (2005) further stated that there are unique characteristics that need to be taken into
consideration pertaining to the funding of schools. These characteristics are:
community capital; rural people are strong supporters of public education and
community-based schools; distance, space, and sparseness; poverty; low and declining
property values; loss of population, talent, and jobs; aging population; high minority
population; smaller schools; social service infrastructure and philanthropic support;
technology; and transportation. (Malhoit, 2005, pp. 10-12)
Rural School Education
Rural school districts possess unique characteristics and play a significant role in the
communities in which they are a part. These districts comprise one third of our nation’s schools.
These districts, because of their size and shrinking tax base, face difficult programmatic and
fiscal challenges. Some rural school districts, especially in NYS, have the capacity to meet the
state established graduation rates; however, some do not.
Rural education is identified as a concern in the nation (Strange et al., 2012). Rural
school enrollment according to Strange et al. (2012) is outpacing non-rural enrollment, and at the
same time, rural educational needs are becoming more complex. Strange et al. (2012) state “new

28
more thoughtful policy reforms are customized to meet the challenges of rural education in all of
its dimensions are manifestations are needed” (p. 21). These challenges include providing
programs to meet student needs in the 21st century during a time when the allocation of fiscal
resources has changed (Brimley et al., 2012; NYSED P12 SO EMS, 2012).
The Alliance For Excellent Education (2009) indicated there are mechanisms for schools
to employ to ensure all students have the opportunity to complete high school. To employ such
mechanisms is advantageous for rural schools in order to address the issue of students dropping
out of school. The Alliance For Excellent Education (2009) stated that:
to guarantee both the stability of rural communities and the nation’s ongoing
competitiveness in the global economy, it is more important than ever to ensure that all
rural high school students graduate with the skills they need for college, careers, and life.
(p. 2)
To address the challenge that rural schools face, The Alliance for Excellent Education
(2009) identified 10 elements that every rural school should have in place. These elements
include:
college and work-ready curriculum for all students, personal attention for all students,
extra help for all students who need it, bringing the real world to the classrooms, family
and community involvement, a safe learning environment, skilled teachers, strong
leaders, necessary resources, and user friendly information for parents and the
community. (p. 8)
These critical elements identified in the literature, if employed, provide opportunities for students
to be globally competitive.
Rural education in New York State. Specifically, the NYSCRS indicated some unique
29
challenges for these schools: “Rural schools face a unique set of issues and challenges, such as
consolidation, improving academics, and extracurricular programs while keeping tax levies in
check” (2012, About New York State’s rural schools section, para. 6). Rural schools also face
the possibility of consolidation, which may impact the socio-economic well being of the
community (Lyson, 2002).
Strange et al. (2012) indicated “more than half of all rural students in the U.S. attend
school in just 11 states” (p. 6), including NYS. The NYSCRS indicates that “of 697 school
districts in the state, 299 are in rural areas and another 65 are in towns located in distant or
remote locations” (2012, About New York State’s rural schools section, para. 2) across the state.
These 299 districts represent more than 40% of the school districts in the state.
The cost of rural school education varies among rural school districts. According to
NYSCRS (2012), a NYS “high need rural district spends a minimum of $12,098 per pupil and a
maximum of $28,470” (About New York State’s rural schools section, para. 7). A necessary
consideration that must be made is the cost of educating students in rural schools in the state so
that students have sufficient opportunities to meet state standards.
The national graduation rate of students attending rural schools, according to Strange et
al. (2012), is 77%. The NYS graduation rate as of June 2012, based on the 2007 cohort, was
73.4% for high need rural school districts (NYSED P12 IRS, 2012c), which is below the state
standard of 80%.
Rural school communities indicated that “they wanted their communities to remain the
same” in a recent survey of communities in NYS (Sipple, Casto, & Blakely, 2009, p. 1). The
survey further indicated that “72.9% of rural New Yorkers are most satisfied with their education
in their communities” (Sipple et al., 2009, p. 1).
30
In conclusion, this survey of rural school communities indicated that New Yorkers were
satisfied with the education provided in rural settings (Sipple et al., 2009). Rural school
communities have unique characteristics as described by Lyson (2002) and Malhoit (2005). A
little over a third of students attend rural schools in NYS (NYSCRC, 2012). Graduation rates in
these rural schools, 73.4%, are below the state standard of 80% in NYS (NYSED P12 IRS,
2012c).
The Causes of High School Dropouts
The literature has identified many reasons why students drop out of school. Students
who drop out cite a number of complex and manifold reasons for making the decision to leave
high school prior to graduation. The research conducted in this area by Rumberger and Ah Lim
(2008) is of particular relevance. Rumberger and Ah Lim conducted research that included a
span of 25 years and focused on the reasons that students drop out of school. Rumberger and Ah
Lim reviewed 203 published studies in which they attempted to “identify statistically significant
predictors of high school dropout and graduation. The results of the research indicated two
prevailing predictive factors contributing to students dropping out of school. These factors
consist of individual characteristics and institutional characteristics” (Rumberger & Ah Lim,
2008, p. 1).
The individual characteristics identified and described by Rumberger and Ah Lim (2008)
included educational performance, behaviors, attitudes, and background. The institutional
characteristics included families, schools, and communities.
According to Rumberger and Ah Lim (2008), dropping out of high school is a “complex
process that is not attributed to any single factor, and the context in which this occurs within the
school, family, or community is strongly considered in this important context” (p. 3).

31
There is one factor identified in the literature, which is attributed to students leaving high
school. “Poverty is the single most powerful demographic factor that increases an individual
student’s chances of dropping out of school” (Dianda, 2008, p. 60). There were several other
reasons that influence a student’s decision to drop out of school identified by Dianda (2008).
These include chronic absences from school, retention, and academic failure. Yet another factor
of dropouts identified in the literature, as indicated by the Alliance for Excellent Education
(2010) is “the lack of student engagement” (p. 2). The Alliance for Excellent Education (2010)
further states, “that both academic and social engagement in school are integral components of
students successfully navigating the education pipeline” (p. 2).
Addressing the dropout crisis. Schools across the nation need to address the dropout
crisis. Students who do not graduate have an economic impact on society (Alliance for Excellent
Education, 2011b; Dianda, 2008; Rouse, 2005; Rumberger, 2011). Dianda (2008) indicated that
the US was ranked 18th in high school graduation rates among developed nations. Dianda
(2008) also indicated that the US ranked fifth in the percentage of young adults ages 25-34 with
college degrees.
As indicated previously, students who drop out of high school will face long term social
and economic consequences. Not only will this adversely affect their lives on an individual
level, but this also has significant consequences on society. According to Dianda (2008), “If the
nation decides to do little or nothing about high school dropouts it will pay dearly for years to
come, but if it invests in dropout prevention and intervention it will accrue enormous benefits”
(p. 27). According to Rumberger (2011), there have been many efforts to alleviate the problems
in the nation’s schools for a considerable time. Rumberger cites research, which indicates that
there have been several approaches to address the dropout crisis including targeted approaches,

32
comprehensive approaches, and systemic approaches. Dianda (2008) states that “solving the
dropout crisis will involve nothing short of community and school transformation” (p. 58).
Schools that fail to meet established graduation standards need assistance.
The research indicates efforts to remedy the dropout crisis in the nation and in the state
have been underway. In 2005, the National Governors Association (NGA) co-sponsored a report
on the topic of schools preparing students for high school completion (Conklin, Curran, &
Gandal, 2005). The report was the first effort towards remedying the dropout crisis and
improving high schools in the nation. This action agenda by the NGA was aimed to “ensure that
all high school graduates are prepared for post-secondary education and work” (Conklin et al.,
2005, p. 5). The result of the educational summit produced a comprehensive plan that involved
five critical elements: restoring the value of the high school diploma and ensuring rigor;
redesigning the American high school to meet the needs of all students; giving high school
students the best teachers and principals; holding high schools and colleges to a high standard;
and streamlining governance of the educational K-12 and post educational system.
A review of the research on graduation rates, dropouts, and rural education indicates
efforts have been underway to address the dropout crisis in schools. Many lawmakers,
policymakers, and researchers, have contributed toward school reform and high school
completion. As the Alliance for Excellent Education indicated, “The best economic stimulus
package is a high school diploma” (2010, p. 3). Therefore, the effort towards resolving the
obstacles of high school completion, need to continue.
Dropout intervention strategies. Christenson and Thurlow (2004) indicate that
currently considerably more is known about who drops out than what is known about efficacious
programs. The challenge, according to Dianda (2008), is to develop the capacity, know-how,

33
and will to implement what is known to work in all high schools. What remains to be identified
in the research is the ability to determine the effectiveness of programs that may or may not
influence graduation rates. Kennelly and Monrad (2007) indicated:
Still, a lot is not known about dropout prevention strategies and interventions that make a
positive difference. However, interventions that have the capacity to be orientated
around individual student needs, and that work in tandem with schoolwide interventions
able to adjust around grade-level needs, holds promise as an effective combination for
combating the nation’s dropout problem. (p. 3)
Legters and Balfanz (2009) also address the need to effectively deal with dropout
prevention. Legters and Balfanz identified five areas, which can be implemented to achieve
system renewal in which to address the dropout problem (2009). The five areas indicated are:
1. Identify the scale and scope of the dropout problem.
2. Transform or replace low-performing schools.
3. Install early warning systems and provide comprehensive targeted intensive supports
to students.
4. Establish supportive policies and resource allocations.
5. Build community will and capacity. (Legters & Balfanz, 2009, pp. 5-8)
Attempts to alleviate the dropout crisis have also been reported by Balfanz, Bridgeland,
Bruce, and Fox (2012). These individuals “indicated a coalition of leading U.S. organizations
gathered to develop a plan of action for ending the dropout crisis in America once and for all”
(Balfanz et al., 2012, p. 20). This plan became known as the “Civic Marshall Plan (CMP)”
(Bridgeland et al., 2012, p. 20). The CMP called for reaching the benchmark of a national
graduation rate of 90% by the year 2020. The focus of the CMP incorporated four principles

34
including: “a strategic focus, high expectations for students, accountability and support for
school systems, and thoughtful collaboration” (Bridgeland et al., 2012, p. 20). These strategies
also are consistent with other facets of the literature presented to overcome the national dropout
crisis.
There have been many intervention strategies identified in the literature that lead to
students completing high school. Two such sources for dropout prevention strategies are from
the research of Dynarski et al. (2008) and Smink (2004). Dynarski et al. (2008) provide six
recommendations for dropout prevention measures in schools. These include the use of data
systems (to track attendance, academics, and discipline) to help identify students at risk of
dropping out of school, a personalized learning environment that encompasses academic rigor
and relevance, academic enrichment opportunities, social skill development, and adult advocates
for students (Dynarski et al., 2008).
Schargel (2012) is another researcher who identified effective strategies to prevent
students from dropping out of school. His 15 strategies have been under development since 1986
at the National Dropout Prevention Center at Clemson University. These strategies have been
identified as being “implemented successfully at all educational levels and environments
throughout the nation” (Schargel, 2012, p. xxiii). Schargel (2012) indicates that these strategies
are field tested, researched-based, and data driven practices. Schargel believes he has identified
the tools to effectively deal with the dropout crisis. Schargel encapsulates all facets of a school-
community environment. Schargel (2012) delineated these strategies in four distinct categories:
1. Early Interventions: family engagement; early childhood education; early literacy
development.
2. Basic Core Strategies: mentoring and tutoring; service learning; alternative schooling;
35
after-school opportunities.
3. Instruction: professional development; educational technology; active learning;
individualized instruction; career and technical education (CTE).
4. School-Community: systematic renewal; school-community collaboration; safe
learning environment. (pp. xxiii- xxiv)
Another factor identified in the dropout prevention effort has been the effective role the
counselor plays in students graduating from high school. Hayes, Nelson, Tabin, Pearson, and
Worthy (2002) describe this role as integral in the understanding of students’ performance needs
and accomplishment on a broad level. Hayes et al. (2002) further describe the counselor’s
position as unique in this respect. “The school counselor has a school-wide perspective on
serving the needs of every student and have the capacity to assess the school for systematic
barriers to academic success” (Hayes et al., 2002, p. 3).
Summary
The literature provides many examples of research conducted to alleviate the dropout
crisis. Specific prevention strategies have been identified to help schools address the issue of
students dropping out of school. The work of Balfanz et al. (2012), Dynarski et al. (2008),
Hayes et al. (2002), Legters and Balfanz (2009), Rumberger (2011), Schargel (2012), and Smink
(2004) are all examples of work that has been done to address the dropout crisis in our nation’s
schools.
Dropout prevention programs and strategies do exist and are available to the nation’s
schools. The Alliance for Excellent Education (2011b) indicates that dropout rates can be
improved by “improving high schools” (p. 4). Dianda (2008) also maintains that no less than a
complete transformation of the school and surrounding community is required as part of any

36
reform measures.

37
Chapter 3: Methods
This chapter discusses the research methods involved in this research study. First, a brief
background of the study will be discussed. The research design, sampling and sampling
procedures, survey construct, and survey validity will follow. The data collection and data
analysis methods will be presented. The chapter will conclude with the research bias and a brief
summary of the study.
The purpose of this quantitative study was to determine what dropout intervention
strategies school districts were using to improve graduation rates. This research study also
sought to determine if there was an association between graduation rates and dropout prevention
intervention strategies employed in rural school districts in NYS. Participants in the study
included middle level and high school level principals from rural school districts.
This study was guided by three basic research questions. These questions included those
directly related to strategies or interventions school districts employed to improve, meet, or
exceed NYS graduation rates. The questions were:
1. What intervention strategies are school districts using to improve graduation rates of
all students?
2. Is there a relationship between dropout prevention strategies and graduation rates?
3. Is there any association between graduation rates and the choice of specific
intervention strategies and the following demographic features:
a. Size of the school;
b. Experience of the administrator/principal;
c. Type of school schedule (i.e. traditional, block, modified block, semestered);
d. Building configuration;

38
e. Type of rural school district.
Research Design
This quantitative study attempted to determine what intervention strategies schools
employed to improve graduation rates, and also to determine if there was an association between
graduation rates in rural school districts and the intervention strategies those school districts
employed. School administrators were asked to identify their districts’ graduation rates for the
2007 cohort obtained from NYSED School Report card data from the 2010-2011 school year
(NYSED P12 IRS, 2012a).
The rationale for selecting a quantitative research design was to attempt to collect data
from as many rural school districts as possible to ascertain what, if any, dropout prevention
strategies were being used in these rural districts to improve graduation rates. The size of the
school district, the experience of the school administrator, the type of high school or middle
school schedule, the type of rural school, and the building configuration were also examined to
determine if there was any difference in the effectiveness of dropout intervention strategies when
these demographic elements were considered.
Sampling and Sampling Procedures
The sampling method employed in this study was “purposeful sampling.” Purposeful
sampling, according to Creswell (2012), “is sampling that is done intentionally to better
understand a central phenomenon of a site or select individuals” (p. 206). The objective in this
study was to elicit as much detail as possible from select rural school districts in NYS to learn
what practices they employed to meet or exceed state established graduation rates. The
participants specifically chosen were those rural schools who elected to become members of the
RSA of NYS in the 2012-2013 school year. A list of these schools is publicly available from the

39
Cornell University’s Center for Rural Schools (RSA of NYS, 2012). These schools are also
publically available and listed in the P-12 Need-Resource Capacity document (2012).
There are currently a total of 262 school districts, including the Board of Cooperative
Educational Services (BOCES) organizations that belong to the Rural School Association. The
BOCES organizations were excluded from this study, since school districts fall under the
boundaries of BOCES organizations. Excluding BOCES organizations, 245 rural school districts
in NYS were asked to participate in the study.
Instrumentation
The instrumentation for this study included a researcher designed survey. This
instrument was designed based on the 15 effective strategies derived from Schargel (2012).
Schargel’s work sought to determine effective practices of schools to alleviate the dropout crisis
that exists in the nation’s schools. Schargel’s strategies have been field tested. Permission to use
the strategies from Schargel’s (2012) work was granted (see Appendix A).
Survey construct. The survey consisted of 57 questions and was divided into two parts
(see Appendix B). Part one included six demographic questions. These questions included
enrollment, building configuration, graduation rate for the 2007 Cohort, type of rural school,
type of schedule (traditional or block), and years of experience of the building administrator.
Part two included 51 questions, which directly related to the dropout prevention
intervention strategies available to students that were derived and adapted from Schargel (2012).
These strategies were divided into four levels that encompassed a variety of interventions and
program opportunities for students. These included opportunities from those considered easily
accessible to those that were more difficult to access. These also included strategies that were

40
available to students on campus and those strategies that were accessed off school grounds.
These four levels will be discussed.
Level One Basic Core Strategies included nine strategies. These strategies were grouped
together, since their characteristics refer to the most common strategies districts may offer
students. These strategies include Peer Mentoring, Adult Mentoring, Peer Academic Tutoring,
Adult Academic Tutoring, Service Learning Opportunities, After School Opportunities (Clubs),
After School Opportunities (Sports), Parent-Teacher Conferences, Parent -Teacher-Student-
Association.
Level Two Instructional Strategies included 13 strategies, all related to instructional
practices that may be utilized by districts. These included Differentiated Instruction, Project
Based Learning, Collaborative Learning, Integration of Technology In Instruction, Students Are
Taught How to Use Technology, Technology is Used for Instruction (Smartboard, Promethean
Board, interactive projector etc.), High School Freshman Transition Course, High Interest
Electives, Character Education Program, Social Skills Development, College and Career
Readiness Skills Taught, Student Advisory Period, Response to Intervention, and Instructional
Support Teams.
Level Three Alternative School Strategies included 13 strategies clustered together since
they related to alternative schooling opportunities provided for high school students either on or
off campus. These strategies included Career and Technical Education Programs provided in
school (In House), Career and Technical Education Programs (Off Campus), Smart Scholars
Program (Dual enrollment in college and high school), BOCES New Visions Program,
International Baccalaureate Program, Advanced Placement Courses, University in the High

41
School Courses, Credit Recovery Program, Summer School, Project Lead the Way, Distance
Learning Courses, Alternative Education (Off Campus), and Early College Admissions Program.
Level Four Building Wide Strategies included 16 strategies. These strategies were
grouped together, since they relate to leadership practices and building level interventions
encompassing a range of services and opportunities available for students. These strategies
included Establish a Vision or Mission for Learning, Establish Goals for Learning, Ongoing
Examination and Analysis of Pertinent Student Data (discipline, attendance, and performance on
assessments), Guidance Counseling Services, Social Worker Counseling, Job Shadowing
Opportunities, Attendance Policy, Recognition of Academic Achievement, College Fair, Career
Fair, Pupil or Child Study Team Services, Academic Planning and Counseling, College Planning
and Counseling, Career Planning and Counseling, Instructional Team Planning, and Agency
Partnerships for Family Support.
Other strategies included in the survey incorporated recommendations from other major
research studies on dropout prevention (Balfanz et al., 2012; Dianda, 2008; Dynarski et al., 2008;
Hayes et al., 2002; Kennelly & Monrad, 2007; Legters & Balfanz, 2009; Rumberger 2011).
Responses for each of the 51 strategies in the survey were answered using the following
choices:
1. This strategy is available for all students;
2. This strategy is available for some students;
3. This strategy is available for most students;
4. This strategy is not available for students in our district;
5. This is a strategy our district needs.

42
Survey validity and reliability. Creswell (2012) indicates it is important to select an
instrument that reports individual scores that are reliable and valid. Creswell (2012) defines
reliability as the scores from which an instrument are stable and consistent and validity as
the development of sound evidence to demonstrate the test interpretation of scores about
the concept or construct that the test is assumed to measure or match its purposed use (p.
159).
For instrument validity, Creswell (2012) identifies five standards to consider as evidence in this
process. These are test content, response processes, internal structure, relations to other
variables, and the consequences of testing. In this study, a process was utilized to produce an
instrument that was considered valid.
To establish face validity of the survey instrument, the researcher’s survey was first
examined by a team of experts. This team included a group of four principals who were not part
of the study: two high school principals and two middle level principals. These individuals were
asked to examine the survey, take the survey, and provide feedback to the researcher. Once the
responses from the panel were collected, the researcher analyzed them and adjustments to the
survey were made accordingly.
To determine construct reliability, Cronbach’s Alpha, a statistical analysis, was
conducted on part two of the instrument tool. All 51 intervention strategies were tested as a
whole using SPSS version 21. Cronbach’s Alpha is defined as “a measure of internal reliability
or consistency of the items in the instrument” (Vogt & Johnson, 2011, p. 86).
Data Collection
Data were collected from the survey of rural school districts that elected to participate in
the study. Contacts were first made to the RSA executive director, Dr. Bruce Fraser, and to the

43
Capital Area School Development Association (CASDA) director, Dr. James Butterworth, to
discuss this research project and to obtain input and support from them. These individuals work
with a vast number of individuals locally and across the state. Their knowledge and expertise of
rural schools was valuable to this study. CASDA also hosts a Rural School Summit, which
provides valuable resources and information on rural schools pertinent to this study.
Dr. Fraser and Dr. Butterworth then introduced the researcher to Dr. Sipple of the NYS
CRS. The research study was discussed with each of these individuals. As a result of these
discussions and their interest in the research study, both Dr. Sipple and Dr. Fraser encouraged
participation in this study with their constituents across the state. Dr. Fraser encouraged this
participation by including an announcement of it in the RSA newsletter.
In this research proposal, the unit of analysis was rural school administrators who were
members of the RSA. This population included schools at the middle and high school levels.
This survey was sent out to the 245 school districts’ middle level and high school level principals
who were members of the RSA (see Appendices B & C). The survey, which was kept
anonymous, was made available to principals after contact had been made to superintendents.
Then, two emails were sent after the first contact (a letter of correspondence) to superintendents
to encourage participation in the study (see Appendices D & E). Finally, an email was sent out
to eligible participants to indicate the survey was made available via Survey Monkey. This
service was purchased by the researcher and is considered to be a secure tool. Survey Monkey
uses an encrypted survey tool, referred to as Secure Sockets Layer (SSL). This security was
consistent with the efforts of ensuring the anonymity of the participants.

44
Once the data from the survey were collected, they were then transferred to the IBM
Statistical Package for Social Sciences® (SPSS) for statistical analysis. Version 21 of the
student Grad Pack was utilized for this purpose.
Data Analysis
The results of the survey were input into SPSS, the designated mechanism used to
analyze data collected in this study. The data were checked for any errors or missing data prior
to conducting the analysis. Creswell (2012) states that “the process of inspecting and examining
the data” (p. 181) is beneficial in ensuring the data are accurate. If data errors were detected or
missing, then that data were eliminated.
Descriptive statistics were applied first in the study. Descriptive statistics “present
information to describe responses to each question obtained from the data, as well as determine
overall trends and the distribution of the data” (Creswell 2012, p. 619).
For question number one, the method of analysis used was derivation of the frequencies
of the demographic data, as well as of the frequencies for all intervention strategies that school
districts either employed or did not employ.
The second part of the data analysis involved the use of inferential statistics. Inferential
statistics, as defined by Creswell (2012) “enable a researcher to draw conclusions, inferences, or
generalizations from a sample to a population of participants” (p. 621).
For research questions two and three, a Chi-Square Test of Association was conducted.
This test was chosen to analyze the data because the data derived from the study were
categorized as nonparametric. Nonparametric statistics are referred to as “statistical techniques
designed to be used when the data analyzed depart from the distribution when data is measured
on a nominal or ordinal scale” (Vogt & Johnson, 2011, p. 256). These statistics, according to

45
Vogt and Johnson (2011), “require fewer assumptions” (p. 256). “The use of nonparametrics are
considered just as valuable as parametrics. This data comes as frequencies, such as numbers or
percentages” (Salkind, 2008, p. 263). For the results obtained in this study, the number of
responses, percentages, and the Chi-Square Value or Asymptotic (statistical) significance were
reported.
The null hypothesis was employed as part of the data analysis process. The decision to
accept or reject the null hypotheses was used to determine whether or not the results of the
relationships between graduation rates, intervention strategies, and demographic features were
significant. The significance value was obtained and included both the number of responses and
percentages for strategies paired with graduation rates of those greater than or equal to 80% or
those less than 80% in this research question. The variables were then determined to be either
independent (p > 0.05 – not significant) or dependent (p < 0.05 – significant) based on the null
hypotheses. This determination of significance was based on the null hypotheses indicating that
there was no relationship between graduation rates and the 51 intervention strategies. If there
was a relationship between the two variables, the null hypotheses of p > 0.05 would be rejected
and the value of p < 0.05 would indicate a relationship between graduation rates and strategies,
therefore the null hypotheses would be rejected and the data would be considered significant.
Both the number of responses and percentages were analyzed in the research question.
Significance in this study included p-values ≤ 0.05. P-values from 0.05 to 0.067 were considered
borderline significant.
For research question two, the Chi-Square Test of Association included analysis of the
association between graduation rates and the specific intervention strategies employed in the
46
district. For research question three, the Chi-Square Test of Association was utilized to
determine the association of graduation rates, intervention strategies, and demographic features.
Analyses of the data were examined to determine if dropout prevention strategies used in
rural school districts in NYS were associated with graduation rates. Data were analyzed to
determine any statistical differences that may have existed within or amongst the data.
Research Bias
A bias that exists in this research study includes the researcher’s own experiences in a
rural school district. This experience extends to the development of a dropout prevention
program for students. The researcher has personal perceptions as to what effective dropout
prevention strategies work. This bias is attributed to the researcher being an administrator
previously involved in a dropout prevention task force in her own school. Therefore, the
researcher in the study suspended judgment by having others examine the research methods and
survey instrument tool. The other essential piece is that the study was anonymous, and the
researcher remained open-minded and embraced the possibility of new discoveries in this study.
It was also essential for the researcher in this study to adhere to scholarly writing that was absent
of biased language.
Summary
This quantitative study involved determining if graduation rates from the 2007 cohort of
rural schools in NYS who belong to the RSA were associated with dropout intervention
strategies used by these districts. A researcher-developed survey instrument was used in this
study to gather data on intervention strategies. The survey was sent to middle school level and
high school level principals. Principals identified what intervention strategies were or were not
available to students. The study also attempted to determine if there was any difference in

47
effectiveness of dropout intervention strategies when the size of the school, the experience of the
administrator, or the type of schedule were considered. The data collected from the online
survey were transferred to SPSS. Statistical analyses were conducted to make a determination of
the correlation between graduation rates and intervention strategies.
Chapter four will include a detailed analysis of each of the three research questions.
Descriptive statistics will explain the demographic features of the school districts included in the
study. Chapter four will also include a detailed analysis identifying the intervention strategies
school districts employed to meet or exceed graduation rates in NYS. The chapter will provide a
detailed analysis of each of the 51 intervention strategies employed and the determination of any
association between these and graduation rates. The analysis of intervention strategies,
graduation rates, and any association between the five demographic features will also be
included.

48
Chapter 4: Data Analysis
This chapter presents the findings of the data analyses of this research study. These
analyses were organized by the three research questions of the research study. Descriptive
statistics were used to answer research question one. To answer question two and three, A Chi
Square Test of Association was utilized to determine if a relationship or association existed
between graduation rates and the 51 intervention strategies. Question three was also answered
using the Chi Square test of association to determine if an association existed between graduation
rates, the 51 intervention strategies, and five demographic categories. The results of the analyses
were described in this study by indicating the number of responses, percentages, and Asymptotic
significance. Asymptotic significance is used to describe the statistical significance of the data.
The data analyses elicited from the survey instrument utilized in the study were used first
to determine what intervention strategies are employed by specific districts in NYS and then to
determine if graduation rates were associated with these intervention strategies or demographic
categories. The survey instrument was delineated into two parts to answer three specific
research questions pertaining to dropout prevention strategies utilized in specific rural schools
across NYS. The first part of the survey related specifically to demographic information about
these rural schools in the study, and the second part was comprised of selected dropout
intervention strategies.
The purpose of this study was to determine if graduation rates, provided by the school
districts in the study from the 2007 cohort (identified in 2012 by NYSED) were associated with
dropout prevention intervention strategies employed in select rural school districts in NYS.
Participants in the study included middle level and high school principals from rural school

49
districts belonging to the Rural School Association (RSA) of NYS. Three research questions
shaped the research study.
1. What intervention strategies are school districts using to improve graduation rates of
all students?
2. Is there a relationship between dropout prevention strategies and graduation rates?
3. Is there any association between graduation rates and the choice of specific
intervention strategies and the following demographic features:
a. Size of the school;
b. Experience of the administrator/principal;
c. Type of school schedule (i.e. traditional, block, modified block, semestered);
d. Building configuration;
e. Type of rural school district.
The unit of analysis of the study was defined as the school districts. The dependent
variable in the study was the graduation rate of the participating school districts. The
independent variables in the study included the 51dropout intervention strategies, delineated into
four categories and five demographic features of the schools previously mentioned.
The 51 dropout intervention strategies were divided into four levels that encompassed a
variety of interventions and program opportunities for students. These included opportunities
from those considered easily accessible to those that were more difficult to access, both on and
off the school campus. The four identified levels of these strategies were: Level One Basic Core
Strategies; Level Two Instructional Strategies; Level Three Alternative Schooling Strategies; and
Level Four Building-Wide Strategies.

50
Demographics
There were 262 districts that belonged to the RSA of NYS (RSA of NYS, 2012). These
schools were identified on the RSA’s website. The sample included 311 administrators from
these districts who were invited to participate. One hundred eight responses from building
administrators were elicited from the study. These participants included P-12 principals, K-12
principals, middle level principals, jr./sr. high school principals, or 9-12 high school principals.
Building enrollment of these rural school districts ranged from buildings of 190 students
to those with 1700 students. Building configuration of these schools included five various
building types. There were 25 P-12 schools, 12 K-12 schools, 34 high schools, 31 jr./sr. high
schools, and 6 middle schools.
The types of schedules in this study are defined as block schedule (an approximate 80
minute period), a traditional schedule (an approximate 40 minute period), and a mixed schedule
(block & traditional). Schools used three types of schedules; however, one type of school
schedule was most frequently utilized. Nine schools used blocked scheduling, five used a mixed
schedule, and 94 schools used a traditional schedule for instruction. There were seven schools in
the study that indicated they used a block schedule, five used a mixed schedule, and 96 used a
traditional schedule.
Administrative experience also varied significantly in this study. The number of years of
experience administrators possessed ranged from one to 28. There were four types of rural
schools identified in the study. There were 13 schools that were identified as Fringe, 51
identified as Distant, 41 identified as Remote, and three identified themselves as rural.
There were three types of rural schools defined in the survey. These rural schools
included Fringe (rural territory that is less than or equal to 5 miles from an urbanized area),
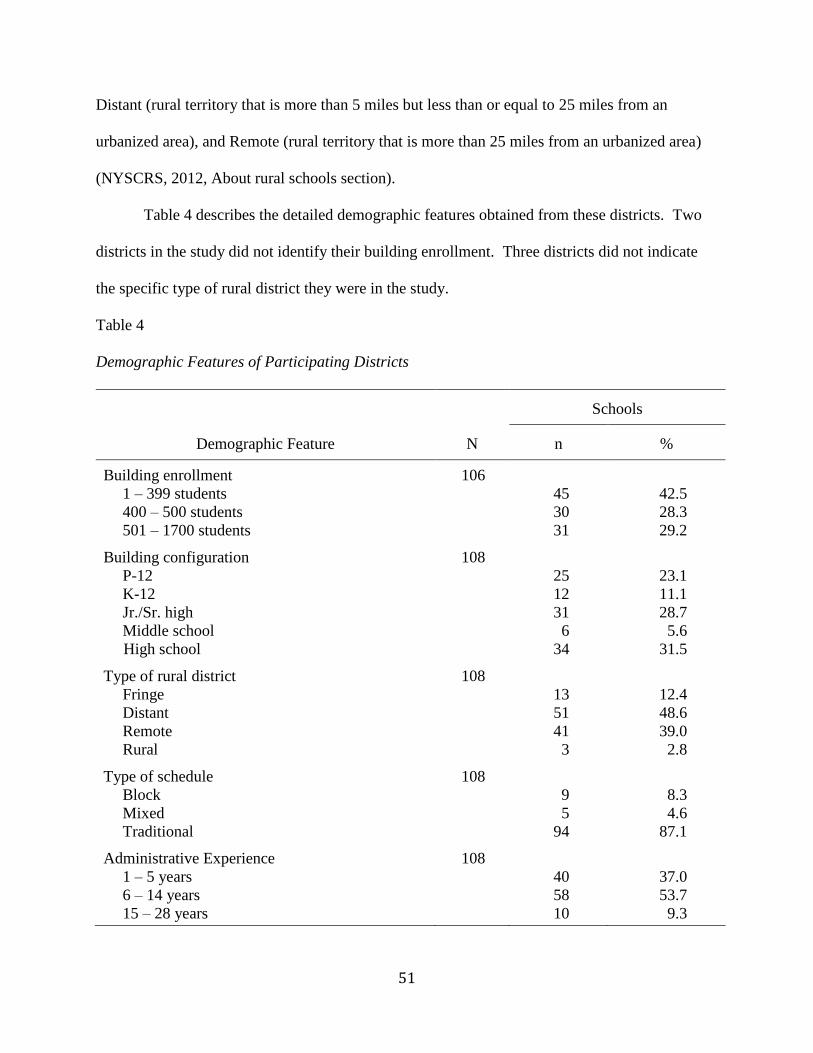
51
Distant (rural territory that is more than 5 miles but less than or equal to 25 miles from an
urbanized area), and Remote (rural territory that is more than 25 miles from an urbanized area)
(NYSCRS, 2012, About rural schools section).
Table 4 describes the detailed demographic features obtained from these districts. Two
districts in the study did not identify their building enrollment. Three districts did not indicate
the specific type of rural district they were in the study.
Table 4
Demographic Features of Participating Districts
Schools
Demographic Feature N n %
Building enrollment
1 – 399 students
400 – 500 students
501 – 1700 students
106
45
30
31
42.5
28.3
29.2
Building configuration
P-12
K-12
Jr./Sr. high
Middle school
High school
108
25
12
31
6
34
23.1
11.1
28.7
5.6
31.5
Type of rural district
Fringe
Distant
Remote
Rural
108
13
51
41
3
12.4
48.6
39.0
2.8
Type of schedule
Block
Mixed
Traditional
108
9
5
94
8.3
4.6
87.1
Administrative Experience
1 – 5 years
6 – 14 years
15 – 28 years
108
40
58
10
37.0
53.7
9.3

52
Graduation Rates
Graduation rates referenced for this study were those derived from the 2007 cohort
obtained from NYSED School Report card data from the 2010-2011 school year (NYSED P12
IRS, 2012, March). Graduation rates were ascertained in part one of the survey instrument.
Eighty-three school districts in the survey reported graduation rates. Twenty-five schools did not
report graduation rates. NYS schools have a defined graduation rate of 80% (NYSED P12 IRS,
2011a).
Graduation rates played an integral part of this study. Graduation rates were reported by
83 schools. This data was examined and divided into two categories for subsequent data analysis
purposes. The first category was graduation rates greater than or equal to 80%, and the second
category was graduation rates of those less than 80%.
Districts were asked to select one of the following responses regarding the intervention
strategies included in the survey: (1) This strategy is not available for students in our district, (2)
This is a strategy our district needs, (3) This strategy is available for some students, (4) This
strategy is available for most students, or (5) This strategy is available for all students. See
Appendix B for the researcher-developed survey.
Each of the three research questions is presented along with a detailed analysis of the
results derived from the study.
Research Question One Results: What Dropout Intervention Strategies Are School
Districts Using to Improve Graduation Rates of All Students?
The first research question in this study sought to determine what intervention strategies
school districts were using to improve graduation rates. First, the original intervention strategy
responses were modified from the five available responses [(1) This strategy is not available for
53
students in our district, (2) This is a strategy our district needs, (3) This strategy is available for
some students, (4) This strategy is available for most students, or (5) This strategy is available
for all students], into two. This change was made because of the similarities of responses in
questions one and two, and the similarities between questions three through five. Question one,
and two responses, hence, were modified to those strategies not employed by the district, and
questions three through five were collapsed to those strategies employed by the district.
Strategies identified by the districts. The 51 intervention strategies in the survey were
clustered and defined into four distinct categories according to the type of characteristics and
implementation methods of the interventions. These strategies were identified in chapter three
and in Appendix B.
The number of responses and percentages of Level One through Level Four intervention
strategies used by districts were determined using descriptive statistics in SPSS. Next, the
percentage and average percentages of those strategies employed by districts and not employed
by districts were then calculated for each of the four respective levels. The results of the survey
indicated 108 school districts employed approximately 94% of Level One strategies, 93% of
Level Two strategies, and approximately 95% of Level Three and Level Four strategies. The
strategy results will be discussed in detail.
Level One Basic Core Strategies. There were nine strategies that comprised this level
These strategies were grouped together according to their characteristics, which refer to common
strategies districts may have offered students in terms of clubs, sports, mentoring and tutoring,
parent-teacher conferences and parent-teacher-student associations. Table 5 indicates the extent
to which Level One strategies were employed and not employed in the select rural school
districts in NYS. The number and percentages of responses for each strategy employed or not

54
employed by districts were included in the data set. The results from this category indicated that
strategies were employed with a range of 89.8% (n = 97) to 99.1% (n = 107). The lowest
employed strategy in this level was Parent-Teacher-Student Association. The highest employed
strategies in this level were After School Opportunities, such as sports, and Parent-Teacher
conferences.
Table 5
Level One Basic Core Strategies – Responses and Percentages of Strategies Employed and Not
Employed
Employed Not employed
Strategy n % n %
Peer Mentoring 98 90.7 10 9.3
Adult Mentoring 98 90.7 10 9.3
Peer Academic Tutoring 104 96.3 4 3.7
Adult Academic Tutoring 99 91.7 9 8.3
Service Learning 99 91.7 9 8.3
After School Opportunities (clubs) 106 98.1 2 1.9
After School Opportunities (sports) 107 99.1 1 0.9
Parent-Teacher Conferences 107 99.1 1 0.9
Parent-Teacher-Student Association 97 89.8 11 10.2
Average 94.13 5.87
Level Two Instructional Strategies. This level consisted of 13 intervention strategies
directly related to instructional practices that may have been utilized by the select rural schools
in NYS. These practices are grouped together according to the instructional practices and
programs towards improving student achievement. Level Two Strategies employed by districts
ranged from 85.2% (n = 92) to a 99.1% (n = 107). The strategy employed with the lowest
average was identified as Student Advisory Period. The strategy employed with the highest

55
percentage is Technology Is Used For Instruction (including technology such as a Smartboard,
Promethean Board, or Interactive Projector, etc.). Table 6 indicates the total number of
responses for each strategy and the percentages (and average percentages) for whether the 13
strategies were employed and not employed by these rural school districts.
Table 6
Level Two Instructional Strategies – Responses and Percentages of Strategies Employed and Not
Employed
Employed Not employed
Strategy n % n %
Differentiated Instruction 105 97.2 3 2.8
Project Based Learning 102 94.2 6 5.6
Collaborative Learning 106 98.1 2 1.9
Integration of Technology in Instruction 106 98.1 2 1.9
Students are Taught How to Use
Technology
105 97.2 3 2.8
Technology is Used for Instruction
(Smartboard, Promethean Board,
interactive projector, etc.)
107 99.1 1 0.9
High School Freshman Transition Course 84 77.8 24 22.2
High Interest Electives 99 91.7 9 8.3
Character Education Program 98 90.7 10 9.3
Social Skills Development 92 85.2 16 14.8
College and Career Readiness Skills Taught 105 97.2 3 2.8
Student Advisory Period 94 87.0 14 13.0
Response to Intervention Instructional
Support Teams
104 96.3 4 3.7
Average 93.06 6.92

56
Level Three Alternative Schooling Strategies. Level Three strategies in the study
consisted of 13 intervention strategies. These strategies were clustered together as they related to
character development, social skills development, and alternative schooling opportunities
provided for high school students, either on or off campus. Level Three strategies included those
from career and technical opportunities to those such as students attending college while still
enrolled in high school. The extent to which these strategies were employed ranged from 84.3%
(n = 91) to 99.1% (n = 107). Career and Technical Education Program (off campus) was the
strategy employed with the highest percentage. Credit Recovery was the strategy employed the
least by school districts included the study. Table 7 indicates the number of responses for each
strategy and the percentages for which the 13 strategies were employed and not employed by the
participating rural school districts.
Level Four Building -Wide Strategies. Level Four included 16 intervention strategies.
These strategies were grouped together as they relate to leadership capacities and building level
interventions encompassing a range of services and opportunities available for students. This
level was considered to be the most comprehensive, as these interventions required multi-faceted
district resources of both time and money. This domain included planning and collaboration
with and among the staff and building leadership team to address student needs at multiple
levels. The strategies employed at this level ranged from 88% (n = 95) to 100% (n = 108).
There were five strategies identified by districts that were employed by all districts with
graduation rates greater than or equal to 80% and less than 80%. These identified strategies
included Guidance Counseling Services, Recognition of Academic Achievement, Academic
Planning and Counseling, Career Planning and Counseling, and College Planning and
Counseling. The strategy employed with the lowest percentage at this level was Agency

57
Partnerships for Family Support. Table 8 identifies the number of responses for each strategy
and the frequencies of the specific strategies employed and not employed by select rural school
districts in NYS.
Table 7
Level Three Alternative Schooling Strategies – Responses and Percentages of Strategies
Employed and Not Employed
Employed Not employed
Strategy n % n %
Career and Technical Education Programs
(in house)
102 94.4 6 5.6
Career and Technical Education Programs
(off campus)
107 99.1 1 0.9
Smart Scholars Program (dual enrollment in
college and high school)
105 97.2 3 2.8
Board of Cooperative Educational Services
New Visions Program
106 98.1 2 1.9
International Baccalaureate Program 103 95.4 5 4.6
Advance Placement Courses 104 96.3 4 3.7
University in the High School Courses 104 96.3 4 3.7
Credit Recovery Program 91 84.3 17 15.7
Summer School 105 97.2 3 2.8
Project Lead the Way 102 94.4 6 5.6
Distance Learning Courses 96 88.9 12 11.1
Alternative Education (off campus) 104 96.3 4 3.7
Early College Admission Program 106 98.1 2 1.9
Average 95.08 4.92

58
Table 8
Level Four Building Wide Strategies – Responses and Percentages of Strategies Employed and
Not Employed
Employed Not employed
Strategy n % n %
Establish a Vision or Mission for Learning 102 94.4 6 5.6
Establish Goals for Learning 106 98.1 2 1.9
Ongoing Examination and Analysis of
Pertinent Student Data (discipline,
attendance, and performance on
assessments)
103 95.4 5 4.6
Guidance Counseling Services 108 100.0
Social Worker Counseling 98 90.7 10 9.3
Job Shadowing Opportunities 97 89.8 11 10.2
Attendance Policy 102 94.4 6 5.6
Recognition of Academic Achievement 108 100.0
College Fair 108 100.0
Career Fair 97 89.8 11 10.2
Pupil or Child Study Team Services 102 94.4 6 5.6
Academic Planning and Counseling 108 100.0
College Planning and Counseling 108 100.0
Career Planning and Counseling 107 99.1 1 0.9
Instructional Team Planning 101 93.5 7 6.5
Agency Partnerships for Family Support 95 88.0 13 12.0
Average 95.48 4.83
Summary of research question one. There were 108 valid responses analyzed as part
of this research study. The research study considered five demographic features, graduation
rates, and dropout intervention strategies in rural school districts that belong to the RSA of NYS.

59
The five demographic features examined in the study included building enrollment,
administrative experience, type of schedule used by these districts, and building configurations.
These demographic features were detailed in Table 4. The demographic features of these
districts varied in size, building configuration, type of rural school, type of schedule used by
these schools, and number of years of experience of the building administrators.
A little over half of the schools in the study either met or exceeded the 80% state
established graduation rate for the 2007 NYS Cohort. Graduation rates were reported by 83
schools. These rates were examined and divided into two categories for subsequent data analysis
purposes. The first category was graduation rates greater than or equal to 80%, and the second
category was graduation rates of those less than 80%. Fifty-one percent (n = 43) of the schools
reported graduation rates greater or equal to 80%, and 48.2% (n = 40) of the schools that
reported graduation rates less than 80%.
The 51 strategies employed by school districts ranged from 84.3% (n = 91) to 100% (n =
108). Level One Basic Core Strategies were employed by districts with an average percentage of
94.13%. There were very few districts that did not employ these specific strategies for students.
The four strategies districts employed with the highest percentages included Peer Academic
Tutoring (96.3%), After School Clubs (98.1%) and Sports (99.1%), and Parent-Teacher
Conferences (99.1%). The strategy that was employed with the lowest percentage of 89.8% (n =
97) at Level One was Parent-Teacher-Student Association.
Level Two Instructional Strategies employed by districts resulted in an average
percentage of 93.3%. The strategies at this level ranged from 87% (n = 94) to 99.1% (n = 107).
Technology is Used For Instruction was the intervention strategy employed with the highest
60
percentage of 99.1% (n = 107). The strategy employed with the lowest percentage at this level
was High School Freshman Transition Course, 77.7% (n = 84).
Level Three Alternative Schooling Strategies employed by districts resulted in an average
percentage of 95.08%. The percentages for employment of these strategies ranged from 84.3%
(n = 91) to 99.1% (n = 107). The strategy with the highest percentage included Career and
Technical Education Programs Off Campus, 99.1% (n = 107). The strategy at this level with the
lowest percentage employed was Credit Recovery, 84.3% (n = 91).
Level Four Building -Wide Strategies ranged from 88% (n = 95) to 100% (n = 108). At
this level, there were five strategies all districts employed 100% (n = 108). These included
Guidance Counseling Services, Recognition of Academic Achievement, College Fair, Academic
Planning and Counseling, and College Planning and Counseling. The strategy employed with
the lowest percentage at this level was Agency Partnerships for Family Support, 88% (n = 95).
In summary, the number of responses in the survey and the percentages of responses
resulting from the survey indicated select rural schools in NYS who belong to the RSA of NYS
employed a much higher percentage (i.e. 94.4%), of the 51 dropout intervention strategies than
those strategies not employed (i.e. 5.6%) by these districts.
Research Question Two Results: Is there a relationship between dropout intervention
strategies and graduation rates?
Question two was investigated by conducting Pearson’s Chi Square Test of Association.
Graduation rates obtained in this study were reported by districts in the study based on the 2007
cohort as identified by NYSED (P12 IRS, 2012c). Eighty-three responses of graduation rates
were reported from districts and then paired with each of the 51 intervention strategies to

61
determine if there was any relationship between graduation rates and the intervention strategies
that were either employed or not employed by the districts.
First, graduation rates of these districts were examined. Then graduation rates of these
districts were delineated into two categories for data analysis purposes: those schools with
graduation rates of greater or equal to 80% and those schools with graduations rates of less than
80%. This delineation of graduation rates resulted in 52% (n = 43) of the graduation rates
greater than or equal to 80% and 48% (n = 40) with graduation rates of less than 80%.
These graduation rates were then paired with each intervention strategy at the defined
four levels of intervention in the study. These strategies included Level One Basic Core
Strategies, Level Two Instructional Strategies; Level Three Alternative Schooling Strategies; and
Level Four Building-Wide Strategies. These strategies were examined according to those that
were employed or those that were not employed by the select rural school districts in the study.
The obtained statistical significance derived from the study was provided in the data
output. The decision was then made to determine whether or not the results of the relationships
of these variables were significant. Both the number of responses and percentages were
analyzed in this research question. The significance value was provided and included both the
number of responses and percentages for strategies paired with graduation rates of those greater
than or equal to 80% or those less than 80% in this research question. The null hypothesis for
this question was utilized. If there was a relationship between the two variables, the null
hypothesis was rejected (p < 0.05). If there was no relationship, then the null hypothesis was
retained (p > 0.05). Significance in this study included p-values ≤ 0.05. P-values from 0.05 to
0.067 were considered borderline significant.

62
The data analyses of this research question will be presented in detail by each strategy
level. These analyses include the number of responses (n) and the percentages of the responses
whose graduation rates were greater than or equal to 80%, along with those less than 80%.
These analyses also include the statistical significance of the responses for each strategy at Level
One to Level Four of those strategies employed or not employed.
Level One Basic Core Strategies. At Level One, nine basic core strategies were paired
with the 83 valid responses of graduation rates greater than or equal to 80% or less than 80% of
strategies employed or not employed by the school districts participating in the study.
At Level One, these strategies, with graduation rates of greater than or equal to 80%
included responses employed or not employed that ranged from 45.8% (n = 38) to 51.8% (n =
43). Those strategies with graduation rates of less than 80% indicated percentages of those
strategies employed that ranged from 43.4% (n = 36) to 48.2% (n = 40).
Basic Core Strategies not employed at this level when paired with graduation rates of
those greater than or equal to 80% and those less than 80% indicated responses of less than 5%.
The results of the Chi Square Test of Association for Basic Core strategies indicated
statistical outcomes that ranged from 0.297 to 0.959. The data for Level One: Basic Core
Strategies are illustrated in detail in Table 9.
In summary, Level One: Basic Core Strategies indicate the null hypotheses to be retained
at this level, as no significance was determined. The 83 schools that reported graduation rates in
the study were employing Level One intervention strategies with high percentages with
graduation rates greater than or equal to 80%, as well as those districts with graduation rates less
than 80%. Almost all of these strategies were being used by almost all school districts at this
level.

63
Table 9
Level One Basic Core Strategies – Chi Square Results for Strategies Employed and Not Employed
Employed Not employed
Strategy & Graduation rates n % n % X² p
Peer Mentoring 0.087 0.768
≥ 80% 39 47.0 4 4.8
< 80% 37 44.6 3 3.6
Adult Mentoring 0.012 0.914
≥ 80% 39 47.0 4 4.8
< 80% 36 43.4 4 4.8
Peer Academic Tutoring 0.005 0.941
≥ 80% 41 49.4 2 2.4
< 80% 38 45.8 2 2.4
Adult Academic Tutoring 0.572 0.449
≥ 80% 39 47.0 4 4.8
< 80% 38 45.8 2 2.4
Service Learning 0.143 0.705
≥ 80% 40 48.2 3 3.6
< 80% 38 45.8 2 2.4
After School Opportunities (clubs) 0.003 0.959
≥ 80% 42 50.6 1 1.2
< 80% 39 47.0 1 1.2
After School Opportunities (sports) 0.088 0.297
≥ 80% 43 51.8 0 0.0
< 80% 39 47.0 1 1.2
Parent-Teacher Conferences 0.942 0.332
≥ 80% 42 50.6 1 1.2
< 80% 40 48.2 0 0.0
Parent-Teacher-Student Association 0.057 0.812
≥ 80% 38 45.8 5 6.0
< 80% 36 43.4 4 4.8

64
Level Two Instructional Strategies. Level two included 13 instructional intervention
strategies, which were examined when paired with the 83 valid responses of graduation rates that
were greater than or equal to 80% and less than 80% of strategies employed or not employed by
the participating districts. Results of these strategies employed with graduation rates greater than
or equal to 80% indicated responses that ranged from 34.4% (n = 29) to 51.8% (n = 43). Results
of strategies employed with graduation rates of less than 80% indicated responses that ranged
from 39.8% (n = 33) to 48.2% (n = 40). When graduation rates were paired with the intervention
strategies employed with graduation rates of greater than or equal to 80% or less than 80% the
number of responses and percentages revealed similar results.
Instructional strategies at Level Two not used at this level with schools that had
graduation rates of greater than or equal to 80% ranged from 0% (n = 0) to 16.9% (n = 14).
Graduation rates of less than 80% had percentages of strategies that were not used that ranged
0% (n = 0) to 8.4% (n = 7).
One variable at Level Two, Technology Is Used for Instruction, is defined as a constant;
meaning this strategy was employed by all districts (100%) in this study with graduation rates
greater than or equal to 80% as well as graduation rates less than 80%.
The results of the Chi Square Test of Association at Level Two indicated output values
that ranged from 0.089 to 0.959. The null hypothesis, therefore, at Level Two was retained, and
therefore the data were determined not to be significant at this level.
Level Two revealed differences in the utilization of strategies that differed from Level
One. There were several identified strategies at Level One that were not employed with
graduation rates (greater than or equal to 80%) that are above 5%. At Level Two, there are
several strategies that are not employed that are above 5%. Strategies at Level Two not
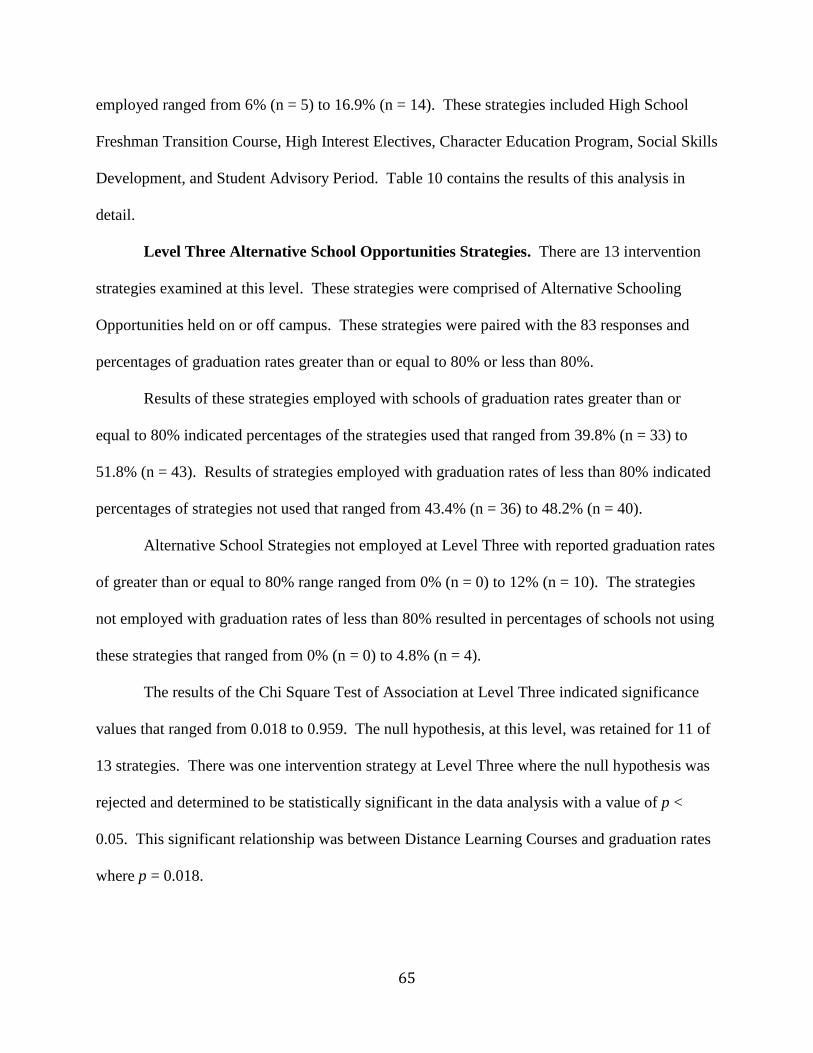
65
employed ranged from 6% (n = 5) to 16.9% (n = 14). These strategies included High School
Freshman Transition Course, High Interest Electives, Character Education Program, Social Skills
Development, and Student Advisory Period. Table 10 contains the results of this analysis in
detail.
Level Three Alternative School Opportunities Strategies. There are 13 intervention
strategies examined at this level. These strategies were comprised of Alternative Schooling
Opportunities held on or off campus. These strategies were paired with the 83 responses and
percentages of graduation rates greater than or equal to 80% or less than 80%.
Results of these strategies employed with schools of graduation rates greater than or
equal to 80% indicated percentages of the strategies used that ranged from 39.8% (n = 33) to
51.8% (n = 43). Results of strategies employed with graduation rates of less than 80% indicated
percentages of strategies not used that ranged from 43.4% (n = 36) to 48.2% (n = 40).
Alternative School Strategies not employed at Level Three with reported graduation rates
of greater than or equal to 80% range ranged from 0% (n = 0) to 12% (n = 10). The strategies
not employed with graduation rates of less than 80% resulted in percentages of schools not using
these strategies that ranged from 0% (n = 0) to 4.8% (n = 4).
The results of the Chi Square Test of Association at Level Three indicated significance
values that ranged from 0.018 to 0.959. The null hypothesis, at this level, was retained for 11 of
13 strategies. There was one intervention strategy at Level Three where the null hypothesis was
rejected and determined to be statistically significant in the data analysis with a value of p <
0.05. This significant relationship was between Distance Learning Courses and graduation rates
where p = 0.018.
66
Table 10
Level Two Instructional Strategies – Chi Square Results for Strategies Employed and Not Employed
Employed Not employed
Strategy & Graduation rates n % n % X² p
Differentiated Instruction 1.906 0.167
≥ 80% 41 49.4 2 2.4
< 80% 40 40.0 0 0.0
Project Based Learning 2.895 0.089
≥ 80% 40 48.2 3 3.6
< 80% 40 48.2 0 0.0
Collaborative Learning 0.942 0.332
≥ 80% 42 50.6 1 1.2
< 80% 40 48.2 0 0.0
Integration of Technology 1.088 0.297
≥ 80% 43 51.8 0 0.0
< 80% 39 47.0 1 1.2
Students Taught Technology 0.003 0.959
≥ 80% 42 50.6 1 1.2
< 80% 39 47.0 1 1.2
Technology is used for Instruction Constant
≥ 80% 43 51.8 0 0.0
< 80% 40 48.2 0 0.0
High School Freshman Transition
Course
2.486 0.115
≥ 80% 29 34.4 14 16.9
< 80% 33 39.8 7 8.4
High Interest Electives 1.179 0.278
≥ 80% 38 45.8 5 6.0
< 80% 38 45.8 2 2.4
Character Education Program 0.405 0.524
≥ 80% 38 45.8 5 6.0
< 80% 37 44.6 3 3.6
Social Skills Development 0.771 0.399
≥ 80% 36 43.4 7 8.4
< 80% 36 43.4 4 4.8
College & Career Readiness 0.425 0.514
≥ 80% 42 50.6 1 1.2
< 80% 38 45.8 2 2.4
Student Advisory Period 0.711 0.399
≥ 80% 36 43.4 7 8.4
< 80% 36 43.4 4 4.8
Response to Intervention 2.895 0.089
≥ 80% 40 48.2 3 3.6
< 80% 40 48.2 0 0.0

67
There was one intervention strategy that resulted in a value of p= 0.067; the value of
0.067 in this study is considered to exhibit borderline significance. This strategy included
Alternative Education (off Campus). Therefore the null hypothesis for this strategy was rejected
and a relationship between graduation rates and Alternative Education (Off Campus) exists.
The detailed analysis of this data is located in Table 11.
Level Four Building-Wide Strategies. At this level, 16 intervention strategies related to
building-wide interventions were paired with the 83 school district responses of graduation rates
that were greater than or equal to 80% and those less than 80% of those strategies employed or
not employed by the school districts participating in the study.
Results of these strategies employed with graduation rates of greater than or equal to 80%
indicated responses that ranged from 42.2% (n = 35) to 51.8% (n = 43). Results of strategies
employed with graduation rates of less than 80% indicated percentages that ranged from 41% (n
= 34) to 48.2% (n = 40). Strategies school districts did not use at this level with graduation rates
of greater than or equal to 80% ranged from 0% (n = 0) to 9.6% (n = 8). Strategies not employed
by districts with a graduation rate of less than 80% ranged from 0% (n = 0) to 7.2% (n = 6).
The Chi Square association analysis at Level Four indicated five intervention strategies
that remained a constant. This result was attributed to all school districts in the study employing
these intervention strategies with reported graduation rates greater than or equal to 80 % and
those less than 80%. These intervention strategies included Guidance Counseling Services,
Recognition of Academic Achievement, College Fair, Academic Planning and Counseling, and
College Planning and Counseling.

68
Table 11 Level Three Alternative Schooling Strategies – Chi Square Results for Strategies Employed and Not Employed
Employed Not employed
Strategy & Graduation rates n % n % X² p
Career & Technology Education
(In House) 0.008 0.927
≥ 80% 40 48.2 3 3.6
< 80% 37 44.6 3 3.6
Career & Technology Education
(Off Campus) 0.942 0.332
≥ 80% 42 50.6 1 1.2
< 80% 40 48.2 0 0
Smart Scholars 0.003 0.959
≥ 80% 42 50.6 1 1.2
< 80% 39 47 1 1.2
BOCES New Visions 2.203 0.138
≥ 80% 43 51.8 0 0
< 80% 38 45.8 2 2.4
International Baccalaureate 0.275 0.600
≥ 80% 41 49.4 2 2.4
< 80% 39 47 1 1.2
Advanced Placement 2.895 0.089
≥ 80% 40 48.2 3 3.6
< 80% 40 48.2 0 0
University in High School courses 1.906 0.167
≥ 80% 41 49.4 2 2.4
< 80% 40 48.2 0 0
Credit Recovery 2.597 0.107
≥ 80% 33 39.8 10 12
< 80% 36 43.4 4 4.8
Summer School 1.088 0.297
≥ 80% 43 51.8 0 0
< 80% 39 47 1 1.2
Project Lead the Way 0.904 0.341
≥ 80% 40 48.2 3 3.6
< 80% 39 47 1 1.2
Distance Learning Courses 5.559 0.018
≥ 80% 35 42.2 8 9.6
< 80% 39 47 1 1.2
Alternative Education (Off Campus) 3.346 0.067
≥ 80% 43 51.8 0 0
< 80% 37 44.6 3 3.6
Early College Admission 0.003 0.959
≥ 80% 42 50.6 1 1.2
< 80% 39 47 1 1.2
69
The results of the Chi Square Test of Association at Level Four indicated significance
values that ranged from 0.061 to 0.941. At Level Four, the null hypothesis was retained for 14
intervention strategies. Two Building-Wide Strategies resulted in a value of p = 0.061; the value
of p = 0.061 in this study is considered to exhibit borderline significance. These strategies
included College Fair and Instructional Team Planning. Therefore the null hypothesis for these
two strategies was rejected, and these two variables were determined to indicate a relationship
between reported graduation rates and these two intervention strategies exists. The detailed
analyses of this data are presented in Table 12.
Summary of research question two. Pearson’s Chi Square Test of Association was
used to determine if there was a relationship between reported graduation rates from school
districts and the 51 intervention strategies identified in this study. These graduation rates were
divided into two categories of those greater than or equal to 80% and those graduation rates of
less than 80%. These 83 graduation rates were reported from school districts that participated in
the survey. The significance value was provided in the data output. Both the number of
responses and percentages were analyzed for this research question. The variables were then
determined to be either independent (p > 0.05 – not significant) or dependent (p < 0.05 –
significant) based on the null hypothesis.
The number of responses and percentages of the strategies school districts used were
obtained and examined at each of the four strategy levels. The percentage of these strategies
utilized in districts, when associated with graduation rates greater than or equal to 80%, ranged
from 34.4% to 51.8%. The percentage of these strategies utilized in districts, when associated
with graduation rates less than 80%, ranged from 39.8% to 48.2%.

70
Table 12
Level Four Building Wide Strategies – Chi Square Results for Strategies Employed and Not Employed
Employed Not employed
Strategy & Graduation rates n % n % X² p
Vision / Mission 0.143 0.705
≥ 80% 40 48.2 3 3.6
< 80% 38 45.8 2 2.4
Goals for Learning 1.906 0.167
≥ 80% 41 49.4 2 2.4
< 80% 40 48.2 0 0.0
Data Analysis 0.425 0.514
≥ 80% 42 50.6 1 1.2
< 80% 38 45.8 2 2.4
Guidance Counseling Constant
≥ 80% 43 51.8
< 80% 40 48.2
Social Worker Counseling 0.015 0.903
≥ 80% 38 45.8 5 6.0
< 80% 35 42.2 5 6.0
Job Shadowing 0.635 0.426
≥ 80% 39 47.0 4 4.8
< 80% 34 41.0 6 7.2
Attendance Policy 0.005 0.941
≥ 80% 41 49.4 2 2.4
< 80% 38 45.8 2 2.4
Recognition of Academic Achievement Constant
≥ 80% 43 51.8
< 80% 40 48.2
College Fair Constant
≥ 80% 43 51.8
< 80% 40 48.2
Career Fair 3.520 0.061
≥ 80% 37 44.6 6 7.2
< 80% 39 47.0 1 1.2
Pupil Study Team / Child Study Team 0.905 0.341
≥ 80% 40 48.2 3 3.6
< 80% 39 47.0 1 1.2
Academic Planning Counseling Constant
≥ 80% 43 51.8
< 80% 40 48.2
College Planning Counseling Constant
≥ 80% 43 51.8
< 80% 40 48.2
Career Planning Counseling 0.942 0.332
≥ 80% 42 50.6 1 1.2
< 80% 40 48.2 0 0.0 3.52 0.061
Instructional Team Planning
≥ 80% 37 44.6 6 7.2
< 80% 39 47.0 1 1.2
Agency Partnerships for Family Support 2.223 0.136
≥ 80% 35 42.2 8 9.6
< 80% 37 44.6 3 3.6

71
Those strategies not employed in districts that have graduation rates greater than or equal
to 80% ranged from 0% to 16.9%, and those strategies not employed in districts of graduation
rates of less than 80% ranged from 0% - 8.4%.
In this study almost all districts with graduation rates greater than or equal to 80% or less
than 80% employed intervention strategies at Level One, Level Two, Level Three, and Level
Four.
This study revealed six intervention strategies that were employed by all districts with
graduation rates greater than or equal to 80% and those with graduation rates of less than 80%.
This output is defined as a constant. These strategies included: Technology is used for
instruction (Level Two Instructional Strategies); and Guidance Counseling Services, Recognition
of Academic Achievement, Career Fair, Academic Planning, and College Planning (Level Four
Building-Wide Strategies).
There were other significant findings in this study. Distance Learning Courses was
determined to be significant at Level Three, p = 0.018. Two additional strategies were
determined to exhibit borderline significance. The significance of these strategies, College Fair
and Instructional Team Planning, resulted in p = 0.061.
The investigation of the research conducted in question two, which sought to determine a
relationship between graduation rates and intervention strategies concluded there was a
significant relationship between graduation rates and four intervention strategies: Distance
Learning, Career Fair, Alternative Education (off Campus), and Instructional Team Planning.

72
Research Question Three Results: Is there any association between graduation rates and
the choice of specific intervention strategies and the following demographic variables: size
of school, experience of the administrator, type of schedule, building configuration, and
type of rural school district?
The Pearson Chi Square Test of Association was used to analyze data for this question.
Graduation rates of the districts in the study and each of the 51 intervention strategies (described
in chapter 3) were examined against each demographic feature to determine if any association
existed between graduation rates, intervention strategies, and demographic features when the
intervention strategies were employed or not employed by participating districts in the study by
employing the null hypothesis.
Graduation rates of the participating districts were delineated into two categories: those
schools with graduation rates of greater or equal to 80% and those schools with graduations rates
of less than 80%. This delineation of graduation rates resulted in 52% (n = 43) of the graduation
rates greater than or equal to 80% and 48% (n = 40) of schools with graduation rates of less than
80%.
An example of one set of the variables used for analyses is as follows: graduation rates,
intervention strategy, and demographic feature. This type of analyses was conducted on each of
the 51 intervention strategies and each of the five demographic features to include: building
enrollment, building configuration, type of rural school, type of schedule, and administrative
experience.
The obtained Asymptotic (statistical) significance derived from the study was provided in
the data output from SPSS version 21. The Chi Square values and significance of the five
demographic considerations and intervention strategies paired with graduation rates of those
73
greater than or equal to 80% or those less than 80% were analyzed in this research question. The
variables were then determined to be either independent (p > 0.05 – not significant) or dependent
(p < 0.05 – significant) based on the null hypothesis. This determination of significance was
based on the results of the null hypothesis that held there was no relationship between graduation
rates, the 51 intervention strategies, and demographic considerations. If there was a relationship
between the three variables, the null hypotheses of p > 0.05 would be rejected, and the value of p
< 0.05 would indicate a relationship between graduation rates, intervention strategies, and
demographic considerations; therefore, the null hypothesis would be rejected and the data would
be considered significant. Both the number of responses and percentages were analyzed in this
research question. Significance included p-values ≤ 0.05. P-values from 0.05 to 0.067 were
considered borderline significant. The detailed results of this analysis, including graduation rates
greater than or equal to 80%, and those less than 80% are located in Appendix F.
Research question 3a: Building enrollment. Is there any association between
graduation rates, intervention strategies, and building enrollment? For the purposes of the
analyses in this research question building enrollment was delineated into three categories: low,
average, and high. Enrollment was considered low with numbers of students ranging from 0 –
399. Average enrollment was defined as numbers of students ranging from 400 – 500. High
enrollment ranged from 501 – 1700 students.
When analyzing this data set of building enrollment paired with graduation rates and
intervention strategies, the output values for Level One, nine Basic Core strategies ranged from
0.296 to 0.958. There was no statistical significance revealed when Level One strategies and
graduation rates in buildings when low, average, or high enrollment were analyzed; therefore the
null hypothesis was retained (see Appendix G).
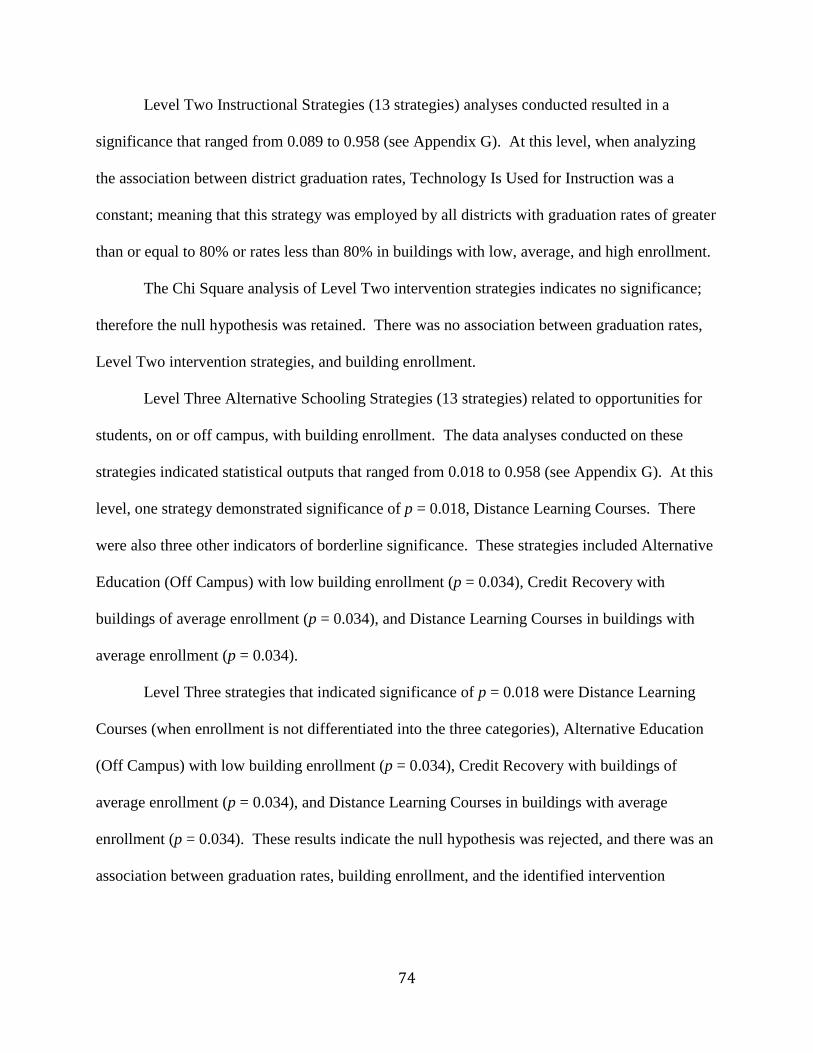
74
Level Two Instructional Strategies (13 strategies) analyses conducted resulted in a
significance that ranged from 0.089 to 0.958 (see Appendix G). At this level, when analyzing
the association between district graduation rates, Technology Is Used for Instruction was a
constant; meaning that this strategy was employed by all districts with graduation rates of greater
than or equal to 80% or rates less than 80% in buildings with low, average, and high enrollment.
The Chi Square analysis of Level Two intervention strategies indicates no significance;
therefore the null hypothesis was retained. There was no association between graduation rates,
Level Two intervention strategies, and building enrollment.
Level Three Alternative Schooling Strategies (13 strategies) related to opportunities for
students, on or off campus, with building enrollment. The data analyses conducted on these
strategies indicated statistical outputs that ranged from 0.018 to 0.958 (see Appendix G). At this
level, one strategy demonstrated significance of p = 0.018, Distance Learning Courses. There
were also three other indicators of borderline significance. These strategies included Alternative
Education (Off Campus) with low building enrollment (p = 0.034), Credit Recovery with
buildings of average enrollment (p = 0.034), and Distance Learning Courses in buildings with
average enrollment (p = 0.034).
Level Three strategies that indicated significance of p = 0.018 were Distance Learning
Courses (when enrollment is not differentiated into the three categories), Alternative Education
(Off Campus) with low building enrollment (p = 0.034), Credit Recovery with buildings of
average enrollment (p = 0.034), and Distance Learning Courses in buildings with average
enrollment (p = 0.034). These results indicate the null hypothesis was rejected, and there was an
association between graduation rates, building enrollment, and the identified intervention

75
strategies of Distance Learning Courses, Credit Recovery, and Alternative Education (Off
Campus).
Level Four Building-Wide Strategies, 16 intervention strategies were analyzed with
district graduation rates greater than or equal to 80% and graduation rates less than 80%, and
building enrollment. The levels of analyses on these Building - Wide Strategies ranged from
0.061 to 0.939 (see Appendix G). There were two strategies at this level that were identified as
borderline significant, Career Fair and Instructional Team Planning, with a value of p = 0.061
(when enrollment was not divided into the three categories).
These results indicated the null hypothesis was rejected and the variables were
determined to be dependent, indicating an association between graduation rates, building
enrollment, and the three identified intervention strategies of Job Shadowing, Career Fair, and
Instructional Team Planning, exist at Level Four.
Research question 3b: Administrative experience. Is there any association between
graduation rates, intervention strategies, and administrative experience? Administrative
experience of the participants in the study ranged from one year of experience to 28 years of
experience. An administrator’s experience was divided into three categories. These categories
included 1 – 5 years of experience defined as low, 6 – 14 years of experience defined as average,
and 15 – 28 years of experience defined as high.
Analyses of the nine Level One Basic Core strategies, for the purposes of determining
whether an association existed between reported district graduation rates, intervention strategies,
and administrative experience, output values ranged from 0.051 to 0.959 (see Appendix G). The
null hypothesis, at Level One, is retained as there was no statistical significance determined at
this level.

76
Level Two Instructional Strategies (13) indicated output values that ranged from 0.051 to
0.959 (see Appendix G). There were two strategies determined to have significance at this level
when administrative experience was considered with average years of experience; these were
Project Based Learning (p = 0.052) and High School Freshman Transition Course (p = 0.051).
There was one strategy analyzed as a constant at this level. Technology is Used for Instruction
was used by all districts with graduation rates greater than or equal to 80% or those less than
80% when strategies were employed.
The null hypothesis at this level is not rejected except for two strategies determined to
have significance at this level when average administrative experience was considered; these
were Project Based Learning (p = 0.052) and High School Freshman Transition Course (p =
0.051).
Analyzing the data set of the 13 Level Three Alternative Schooling Strategies, in
conjunction with district reported graduation rates and administrative experience, resulted in a
statistical values that ranged from 0.018 to 0.959 (see Appendix G). There was a statistical
significance of p = 0.018 when Distance Learning Courses was not separated among the three
categories of experience. There was also a significance level of p = 0.033 that resulted with low
administrative experience. Therefore, the null hypothesis at this level was not rejected, with the
exception of Distance Learning Courses. The null hypothesis was rejected with Distance
Learning Courses, as there was an association determined between graduation rates, Distance
Learning Courses, and administrative experience.
Data analyzed at Level Four Building-Wide Strategies (16) in conjunction with district
reported graduation rates and administrative experience resulted in statistical values that ranged
from 0.023 to 0.941 (see Appendix G). There were several strategies that indicated significance

77
at Level Four. Two intervention strategies indicated significance with average years of
administrative experience: Career Fair (p = 0.052) and Instructional Team Planning (p = 0.023).
Career Fair also demonstrated significance with a high level of administrative experience (p =
0.061). Two strategies, Career Fair and Instructional Team Planning, were determined to be
borderline significant, p = 0.061, when administrative experience was not divided into the three
categories (low, average, and high).
Strategies that indicated statistical significance with average administrative experience
were Career Fair (p = 0.052) and Instructional Team Planning (p = .023). When administrative
experience was not separated into the three categories, Career Fair (p =0.061) and Instructional
Team Planning (p = 0.061) indicated borderline significance. The null hypothesis was rejected,
and an association between district reported graduation rates, the intervention strategies of
Career Fair and Instructional Team Planning, and administrative experience was determined to
exist.
There were five strategies at Level Four that indicated a statistical outcome defined as a
constant. This means that all of these intervention strategies were employed by districts with
graduation rates greater than or equal to 80% and those with less than 80%. These intervention
strategies included: Guidance Counseling Services, College Fair, Recognition of Academic
Achievement, Academic Planning and Counseling, and College Planning and Counseling.
Research question 3c: Type of schedule. Is there any association between
graduation rates, intervention strategies, and type of schedule? The different types of
schedules used in the schools in the study were divided into three categories: a block schedule
(an approximate 80 minute period), a traditional schedule (an approximate 40 minute period),

78
and a mixed schedule (block & traditional). There were seven schools in the study that indicated
they used a block schedule, five used a mixed schedule, and 96 used a traditional schedule.
When analyzing the nine intervention strategies at Level One Basic Core Strategies for
the purposes of determining whether or not there existed an association between graduation rates,
intervention strategies, and type of schedule, the statistical output values ranged from 0.297 to
0.959 (see Appendix G). There were no significant statistical values determined at this level;
therefore, the null hypothesis was retained.
Level Two Instructional Strategies (13) analyzed indicated statistical output values that
ranged from 0.089 to 0.959 (see Appendix G). There were no strategies determined to be of
statistical significance at this level. Therefore the null hypothesis at this level was retained.
There was one strategy, Technology is Used for Instruction, that was considered a constant at
this level, indicating this strategy was employed by all districts with graduation rates greater than
or equal to 80% and those less than 80%.
Analyses of Level Three Alternative Schooling Strategies data of graduation rates, type
of schedule, and 13 intervention strategies obtained results that ranged from 0.016 to 0.959 (see
Appendix G). The strategy of Distance Learning Courses indicated a significance level of p =
0.016 when associated with a traditional schedule, and when it was not divided into the three
types of school schedules, a significance of p = 0.018 resulted. Alternative Education (off
campus) (p = 0.067) was also considered borderline significant when no differentiation of the
type of schedule was considered.
The null hypothesis at this level was not rejected with the exception of the following:
Distance Learning Courses when a traditional schedule was utilized (p = 0 .016), when no
separation of the three categories was considered For Distance Learning Courses (p = 0.018), and
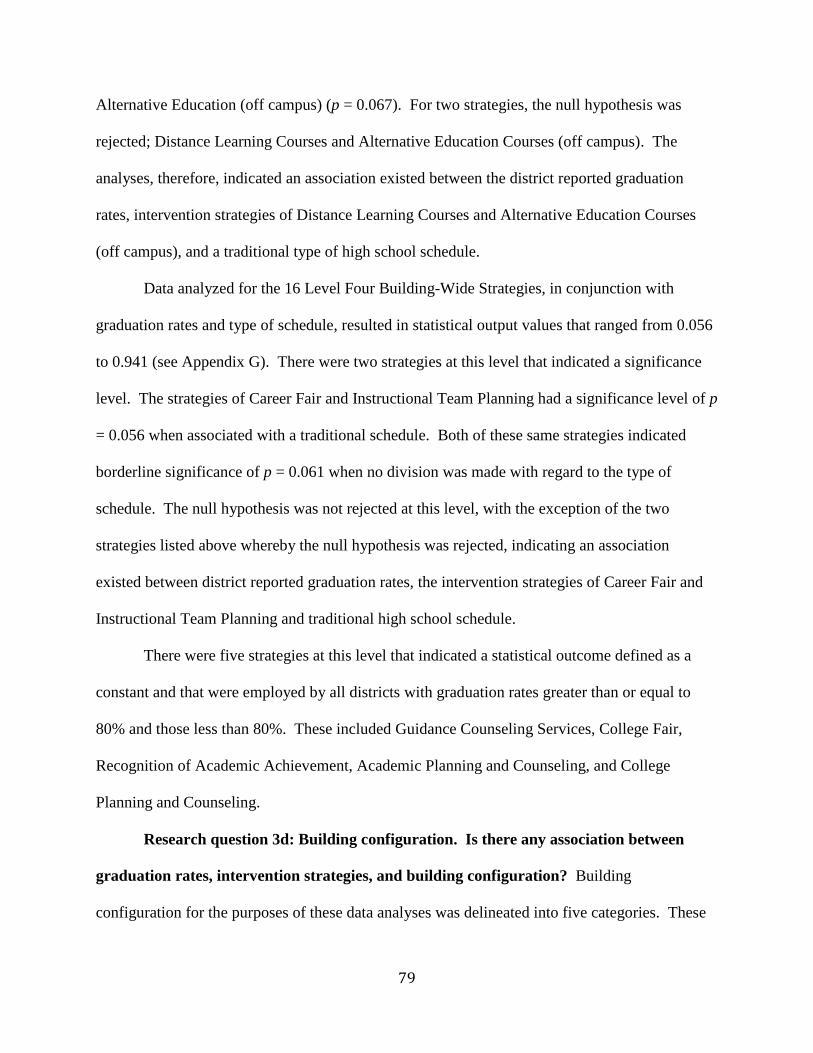
79
Alternative Education (off campus) (p = 0.067). For two strategies, the null hypothesis was
rejected; Distance Learning Courses and Alternative Education Courses (off campus). The
analyses, therefore, indicated an association existed between the district reported graduation
rates, intervention strategies of Distance Learning Courses and Alternative Education Courses
(off campus), and a traditional type of high school schedule.
Data analyzed for the 16 Level Four Building-Wide Strategies, in conjunction with
graduation rates and type of schedule, resulted in statistical output values that ranged from 0.056
to 0.941 (see Appendix G). There were two strategies at this level that indicated a significance
level. The strategies of Career Fair and Instructional Team Planning had a significance level of p
= 0.056 when associated with a traditional schedule. Both of these same strategies indicated
borderline significance of p = 0.061 when no division was made with regard to the type of
schedule. The null hypothesis was not rejected at this level, with the exception of the two
strategies listed above whereby the null hypothesis was rejected, indicating an association
existed between district reported graduation rates, the intervention strategies of Career Fair and
Instructional Team Planning and traditional high school schedule.
There were five strategies at this level that indicated a statistical outcome defined as a
constant and that were employed by all districts with graduation rates greater than or equal to
80% and those less than 80%. These included Guidance Counseling Services, College Fair,
Recognition of Academic Achievement, Academic Planning and Counseling, and College
Planning and Counseling.
Research question 3d: Building configuration. Is there any association between
graduation rates, intervention strategies, and building configuration? Building
configuration for the purposes of these data analyses was delineated into five categories. These

80
categories included pre-kindergarten through grade 12 (P-12), 25 schools; kindergarten through
grade 12 (K-12), 12 schools; grades 9 through 12 (9-12), 34 schools; grades 6 through 12 (jr./sr.
high school), 31 schools; and middle schools, 6 schools.
When analyzing the data set for the nine Level One, Basic Core Strategies significance
ranged from 0.047 to 0.959 (see Appendix G). There was one strategy that was considered
significant with a K-12 building configuration: Adult Mentoring, with a significance of p =
0.047. Peer mentoring was considered borderline significant with p = 0.060 in a 9-12 building
configuration.
The null hypotheses were not rejected at Level One with the exception of the two
strategies whereby the null hypothesis was rejected, indicating an association of the variables of
Adult Mentoring (p = 0.047) in a K-12 building and Peer Mentoring (p = 0.060) in a 9-12
building.
Level Two Instructional Strategies (13) analyzed indicated significance that ranged from
0.089 to 0.959 (see Appendix G). There were no strategies determined to be of significance at
this level. Therefore the null hypothesis was retained. There was one strategy at this level,
Technology is Used for Instruction, which was employed by all school districts with graduation
rates greater than or equal to 80% or less than 80%.
Level Three Alternative Schooling Strategies (13), when paired with graduation rates and
type of school schedule, indicated significance that ranged from 0.018 to 0.959 (see Appendix
G). There was one strategy that demonstrated significance with a K-12 building configuration.
This included Career and Technical Education Courses (In House) with a significance of p =
0.047. The intervention strategy of Distance Learning Courses at this level indicated a statistical

81
significance of p = 0.018 when no separation of the types of building configuration were
considered.
The null hypothesis for Level Three Strategies was not rejected. There were, however,
two strategies, Career and Technical Education (In House) (p = 0.047) and Distance Learning
Courses (p = 0.018), where the null hypothesis was rejected and considered significant.
Data analyzed at Level Four Building-Wide Strategies (16) with graduation rates and
building configuration resulted in statistical output values that ranged from 0.060 to 0.941 (see
Appendix G). The strategy, Instructional Team Planning, indicated a borderline significance of p
= 0.060 in a 9-12 setting. When analyzing reported graduation rates, the strategy of Instructional
Team Planning, with no differentiation of building configuration, a borderline significance of p =
0.061 resulted. The null hypothesis for Level Four was not rejected except for the strategy of
Instructional Team Planning. The null hypothesis was rejected for Instructional Team Planning
where this variable is determined to have an association with a 9-12 building and when no
differentiation of building configuration is considered.
Level Four resulted in five intervention strategies defined as a constant. These strategies
were employed by all districts with the defined graduation rates in the study. These intervention
strategies included Guidance Counseling Services, College Fair, Recognition of Academic
Achievement, Academic Planning and Counseling, and College Planning and Counseling.
Research question 3e: Type of rural school. Is there any association between
graduation rates, intervention strategies, and type of rural school? Schools in this study
were categorized as distant (51 schools), fringe (10 schools), or remote (41 schools). Three
schools in the study identified themselves as rural.

82
The statistical values ranged from 0.039 to 0.959 for the nine Level One Basic Core
Strategies for the purposes of determining whether or not there existed an association between
reported graduation rates, intervention strategies, and type of rural school. The null hypothesis
was retained for eight of the strategies for Level One. There was one strategy which
demonstrated statistical significance at this level. This included Parent-Teacher-Student
Association with a significance of p = 0.039, for schools defined as remote.
The 13 Level Two Instructional Strategies analyzed ranged from 0.089 to 0.959 (see
Appendix G). There were no strategies determined to be statistically significant at this level.
This result was similar to the other four demographic features in the study of building size,
building configuration, administrative experience, and type of schedule. There was one strategy
that was identified as a constant in the other four demographic features that was also identified as
a constant in this demographic of type of rural school, Technology is Used for Instruction. This
intervention strategy was employed by all districts with graduation rates greater than or equal to
80% and those with less than 80%. The null hypothesis was retained for Level One strategies,
indicating there was no statistical significance for the nine intervention strategies.
The values ranged from 0.012 to 0.959 for the thirteen Level Three Alternative Schooling
Strategies in conjunction with reported graduation rates and type of rural schools (see Appendix
G). There was one strategy that demonstrated significance when defined as a distant rural
school: Credit Recovery with a significance of p = 0.012. The intervention strategy of Distance
Learning Courses, graduation rates, and type of rural school and Alternative Education Programs
(Off Campus) indicated a significance of p = 0.018 when no differentiation of the type of rural
school was considered.

83
The null hypothesis was not rejected at Level Three for ten intervention strategies. The
null hypothesis was rejected for three intervention strategies: Credit Recovery p = 0.012,
Distance Learning Courses p = 0.018, and Alternative Education Programs (Off Campus) p =
0.067 (borderline significance). An association is determined to exist between reported
graduation rates, Distance Learning Courses, Credit Recovery, Alternative Education (off
campus) and type of rural school.
Data analyzed for the sixteen Level Four Building-Wide Strategies in conjunction with
graduation rates and rural schools, resulted in statistical values that ranged from 0.061 to 0.941
(see Appendix G). The strategies Career Fair and Instructional Team Planning indicated
borderline significance of p = 0.061 when there was no differentiation of the type of rural school
was considered. The null hypothesis was not rejected, except for Career Fair and Instructional
Team Planning. The analyses indicated an association existed between reported graduation rates,
Career Fair, Instructional Team Planning, and type of rural school.
Level Four strategies indicated a statistical outcome defined as a constant for five
strategies. These five intervention strategies were employed by all districts with graduation rates
greater than or equal to 80% and those with graduation rates of less than 80%. These
interventions included Guidance Counseling Services, College Fair, Recognition of Academic
Achievement, Academic Planning and Counseling, and College Planning and Counseling.
Summary of research questions 3a-3e. Question three focused on examining the
association of graduation rates, 51 intervention strategies, and five demographic features which
included building enrollment, administrative experience, type of high school schedule, building
configuration, and type of rural school. The results of this Chi Square test of Association
revealed significance or an association in the study amongst reported graduation rates,
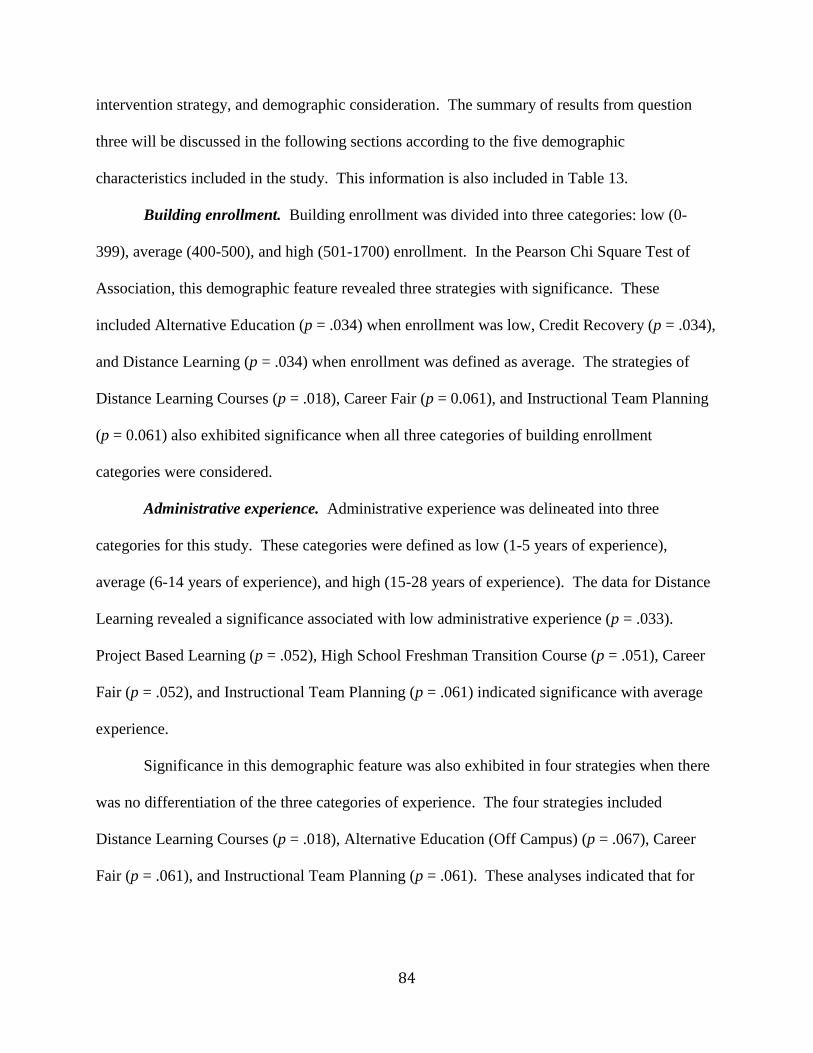
84
intervention strategy, and demographic consideration. The summary of results from question
three will be discussed in the following sections according to the five demographic
characteristics included in the study. This information is also included in Table 13.
Building enrollment. Building enrollment was divided into three categories: low (0-
399), average (400-500), and high (501-1700) enrollment. In the Pearson Chi Square Test of
Association, this demographic feature revealed three strategies with significance. These
included Alternative Education (p = .034) when enrollment was low, Credit Recovery (p = .034),
and Distance Learning (p = .034) when enrollment was defined as average. The strategies of
Distance Learning Courses (p = .018), Career Fair (p = 0.061), and Instructional Team Planning
(p = 0.061) also exhibited significance when all three categories of building enrollment
categories were considered.
Administrative experience. Administrative experience was delineated into three
categories for this study. These categories were defined as low (1-5 years of experience),
average (6-14 years of experience), and high (15-28 years of experience). The data for Distance
Learning revealed a significance associated with low administrative experience (p = .033).
Project Based Learning (p = .052), High School Freshman Transition Course (p = .051), Career
Fair (p = .052), and Instructional Team Planning (p = .061) indicated significance with average
experience.
Significance in this demographic feature was also exhibited in four strategies when there
was no differentiation of the three categories of experience. The four strategies included
Distance Learning Courses (p = .018), Alternative Education (Off Campus) (p = .067), Career
Fair (p = .061), and Instructional Team Planning (p = .061). These analyses indicated that for
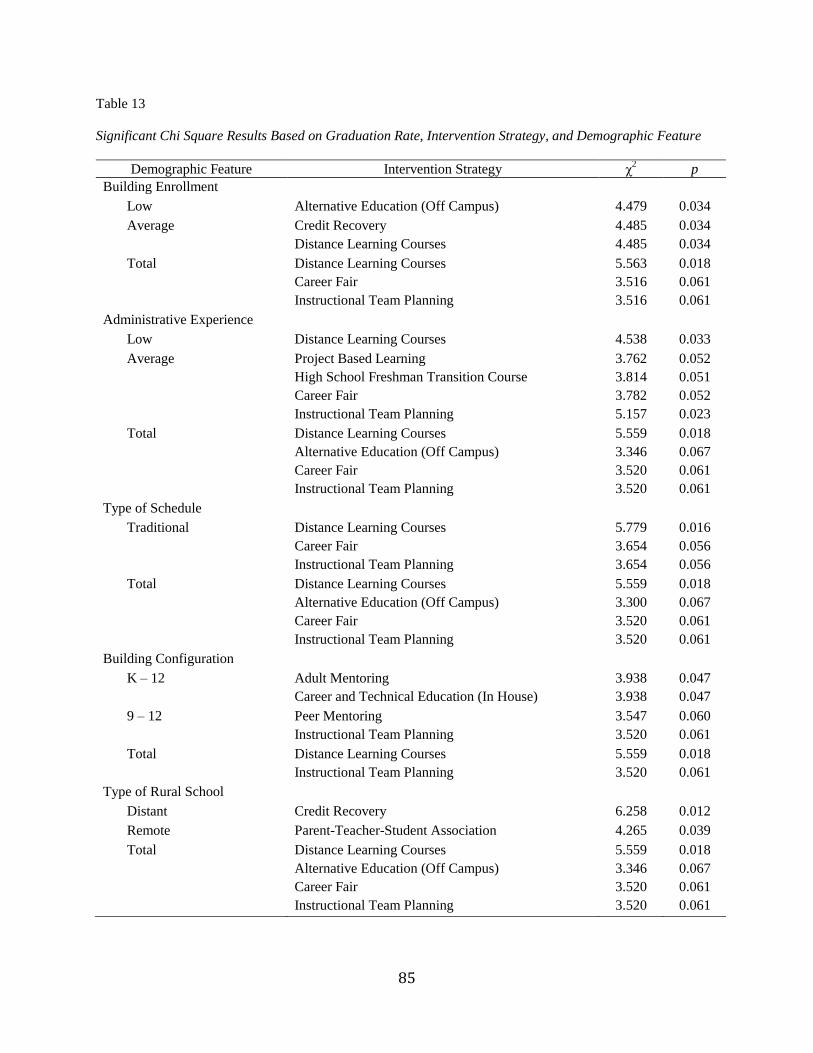
85
Table 13
Significant Chi Square Results Based on Graduation Rate, Intervention Strategy, and Demographic Feature
Demographic Feature Intervention Strategy χ2 p
Building Enrollment
Low Alternative Education (Off Campus) 4.479 0.034
Average Credit Recovery
Distance Learning Courses
4.485
4.485
0.034
0.034
Total Distance Learning Courses
Career Fair
Instructional Team Planning
5.563
3.516
3.516
0.018
0.061
0.061
Administrative Experience
Low Distance Learning Courses 4.538 0.033
Average Project Based Learning
High School Freshman Transition Course
Career Fair
Instructional Team Planning
3.762
3.814
3.782
5.157
0.052
0.051
0.052
0.023
Total Distance Learning Courses
Alternative Education (Off Campus)
Career Fair
Instructional Team Planning
5.559
3.346
3.520
3.520
0.018
0.067
0.061
0.061
Type of Schedule
Traditional Distance Learning Courses
Career Fair
Instructional Team Planning
5.779
3.654
3.654
0.016
0.056
0.056
Total Distance Learning Courses
Alternative Education (Off Campus)
Career Fair
Instructional Team Planning
5.559
3.300
3.520
3.520
0.018
0.067
0.061
0.061
Building Configuration
K – 12 Adult Mentoring
Career and Technical Education (In House)
3.938
3.938
0.047
0.047
9 – 12 Peer Mentoring
Instructional Team Planning
3.547
3.520
0.060
0.061
Total Distance Learning Courses
Instructional Team Planning
5.559
3.520
0.018
0.061
Type of Rural School
Distant Credit Recovery 6.258 0.012
Remote Parent-Teacher-Student Association 4.265 0.039
Total Distance Learning Courses
Alternative Education (Off Campus)
Career Fair
Instructional Team Planning
5.559
3.346
3.520
3.520
0.018
0.067
0.061
0.061

86
these strategies an association existed between reported graduation rates, the four intervention
strategies, and administrative experience.
Type of schedule. The different types of schedules examined in the study included a
block schedule, a mixed schedule (block & traditional), and a traditional schedule. The data
analyses did not discern any significance when employing a block or mixed schedule. In a
traditional schedule, however, there were three strategies that exhibited significance. These
included Distance Learning Courses (p =.018), Career Fair (p = .052), and Instructional Team
Planning (p = .056).
Significance was also determined for the following strategies when no differentiation of
the three types of building schedule was taken into consideration. These included Distance
Learning Courses (p = .018), Alternative Education (Off Campus) (p = .067), Career Fair (p =
.061), and Instructional Team Planning (p = .061). This significance indicated an association
existed between reported graduation rates, the four intervention strategies, and types of schedule.
Building configuration. There were five school building configurations examined in this
study. These configurations included P-12, K-12, 9-12, jr./sr. high school, and middle school. In
the data analysis, there was no association of reported graduation rates and intervention strategies
determined in P – 12 schools. Two strategies indicated significance in K-12 schools. These
strategies were Adult Mentoring (p = .047) and Career and Technical Education Programs (In
House) (p = .047). Two strategies, Peer Mentoring (p = .060) and Instructional Team Planning
(p = .061), were considered to be borderline significant in 9-12 schools. There were no strategies
determined to be significant in middle schools and jr./sr. high schools.
Significance in building configuration was determined in Distance Learning Courses (p =
.018) and borderline significance for Instructional Team Planning (p = .061) was determined

87
when building configuration was not divided into the five categories. This study, therefore,
determined an association existed between reported graduation rates, Distance Learning Courses,
Instructional Team Planning, and building configuration.
Type of rural school. Schools in this study were categorized as distant, fringe, and
remote. Significance (p = .012) was evidenced with the strategy Credit Recovery programs in
schools characterized as distant. Parent-Teacher-Student Association was defined as significant
(p = .018) in schools that were considered remote. Significance was also determined when no
differentiation of the three types of rural schools were considered. This included the significance
of Distance Learning Courses (p = .018) and the borderline significance of Alternative
Education-off Campus (p = .067), Career Fair (p = .061), and Instructional Team Planning (p =
.061). This study determined an association existed between reported graduation rates, the
intervention strategies named when the type of rural school was considered distant, remote, and
when no differentiation of type of rural district was made.
Research question three conclusion. After examining statistical significance without
differentiation of the demographic features, one variable, was considered significant. Distance
Learning Courses (Level Three Instructional Strategies), was considered significant (p = 0.018)
in all five demographic features. Distance Learning was also identified in research question two
as being significant (p = 0.018), and determined to have an association with reported graduation
rates.
Instructional Team Planning (Level Four Building-Wide Strategies) was considered
borderline significant, (p = .061) when associated with graduation rates in four demographic
categories: administrative experience, type of schedule, building configuration, and type of rural
school. Career Fair (Level Four Building -Wide Strategies) was identified as being borderline

88
significant (p = .061) when associated with graduation rates in three demographic categories:
administrative experience, type of schedule, and type of rural school. Alternative Education (Off
Campus), (Level Three Instructional Strategies) was also identified as borderline significant (p =
.067) when associated with graduation rates, administrative experience, type of schedule, and
type of rural school.
There were six strategies identified as a constant, in the analyses of association between
graduation rates, intervention strategies, and the five demographic features. This result was
attributed to the fact that these strategies were employed by all districts in the study. These
strategies included Technology is Used for Instruction from Level Two: Instructional strategies
and Guidance Counseling Services, Recognition of Academic Achievement, Career Fair,
Academic Planning, and College Planning from Level Four: Building-Wide strategies.
The Chi Square table and significance results indicating the significance of graduation
rates, intervention strategies, and demographic features are included in Table 13. Appendix F
includes this information in detail. This appendix includes the number of reported responses
from districts, percentages of intervention strategies employed and not employed with reported
graduation rates greater than or equal to 80% and those less than 80% corresponding with each
demographic feature.

89
Chapter 5: Summary of Findings, Conclusions, and Recommendations
Chapter 5 presents the findings of this research study on dropout prevention strategies in
select school districts in NYS. This chapter includes the three research questions that guided this
study. The findings of this study are discussed and include those specific to the four strategy
levels in the study. These levels include Level One Basic Core Strategies, Level Two
Instructional Strategies, Level Three Alternative Schooling Strategies, and Level Four Building-
Wide Strategies. The chapter also provides the conclusions of the study, recommendations,
considerations for future research, and last a brief summary of the research.
The purpose of this quantitative study was to determine if graduation rates were
influenced by the employment of dropout prevention strategies in rural school districts in NYS.
This study was guided by three basic research questions:
1. What intervention strategies are school districts using to improve graduation rates of
all students?
2. Is there a relationship between dropout prevention strategies and graduation rates?
3. Is there any association between graduation rates and the choice of specific
intervention strategies and the following demographic features:
a. Size of the school;
b. Experience of the administrator/principal;
c. Type of school schedule (i.e. traditional, block, modified block, semestered);
d. Building configuration;
e. Type of rural school district.

90
Summary of Findings
The study sought to determine what intervention strategies school districts were using
and if these dropout intervention strategies influenced graduation rates in selected rural districts
of NYS. Schools that belonged to the RSA of NYS were targeted for this study. There were
currently 262 districts that belonged to the RSA across the state with 108 responses from
throughout the state that were analyzed for this research endeavor.
Finding one. This research focused on describing the demographic features and
graduation rates of the select school districts in the study. Additionally, this research determined
what intervention strategies school districts employed or did not employ to improve graduation
rates.
The demographics of the participants in the study varied significantly. Building
enrollment of these rural school districts ranged from buildings of 190 students to those with
1700 students. There were 45 schools with 1-399 students, 30 schools with 400-500 students,
and 31 schools with 501-1700 students.
Building configuration of these schools included five various building types. There were
25 P-12 schools, 12 K-12 schools, 34 9-12 Schools, 31 Jr. /Sr. high schools, and 6 middle
schools.
These schools used three types of schedules; however, one type of school schedule was
most frequently utilized. Nine schools used blocked scheduling, five used a mixed schedule and
94 schools used a traditional schedule for instruction.
Administrative experience varied in this study. The number of years of experience
administrators possessed ranged from those having one year of experience to those with 28 years
of experience.

91
There were four types of rural schools identified in the study. There were 13 schools that
were identified as Fringe, 51 identified as Distant, 41 were identified as Remote. Despite the
definitions of the types of rural school districts described in the survey, three schools identified
themselves as Rural.
Graduation rates of these districts were reported by 83 schools. Graduation rates in this
study were examined and then divided into two categories for data analysis purposes. The first
category was graduation rates greater than or equal to 80% and the second category was
graduation rates of those less than 80%. Fifty-two percent (n = 43) of the schools reported
graduation rates greater or equal to 80%, and 48% (n = 40) of the schools reported graduation
rates less than 80%. Just over 50% of the schools in the study either met or exceeded the 80%
graduation rate for the 2007 cohort as reported by NYSED P12 IRS (2012c). The data indicated
that the graduation rates of districts that were greater than or equal to 80% were almost equal to
those with graduation rates that were less than 80%. These two categories differ slightly, by less
than 3%.
Level One Basic Core Strategies: Results. The average of Level One Strategies all
districts employed in the study was determined to be 94.13%, and those not employed were
5.87%. Level One included nine basic strategies. These strategies were grouped together, as
their characteristics refer to the most common strategies districts may offer students. These
included Peer Mentoring, Adult Mentoring, Peer Academic Tutoring, Adult Academic Tutoring,
Service Learning Opportunities, After School Opportunities (Clubs), After School Opportunities
(Sports), Parent-Teacher Conferences, and Parent -Teacher-Student-Association.
Level Two Instructional Strategies: Results. The average of Level Two Strategies
employed by districts was found to be 93.06%, and those not employed were found to be 6.92%.

92
Level Two included 13 strategies all related to instructional practices that may be utilized by
districts. These included Differentiated Instruction, Project Based Learning, Collaborative
Learning, Integration of Technology In Instruction, Students Are Taught How to Use
Technology, Technology is Used for Instruction (Smartboard, Promethean Board, interactive
projector etc.), High School Freshman Transition Course, High Interest Electives, Character
Education Program, Social Skills Development, College and Career Readiness Skills Taught,
Student Advisory Period, Response to Intervention, and Instructional Support Teams.
Level Three Alternative Schooling Strategies: Results. The average of Level Three
strategies districts employed was determined to be 95.8%, and those not employed were
determined to be 4.92%. Level Three included 13 strategies clustered together as they related to
alternative schooling opportunities provided for high school students either on or off campus.
These strategies included Career and Technical Education Programs (In House), Career and
Technical Education Programs (Off Campus), Smart Scholars Program (Dual enrollment in
college and high school), BOCES New Visions Program, International Baccalaureate Program,
Advanced Placement Courses, University in the High School Courses, Credit Recovery Program,
Summer School, Project Lead the Way, Distance Learning Courses, Alternative Education (Off
Campus), and Early College Admissions Program.
Level Four Building-Wide Strategies: Results. The average of Level Four strategies
employed by districts was determined to be 95.48%, and those not employed were determined to
be 4.83%. Level Four included 16 strategies. These strategies were grouped together, as they
relate to leadership capacities and building level interventions encompassing a range of services
and opportunities available for students. These strategies included Establish a Vision or Mission
for Learning, Establish Goals for Learning, Ongoing Examination and Analysis of Pertinent
93
Student Data (discipline, attendance, and performance on assessments), Guidance Counseling
Services, Social Worker Counseling, Job Shadowing Opportunities, Attendance Policy,
Recognition of Academic Achievement, College Fair, Career Fair, Pupil or Child Study Team
Services, Academic Planning and Counseling, College Planning and Counseling, Career
Planning and Counseling, Instructional Team Planning, and Agency Partnerships for Family
Support.
In summary, the number of responses of the 51 strategies employed by school districts in
the survey and the percentages of responses resulting from the survey indicated select rural
schools in NYS who belonged to the RSA employed a much higher percentage, 94.4%, of all the
51 dropout intervention strategies than those strategies not employed, 5.6%, by these districts.
Finding two. Research question two sought to determine if there was a relationship
between graduation rates with or among the various dropout intervention strategies employed by
the districts.
Graduation rates of districts from the study included those greater than or equal to 80% or
those less than 80%. These rates were paired with each intervention strategy at the defined four
levels in the study.
The results of the Chi Square Test of Association at Level One for the nine Basic Core
Strategies indicated values that ranged from 0.297 to 0.959. Level One Basic Core Strategies
indicated the null hypothesis was to be retained; indicating no significance existed. The 83
schools that reported graduation rates in the study employed Level One Intervention Strategies
with high percentages, with graduation rates greater than or equal to 80% (51.8%), as well as
those districts with graduation rates less than 80% (48.2%). Strategies not employed with
graduation rates of greater than or equal to 80% or less than 80% were considered very low at
94
Level One (less than 5%). The nine strategies were employed by almost all school districts at
this level with a percentage of 94%.
Level Two Strategies were analyzed in the Chi Square Test of Association, and the 13
strategies indicated values of significance that ranged from 0.089 to 0.959. The 83 schools that
reported graduation rates in the study employed Level Two Strategies with a high percentages
when graduation rates were greater than or equal to 80%, 51.8%, and those with less than 80%,
48.2%. Strategies not employed with graduation rates of greater than or equal to 80% or less
than 80% were considered higher at Level Two than at level one. Strategies not employed at
Level Two with graduation rates greater than or equal to 80% ranged from 0% to 16.9%.
Graduation rates less than 80% were not employed with percentages that ranged from 0% to
8.4%.
One variable at this level, Technology is Used for Instruction, was employed by all
districts in this study with graduation rates greater than or equal to 80%, as well as those with
graduation rates less than 80%. The data at Level Two was determined not to be significant.
Level Three results of the Chi Square Test of Association for the 13 intervention
strategies indicated values of significance that ranged from 0.018 to 0.959. At this level, there
was significance determined for two intervention strategies. Distance Learning Courses was
determined to be significant with a value of p < 0.05; and Alternative Education (Off Campus)
was determined to be borderline significant with a value of p < 0.067. This result indicates the
existence of a relationship between Distance Learning Courses and graduation rates and
Alternative Education (Off Campus) and graduation rates.
At Level Four the Chi Square association analysis for the intervention strategies indicated
five intervention strategies that remained a constant. This result was attributed to strategies that

95
were employed by all districts with graduation rates greater than or equal to 80 % and those less
than 80%. These strategies included Guidance Counseling Services, Recognition of Academic
Achievement, College Fair, Academic Planning and Counseling, and College Planning and
Counseling.
The significance at Level Four for the 16 strategies ranged from 0.061 to 0.941. At Level
Four two strategies resulted in a value of p = 0.061. The strategies included Career Fair and
Instructional Team Planning demonstrated borderline significance; meaning a relationship
existed between graduation rates and these two strategies.
To conclude, the results of the percentages and responses of intervention strategies varied
little at each of the four designated levels of the study in research question two. Percentages of
those strategies employed ranged from 34.4% (n = 29) to 51.8% (n = 43) when intervention
strategies were employed with graduation rates greater than or equal to 80%, and those with
graduation rates less than 80% ranged between 39.8% (n = 33) and 48.2% (n = 40).
Those strategies not employed with graduation rates greater than or equal to 80% ranged
from 0% to 16.9% (n = 14). Those strategies not employed with graduation rates of less than
80% ranged from 0% to 8.4% (n = 7).
There were two strategies at Level Three and two at Level Four that were considered
significant. These strategies included Distance Learning Courses, Alternative Education (Off
Campus), Career Fair, and Instructional Team Planning. This result indicated a relationship
existed between these strategies and graduation rates.
Finding three. Research question three sought to determine if there was a relationship
between graduation rates with or among the dropout intervention strategies identified in the

96
study and five demographic features. Significance in this study included p-values of ≤ 0.05. P-
values from 0.05 to 0.067 were considered borderline significant.
Building enrollment. There were a total of five strategies in this demographic feature
that revealed significance. These strategies included Alternative Education (p = .034) when
enrollment was low, and Credit Recovery (p = .034) and Distance Learning (p = .034) when
enrollment was defined as average. The strategy of Distance Learning Courses (p = .018),
Career Fair (p = 0.061) and Instructional Team Planning (p = 0.061) also exhibited significance
when there was no differentiation of the three building enrollment categories being considered.
These results indicate an association existed between graduation rates, intervention strategies,
when the demographic feature of building enrollment was considered.
Administrative experience. There were a total of five strategies that exhibited
significance in this demographic feature. Distance Learning Courses revealed significance
associated with low administrative experience (p = .033). With average administrative
experience, Project Based Learning (p = .052), High School Freshman Transition Course (p =
.051), Career Fair (p = .052), and Instructional Team Planning (p = .061) indicated significance.
Significance in administrative experience was also indicated in four strategies when there
was no differentiation of the three categories of experience (i.e. low, average, and high). These
include Distance Learning Courses (p = .018), Alternative Education (Off Campus) (p = .067),
Career Fair (p = .061), and Instructional Team Planning (p = .061). These results indicated an
association existed between graduation rates, intervention strategies, when the demographic
feature of administrative experience was considered.
Type of schedule. There were four strategies that demonstrated significance in this
demographic feature. The different types of schedules examined in the study did not show any
97
significance when employing a block or mixed schedule. In a traditional schedule, however,
there were three strategies that exhibited significance. These included Distance Learning
Courses (p = .018), Career Fair (p = .052), and Instructional Team Planning (p = .056).
Significance was also determined for the following strategies related to type of schedule
when the three types of building schedule (block, mixed, and traditional) were not divided into
the three categories. These included Distance Learning Courses (p = .018), Alternative
Education (Off Campus) (p = .067), Career Fair (p = .061), and Instructional Team Planning (p =
.061). These results indicated an association existed between graduation rates and intervention
strategies, when the demographic feature of type of schedule was considered.
Building configuration. In the analysis of the demographic feature, there were five
strategies that were determined to be of significance. There were five categories of consideration
in building configuration. There was no significance in P-12 schools for any strategies. Two
strategies indicated significance in K-12 schools: Adult Mentoring (p = .047) and Career and
Technical Education Programs (In House) (p = .047). In 9-12 schools, two strategies, Peer
Mentoring (p = .060) and Instructional Team Planning (p = .061), were considered to be
borderline significant. There were no strategies determined to be significant in middle schools
and jr./sr. high schools.
Significance in building configuration was determined in Distance Learning Courses (p =
.018) and Instructional Team Planning (p = .061) when building configuration was not divided
into the five categories. These results indicated an association existed between graduation rates,
intervention strategies, and demographic feature when building configuration was considered.
Type of rural school. There were six intervention strategies that were considered to be
significant in this demographic feature. Credit Recovery in schools characterized as distant (p =
98
.012) was considered significant. Parent-Teacher-Student Association was defined as significant
in schools that were considered remote (p = .018). Significance was also determined when no
differentiation of the three types of rural schools was considered for Distance Learning Courses
(p = .018), Alternative Education (Off Campus) (p = .067), Career Fair (p = .061), and
Instructional Team Planning (p = .061). These results indicated an association existed between
graduation rates, intervention strategies, and demographic feature when the type of rural school
was considered.
Conclusions
The first purpose of this study sought to identify what intervention strategies rural school
districts in NYS who belong to the RSA employed to improve graduation rates. The second
undertaking of this study attempted to determine if a relationship existed between graduation
rates and the intervention strategies employed by these districts. The third objective of this study
was to determine if an association existed between graduation rates, 51 intervention strategies,
and five specific demographic features of rural school districts (building enrollment,
administrative experience, type of schedule, building configuration, and type of rural school).
Conclusion one. School districts in the study employed 94.4% of the intervention
strategies. These strategies were examined at four distinctive levels (Level One Basic Core
Strategies, Level Two Instructional Strategies, Level Three Alternative Schooling Strategies, and
Level Four Building-Wide Strategies) with graduation rates greater than or equal to 80% or less
than 80%.
There were six strategies in this research study that districts identified as being employed
100%. These included Technology is Used for Instruction, Guidance Counseling, Recognition
of Academic Achievement, College Fair, Academic Planning, and College Planning.

99
These data indicated the select rural school districts in this study employed programs and
resources identified in the literature (Alliance for Education, 2009; Balfanz et al., 2012; Dynarski
et al. 2008; Schargel, 2012; Smink, 2008). The strategies employed in the study were
opportunities for students to stay in school, complete high school, and be an economic benefit to
society (Alliance for Excellent Education, 2011c; Dianda, 2008; Rouse, 2005; Rumberger,
2011).
Conclusion two. When graduation rates were analyzed with the each of the 51
intervention strategies there was one strategy, Distance Learning Courses, in which significance
was discovered when paired with graduation rates. Two strategies, Career Fair and Instructional
Team Planning, indicated borderline significance.
The relationship of Distance Learning Courses, Career Fair, and Instructional Team
Planning when paired with graduation rates indicated the value of these opportunities for
students in rural areas. The significance determined in the data indicated that graduation rates
were thus positively correlated with the implementation of these strategies. The research
suggests the continued need to provide access to these types of courses students would otherwise
not have access to in these rural school districts. Indeed these strategies indicate the potential
importance of implementing and utilizing these strategies toward meeting or exceeding
graduation rates of their school districts.
There were only three identifiable intervention strategies out of 51 that were determined
to be of significance when paired with graduation rates despite districts high percentages of
intervention strategies being identified and employed in their districts as dropout prevention
measures. These results led this researcher to conclude there may be another key factor masking
or eclipsing the process of determining that a relationship exists between graduation rates and

100
intervention strategies. The results of the study were perplexing. On the one hand districts in the
study were employing the intervention strategies with a percentage of 94.4 and yet on the other
hand only 52 % of the districts in the study had graduation rates greater than or equal to 80%.
Conclusion three. When graduation rates were analyzed with each of the 51 strategies at
each of the four designated levels and the five demographic features indicated significance
occurred at varying levels that were defined in the demographic features. Significance also was
determined in the analyses when the demographic features were not divided into the categories
within each feature.
Significance was determined for twelve intervention strategies. These strategies include
Alternative Education (Off Campus), Credit Recovery, Distance Learning, Project Based
Learning, High School Freshman Transition Course, Career Fair, Instructional Team Planning,
Adult Mentoring, Career and Technical Education (In House), Peer Mentoring, and Parent-
Teacher-Student Association.
Alternative Education Courses (Off Campus) was significant in buildings with low
enrollment. Credit Recovery was significant in buildings with average enrollment and in rural
schools defined as Distant. Project Based Learning, and High School Freshman Transition
Course, Career Fair, and Instructional Team Planning were considered significant for rural
school administrators with average years of experience.
Adult Mentoring and Career and Technical Education were considered significant when
building configuration was Kindergarten through grade twelve. Peer Mentoring and Instructional
Team Planning were considered significant in a building configuration of grades nine through
twelve. A Parent-Teacher- Student Association was considered significant in a rural school
defined as Remote.

101
The relationship of these intervention strategies determined to be significant when paired
with graduation rates indicated the value of these opportunities for students in rural areas. The
significance determined in the data indicated that graduation rates were thus positively correlated
with the implementation of these strategies. Indeed, these strategies indicate the potential
importance of implementing and utilizing these strategies towards meeting the state established
graduation rate.
Conclusion four. There were six strategies in the survey that were employed by all
school districts in the study. These strategies were identified as a constant and included
Technology is Used for Instruction from Level Two: Instructional Strategies, and Guidance
Counseling Services, Recognition of Academic Achievement, Career Fair, Academic Planning,
and College Planning from Level Four: Building-Wide strategies. Although not considered
statistically significant, the fact that these strategies were utilized by all districts in the study was
indicative of the relevance of these strategies to the districts in this study. Districts and policy
makers need to continue to support the efforts of employing these intervention strategies fiscally,
as well as on a system or school level. The literature indicated such essential opportunities be
made available for students. The nation’s goal is to keep students in school, so they are become
an economic benefit to society not an economic loss to society (Alliance for Excellent Education,
2009; Alliance for Excellent Education, 2011b; Dianda, 2008; Murphy et al., 2007; Rouse, 2005;
Rumberger, 2011; Schargel, 2012).
Conclusion five. The key finding in the study was the strong significance that existed
between Distance Learning Courses, graduation rates that are greater than or equal to 80% and
those with graduation rates of less than 80%, and the five demographic features in this study.
102
Distance Learning Courses were considered significant when building enrollment was
considered average. Distance learning courses were also considered significant when
administrative experience was low and when a traditional type of scheduled is employed. This
intervention strategy was also significant when building configuration and type of rural school is
considered.
The significance of this finding in this research study is indicative of the importance of
providing these types of courses for rural school district students who may otherwise not have
the opportunity to have access to. This information is particularly important for districts and
policy makers in terms of programmatic and budgetary considerations. This effort is consistent
with what is articulated in the literature (Dianda, 2008; Dynarski et al., 2008; Kennelly &
Monrad, 2007; Murphy et al. 2007; Schargel, 2012).
Conclusion six. Another notable finding in the study is the significance that existed
between the intervention strategies of Career Fair, Alternative Education (Off Campus), and
Instructional Team Planning with graduation rates that are greater than or equal to 80% and those
with graduation rates of less than 80%, and the demographic features in this study.
Instructional Team Planning was considered significant in all five demographic features
(building enrollment, administrative experience, type of schedule, building configuration, and
type of rural school). Career Fair was considered significant in four of the demographic features,
building enrollment, administrative experience, type of schedule, and type of rural school.
Alternative Education (Off Campus) was considered significant in three demographic features,
type of schedule employed, administrative experience, and in type of rural schools.
The significance of these findings identified in the demographic features of this study is
indicative of the relevance of these interventions strategies for school districts with similar types
103
of characteristics. This information is important for districts and policy makers in terms of
programmatic and budgetary considerations.
Recommendations
Recommendation one. School districts in the study utilized intervention strategies with
a high percentage. Schools should continue to employ these measures. Districts and policy
makers should continue to provide the fiscal support necessary to provide and support these
intervention programs in their districts. It is also recommended that districts that do not employ
these strategies should give consideration in doing so. The literature has indicated that providing
students these opportunities to stay in school and graduate would be of an economic benefit to
society.
Recommendation two. Career Fair, an intervention strategy identified in four
demographic areas, was indicated as significant in four demographic features: building
enrollment, administrative experience, type of schedule, and type of rural school. This is another
strategy that should be provided to students, and funding should be sought to ensure this strategy
remains viable.
Recommendation three. Rural school districts that employ the strategy of Instructional
Team Planning should continue doing so. This strategy exhibited significance in all five
demographic features examined in the study. Those schools that do not employ the strategy of
Instructional Team Planning should consider doing so, as this intervention strategy indicated
significance when associated with graduation rates and all demographic features.
Recommendation four. Rural school districts in NYS that do not offer Distance
Learning Courses should give strong consideration to adding this opportunity for students in
these districts. Those school districts that do offer this program should continue doing so. This
104
intervention strategy indicated a positive significance when associated with graduation rates and
all five of the demographic features considered in the study.
Recommendations for Future Research
Future research recommendation one. School districts utilized all of the identified 51
strategies in the study. It would be valuable to determine what other strategies or intervention
mechanisms school districts may be using to meet or exceed established graduation rates.
Future research recommendation two. This research study concentrated on
intervention strategies utilized in specific rural school districts in NYS. It would be beneficial to
expand this research study to all rural school districts in NYS to determine if similar or varying
results exist in the data amongst all rural districts.
Future research recommendation three. Disaggregation of data is also suggested
between various demographic groups such as students with disabilities and students of low
socio-economic status. Perhaps there could be valuable information to discern within or amongst
these groups that would be indicative of a correlation between intervention strategies and
graduation rates. This information may benefit not only students but also district or policy
makers in terms of making programmatic or budgetary decisions.
Future research recommendation four. One of the areas not explored in this research
study was early intervention. Researching this aspect of intervention may provide districts or
policy makers further information on dropout prevention strategies. This research endeavor could
also include the exploration and inclusion of early intervention programs at the pre-kindergarten
and elementary level that may be employed in these districts. This research did not include any
early intervention strategies of this nature.
105
Future research recommendation five. Explore the phenomenon that existed in the
results the data produced from the study that prevented the identification of a larger number of
correlations or significance between graduation rates and intervention strategies. There seems to
be some factor yet to be accounted for that is eclipsing a possible existence between graduation
rates and intervention strategies employed. The survey instrument used in the study can be ruled
out as such a factor, as the reliability function conducted on the survey tool was determined to be
an acceptable instrument, indicating the instrument itself was reliable and could therefore be
utilized for future research exploration. The results of this reliability test can be located in
Appendix H of this study.
Future research recommendation six. Distance Learning Courses exhibited a strong
significance when associated with graduation rates and all demographic features. The extent to
which these courses are utilized are worthy of further exploration to determine how these courses
may influence graduation rates.
Closing Statement
There were multiple findings in this research study. First, the responses of the 51
strategies employed by school districts in the survey and the percentages of responses resulting
from the survey indicated select rural schools in NYS who belonged to the RSA employed a
much higher percentage, 94.4%, of all the 51 dropout intervention strategies than those strategies
not employed, 5.6%, by these districts.
Another finding in the study indicated the correlation between graduation rates and the
intervention strategies Distance Learning Courses, College Fair, and Instructional Team
Planning.

106
There were also correlations between graduation rates, intervention strategies, and
demographic features. These included the intervention strategies of Alternative Education (off
campus), Credit Recovery, Distance Learning Courses, Career Fair, Instructional Team Planning,
Project Based Learning, High School Freshman Transition Course, Career Fair, Adult
Mentoring, Peer Mentoring, and Parent-Teacher- Student Association.
A key finding in this research study suggests the importance of Distance Learning
Courses for rural districts. Districts are facing diminishing fiscal resources, while at the same
time being challenged to meet tougher new graduation standards established by NYS. This
research suggests an essential program to be continued or to be considered, Distance Learning
Courses. Every resource or program a district utilizes must optimize its resources to ensure
students have the opportunity to meet these tough, new standards. The key finding in the study
was certainly an example of one program that rural school districts can strongly consider if they
are not already doing so.
This study also identified intervention strategies school districts were using to meet or
exceed graduation rates in NYS rural schools. This study serves as a bank of information for
rural school districts and policy makers to consider related to data on strategies that districts
employ and do not employ to meet rigorous graduation standards.
This study also provides contemplation for further study to determine what other
strategies or other programs may exist to help students succeed; especially with regard to early
intervention strategies. Furthermore, this study provides consideration for further examination of
disaggregated groups of students who may benefit from intervention strategies or interventions.

107
References
Alliance for Excellent Education. (2009, September). Is your local high school making the
grade? Ten elements of successful high schools: A guide for rural communities [Guide].
Washington, DC: Author. Retrieved from
http://www.all4ed.org/files/RuralElementsBrochure.pdf
Alliance for Excellent Education. (2010, September). High school dropouts in America [Fact
sheet]. Washington, DC: Author. Retrieved from
http://www.all4ed.org/files/HighSchoolDropouts.pdf
Alliance for Excellent Education. (2011a, January). Meeting the challenge: The role of school
leaders in turning around the lowest –performing high schools [Policy brief].
Washington, DC: Author. Retrieved from
http://www.all4ed.org/files/MeetingTheChallenge.pdf
Alliance for Excellent Education. (2011b, November). The high cost of high school dropouts:
What the nation pays for inadequate high schools [Issue brief]. Washington, DC: Author.
Retrieved from http://www.all4ed.org/files/HighCost.pdf
Alliance for Excellent Education. (2011c, December). The economic benefits of helping high
school dropouts earn both high school diplomas and college degrees: New York.
Washington, DC: Author. Retrieved from
http://www.all4ed.org/files/NewYork_sebps.pdf
Ammerman, M. (1998). The root cause analysis handbook: A simplified approach to identifying,
correcting, and reporting workplace errors. New York, NY: Quality Resources.
Balfanz, R., Bridgeland, J. M., Bruce, M., & Fox, J. H. (2012, March). Building a grad nation:
Progress and challenge in ending the high school dropout epidemic. Washington, DC:

108
Civic Enterprises. Retrieved from America's Promise Alliance website:
http://www.americaspromise.org/Our-Work/Grad-
Nation/~/media/Files/Our%20Work/Grad%20Nation/Building%20a%20Grad%20Nation/
BuildingAGradNation2012.ashx
Bambrick-Santoyo, P., & Peiser, B. M. (2012). Leverage leadership: A practical guide to
building exceptional schools. San Francisco, CA: Jossey-Bass.
Bennis, W. G. (2003). On becoming a leader. New York, NY: Basic Books.
Bridges, W. (2009). Managing transitions: Making the most of change (3rd ed.). Philadelphia,
PA: Da Capo Press.
Brimley, V., Jr., Verstegen, D. A., & Garfield, R. R. (2012). Financing education in a climate of
change (11th ed.). Boston, MA: Pearson Education.
Carver, J. (1990). Boards that make a difference: A new design for leadership in nonprofit and
public organizations. San Francisco, CA: Jossey-Bass.
Christenson, S. L., & Thurlow, M. L. (2004). School dropouts: Prevention considerations,
interventions, and challenges. Current Directions in Psychological Science, 13(1), 36-39.
doi:10.1111/j.0963-7214.2004.01301010.x
Conklin, K. D., Curran, B. K., & Gandal, M. (2005). An action agenda for improving America's
high schools: 2005 National Education Summit on High Schools. Washington, DC:
National Governors Association. Retrieved from
http://www.nga.org/files/live/sites/NGA/files/pdf/0502ACTIONAGENDA.pdf
Creswell, J. W. (2012). Educational research: Planning, conducting, and evaluating quantitative
and qualitative research (4th ed.). Boston, MA: Pearson.
109
Deyé, S. (2011). A path to graduation for every child: State legislative roles and responsibilities:
A report of the NCSL Task Force on school dropout prevention and recovery [Research
report]. Denver, CO: National Conference of State Legislatures. Retrieved from
http://www.ncsl.org/documents/educ/ncsldropouttaskforcereport.pdf
Dianda, M. R. (2008, November). Preventing future high school dropouts: An advocacy and
action guide for NEA state and local affiliates. Washington, DC: National Education
Association. Retrieved from http://www.nea.org/assets/docs/HE/dropoutguide1108.pdf
Dynarski, M., Clarke, L., Cobb, B., Finn, J., Rumberger, R., & Smink, J. (2008, September).
Dropout prevention: A practice guide (NCEE Publication No. 2008--4025). Washington,
DC: U.S. Department of Education, Institute of Education Sciences, National Center for
Education Evaluation and Regional Assistance. Retrieved from
http://ies.ed.gov/ncee/wwc/pdf/practice_guides/dp_pg_090308.pdf
Fullan, M. (2008). The six secrets of change: What the best leaders do to help their
organizations survive and thrive. San Francisco, CA: Jossey-Bass.
Fullan, M., Cuttress, C., & Kilcher, A. (2005). 8 forces for leaders of change. Journal of Staff
Development, 26(4), 54-58, 64. Retrieved from
http://www.learningforward.org/publications/jsd
Gao, W., & Mager, G. (2011). Enhancing preservice teachers' sense of efficacy and attitudes
toward school diversity through preparation: A case of one U.S. inclusive teacher
education program. International Journal of Special Education, 26(2), 92-107. Retrieved
from http://www.internationaljournalofspecialeducation.com/
Hall, B. (2011). K-12 distance education: The case of rural schools. The Cornell Policy Review,
2(1). Retrieved from http://blogs.cornell.edu/policyreview/

110
Hayes, R. L., Nelson, J. L., Tabin, M., Pearson, G., & Worthy, C. (2002). Using school-wide
data to advocate for student success. Professional School Counseling, 6(2), 86-94.
Retrieved from http://www.schoolcounselor.org/content.asp?contentid=235
Harris, A. (2010). Leading system transformation. School Leadership & Management, 30(3),
197-207. doi:10.1080/13632434.2010.494080
Johnson, S. (2002). Who moved my cheese?: An amazing way to deal with change in your work
and in your life. New York, NY: G. P. Putnam's Sons.
Kennelly, L., & Monrad, M. (2007, October). Approaches to dropout prevention: Heeding early
warning signs with appropriate interventions. Washington, DC: American Institutes for
Research, National High School Center. Retrieved from
http://www.betterhighschools.org/docs/nhsc_approachestodropoutprevention.pdf
Kotter, J. P., & Cohen, D. S. (2002). The heart of change: Real-life stories of how people change
their organizations. Boston, MA: Harvard Business School Press.
Legters, N., & Balfanz, R. (2009, February). Do we have what it takes to put all students on the
graduation path? The State Education Standard, 4-9. Retrieved from
http://new.every1graduates.org/wp-content/uploads/2012/06/DoWeHaveWhatItTakes.pdf
Lyson, T. A. (2002). What does a school mean to a community?: Assessing the social and
economic benefits of schools to rural villages in New York. Journal of Research in Rural
Education, 17(3), 131-137. Retrieved from http://www.jrre.psu.edu/
Malhoit, G. C. (2005, July). Providing rural students with a high quality education: The rural
perspective on the concept of educational adequacy. Arlington, VA: Rural School and
Community Trust. Retrieved from
http://www.ruraledu.org/user_uploads/file/Providing_Rural_Students.pdf

111
Marzano, R. J., & Waters, T. (2009). District leadership that works: Striking the right balance.
Bloomington, IN: Solution Tree Press.
Marzano, R. J., Waters, T., & McNulty, B. A. (2005). School leadership that works: From
research to results. Alexandria, VA: Association for Supervision and Curriculum
Development; Aurora, CO: Mid-continent Research for Education and Learning.
Murphy, J., Elliott, S. N., Goldring, E., & Porter, A. C. (2007). Leadership for learning: A
research-based model and taxonomy of behaviors. School Leadership & Management,
27(2), 179-201. doi:10.1080/13632430701237420
New York State Center for Rural Schools. (2012). About rural schools. Retrieved from
http://www.nyruralschools.org/pages/about_rural.php
New York State Education Department, Office of Communications. (2012, June 11). Education
Department releases high school graduation rates: Overall rates improve slightly but are
still too low for our students to be competitive: College and Career readiness measures
remain low [Press Release]. Retrieved from
http://www.p12.nysed.gov/irs/pressRelease/20120611/GradRates2012.pdf
New York State Education Department, Prekindergarten through Grade 12 Education,
Information and Reporting Services. (2009, November 25). The New York State report
card: Accountability and overview report 2008-09. Retrieved from
http://www.p12.nysed.gov/irs/reportcard/2009/2009statewideAOR.pdf
New York State Education Department, Prekindergarten through Grade 12 Education,
Information and Reporting Services. (2011a, February 1). The New York State report
card: Accountability and overview report 2009-10. Retrieved from
https://reportcards.nysed.gov/statewide/2010statewideAOR.pdf
112
New York State Education Department, Office of Prekindergarten Through Grade 12 Education,
Information and Reporting Services. (2011b, November 9). Acronyms and definitions:
2011-12 student information repository system. Retrieved from
http://www.p12.nysed.gov/irs/sirs/2011-12/2011-
12SIRSGuidance/NEWER/AcronymsDefinitions20111109.doc
New York State Education Department, Prekindergarten through Grade 12 Education,
Information and Reporting Services. (2012a, March 1). The New York State report card:
Accountability and overview report 2010-2011. Retrieved from
https://reportcards.nysed.gov/statewide/2011statewideAOR.pdf
New York State Education Department, Prekindergarten through Grade 12 Education,
Information and Reporting Services. (2012b, May 9). Need/resource capacity categories.
Retrieved from http://www.p12.nysed.gov/irs/accountability/2011-
12/NeedResourceCapacityIndex.pdf
New York State Education Department, Prekindergarten through Grade 12 Education,
Information and Reporting Services. (2012c, June 11). Graduation rates: Students who
started 9th grade in 2003, 2004, 2005, 2006, and 2007 supplemental packet [PowerPoint
Presentation]. Retrieved from http://www.p12.nysed.gov/irs/statistics/hsgrads/2012/
SupplementalGradRateSlides.ppt
New York State Education Department, Office of Prekindergarten through Grade 12 Education,
Office of School Operations, Educational Management Services. (2012, March).
Property tax cap guidance. Retrieved from http://www.p12.nysed.gov/mgtserv/
propertytax/taxcap/docs/Tax_Cap_Guidance_final.pdf

113
New York State Education Department, Office of Prekindergarten through Grade 12 Education,
Race to the Top, Network Team Institute. (n.d.). The Regents reform agenda [Powerpoint
presentation]. Retrieved from http://usny.nysed.gov/rttt/ntinstitute/docs/nti-rra.pdf
Princiotta, D., & Reyna, R. (2009). Achieving graduation for all: A governor's guide to dropout
prevention and recovery. Washington, DC: National Governors Association Center for
Best Practices. Retrieved from http://www.nga.org/files/live/sites/NGA/files/
pdf/0910ACHIEVINGGRADUATION.PDF
Provasnik, S., KewalRamani, A., Coleman, M. M., Gilbertson, L., Herring, W., & Xie, Q.
(2007). Status of education in rural America [NCES Report No. 2007-040]. Washington,
DC: U.S. Department of Education, Institute of Education Sciences, National Center for
Education Statistics. Retrieved from http://nces.ed.gov/pubs2007/2007040.pdf
Rouse, C. E. (2005, October). The labor market consequences of an inadequate education. Paper
presented at the Fall 2005 Symposium on the "Social Costs of Inadequate Education",
New York, NY. Retrieved from Columbia University, Teachers College website:
http://devweb.tc.columbia.edu/manager/symposium/Files/77_Rouse_paper.pdf
Rumberger, R. W. (2011). Dropping out: Why students drop out of high school and what can be
done about it. Cambridge, MA: Harvard University Press.
Rumberger, R., & Ah Lim, S. (2008, October). Why students drop out of school: A review of 25
years of research (Policy brief 15). Santa Barbara, CA: University of California, Santa
Barbara, Gevirtz Graduate School of Education, California Dropout Research Project.
Retrieved from http://www.slocounty.ca.gov/Assets/CSN/PDF/Flyer+-
+Why+students+drop+out.pdf

114
Rural Schools Association of New York State. (2012). RSA members: 2012-13 RSA member
schools. Retrieved from http://education.cornell.edu/rsa/rsa_members.html
Salkind, N. J. (2008). Statistics for people who (think they) hate statistics (3rd ed.). Thousand
Oaks, CA: Sage.
Schargel, F. P. (2012). Dropout prevention fieldbook: Best practices from the field. Larchmont,
NY: Eye on Education.
Scharmer, C. O. (2009). Theory u: Leading from the future as it emerges: The social technology
of presenting. San Francisco, CA: Berrett-Koehler.
Silky, W. & Merrins, J. (2007). The 2007 Superintendent Development Program: A cooperative
effort of BOCES, district superintendents, and Oswego State University [Program
Binder]. Oswego, NY: State University of New York at Oswego.
Sipple, J. W., Casto, H., & Blakely, R. M. (2009). How schools can help communities in NYS
(Research & policy brief No. 32). Retrieved from Cornell University, Department of
Development Sociology, Community and Rural Development Institute website:
http://cardi.cornell.edu/cals/devsoc/outreach/cardi/publications/loader.cfm?csModule=sec
urity/getfile&PageID=779368
Smink, J. (2004). Coming to terms with at risk. In J. Smink & F. Schargel (Eds.), Helping
students graduate: A strategic approach to dropout prevention (pp. 1-7). Larchmont, NY:
Eye on Education. Retrieved from http://www.eyeoneducation.com/bookstore/client/
client_pages/samplechapters/675-6.pdf
Snyder, T. D. (2010, April). Mini-digest of education statistics: 2009 (NCES 2010-014).
Washington, DC: U.S. Department of Education, National Center for Education

115
Statistics, Institute of Education Sciences. Retrieved from
http://nces.ed.gov/pubs2010/2010014.pdf
Snyder, T. D., & Dillow, S. A. (2012, June). Digest of education statistics 2011 [NCES
Publication No. 2012-001]. Washington, DC: U.S. Department of Education, Institute of
Education Sciences, National Center for Education Statistics. Retrieved from
http://nces.ed.gov/pubs2012/2012001_0.pdf
Strange, M., Johnson, J., Showalter, D., & Klein, R. (2012, January). Why rural matters 2011-
12: The condition of rural education in the 50 states [Research Report]. Washington, DC:
Rural School and Community Trust. Retrieved from http://files.ruraledu.org/wrm2011-
12/WRM2011-12.pdf
U.S. Department of Education. (2008, April). A nation accountable: Twenty-five years after A
Nation at Risk. Washington, DC: U.S. Department of Education. Retrieved from
http://www2.ed.gov/rschstat/research/pubs/accountable/accountable.pdf
U.S. Department of Education, National Commission on Excellence in Education. (1983, April).
A nation at risk: The imperative for educational reform: An open letter to the American
people: A report to the nation and the secretary of education. Washington, DC:
Government Printing Office, Superintendent of Documents. Retrieved from
http://datacenter.spps.org/uploads/SOTW_A_Nation_at_Risk_1983.pdf
U.S. Department of Education, Office of Elementary and Secondary Education, Comprehensive
School Reform Program Office. (2002, August). Scientifically based research and the
Comprehensive School Reform (CSR) program. Retrieved from
http://www2.ed.gov/programs/compreform/guidance/appendc.pdf

116
Vogt, W. P., & Johnson, R. B. (2011). Dictionary of statistics & methodology: A nontechnical
guide for the social sciences (4th ed.). Thousand Oaks, CA: Sage.

117
Appendix A
Permission to use Schargel’s Strategies
From: Franklin Schargel < > To: <sdelaney@xxxxxxxxxxx> Date: 11/19/2012 5:18 PM Subject: Feel free to use the 15 Effective Strategies Stacey: Check out my website, www.schargel.com and search for information about rural schools. There are 15 states (according to the US Department of Education) that produce almost 80 percent of all dropouts. What are the commonalities? They are in the South and the West (except Michigan) are border states, fund education less than the national average (except California) are rural. Let me know if I can be of further assistance. Franklin Franklin Schargel Schargel Consulting Group www.schargel.com

118
Appendix B
Survey Instrument
A Survey of Dropout Prevention Strategies Used in Schools
Assurance: The information you provide in this survey will be kept anonymous.
This survey should take approximately 20 minutes to complete. The survey is divided into two
sections. The first section involves a few basic demographic questions regarding your school
district. The second part of the survey is related to strategies or interventions you or your school
district may use to prevent students from dropping out of school. These strategies are divided
into four categories.
(This survey tool is researcher developed. The tool has incorporated and adapted some of the 15
effective strategies identified in Schargel, F. (2012). Dropout Prevention Fieldbook: Best
Practices From the Field. Larchmont, NY: Eye On Education).
Part I
1. What is your building enrollment?
2. What is your building configuration?
3. If you are a high school building, what was your 2007 total cohort (2010-2011)
graduation rate?
4. Please indicate what type of rural school district you are:
___Fringe (rural territory that is less than or equal to 5 miles from an urbanized area)
___Distant (rural territory that is more than 5 miles but less than equal to 25 miles from
an urbanized area)
___Remote (rural territory that is more than 25 miles from an urbanized area)
5. Do you use a block or traditional schedule?
6. How many years have you served as an administrator in the district?
Part II
Please respond to the following questions that relate to prevention intervention strategies that are
employed in your district. These strategies are divided into in four categories: Level One: Basic
Core Strategies; Level Two: Instructional Strategies; Level Three: Alternative Schooling
Opportunities, and Level Four: Building-Wide strategies. There are five choices with which you
can respond with. If the strategy is not available in your district and you think your district needs
this strategy then please indicate that in the appropriate response. There are five choices to which
you can respond.
1. This strategy is not available for students in our district.
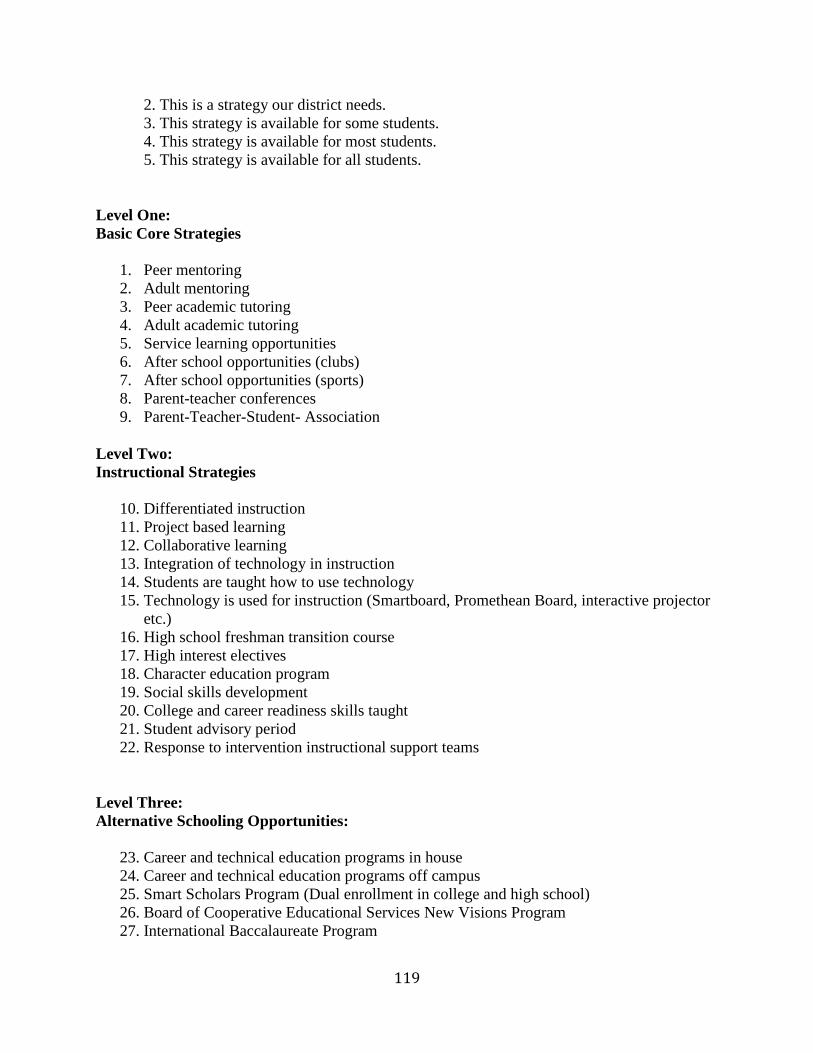
119
2. This is a strategy our district needs.
3. This strategy is available for some students.
4. This strategy is available for most students.
5. This strategy is available for all students.
Level One:
Basic Core Strategies
1. Peer mentoring
2. Adult mentoring
3. Peer academic tutoring
4. Adult academic tutoring
5. Service learning opportunities
6. After school opportunities (clubs)
7. After school opportunities (sports)
8. Parent-teacher conferences
9. Parent-Teacher-Student- Association
Level Two:
Instructional Strategies
10. Differentiated instruction
11. Project based learning
12. Collaborative learning
13. Integration of technology in instruction
14. Students are taught how to use technology
15. Technology is used for instruction (Smartboard, Promethean Board, interactive projector
etc.)
16. High school freshman transition course
17. High interest electives
18. Character education program
19. Social skills development
20. College and career readiness skills taught
21. Student advisory period
22. Response to intervention instructional support teams
Level Three:
Alternative Schooling Opportunities:
23. Career and technical education programs in house
24. Career and technical education programs off campus
25. Smart Scholars Program (Dual enrollment in college and high school)
26. Board of Cooperative Educational Services New Visions Program
27. International Baccalaureate Program
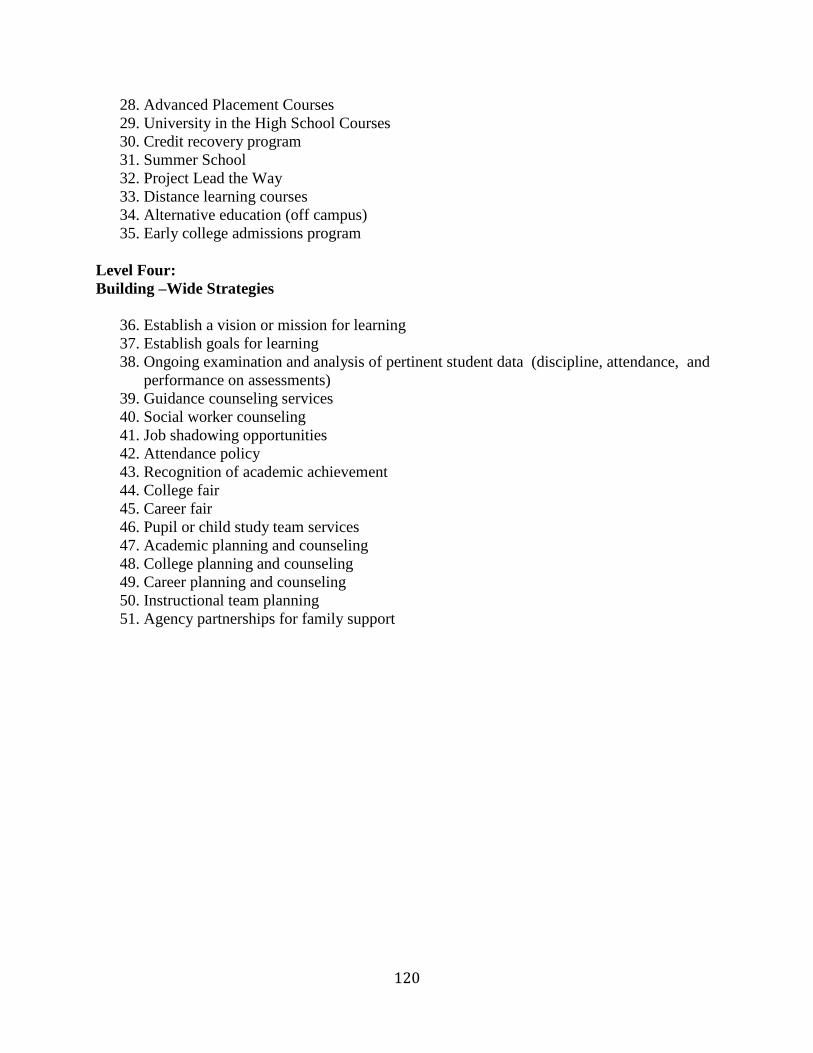
120
28. Advanced Placement Courses
29. University in the High School Courses
30. Credit recovery program
31. Summer School
32. Project Lead the Way
33. Distance learning courses
34. Alternative education (off campus)
35. Early college admissions program
Level Four:
Building –Wide Strategies
36. Establish a vision or mission for learning
37. Establish goals for learning
38. Ongoing examination and analysis of pertinent student data (discipline, attendance, and
performance on assessments)
39. Guidance counseling services
40. Social worker counseling
41. Job shadowing opportunities
42. Attendance policy
43. Recognition of academic achievement
44. College fair
45. Career fair
46. Pupil or child study team services
47. Academic planning and counseling
48. College planning and counseling
49. Career planning and counseling
50. Instructional team planning
51. Agency partnerships for family support
121
Appendix C
Initial Superintendent Letter
Date
Address of Superintendent / RSA Executive Director / Capital District Areas School
Development Association Director
Dear (Superintendent’s Name / Executive Directors’ Name):
My name is Stacey A. Delaney. I am a doctoral student in the Educational Leadership program at
the Sage College of Albany. I am writing you to invite you to participate in a research study that
investigates the relationship between the graduation rates of school district’s 2007 cohort (2010-
2011) graduation rate and the availability of dropout intervention strategies that may or may not
be available to the students in your district.
The information gathered from this study will assist policy makers, district leaders, and
community members in the difficult decision making process in determining what programs
should be made available to students to keep them in school. Your participation will add to the
input needed for important decisions on what program services should be made available to
students in difficult economic times.
The research involves the completion of a brief, anonymous, survey (which will be sent to
principals on- line) and several questions about data your district already maintains in your
student management system and the district’s accountability report. For your review, I have
included a hard copy of the survey in this correspondence. In most districts this information is
maintained by the principals or guidance counselors. The researcher will only collect aggregate
data from your district and will not have access to the identity of any students or staff; therefore,
this study will be anonymous. The results of this research will be reported in aggregate and may
be published in a professional journal or presented at professional meetings. Therefore, you may
withdraw from the study at any point until the survey had been submitted.
It is my intention to contact you by telephone to discuss the possibility of participating. At that
time I will answer any questions you may have regarding the research study. If you have any
questions or concerns prior to that feel free to contact me at [email protected] or my doctoral
chairperson, Dr. Daniel Alemu at [email protected]. I appreciate your consideration and I hope to
have the opportunity to have your support for this study.
Sincerely,
Stacey A. DeLaney
Doctoral Candidate
Sage Graduate Schools
140 New Scotland Avenue
Albany, NY 12208

122
Appendix D
Follow up Superintendent Letter
Date
Address of Superintendent / RSA Executive Director
Dear (Superintendent’s Name / RSA Executive Director’s Name):
I am following up to the letter I sent out to you recently. This correspondence also included a
copy of the anonymous survey that will be available on line to the 245 rural school districts in
NYS that belong in the Rural School Association.
The information gathered from this study will assist policy makers, district leaders, and
community members in the difficult decision making process in determining what programs
should be made available to students to keep them in school. Your participation will add to the
input needed for important decisions on what program services should be made available to
students in difficult economic times.
The research involves the completion of a brief survey and data the district already maintains in
your student management system and the district’s accountability report. In most districts this
information is maintained by the principals or guidance counselors. The researcher only collects
aggregate data from your district and will not have access to the identity of any students or staff;
therefore, this study will be anonymous. The results of this research will be reported in aggregate
and may be published in a professional journal or presented at professional meetings. Therefore,
you may withdraw from the study at any point until the survey had been submitted
I may be contacting you by telephone to discuss the research project. At that time I will answer
any questions you may have regarding the research study. If you have any questions or concerns
prior to that feel free to contact me at [email protected] or my doctoral chairperson, Dr. Daniel
Alemu at [email protected]. I appreciate your consideration and I hope to work with you in this
study.
Sincerely,
Stacey A. DeLaney
Doctoral Student
Sage College of Albany
123
Appendix E
Second Follow up Superintendent Letter
Date
Email addresses of principals’
Dear (Superintendent /Principal’s / RSA Executive Director’s Name):
I am following up to the email I sent you recently regarding the completion of an anonymous
survey on dropout prevention strategies you may employ in your school. This reminder is to let
you know the survey will be closing in three days (insert date). Your participation in this study is
greatly appreciated and it is hoped that the information gathered from this study will assist
policy makers, district leaders, and community members in the difficult decision making process
in determining what programs should be made available to students to keep them in school. Your
participation will add to the input needed for important decisions on what program services
should be made available to students in difficult economic times.
This anonymous survey should only take about twenty minutes to complete. The link to the
survey is included in this correspondence for your convenience. The data asked is such data the
district already maintains in your student management system and the district’s accountability
report. The results of this research will be reported in aggregate and may be published in a
professional journal or presented at professional meetings. Therefore, you may withdraw from
the study at any point until the survey had been submitted
I will be happy to answer any questions you may have regarding this research study. If you have
any questions or concerns prior to that, feel free to contact me at [email protected] or my
doctoral chairperson, Dr. Daniel Alemu at [email protected]. I appreciate your consideration and
I hope to work with you in this study.
Sincerely,
Stacey A. DeLaney
Doctoral Student
Sage College of Albany
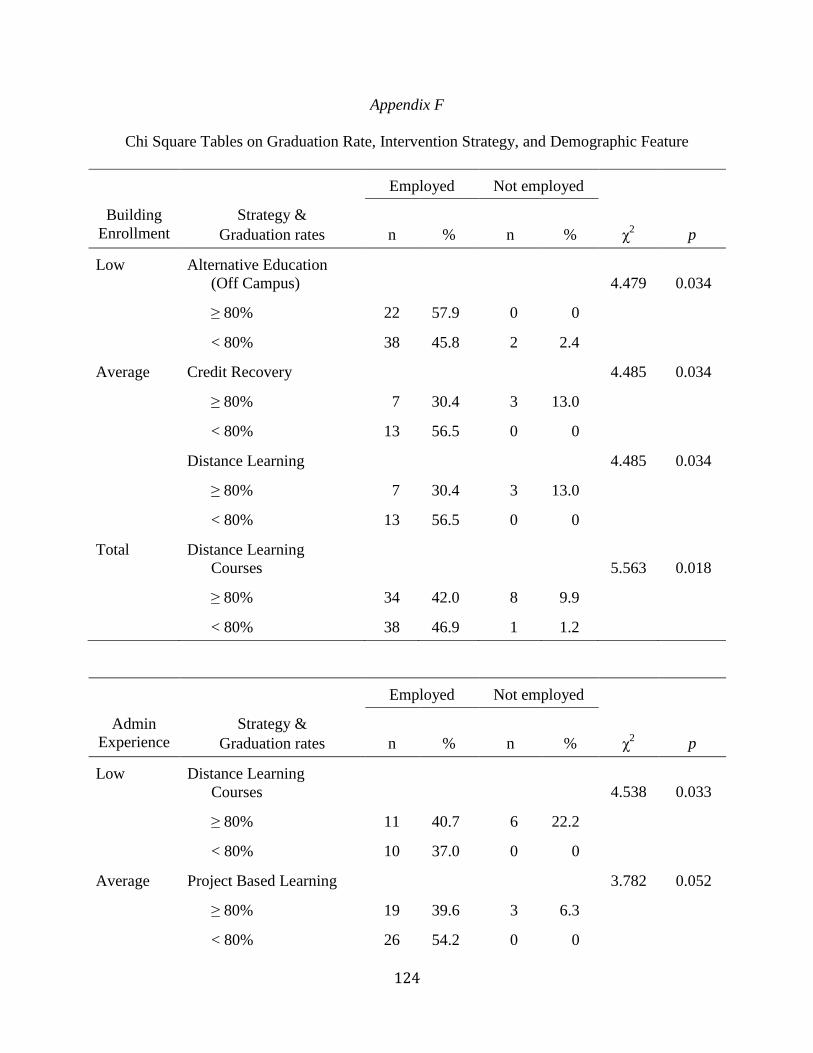
124
Appendix F
Chi Square Tables on Graduation Rate, Intervention Strategy, and Demographic Feature
Employed Not employed
Building
Enrollment
Strategy &
Graduation rates n % n % χ2 p
Low Alternative Education
(Off Campus)
4.479 0.034
≥ 80% 22 57.9 0 0
< 80% 38 45.8 2 2.4
Average Credit Recovery 4.485 0.034
≥ 80% 7 30.4 3 13.0
< 80% 13 56.5 0 0
Distance Learning 4.485 0.034
≥ 80% 7 30.4 3 13.0
< 80% 13 56.5 0 0
Total Distance Learning
Courses
5.563 0.018
≥ 80% 34 42.0 8 9.9
< 80% 38 46.9 1 1.2
Employed Not employed
Admin
Experience
Strategy &
Graduation rates n % n % χ2 p
Low Distance Learning
Courses
4.538 0.033
≥ 80% 11 40.7 6 22.2
< 80% 10 37.0 0 0
Average Project Based Learning 3.782 0.052
≥ 80% 19 39.6 3 6.3
< 80% 26 54.2 0 0

125
High School Freshman
Transition Course
3.814 0.051
≥ 80% 12 25.0 10 20.8
< 80% 21 43.8 5 10.4
Career Fair 3.782 0.052
≥ 80% 19 39.6 3 6.3
< 80% 26 54.2 0 0
Instructional Team
Planning
5.157 0.023
≥ 80% 18 37.5 4 83.0
< 80% 26 54.2 0 0
≥ 80%
< 80%
Total Distance Learning
Courses
5.559 0.018
≥ 80% 35 42.2 8 9.6
< 80% 39 47.0 1 1.2
Alternative Education
(Off Campus)
3.346 0.067
≥ 80% 43 51.8 0 0
< 80% 37 44.6 3 3.6
Career Fair 3.520 0.061
≥ 80% 39 47 1 1.2
< 80% 76 91.6 7 8.4
Instructional Team
Planning
3.346 0.067
≥ 80% 37 44.6 6 7.2
< 80% 39 47 1 1.2

126
Employed Not employed
Building
Config.
Strategy &
Graduation rates n % n % χ2 p
P – 12
K – 12 Adult Mentoring 3.983 0.047
≥ 80% 7 77.8 0 0
< 80% 1 11.1 1 11.1
Career & Technical
Education (In House)
3.938 0.047
≥ 80% 7 77.7 0 0
< 80% 1 11.1 1 11.1
9 – 12 Peer Mentoring 3.547 0.060
≥ 80% 9 29.0 4 1.2
< 80% 17 54.8 1 3.2
Instructional Team
Planning
3.547 0.060
≥ 80% 9 29.0 4 1.2
< 80% 17 54.8 1 3.2
Jr./Sr. High
MIddle
Total Distance Learning
Courses
5.559 0.018
≥ 80% 35 42.2 8 9.6
< 80% 39 47 1 1.2
Instructional Team
Planning
3.52 0.061
≥ 80% 37 44.6 6 7.2
< 80% 39 47 1 1.2

127
Employed Not employed
Type of
Rural
School
Strategy &
Graduation rates n % n % χ2 p
Distant Credit Recovery 6.258 0.012
≥ 80% 13 31.7 4 9.8
< 80% 24 58.5 0 0
Fringe XXXX
Remote Parent-Student-Teacher-
Association
4.265 0.039
≥ 80% 12 41.4 5 17.2
< 80% 12 41.4 0 0
Total Distance Learning
Courses
5.559 0.018
≥ 80% 35 42.2 8 9.6
< 80% 39 47 1 1.2
Alternative Education
(Off Campus)
3.346 0.067
≥ 80% 43 51.8 0 0
< 80% 37 44.6 3 3.6
Career Fair 3.520 0.061
≥ 80% 37 44.6 6 7.2
< 80% 39 47 1 1.2
Instructional Team
Planning
3.520 0.061
≥ 80% 37 44.6 6 7.2
< 80% 39 47 1 1.2
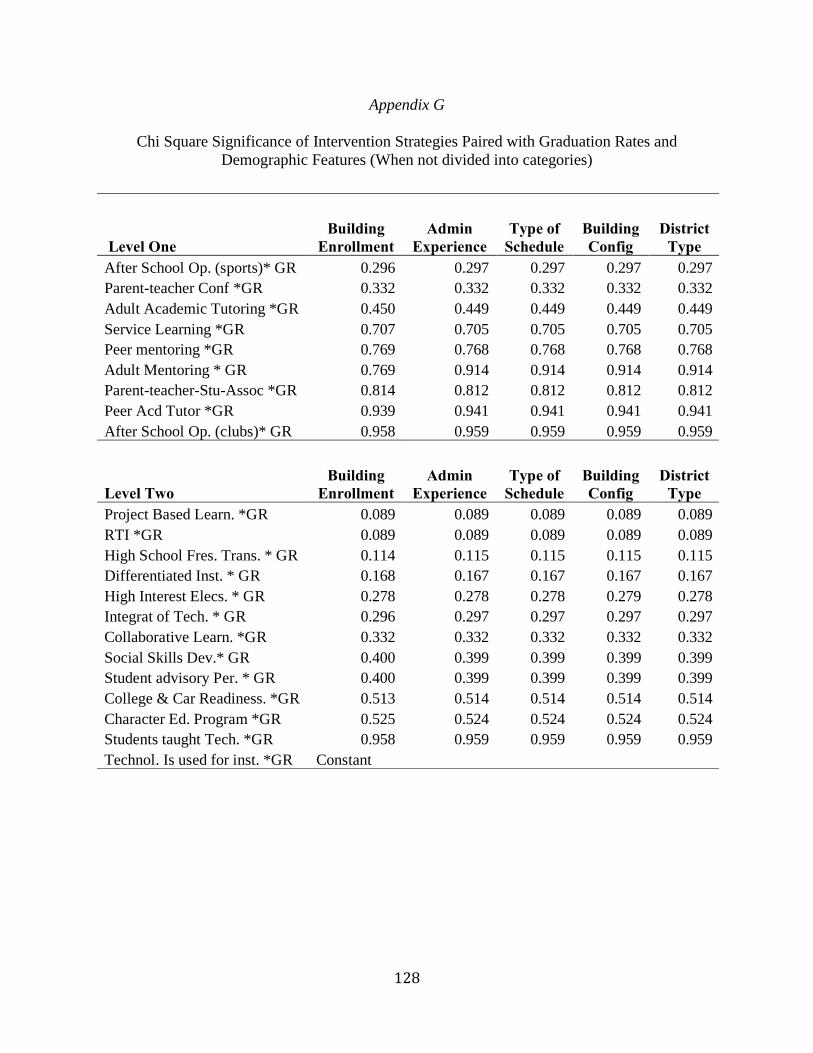
128
Appendix G
Chi Square Significance of Intervention Strategies Paired with Graduation Rates and
Demographic Features (When not divided into categories)
! !
Level One
Building
Enrollment
Admin
Experience
Type of
Schedule
Building
Config
District
Type
After School Op. (sports)* GR 0.296 0.297 0.297 0.297 0.297
Parent-teacher Conf *GR 0.332 0.332 0.332 0.332 0.332
Adult Academic Tutoring *GR 0.450 0.449 0.449 0.449 0.449
Service Learning *GR 0.707 0.705 0.705 0.705 0.705
Peer mentoring *GR 0.769 0.768 0.768 0.768 0.768
Adult Mentoring * GR 0.769 0.914 0.914 0.914 0.914
Parent-teacher-Stu-Assoc *GR 0.814 0.812 0.812 0.812 0.812
Peer Acd Tutor *GR 0.939 0.941 0.941 0.941 0.941
After School Op. (clubs)* GR 0.958 0.959 0.959 0.959 0.959
Level Two
Building
Enrollment
Admin
Experience
Type of
Schedule
Building
Config
District
Type
Project Based Learn. *GR 0.089 0.089 0.089 0.089 0.089
RTI *GR 0.089 0.089 0.089 0.089 0.089
High School Fres. Trans. * GR 0.114 0.115 0.115 0.115 0.115
Differentiated Inst. * GR 0.168 0.167 0.167 0.167 0.167
High Interest Elecs. * GR 0.278 0.278 0.278 0.279 0.278
Integrat of Tech. * GR 0.296 0.297 0.297 0.297 0.297
Collaborative Learn. *GR 0.332 0.332 0.332 0.332 0.332
Social Skills Dev.* GR 0.400 0.399 0.399 0.399 0.399
Student advisory Per. * GR 0.400 0.399 0.399 0.399 0.399
College & Car Readiness. *GR 0.513 0.514 0.514 0.514 0.514
Character Ed. Program *GR 0.525 0.524 0.524 0.524 0.524
Students taught Tech. *GR 0.958 0.959 0.959 0.959 0.959
Technol. Is used for inst. *GR Constant

129
!
Level Three
Building
Enrollment
Admin
Experience
Type of
Schedule
Building
Config
District
Type
DL Courses *GR 0.018 0.018 0.018 0.018 0.018
Alt. Ed (off Cam)*GR 0.067 0.067 0.067 0.067 0.067
AP *GR 0.089 0.089 0.089 0.089 0.089
Credit Recovery* GR 0.107 0.107 0.107 0.107 0.107
BOCES NEW V *GR 0.137 0.138 0.138 0.138 0.138
UHS * GR 0.168 0.167 0.167 0.167 0.167
Summer School* GR 0.296 0.297 0.297 0.297 0.297
Career & Tech Ed-Off Camp *GR 0.332 0.332 0.332 0.332 0.332
Project LTW *GR 0.342 0.341 0.588 0.341 0.341
IB *GR 0.601 0.6 0.6 0.6 0.6
Career & Tech Ed-In House
*GR 0.925 0.927 0.927 0.927 0.927
Smart Scholars *GR 0.958 0.959 0.959 0.959 0.959
Early College Adm. *GR 0.958 0.959 0.959 0.959 0.959
Level Four
Building
Enrollment
Admin
Experience
Type of
Schedule
Building
Config
District
Type
Career Fair*GR 0.061 0.061 0.061 0.061 0.061
Instr, Team Planning*GR 0.061 0.061 0.061 0.061 0.061
Agency Partnerships*GR 0.136 0.136 0.136 0.136 0.136
Goals for Learning*GR 0.168 0.167 0.167 0.167 0.167
Career Planning*GR 0.332 0.332 0.332 0.332 0.332
PST/CST*GR 0.342 0.341 0.341 0.341 0.341
Job Shadow*GR 0.423 0.426 0.426 0.426 0.426
Data Analy *GR 0.513 0.514 0.514 0.514 0.514
Vision / Mission*GR 0.707 0.705 0.705 0.705 0.705
SW Counc. *GR 0.9 0.903 0.903 0.903 0.903
Attendance Pol*GR 0.939 0.941 0.941 0.941 0.941
Guidance Counseling*GR Constant
Recog. Academ. Ach*GR Constant
College Fair*GR Constant
Academ. Planning*GR Constant
College Planning*GR Constant
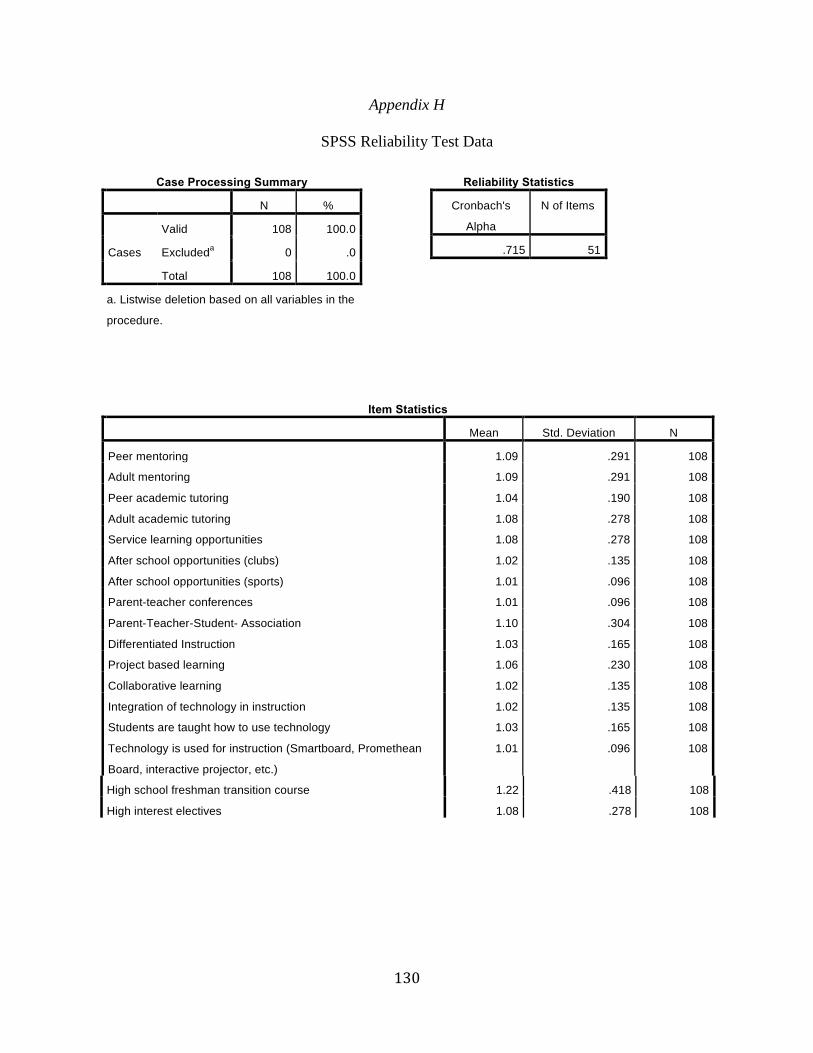
130
Appendix H
SPSS Reliability Test Data
125!!
Appendix G
SPSS Reliability Test Data
Case Processing Summary
N %
Cases
Valid 108 100.0
Excludeda 0 .0
Total 108 100.0
a. Listwise deletion based on all variables in the
procedure.
Reliability Statistics
Cronbach's
Alpha
N of Items
.715 51
High school freshman transition course 1.22 .418 108
High interest electives 1.08 .278 108
Item Statistics
Mean Std. Deviation N
Peer mentoring 1.09 .291 108
Adult mentoring 1.09 .291 108
Peer academic tutoring 1.04 .190 108
Adult academic tutoring 1.08 .278 108
Service learning opportunities 1.08 .278 108
After school opportunities (clubs) 1.02 .135 108
After school opportunities (sports) 1.01 .096 108
Parent-teacher conferences 1.01 .096 108
Parent-Teacher-Student- Association 1.10 .304 108
Differentiated Instruction 1.03 .165 108
Project based learning 1.06 .230 108
Collaborative learning 1.02 .135 108
Integration of technology in instruction 1.02 .135 108
Students are taught how to use technology 1.03 .165 108
Technology is used for instruction (Smartboard, Promethean
Board, interactive projector, etc.)
1.01 .096 108

131
2!
!
Character education program 1.09 .291 108
Social skills development 1.15 .357 108
College and career readiness skills are taught 1.03 .165 108
Student advisory period 1.13 .337 108
Response to intervention instructional support teams 1.04 .190 108
Career and technical education programs in house 1.06 .230 108
Career and technical education programs off campus 1.01 .096 108
Smart Scholars Program (Dual enrollment in college and high
school)
1.03 .165 108
Board of Cooperative Educational Services New Visions
Program
1.02 .135 108
International Baccalaureate Program 1.05 .211 108
University in the High School Courses 1.04 .190 108
Credit Recovery Program 1.16 .366 108
Summer School 1.03 .165 108
Project Lead the Way 1.06 .230 108
Distance learning courses 1.11 .316 108
Alternative education (off campus) 1.04 .190 108
Early college admissions program 1.02 .135 108
Advanced Placement (AP) courses 1.04 .190 108
Establish a vision or mission for learning 1.06 .230 108
Establish goals for learning 1.02 .135 108
Ongoing examination and analysis of pertinent student data
such as discipline, attendance, and performance on
assessments
1.05 .211 108
Guidance counseling services 1.00 .000 108
Social worker counseling 1.09 .291 108
Job shadowing opportunities 1.10 .304 108
Attendance policy 1.06 .230 108
Recognition of academic achievement 1.00 .000 108
Career fair 1.10 .304 108
College fair 1.00 .000 108
Pupil or study team services 1.06 .230 108
Academic planning and counseling 1.00 .000 108
College planning and counseling 1.00 .000 108
Career planning and counseling 1.01 .096 108
Instructional team planning 1.06 .247 108
Agency partnerships for family support 1.12 .327 108