the effect of detector sampling in wavefront-coded imaging systems
TRANSCRIPT
IOP PUBLISHING JOURNAL OF OPTICS A: PURE AND APPLIED OPTICS
J. Opt. A: Pure Appl. Opt. 11 (2009) 054002 (9pp) doi:10.1088/1464-4258/11/5/054002
The effect of detector sampling inwavefront-coded imaging systemsG Muyo and A R Harvey
School of Engineering and Physical Sciences, Heriot-Watt University,Edinburgh EH14 4AS, UK
E-mail: [email protected]
Received 9 October 2008, accepted for publication 4 December 2008Published 18 March 2009Online at stacks.iop.org/JOptA/11/054002
AbstractWe present a comprehensive study of the effect of detector sampling on wavefront-codedsystems. Two important results are obtained: the spurious response ratios are reduced inwavefront-coded systems with a cubic phase mask and detector sampling does not compromisethe restoration of wavefront-coded images with extended depth of field. Rigorous computersimulation of sampled wavefront-coded images shows an increased signal-to-aliased-noise ratioof up to 16% for a cubic phase mask with α = 5λ.
Keywords: wavefront coding, detector sampling, aliasing, digital image processing
1. Introduction
There has been a recent growth of interest in the useof computational imaging techniques to provide improvedperformance or an extra degree of freedom in the designprocess [1]. One example of these hybrid optical/digitaltechniques is wavefront coding which employs a refractivephase mask, to produce a non-conventional point-spreadfunction (PSF), combined with post-detection electronicprocessing to recover an image. The salient advantage is that ahigh-quality imaging can be achieved with greater tolerance toaberrations than is possible with traditional optical imaging [2].
In modern optical systems the optical image is sampledusing a pixelated detector. Good optical sensitivity requireslarge pixels and fast optics, and so it is common that the codedimage at the focal plane is undersampled by the pixelateddetector [3–5], which introduces sampling artefacts due toaliasing. Subsequent to image recovery, the spatial frequencycontent of the image is mixed down into the baseband of theimage where it interferes with the image spatial frequenciesthat fall within the baseband. This recorded image, with aliasartefacts, is then modulated by the inverse filter used for imagerecovery. In this paper, for the first time to our knowledge, weappraise the significance of artefacts introduced into recoveredimages by aliasing in the recorded wavefront-coded images.
In section 2, using Fourier theory, we present a briefintroduction to the response function of a sampled imagingsystem. The response function concept is similar to the optical
(OTF) function approach, although sampled imaging systemsin which aliasing occurs are not shift invariant. Our analysisfollows the work by Vollmerhausen et al [6] and Boreman [7],who provide a comprehensive aliasing model for conventionalsampled systems using Fourier theory. In section 3, the samemethod is applied to a wavefront-coded imaging system witha cubic phase mask for coding strengths in the range 0 �α � 10λ, and the impact of sampling on the performance isinvestigated by means of simple metrics.
Finally, in section 4, we present simulations of the acquisi-tion of sampled images with conventional and wavefront-codedimaging systems, based on the continuous/discrete/continuousimaging model derived by Park et al [8]. This characterizesaliasing as an additive scene-dependent noise and allows usto apply a signal-to-aliased-noise ratio metric to the sampledimages and evaluate the effects that coding and decoding animage have on information content and aliasing artefacts.
2. Overview of the response function of a sampledimaging system
The response function describes the spatial frequency transferfunction of a sampled imaging system and therefore providesinformation about the sampling artefacts that will be apparentin the image.
The response function of a sampled imaging system canbe derived by characterizing the system response to a point
1464-4258/09/054002+09$30.00 © 2009 IOP Publishing Ltd Printed in the UK1
J. Opt. A: Pure Appl. Opt. 11 (2009) 054002 G Muyo and A R Harvey
source. This is analogous to the method employed in non-sampled imaging systems; however, the response for thesampled system in the presence of aliasing is not isoplanatic orshift invariant: the system point-spread function and its Fouriertransform vary with the relative positions of the point source tothe sampling locations.
To simplify the mathematics, and without loss ofgenerality, we restrict the study to a one-dimensional samplingprocess. For most practical sampled imaging systems, thecomplete image formation of the point source by an array ofdiscrete detectors may be separated into two stages: the pre-sampling and sampling components. In the Fourier domain,the pre-sampling component accounts for the spatial frequencyfiltering due to the optics and finite size of the detectors, whichare described by the OTF, Hopt, and the pixel or footprinttransfer function, Hpix, respectively. The effect of spatialaveraging over pixels of finite size is well known, and can beexpressed as [7]
Hpix (ξ) = sinc (pξ) = sin (πpξ)
πpξ(1)
where p is the full width of the pixel and ξ is the spatialfrequency.
The sampling component of the response function canbe represented by a comb of delta functions with samplingfrequency fsam = 1/X , where X is the interval betweensampling points; thus
⊥⊥ (ξ) =+∞∑
n=−∞δ (ξ − n fsam). (2)
The three transfer functions Hopt, Hpix, and ⊥⊥ multiplyin the frequency domain to yield a combined response functionfor the imaging and sampling process, which yields [6]
R (ξ, φ) = Hpix (ξ)
+∞∑
n=−∞Hopt (ξ − n fsam) exp (inφ). (3)
It can be observed from (3) that the sampling processreplicates the OTF, Hopt, at each integer n multiple of thesampling frequency fsam = 1/X . All of the replicated spectraare multiplied by the pixel transfer function Hpix centred at thespatial frequency origin ξ = 0 to yield the final spectrum. Eachreplicated spectrum varies in phase from the adjacent spectrumby the sample phase increment, φ. Due to this phase variation,the sum in (3) is a function of φ, and therefore the sampledresponse function R(ξ, φ) will depend on the relative positionof the pre-sampled point-spread function and the samplingpoints. The mathematical derivation of the sampling processshows two distinct contributions to R(ξ, φ): a transfer functionand a spurious response component. The transfer function orbaseband spectrum corresponds to n = 0 and is independentof the sampling interval; it is simply the product of the OTFHopt and the transfer function of the pixel Hpix. The spuriousresponse is determined by multiplying Hpix by all the replicatedspectra except the one located at the origin (n = 0), andis conditioned by the sampling frequency fsam and samplingphase φ. The phase dependence of the spurious response
accounts for variations in the system PSF as the detector arrayis moved across the point source. The region of overlapbetween the spurious response and the baseband spectrumvaries with the sampling frequency and is the main indicatorof the magnitude of the sampling artefact in the image. Forsmall sampling frequencies, the spurious response completelycorrupts the baseband.
3. Response function of a sampled imaging systemwith wavefront coding
As an illustrative example, we consider an imaging system witha cubic phase mask in the aperture stop and quantify the impactof sampling on the overall OTF performance, and in particular,the effect of aliasing on the restorability of wavefront-codedimages with extended depth of field. In this assessment, nopost-detection display transfer functions such as the MTFsfrom the observer’s eye and display (cathode ray tube spot,LCD, etc) are included. The same sampling model is appliedto the imaging system without the cubic phase mask and theresults obtained from both schemes before and after post-detection digital signal processing are compared.
The imaging system consists of an optical system with cut-off frequency fcut ( fcut = 1/λF/#, where λ is the wavelengthand F/# is the f -number of the lens) and a focal planearray with pixel pitch X such that the sampling frequencyis half the optical cut-off frequency; thus fsam = fcut/2.The Nyquist frequency, fnyq, of this imaging system is thenfnyq = fsam/2 = fcut/4. We assume a pixel fill-factorof 100%. This generic imaging system is comparable to anuncooled thermal imager with an F/1.2 germanium optics( fcut = 80 cyc mm−1 at wavelength λ = 10.5 μm) and focalplane array with pixel size X = 25 μm (Nyquist frequencyfnyq = 20 cycles mm−1, assuming a 100% fill-factor). Inthe visible region, for example, this sampled imaging systemrepresents an F/5.6 optical system at λ = 0.587 μm togetherwith a focal plane array whose pixel pitch is 6.45 μm.
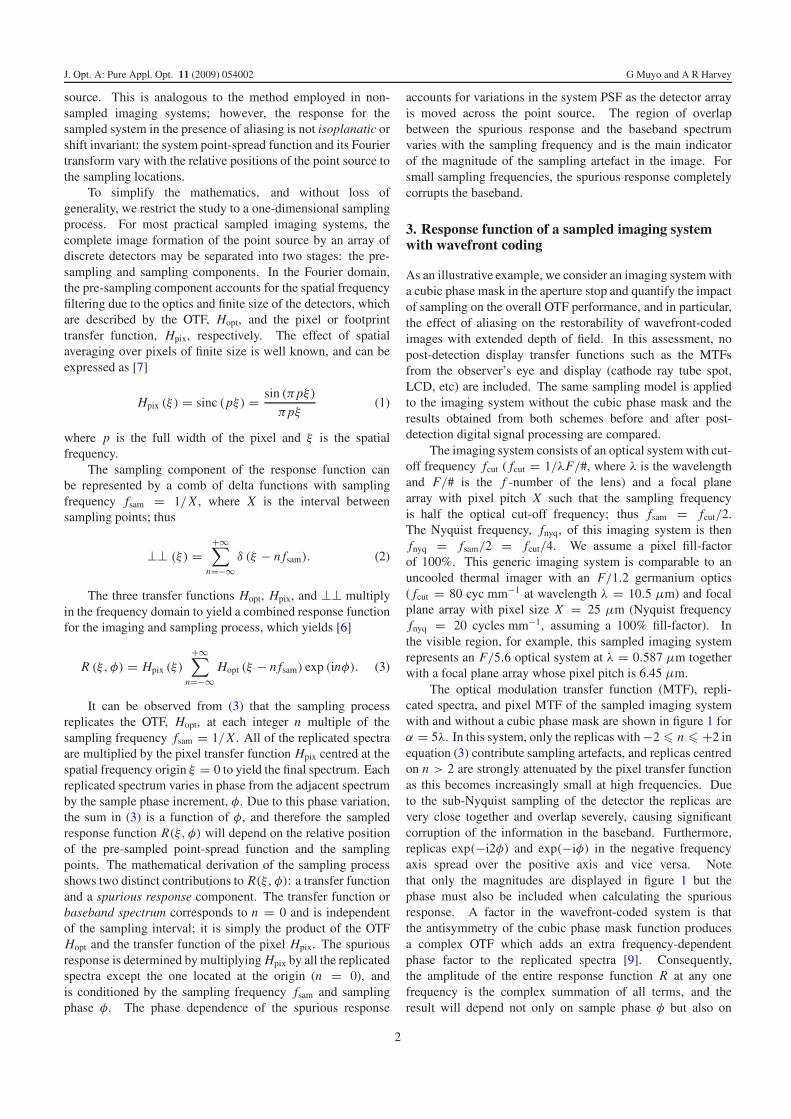
The optical modulation transfer function (MTF), repli-cated spectra, and pixel MTF of the sampled imaging systemwith and without a cubic phase mask are shown in figure 1 forα = 5λ. In this system, only the replicas with −2 � n � +2 inequation (3) contribute sampling artefacts, and replicas centredon n > 2 are strongly attenuated by the pixel transfer functionas this becomes increasingly small at high frequencies. Dueto the sub-Nyquist sampling of the detector the replicas arevery close together and overlap severely, causing significantcorruption of the information in the baseband. Furthermore,replicas exp(−i2φ) and exp(−iφ) in the negative frequencyaxis spread over the positive axis and vice versa. Notethat only the magnitudes are displayed in figure 1 but thephase must also be included when calculating the spuriousresponse. A factor in the wavefront-coded system is thatthe antisymmetry of the cubic phase mask function producesa complex OTF which adds an extra frequency-dependentphase factor to the replicated spectra [9]. Consequently,the amplitude of the entire response function R at any onefrequency is the complex summation of all terms, and theresult will depend not only on sample phase φ but also on
2
J. Opt. A: Pure Appl. Opt. 11 (2009) 054002 G Muyo and A R Harvey
Figure 1. Optics MTF (solid black curve), replicated spectra (dotted) and pixel transfer function (solid grey curve) of a sampled imagingsystem without (left) and with a cubic phase mask α = 5λ prior to post-detection processing (right).
Figure 2. Magnitude of the transfer function (optics OTF and pixel OTF) and spurious response (replicated spectra and pixel OTF centred atthe frequency origin) as a function of phase sampling for a wavefront coding system with a cubic phase mask α = 5λ (left) and a traditionalsystem (right) for two values of the sample phase. No post-detection digital processing has been applied.
the magnitude of the wavefront-coded distortion. As a result,the complex summation of wavefront-coded OTFs produces ahighly modulated and intricate spurious response across thespatial frequency domain, as illustrated in figure 2 for φ = 0and π/2. The baseband and spurious response in figure 2 werecalculated from (3), i.e.
Baseband: B(ξ) = Hpix(ξ)Hopt(ξ)
Spurious response: S(ξ, φ) = Hpix(ξ)
×+2∑
n=−2
Hopt(ξ − n f ) exp(inφ) with n �= 0.
(4)
Note that the wavefront-coded baseband and spuriousterms displayed in figure 2 correspond to the sampled PSFat the sensor and not to the decoded PSF: post-detection
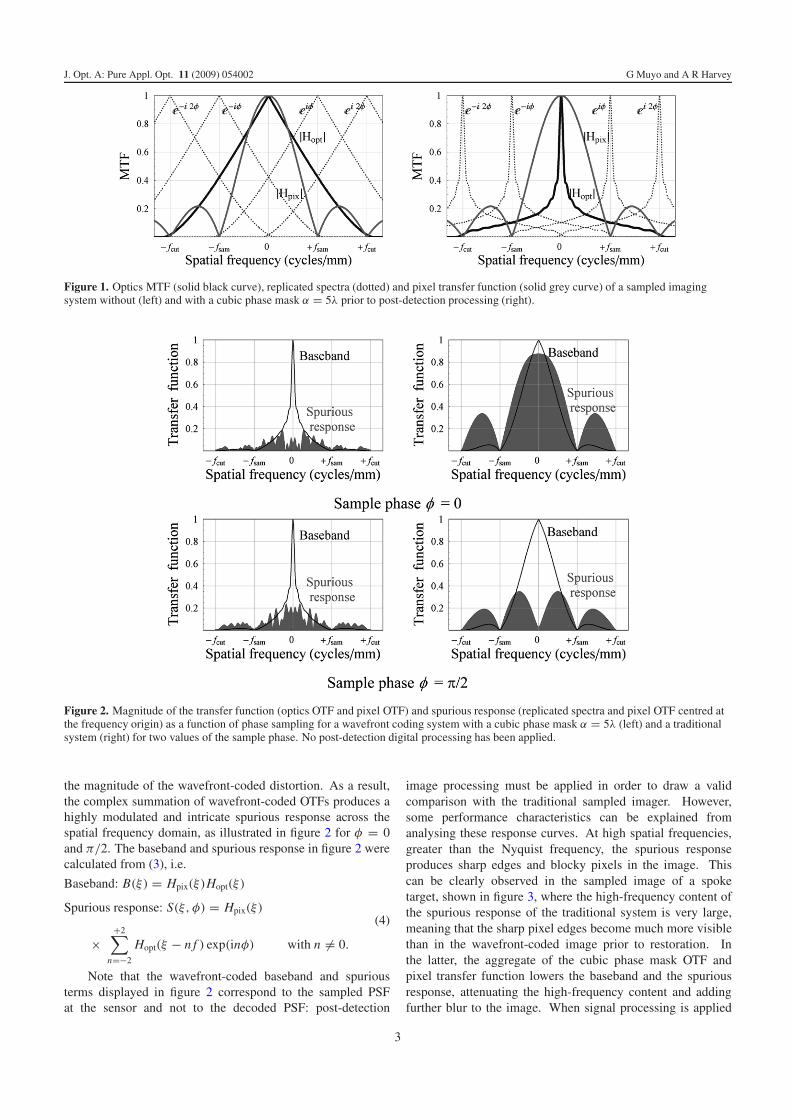
image processing must be applied in order to draw a validcomparison with the traditional sampled imager. However,some performance characteristics can be explained fromanalysing these response curves. At high spatial frequencies,greater than the Nyquist frequency, the spurious responseproduces sharp edges and blocky pixels in the image. Thiscan be clearly observed in the sampled image of a spoketarget, shown in figure 3, where the high-frequency content ofthe spurious response of the traditional system is very large,meaning that the sharp pixel edges become much more visiblethan in the wavefront-coded image prior to restoration. Inthe latter, the aggregate of the cubic phase mask OTF andpixel transfer function lowers the baseband and the spuriousresponse, attenuating the high-frequency content and addingfurther blur to the image. When signal processing is applied
3
J. Opt. A: Pure Appl. Opt. 11 (2009) 054002 G Muyo and A R Harvey
Figure 3. Detected image with a conventional sampled traditionaloptical system (left) and with a sampled wavefront-coded system(right). Clearly, the significantly higher spurious response content ofthe traditional system compared to the wavefront-coded systemaccentuates the blocky nature of the pixels.
to the sampled-coded image to compensate for the effectsof the cubic mask, the filtering restores simultaneously thewavefront-coded bandpass and the spurious response; hence,aliasing-related artefacts become more apparent in the restoredimage. The absence of zeros in the baseband spectrum withthe cubic phase mask allows the use of a simple inversefilter to recover a transfer function identical to that of thetraditional system. The inverse filter is implemented by usingthe following expressions:
Restored baseband: B ′ (ξ) = Hdif (ξ)
Hopt (ξ)B (ξ)
Restored spurious response: S′ (ξ, φ) = Hdif (ξ)
Hopt (ξ)S (ξ, φ)
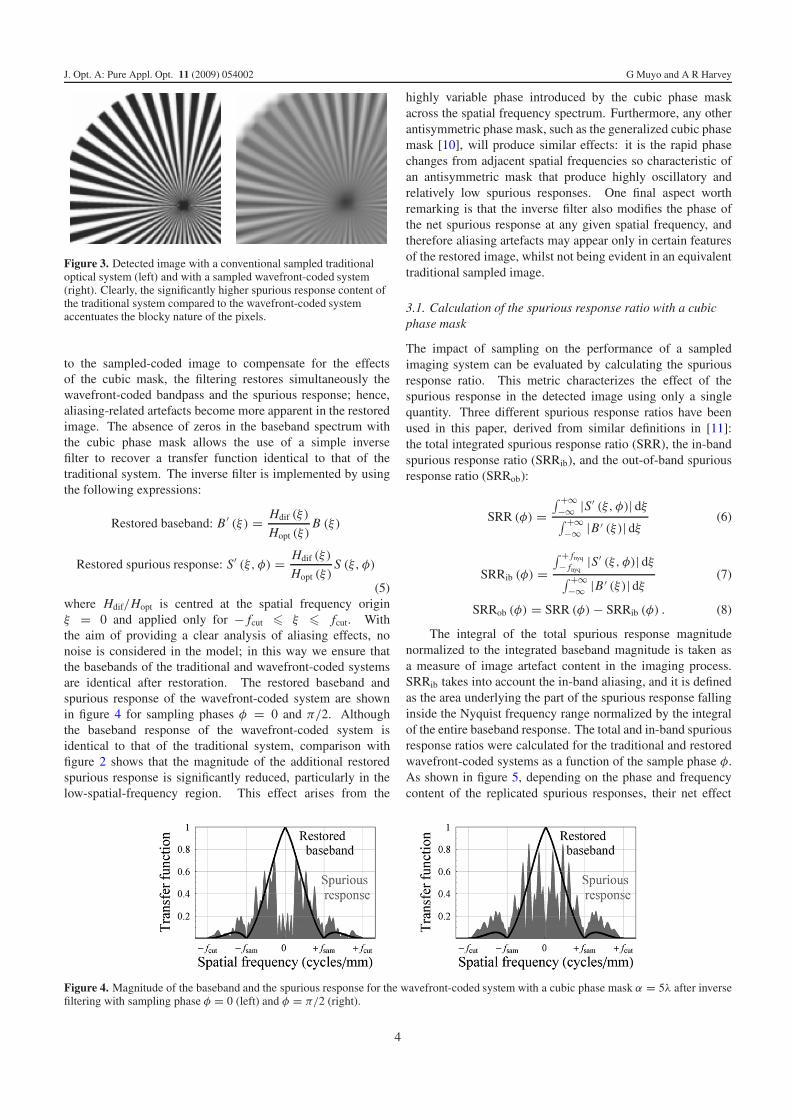
(5)where Hdif/Hopt is centred at the spatial frequency originξ = 0 and applied only for − fcut � ξ � fcut. Withthe aim of providing a clear analysis of aliasing effects, nonoise is considered in the model; in this way we ensure thatthe basebands of the traditional and wavefront-coded systemsare identical after restoration. The restored baseband andspurious response of the wavefront-coded system are shownin figure 4 for sampling phases φ = 0 and π/2. Althoughthe baseband response of the wavefront-coded system isidentical to that of the traditional system, comparison withfigure 2 shows that the magnitude of the additional restoredspurious response is significantly reduced, particularly in thelow-spatial-frequency region. This effect arises from the
highly variable phase introduced by the cubic phase maskacross the spatial frequency spectrum. Furthermore, any otherantisymmetric phase mask, such as the generalized cubic phasemask [10], will produce similar effects: it is the rapid phasechanges from adjacent spatial frequencies so characteristic ofan antisymmetric mask that produce highly oscillatory andrelatively low spurious responses. One final aspect worthremarking is that the inverse filter also modifies the phase ofthe net spurious response at any given spatial frequency, andtherefore aliasing artefacts may appear only in certain featuresof the restored image, whilst not being evident in an equivalenttraditional sampled image.
3.1. Calculation of the spurious response ratio with a cubicphase mask
The impact of sampling on the performance of a sampledimaging system can be evaluated by calculating the spuriousresponse ratio. This metric characterizes the effect of thespurious response in the detected image using only a singlequantity. Three different spurious response ratios have beenused in this paper, derived from similar definitions in [11]:the total integrated spurious response ratio (SRR), the in-bandspurious response ratio (SRRib), and the out-of-band spuriousresponse ratio (SRRob):
SRR (φ) =∫ +∞−∞ |S′ (ξ, φ)| dξ∫ +∞−∞ |B ′ (ξ)| dξ
(6)
SRRib (φ) =∫ + fnyq
− fnyq|S′ (ξ, φ)| dξ
∫ +∞−∞ |B ′ (ξ)| dξ
(7)
SRRob (φ) = SRR (φ) − SRRib (φ) . (8)
The integral of the total spurious response magnitudenormalized to the integrated baseband magnitude is taken asa measure of image artefact content in the imaging process.SRRib takes into account the in-band aliasing, and it is definedas the area underlying the part of the spurious response fallinginside the Nyquist frequency range normalized by the integralof the entire baseband response. The total and in-band spuriousresponse ratios were calculated for the traditional and restoredwavefront-coded systems as a function of the sample phase φ.As shown in figure 5, depending on the phase and frequencycontent of the replicated spurious responses, their net effect
Figure 4. Magnitude of the baseband and the spurious response for the wavefront-coded system with a cubic phase mask α = 5λ after inversefiltering with sampling phase φ = 0 (left) and φ = π/2 (right).
4

J. Opt. A: Pure Appl. Opt. 11 (2009) 054002 G Muyo and A R Harvey
Figure 5. Magnitude of the total spurious response (left) and magnitude of the in-band spurious response (right), as a function of phasesampling for both traditional (grey curve) and restored wavefront coding systems (dark curve).
Figure 6. Mean magnitude over the sampling phase of the full-band (left) and in-band (right) spurious response ratios, as a function of thecubic phase mask parameter α.
becomes destructive or constructive in nature and oscillates inmagnitude. However, the SRR can be condensed into a singlenumber in order to predict a good performance measurementby taking the average across the sampling phase 0 � φ � 2π .The phase-averaged SRR and SRRib were calculated for theabove-mentioned conventional sampled imager: SRR = 1.05and SRRib = 0.54; and for the wavefront-coded sampledimager after restoration: SRR = 0.94 and SRRib = 0.43.The calculation of phase-averaged spurious response ratioswas also extended to cubic phase masks with coding strengths0 � α � 10λ. The results are illustrated in figure 6and show that the total and in-band spurious responses ratiosremain practically constant with α. This suggests that beyond acertain degree of mask-induced phase change between adjacentspatial frequencies, the number of destructive and constructivespurious events balances out, and hence the spurious responseratios remain unchanged for any value of α > 1λ.
3.2. Defocus tolerance with a wavefront-coded sampledimaging system
We have shown that detector sampling of wavefront PSFs doesnot affect in a negative way the restoration process by whichthe diffraction-limited performance of the baseband spectrumis subsequently recovered. Furthermore, we have demonstratedthat, in the absence of noise, wavefront coding enables a slightreduction of artefacts in the restored images as expressed by thespurious response ratio. In this section, the impact of samplingon the ability of a wavefront-coded system to mitigate defocusaberration is investigated. Whereas for a conventional imagingsystem defocus causes a marked reduction or even nulls in the
MTF, for a wavefront-coded system, variations in magnitudeare much less, but variations in the phase of the OTF canintroduce artefacts. We consider here how these artefacts areaffected by aliasing. We restrict the discussion to an examplecubic phase mask with α = 5λ, although the results shownhere can be extended to any antisymmetric phase mask, andin particular to the family of cubic phase masks with differentvalues of α.
The pre-processed (detected) baseband B(ξ) and spuriousresponse S(ξ , φ) of a wavefront-coded system were generatedfor a set of defocus coefficients W20 varying from 0 to 5in units of wavelength. Subsequently, the coded basebandsand spurious response functions were inverse filtered usingthe wavefront-coded OTF associated with no defocus andthe diffraction-limited OTF. This process can be expressedmathematically by simply introducing the defocus variableW20 in (5), which yields
Restored baseband: B ′(ξ, W20)
= Hdif(ξ)
Hopt(ξ, W20 = 0)B(ξ, W20)
Restored spurious response: S′(ξ, φ, W20)
= Hdif(ξ)
Hopt(ξ, W20 = 0)S(ξ, φ, W20).
(9)
The result of restoring the baseband B(ξ , W20) withthe in-focus OTF Hopt(ξ, 0) is identical to that of a well-sampled wavefront-coded imager where the baseband containsthe pixel transfer function. The inverse filtering of thedefocused basebands introduces identical phase and magnitude
5
J. Opt. A: Pure Appl. Opt. 11 (2009) 054002 G Muyo and A R Harvey
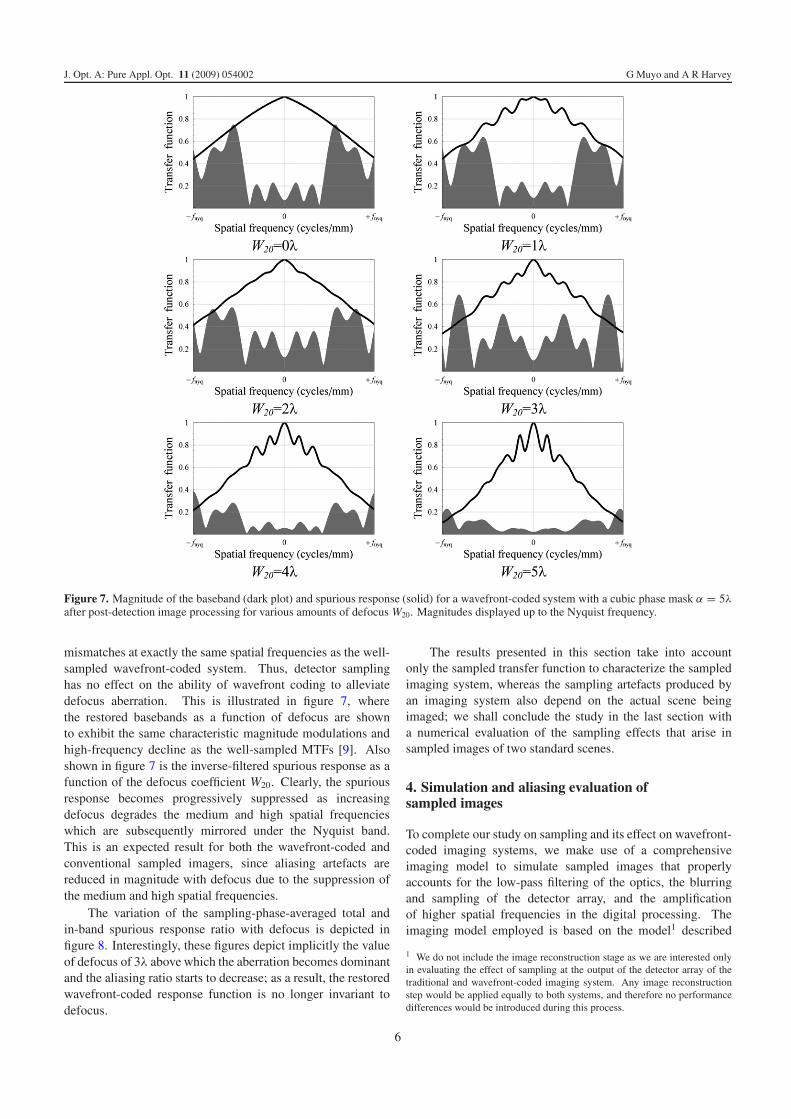
Figure 7. Magnitude of the baseband (dark plot) and spurious response (solid) for a wavefront-coded system with a cubic phase mask α = 5λafter post-detection image processing for various amounts of defocus W20. Magnitudes displayed up to the Nyquist frequency.
mismatches at exactly the same spatial frequencies as the well-sampled wavefront-coded system. Thus, detector samplinghas no effect on the ability of wavefront coding to alleviatedefocus aberration. This is illustrated in figure 7, wherethe restored basebands as a function of defocus are shownto exhibit the same characteristic magnitude modulations andhigh-frequency decline as the well-sampled MTFs [9]. Alsoshown in figure 7 is the inverse-filtered spurious response as afunction of the defocus coefficient W20. Clearly, the spuriousresponse becomes progressively suppressed as increasingdefocus degrades the medium and high spatial frequencieswhich are subsequently mirrored under the Nyquist band.This is an expected result for both the wavefront-coded andconventional sampled imagers, since aliasing artefacts arereduced in magnitude with defocus due to the suppression ofthe medium and high spatial frequencies.
The variation of the sampling-phase-averaged total andin-band spurious response ratio with defocus is depicted infigure 8. Interestingly, these figures depict implicitly the valueof defocus of 3λ above which the aberration becomes dominantand the aliasing ratio starts to decrease; as a result, the restoredwavefront-coded response function is no longer invariant todefocus.
The results presented in this section take into accountonly the sampled transfer function to characterize the sampledimaging system, whereas the sampling artefacts produced byan imaging system also depend on the actual scene beingimaged; we shall conclude the study in the last section witha numerical evaluation of the sampling effects that arise insampled images of two standard scenes.
4. Simulation and aliasing evaluation ofsampled images
To complete our study on sampling and its effect on wavefront-coded imaging systems, we make use of a comprehensiveimaging model to simulate sampled images that properlyaccounts for the low-pass filtering of the optics, the blurringand sampling of the detector array, and the amplificationof higher spatial frequencies in the digital processing. Theimaging model employed is based on the model1 described
1 We do not include the image reconstruction stage as we are interested onlyin evaluating the effect of sampling at the output of the detector array of thetraditional and wavefront-coded imaging system. Any image reconstructionstep would be applied equally to both systems, and therefore no performancedifferences would be introduced during this process.
6

J. Opt. A: Pure Appl. Opt. 11 (2009) 054002 G Muyo and A R Harvey
Figure 8. Mean magnitude across the sample phase of the full-band (left) and in-band (right) spurious response ratios, as a function of thedefocus coefficient W20, for α = 5λ after post-detection image processing.
in detail by Park et al [8] which considers aliasing as ascene-dependent additive noise. It enables the baseband andspurious components of the sampled images to be calculatedand displayed separately whilst providing metrics to quantifythe magnitude of aliasing. The input to the simulation is acontinuous scene o projected by the imaging optics onto thedetector. The scene is low-pass filtered by the OTF, averagedby the pixel area, and sampled by a detector array to producean N × N digital image (for simplicity the detector is assumedto be square). In the case of the wavefront-coded system, theN × N image is subsequently decoded to obtain a sharp image.For clarity, we assume that no random noise is introduced bythe sensor electronics. The continuous scene o is assumed tobe bandlimited and is represented by a Fourier series whosecoefficients are given by O[ν1, ν2]. The Fourier coefficientscan be obtained from an M × M high-resolution digital imageof the scene. To model a sampled imaging system properly Mmust be chosen several times larger than N so as to allow forsignificant spectral energy beyond the sampling frequency.
By considering aliasing as scene-dependent additive noise,we can express the discrete Fourier spectrum of a sampledimage as the sum of two components (in an analogous wayto the response function of a sampled imager); thus
I [ν1, ν2] = Bi [ν1, ν2] + Si [ν1, ν2] (10)
where Bi is the image baseband and the Si is its aliased noiseterm or spurious response. The baseband (or Fourier spectrumof the pre-sampled image) is defined by
Bi [ν1, ν2] = Hpix (ν1/P, ν2/P) Hopt (ν1/P, ν2/P) O [ν1, ν2] ,
(11)where P is the width of the square detector; thus P = N X(X the pixel pitch). The spurious components of the sampledimage are calculated by adding replicas of the spectrum ofthe pre-sampled image (without including the pixel transferfunction) shifted at multiples of the sampling frequency, whichyields
Si [ν1, ν2] = Hpix (ν1/P, ν2/P)
×+∞∑
k1=−∞
+∞∑
k2=−∞Hopt
(ν1 − k1 N
P,ν2 − k2 N
P
)
× O [ν1 − k1 N, ν2 − k2 N ] , with [k1, k2] �= [0, 0] .
(12)
Figure 9. 1280 × 1280 pixel high-resolution spoke target andthermal image for the sampling model. The original thermal image isfrom Sierra Pacific Innovations Corporation (www.x20.org).
The functions with ( ) and [ ] are used to representcontinuous and discrete components, respectively. Post-detection digital processing restores the wavefront-codedbaseband spectrum to match the baseband spectrum ofthe traditional system, which we assume to be diffractionlimited. Therefore, after restoration using an inverse filter,equations (11) and (12) become
B ′i [ν1, ν2] = Hdif (ν1/P1, ν2/P2)
Hopt (ν1/P1, ν2/P2)Bi [ν1, ν2] , (13)
and
S′i [ν1, ν2] = Hdif (ν1/P1, ν2/P2)
Hopt (ν1/P1, ν2/P2)Si [ν1, ν2] . (14)
Aliasing can be quantified by comparing both componentsreferenced to the input scene: Rb = B ′
i [ν1, ν2]/O[ν1, ν2] andRs = S′
i [ν1, ν2]/O[ν1, ν2], provided O[ν1, ν2] �= 0. Themagnitude of these ratios allows us to establish the spatialfrequency region where Rs > Rb and quantify the degree ofthe aliasing component.
This quantitative assessment has been applied to two high-resolution scenes, see figure 9: a spoke target and thermalimage with 1280 × 1280 pixels, sampled by a 320 × 320detector with sampling frequency at half the cut-off frequencyof the optical system, fsam = fcut/2 (equivalent to the imagingsystem used to derived the response function in section 3).The former scene enables ready observation of artefacts, whilstthe latter enables a more representative appreciation of theirsubjective significance.
7
J. Opt. A: Pure Appl. Opt. 11 (2009) 054002 G Muyo and A R Harvey
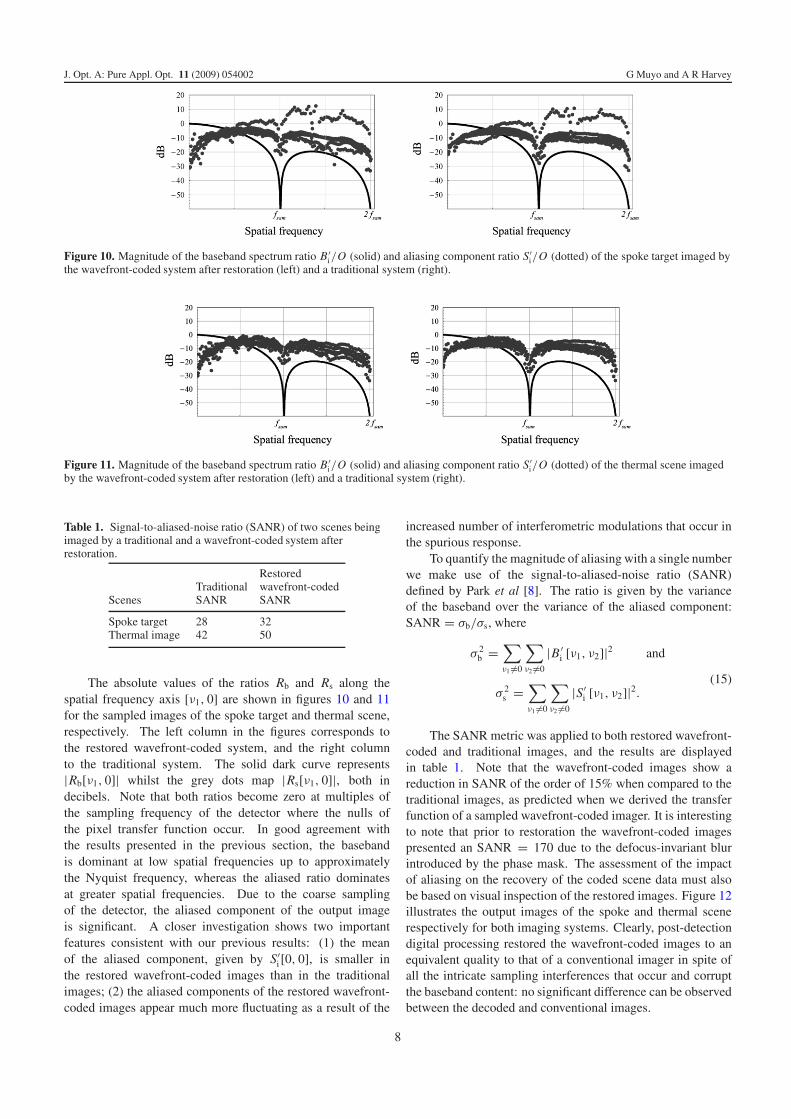
Figure 10. Magnitude of the baseband spectrum ratio B ′i/O (solid) and aliasing component ratio S′
i/O (dotted) of the spoke target imaged bythe wavefront-coded system after restoration (left) and a traditional system (right).
Figure 11. Magnitude of the baseband spectrum ratio B ′i/O (solid) and aliasing component ratio S′
i/O (dotted) of the thermal scene imagedby the wavefront-coded system after restoration (left) and a traditional system (right).
Table 1. Signal-to-aliased-noise ratio (SANR) of two scenes beingimaged by a traditional and a wavefront-coded system afterrestoration.
ScenesTraditionalSANR
Restoredwavefront-codedSANR
Spoke target 28 32Thermal image 42 50
The absolute values of the ratios Rb and Rs along thespatial frequency axis [ν1, 0] are shown in figures 10 and 11for the sampled images of the spoke target and thermal scene,respectively. The left column in the figures corresponds tothe restored wavefront-coded system, and the right columnto the traditional system. The solid dark curve represents|Rb[ν1, 0]| whilst the grey dots map |Rs[ν1, 0]|, both indecibels. Note that both ratios become zero at multiples ofthe sampling frequency of the detector where the nulls ofthe pixel transfer function occur. In good agreement withthe results presented in the previous section, the basebandis dominant at low spatial frequencies up to approximatelythe Nyquist frequency, whereas the aliased ratio dominatesat greater spatial frequencies. Due to the coarse samplingof the detector, the aliased component of the output imageis significant. A closer investigation shows two importantfeatures consistent with our previous results: (1) the meanof the aliased component, given by S′
i [0, 0], is smaller inthe restored wavefront-coded images than in the traditionalimages; (2) the aliased components of the restored wavefront-coded images appear much more fluctuating as a result of the
increased number of interferometric modulations that occur inthe spurious response.
To quantify the magnitude of aliasing with a single numberwe make use of the signal-to-aliased-noise ratio (SANR)defined by Park et al [8]. The ratio is given by the varianceof the baseband over the variance of the aliased component:SANR = σb/σs, where
σ 2b =
∑
ν1 �=0
∑
ν2 �=0
|B ′i [ν1, ν2]|2 and
σ 2s =
∑
ν1 �=0
∑
ν2 �=0
|S′i [ν1, ν2]|2.
(15)
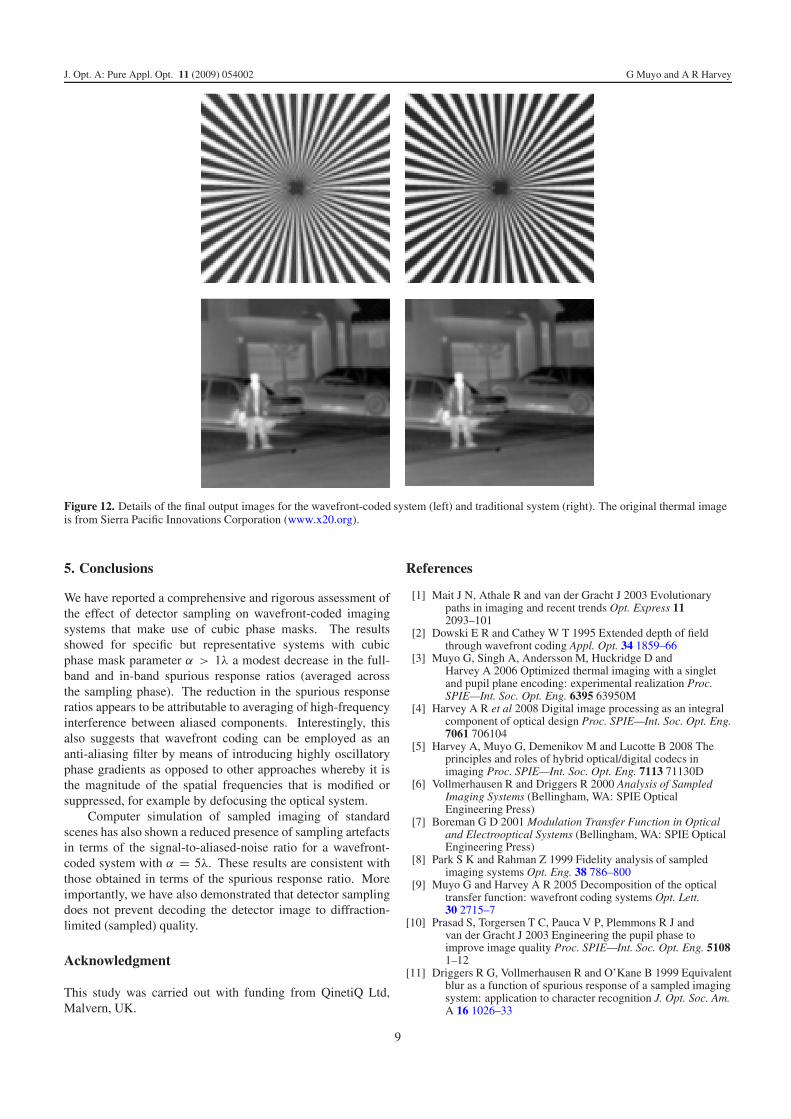
The SANR metric was applied to both restored wavefront-coded and traditional images, and the results are displayedin table 1. Note that the wavefront-coded images show areduction in SANR of the order of 15% when compared to thetraditional images, as predicted when we derived the transferfunction of a sampled wavefront-coded imager. It is interestingto note that prior to restoration the wavefront-coded imagespresented an SANR = 170 due to the defocus-invariant blurintroduced by the phase mask. The assessment of the impactof aliasing on the recovery of the coded scene data must alsobe based on visual inspection of the restored images. Figure 12illustrates the output images of the spoke and thermal scenerespectively for both imaging systems. Clearly, post-detectiondigital processing restored the wavefront-coded images to anequivalent quality to that of a conventional imager in spite ofall the intricate sampling interferences that occur and corruptthe baseband content: no significant difference can be observedbetween the decoded and conventional images.
8
J. Opt. A: Pure Appl. Opt. 11 (2009) 054002 G Muyo and A R Harvey
Figure 12. Details of the final output images for the wavefront-coded system (left) and traditional system (right). The original thermal imageis from Sierra Pacific Innovations Corporation (www.x20.org).
5. Conclusions
We have reported a comprehensive and rigorous assessment ofthe effect of detector sampling on wavefront-coded imagingsystems that make use of cubic phase masks. The resultsshowed for specific but representative systems with cubicphase mask parameter α > 1λ a modest decrease in the full-band and in-band spurious response ratios (averaged acrossthe sampling phase). The reduction in the spurious responseratios appears to be attributable to averaging of high-frequencyinterference between aliased components. Interestingly, thisalso suggests that wavefront coding can be employed as ananti-aliasing filter by means of introducing highly oscillatoryphase gradients as opposed to other approaches whereby it isthe magnitude of the spatial frequencies that is modified orsuppressed, for example by defocusing the optical system.
Computer simulation of sampled imaging of standardscenes has also shown a reduced presence of sampling artefactsin terms of the signal-to-aliased-noise ratio for a wavefront-coded system with α = 5λ. These results are consistent withthose obtained in terms of the spurious response ratio. Moreimportantly, we have also demonstrated that detector samplingdoes not prevent decoding the detector image to diffraction-limited (sampled) quality.
Acknowledgment
This study was carried out with funding from QinetiQ Ltd,Malvern, UK.
References
[1] Mait J N, Athale R and van der Gracht J 2003 Evolutionarypaths in imaging and recent trends Opt. Express 112093–101
[2] Dowski E R and Cathey W T 1995 Extended depth of fieldthrough wavefront coding Appl. Opt. 34 1859–66
[3] Muyo G, Singh A, Andersson M, Huckridge D andHarvey A 2006 Optimized thermal imaging with a singletand pupil plane encoding: experimental realization Proc.SPIE—Int. Soc. Opt. Eng. 6395 63950M
[4] Harvey A R et al 2008 Digital image processing as an integralcomponent of optical design Proc. SPIE—Int. Soc. Opt. Eng.7061 706104
[5] Harvey A, Muyo G, Demenikov M and Lucotte B 2008 Theprinciples and roles of hybrid optical/digital codecs inimaging Proc. SPIE—Int. Soc. Opt. Eng. 7113 71130D
[6] Vollmerhausen R and Driggers R 2000 Analysis of SampledImaging Systems (Bellingham, WA: SPIE OpticalEngineering Press)
[7] Boreman G D 2001 Modulation Transfer Function in Opticaland Electrooptical Systems (Bellingham, WA: SPIE OpticalEngineering Press)
[8] Park S K and Rahman Z 1999 Fidelity analysis of sampledimaging systems Opt. Eng. 38 786–800
[9] Muyo G and Harvey A R 2005 Decomposition of the opticaltransfer function: wavefront coding systems Opt. Lett.30 2715–7
[10] Prasad S, Torgersen T C, Pauca V P, Plemmons R J andvan der Gracht J 2003 Engineering the pupil phase toimprove image quality Proc. SPIE—Int. Soc. Opt. Eng. 51081–12
[11] Driggers R G, Vollmerhausen R and O’Kane B 1999 Equivalentblur as a function of spurious response of a sampled imagingsystem: application to character recognition J. Opt. Soc. Am.A 16 1026–33
9