the effect of bilateral services trade barriers on goods trade
TRANSCRIPT

The Effect of Bilateral Services Trade Barriers
on Goods Trade
N. Nergiz Dincer* and Ayça Tekin-Koru†
October 2017
Abstract: The objective of this paper is to investigate the impact of policy-induced trade barriers
in finance, knowledge intensive producer services (KIPS), telecom, transport and wholesale and
retail (W&R) on goods trade using the World Input-Output Database covering 43 countries over
the period 2000-2014. A three-stage analysis is employed. The measures of bilateral services trade
barriers calculated in each of the five key services sectors in the first stage are decomposed into its
cultural/geographical and policy-induced parts in the second stage. Policy-induced barriers to
services trade are used in the structural gravity estimations of intermediate and final goods trade
across countries in the final stage. The results demonstrate significant and robust adverse effects
of barriers to services trade on goods trade independent of intermediate or final status. However,
when the level of development is taken into consideration, there are marked differences in the
impact of these barriers on goods trade.
Keywords: bilateral services trade barriers, goods exporting, gravity.
JEL Codes: F10, F14
* Department of Economics, TED University, Ziya Gokalp Bul. No:48, Kolej, Ankara, Turkey. Phone:
+90(312)585-0038. E-mail: [email protected] † Department of Economics, TED University, Ziya Gokalp Bul. No:48, Kolej, Ankara, Turkey. Phone:
+90(312)585-0034. E-mail: [email protected]

2
1. Introduction
The rising international fragmentation of production in the recent decades has created a
new trade-investment-services nexus. Core elements in this structure are finance,
knowledge intensive producer services (KIPS), telecom, transport and wholesale and retail
(W&R) as these services are important inputs in production and a significant part of final
consumption.
The objective of this paper is to analyze the impact of policy-induced bilateral barriers
to trade in these key services sectors on goods trade. There is an extensive amount of
research on the effect of different types of barriers on trade. It has been shown time and
again that the measures taken to reduce goods trade were successful in their purpose.
Related to this, a rather new line of research finds that the measures to restrict services
trade diminish trade in services. Concurrently, the global value chains literature shows
strong evidence about goods and services production/trade becoming increasingly
intertwined in the second age of globalization due to falling transport and transaction
costs (Baldwin and Lopez-Gonzalez, 2014). However, the literature has not yet rigorously
established the role of policy-induced bilateral services trade barriers on goods trade,
which constitutes the central thrust of the current paper.
Increasing global competition has reduced the margins of error in production and made
it necessary to have sophisticated process design, supply chain management, software,
high-speed telecommunications, effective transportation, and universal and safe financial
services (Nordås and Rouzet, 2015). Therefore, barriers to trade of services are expected
to be associated with lower trade volumes not only in services but also in goods.
This paper employs a three-stage approach in analyzing the impact of policy-induced
bilateral barriers to services trade on goods trade using data from the World Input Output
Database (WIOD) for 43 countries spanning the period 2000-2014.
The first stage of the analysis involves calculating barriers to trade in services. There
are survey based measures in the literature that are used as proxies of observable services
trade barriers (STBs) such as the OECD Product Market Regulation Database3, the World
Bank Services Trade Restrictiveness Index4 and the OECD Services Trade Restrictiveness
Index5. Although these proxies provide useful information, they have several drawbacks.
First, data are not available for a long and continuous time span, which hinders the time
variation analysis. Second, they reflect services restrictiveness on a unilateral basis
lacking important bilateral barrier information. Third, as the data are survey based,
subjectivity of the responses may create biased analysis. We use Novy (2013) methodology,
which overcomes some of these disadvantages of the survey-based databases in calculating
the trade barriers in services.
The second stage of the analysis is to estimate bilateral policy-induced barriers in
services trade. As argued by Nordås and Rouzet (2015) as well, measures of STBs designed
3 See Kox and Nordås (2009) and Schwellnus (2007) 4 See Van der Marel and Shepherd (2013) 5 See Nordås and Rouzet (2015)
3
and calculated so far are unable to distinguish between natural barriers, such as cultural
and geographical barriers (CGBs) and policy-induced barriers in services trade (PIBs).
CGBs affect both goods and services trade, though the effect may not be the same. The
timely question here is the impact of bilateral PIBs on goods trade in time, i.e. the impact
of bilateral liberalization or protection efforts, which leads us to make a novel contribution
by decomposing STBs into CGBs and PIBs and analyze the impact of bilateral PIBs
separately. As a result, in this stage of the analysis, we decompose services trade barriers
into their cultural/geographic and policy-induced components by regressing STBs on
CGBs. The residual vector approximates bilateral PIBs, which pro bilateral regulations in
services trade, as suggested by Francois et al. (2007).
The third stage of our analysis is to estimate a structural gravity equation of goods
trade6 by including bilateral PIBs to trade in five services sectors (finance, KIPS, telecom,
transport and W&R) as explanatory variables.
In the first stage, after calculating STBs we explore if there is a distinction between
intermediate and final use. This is motivated by the fact that in the international input-
output framework, when a service is produced, it can be used in the domestic and foreign
production as well as domestic and final consumption. Our results show that STBs in final
services trade is slightly higher than the intermediate ones but correlated at above 95
percent. Therefore, in all the subsequent analysis, we use STBs in all services trade
without distinguishing between intermediate or final use.
Our descriptive analysis on bilateral PIBs, which are calculated in the second stage,
indicate that advanced countries face lower PIBs compared to emerging countries
throughout the sample period. Furthermore, when we shine a light on the change of
barriers from 2000 to 2014, we observe that the new members of the EU (Poland, Hungary,
Romania, Bulgaria, Estonia and Croatia) witnessed declining PIBs probably due to the
improvements of these countries’ legal systems and expected economic stability following
the EU integration. Emerging countries (Russia, Turkey, Mexico, India and Indonesia), on
the other hand, exhibited the opposite trend and experienced higher barriers over time as
a possible outcome of the anti-globalization movement which resulted in more restrictive
behind the border regulations between advanced and emerging countries, in particular.
In the third and the last stage, our baseline results indicate that bilateral PIBs in all
five services sectors adversely affect goods trading when considered individually. Results
for intermediate or final goods trade have no marked differences. However, when
considered all together, the negative impact of bilateral PIBs in financial services on goods
trade disappears both for intermediate and final goods trade.
We then extend our analysis to the effect of policy-induced bilateral services trade
barriers by level of economic development. We complement our investigation by offering a
counterfactual analysis on the impact of removing PIBs in services trade on goods trade.
The results show that (i) PIBs in transport and W&R negatively affect goods trade
independent of the development level of the exporter and the importer; (ii) while PIBs in
6 See Anderson and van Wincoop (2004) and Bergstrand (1985, 1989).

4
telecom, transport and W&R have an adverse impact on advanced-advanced country goods
trade, PIBs in finance and KIPS do not have an impact on this type of goods trade; (iii)
PIBs in finance, transport and W&R negatively affect goods trade between advanced and
emerging countries; (iv) PIBs in KIPS and telecom have a negative impact on goods exports
from emerging countries to advanced countries, but not on goods exports from advanced
countries to emerging countries; (v) the impact of PIBs in KIPS, transport and W&R is
negative on goods trade among emerging countries. Depending on the services barrier type
and the development level of the traders, counterfactual analysis produces positive effects
on goods trade ranging from 8 to 230 percent.
Through its treatment and analysis of services trade barriers in three-stages, our work
contributes to the literature in several dimensions: First, we calculate the tariff
equivalents of bilateral barriers to trade in five services sectors using Novy (2013) method.
Obtaining these tariff equivalents or STBs in an indirect way by inferring them from
observable trade flows is an advantage particularly in services trading due to data
limitations and well-known heterogeneity of domestic and international regulations in
services7. Another advantage of this method among others is its incorporation of time
dimension into the analysis. Since trade flows vary over time, we can compute tariff
equivalents in services sectors not only for cross-sectional data but also for time series and
panel data.
Second, we decompose STBs into its cultural/geographical and policy components. That
way, we obtain a services trade cost measure that can account for bilateral and policy
related barriers only. Considering the impact of bilateral liberalization or protection
efforts, it is important to have a measure of bilateral PIBs in services trade.
Finally, to the best of our knowledge we are the first to estimate the effect of bilateral
PIBs in trade in services on goods trading. Considering the services penetration in
manufacturing sector and the intertwined nature of goods and services trading, our
analysis may reveal potentially important policy implications.
The paper proceeds as follows. Section 2 lays out the methodology and data followed by
a discussion of calculation of services trade barriers in the first stage in Section 3. Next,
Section 4 presents the results of second stage complemented with a descriptive analysis of
policy-induced barriers. Section 5 outlines the baseline results and the extensions of our
analysis. Finally, Section 6 concludes and discusses the directions for future research.
2. Methodology and Data
This section presents the details of the methodology for the purpose of analyzing the
impact of bilateral policy-induced services trade barriers on goods trade.
7 One drawback of using observable trade flows is the missing trade problem. Some trade is unobserved. In
services, this might be more so due to the restrictiveness of domestic or policy barriers. We recognize that
there is a selection problem when services trade restrictiveness is derived from observed data.

5
2.1. First Stage: Services Trade Barriers
The first stage of our analysis involves the calculation of a micro-founded measure of
bilateral services trade costs as in Novy (2013) where he derives a trade cost measure8
from a wide range of leading trade models based on the idea that all those models yield
gravity equations in general equilibrium. We start with a short review of this method
based on the gravity model of Anderson and van Wincoop (2003, 2004) that can apply to
trade in goods or services:
𝑥𝑖𝑗𝑠 =
𝑦𝑖𝑠𝑦𝑗
𝑠
𝑦𝑠 (𝑡𝑖𝑗
𝑠
Π𝑖𝑠𝑃𝑗
𝑠)
1−𝜎𝑠
∀𝑖, 𝑗; (1)
(Π𝑖𝑠)1−𝜎𝑠
= ∑ (𝑡𝑖𝑗
𝑠
𝑃𝑗𝑠)
1−𝜎𝑠
𝑦𝑖𝑠
𝑦𝑠
𝑗
∀𝑖; (2)
(𝑃𝑗
𝑠)1−𝜎𝑠
= ∑ (𝑡𝑖𝑗
𝑠
Π𝑖𝑠)
1−𝜎𝑠
𝑦𝑖𝑠
𝑦𝑠
𝑖
∀𝑗.
(3)
Let 𝑥𝑖𝑗𝑠 denote the value of exports of services sector s at destination prices from country i
to country j. 𝑦𝑗𝑠 signifies the expenditure on services sector s in country j originated from
all countries. 𝑦𝑖𝑠 and 𝑦𝑠 denote the sales of services sector s at destination prices from i to
all countries and total output of services sector s at those prices, respectively. Next, 𝑡𝑖𝑗𝑠
denotes the bilateral trade costs between countries i and j. The trade elasticity of
substitution across exporting countries i in services sector s is represented by 𝜎𝑠. Π𝑖𝑠 and
𝑃𝑗𝑠 are price indices of exporting and importing countries in services sector s, respectively.
These price indices, which are called as outward and inward multilateral resistance by
Anderson and van Wincoop (2003), include trade costs with all other partners and can be
interpreted as average trade costs.
Due to the difficulty of finding expressions for the multilateral resistance variables,
Novy (2013) proposes a method that makes use of the insight that a change in bilateral
trade barriers does not only affect international trade but also intranational trade. More
precisely, a decline in trade barriers in country i reduces the domestic consumption
(intranational trade) of the services sector s because of an increase in shipments of that
service to foreign countries after the policy change.
Using equation (1), we can write the gravity equation for intranational trade of country
i in services sector s as follows:
8 Head and Ries (2001) were the first authors to derive this type of trade cost measure for which they coined
the name Head and Ries Index.

6
Π𝑖𝑠𝑃𝑖
𝑠 = (
𝑥𝑖𝑖𝑠
𝑦𝑖𝑠⁄
𝑦𝑖𝑠
𝑦𝑠⁄)
1𝜎𝑠−1⁄
𝑡𝑖𝑖𝑠 (4)
Suppose that countries i and j are of the same size 𝑦𝑖𝑠 = 𝑦𝑗
𝑠 and same level of openness
𝑥𝑖𝑖𝑠 = 𝑥𝑗𝑗
𝑠 in services sector s. However, country i has more stringent domestic regulations
in services sector s compared to country j, 𝑡𝑖𝑖𝑠 > 𝑡𝑗𝑗
𝑠 . Then, equation (4) shows that
multilateral resistance in services sector s is higher for country i.
To solve for the bilateral trade costs in services sector s, we use equation (4) in
conjunction with equation (1). Equation (1) includes the product of outward multilateral
resistance of the exporting country and inward multilateral resistance of the importing
country, Π𝑖𝑠 𝑃𝑗
𝑠 in service sector s. Equation (4) provides a solution for Π𝑖𝑠𝑃𝑖
𝑠. By multiplying
gravity equation (1) by the corresponding gravity equation for trade flows in service sector
s in the opposite direction, 𝑥𝑖𝑗𝑠 , we can obtain a bidirectional gravity equation with outward
and inward multilateral resistance variables of exporting and importing countries in
services sector s:
𝑥𝑖𝑗𝑠 𝑥𝑗𝑖
𝑠 = (𝑦𝑖
𝑠𝑦𝑗𝑠
𝑦𝑠 )
2
(𝑡𝑖𝑗
𝑠 𝑡𝑗𝑖𝑠
Π𝑖𝑠𝑃𝑖
𝑠Π𝑗𝑠𝑃𝑗
𝑠)
1−𝜎𝑠
(5)
Substituting the solution from equation (4), assuming asymmetry in domestic and
bilateral services trade costs, 𝑡𝑖𝑗𝑠 ≠ 𝑡𝑗𝑖
𝑠 and 𝑡𝑖𝑖𝑠 ≠ 𝑡𝑗𝑗
𝑠 , and taking the geometric mean of the
barriers in both directions, we arrive at the following tariff equivalent in services sector s:
𝜏𝑖𝑗𝑠 ≡ (
𝑡𝑖𝑗𝑠 𝑡𝑗𝑖
𝑠
𝑡𝑖𝑖𝑠 𝑡𝑗𝑗
𝑠 )
12
− 1 = (𝑥𝑖𝑖
𝑠 𝑥𝑗𝑗𝑠
𝑥𝑖𝑗𝑠 𝑥𝑗𝑖
𝑠 )
12(𝜎𝑠−1)
− 1 (6)
where 𝜏𝑖𝑗𝑠 measures bilateral trade costs 𝑡𝑖𝑗
𝑠 𝑡𝑗𝑖𝑠 relative to domestic trade costs 𝑡𝑖𝑖
𝑠 𝑡𝑗𝑗𝑠 in
services sector s. 𝜎𝑠 > 1 is the elasticity of substitution in services sector s9.
The trade cost measure in equation (6) has a simple yet elegant logic. If there is an
increase in bilateral trade flows 𝑥𝑖𝑗𝑠 𝑥𝑗𝑖
𝑠 relative to domestic trade flows 𝑥𝑖𝑖𝑠 𝑥𝑗𝑗
𝑠 in services
sector s, it means that trading services sector s products between the two countries must
have become easier relative to trading domestically, which is signified by a decline in 𝜏𝑖𝑗𝑠 .
In essence, we divide external services trade barriers inclusive of domestic regulation to
domestic services barriers inclusive of domestic regulation to obtain the bilateral barriers
to trade in services.
We calculate the tariff equivalent in equation (6) for five leading services sector
9 𝜎 𝑠 is assumed to be 4.67 in all network serviced sectors in this paper following Francois et al. (2005).

7
categories: finance, KIPS, telecom, transport and W&R as a measure of services trade
barriers (STBs) for years 2000-2014.
2.2. Second Stage: Policy-Induced Barriers in Services Trade
The second stage of our analysis is to estimate bilateral policy-induced barriers (PIBs) in
services trade. Our objective is to decompose STBs into its two main components: cultural
and geographical barriers (CGBs) and policy-induced barriers in services trade (PIBs).
Trade (goods or services) is affected by cultural barriers such as colonial ties or common
language and geographical barriers such as distance, common border or being landlocked.
What seems to be more challenging to answer here is the question that whether and how
trade is affected by policy induced barriers in services, and in particular by bilateral PIBs.
As a next step, in obtaining the unobservable, residual trade costs (bilateral PIBs) in
services trade in each services sector s, we regress STBs obtained in the first stage of our
analysis on CGBs proxied by geographical (common border, distance) barriers and
cultural (same country, colonial ties, common language, member of the same currency
union) barriers as follows:
𝑙𝑛𝜏𝑖𝑗𝑡𝑠 = 𝛼0 + 𝛼1𝑙𝑛(𝐷𝑖𝑠𝑡𝑎𝑛𝑐𝑒𝑖𝑗) + 𝛼2𝐵𝑜𝑟𝑑𝑒𝑟𝑖𝑗 + 𝛼3𝐿𝑎𝑛𝑔𝑢𝑎𝑔𝑒𝑖𝑗 + 𝛼4𝐶𝑜𝑙𝑜𝑛𝑦𝑖𝑗
+ 𝛼5𝑆𝑎𝑚𝑒 𝐶𝑜𝑢𝑛𝑡𝑟𝑦𝑖𝑗 + 𝛼6𝐿𝑎𝑛𝑑𝑙𝑜𝑐𝑘𝑒𝑑𝑖 + 𝛼7𝐿𝑎𝑛𝑑𝑙𝑜𝑐𝑘𝑒𝑑𝑗
+ 𝛼8𝐶𝑢𝑟𝑟𝑒𝑛𝑐𝑦 𝑈𝑛𝑖𝑜𝑛𝑖𝑗 + 𝜀𝑖𝑗𝑡𝑠
(7)
where 𝑙𝑛𝜏𝑖𝑗𝑡𝑠 is the logarithm of bilateral trade barriers in services sector s between
exporting country i and importing country j in year t. Here
𝑙𝑛(𝐷𝑖𝑠𝑡𝑎𝑛𝑐𝑒𝑖𝑗) = 𝑙𝑛 (𝑑𝑖𝑗𝑑𝑗𝑖
𝑑𝑖𝑖𝑑𝑗𝑗)
12
− 1 (8)
to use the same functional form as in the tariff equivalent term, where 𝑑𝑖𝑗 = 𝑑𝑗𝑖 is the
distance between trading partners and 𝑑𝑖𝑖 and 𝑑𝑗𝑗 are internal distances10. 𝐵𝑜𝑟𝑑𝑒𝑟𝑖𝑗 takes
the value of 1 if there is a common border between i and j and 0 otherwise while 𝐿𝑎𝑛𝑔𝑢𝑎𝑔𝑒𝑖𝑗
is a dummy to capture the presence of a common language between these countries.
𝐶𝑜𝑙𝑜𝑛𝑦𝑖𝑗 shows if there are colonial ties between the two countries. 𝑆𝑎𝑚𝑒 𝐶𝑜𝑢𝑛𝑡𝑟𝑦𝑖𝑗 takes
the value of 1 if countries were or are the same state or the same administrative entity for
a long period (25-50 years in the twentieth century, 75 year in the ninetieth and 100 years
before) and 0 otherwise. 𝐿𝑎𝑛𝑑𝑙𝑜𝑐𝑘𝑒𝑑𝑖 and 𝐿𝑎𝑛𝑑𝑙𝑜𝑐𝑘𝑒𝑑𝑗 are indicator variables equal to 1 if
10 Internal distance of the exporting country i is calculated as, dii = .67 √Areai/π and for the importing
country j, djj = .67 √Areaj/π (as a measure of average distance between producers and consumers in a
country).

8
exporting and importing country are landlocked, respectively. Finally, 𝐶𝑢𝑟𝑟𝑒𝑛𝑐𝑦 𝑈𝑛𝑖𝑜𝑛𝑖𝑗
account for a currency union among countries i and j. Note that there is no need to conduct
the same transformation that is done for distance variable for the other gravity variables
since they are all dummy variables.
First, we estimate five equations with time varying dummy variables for five services
sectors under consideration as well as for the entire services sector. Next, we use the
residual vector, 𝜀𝑖𝑗𝑡𝑠 = 𝜐𝑖𝑗
𝑠 + 𝑒𝑖𝑗𝑡𝑠 , as a proxy for PIBs, which reflect bilateral regulations in
services trade, as suggested by Francois et al (2007). The residual vector in each
estimating equation approximates the sector specific policy-induced barriers to services
trade in that particular sector11.
Finally, PIBs are calculated by indexing the residual vector as follows:
𝜙𝑖𝑗𝑡𝑠 =
𝜀𝑖𝑗𝑡𝑠 − min (𝜀𝑖𝑗𝑡
𝑠 )
max[𝜀𝑖𝑗𝑡𝑠 − min(𝜀𝑖𝑗𝑡
𝑠 )] ∈ [0,1] (9)
2.3. Third Stage: Structural Gravity Estimation of Goods Trade
In the final stage, we estimate a structural gravity model of goods trade, which involves
the policy-induced services trade barriers in the five sectors as explanatory variables, in
the form
𝑙𝑛𝑥𝑖𝑗𝑡𝑔
= 𝛽 + 𝛽𝑖𝑡 + 𝛽𝑗𝑡 + 𝛽𝑖𝑗 + ∑ 𝛾𝑠
𝑠
𝜙𝑖𝑗𝑡𝑠 + 𝜁𝑖𝑗𝑡 (10)
where ∑ 𝛾𝑠𝜙𝑖𝑗𝑡𝑠
𝑠 = 𝛾𝐹𝐼𝑁𝜙𝑖𝑗𝑡𝐹𝐼𝑁 + 𝛾𝐾𝐼𝑃𝑆𝜙𝑖𝑗𝑡
𝐾𝐼𝑃𝑆 + 𝛾𝑇𝐸𝐿𝜙𝑖𝑗𝑡𝑇𝐸𝐿 + 𝛾𝑇𝑅𝐴𝑁𝜙𝑖𝑗𝑡
𝑇𝑅𝐴𝑁 + 𝛾𝑊&𝑅𝜙𝑖𝑗𝑡𝑊&𝑅.
In equation (10), 𝑙𝑛𝑥𝑖𝑗𝑡𝑔
is the logarithm of the nominal value of goods exports from
country i to country j in year t. In order to account for unobserved heterogeneity across
time and countries, exporter-year 𝛽𝑖𝑡, importer-year 𝛽𝑗𝑡 and exporter-importer 𝛽𝑖𝑗 fixed
effects are included in the estimations. Bilateral PIBs approximated by 𝜙𝑖𝑗𝑡𝑠 in services
sectors are included in this regression to measure the impact of bilateral barriers in
services trade on goods trade.
Our choice of estimation method is Poisson pseudo-maximum-likelihood (PPML)
estimator for its success in overcoming heteroskedasticity and zeroes in bilateral trade
flows (Santos Silva and Tenreyro, (2006, 2011)).
11 The first term is the panel specific error which is constant over time. The second one is the regular error
term. We need both of them. The first one gives us the exporter-importer specific trade barriers which we did
not control with our observed variables. The second one gives us the exporter-importer-year specific error.

9
2.4. Data
The analyses in this paper are based on bilateral international trade data from the World
Input-Output Database (WIOD) and the gravity data. In the first stage of the analysis, we
use bilateral services trade data12, while in the third stage we utilize bilateral goods trade
data.
The WIOD November 2016 Release is composed of World Input Output Tables (WIOT)
and Socio-Economic Accounts (SEA). The three improvements that have been incorporated
in this new release are (i) addition of data that have become available in recent years, (ii)
improvement of the bilateral shares estimation in especially services trade, and (iii)
enhancement of the estimation of basic price tables by using information on margins and
taxes on exports13.
The new release of WIOD covers 43 countries in total -28 EU countries and 15 other
major countries in the world- for the period from 2000 to 201414. Moreover, NACE Rev. 2
industry and CPA 2008 product classifications are used. The supply and use tables (SUTs)
in the database cover 56 industries which are listed in Appendix Table A1.
In the second stage of the analysis, we use standard controls for the gravity model,
namely natural trade barriers. The variables that we use are distance between countries,
𝐷𝑖𝑠𝑡𝑎𝑛𝑐𝑒; common border between countries, 𝐵𝑜𝑟𝑑𝑒𝑟; common language, 𝐿𝑎𝑛𝑔𝑢𝑎𝑔𝑒; same
historical origins, 𝐶𝑜𝑙𝑜𝑛𝑦 and 𝑆𝑎𝑚𝑒 𝐶𝑜𝑢𝑛𝑡𝑟𝑦; being landlocked, 𝐿𝑎𝑛𝑑𝑙𝑜𝑐𝑘𝑒𝑑; being under
the same currency union, 𝐶𝑢𝑟𝑟𝑒𝑛𝑐𝑦 𝑈𝑛𝑖𝑜𝑛. Area is used for internal distance calculations.
All the data are taken from CEPII, except data on currency union which come from De
Sousa (2012).
Summary statistics are given in Table 1.
3. Services Trade Barriers
In the framework of the WIOT, when a service is produced, it can be used by (1) domestic
agriculture sectors, (2) domestic goods sectors, (3) domestic services sectors, (4) foreign
agriculture sectors, (5) foreign goods sectors, (6) foreign services sectors, (7) domestic
consumers and (8) foreign consumers. To compute bilateral services trade barriers (STBs),
we need to consider the bilateral trade of services between two countries. Therefore, we
use (4), (5), (6) and (8).
12 Only data on cross-border services trade in GATS modes 1 and 2 are integrated due to data limitations. 13 See Timmer et al. (2016) for a detailed discussion on the construction of WIOD and improvements of the
database. 14 The list of the 43 countries (plus estimated rest of world) included is: EU-28 Member States (Austria,
Belgium, Bulgaria, Croatia, Cyprus, Czechia, Germany, Denmark, Spain, Estonia, Finland, France, Greece,
Hungary, Ireland, Italy, Lithuania, Luxembourg, Latvia, Malta, Netherlands, Poland, Portugal, Romania,
Sweden, Slovakia, Slovenia and United Kingdom), Australia, Brazil, Canada, China, Norway, India,
Indonesia, Japan, Korea, Mexico, Russia, Switzerland, Taiwan, Turkey, USA and Rest-of-World (estimated).

10
As a first step in our analysis, we explore if there is a distinction between intermediate
and final use in terms of services trade barriers. For the former we use (4) to find 𝜏𝑖𝑗𝑡𝑖𝑛𝑡−𝑎,
(5) to find 𝜏𝑖𝑗𝑡𝑖𝑛𝑡−𝑚, (6) to find 𝜏𝑖𝑗𝑡
𝑖𝑛𝑡−𝑠 and for the latter we use (6) to find 𝜏𝑖𝑗𝑡𝑓𝑖𝑛
.
On the supply side (inputs) the services sectors are categorized as follows15:
Services: Rows 23-56
Finance and Insurance: Rows 41-43
Knowledge Intensive Producer Services: Rows 40 and 45-48
Telecom and Postal: Rows 35 and 39
Transport (inc. logistics): Rows 31-34
Wholesale and Retail: Rows 28-30
The use side (output) is categorized as follows:
Intermediate Use: Columns 1-56
Agriculture: Columns 1-4
Manufacturing: Columns 4-22
Services: Columns 23-56
Final Use: Columns 57-61
Our calculations of STBs in intermediate services trade –services traded to be used in
agriculture, manufacturing and services production- and final services trade –services
traded for consumption- exhibit a slight difference as displayed in Figure 1. The kernel
density diagram shows that the distributions of the STBs in intermediate services trade
are almost the same. However, the distribution of STBs in final services trade is slightly
higher than the intermediate ones16.
However, the correlation coefficients are all above 95 percent showing that these
measures are virtually equal when used in regressions,
𝜏ijtint−a = 𝜏ijt
int−m = 𝜏ijtint−s = 𝜏ijt
final.
Therefore, in the rest of the paper, we calculate the STBs in all services trade without
distinguishing between intermediate or final use.
4. Policy-Induced Barriers to Trade
Policy-induced barriers to services trade (PIBs), which reflect bilateral regulations in
services trade, are calculated in the second stage for the five services sectors for the period
2000-2014. This section briefly discusses the differences of PIBs among countries for the
services sector as a whole and for each five services subsectors.
Figure 2 presents a comparison of PIBs in services sector across countries for 2014.
The measure of PIBs for a country is calculated as the simple average of that country’s
15 Row and column numbers in WIOT which are also presented in Table A.1. 16 This slight difference is also proved by the Kolmogorov-Smirnov test for the equality of intermediate and
final STBs, which is rejected. The results are available upon request.
11
bilateral PIBs. Note that as PIBs are indexed to change between 0 and 1, country-level
PIBs will fall into the same range as well. A change in a country’s level of PIBs may be
caused by; i) that country altering its barriers towards a set of other countries, ii) other
countries changing barriers towards that country or iii) both.
The countries experiencing the lowest PIBs (around 0.35) are small, open economies of
the EU; namely, the Netherlands, Belgium and Malta. In contrast, India and Indonesia
are the countries with the highest PIBs, almost two-folds of the lowest PIBs countries. The
Figure shows that advanced countries face lower PIBs compared to emerging countries.
The exceptions are PIBs of Taiwan with around 0.4 and Canada with around 0.5.
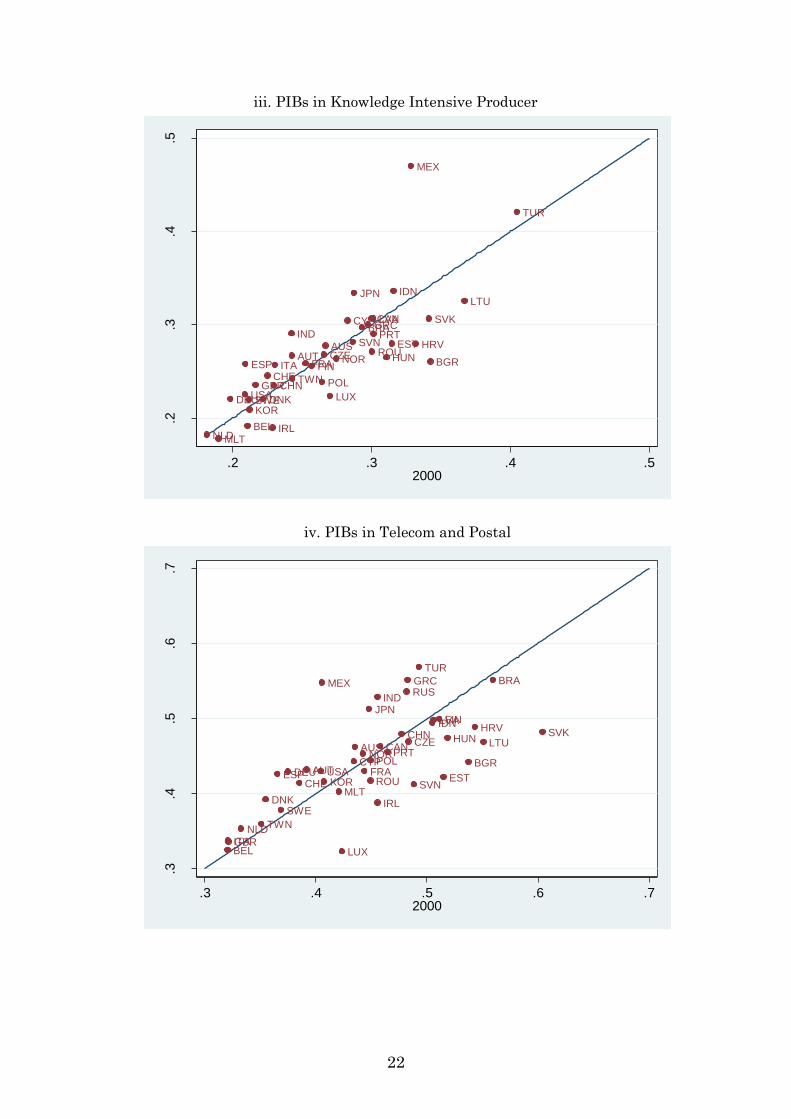
Figure 3 provides a comparison of average PIBs between 2000 and 2014 for services
sector as a whole and for each subsector. Panel (i) suggests that while some countries
experienced a decrease in their PIBs over time, there are countries that encountered an
increase in their barriers between 2000 and 2014. Specifically, the countries that became
a member of the EU after 2000 enjoyed lower PIBs during 2000-2014 period. Some of those
countries with significant decreases are Poland, Hungary, Romania, Bulgaria, Estonia
and Croatia. This would be due to the improvements of these countries’ legal systems and
expected economic stability following the integration to the EU. Moreover, some other
members of the EU enjoyed further decreases in their barriers such as Malta, Belgium,
Ireland and Luxemburg, which may be an indication of an added benefit of joining the
European Monetary Union.
Emerging countries, on the other hand, followed an opposite trend and experienced
higher barriers over time. Russia, Turkey, Mexico, India and Indonesia are amongst those
countries. This may be the outcome of the anti-globalization movement which resulted in
more restrictive behind the border regulations. Evenett and Fritz (2015) present a detailed
picture of discriminatory measures implemented and experienced by G20 countries for
years 2009-2015. Among these six countries, while Mexico was harmed relatively more by
other countries’ protectionist measures, India and Indonesia adopted protectionist
measures that harm the interests of other countries relatively more intensely. Russia and
Turkey, on the other hand, implemented and experienced a plethora of protectionist
measures. To be precise, Russia has increased the number of protectionist measures from
71 to 478 while Turkey from 27 to 157 during 2009-2015 period.
As a financial center, the UK is one of the countries with the lowest PIBs in Finance
and Insurance both in 2000 and 2014 as shown in panel (ii) of Figure 3. Ireland and Malta
are the other countries with the lowest barriers. In contrast, the highest trade barriers in
the financial and insurance services are observed in Russia, India and Indonesia. These
results are in line with the OECD STRI index (2017 release). Indeed, for financial and
insurance services, PIBs calculated in this paper and STRI values, both in 2014, are
positively correlated at 65 percent level.
PIBs in Knowledge Intensive Producer Services is lower almost for all the countries in
our sample compared to the services sectors as a whole (Panel iii). Most of the countries
demonstrate PIBs around 0.15-0.3 band. The two outlier countries experiencing higher
barriers are Mexico and Turkey.

12
The highest PIBs in the Transport are observed in India and Indonesia in 2014. The
countries that started to experience significantly higher barriers in Transport over time
are Turkey, Spain, Japan, India and Indonesia. Similar to the reduction of their PIBs in
services sector as a whole, the latest members of the EU also enjoyed decreasing PIBs in
Transport as presented in Panel (iv) of Figure 3. In addition to these new members of the
EU, China also notably experienced a fall in its PIBs in the transport sector following the
liberalization efforts in transport sector during the sample period.
Compared to PIBs in services overall, most of the countries did not experience any
change in their PIBs in Telecom and Postal during our sample period as evident in Panel
(v) of Figure 3. The countries facing significantly lower barriers in the Telecom and Postal
services are among the EU members as it is the case in the overall services sectors.
Belgium, Luxemburg, the UK and Italy were the countries with the lowest barriers in
2014, whereas Turkey, Mexico, Greece and Brazil had the highest barriers.
Except Indonesia17, the countries in our sample impose very low PIBs in W&R as
expected (Panel vi). Indeed, the OECD STRI index (2017 release) shows that Indonesia is
an outlier in imposing high barriers in distribution sectors. Furthermore, in 2014, barriers
to trade in wholesale and retail services calculated in this paper as PIBs and STRI values
reported by OECD are positively correlated at 80 percent level.
5. Structural Gravity
5.1. Baseline Results
In this section, very similar to Section 3, we start our analysis by categorizing the goods
trade according to intermediate and final use in the destination country. Goods that are
exported to be used in foreign agriculture, goods and services sectors, altogether make the
intermediate goods trade. Obviously, goods are also exported to be used in final
consumption in the destination country, which constitutes the final goods trade.
In order to determine whether bilateral policy induced barriers in different services
sectors affect exports of intermediate and final goods differently, we estimate the following
two variants of the structural gravity regression given in equation (10):
𝑙𝑛𝑥𝑖𝑗𝑡𝑖𝑛𝑡−𝑔
= 𝛽 + 𝛽𝑖𝑡 + 𝛽𝑗𝑡 + 𝛽𝑖𝑗 + ∑ 𝛾𝑠𝑠 𝜀𝑖𝑗𝑡𝑠 + 𝜁𝑖𝑗𝑡. (11a)
𝑙𝑛𝑥𝑖𝑗𝑡𝑓𝑖𝑛𝑎𝑙−𝑔
= 𝛽 + 𝛽𝑖𝑡 + 𝛽𝑗𝑡 + 𝛽𝑖𝑗 + ∑ 𝛾𝑠𝑠 𝜀𝑖𝑗𝑡𝑠 + 𝜁𝑖𝑗𝑡. (11b)
Table 2 presents the results of the PPML estimation of bilateral goods trade for the
period 2000-2014 for 43 countries composed of advanced and emerging countries in the
WIOD database. The estimations include exporter-year, importer year, exporter-importer
fixed effects as well as policy induced barriers to services trade in five services sectors.
17 Indonesia is removed from the Figure for demonstration purposes.

13
Table 3 and 4 repeat the same analysis for intermediate goods trade and final goods trade
enabling the comparison of the impact of PIBs on them.
As a first step, we analyze the effects of policy induced barriers to trade in five services
sectors on goods trade in Table 2. Column 1 reports the impact of PIBs in services sector
as a whole on goods trade. The coefficient is negative and significant as expected. Columns
2 to 6 present results related to 5 services sectors, namely Transport, Telecom and Postal,
Finance and Insurance, Knowledge Intensive Producer Services and Wholesale and Retail.
Trade barriers in these services sectors negatively and significantly affect goods trade.
Finally, the joint effect of all five policy induced services trade barriers are reported in
Column 7 and all of them are negative and significant, except PIBs in Finance and
Insurance. These results are in line with Nordås and Rouzet (2015) and Ariu et al. (2016)
who found similar results by using OECD STRI index and OECD PMR index, respectively.
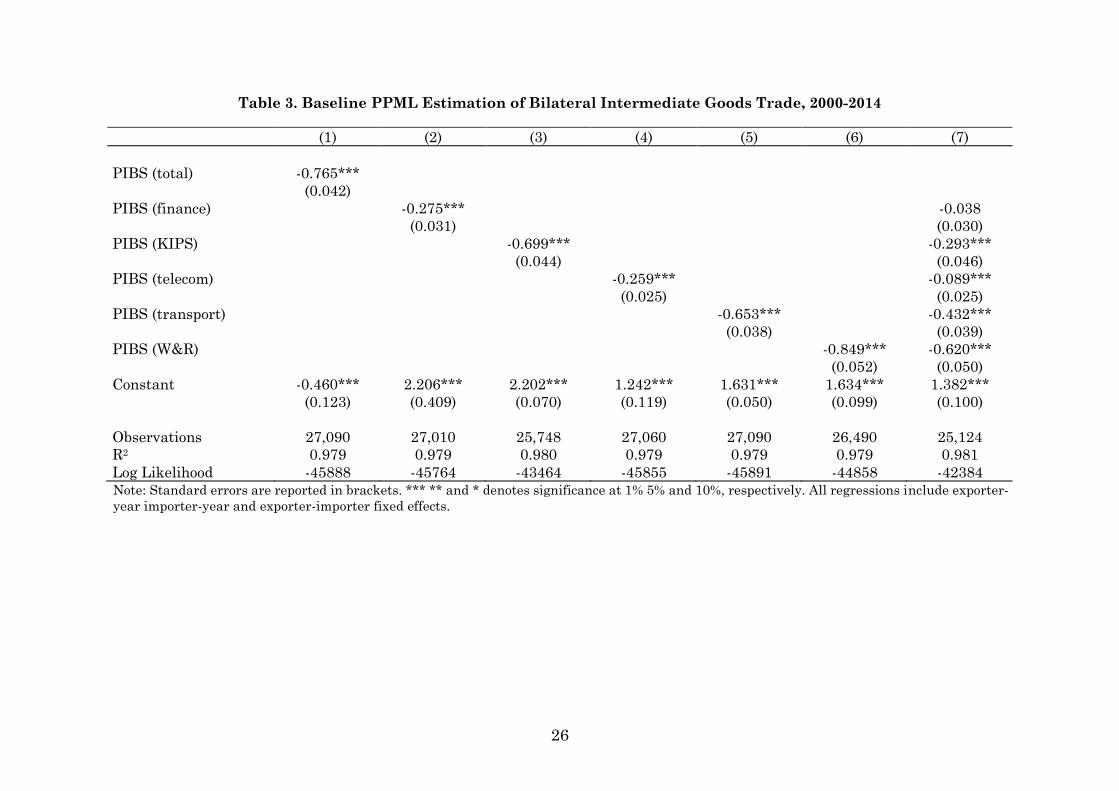
Table 3 and 4 repeat the regressions in Table 2, for final goods trade and intermediate
goods trade in Table 3 and 4, respectively. The objective of this exercise is to investigate if
there is a marked difference in the impact of PIBs on final and intermediate goods trade.
The results indicate that the coefficients in Table 2, 3 and 4 are very close to each other
indicating that PIBs have a very similar impact on final goods trade and intermediate
goods trade.
Next, we discuss the extensions of our benchmark specifications.
5.2. Trade Costs by Level of Economic Development
In this section, we investigate whether our results in the benchmark regressions change
when we consider trade between countries with different levels of development18. The
results of the estimations are presented in Table 5, while counterfactual analysis
regarding the effect of removing PIBs in Finance, KIPS, Telecom, Transport and W&R,
one at a time, on goods trade is shown in Table 6.
The first result from the Table 5 is that PIBs in Transport and W&R negatively affect
goods trade independent of the development level of the exporter and the importer.
Therefore, any country imposing high barriers in Transport and W&R has the possibility
of reducing goods trade in a significant way as these are vital services sectors that act as
inputs in goods production.
First column of Table 5 reports the impact of PIBs in services on bilateral goods trade
between advanced countries. The coefficients of PIBs in Telecom, Transport and W&R are
negative and significant indicating the importance of reducing barriers in services sectors
in boosting goods trade between advanced countries. The counterfactual analysis results
suggest that removing PIBs in W&R would increase goods trade between advanced
countries by 229 percent, while removing barriers in Telecom and Transport would
enhance goods trade by 32 percent and 52 percent, respectively, as shown in Table 6. On
18 Advanced and emerging country classifications are made using the World Bank income taxonomy. Advanced
countries are high income countries in the World Bank classification while emerging ones are all the rest in
our database.

14
the other hand, PIBs in Finance and KIPS do not have an impact on bilateral goods trade.
This may be due to the already low barriers in Finance and KIPS among advanced
countries.
Goods trade between advanced countries and emerging countries is negatively affected
by PIBs in Finance, Transport and W&R. The estimated increase in goods trade ranges
from 8 percent to 122 percent as reported in Table 6. Furthermore, PIBs in KIPS and
Telecom have a negative impact on goods exports from emerging countries to advanced
countries, but not on goods exports from advanced countries to emerging countries.
The value of services trade between advanced countries is much higher compared to
that between advanced and emerging countries. Owing to this scale effect, barriers in
KIPS and Telecom between advanced and emerging countries do not have a significant
effect on goods exports of advanced countries. On the other hand, as emerging countries
may rely more on advanced countries in their procurement of international services,
barriers in these sectors reduce emerging countries’ goods exports. As a result, reductions
in barriers in KIPS and Telecom may increase goods exports of emerging countries by 25
percent and 30 percent, respectively (Table 6). However, for such reductions to take place,
the prerequisite may very well be the improvements in the quality of services supplied by
these sectors, such as engineering, legal and accounting services, in emerging countries.
The last columns of Table 5 is for bilateral trade among emerging countries. The impact
of PIBs in KIPS, Transport and W&R is negative on goods trade among emerging
countries. The counterfactual analysis produces positive effects on goods trade of removing
services trade barriers ranging from100 to 227 percent as presented in Table 6.
6. Conclusion
In this paper, we investigated the impact of policy-induced trade barriers in finance,
telecom, transport, wholesale and retail (W&R) and knowledge intensive producer services
(KIPS) on goods trade using the World Input-Output Database covering 43 countries over
the period 2000-2014.
We employed a three-stage approach: (i) In the first stage, we calculated barriers to
trade in services using Novy (2013) methodology. The advantage of obtaining these tariff
equivalents or STBs in an indirect way by inferring them from observable trade flows is
to overcome the difficulties related to data limitations and heterogeneity of domestic and
international regulations in services. Another benefit is to be able compute tariff
equivalents in services sectors not only for cross-sectional data but also for time series and
panel data. (ii) In the second stage, we decomposed services trade barriers into their
cultural/geographic and policy-induced components by regressing STBs on well-known
gravity variables. We calculated policy-induced barriers from the residual vector of this
regression. In essence, we obtained a services trade cost measure that account for bilateral
barriers only. (iii) In the third stage, we estimated a structural gravity equation of goods
trade by including bilateral PIBs to trade in five services sectors as explanatory variables,
namely finance, telecom, transport, W&R and KIPS.

15
Our results show that STBs calculated in the first stage using Novy (2013) are not
different for intermediate and final use. Therefore, in the decomposition of STBs into
CGBs and PIBs in the second stage, we employed no such distinction.
Next, in the second stage analysis, for the services sector as a whole, we found that
advanced countries have lower bilateral PIBs on average compared to emerging countries
throughout the sample period. While the new members of the EU (Poland, Hungary,
Romania, Bulgaria, Estonia and Croatia) witnessed declining PIBs over time, emerging
countries (Russia, Turkey, Mexico, India and Indonesia) experienced higher barriers over
time.
Finally, in the structural gravity estimations in the third stage, the results show that
bilateral PIBs in all five services sectors adversely affect goods trading both for
intermediate and final goods trade. When we extended our analysis to goods trade between
countries of different development levels the results exhibit meaningful variations in the
regression coefficients.
First of all, the impediments to trade in the most traditional services sectors such as
Transport and W&R, independent of the level of development of the exporter or the
importer had a significant role in adversely affecting the goods trade. Therefore, policy
measures that reduce the services trade barriers in these sectors will have an important
role in boosting goods trading in all countries.
Second, we found that while PIBs in Telecom, Transport and W&R have an adverse
impact on advanced-advanced goods trade, PIBs in Finance and KIPS do not have an
impact on this type of goods trade. This means that there is still room for bilateral
reductions in barriers to the trade of telecommunications, distribution and transportation
services in advanced economies in order to increase the level of goods trade between these
countries.
Third, PIBs in Finance, Transport and W&R negatively affect goods trade between
advanced and emerging countries. Some of these barriers, particularly in transport, are
imposed by advanced countries to emerging countries. However, the results suggest that
reducing these barriers would enhance the goods exports in emerging countries as well as
advanced countries.
Fourth, PIBs in KIPS and Telecom have a negative impact on goods exports from
emerging countries to advanced countries, but not on goods exports from advanced
countries to emerging countries. What this result may imply in the policy arena is that
reductions in barriers to the trade of KIPS and Telecom will increase goods exports of
emerging countries. However, for advanced countries to get involved in such a concession,
improvements in the quality of services supplied by emerging to advanced countries in
these sectors may be in order.
Finally, the impact of PIBs in KIPS, Transport and Wholesale and Retail is negative on
goods trade among emerging countries. These barriers may be imposed due to the
possibility of low quality of these services in emerging countries. Improving the quality
and reliability of these services in emerging countries may enhance the goods trade among
them.

16
Considering the anemic growth of world trade in the better part of the last decade, the
results of this paper may lend themselves to be of use by policymakers. It is true that there
is no consensus about what caused the trade slowdown; the underlying reasons may be
cyclical, structural or protection related (Hoekman, 2015). However, it cannot be true that
we hit a peak trade constraint.
First of all, most of the world trade is dominated by a few advanced countries which are
heavily affected by the 2008 financial crisis. Once these countries fully recover, demand
weaknesses -which is a factor for trade slowdown- will disappear and cause the blossoming
of trade once again. There are emerging economies with big populations (not only China
and India) that can create demand in international markets.
Secondly, we have witnessed revolutionary developments in information technology.
Only between 2013 and 2014 data flows between countries doubled and reached 290
terabytes per second. There is a never-seen-before increase in the volume of digital
products ranging from e-books to internet games. Each day more nontradables become
tradables.
In conclusion, for both of these forces to help recover the anemic world trade, we need
a better grasp of the factors that inhibit this recovery. This paper, therefore, can be
considered as an attempt to pave the road for our understanding of how service trade
barriers affect global trade in today’s world.

17
References
Anderson, J., van Wincoop, E. (2003). Gravity with gravitas: a solution to the border
puzzle. American Economic Review 93, 170–192.,
Anderson, J. E., & Van Wincoop, E. (2004). Trade costs. Journal of Economic literature,
42(3), 691-751.
Ariu, A., Breinlich, H., Corcos, G., & Mion, G. (2016). Interconnections Between Services
and Goods Trade at the Firm Level. Technical report, Mimeo.
Baldwin, R., & Lopez‐ Gonzalez, J. (2014). Supply-chain Trade: A Portrait of Global
Patterns and Several Testable Hypotheses. The World Economy.
Bergstrand, J. H. (1985). The gravity equation in international trade: some microeconomic
foundations and empirical evidence. The review of economics and statistics, 474-481.
Bergstrand, J. H. (1989). The generalized gravity equation, monopolistic competition, and
the factor-proportions theory in international trade. The review of economics and
statistics, 143-153.
De Sousa, J. (2012), "The currency union effect on trade is decreasing over time",
Economics Letters, 117(3), 917-920
Evenett, S., & Fritz, J. (2015). The tide turns? Trade, protectionism, and slowing global
growth. 18th Global Trade Alert Report, Centre for Economic Policy Research.
Francois, J., Van Meijl, H., & Van Tongeren, F. (2005). Trade liberalization in the Doha
development round. Economic Policy, 20(42), 350-391.
Francois, J., Hoekman, B., & Woerz, J. (2007). Does gravity apply to intangibles?
Measuring openness in services. Center for Economic and Policy Research, Johannes
Kepler Universitat, World Bank, and Vienna Institute for International Economic Studies.
Unpublished manuscript.
Head, K., & Ries, J. (2001). Increasing returns versus national product differentiation as
an explanation for the pattern of US-Canada trade. American Economic Review, 858-876.
Hoekman, B. (2015). The global trade slowdown: A new normal. VoxEU. org eBook
(London, Centre for Economic Policy Research (CEPR)).
Nordås, H. K., & Kox, H. (2009). Quantifying regulatory barriers to services trade.
Nordås, H. K., & Rouzet, D. (2015). The Impact of Services Trade Restrictiveness on Trade
Flows: First Estimates, OECD Trade Policy Paper No. 178, Paris: OECD.
18
Novy, D. (2013). Gravity redux: measuring international trade costs with panel data.
Economic Inquiry, 51(1), 101-121.
Silva, J. S., & Tenreyro, S. (2006). The log of gravity. The Review of Economics and
statistics, 88(4), 641-658.
Silva, J. S., & Tenreyro, S. (2011). Further simulation evidence on the performance of the
Poisson pseudo-maximum likelihood estimator. Economics Letters, 112(2), 220-222.
Schwellnus, C. (2007). The effect of domestic regulation on services trade revisited (No.
2007-08).
Timmer, M. P., Los, B., Stehrer, R., & de Vries, G. J. (2016). An anatomy of the global
trade slowdown based on the WIOD 2016 release (No. GD-162). Groningen Growth and
Development Centre, University of Groningen.
Van der Marel, E., & Shepherd, B. (2013). International tradability indices for services.
World Bank Policy Research Working Paper, (6712).

19
Figure 1. Kernel Density Diagram of Intermediate and Final STBs
0.2
.4.6
.8
Density
0 1 2 3 4 5
Agriculture Use Manufacturing Use
Services Use Final Use
kernel = epanechnikov, bandwidth = 0.0541

20
Figure 2. Comparison of Average PIBs across Countries
0.2
.4.6
PIB
s
NL
D
BE
L
ML
T
IRL
DN
K
LU
X
GB
R
DE
U
KO
R
SW
E
TW
N
PO
L
ITA
US
A
FR
A
CH
E
CY
P
HU
N
ES
P
AU
T
CH
N
AU
S
NO
R
RO
U
CZ
E
BG
R
SV
N
ES
T
FIN
GR
C
PR
T
JP
N
BR
A
CA
N
LT
U
SV
K
HR
V
TU
R
LV
A
RU
S
ME
X
IND
IDN

21
Figure 3. Comparison of Average PIBs across Countries between 2000 and 2014
i. PIBs in Services
ii. PIBs in Finance and Insurance
AUSAUT
BEL
BGR
BRACAN
CHE
CHN
CYP
CZE
DEU
DNK
ESP
ESTFIN
FRA
GBR
GRC
HRV
HUN
IDNIND
IRL
ITA
JPN
KOR
LTU
LUX
LVA
MEX
MLTNLD
NOR
POL
PRT
ROU
RUS
SVK
SVN
SWE
TUR
TWNUSA
.3.4
.5.6
.7
2014
.3 .4 .5 .6 .72000
AUS
AUT
BEL
BGR
BRA
CAN
CHE
CHN
CYP
CZE
DEUDNK
ESP
ESTFINFRA
GBR
GRC
HRV
HUN
IDN
IND
IRL
ITA
JPN
KOR
LTU
LUX
LVA
MEX
MLT
NLD
NORPOL
PRT
ROU
RUS
SVK
SVN
SWETUR
TWN
USA
.3.4
.5.6
.7
2014
.3 .4 .5 .6 .72000
22
iii. PIBs in Knowledge Intensive Producer
iv. PIBs in Telecom and Postal
AUSAUT
BEL
BGR
BRACAN
CHECHN
CYP
CZE
DEU DNK
ESP
EST
FINFRA
GBR
GRC
HRV
HUN
IDN
IND
IRL
ITA
JPN
KOR
LTU
LUX
LVA
MEX
MLTNLD
NOR
POL
PRT
ROU
SVK
SVN
SWE
TUR
TWN
USA
.2.3
.4.5
2014
.2 .3 .4 .52000
AUS
AUT
BEL
BGR
BRA
CAN
CHE
CHN
CYP
CZE
DEU
DNK
ESP EST
FIN
FRA
GBR
GRC
HRVHUN
IDN
IND
IRL
ITA
JPN
KOR
LTU
LUX
LVA
MEX
MLT
NLD
NORPOL
PRT
ROU
RUS
SVK
SVN
SWE
TUR
TWN
USA
.3.4
.5.6
.7
2014
.3 .4 .5 .6 .72000

23
v. PIBs in Transport
vi. PIBs in Wholesale and Retail
AUS
AUT
BEL
BGR
BRA
CAN
CHE
CHN
CYP
CZE
DEU
DNK
ESPEST
FIN
FRA
GBRGRC
HRV
HUN
IDN
IND
IRL
ITA
JPNKOR
LTU
LUX
LVA
MEX
MLT
NLD
NOR
POL
PRTROU
RUS
SVK
SVN
SWE
TUR
TWN
USA
.2.3
.4.5
.6
2014
.2 .3 .4 .5 .62000
AUS
AUT
BEL
BGR
BRA
CAN
CHE
CHNCYPCZE
DEUDNK
ESP
ESTFIN
FRA
GBR
GRC
HRV
HUN
IND
IRLITA
JPN
KOR
LTU
LUX
LVA
MEX
MLT
NLD
NOR
POL
PRT ROU
RUS SVK
SVN
SWE
TUR
TWN
USA
.1.1
5.2
.25
.3
2014
.1 .15 .2 .25 .32000

24
Table 1. Summary Statistics
Variable Mean Std. Dev. Min Max
Trade Variables
𝑙𝑛𝑥𝑖𝑗𝑡𝑖𝑛𝑡−𝑔
5.144 2.433 0.000* 11.85
𝑙𝑛𝑥𝑖𝑗𝑡𝑓𝑖𝑛𝑎𝑙−𝑔
4.839 2.422 0.000* 12.29
𝑙𝑛𝑥𝑖𝑗𝑡𝑔
5.734 2.447 0.000* 12.72 𝑙𝑛𝑥𝑖𝑗𝑡
𝑠 4.700 2.319 0.002 11.012
Gravity Variables
Distance 4913.7 4430.8 59.62 18821
Border 0.059 0.237 0 1
Language 0.051 0.220 0 1
Colony 0.034 0.182 0 1
Same Country 0.022 0.147 0 1
Land Locked 0.140 0.347 0 1
Currency Union 0.106 0.308 0 1
Area 1757782 3713285 316 17100000 * Minimum trade is rounded to 0.

25
Table 2. Baseline PPML Estimation of Bilateral Goods Trade, 2000-2014
(1) (2) (3) (4) (5) (6) (7)
PIBS (total) -0.676***
(0.035)
PIBS (finance) -0.226*** -0.025
(0.025) (0.025)
PIBS (KIPS) -0.573*** -0.221***
(0.037) (0.038)
PIBS (telecom) -0.214*** -0.075***
(0.020) (0.021)
PIBS (transport) -0.530*** -0.325***
(0.032) (0.032)
PIBS (W&R) -0.825*** -0.639***
(0.046) (0.044)
Constant 0.100 1.224*** 2.158*** 1.445*** 1.603*** 1.740*** 1.477***
(0.075) (0.294) (0.052) (0.089) (0.039) (0.083) (0.089)
Observations 27,090 27,010 25,748 27,060 27,090 26,490 25,124
R2 0.981 0.981 0.982 0.981 0.981 0.982 0.983
Log Likelihood -47665 -47538 -45183 -47629 -47669 -46604 -44074
Note: Standard errors are reported in brackets. *** ** and * denotes significance at 1% 5% and 10%, respectively. All regressions include exporter-
year importer-year and exporter-importer fixed effects.
26
Table 3. Baseline PPML Estimation of Bilateral Intermediate Goods Trade, 2000-2014
(1) (2) (3) (4) (5) (6) (7)
PIBS (total) -0.765***
(0.042)
PIBS (finance) -0.275*** -0.038
(0.031) (0.030)
PIBS (KIPS) -0.699*** -0.293***
(0.044) (0.046)
PIBS (telecom) -0.259*** -0.089***
(0.025) (0.025)
PIBS (transport) -0.653*** -0.432***
(0.038) (0.039)
PIBS (W&R) -0.849*** -0.620***
(0.052) (0.050)
Constant -0.460*** 2.206*** 2.202*** 1.242*** 1.631*** 1.634*** 1.382***
(0.123) (0.409) (0.070) (0.119) (0.050) (0.099) (0.100)
Observations 27,090 27,010 25,748 27,060 27,090 26,490 25,124
R2 0.979 0.979 0.980 0.979 0.979 0.979 0.981
Log Likelihood -45888 -45764 -43464 -45855 -45891 -44858 -42384
Note: Standard errors are reported in brackets. *** ** and * denotes significance at 1% 5% and 10%, respectively. All regressions include exporter-
year importer-year and exporter-importer fixed effects.

27
Table 4. Baseline PPML Estimation of Bilateral Final Goods Trade, 2000-2014
(1) (2) (3) (4) (5) (6) (7)
PIBS (total) -0.703***
(0.044)
PIBS (finance) -0.252*** -0.057*
(0.032) (0.033)
PIBS (KIPS) -0.526*** -0.174***
(0.046) (0.049)
PIBS (telecom) -0.233*** -0.094***
(0.025) (0.026)
PIBS (transport) -0.479*** -0.227***
(0.040) (0.041)
PIBS (W&R) -0.994*** -0.805***
(0.060) (0.061)
Constant -0.353*** -0.686* 1.747*** 1.271*** 1.040*** 1.622*** 0.387**
(0.084) (0.395) (0.052) (0.125) (0.052) (0.152) (0.167)
Observations 27,090 27,010 25,748 27,060 27,090 26,490 25,124
R2 0.977 0.977 0.978 0.977 0.977 0.977 0.979
Log Likelihood -44861 -44748 -42536 -44830 -44865 -43875 -41516 Note: Standard errors are reported in brackets. *** ** and * denotes significance at 1% 5% and 10%, respectively. All regressions include exporter-
year importer-year and exporter-importer fixed effects.

28
Table 5. PPML Estimation of Bilateral Goods Trade between Country Groups
2000-2014
Exporter
Importer
Advanced
Advanced
Advanced
Emerging
Emerging
Advanced
Emerging
Emerging
PIBS (finance) 0.066* -0.223*** -0.163*** 0.234***
(0.040) (0.044) (0.052) (0.077)
PIBS (KIPS) -0.084 -0.012 -0.169** -0.539***
(0.060) (0.058) (0.066) (0.152)
PIBS (telecom) -0.125*** 0.004 -0.127*** -0.051
(0.027) (0.037) (0.045) (0.076)
PIBS (transport) -0.204*** -0.281*** -0.403*** -0.618***
(0.046) (0.059) (0.064) (0.112)
PIBS (W&R) -1.245*** -0.587*** -0.240*** -0.963***
(0.136) (0.064) (0.060) (0.133)
Constant 2.109*** 2.642*** 2.017*** 4.169***
(0.035) (0.030) (0.072) (0.135)
Observations 7,590 6,137 6,482 4,659
R2 0.990 0.986 0.979 0.971
Log Likelihood -14018 -10671 -11349 -7627
Note: Standard errors are reported in brackets. *** ** and * denotes significance at 1% 5% and
10%, respectively. All regressions include exporter-year importer-year and exporter-importer
fixed effects.
Table 6. Counterfactual Analysis: Impact of Removing PIBs
between Country Groups (percentage increase)
Exporter
Importer
Advanced
Advanced
Advanced
Emerging
Emerging
Advanced
Emerging
Emerging
PIBS (finance) -12.72* 57.76*** 39.33*** -32.25***
PIBS (KIPS) 12.33 1.521 24.78** 100.4***
PIBS (telecom) 31.96*** -0.750 29.55*** 9.694
PIBS (transport) 52.13*** 73.86*** 121.7*** 226.5***
PIBS (W&R) 229.1*** 73.92*** 8.14*** 133.6***
Note: Standard errors are reported in brackets. *** ** and * denotes significance at 1% 5% and
10%, respectively. PIBS for finance, KIPS, telecom, transport, W&R are removed one at a time
in regressions and the results indicate the increase in goods trade as a percentage.

29
Table A1. Sectors in WIOD Release 2016 (NACE.Rev2)
Nr Sector
1 A01 Crop and animal production, hunting and related service activities
2 A02 Forestry and logging
3 A03 Fishing and aquaculture
4 B Mining and quarrying
5 C10-C12 Manufacture of food products, beverages and tobacco products
6 C13-C15 Manufacture of textiles, wearing apparel and leather products
7 C16 Manufacture of wood and of products of wood and cork, except furniture; etc.
8 C17 Manufacture of paper and paper products
9 C18 Printing and reproduction of recorded media
10 C19 Manufacture of coke and refined petroleum products
11 C20 Manufacture of chemicals and chemical products
12 C21 Manufacture of basic pharmaceutical products and pharmaceutical preparations
13 C22 Manufacture of rubber and plastic products
14 C23 Manufacture of other non-metallic mineral products
15 C24 Manufacture of basic metals
16 C25 Manufacture of fabricated metal products, except machinery and equipment
17 C26 Manufacture of computer, electronic and optical products
18 C27 Manufacture of electrical equipment
19 C28 Manufacture of machinery and equipment n.e.c.
20 C29 Manufacture of motor vehicles, trailers and semi-trailers
21 C30 Manufacture of other transport equipment
22 C31_C32 Manufacture of furniture; other manufacturing
23 C33 Repair and installation of machinery and equipment
24 D Electricity, gas, steam and air conditioning supply
25 E36 Water collection, treatment and supply
26 E37-E39 Sewerage; waste collection, treatment and disposal activities; materials recovery; etc.
27 F Construction
28 G45 Wholesale and retail trade and repair of motor vehicles and motorcycles
29 G46 Wholesale trade, except of motor vehicles and motorcycles
30 G47 Retail trade, except of motor vehicles and motorcycles
31 H49 Land transport and transport via pipelines
32 H50 Water transport
33 H51 Air transport
34 H52 Warehousing and support activities for transportation
35 H53 Postal and courier activities
36 I Accommodation and food service activities
37 J58 Publishing activities
38 J59_J60 Motion picture, video and television program production, sound recording and music publishing activities; etc.
39 J61 Telecommunications
40 J62_J63 Computer programming, consultancy and related activities; information service activities
41 K64 Financial service activities, except insurance and pension funding
42 K65 Insurance, reinsurance and pension funding, except compulsory social security
43 K66 Activities auxiliary to financial services and insurance activities
44 L Real estate activities
45 M69_M70 Legal and accounting activities; activities of head offices; management consultancy activities
46 M71 Architectural and engineering activities; technical testing and analysis
47 M72 Scientific research and development
48 M73 Advertising and market research
49 M74_M75 Other professional, scientific and technical activities; veterinary activities
50 N Rental and leasing activities, Employment activities, Travel services, security and services to buildings
51 O Public administration and defense; compulsory social security
52 P Education
53 Q Human health and social work activities
54 R-S Creative, Arts, Sports, Recreation and entertainment activities and all other personal service activities
55 T Activities of households as employers; undifferentiated goods- and services-producing activities of households for own use
56 U Activities of extra-territorial organizations and bodies