the effect of amplitude compression on the perception of ... · the effect of amplitude compression...
TRANSCRIPT

The Effect of Amplitude Compressionon the Perception of Speech in Noise
by the Hearing Impaired

c© 2006 A.C.H. Houben
Typeset in LATEX
Printed by Gildeprint BV, Enschede
All rights reserved. No part of this book may be reproduced in any form, by print, photocopy-ing, microfilm, electronic data transmission, or any other means, without the prior writtenpermission of the author.
Niets uit deze uitgave mag worden vermenigvuldigd en/of openbaar gemaakt worden doormiddel van druk, fotokopie, microfilm, elektronisch dataverkeer of op welke andere wijze danook, zonder voorafgaande schriftelijke toestemming van de auteur.

The Effect of Amplitude Compressionon the Perception of Speech in Noise
by the Hearing Impaired
Het effect van amplitude-compressie op het spraakverstaan in lawaai doorslechthorenden
(met een samenvatting in het Nederlands)
Proefschrift
ter verkrijging van de graad van doctor aan de Universiteit Utrechtop gezag van de rector magnificus, prof.dr. W.H. Gispen,
ingevolge het besluit van het college voor promotiesin het openbaar te verdedigen op
dinsdag 10 oktober 2006 des middags te 2.30 uur
door
Adrian Carina Henri Houben
geboren op 10 september 1972 te Weert

Promotor: Prof.dr. G.F. Smoorenburg
Publication of this thesis was financially supported by: Stichting Atze Spoor Fonds,Makker Hoortoestellen, Oticon Nederland BV, GN Resound BV, Siemens AudiologieTechniek BV, Atos Medical, Schoonenberg Hoorcomfort, EmiD AudiologischeApparatuur, and Beltone Netherlands BV.

Contents
List of abbreviations ix
1 Introduction 11.1 Introduction . . . . . . . . . . . . . . . . . . . . . . . . . . . . . . . . . . . 31.2 The basics of hearing . . . . . . . . . . . . . . . . . . . . . . . . . . . . . . 4
1.2.1 Outer and middle ear . . . . . . . . . . . . . . . . . . . . . . . . . . 41.2.2 The cochlea . . . . . . . . . . . . . . . . . . . . . . . . . . . . . . . . 51.2.3 The auditory nerve . . . . . . . . . . . . . . . . . . . . . . . . . . . 7
1.3 Perceptual consequences of cochlear compression . . . . . . . . . . . . . 91.3.1 Improved sensitivity and dynamic range . . . . . . . . . . . . . . . 91.3.2 Improved frequency selectivity . . . . . . . . . . . . . . . . . . . . 101.3.3 Improved temporal resolution . . . . . . . . . . . . . . . . . . . . . 111.3.4 Distortion (combination tones) . . . . . . . . . . . . . . . . . . . . 12
1.4 Perceptual consequences of outer hair cell loss . . . . . . . . . . . . . . . 131.4.1 Lower sensitivity and reduced dynamic range . . . . . . . . . . . 131.4.2 Reduced frequency resolution . . . . . . . . . . . . . . . . . . . . . 141.4.3 Temporal resolution . . . . . . . . . . . . . . . . . . . . . . . . . . . 14
1.5 Estimates of cochlear compression . . . . . . . . . . . . . . . . . . . . . . 141.5.1 In vivo measurements . . . . . . . . . . . . . . . . . . . . . . . . . 151.5.2 Dynamic range . . . . . . . . . . . . . . . . . . . . . . . . . . . . . . 161.5.3 Forward masking . . . . . . . . . . . . . . . . . . . . . . . . . . . . 161.5.4 Distortion products (combination tones) . . . . . . . . . . . . . . . 16
1.6 Compression in hearing aids I. Basic properties . . . . . . . . . . . . . . . 171.6.1 Compression ratio . . . . . . . . . . . . . . . . . . . . . . . . . . . . 171.6.2 Time constants . . . . . . . . . . . . . . . . . . . . . . . . . . . . . . 181.6.3 Several definitions of time constant . . . . . . . . . . . . . . . . . . 181.6.4 Number of channels . . . . . . . . . . . . . . . . . . . . . . . . . . . 20
1.7 Compression in hearing aids II. Implementations . . . . . . . . . . . . . . 221.7.1 Compressive limiting . . . . . . . . . . . . . . . . . . . . . . . . . . 23
v

Contents
1.7.2 Automatic gain control . . . . . . . . . . . . . . . . . . . . . . . . . 231.7.3 Syllabic compression . . . . . . . . . . . . . . . . . . . . . . . . . . 231.7.4 Other types of compression . . . . . . . . . . . . . . . . . . . . . . 24
1.8 Scope and overview of this thesis . . . . . . . . . . . . . . . . . . . . . . . 25
2 The effect of compression on speech intelligibility in stationary noise 272.1 Introduction . . . . . . . . . . . . . . . . . . . . . . . . . . . . . . . . . . . 28
2.1.1 Previous research on amplitude compression . . . . . . . . . . . . 282.1.2 Conclusions from previous research . . . . . . . . . . . . . . . . . 382.1.3 The present research . . . . . . . . . . . . . . . . . . . . . . . . . . 38
2.2 Methods . . . . . . . . . . . . . . . . . . . . . . . . . . . . . . . . . . . . . 392.2.1 Subjects . . . . . . . . . . . . . . . . . . . . . . . . . . . . . . . . . . 392.2.2 Signal Processing . . . . . . . . . . . . . . . . . . . . . . . . . . . . 392.2.3 Speech Material and Procedure . . . . . . . . . . . . . . . . . . . . 422.2.4 Design . . . . . . . . . . . . . . . . . . . . . . . . . . . . . . . . . . 43
2.3 Results . . . . . . . . . . . . . . . . . . . . . . . . . . . . . . . . . . . . . . 442.3.1 Concurrent analysis of single-, two-, and six-channel compression 462.3.2 Analysis with the inclusion of split-frequency compression ratios
(1/2 and 2/3) . . . . . . . . . . . . . . . . . . . . . . . . . . . . . . 482.3.3 Analysis with attack and release time . . . . . . . . . . . . . . . . . 52
2.4 Discussion . . . . . . . . . . . . . . . . . . . . . . . . . . . . . . . . . . . . 532.4.1 Main effects of NC, CR, and Ta/Tr . . . . . . . . . . . . . . . . . . 532.4.2 Attack and release time . . . . . . . . . . . . . . . . . . . . . . . . . 542.4.3 Interactions . . . . . . . . . . . . . . . . . . . . . . . . . . . . . . . . 562.4.4 Best settings . . . . . . . . . . . . . . . . . . . . . . . . . . . . . . . 58
2.5 Conclusions . . . . . . . . . . . . . . . . . . . . . . . . . . . . . . . . . . . 58
3 The effect of compression on speech intelligibility in fluctuating noise 613.1 Introduction . . . . . . . . . . . . . . . . . . . . . . . . . . . . . . . . . . . 62
3.1.1 Previous research on amplitude compression in fluctuating noise 623.1.2 Conclusions based on previous research . . . . . . . . . . . . . . . 70
3.2 Methods . . . . . . . . . . . . . . . . . . . . . . . . . . . . . . . . . . . . . 713.3 Results . . . . . . . . . . . . . . . . . . . . . . . . . . . . . . . . . . . . . . 72
3.3.1 Learning effect . . . . . . . . . . . . . . . . . . . . . . . . . . . . . . 723.3.2 Speech intelligibility in fluctuating noise compared to stationary
noise . . . . . . . . . . . . . . . . . . . . . . . . . . . . . . . . . . . 733.3.3 Concurrent analysis of single-, two-, and six-channel compression 773.3.4 Analysis with the inclusion of split-frequency compression ratios
(1/2 and 2/3) . . . . . . . . . . . . . . . . . . . . . . . . . . . . . . 78
vi

Contents
3.3.5 Analysis with attack and release time . . . . . . . . . . . . . . . . . 803.4 Discussion . . . . . . . . . . . . . . . . . . . . . . . . . . . . . . . . . . . . 80
3.4.1 Results for fluctuating noise compared to results for stationarynoise . . . . . . . . . . . . . . . . . . . . . . . . . . . . . . . . . . . 80
3.4.2 Effect of compression on speech intelligibility . . . . . . . . . . . . 843.4.3 Best parameter values . . . . . . . . . . . . . . . . . . . . . . . . . . 85
3.5 Conclusions . . . . . . . . . . . . . . . . . . . . . . . . . . . . . . . . . . . 85
4 Results for individual listeners 874.1 Introduction . . . . . . . . . . . . . . . . . . . . . . . . . . . . . . . . . . . 88
4.1.1 Previous research reporting individual results of compression . . 884.1.2 Conclusions based on previous research . . . . . . . . . . . . . . . 95
4.2 Results . . . . . . . . . . . . . . . . . . . . . . . . . . . . . . . . . . . . . . 964.2.1 Learning effect . . . . . . . . . . . . . . . . . . . . . . . . . . . . . . 964.2.2 Correlation of hearing loss with age . . . . . . . . . . . . . . . . . 964.2.3 Response errors . . . . . . . . . . . . . . . . . . . . . . . . . . . . . 964.2.4 Measurement error . . . . . . . . . . . . . . . . . . . . . . . . . . . 984.2.5 Analysis of Variance . . . . . . . . . . . . . . . . . . . . . . . . . . . 994.2.6 Significant results . . . . . . . . . . . . . . . . . . . . . . . . . . . . 1034.2.7 Regression analysis . . . . . . . . . . . . . . . . . . . . . . . . . . . 1044.2.8 Best result . . . . . . . . . . . . . . . . . . . . . . . . . . . . . . . . 105
4.3 Discussion . . . . . . . . . . . . . . . . . . . . . . . . . . . . . . . . . . . . 1074.4 Conclusions . . . . . . . . . . . . . . . . . . . . . . . . . . . . . . . . . . . 108
5 Summary and clinical applicability 111
Bibliography 121
Nederlandstalige samenvatting 133
Dankwoord 139
Curriculum Vitae 141
vii

Contents
viii

List of abbreviations
∆SRT SRT obtained for compression minus SRT for linear amplification [dB]AGC automatic gain control, also called automatic volume control (AVC)ANOVA analysis of varianceANSI American National Standards InstituteAPHAB abbreviated profile of hearing aid benefitAVC automatic volume control, also called automatic gain control (AGC)CF characteristic frequency [Hz]CP compression parameters: CP ( NC, CR, T)CR compression ratio, characteristic of compression: change in input level [dB]
divided by the change in output level [dB]CRhigh compression ratio for frequency channels above 1000 Hz [dB/dB]CRlow compression ratio for frequency channels below 1000 Hz [dB/dB]DSL [i/o] desired sensation level. Fitting rationale for linear and compression
hearing aidsDR dynamic range of hearing [dB]DRx, y, z kHz average of the dynamic range of hearing for pure tones at frequencies of x, y,
and z kHz [dB]DRspeech dynamic range of hearing for speech; uncomfortable loudness level of
broadband speech minus the speech reception threshold in quiet [dB]F-ratio Fisher ratio, ratio of variances
here: statistics, F = MSeffect/MSerror
FIG6 fitting rationale for compression hearing aidsHL dB HL, hearing level: level [dB] relative to the (frequency dependent)
standardized equivalent threshold level (ISO 389-2, 1996)HI hearing-impaired listenersHSD-test statistics, Tukey’s honestly significant difference testGOF growth of masking (used in forward masking experiments to estimate
compression ratio)IEC International Electrotechnical CommissionIHC inner hair cellL (sound pressure) level [dB] (SPL)MS statistics, mean square
ix

Abbreviations
MSeffect statistics, mean square of the effect under investigationMSerror statistics, mean square of the error termNAL-NL1 National Acoustics Laboratories nonlinear. Fitting rationale for
compression hearing aidsNAL-RP National Acoustics Laboratories revised profound. Fitting rationale
for linear hearing aids for subjects with mild to profound hearing lossNC number of channels, characteristic of compression: the number of
frequency channels that are independently compressedNH normal hearing listenersOHC outer hair cellp statistics, p-value, probability that the sample could have been drawn
from the population being tested given the assumption that the nullhypothesis is true
PTA pure-tone average hearing loss, the average hearing loss for puretones, expressed relative to normal hearing [dB HL]
PTAx, y, z kHz average of the hearing loss for pure tones at frequencies of x, y,and z kHz [dB HL]
rms root mean square, the rms value of a fluctuating quantity x is given by:xrms =
√(x2
1 + x22 + · · · + x2
N)/N
r2 statistics, fraction of the variance in the data that is explained bya regression line
SC syllabic compressionSNR signal-to-noise ratio [dB]SPL dB SPL, sound pressure level: level [dB] relative to the reference sound
pressure (20 µPa)SRT speech reception threshold in noise [dB]: the signal-to-noise ratio at
which 50% of the presented sentences were repeated correctlySRTstat, linear SRT [dB] for stationary noise and linear amplificationSRTfluct, linear SRT [dB] for fluctuating noise and linear amplificationT time constants, characteristic of compression (T = Ta/Tr) [ms]Ta attack time [ms]TANSI time constants [ms] as defined in ANSI S3.22 (1996)Texp time constants [ms] based on an exponential decayTIEC time constants [ms] as defined in IEC 60188-2Tr release time [ms]TM temporal masking (used in forward masking experiments to estimate
compression ratio)UCL uncomfortable loudness levelWDRC wide dynamic range compression
x

“This golden age of communicationmeans everybody speaks at the sametime”
Lyrics from ‘225’,
Justin Sullivan and Robert Heaton,
New Model Army, ‘Thunder and Consolation’, 1988

xii

Introduction 1

Chapter 1: General Introduction
2

1.1 Introduction
1.1 Introduction
Since the earliest days of electronic sound reproduction, people have tried to develophearing aids to reduce hearing disability. The first “practical” electronic hearing aidwas based on a carbon microphone, and was made as early as 1902. Since this firstdevice, hearing aid amplification has improved steadily: from vacuum tubes (1920s),via transistors (1950s), to integrated circuits (1960s). And finally, in the last decadeswe have seen the rise of powerful digital signal processing. Meanwhile, productiontechniques drastically improved and electronic components were miniaturized. Newhearing aids became ever smaller, while still containing powerful processing capabili-ties. Currently, hearing aid technology has advanced to the point where it is possible toincorporate more than simple and straight forward amplification in wearable devices:the new technology allows the utilization of sophisticated audiological knowledge forimproving hearing ability.
Despite these technological and audiological advances, not every hearing aid user iscompletely satisfied with his/her hearing aid. For the Netherlands it was estimatedthat only 21% of the hearing-impaired population (i.e., people reporting a hearing dif-ficulty) owned a hearing aid (calculated from Duijvesteijn, 1999). An American studyreported a similar situation: in 1999 the market penetration of hearing aids was lim-ited to only 20% of the total American hearing-impaired population (Kochkin, 1999).Moreover, of the hearing aid owners roughly 16% did not use their aids at all (Kochkin,2000). The primary reason was small benefit, especially in noisy situations.
Hearing disability is most significantly and most frequently present in daily-life com-munication in noisy situations, such as conversations in restaurants and at parties. Aconversation in a background of other speakers is notoriously difficult to follow forhearing-impaired listeners, especially for people with sensorineural hearing loss. Thistype of hearing loss involves a dysfunction of the sensorineural structures of the innerear; or in other words, it is often caused by ’defective hearing sensors’. Sensorineuralhearing loss generally leads to lower speech intelligibility in a background noise, evenif hearing aids are used. The prevalence of this hearing loss is quite extensive and com-mon causes are for instance ageing, excessive noise exposure, genetic predisposition,and ototoxic medication.
It is important to further reduce hearing handicap, especially in noisy situations.One means is to develop hearing aids in which sophisticated audiology-based sig-nal processing is applied. This thesis investigates several (compressive) amplificationstrategies to determine which strategy provides the best speech intelligibility in noisy
3
Chapter 1: General Introduction
situations for listeners with a sensorineural hearing loss.
1.2 The basics of hearing
In daily life we often depend on hearing to interact with our surroundings. A closelook at the hearing mechanisms reveals that our hearing ability, which comes so eas-ily, stems from an amazing and dynamic process. The next three sections explain thebasic anatomy and sound processing that occurs in the outer and middle ear, the in-ner ear, and the auditory nerve. Each section is divided into A) anatomy, B) soundtransmission, and C) hearing loss.
1.2.1 Outer and middle ear
A. Anatomy
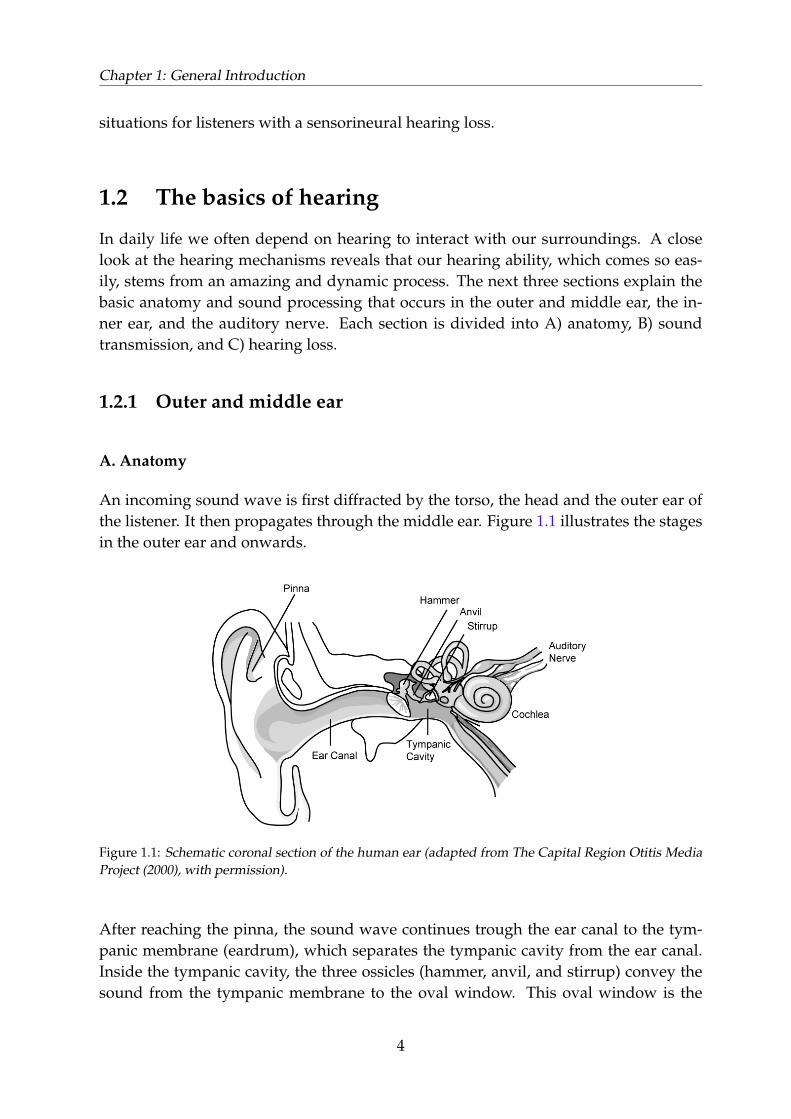
An incoming sound wave is first diffracted by the torso, the head and the outer ear ofthe listener. It then propagates through the middle ear. Figure 1.1 illustrates the stagesin the outer ear and onwards.
Figure 1.1: Schematic coronal section of the human ear (adapted from The Capital Region Otitis MediaProject (2000), with permission).
After reaching the pinna, the sound wave continues trough the ear canal to the tym-panic membrane (eardrum), which separates the tympanic cavity from the ear canal.Inside the tympanic cavity, the three ossicles (hammer, anvil, and stirrup) convey thesound from the tympanic membrane to the oval window. This oval window is the
4

1.2 The basics of hearing
entrance of the inner ear.
B. Sound transmission in the outer and middle ear
The eardrum, ossicles, and oval window form an impedance transformer; they changethe incoming sound pressure wave into a fluid pressure wave in the cochlea. With-out this impedance transformation about 99.9% of the incoming sound energy wouldbe reflected back from the fluid surface (Pickles, 1988). The influence of the torso, thepinna, and the entire middle ear can be approximated by a band pass filter (Palmerand Shamma, 2004). The transduction behaves linearly, i.e., the sound transmissiondepends on frequency only and is unaffected by the intensity of the incoming soundwave. However, this approximation is only accurate for moderate sound levels. Athigher sound levels additional nonlinear processes occur. For instance, the small mus-cles which are connected to the ossicles can protect the inner ear by contracting at highsound pressure levels (middle ear reflex). The contraction predominantly attenuatesthe low frequency components. For high sound levels these muscles therefore intro-duce a nonlinear response. Moreover, at very high sound levels the tympanic mem-brane and the ossicles themselves can introduce nonlinear distortion (Moore, 1998).Nevertheless, at moderate sound levels ( < 90 dB SPL), these nonlinear effects do notoccur and the transmission through outer and middle ear can be regarded as a linearsystem. In the experiments in this thesis (Chapters 2, 3 and 4), all stimuli were pre-sented at moderate levels for which it is safe to assume that the middle ear behaveslinearly.
C. Conductive hearing loss
Damage to the outer and middle ear will impair the hearing abilities of the listener.Such hearing impairment manifests itself mostly as a frequency dependent loss of hear-ing sensitivity, i.e., a conductive hearing loss. Surgical procedures or the application ofa hearing-aid can often lead to substantial improvement of hearing ability.
1.2.2 The cochlea
A. Anatomy
The stirrup conveys the incoming sound wave to the cochlea, which converts the soundwave into nerve impulses. The cochlea consists of three fluid filled canals which to-gether are coiled in the form of a snail’s shell, hence the name (from Greek “kochlos”meaning “spiral shell”). Figure 1.2 shows a schematic cross section of a human cochlea.Sound waves enter the cochlea via the oval window. At the top of the spiral (apex), thescala vestibuli is connected to the adjacent scala tympani. This connection is called he-licotrema. At the far end, the scala tympani is closed by the round window, which is a
5

Chapter 1: General Introduction
membrane that allows the incompressible fluid to displace in accordance to the motionforced on the fluid through the oval window (Nedzelnitsky, 1980).
Figure 1.2: Schematic cross section of the cochlea. The arrows represent the incoming and outgoingsound waves. The right panel shows a cross section of a turn of the cochlea.
Between the scala vestibule and scala tympani, another duct is present: the scala me-dia. This scala is not connected to the other two scalae, it ends blindly at the heli-cotrema. The scala media is separated from the scala vestibuli by Reissner’s membraneand from the scala tympani by the basilar membrane. The actual sensory organ, theorgan of Corti, is situated on the basilar membrane (inside the scala media). Soundpressure waves force the basilar membrane to vibrate and the organ of Corti convertsthis movement to electro-chemical activity that elicits nerve impulses. The organ ofCorti contains two types of receptor cells: inner hear cells (IHCs) and outer hair cells(OHCs). These hair cells are arranged in four rows; one row of IHCs and three rows ofOHCs. The function of IHCs and OHCs differs. The IHCs are the actual transductioncells which convert the incoming sound waves to outgoing nerve impulses. The OHCsare thought to amplify incoming sound to facilitate detection by the IHCs (Pickles,1988).
B. Sound transmission in the cochlea
An incoming sound wave moves over the basilar membrane as a travelling wave (VonBekesy, 1960). The mechanical compliance (e.g., the stiffness and mass) of the basilarmembrane changes systematically along the membrane. This change evokes a maxi-mal displacement of the sound wave to occur at a specific position on the basilar mem-brane. This place on the basilar membrane corresponds directly to the frequency ofthe incoming sound wave: the characteristic frequency CF of this place. The base ofthe cochlea responds well to high frequencies, the apex to low frequencies. The pas-sive system, that is the system without OHC function, has poor frequency selectivity.Passive frequency tuning has a shallow slope on the low-frequency side and a steeperslope on the high-frequency side (Geisler, 1998). In fact, the basilar membrane can beregarded as a low-pass filter (Pickles, 1988). Thus, if we disregard OHC function, the
6

1.2 The basics of hearing
response of the basilar membrane is frequency dependent and approximately linear.
However, this passive system is a gross simplification since it is thought that the OHCsact as an active bio-mechanical amplifier. The OHCs amplify incoming sound waveswhen their frequencies are close to the characteristic frequency. The amplification ishighly nonlinear and it strongly influences threshold, dynamic range of hearing, andfrequency selectivity, see section 1.3.
C. Cochlear hearing loss
Damage to the IHCs leads to an increased threshold of hearing. If the extent of IHCloss is limited, amplification provided by hearing aids can restore hearing thresholdsto near normal. Hearing loss due to loss of OHCs is much more common than hearingloss due to loss of IHCs, since OHCs are more susceptible to damage than IHCs. Adysfunction of the OHCs leads to less bio-mechanical amplification, which results ina loss of sensitivity, a smaller dynamic range, and impaired frequency resolution. Theconsequences of extensive OHC loss are far reaching and complex, and are difficult totreat. Surgical procedures and efficacious medication hardly exist (Dobie, 1997; Muru-gasu, 2005), while assistive devices such as hearing aids can not restore the impairedhearing to normal.
Hearing loss that originates from damaged OHCs is the central theme of this thesisand it will be discussed in more detail in sections 1.3 to 1.5.
1.2.3 The auditory nerve
A. Anatomy
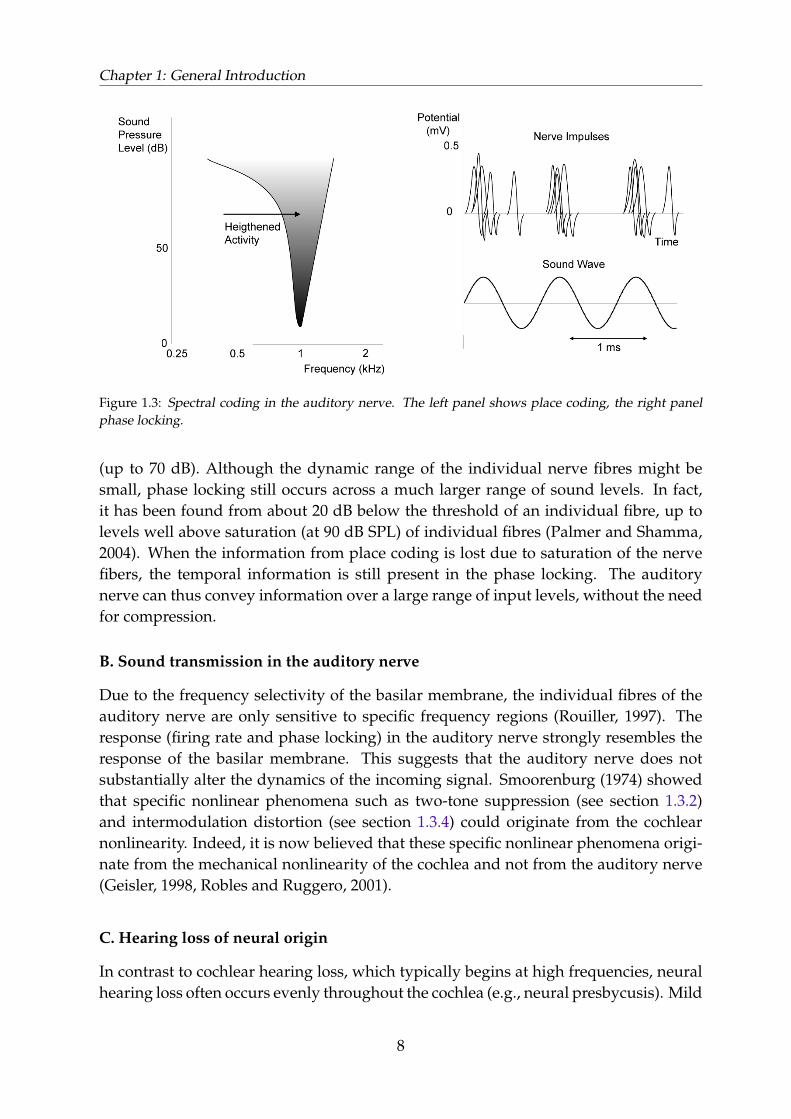
The IHCs transform the incoming fluid pressure wave into nerve impulses. Each IHCis connected to about twenty afferent nerve fibres (Pickles, 1988). Spectral content isencoded in two ways, which are both illustrated in Figure 1.3. First, each nerve fibrecorresponds to a specific cochlear location that is most sensitive to a specific frequency(place coding). Second, the timing of the nerve spikes does not occur randomly intime. The discharges occur at specific moments in time corresponding to the phase ofthe waveform at the innervation site (phase locking). Phase locking is limited to thelower frequencies. For instance, in the cat, phase locking occurs for frequencies up to5 kHz (Rose et al., 1967; Palmer and Shamma, 2004).
Most nerve fibres (about 80%) respond to low intensity sounds (20 dB SPL or less).These nerve fibres have a high spontaneous discharge rate (40–120 discharges/s) and arelatively small dynamic range (30 dB). Saturation at such low levels suggests extremecompression. However, another type of nerve fibres with a low spontaneous rate offiring ( < 20/s), has higher thresholds (up to 80 dB SPL) and larger dynamic ranges
7
Chapter 1: General Introduction
Figure 1.3: Spectral coding in the auditory nerve. The left panel shows place coding, the right panelphase locking.
(up to 70 dB). Although the dynamic range of the individual nerve fibres might besmall, phase locking still occurs across a much larger range of sound levels. In fact,it has been found from about 20 dB below the threshold of an individual fibre, up tolevels well above saturation (at 90 dB SPL) of individual fibres (Palmer and Shamma,2004). When the information from place coding is lost due to saturation of the nervefibers, the temporal information is still present in the phase locking. The auditorynerve can thus convey information over a large range of input levels, without the needfor compression.
B. Sound transmission in the auditory nerve
Due to the frequency selectivity of the basilar membrane, the individual fibres of theauditory nerve are only sensitive to specific frequency regions (Rouiller, 1997). Theresponse (firing rate and phase locking) in the auditory nerve strongly resembles theresponse of the basilar membrane. This suggests that the auditory nerve does notsubstantially alter the dynamics of the incoming signal. Smoorenburg (1974) showedthat specific nonlinear phenomena such as two-tone suppression (see section 1.3.2)and intermodulation distortion (see section 1.3.4) could originate from the cochlearnonlinearity. Indeed, it is now believed that these specific nonlinear phenomena origi-nate from the mechanical nonlinearity of the cochlea and not from the auditory nerve(Geisler, 1998, Robles and Ruggero, 2001).
C. Hearing loss of neural origin
In contrast to cochlear hearing loss, which typically begins at high frequencies, neuralhearing loss often occurs evenly throughout the cochlea (e.g., neural presbycusis). Mild
8

1.3 Perceptual consequences of cochlear compression
injury to the auditory nerve mainly affects the timing of the neural discharges (Møller,2000). Consequently, pure tone sensitivity remains unaffected until the hearing loss isquite severe (up to 90% of neurons may be lost; Roeser et al., 2000) and the dynamicrange of hearing is not affected. However, speech discrimination at moderate levels isoften disproportionately lower than suggested by the pure tone sensitivity (Jerger andJerger, 1981), and it can even decrease as the speech level is increased. Since neuralhearing loss affects the timing of the neural impulses, it has the strongest effect ontiming-related perceptions and tasks, such as temporal masking, gap detection, tem-poral integration, and low-frequency pitch perception (Zeng et al., 2005). Moderateneural hearing loss does not affect the dynamic range of hearing, and therefore com-pressive amplification (section 1.6) is not suitable for improving speech intelligibilityfor this type of hearing loss.
1.3 Perceptual consequences of cochlear compressionThe cochlear nonlinearity influences auditory perception considerably, and behavesin an essentially nonlinear way (Goldstein, 1967; Eguıluz et al. 2000). This meansthat the nonlinearity is already present at moderate sound levels and is not the resultfrom distortion caused by high sound pressure levels. Figure 1.4 illustrates the effect ofcochlear amplification. The figure is based on a famous in vivo experiment by Ruggeroand Rich (1991), and shows the velocity of the basilar membrane as a function of theinput sound level.
The figure shows amplification at low levels resulting in a compressive input-outputfunction between 30 and 90 dB SPL (solid line). For these levels, the velocity of thebasilar membrane increases with about 0.5 dB for each increase of 1 dB in stimuluslevel; the response is nonlinear. In contrast, for low ( < 30 dB SPL) and high ( > 90 dBSPL) stimulus levels, the response is linear (response growth of 1 dB per 1 dB increasein input level). The dashed line in Figure 1.4 shows the situation where OHC amplifi-cation is temporarily suppressed; the response is linear. The response to tones with afrequency far away from the characteristic frequency, i.e., far away from the recordinglocation on the basilar membrane, also behaves linearly.
1.3.1 Improved sensitivity and dynamic range
Figure 1.4 illustrates the influence of the compressive nonlinearity at low thresholds.The high amount of amplification for low input levels improves hearing sensitivity.For human hearing, it has been estimated that the outer hair cells can improve thethreshold by as much as 40 to 60 dB. The measurement from Ruggero and Rich in achinchilla shows an increase of about 30 dB (see Figure 1.4).
The lower threshold of hearing greatly increases the dynamic range of the system. The
9

Chapter 1: General Introduction
Figure 1.4: Illustration of the input-output function of the basilar membrane of a chinchilla. The solidline represents the response of a healthy cochlea at the characteristic frequency, the dashed line theresponse of a cochlea with eliminated OHC function. Redrawn from Ruggero and Rich, 1991. Addi-tionally, the thin line indicates the curve for a linear response. A factor 10 change in velocity (ordinate)corresponds to 20 dB.
compressive nonlinearity therefore directly improves the human dynamic range from60–80 dB HL to about 120 dB HL. In other words, the nonlinearity effectively reduces(compresses) the incoming sound waves by about 2 dB per 1 dB.
1.3.2 Improved frequency selectivity
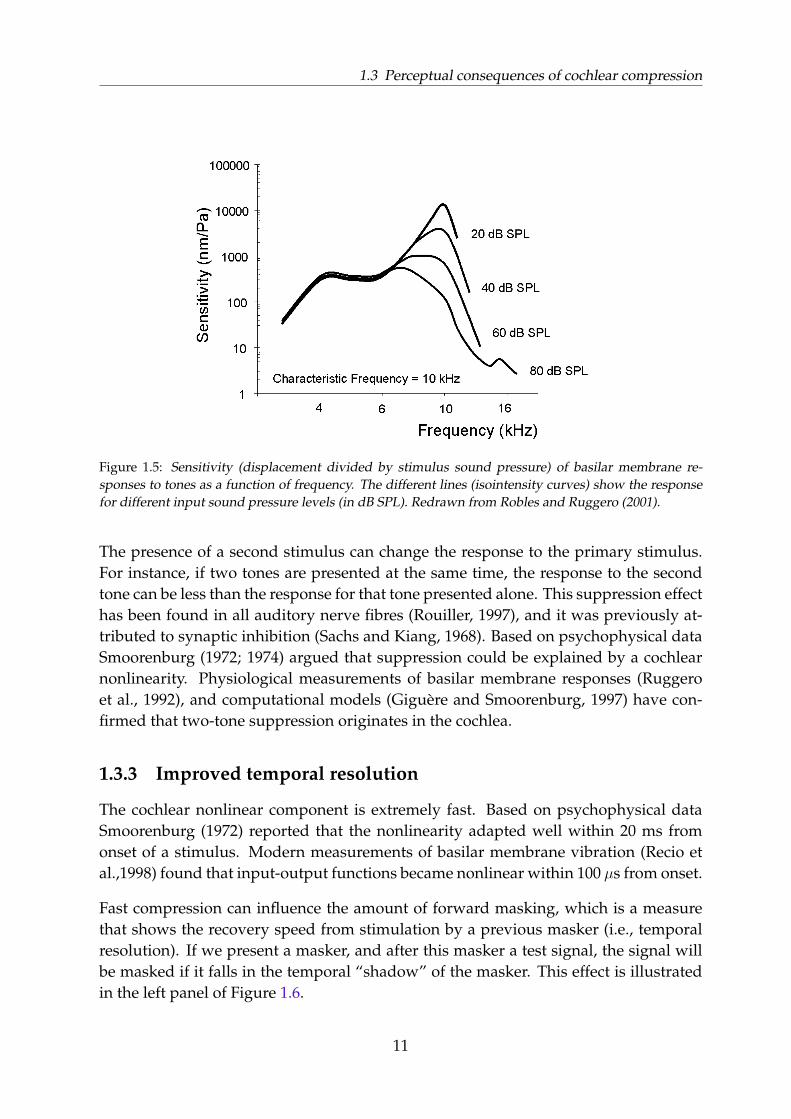
The frequency tuning on the basilar membrane is generally thought to stem from twocomponents. The first arises from the hydro-mechanical properties of the cochlea (suchas the compliance, friction, and mass of the basilar membrane; the volume of the scalae;the viscosity of the cochlear fluids etc.). This component acts only passively and itsbehaviour is linear for all stimulus levels. The second component is thought to arisefrom the active influence of the outer hair cells on the basilar membrane. This effectis markedly nonlinear: at low input levels the bio-mechanical amplification is higherthan at higher input levels. The sharpness of tuning therefore depends on the stimuluslevel (Robles and Ruggero, 2001). For low input levels it is dominated by the activeOHC component, at high input levels by the passive tuning of the basilar membrane.Figure 1.5 illustrates the sensitivity of basilar membrane responses as a function offrequency and stimulus level.
The curves for low stimulus levels (e.g., 40 dB SPL), show a sharp drop in sensitivity forfrequencies which are further away from the characteristic frequency. For higher stim-ulus levels, the sensitivity changes less with frequency; the tuning is much broader.
10
1.3 Perceptual consequences of cochlear compression
Figure 1.5: Sensitivity (displacement divided by stimulus sound pressure) of basilar membrane re-sponses to tones as a function of frequency. The different lines (isointensity curves) show the responsefor different input sound pressure levels (in dB SPL). Redrawn from Robles and Ruggero (2001).
The presence of a second stimulus can change the response to the primary stimulus.For instance, if two tones are presented at the same time, the response to the secondtone can be less than the response for that tone presented alone. This suppression effecthas been found in all auditory nerve fibres (Rouiller, 1997), and it was previously at-tributed to synaptic inhibition (Sachs and Kiang, 1968). Based on psychophysical dataSmoorenburg (1972; 1974) argued that suppression could be explained by a cochlearnonlinearity. Physiological measurements of basilar membrane responses (Ruggeroet al., 1992), and computational models (Giguere and Smoorenburg, 1997) have con-firmed that two-tone suppression originates in the cochlea.
1.3.3 Improved temporal resolution
The cochlear nonlinear component is extremely fast. Based on psychophysical dataSmoorenburg (1972) reported that the nonlinearity adapted well within 20 ms fromonset of a stimulus. Modern measurements of basilar membrane vibration (Recio etal.,1998) found that input-output functions became nonlinear within 100 µs from onset.
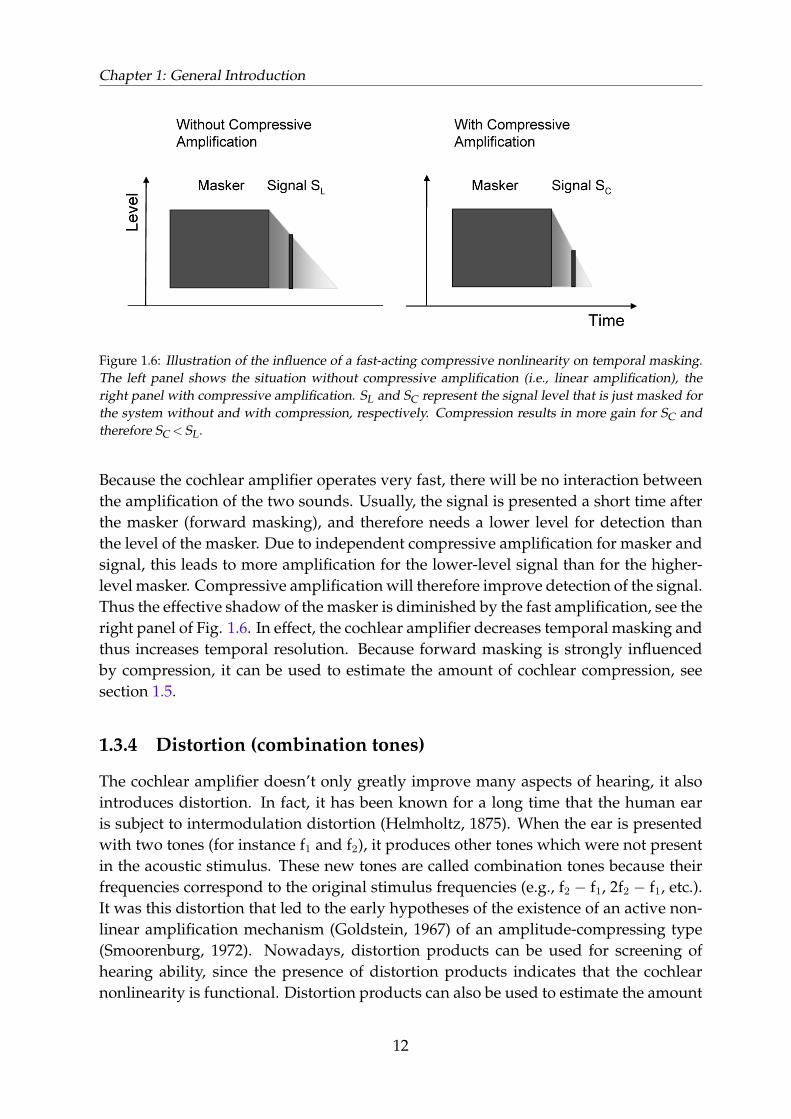
Fast compression can influence the amount of forward masking, which is a measurethat shows the recovery speed from stimulation by a previous masker (i.e., temporalresolution). If we present a masker, and after this masker a test signal, the signal willbe masked if it falls in the temporal “shadow” of the masker. This effect is illustratedin the left panel of Figure 1.6.
11
Chapter 1: General Introduction
Figure 1.6: Illustration of the influence of a fast-acting compressive nonlinearity on temporal masking.The left panel shows the situation without compressive amplification (i.e., linear amplification), theright panel with compressive amplification. SL and SC represent the signal level that is just masked forthe system without and with compression, respectively. Compression results in more gain for SC andtherefore SC < SL.
Because the cochlear amplifier operates very fast, there will be no interaction betweenthe amplification of the two sounds. Usually, the signal is presented a short time afterthe masker (forward masking), and therefore needs a lower level for detection thanthe level of the masker. Due to independent compressive amplification for masker andsignal, this leads to more amplification for the lower-level signal than for the higher-level masker. Compressive amplification will therefore improve detection of the signal.Thus the effective shadow of the masker is diminished by the fast amplification, see theright panel of Fig. 1.6. In effect, the cochlear amplifier decreases temporal masking andthus increases temporal resolution. Because forward masking is strongly influencedby compression, it can be used to estimate the amount of cochlear compression, seesection 1.5.
1.3.4 Distortion (combination tones)
The cochlear amplifier doesn’t only greatly improve many aspects of hearing, it alsointroduces distortion. In fact, it has been known for a long time that the human earis subject to intermodulation distortion (Helmholtz, 1875). When the ear is presentedwith two tones (for instance f1 and f2), it produces other tones which were not presentin the acoustic stimulus. These new tones are called combination tones because theirfrequencies correspond to the original stimulus frequencies (e.g., f2 − f1, 2f2 − f1, etc.).It was this distortion that led to the early hypotheses of the existence of an active non-linear amplification mechanism (Goldstein, 1967) of an amplitude-compressing type(Smoorenburg, 1972). Nowadays, distortion products can be used for screening ofhearing ability, since the presence of distortion products indicates that the cochlearnonlinearity is functional. Distortion products can also be used to estimate the amount
12

1.4 Perceptual consequences of outer hair cell loss
of cochlear compression (see section 1.5).
1.4 Perceptual consequences of outer hair cell loss
1.4.1 Lower sensitivity and reduced dynamic range
One of the most noticeable effects of cochlear damage is an impaired ability to hearlow-level sounds. The solution, of course, is to amplify the incoming sounds to thepoint where they become audible for the hearing impaired. However, simple amplifi-cation can quickly lead to uncomfortably loud sounds, and even to more hearing loss.
Normal cochlear amplification is largest for low input levels, and it decreases forhigher level sounds. The pathological absence of cochlear amplification therefore re-sults in inaudible low-level sounds, while the loudness of high-level sounds stays(near) normal, i.e., the dynamic range of hearing becomes smaller. Figure 1.7 schemat-ically illustrates this reduced dynamic range due to loss of cochlear compression.
Figure 1.7: Schematic illustration of a reduced dynamic range (DR) of hearing due to cochlear hear-ing loss. The ordinate denotes the input sound level. Although cochlear hearing loss leads to higherthresholds, the uncomfortably loud levels (UCL) can stay unaffected. This can easily lead to the classicscenario of an individual saying “Speak up, I can’t hear you”, and in the next breath: “There’s no needto shout, I’m not deaf”.
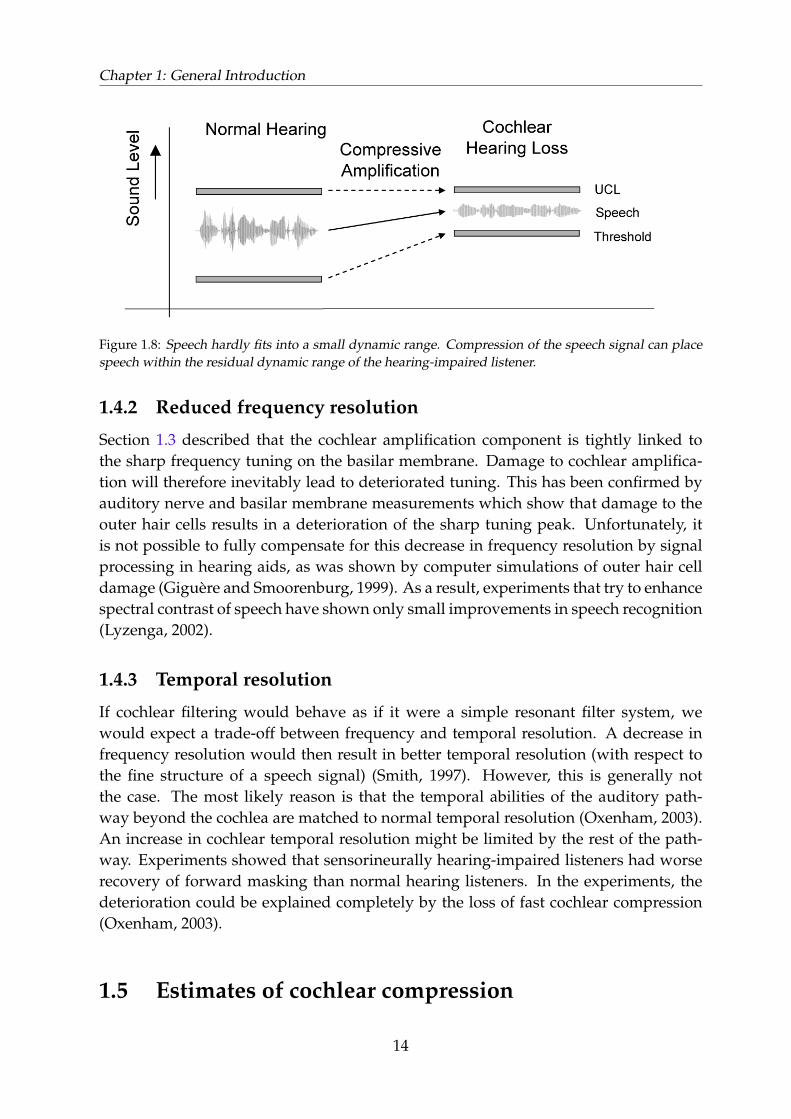
Elevated thresholds combined with near normal uncomfortable levels (UCLs) cause anabnormal loudness growth (recruitment). Recruitment can be very awkward; a littlemore vocal effort can turn inaudible speech into uncomfortably loud speech (see Fig.1.7). A solution lies in hearing aids with compressive amplification: low-level soundsshould receive more amplification than high-level sounds. Figure 1.8 illustrates thebenefit of compressive amplification for alleviating cochlear hearing loss. Note thatthe effect of compression on the speech signal depends on the type of compression, seesection 1.6 and Fig. 1.16.
13
Chapter 1: General Introduction
Figure 1.8: Speech hardly fits into a small dynamic range. Compression of the speech signal can placespeech within the residual dynamic range of the hearing-impaired listener.
1.4.2 Reduced frequency resolution
Section 1.3 described that the cochlear amplification component is tightly linked tothe sharp frequency tuning on the basilar membrane. Damage to cochlear amplifica-tion will therefore inevitably lead to deteriorated tuning. This has been confirmed byauditory nerve and basilar membrane measurements which show that damage to theouter hair cells results in a deterioration of the sharp tuning peak. Unfortunately, itis not possible to fully compensate for this decrease in frequency resolution by signalprocessing in hearing aids, as was shown by computer simulations of outer hair celldamage (Giguere and Smoorenburg, 1999). As a result, experiments that try to enhancespectral contrast of speech have shown only small improvements in speech recognition(Lyzenga, 2002).
1.4.3 Temporal resolution
If cochlear filtering would behave as if it were a simple resonant filter system, wewould expect a trade-off between frequency and temporal resolution. A decrease infrequency resolution would then result in better temporal resolution (with respect tothe fine structure of a speech signal) (Smith, 1997). However, this is generally notthe case. The most likely reason is that the temporal abilities of the auditory path-way beyond the cochlea are matched to normal temporal resolution (Oxenham, 2003).An increase in cochlear temporal resolution might be limited by the rest of the path-way. Experiments showed that sensorineurally hearing-impaired listeners had worserecovery of forward masking than normal hearing listeners. In the experiments, thedeterioration could be explained completely by the loss of fast cochlear compression(Oxenham, 2003).
1.5 Estimates of cochlear compression
14

1.5 Estimates of cochlear compression
This section gives an indication of the amount of cochlear compression. The amount ofcompression is expressed as a “compression ratio” (CR), i.e., the change in input gain(in dB) divided by the change in output gain (in dB). For an input-output graph suchas Figure 1.4, where both axes have a logarithmic scale, the compression ratio is repre-sented in the slope of the curves. See section 1.6.1 for a more elaborate description ofcompression ratio. We adopt CR because this is a common measure in the hearing aidindustry. In contrast, many physiological investigations express the amount of com-pression as a “growth rate”, which is the reciprocal of the compression ratio (growthrate = 1/CR).
1.5.1 In vivo measurements
Robles and Ruggero (2001) reviewed available data on basilar membrane responsesthat were measured at basal sites of the cochlea. They reported response growths thatwere averaged over the total input range (i.e., one value for the entire range, theirTable 1). Figure 1.9 shows a graphical representation of their findings; the presentationis analogous to Figure 1.4.
Figure 1.9: Range of experimentally found basilar membrane input-output curves, for different species.The figure is an adaptation from the literature review by Robles and Ruggero (2001, data from Table1). The slope of the curves and the corresponding values to the right show the average compressionratio. Data was obtained from in vivo experiments at basal sites of the cochlea. The line in the lower leftcorner represents a linear response (CR = 1). For clarity, data for the different animals are shifted alongthe ordinate.
Overall, the figure shows that the measured compression ratios ranged between 2 and
15

Chapter 1: General Introduction
8. Most compression ratios centered around 3, with the exception of the guinea pig forwhich much higher compression ratios were found. Generally, the amount of compres-sion was less at more apical sites on the basilar membrane (i.e., for lower characteristicfrequencies). It is very difficult to measure apical basilar membrane responses, andinflicted cochlear damage quickly leads to linear responses. Therefore, data for siteson the basilar membrane near the apex is scarce. Nevertheless, a few papers reportedcompression ratios of about 1.25–2 for the chinchilla and a linear response (CR = 1) forboth the guinea pig and squirrel monkey (Robles and Ruggero, 2001).
1.5.2 Dynamic range
Besides animal models, it is also possible to obtain a rough estimate of the overallamount of compression by using its influence on the dynamic range. For instance,it is often assumed that complete loss of outer hair cells causes a threshold eleva-tion of about 50 (± 10) dB HL, while the upper limit of hearing remains normal (110± 10 dB HL). This implies that the OHCs reduce the dynamic range with a CR of about2 (± 0.5).
1.5.3 Forward masking
Smoorenburg (1974) used forward masking (pulsation technique of Houtgast, 1972) toobtain an estimate for the compression ratio in humans. He measured a compressionratio of about 2 for a CF of 1 kHz. Another approach is to compare the forward mask-ing results for on-frequency and off-frequency maskers. The two most used methodsare growth of masking (GOF, Oxenham and Plack, 1997; Oxenham and Bacon, 2003)and temporal masking (TM, Nelson et al., 2001). Both methods assume that a maskerwith a frequency far away from the characteristic frequency yields a linear response.However, it is not clear that this assumption is valid, especially for low CFs (Lopez-Poveda et al., 2003). This makes the results somewhat difficult to interpret. Moreover,for both methods it is not yet established if the observed compression can be com-pletely ascribed to cochlear compression or to other mechanisms. Estimates based onGOF and TM show compression ratios from about 2 to 5.5 (Oxenham and Plack, 1997;Lopez-Poveda et al., 2003; Plack and Drga, 2003; Rosengard et al., 2005).
1.5.4 Distortion products (combination tones)
Cochlear distortion products can be used to obtain an estimate of the amount compres-sion in the human cochlea. Smoorenburg (1972, 1974) used the level of the combinationtone 2f1-f2 in relation to level of the primary tones f1 and f2. He obtained an estimate ofcompression ratio of about 2 (f1 = 1 kHz). Neely et al. (2003) re-evaluated previouslyobtained data from several recent distortion product measurements, and found CRsranging from 1 to 4, for low (0–20 dB SPL) to high (50–70 dB SPL) input levels, respec-
16

1.6 Compression in hearing aids I. Basic properties
tively. A similar range (1.7–5) has been obtained from tone-burst and transient evokedoto-acoustic emissions (Harte and Elliott, 2005).
Evaluating the different estimates, we can assume that cochlear compression in thehuman ear is, on average, about 3 (± 2) dB).
1.6 Compression in hearing aids I. Basic propertiesModern hearing aids counteract consequences of sensorineural hearing loss with com-pressive amplification. Such a compression system is an amplifier with high gain forlow input levels, and with low gain for high input levels. The amount of gain is con-trolled by the envelope of a signal, leaving the fine structure unaffected.
Compression in hearing aids can be characterised by three main parameters, namelycompression ratio, time constants and number of channels. The next three sectionsexplain these parameters.
1.6.1 Compression ratio
Compression ratio (CR) is defined as the change in input gain (in dB) divided by thechange in output gain (in dB). Compression ratio is thus a measure of the reduction ingain. A compression ratio of 2, for instance, indicates that an increase in sound levelof 2 dB will lead to an increase in output level of only 1 dB. This process is shown inFigure 1.10 which illustrates the static properties of compression.
Figure 1.10: Input-output curve of a compression system. Compression ratio (CR) is defined as thechange in input level (∆Lin) relative to the change in output level (∆Lout).
Compression is only active above the compression threshold. Figure 1.10 indicates
17

Chapter 1: General Introduction
that for input levels below threshold, the transduction is linear. As a side note, inour experiments (Chapters 2, 3 and 4) we ensured that all input levels were above thecompression threshold. Some commercial hearing aids use additional expansion forextremely low input levels ( < 10 dB SPL) to block low level microphone noise, andsevere compression for high input levels ( > 90 dB SPL) to prevent the amplifier frompeak clipping.
1.6.2 Time constants
The speed at which a compression hearing aid reacts to changes in input level is char-acterised by its time constants. Figure 1.11 clarifies the definition of attack and releasetime. Attack time is the time it takes the gain to adjust to a sudden increase in inputlevel (for instance caused by a door slamming shut). Similarly, release time is the timeit takes the gain to adjust to a sudden decrease in input level (for instance caused by anengine switching off). Attack and release times can be varied independently. Due tonon-zero time constants it takes the compressor some time to adjust the gain. Duringthe adjustment the compression system is in a state of overshoot (too much gain), orundershoot (not enough gain).
Figure 1.11: Dynamic characteristics of compression. The upper panel shows the envelope of an inputsignal, in this example a sine wave which is modulated by a square wave. Compression in hearing aidstypically reacts to level changes of the envelope of the input signal, and not to the fine structure (the sinewave). The lower panel shows the corresponding output signal. Ta = attack time; Tr = release time.
1.6.3 Several definitions of time constant
18

1.6 Compression in hearing aids I. Basic properties
When comparing the effects different compression systems, it is important to knowhow attack and release time are defined, since they describe the reaction of a com-pressor to changes in signal amplitude. Currently, several definitions of attack andrelease time are in use. The two standards that are most frequently used are an inter-national/European (IEC 60118-2, 1983) and an American (ANSI S3.22, 1996) standard.Both the IEC 60118-2 (1983) and the previous (obsolete) ANSI S3.22 from 1987, defineattack and release time according to a change in input level from 55 to 80 dB (and viceversa) of a sine wave with a frequency of 2 kHz. Both attack and release time are de-fined with respect to a level 2 dB off the steady state output level. However, the newANSI S3.22 (1996) defines attack and release time for a change in input level from 55 to90 dB (and vice versa) for a sine wave of arbitrary frequency. Attack time is defined asthe time it takes the output level to reach 3 dB above steady state output level, releasetime is the time it takes to reach 4 dB below steady state output level.
Both IEC and ANSI define time constant as the time it takes the output level to reach acertain distance from the final steady state level. This type of definition is ambiguousbecause the value of time constant is not only influenced by the speed of the peakdetector (the RC constant), but also by the amount of overshoot. This implies that thebehaviour of two systems with the same IEC/ANSI time constant can be very different(Kates, 1993). For instance, one system with a low threshold and fast compression, andanother system with a high threshold and slow compression, might have the samerelease time constant when measured over the entire input range. Of course, this isremedied by IEC and ANSI through the specification of fixed input levels for timeconstant measurements.
In contrast to IEC and ANSI, we define time constant mathematically as the time ittakes for the output level to reach 1/e (≈ 37%) of the ultimate change in gain. Fig-ure 1.12 illustrates the difference between our and the IEC definition.
From the figure it can be seen that the definitions are fundamentally different. Boththe IEC and ANSI definitions are based on the tail of the response, while our definitionis based on the initial part. Consequently, the ratio of time constants according to theIEC/ANSI definition and ours is not constant, but depends on the amount of overshoot(and therefore on the combination of input signal, compression ratio and threshold). Achange in input from 55 to 80 dB with CR = 2 results in an overshoot of the output levelof 12.5 dB. Using this overshoot and assuming logarithmic decay for an IEC system,the ratio between our (Texp) and the IEC definition (TIEC) is Texp/TIEC = 0.4 for bothattack and release time. For an ANSI (1996) system the ratio for the same input rise isTexp/TANSI = 0.5 for attack time and Texp/TANSI = 0.6 for release time. Since these ratiosdepend on overshoot, they differ for different input signals and compression ratios.An overshoot of 6.25 dB (25 dB input change with CR = 4) and 16.7 dB (25 dB inputchange with CR = 1.5) results in Texp/TIEC = 0.7, and Texp/TIEC = 0.3, respectively. Incomparing our results to those specified in terms of TIEC or TANSI we suggest to use the
19

Chapter 1: General Introduction
Figure 1.12: Different definitions of time constant. TIEC represents time constant as defined byIEC 60188-2; T1/e is our mathematical definition.
factor of 0.4. See section 1.7 for a description of time constants in common compressionsystems.
1.6.4 Number of channels
Instead of applying compression to the entire signal (single-channel or wide-bandcompression), it is also possible to compress spectral parts of the signal in smallerfrequency bands (multi-channel compression). Figure 1.13 illustrates the differencebetween single-channel and multi-channel compression.
Figure 1.13: Schematics of compression. The top panel shows single-channel compression, the bottompanel shows multi-channel compression.
20
1.6 Compression in hearing aids I. Basic properties
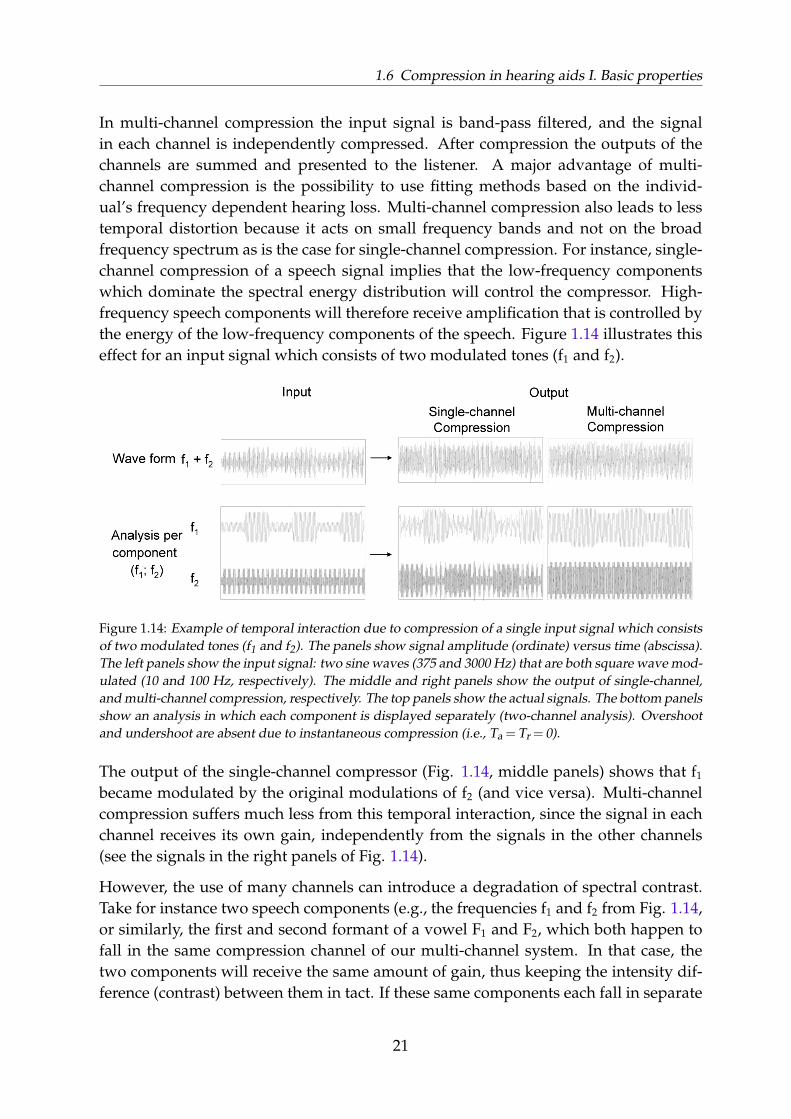
In multi-channel compression the input signal is band-pass filtered, and the signalin each channel is independently compressed. After compression the outputs of thechannels are summed and presented to the listener. A major advantage of multi-channel compression is the possibility to use fitting methods based on the individ-ual’s frequency dependent hearing loss. Multi-channel compression also leads to lesstemporal distortion because it acts on small frequency bands and not on the broadfrequency spectrum as is the case for single-channel compression. For instance, single-channel compression of a speech signal implies that the low-frequency componentswhich dominate the spectral energy distribution will control the compressor. High-frequency speech components will therefore receive amplification that is controlled bythe energy of the low-frequency components of the speech. Figure 1.14 illustrates thiseffect for an input signal which consists of two modulated tones (f1 and f2).
Figure 1.14: Example of temporal interaction due to compression of a single input signal which consistsof two modulated tones (f1 and f2). The panels show signal amplitude (ordinate) versus time (abscissa).The left panels show the input signal: two sine waves (375 and 3000 Hz) that are both square wave mod-ulated (10 and 100 Hz, respectively). The middle and right panels show the output of single-channel,and multi-channel compression, respectively. The top panels show the actual signals. The bottom panelsshow an analysis in which each component is displayed separately (two-channel analysis). Overshootand undershoot are absent due to instantaneous compression (i.e., Ta = Tr = 0).
The output of the single-channel compressor (Fig. 1.14, middle panels) shows that f1
became modulated by the original modulations of f2 (and vice versa). Multi-channelcompression suffers much less from this temporal interaction, since the signal in eachchannel receives its own gain, independently from the signals in the other channels(see the signals in the right panels of Fig. 1.14).
However, the use of many channels can introduce a degradation of spectral contrast.Take for instance two speech components (e.g., the frequencies f1 and f2 from Fig. 1.14,or similarly, the first and second formant of a vowel F1 and F2, which both happen tofall in the same compression channel of our multi-channel system. In that case, thetwo components will receive the same amount of gain, thus keeping the intensity dif-ference (contrast) between them in tact. If these same components each fall in separate
21

Chapter 1: General Introduction
Figure 1.15: Example of reduced spectral contrast due to multi-channel compression. Panels displaythe relative level (ordinate) of two formants (F1 and F2). The left panel shows the input signal. Themiddle panel shows the output after single-channel compression. Spectral contrast after single-channelcompression (∆Ls) is equal to the spectral contrast of the original input signal (∆Li). The right panelshows the effect of multi-channel compression in which F1 and F2 each receive a different amount of gainbecause they fall into different channels. The spectral contrast for multi-channel compression (∆Lm) islower than the contrast for single-channel compression (∆Ls).
channels, they most likely will receive a different amount of gain, appropriate for theirrespective channel, and this will reduce spectral contrast. Figure 1.15 illustrates thisprocess.
An alternative way of looking at this is the following. Instead of thinking about theinfluence of multi-channel compression as a reduction in spectral contrast, one may re-alize that multi-channel compression in a hearing aid restores contrast to (near) normal.The hearing aid replaces the effect of the normal (multi-channel) cochlear nonlinearity.In fact, compensation of hearing loss by single-channel compression will lead to an in-crease in spectral contrast relative to normal hearing. This increased spectral contrastmight actually be beneficial for speech intelligibility, and might to some extent alle-viate the reduced frequency selectivity. On the other hand, increasing the number ofchannels might decrease temporal interaction (see Fig. 1.14) and this could compensatethe decrease in spectral contrast. Compensating for reduced cochlear compression bymulti-channel compression in hearing aids therefore leads to a trade-off between thetwo effects. The optimum number of channels for alleviating hearing loss should bedetermined experimentally, see Chapters 2, 3, and 4.
1.7 Compression in hearing aids II. ImplementationsCompressive amplification systems are very versatile, and many different types of sys-tems have been designed. This section gives a short overview of different rationalesunderlying the application of compression in hearing aids. For the general description
22

1.7 Compression in hearing aids II. Implementations
in this section, the mentioned values of time constants are appropriate for the IEC andANSI definitions (see Section 1.6.3).
1.7.1 Compressive limiting
Compression can be used for output limiting to prevent the ear from being stimulatedby too high (peak) sound levels, while minimizing distortion. Compressive limitingis usually characterized by a short attack time ( < 5 ms), high compression thresholds( > 90 dB SPL) and a high compression ratio ( > 5). These characteristics imply linearamplification for most input levels, including normal speech levels.
1.7.2 Automatic gain control
Automatic gain control (AGC, also called automatic volume control, AVC) is a formof compression that is used to keep the long-term average presentation level near thelevel corresponding to maximum intelligibility. This type of compression is typicallyused for people with only a slightly reduced dynamic range. AGC can adjust the over-all level of speech such that it is at the preferred level and not too soft or too loud foroptimal speech understanding. An AGC system reduces the need of a volume wheelsince the gain is automatically changed over a wide range of input levels. AGC ischaracterized by low compression thresholds ( < 50 dB SPL), moderate compressionratios ( < 5) and attack and release times that are comparable to the length of a phraseor sentence (between approximately 150 ms and several seconds). In practice, manyAGC systems use a short attack time to allow the system to quickly react to suddenincreases in input. Some AGC systems obtain the same effect by incorporating an ad-ditional compressive limiter.
1.7.3 Syllabic compression
In contrast to AGC, syllabic compression (SC) is used to alter the short-term intensityrelations among speech elements to improve intelligibility. The objective of syllabiccompression is to compress the dynamic range of the speech signal in order to presentthe speech within the reduced dynamic range of the patient. Figure 1.16 shows thedifferent effect of AGC and SC on a speech signal.
Because syllabic compression is fast, it can fit all relevant speech aspects (syllables, oreven phonemes like consonants and vowels) into the dynamic range of the hearing-impaired listener and it can restore an abnormal loudness growth (recruitment) tonormal. Syllabic compression is characterized by short attack and release times( < 150 ms), a low compression ratio ( < 4) and a low threshold ( < 50 dB SPL). If thetime constants are comparable to the duration of phonemes ( < 25 ms), this type ofcompression is also called phonemic compression.
23

Chapter 1: General Introduction
Figure 1.16: Both slowly-acting and fast-acting compression lift the speech above the elevated threshold.Fast-acting compression additionally reduces the dynamic range of speech itself.
Of the described compression types, syllabic (or phonemic) compression is most simi-lar to the physiological compressive nonlinearity. Both act fast, and have a compressionratio of about 2 to 3. Syllabic compression is therefore a prime candidate for restoringhearing abilities. However, as indicated in section 1.4.2, compression can not restoreimpaired frequency selectivity, and this inability might limit the possible benefit fromsyllabic compression.
The compression used in the experiments of Chapters 2, 3, and 4, can be characterizedas ranging from syllabic compression to automatic volume control. All stimuli werepresented within the dynamic range of hearing of the individual subject and compres-sion limiting was not needed.
1.7.4 Other types of compression
Several other types of compressive amplification have been designed. Such systemsoften incorporate aspects of the types of compression mentioned above, or use differenttechniques. For reference, some examples are given below:
• Some (commercial) hearing aids have an adaptive release time. If the compres-sion threshold is exceeded for a longer period of time (not just momentarily), therelease time will be lengthened. For signals above the compression threshold,these hearing aids act as automatic gain control (Dillon, 1996).
• Hearing aids can also incorporate different compression ratios, depending on thesignal level (curvilinear amplification). An example of this is the “K-amp”, de-veloped by Killion (1993). A K-amp consists of four amplification stages: linearwith high gain for low signal levels, compression for moderate signal levels, lin-ear gain for high signal levels and compression limiting for the highest signal
24

1.8 Scope and overview of this thesis
levels. In addition, the K-amp uses high-frequency emphasis for low signal lev-els.
• Specific systems have been designed to reduce overshoot. In a compression sys-tem an abrupt increase in input level causes a signal overshoot because the sys-tem needs time to adjust the gain. The overshoot is partly caused by a delay ofthe gain signal relative to the audio signal (due to low-pass filtering of the gainsignal). Some compression systems synchronise the gain and audio signals byintroducing a delay to the audio signal, thus reducing signal overshoot.
• Hearing aids can apply compression to specific frequency ranges only. For ex-ample, ’treble increase for low levels’ (TILL) uses more compression at high fre-quencies than at low frequencies, or ’bass increase for low levels’ (BILL) usesmore compression for the low frequencies than for the high (Killion, 1990; Dillon,1996).
• Moore and Glasberg (1988) have developed a dual time constant hearing aid thatincorporates two sets of time constants. A slow-acting control voltage (releasetime = 5 s) keeps the average signal level at the output constant, regardless ofthe input level. A fast-acting control (release time = 150 ms) reduces the gain inresponse to sudden high intensity sounds. When the sudden sound has dimin-ished, the gain will return to the value set by the slowly-acting component.
1.8 Scope and overview of this thesisCochlear compression is extremely important for hearing acuity. Consequently, loss ofcochlear compression often leads to severely impaired speech intelligibility. To com-pensate for this loss, hearing aids can (and should) incorporate compressive amplifica-tion. However, due to the nature of cochlear hearing loss it is not sufficient to replacelost cochlear compression by compressive amplification in a hearing aid. Cochlearcompression is inextricably linked to several perceptual phenomena, and althoughcompression in hearing aids can counteract impaired thresholds and decreased dy-namic range, it can not compensate for reduced frequency resolution. The choice ofhearing aid compression parameters leads to a trade-off between different effects. Cur-rently, the optimal compression characteristics remain unclear. This thesis investigatesthe effect of combinations of compression characteristics on speech intelligibility.
The main research question of this thesis is “What is the influence of number of chan-nels, compression ratio, and time constants on speech intelligibility in noise for lis-teners with a moderate sensorineural hearing loss?”. The focus lies on the effect ofcompression on speech intelligibility and not on speech audibility. In the study wewill simultaneously investigate the effect of the different compression parameters. The
25

Chapter 1: General Introduction
advantage of such a complete parametric design is the possibility to determine inter-action effects between number of channels, compression ratio, and time constants.
Chapter 2 investigates the effect of compression on speech intelligibility in stationarynoise. Due to the temporal aspects of compression, we expect that the effect of com-pression will be different for a fluctuating background. Therefore, Chapter 3 extentsthe research to speech in fluctuating noise. Chapter 4 investigates possible predictorsfor the effect of compression for an individual user. Finally, in Chapter 5 the thesisconcludes with a summary and a discussion on clinical applicability of the results.
26

The effect of compression onspeech intelligibility instationary noise 2
Rolph Houben and Guido F. SmoorenburgManuscript in revision for Audiology & Neurotology

Chapter 2: Compression in stationary noise
2.1 IntroductionCochlear hearing loss results in a reduced dynamic range of hearing (Chapter 1), andthis loss can be alleviated by compression hearing aids. Compression can lead to betterspeech intelligibility when it is used to amplify low-level (inaudible) speech (Souza,2002), or when it is used to attenuate high-level (uncomfortably loud) speech (Dillon,1996). As a result, many modern compression hearing-aids use compression over awide range of input levels.
In quiet, compression only slightly influences speech intelligibility for speech that ispresented at a comfortable listening level (Dillon, 1996), for instance in a one-on-oneconversation in a quiet room. If speech is already audible, compression does not im-prove or degrade speech intelligibility substantially. However, communication in anoisy background is generally much more difficult and in this situation compressionoften leads to worse speech intelligibility than linear amplification. The effect of com-pression characteristics on speech intelligibility is still under debate, especially for thesituation when the speech levels are comfortable and compression is not needed tomake the speech audible.
In this chapter we focus on the effects of compression on speech intelligibility (andnot on speech audibility) in a stationary background noise. Previous studies focusedmainly on one or two parameters per experiment. This study focuses on the combi-nation of four parameters, namely the number of channels, the compression ratio, andthe attack and release time. The study is designed to investigate possible interactioneffects of the parameters with respect to speech intelligibility in stationary noise.
2.1.1 Previous research on amplitude compression
The body of research on compression is quite large, therefore we will first look at sev-eral literature reviews.
Reviews
Rintelmann (1972) presented a chronological review of experiments on compressionfor the hearing impaired. At the time of his review, compression was predominantlyused in amplitude limiting circuits. Only few studies had used compression over awide dynamic range. These studies showed a large variability between subjects; inquiet most of the subjects showed improved speech intelligibility with compressionrelative to linear amplification. Rintelmann stressed that future evaluations should notonly test speech intelligibility in quiet, but also in various types of background noise.
Villchur (1978) focused on both single- and multi-channel compression. He lookedonly at fast systems with an attack time of ≤ 15 ms and a release time of ≤ 40 ms.Unfortunately, he did not make a distinction between speech intelligibility in quiet
28

2.1 Introduction
and in background noise. Villchur concluded that the experiments showed seeminglycontradictory results. Many compression experiments had failed to improve speech in-telligibility relative to linear amplification. He proposed several possible explanationsfor this poor result. Next to improper speech material, improper selection of subjectsor poor post-compression frequency equalization, he argued that multi-channel com-pression might be better than single-channel compression.
Braida et al. (1979) differentiated only between slow (attack time between 10 and200 ms, release time between 200 and 3000 ms) and fast compression systems (attacktime ≤ 25 ms; release time ≤ 50 ms). Although both categories included single- andmulti-channel compression, they did not perform a systematic analysis of the effect ofthe number of channels. Furthermore, they did not evaluate the effect of compressionratio. Most included studies used moderate compression ratios (CR≤ 5,) with the ex-ception of amplitude limiting systems (CR > 5). Finally, they made no clear distinctionbetween results obtained in quiet and in noise. They concluded that there was hardlyany data available regarding slowly-acting compression. With respect to fast-actingcompression Braida et al. reached the same conclusion as Villchur: the experimentalresults seemed to be inconsistent. The reasons for the discrepancies were not thor-oughly understood. At the time of this review, they concluded that no experiment haddemonstrated clear advantages of either slowly-acting or fast-acting compression forhearing-impaired listeners.
Walker and Dillon (1982) compared the results of several studies that used commer-cially available hearing aids. They also evaluated a set of laboratory studies. Theymade a distinction between single-channel and multi-channel compression, and slowand fast compression systems. Throughout the review no systematic differentiationbetween experiments in quiet and in noise was made. The evaluation indicated thatcompression hearing aids failed to show any consistent advantages in terms of speechintelligibility or wearer acceptance above non-compressive hearing aids. The hearingaids that yielded the highest speech discrimination scores were predominantly the fastsystems. Evaluating the laboratory studies they found some minor advantage for fast-acting single-channel compression. With fast-acting multi-channel compression theinter subject variability was large. Some subjects had shown a clear improvement inspeech intelligibility as compared to linear amplification. Overall, they concluded thatthe acquired results provided only minor support for the use of fast-acting compres-sion. They indicated that more work was needed in this area. With respect to slowly-acting compression, Walker and Dillon sided with Braida et al.: not enough data wasavailable to reach a conclusion. Furthermore, they concluded that there had been verylittle attention paid to subjective measures like acceptability and pleasantness.
Preves (1991) found that several authors had shown little, if any, benefit when compar-ing fast-acting compression to linear amplification. He emphasized that fast-actingcompression increases consonant energy and decreases vowel energy. In his view,
29

Chapter 2: Compression in stationary noise
more research was needed to determine whether this enhancement of the consonantto vowel energy ratio results in improved speech perception in both quiet and noise.
Hickson (1994) concluded that there was only minor support for the use of fast-actingsingle channel compression in hearing aids. Results when using slowly-acting single-channel compression in noise were seemingly contradictory. The benefit from multi-channel compression was not clear. Hickson loosely concluded that for multi-channelsystems generally the best results had been obtained with a maximum of three chan-nels. She didn’t advise on preferable compression ratios or time constants. In her view,optimal compression characteristics were still to be determined.
Dillon (1996) categorized experiments according to frequency dependency of compres-sion (compression for all, low, or high frequencies only) and amplitude dependency(compression of all, small, or large amplitudes only). He limited his evaluation tothese two categories and did not differentiate on the basis of the number of frequencychannels, compression ratio, or time constants. All papers included in Dillon’s eval-uation had a maximum of three channels. Compression ratios varied between aboutone and five. Most systems used fast-acting compression. Some systems used slowly-acting compression or compression with adaptive time constants (see section 1.7.4).Omitting amplitude limiting in Dillon’s classification system, six categories remained,which included a total of 12 experiments. Dillon compared the results of the differ-ent systems by converting all data (i.e., percentage points or dBs) into rationalizedarcsine units. For listening in quiet, Dillon found that the difference between the sys-tems was quite small. The various compression schemes did not have much effecton speech identification in quiet if speech in the reference condition was presentedat a comfortable listening level. In quiet, compression is beneficial if the absence ofcompression would result in speech at long-term levels that are lower than optimal.This means that both slowly- and fast-acting compression will improve intelligibilityof low-level speech without degrading it for speech at a higher level. Thus, compres-sion can be important for speech intelligibility if the acoustic environment containswidely varying sound levels. For intelligibility in noise, Dillon again found the differ-ences in intelligibility between the different systems to be small, except for two systemsthat outperformed the others. The first system (Moore and Glasberg, 1986) consisted ofa slowly-acting single-channel compressor (attack/release time = 8/150 ms), followedby fast-acting two channel compression (attack/release time = 3/10 to 3/50 ms). Thesecond system (Moore and Glasberg, 1988) used a slowly-acting single-channel com-pressor (release time = 5000 ms) preceding a fast-acting single-channel compressor (re-lease time = 150 ms). This dual time constant compression system was then followedby a high-frequency syllabic compressor. Moore and Glasberg (1988) attributed thehigh performance to the facts that the slowly-acting single-channel compressor keptthe signal at a comfortable level so that the fast high-frequency compressor had to actover only a small dynamic range, thus minimizing distortion. Moreover, the num-ber of channels was only two. They thought that this prevented the loss of spectral
30
2.1 Introduction
contrast. Dillon wondered why compression in the high-frequency channel could pro-vide much better results than (frequency shaped) linear amplification, especially sincethe compressor was most of the time noise controlled (the signal-to-noise ratio wasaround −7 dB) and the speech-shaped noise would have kept the gain at a rather con-stant level. He concluded that these two systems were promising but that their resultswere not fully understood.
Souza (2002) concluded that wide dynamic range compression could lead to an advan-tage over linear amplification, especially for low-level speech in quiet. In a backgroundnoise, the benefit of compression and linear amplification was similar. However, sheindicated that the benefit of compression might depend on the signal-to-noise ratio andon the noise type. Based on research that was published after Hickson wrote her review(Hickson 1994) Souza stated that compression with a maximum number of channels offour (and not three, as was suggested by the research available to Hickson) might givesimilar speech intelligibility as linear amplification (but not better than linear amplifi-cation). Souza described some studies that showed improved speech intelligibility forcompression systems with many channels. However, she attributed this positive resulton increased audibility and not on the large numbers of channels itself. Souza sug-gested using the lowest possible compression ratio that will maximize audibility for abroad range of input sound levels. For this compression ratio, the increased audibilityof speech might be larger than the detrimental effects of compression. For a quick re-sponse to sudden increases in input level, attack time should be short. For release timethe situation is more complicated since it might interact with compression thresholdand ratio. Souza found no consensus for the best release time. For multi-channel com-pression with many channels, she suggested to use longer release times because thismight prevent a degradation of speech intelligibility caused by temporal and spectralloss of contrast.
In summary, the reviews show that many experimental results were inconclusive orseemingly contradictory. The results seem to imply that a small number of channels(≤ 3 or 4) gives the best results. However, since most systems under investigation hadonly a few channels, the effect of many channels on speech intelligibility is still notclear. Most systems evaluated had compression ratios smaller than 5. Higher com-pression ratios seem detrimental. The reviews differentiated between fast and slowsystems, but none appeared superior to the other. A clear distinction between com-pression in quiet and in noise was made by Hickson (1994) and Dillon (1996). Thisdistinction is needed since in a noisy background it is possible that the noise, and notthe speech, controls the compressor. From the reviews it can be concluded that com-pression in quiet does not have to be detrimental for speech intelligibility, and that itmight even be beneficial. For speech in noise, the effect of compression on speech in-telligibility was mainly detrimental. Dillon (1996) concluded that the effect on speechintelligibility in noise of the systems under investigation did not differ much from eachother.
31
Chapter 2: Compression in stationary noise
Since the effect of compression on speech intelligibility tends to be more detrimentalin noise, speech in noise may be a better research tool than speech in quiet if one isinterested in the effects of compression parameters on speech intelligibility. Moreover,speech in noise is closer to everyday listening conditions. According to a survey ofhearing aid owners on what improvements they would like for their hearing aids, im-provement of speech intelligibility in noise was the most desired one (Kochkin, 2002).
In conclusion, speech in noise can be a useful tool for investigating the effects of com-pression. However, from the reviews quoted above, it is not clear which parametervalues should be used in the current study, including possible interaction effects. Thenext section expands on the reviews and classifies papers according to the numberof frequency channels (NC) and the compression ratio (CR). Secondly, the results arearranged according to the time constants namely, attack and release time in ms (Ta/Tr,defined according to IEC 60118-2 or ANSI S3.22, see section 1.6.3).
Previous research classified parametrically
From the reviews it was concluded that many results with compression were seem-ingly contradictory. This might have been aggravated by the comparison of experi-ments which spanned too broad a range of relevant parameters, such as hearing loss,compression settings, types of noise, etc.
Research included in the evaluation given below concerned experiments with speechsignals in a stationary background noise, unless stated otherwise. Compression thresh-olds were well below the input signal levels, which ensured full dynamic range com-pression. All research was conducted with moderately hearing-impaired subjects. Sub-jects had a dynamic range of hearing larger than 30 dB, i.e., larger than the typicaldynamic range of speech. If the dynamic range was unknown, the inclusion criterionof a pure tone average hearing loss (PTA) smaller than 60 dB at 0.5, 1, and 2 kHz wasapplied. For research with profoundly hearing-impaired subjects we refer to otherstudies such as Boothroyd et al. (1988), Busby et al. (1988), Crain and Yund (1995), DeGennaro et al. (1986), Drullman and Smoorenburg (1997), Moore and Glasberg (1986),Neuman et al. (1994), Verschuure et al. (1993), Verschuure et al. (1998), Villchur (1987),and Yund et al. (1987).
For clarity, the compression parameters are indicated by CP ( NC, CR, Ta/Tr). Linearamplification is indicated by CR = 1. A question mark indicates that the parametervalues were not specified by the authors. In addition, two symbols are used: - and+. The - symbol refers to a range used within a single experiment. If used for com-pression ratios, it indicates that frequency dependent compression ratios within thatrange were used. This can also be subject dependent. If used for time constants the- symbol represents a single experiment in which time constants differ across channels(multi-channel compression) or change over time (adaptive release time). The + sym-bol refers to individual parameter values. If used for several parameters it implies that
32

2.1 Introduction
all combinations were studied. For instance CP ( 1 + 2, 2 + 3, 10/10) gives 4 differ-ent experiments: CP ( 1, 2, 10/10), CP ( 2, 2, 10/10), CP ( 1, 3, 10/10), and CP ( 2, 3,10/10). Whereas CP ( 3, 1-3 + 3-5, 10/50-500) represents only two experiments: CP ( 3,1-3, 10/50-500) and CP ( 3, 3-5, 10/50-500), with frequency dependent compression ra-tios ranging from 1 to 3, and 3 to 5, respectively and release times ranging from 50 to500 ms.
The compression parameters and the results of the studies described below are sum-marized in Table 2.1. Additionally, the table gives the number of subjects that wereincluded in the experiments.
Table 2.1: Results of previous research with moderately hearing-impaired subjects and stationary noise.The reference is linear amplification. Research that has not used linear amplification is indicated by ⊗.Equal or worse scores than the reference are indicated by �, and , respectively. Better scores than thelinear reference did not occur. Research that could not be classified in this table is not numbered butindicated by ? in the list below. The number of subjects included (n) is given to the right of the name ofthe authors.
Single-channel (NC = 1) Multi-channel (NC > 1)CR≤ 3 CR > 3 CR≤ 3 CR > 3
Tr≤ 25 ms 2� 4 2��� 43� 4�4� 9�
25 < Tr≤ 100 ms 1�5⊗7���
Tr≥ 100 ms 5⊗ 66��� 87
1 Dreschler et al. (1984) n = 12 8 Tyler and Kuk (1989) n = 162 Moore et al. (1999) n = 18 9 Barfod (1978) n = 53 Mare et al. (1992) n = 18 ? Yund et al. (1987) n = 204 Van Buuren et al. (1999) n = 26 CR = 1-75 Neuman et al. (1995) n = 20 ? Yund and Buckles (1995; 1995a) n = 166 Neuman et al. (1998) n = 20 CR = 1-7
CP ( 1, 1+1.5+2+3+5+10, 5/200) ? Van Toor and Verschuure (2002) n = 387 Neuman et al. (1998) n = 20 CR = unspecified
CP ( 1, 1.5+2+3, 5/60+5/200+5/1000)
Single-channel compression
CR≤ 3
Dreschler et al. (1984) CP ( 1, 1 + 3, 8/50) did not find a significant difference in speechintelligibility between linear amplification and fast-acting single-channel compression.
33

Chapter 2: Compression in stationary noise
Mare et al. (1992) CP ( 1, 1 + 2, 10/20) used compression with a delay to reduce over-shoot (see section 1.7.4). Compression threshold was chosen at the rms of speech. Bothspeech reception threshold and nonsense CVC scores were slightly worse for compres-sion than for (non frequency-shaped) linear amplification. However, it is not known ifthese differences were significant.
Van Buuren et al. (1999) CP ( 1 + 4 + 16, 1 + 2 + 4, 0/0) obtained speech receptionthresholds for instantaneous compression. For single-channel compression and a com-pression ratio of 2, the speech reception threshold did not differ significantly fromresults obtained with linear amplification.
Moore et al. (1999) CP ( 1 + 2 + 4 + 8, 1 + 1-2.9, 7/7) used compression with a de-lay to reduce overshoot. Compression ratio was subject and channel dependent. Thebackground noise had spectral gaps. No significant differences in speech receptionthresholds were found between linear amplification and single-channel compression.
Neuman et al. (1995) CP ( 1, 1.5 + 2 + 3, 5/60 + 5/200 + 5/1000) used paired-comparison judgements to investigate the effect of release time on sound quality. Theydid not find a significant preference for release time with respect to speech in noise.However, this might be due to (ventilation) noise that was presented 14 dB belowcompression threshold. Moreover, the signal-to-noise ratio was very high, +35 dB.Their experimental design did not allow an analysis with compression ratio as maineffect.
Neuman et al. (1998) described two experiments. For both experiments they usedthe same subjects and noise as Neuman et al. (1995). In the first experiment CP ( 1,1 + 1.5 + 2 + 3 + 5 + 10, 5/200) they varied compression ratio with only one Ta/Tr-setting. Quality ratings with all types of noise were lower with CR = 3 than withCR = 1, 1.5, and 2. The subjective rating of the amount of background noise in-creased with increasing compression ratio for CR > 1. In their second experimentCP ( 1, 1.5 + 2 + 3, 5/60 + 5/200 + 5/1000), Neuman et al. conducted a parametricstudy of the effect of CR and Tr on sound quality with the same subjects. In this study,the highest compression ratios (CR = 5, and 10) of the previous study were omitted infavour of two extra time constants (Ta/Tr = 5/60, and 5/1000 ms). The results con-firmed previous results that higher compression ratios lead to lower subjective qualityratings (clarity, pleasantness, and perceived amount of background noise). Across allnoise types they found a significant effect of CR * Tr. For CR = 3, a larger release timeresulted in better scores of clarity, of pleasantness, and of overall quality. For CR = 2,the influence of release time was less (except for the perceived amount of backgroundnoise). For all compression ratios, Tr = 1000 ms was better than Tr = 60, and 200 ms,but results were still worse than the linear scores obtained in the previous experiment.
34

2.1 Introduction
CR > 3
Tyler and Kuk (1989) CP ( 1, 5, 6/50-6/550) used compression with an adaptive releasetime (see section 1.7.4). Release time depended on the duration of the input signal. Forshort input sounds the release time was short (50 ms). For long input sounds the re-lease time was long (550 ms). With compression nearly all subjects showed a decreasein nonsense syllable recognition in low-frequency noise, relative to linear amplifica-tion.
The experiment by Van Buuren et al. (1999) CP ( 1 + 4 + 16, 1 + 2 + 4, 0/0) quotedabove for single-channel compression with CR = 2 (with results similar to those forlinear amplification) showed, for CR = 4, significantly worse results than linear ampli-fication.
In the experiments of Neuman et al. (1998) CP ( 1, 1 + 1.5 + 2 + 3 + 5 + 10, 5/200)with fixed time constants (Ta/Tr = 5/200), quoted above, compression ratios higherthan 3 resulted in lower quality scores.
In summary, when applying single-channel compression in stationary noise for sub-jects with moderate sensorineural hearing impairment, speech intelligibility was atbest equal to that obtained with linear amplification. No improvement relative to lin-ear amplification has been found. However, all experiments used fast-acting compres-sion. The effect of slowly-acting single-channel compression on speech intelligibility isstill not clear.
Sound quality experiments showed that a compression ratio higher than 2 degradedquality. Long release times (Tr up to at least 1000 ms) decreased the negative effect ofcompression on sound quality, but they did not restore it to the level achieved withlinear amplification.
Multi-channel compression
CR≤ 3
Barfod (1978) CP ( 2 + 3 + 4, 1 + 1-3, 6-24/6-24) used fast-acting two-, three- and four-channel compression at several positive signal-to-noise ratios (0, +5, +10, +15, and+20 dB). Compression ratios were subject and frequency dependent. The lowest chan-nel always had linear amplification. Four-channel compression showed no significantdifference in speech intelligibility relative to linear amplification, but three- and two-channel compression degraded performance. The four-channel scores were signifi-cantly better than those for two or three channels.
The experiment of Moore et al. (1999) CP ( 1 + 2 + 4 + 8, 1 + 1-2.9, 7/7), quoted abovefor single-channel compression, also included multi-channel compression (NC =
1 + 2 + 4 + 8). Again, all compression conditions resulted in speech reception thresh-
35

Chapter 2: Compression in stationary noise
olds worse than achieved with linear amplification, although none differed signifi-cantly.
Van Buuren et al. (1999) CP ( 1 + 4 + 16, 1 + 2 + 4, 0/0), quoted above, found the sameresults with multi-channel compression (NC = 4 + 16) with CR = 2, as with single-channel compression. Speech reception thresholds were worse than those achievedwith linear amplification, but the differences were not significant.
CR > 3
Van Buuren et al. (1999) CP ( 1 + 4 + 16, 1 + 2 + 4, 0/0) also used CR = 4. As withsingle-channel compression, quoted above, speech intelligibility with multi-channelcompression (NC = 4, 16) was significantly lower than that achieved with linear ampli-fication. It is noteworthy that for CR = 4 the scores decreased with increasing numberof channels. This was not found for CR = 2.
Yund et al. (1987) CP ( 8, 1 + 1-7, 4/4) used fast eight-channel compression as de-scribed by Robinson and Huntington (1973). In this type of system, the average powerof the input signal is measured continuously and is used to determine the gain forthe signal at the center of each interval. For the system of Yund et al., the resultingattack and release times were both approximately 4 ms in terms of the IEC definition(see section 1.6.3). Compression ratio, varying between one and seven, was subjectand channel dependent. Yund et al. measured nonsense syllable recognition with sev-eral signal-to-noise ratios, ranging from −5 to +15 dB. Compression resulted in highernonsense syllable recognition than linear amplification for all signal-to-noise ratios.
Yund and Buckles (1995) CP ( 4 + 8 + 12 + 16, 1-7, 4/4) extended the previous experi-ment of Yund et al. (1987) to include four-, twelve- and sixteen-channel compression.Again several signal-to-noise ratios (from -5 to +15 dB) were used. The average non-sense syllable score was lower for four channels than for eight channels. The scores foreight, twelve, and sixteen channels were roughly equal. This is a remarkable finding,since most experiments showed deterioration in speech intelligibility with increasingnumber of channels. No interaction between signal-to-noise ratio and the number ofchannels was found.
Yund and Buckles (1995a) CP ( 8, 1 + 1-7, 4/4) compared the eight-channel results fromYund and Buckles (1995) to results obtained with linear amplification. Using all signal-to-noise ratios, a quarter of the subjects showed worse speech intelligibility with com-pression, whereas half of the subjects had better speech intelligibility compared to lin-ear amplification.
Van Toor and Verschuure (2002) CP ( 4, ?, 2/16-64 + 2-16/64-512 + 32-64/1024-2048)compared three wearable four-channel compression systems. They used a fast, an in-termediate, and a slow system. Time constants changed over channels, the high fre-quency channels being the fastest. All systems used a short signal delay to reduce over-
36

2.1 Introduction
shoot. Compression was curvilinear, i.e., the compression ratio depended on the inputlevel. The systems were fitted according to the DSL [i/o] algorithm (Cornelisse et al.,1995) with both a flat response, and a fitting with high-frequency emphasis. They usedthree types of noise, stationary speech-shaped noise, fluctuating noise (speech-shapedas well), and low-frequency car noise. No significant effect of time constants on speechreception threshold was found in both the stationary speech-shaped noise and in thelow-frequency car noise. Only for fluctuating noise did time constants have a signifi-cant effect, see Chapter 3. With the flat frequency-response the slow system gave signif-icantly less improvement than the intermediate or fast system. Across all three noisetypes (stationary, fluctuating, and low-frequency noise) and all time constants, com-pression with high-frequency emphasis gave significantly better results than compres-sion with a flat frequency-response. A subjective performance test (APHAB) yieldedno consistent preferences for any set of time constants.
In summary, for multi-channel compression some experiments showed better speechintelligibility with compression than with linear amplification. However, generally theresults with multi-channel compression were worse than those obtained with linearamplification. The effect of an increasing number of channels was not clear.
Interaction between compression parameters
Only few studies have investigated interaction effects of number of channels, compres-sion ratio, and time constants.
Neuman et al. (1998) CP ( 1, 1.5 + 2 + 3, 5/60 + 5/200 + 5/1000) quoted before, havereported a significant interaction of compression ratio and release time (CR * Tr) basedon subjective quality assessments. The positive effect of longer release times (increas-ing from 60, to 200, to 1000 ms) was larger with increasing compression ratio (goingfrom 1.5, to 2, to 3).
Van Buuren et al. (1999) CP ( 1 + 4 + 16, 1 + 2 + 4, 0/0) did not report significant in-teractions. However, for CR = 4 their data consistently showed a decrease in speechintelligibility and quality (only tested in quiet) with increasing number of channels(NC * CR).
Plomp (1994) CP ( 1 + 2 + 4 + 8 + 16, 1 + 2 + 4 + ∞, 0/20) reported data of VanDijkhuizen (J.N. van Dijkhuizen, unpublished data, 1993) in which a larger numberof channels had a detrimental effect on speech intelligibility in noise for twelve mod-erately hearing-impaired subjects (Plomp did not specify the subjects’ hearing loss orthe type of background noise). This detrimental effect for larger number of channels,became more profound for higher compression ratios (CR = 2, 4, or ∞).
Festen and Van Dijkhuizen (1999) CP ( 1 + 2 + 4 + 8 + 16, 1 + 2 + 4 + ∞, 0/20) inves-tigated the effect of amplitude compression on speech intelligibility in quiet. Theyused a parametric design in which they changed compression ratio and the number of
37

Chapter 2: Compression in stationary noise
channels. Their sixteen subjects had an average hearing loss of 55 dB and a dynamicrange of about 45 dB. The results showed a gradual decline of sentence intelligibilitywith increasing compression ratio and with an increasing number of channels. Thedecline in intelligibility for higher compression ratios was larger for a larger numberof compression channels.
2.1.2 Conclusions from previous research
Our evaluation of previous studies on compression only included research with mod-erately hearing-impaired subjects and stationary noise. For these criteria, compres-sion with a low compression ratio (≤ 3) did not significantly degrade speech intelli-gibility relative to linear amplification. For higher compression ratios, some studiesshowed a slight (mostly insignificant) improvement in speech intelligibility, whereassome studies showed a reduction. For a small number of channels (≤ 3) the effect ofcompression was limited, whereas experiments with a larger number of channels gaveseemingly conflicting results. Scarcely any studies on the influence of time constantswere available. The effect of time constants on speech intelligibility for moderatelyhearing-impaired listeners and stationary noise is therefore largely unknown. System-atic investigations into the effect of different parameter values on speech intelligibilityin noise are scarce. Van Buuren et al. (1999) and Plomp (1994) investigated the effect ofcompression ratio and number of channels, but they did not change the time constantsin their experiments.
2.1.3 The present research
In view of the inconclusive results from the literature quoted above we conducted afull parametric investigation with respect to the combination of number of channels,compression ratio and time constants. This allows for the analysis of possible interac-tion effects. The choice of appropriate values of the compression parameters is basedon previous research, and is given in Table 2.2. First, since multi-channel compres-sion with many channels gave seemingly contradictory results we included NC = 1,2, and 6. Second, the literature showed that the compression ratio should be small.The best results were obtained with a CR around 2. Since many hearing losses are fre-quency dependent, we included channel dependent compression ratios. This yieldedfive compression ratio settings ranging from CR = 1 to 3, see Table 2.2. Third, it is gen-erally accepted to use a short attack time to prevent hearing damage and discomfort,and the effect of this choice on speech intelligibility should be verified. Thus, we usedtwo different attack times, 4 and 40 ms. Most research quoted has been performed withshort release times. The effect of long release times on speech intelligibility in station-ary noise is still not clear. Therefore, we used three different release times, 4, 40, and400 ms. The experimental design will be explained in more detail in section 2.2.4.
38

2.2 Methods
Table 2.2: Processing characteristics of the full parametric investigation. In brackets the total numberof conditions with that specific value is given. For example, for two-channel compression 20 differentconditions were measured (4 different compression ratios, each with 5 time constants). The compressionratios (CR = 1, 2, or 3) were divided in two separate ratios for low and high frequencies. The cross-overfrequency was 1 kHz.
NC CRlow/CRhigh Ta/Tr (in ms)linear (1) linear (1) linear (1)1 (10) 1/2 (10) 4/4 (10)2 (20) 2/2 (15) 4/40 (10)6 (20) 2/3 (10) 40/40 (10)
3/3 (15) 4/400 (10)40/400 (10)
2.2 Methods
2.2.1 Subjects
Twenty adult subjects with moderate sensorineural hearing impairment participatedin this study. All included subjects completed the entire experiment; none of themquit early. The inclusion criterion for our subjects was a sensorineural hearing loss ofapproximately 40–60 dB HL at 4 kHz. All subjects were native Dutch speakers. Rele-vant subject data are given in Table 2.3. The average pure-tone hearing loss at 0.5, 1,and 2 kHz (PTA0.5/1/2 kHz) was 45 dB (ranging from 35 to 65 dB). The dynamic rangeaveraged over the same frequencies (DR0.5/1/2 kHz) ranged from 43 to 83 dB. All butone subject had used compression hearing aids prior to the experiment. The averageage of the participants was 65 (± 10) year. The first session started with audiometricmeasurements. Pure-tone thresholds and uncomfortable loudness levels were mea-sured for each subject in an unaided condition. Subjects had a sloping, a flat, or ahelmet-shaped hearing loss. The ear used was the one that satisfied the inclusion cri-teria. If both ears were suitable, the ear with the smallest hearing loss was used. Formost subjects the hearing loss was only slightly asymmetric between the two ears. ThePTA0.5/1/2 kHz of the included ear was maximally 12 dB worse than the non-includedear. Subjects participated on a voluntarily basis. After completion of all sessions, theyreceived a reimbursement of travelling expenses and a small financial compensationof e 45.
This research was approved by the Medical Ethical Committee of University HospitalUtrecht, protocol number METC 01/165, dated 21 December 2001.
2.2.2 Signal Processing
Signal processing was carried out off-line using a personal computer with MATLABRelease 12 (The Mathworks, 2001). The noise masker and the speech signal were
39

Chapter 2: Compression in stationary noise
Table 2.3: Relevant data of the 20 subjects. For each subject, the hearing thresholds are given on the firstrow and their uncomfortably levels on the second. When the maximum output level of the equipmentwas not sufficient the values are preceded by a > symbol. The ear measured was the one that satisfiedthe inclusion criteria. If both ears were suitable, the ear with the smallest hearing loss was used.
Subject Sex Age Etiology Threshold or UCL (dB HL)(yr) 125 250 500 1 2 4 8
Hz Hz Hz kHz kHz kHz kHzs1 F 72 Unknown 65 65 55 55 65 60 85
>90 >110 110 105 105 95 90s2 F 80 Age 30 25 30 35 45 65 80
>90 >110 120 120 >120 >120 >110s3 F 41 Unknown 25 20 25 35 55 65 85
>90 110 115 120 120 >120 >110s4 M 64 Shotgun noise 20 25 25 45 50 60 80
>90 >110 105 100 105 105 >110s5 F 53 Hereditary 25 20 20 45 55 75 80
>90 95 85 95 95 95 85s6 F 73 Unknown/Age 20 15 25 35 45 55 75
>90 110 115 120 >120 >120 >110s7 M 69 Noise 25 25 30 35 45 55 90
>90 >110 120 110 120 >120 >110s8 F 66 Unknown 25 30 35 55 50 55 55
>90 >110 120 120 115 115 >110s9 M 63 Hereditary 20 20 25 50 45 60 65
>90 >110 110 110 115 >120 >110s10 F 62 Hereditary 50 55 50 40 50 50 50
90 100 105 105 110 >120 >110s11 M 71 Noise 20 20 30 50 70 70 85
90 95 100 110 115 >120 >110s12 F 69 Unknown/Age 35 35 35 35 45 30 65
>90 110 110 105 105 >120 >110s13 M 83 Age 45 40 40 55 55 60 85
>90 >110 110 110 110 120 >110s14 F 57 Unknown 65 65 70 65 60 65 95
80 90 100 115 110 105 105s15 F 67 Hereditary 45 50 50 55 60 70 75
>90 100 100 100 95 90 90s16 F 61 Unknown 20 15 25 45 60 45 45
85 90 95 110 >120 115 110s17 F 62 Hereditary 53 40 40 40 50 65 65
>90 >110 110 110 115 120 >110s18 F 49 Unknown 40 40 50 50 60 50 65
>90 105 100 95 100 85 90s19 M 66 Noise 45 30 25 30 50 75 70
>90 105 110 115 115 >120 >110s20 M 76 Noise 30 35 45 50 65 65 80
>90 110 110 110 110 120 >110
40

2.2 Methods
summed before processing. For all conditions, including the linear condition, thespeech-plus-noise signal passed through six elliptical band filters (see Table 2.4). Theband filters were applied twice; after the first filtering the filters were applied againto the time reversed signals to remove any phase distortion introduced by the first fil-tering stage (Smith, 1997). Depending on the experimental condition, the signal wascompressed independently in one, two, or six channels. With six-channel compression,each channel corresponded to one frequency band. With two channels, prior to com-pression, the low-frequency channel received a summation of the outputs of bands 1, 2,and 3, and the high-frequency channel received a summation of bands 4, 5 and 6. Forsingle-channel compression the outputs of all bands were summed into one channelbefore compression.
Table 2.4: Characteristics of band filtering.
Band Low cut-off High cut-off Filter orderfrequency (kHz) frequency (kHz)
1 - 0.25 52 0.25 0.5 43 0.5 1 34 1 2 35 2 4 36 4 22 7
After filtering and summation of the outputs of the bands, the amplitude envelope ineach channel was calculated for an entire stimulus (full sentence) by means of a Hilberttransform (Oppenheim and Schafer, 1989). These envelopes were then logarithmicallycompressed (Braida et al., 1979). A gain signal was constructed for the signal in eachchannel by calculating the ratio of the instantaneously compressed envelope and theoriginal envelope. In order to introduce attack and release times, each gain signalpassed through two first-order low-pass filters. One filter acted only on rising signals(attack time filter), and resulted in a logarithmic decay. The other filter acted onlyon falling signals (release time filter), and resulted in a gain that rose logarithmically.It should be noted that our definition of time constant differs from the current andprevious IEC and ANSI standards for non-linear hearing aids (see Section 1.6.3). Aftersubjecting the gain signals to the attack and release filters, the signals in the channelswere multiplied sample by sample by their respective gain signal. In each channel thecompressed signals were then amplified to the long-term rms values of the originalinput signals in that channel. Finally, the outputs of all channels were summed.
The digital stimuli were converted to the analogue domain using a ‘Creative Sound-Blaster Live Platinum 5.1’ 16-bit sound card with a separate front-panel connectionbox. The analogue signal was adjusted to the individual audiograms using a Boss GE-131 one-third octave band graphic equalizer. The maximal individual adjustment ofeach of the one-third octave bands was 30 dB. The frequency response of the equalizer
41
Chapter 2: Compression in stationary noise
was measured after each change in setting and was adjusted until the desired responsewas obtained. During the presentation of all stimuli the frequency response remainedfixed for each subject. This was possible because the compressor output was amplifiedto the original (uncompressed) rms for each channel. Frequency shaping was appliedaccording to the half gain rule (Dillon, 2001). After frequency shaping the signal couldbe attenuated with Shallco attenuators type 2511 and 2513 by 1 and 10 dB/step, re-spectively. The signal was then amplified by a Sony TA-F470 amplifier, and presentedmonaurally through Sennheiser HDA200 circumaural headphones. The overall gainwas such that the stimuli were presented around the most comfortable loudness levelof each subject. Thus only the frequency response of the half gain rule (and not the pre-scribed overall level) was used for the final fitting. On request we slightly decreasedthe high frequency gain for one subject (s15).
2.2.3 Speech Material and Procedure
Speech materials consisted of Dutch sentence material for measurement of the SpeechReception Threshold (SRT) in noise, developed by Versfeld et al. (2000). This materialconsisted of two sets (a male and a female speaker) of 39 lists of 13 sentences each. Thetotal number of sentences was 1014. The long-term average speech spectrum (LTASS)of each speaker was used as background noise. Speech was embedded in this back-ground noise. The noise extended from 2 seconds before speech (onset), to 1 secondafter speech (offset). The onset was used to allow any initial gain adjustments of thecompressor to even out before speech was presented and to attract subjects’ attentionto the stimulus. The offset prevented an abrupt ending after the speech had finished,thus giving the compressor time to fully change the gain in accordance with its timeconstants. The dynamic range of the original speech material was 26± 6 dB (the stan-dard deviation was calculated from the dynamic range of all the separate sentences);the dynamic range of the background noise was approximately 4 dB (both wide bandmeasurements between the 1st and 99th percentile, applying an integration time con-stant of 125 ms). Within each list, sentence order was randomized. This was done tominimize possible recognition effects for a repeated list. For each subject a particularlist was used only once or twice. The set of sentences per list was fixed because thelists were balanced with respect to intelligibility.
Speech intelligibility was measured by the Speech Reception Threshold (SRT) test innoise. The SRT in noise is defined as the signal-to-noise ratio at which a subject canreproduce 50% of the sentences entirely correctly. The SRT was measured with theadaptive procedure developed by Plomp and Mimpen (1979). The noise was kept ata fixed average level; the signal-to-noise ratio was varied by changing the level of thespeech signal. For each experimental condition, one list (consisting of 13 sentences)was presented to the subject. The first sentence was presented at a low signal-to-noiseratio. This sentence was repeated until the subject had reproduced it correctly. Each
42

2.2 Methods
repetition was presented at a 4 dB higher signal-to-noise ratio. The subsequent sen-tences (2–13) were not repeated. After a correct response, the signal-to-noise ratio ofthe next sentence was decreased by 2 dB; after an incorrect response it was increasedby 2 dB. After the last sentence, the SRT was estimated by averaging the last ten signal-to-noise ratios. The first three values were discarded from this calculation.
The experiments were conducted in a soundproof room. The subjects removed (both)their hearing aids prior to the experiment. Since the headphones provided high passiveattenuation of external noise (approximately 29 dB at 1 kHz), masking at the contralateral ear was not used. Subjects received written and oral instructions in which theywere told to repeat the sentences, or part of the sentences if they did not understandthem completely. It was made clear that subjects should try to give every sentenceapproximately the same amount of attention during the whole session, i.e., to listen toall sentences in a comfortable, not too tiring manner. Since the experiment consisted ofmany experimental conditions, the task was divided over several sessions on differentdays. Every session started with a practice session to familiarize subjects with theexperimental procedure. A session lasted from 2.5 to 4 hours, including breaks. Thetotal number of sessions (including those with fluctuating noise) varied from 3 to 6 persubject, depending on availability of the subjects and their fitness.
2.2.4 Design
The compression threshold level remained fixed for the entire experiment at −30 dBre speech rms. Only signals above the compression threshold were compressed. Sincethe dynamic range of the speech material was approximately 26 dB (see section 2.2.3)this choice of threshold level brought the entire range of relevant speech levels withinthe compression range, ensuring full dynamic range compression.
In total, 50 compressive processing conditions were used. The full parametric studyconsisted of three numbers of channels, four compression ratios, and five time con-stants (see Table 2.2). The numbers of channels were 1, 2, and 6 channels. The com-pression ratios (CR = 1, 2, or 3) were divided in two separate ratios for low and highfrequencies. The cross-over frequency was 1 kHz. Note that although the compressionratio in some channels might be equal, all channels were independently compressed.The time constants consisted of combinations of attack (4 to 40 ms) and release times (4to 400 ms). In order to limit the number of conditions, and following common hearingaid design, release times were chosen to be greater than or equal to attack times. Withsingle-channel compression it is, of course, not possible to use different compressionratios for low and high frequencies. Therefore single-channel compression includedonly two compression ratios (CR = 2, and 3), resulting in 10 single-channel compres-sion conditions in total.
In order to estimate test-retest variance, measurements were made in duplicate. Dueto time constraints the duplicate measurements were made for only 13 predetermined
43

Chapter 2: Compression in stationary noise
conditions. These duplicate conditions were evenly distributed over the experiment(2nd, 5th, 7th, 10th measurement, etc.).
At the time of measurement, all conditions were presented with two types of back-ground noise: speech-shaped stationary noise (the results of which are presented here)and fluctuating noise (Chapter 3). Ten subjects selected at random performed the ex-periment with stationary noise first and with fluctuating noise second; the other tensubjects vice versa. The speech materials included speech of both a male and a femalespeaker. The frequency spectrum of the speech-shaped noise was changed accordingly.For each type of noise (stationary or fluctuating) each subject was presented with ma-terials from one speaker only.
2.3 ResultsUsing the duplicate measurements (see section 2.2.4) of all subjects, a t-test for depen-dent samples (paired by condition) showed a significant improvement of the retestscore relative to the test score (improvement was 0.5 dB; t = 3.7; p < 0.001). No signif-icant interaction between this learning effect and subject was found (F = 0.7; p = 0.8)and the learning effect did not depend on compression condition (F = 0.5; p = 0.9). Asstated above, the duplicate measurements were distributed over the entire experiment.Some test-retest pairs were measured during the same session, whereas others spanned2 or 3 sessions. Test-retest measurements which took place in the same session did notdiffer significantly from test-retest pairs in two different sessions (F = 0.2; p = 0.7). Re-gression analysis over all subjects showed that the learning effect depended on onlythe number of previous measurements (r2 = 0.02; p < 0.05), not on session. Figure 2.1gives the difference between the retest and the test score for all subjects as a function ofpresentation number, irrespective of session. Although the learning effect was small,it was significant and therefore a correction was applied. This correction dependedon the number of previous encountered sentences and was +0.019 dB per presentationnumber. The maximum correction at the end of the experiment was +1.3 dB.
After correction for the learning effect, the average variance of the duplicate pairs was2.3 dB2. It was independent of compression condition (F = 0.6; p = 0.9). Before fur-ther analysis, all results for the duplicate pairs were averaged and the average valueswere included in the analyses as one data point. Subsequent analyses of variance didtherefore not include the duplicate variance in error estimation.
As described in Design (section 2.2.4), for stationary noise half of the subjects usedonly material uttered by a male speaker and half used material uttered by a female. Ananalysis of variance with noise type (stationary, fluctuating) and speaker (male, female)as independent factors showed no significant difference in speech reception thresholdsbetween the male and the female lists (F = 0.9; p = 0.3; SRTfemale−SRTmale =−1.0 dB).The interaction between noise type and speaker was also insignificant (F = 0.2; p = 0.7).
44

2.3 Results
0 10 20 30 40 50 60 70Number of encountered sentences between test and retest
measurement
0 10 20 30 40 50 60 70Number of encountered sentences between test and retest
measurement
-8
-6
-4
-2
0
2
4
6
8
SR
T ret
est-
SR
T tes
t(dB
)
Figure 2.1: SRT of the retest measurement (SRTretest) minus SRT for the test measurement (SRTtest) forall subjects. The test and the corresponding retest conditions were distributed at random over the entireexperiment. The ordinate gives the difference in speech reception threshold of the retest and the testmeasurements, irrespective of session. A negative value represents a better retest. The abscissa repre-sents the difference in number of previously encountered sentences between the two measurements.
Since the effect of speaker was not significant, this factor is omitted in further analyses.Possible interactions between compression parameters and male/female material wereassumed to be negligible and were therefore not tested.
Across all subjects, the average speech reception threshold for linear amplification instationary noise was 0 dB, which is 4 dB worse than the average scores of normal-hearing subjects using the same speech material (Versfeld et al., 2000; Lyzenga et al.,2002). Figure 2.2 gives the SRT as a function of the subjects’ pure tone average hear-ing loss at 0.5, 1, and 2 kHz. The figure suggests that SRT deteriorates with increasinghearing loss. However, linear regression analysis restricted to our present data yieldedno significant correlation and explained only a small amount of variance (r2 = 0.11;p = 0.15). Comparing the speech reception thresholds with PTAs for other frequenciesyielded correlation coefficients explaining even less variance (r2≤ 0.003 for PTA1, 2, 4 kHz,PTA2, 4 kHz, and PTA2, 4, 8 kHz). Apparently, speech perception of our subjects in station-ary noise after linear amplification could not be predicted accurately by pure tonehearing loss measured in silence. Since this speech material was developed recently(Versfeld et al., 2000), only few results pertaining to this material have been reported.Included in Fig. 2.2 are data for both normal hearing subjects (Versfeld et al. 2000;Lyzenga et al., 2002) and for sensorineurally hearing impaired subjects (Lyzenga et al.,2002). Our data relate well to the added data, see Fig. 2.2.
45

Chapter 2: Compression in stationary noise
-10 0 10 20 30 40 50 60 70PTA 0.5, 1, 2 kHz (dB HL)
-6
-4
-2
0
2
4
6
8
SR
T sta
t, lin
ear
(dB
)
LinearHINH
Figure 2.2: SRTs obtained with linear amplification (SRTstat, linear) as a function of the subjects pure-toneaverage hearing loss at 0.5, 1, and 2 kHz (PTA0.5, 1, 2 kHz). Regression analysis of our data (filled circles,solid line) yielded no significant correlation (r2 = 0.11, p = 0.15). The diamond represents additional datafor hearing-impaired (HI) subjects from Lyzenga et al. (2002). The Triangle represents data for normalhearing subjects (NH) from both, Versfeld et al. (2000) and Lyzenga et al. (2002). These additional datacoincide with the insignificant regression line of our data.
2.3.1 Concurrent analysis of single-, two-, and six-channel compres-sion
The measured SRT for linear amplification ranged between−2.9 dB and +6.1 dB (aver-age SRT = 0.2± 2.5 dB). The SRT for compression conditions will be presented relativeto these linear scores. For this purpose, ∆SRT is defined as the SRT for a particularcondition minus the SRT for the linear condition for that subject. Negative values of∆SRT indicate a better speech reception threshold for compression than for linear am-plification.
A univariate1 repeated measures analysis of variance was performed on ∆SRT. Num-ber of channels (3 levels), compression ratio (2 levels) and time constants (5 levels) wereall treated as independent within subject factors. Single-channel compression does notallow for frequency dependent compression ratios (section 2.2.4), therefore CR = 1/2and CR = 2/3 were not included in this analysis. The results are given in Table 2.5.Figure 2.3 shows ∆SRT as a function of time constants. The panels represent numberof channels and the two curves represent compression ratios.
1Mauchley’s test of sphericity did not yield any significant results. Univariate analysis was thusappropriate.
46

2.3 Results
Table 2.5: Results of a repeated measures analysis of variance. Single-channel compression was includedand therefore split-frequency compression ratios were omitted. (NC = 1, 2, 6; CR = 2/2, 3/3; Ta/Tr =4/4, 4/40, 40/40, 4/400, 40/400).
Effect Degrees MS F p-valueof freedom
NC 2 11.1 7.0 < 0.005CR 1 73.5 24.6 < 0.0001T 4 21.2 10.0 < 0.00001NC * CR 2 4.8 2.6 0.08NC * T 8 7.9 3.9 < 0.0005CR * T 4 2.9 1.3 0.3NC * CR * T 8 4.7 2.4 < 0.05
PTA 0.5, 1, 2 kHz (dB HL)
SR
T sta
t, lin
ear
(dB
)
-1.0
-0.5
0.0
0.5
1.0
1.5
2.0
2.5
3.0
3.5
4.0
4.5
∆SR
T (d
B)
CR = 2/2CR = 3/3
∆SR
T (d
B)
Ta/T
r: 4/4
4/40
40/4
0
4/40
0
40/4
000
Ta/T
r: 4/4
4/40
40/4
0
4/40
0
40/4
000
Ta/T
r: 4/4
4/40
40/4
0
4/40
0
40/4
000
Ta/T
r: 4/4
4/40
40/4
0
4/40
0
40/4
000
Figure 2.3: ∆SRT averaged over all subjects. ∆SRT is the SRT for compression minus the subjects’ SRTfor linear amplification. Lower values of ∆SRT represent better speech intelligibility with compression.∆SRT is plotted as a function of time constants (Ta/Tr), and the ordering of Ta/Tr is primarily based onrelease time. Each curve represents a compression ratio setting. The panels represent different numberof channels. Split-frequency compression ratios are not included. Vertical bars denote 0.95 confidenceintervals.
47

Chapter 2: Compression in stationary noise
All main effects (NC, CR, and Ta/Tr) were highly significant (F≥ 7.0; p < 0.005). First,the effect of number of channels showed that the average results improved when goingfrom single-, to two-channel, to six-channel compression. However, post-hoc analysis(Tukey’s Honestly Significantly Difference test, HSD) gave only one significant con-trast: six-channel compression resulted in better speech intelligibility (lower ∆SRT)than single-channel compression (∆SRTNC = 6 −∆SRTNC = 1 =−0.5 dB, p < 0.05).Second, a compression ratio of 2/2 yielded consistently lower ∆SRTs than CR = 3/3.Post-hoc comparison confirmed this finding (∆SRTCR = 2/2 −∆SRTCR = 3/3 =−0.7 dB,p < 0.001). Both compression ratios resulted in significantly higher SRTs than thoseobtained with linear amplification (∆SRTCR = 2/2 = +0.6 dB, p < 0.001; ∆SRTCR = 3/3 =
+1.3 dB, p < 0.00001).Third, larger time constants gave better results than smaller constants. This findingwas confirmed by post-hoc comparisons which showed that Ta/Tr = 40/40 gave bet-ter results than Ta/Tr = 4/4 (p < 0.05), and that Ta/Tr = 40/400 was better than 4/4(p < 0.001), 4/40 (p < 0.001), and 4/400 (p < 0.05). The improvement for Ta/Tr = 4/400over 4/40 and 4/4 was insignificant.
Besides the main effects, the effect of the interaction NC * T was also significant (p <
0.0005, see Table 2.5). This interaction is apparent in Figure 2.4, which shows ∆SRT asa function of time constants for each number of channels. For NC = 1, the smallest timeconstants (Ta/Tr = 4/4) resulted in the highest ∆SRTs. Whereas for NC = 2, or NC = 6,the results for Ta/Tr = 4/4 were not worse than for larger time constants.
Finally, the effect of the highest interaction term (NC * CR * T) was also significant. Re-sults with single-channel compression were best for the largest time constants. Al-though this effect was present for both compression ratios, the improvement was largerfor CR = 3/3 than for CR = 2/2 (Fig. 2.3). With two-channel compression the effectof time constants was different for CR = 2/2 and CR = 3/3. With CR = 2/2 speechintelligibility did not change for larger time constants, it was rather constant. Incontrast, for CR = 3/3, speech intelligibility was lowest with Ta/Tr = 4/400, and bestwith Ta/Tr = 40/400 (∆SRTTa/Tr = 40/400−∆SRTTa/Tr = 4/400 =−1.9 dB, p < 0.01). For six-channel compression the effect of time constants was roughly the same for both com-pression ratios.
For the highest interaction effect (NC * CR * T), compression ratio seems to have theleast influence. Moreover, both second order effects with compression ratio (NC * CRand CR * T) were not significant. The significance of both NC * T and NC * CR * T indi-cates that interactions are important and that full parametric investigations might beimportant for understanding the effects of compression.
2.3.2 Analysis with the inclusion of split-frequency compression ra-tios (1/2 and 2/3)
In the previous analysis, no frequency dependent compression ratios were included be-
48

2.3 Results
PTA 0.5, 1, 2 kHz (dB HL)
SR
T sta
t, lin
ear
(dB
)
∆SR
T (d
B)
Ta/T
r: 4/4
4/40
40/4
0
4/40
0
40/4
000
4/4 4/40 40/40 4/400 40/400Ta/Tr
-0.5
0.0
0.5
1.0
1.5
2.0
2.5
3.0
NC=1NC=2NC=6
Ta/Tr
Figure 2.4: ∆SRT averaged over all subjects. ∆SRT is given as a function of time constants (Ta/Tr)and number of channels (NC) for CR = 2/2 and 3/3 only. ∆SRT is the SRT for compression minusthe subjects’ SRT for linear amplification, and lower values represent better speech intelligibility withcompression. The ordering of Ta/Tr is primarily based on release time. Each curve represents a differentnumber of channels. Split-frequency compression ratios were not included. Vertical bars denote 0.95confidence intervals.
cause of the inclusion of single-channel compression. An additional univariate analy-sis2 was conducted in which single-channel compression was omitted in favour of theinclusion of the split-frequency compression conditions CR = 1/2 and 2/3. Numberof channels (NC = 2, 6), compression ratios (CR = 1/2, 2/2, 2/3, and 3/3), and timeconstants (5 levels) were all treated as independent within subject factors. The resultsof the analysis are presented in Table 2.6 and Figure 2.5.
In this second analysis, the main effect of number of channels was not significant, dueto the exclusion of single-channel compression which caused the significant effect inthe previous analysis.
The main effect of compression ratio still was significant. Post-hoc comparison (HSD)of the effect of compression ratio showed that, in accordance with the previous analy-sis, CR = 3/3 resulted in significantly worse scores than those obtained for CR = 2/2.Moreover, the scores for CR = 3/3 were worse than those obtained for all other com-pression ratios (CR = 1/2, 2/2, and 2/3, p < 0.01). The differences between the othercompression ratios (CR = 1/2, 2/2, and 2/3) were small (0.1 dB) and insignificant
2After inclusion of the split compression ratios, Mauchley’s test of sphericity again did not yield anysignificant results. Univariate analysis is thus appropriate.
49

Chapter 2: Compression in stationary noise
Table 2.6: Results of a repeated measures analysis of variance. Split-frequency compression condi-tions were included, and single-channel compression was omitted. NC = 2, 6; CR = 1/2, 2/2, 2/3, 3/3;Ta/Tr=4/4, 4/40, 40/40, 4/400, 40/400.
Effect Degrees MS F p-valueof freedom
NC 1 7.0 2.7 0.1CR 3 15.8 6.8 < 0.0005T 4 13.6 5.9 < 0.0005NC * CR 3 2.1 0.9 0.5NC * T 4 7.0 2.9 < 0.05CR * T 12 2.4 1.1 0.4NC * CR * T 12 4.4 1.8 < 0.05
PTA 0.5, 1, 2 kHz (dB HL)
SR
T sta
t, lin
ear
(dB
)
∆SR
T (d
B)
Ta/T
r: 4/4
4/40
40/4
0
4/40
0
40/4
000
Ta/Tr
NC = 2
Ta/Tr:4/4
4/4040/40
4/40040/400
-2.0
-1.5
-1.0
-0.5
0.0
0.5
1.0
1.5
2.0
2.5
3.0
3.5
NC = 6
Ta/Tr:4/4
4/4040/40
4/40040/400
Ta/Tr:4/4
4/4040/40
4/40040/400
CR = 1/2CR = 2/2CR = 2/3CR = 3/3
∆SR
T (d
B)
Figure 2.5: ∆SRT is averaged over all subjects and shown as a function of time constants (Ta/Tr), com-pression ratio (CR) and number of channels (NC). Split-frequency compression ratios (CR = 1/2 and2/3) were included; single-channel compression was omitted. ∆SRT is the SRT for compression minusthe subjects’ SRT for linear amplification, and lower values represent better speech intelligibility withcompression. The ordering of Ta/Tr is primarily based on release time. Confidence intervals are omittedfor clarity. The 0.95 confidence intervals were approximately 1.5 dB.
50

2.3 Results
(p≥ 0.9). All four compression ratios resulted in significantly higher ∆SRTs than thoseobtained with linear amplification (∆SRT≥+0.5 dB; p < 0.05).
After inclusion of the split-frequency compression conditions, the main effect of timeconstants still exhibited the same trend as in the previous analysis, i.e., larger timeconstants yielded better results. The exclusion of NC = 1 resulted in a less detri-mental effect of compression on ∆SRT for all time constants, except for the largest(Ta/Tr = 40/400). For both analyses, Ta/Tr = 40/400 gave the best results of all timeconstants (∆SRT = +0.3 dB, for both analyses). Post-hoc comparisons of the results forthe main effect of Ta/Tr gave three significant results. First, Ta/Tr = 40/40 resulted ina 0.5 dB better ∆SRT than Ta/Tr = 4/40 (p < 0.05). Second, Ta/Tr = 40/400 gave bet-ter ∆SRTs than both Ta/Tr = 4/40 and 4/400 (0.7 dB; p < 0.05, and 0.6 dB; p < 0.0001,respectively). The difference between Ta/Tr = 40/400 and Ta/Tr = 4/4, which was sig-nificant in the previous analysis, was insignificant: the omission of NC = 1 diminishedthe detrimental effect of Ta/Tr = 4/4.
The inclusion of split-frequency compression conditions gave the same significant in-teraction effects as the previous analysis: both NC * T and NC * CR * T were significant.For NC = 2, a contour plot of the average ∆SRT score as a function of compressionratio and time constants is shown in Figure 2.6(a). The standard deviation betweenthe subjects is shown in Figure 2.6(b). Experimental data was available for everygrid point. The intermediate values, represented by contour lines and colours, wereobtained by a distance-weighted least-squares calculation. While the main effect ofcompression ratio is clearly discernible in the figure (CR = 3/3 resulted in the highest∆SRTs), the main effect of time constants (better scores for increasing Ta/Tr) is lesspronounced. Looking only at data obtained with NC = 2, the interaction CR * T wassignificant (F = 1.8; p < 0.05). As stated before, overall (NC = 2+6), this interaction wasnot significant. For NC = 2 the best SRT was −0.7 dB and was achieved with CR = 2/3and Ta/Tr = 40/40. The improvement relative to linear amplification was not signifi-cant (p = 0.1). However, Fig. 2.6(b) shows that the standard deviation of the individualscores was relatively low for this setting (1.7 dB). This indicates that for two-channelcompression this setting is a safe choice for most subjects, since the difference in scor-ing between the subjects is relatively small.
Contour plots for NC = 6 are shown in Figure 2.7. The main effect of compression ra-tio, which was significant for NC = 2, was not significant for NC = 6 (p = 0.06). Themain effect of time constants (decreasing ∆SRT with increasing Ta/Tr) is clearly visiblein Fig. 2.7, and was significant (p < 0.0001). Without the data for NC = 2, the inter-action CR * T was no longer significant (F = 1.1; p = 0.4). For NC = 6, the best result(∆SRT =−0.4 dB) was obtained for the longest release time and two compression ra-tios: CP ( 6, 2/2 + 2/3, 40/400). This improvement relative to linear amplification wasnot significant (p = 0.1). However, the standard deviations for these best settings wererelatively low (1.1 and 1.5 dB, respectively).
51

Chapter 2: Compression in stationary noise
(a) ∆SRT (b) Standard deviation
Figure 2.6: Contour plots for two-channel compression. Experimental data was available for every gridpoint (◦). The intermediate values were calculated by a distance weighted least squares interpolation.
The results for NC = 2 show that the interaction between CR and T is important if oneseeks the best setting with respect to speech intelligibility. This interaction was notsignificant when the analysis was limited to data for NC = 6, thus indicating that theinteraction of CR * T changes with number of channels. This is in agreement with thesignificant interaction of NC * CR * T. Unfortunately, all improvements relative to linearamplification were insignificant.
2.3.3 Analysis with attack and release time
In order to analyse the results of attack and release time individually, a univariaterepeated measures ANOVA was performed with Ta and Tr as independent withinvariables (all combinations of Ta = 4, 40 ms; Tr = 40, 400 ms). All compression ratios(CR = 1/2, 2/2, 2/3, 3/3) and number of channels (NC = 1, 2, 6) were included. Theanalysis showed that the effect of both Ta (p < 0.000001) and Tr (p < 0.05) was signif-icant. Post-hoc analysis with Tukey’s HSD test showed that an attack time of 40 msyielded better results than an attack time of 4 ms (∆SRTTa = 40 −∆SRTTa = 4 =−0.6 dB;p < 0.0001). A release time of 400 ms gave better ∆SRTs than a release time of 40 ms(∆SRTTr = 400 −∆SRTTr = 40 =−0.2 dB; p < 0.05). Thus larger time constants (both attackand release time) resulted in better scores.
Since release time spanned a larger range (4 to 400 ms) than attack time (4 to 40 ms),the ordering of Ta/Tr in Fig. 2.3 and subsequent figures is primarily based on release
52

2.4 Discussion
(a) ∆SRT (b) Standard deviation
Figure 2.7: Contour plots for six-channel compression. Experimental data was available for every gridpoint (◦). The intermediate values were calculated by a distance-weighted least-squares interpolation.
time.
2.4 Discussion
2.4.1 Main effects of NC, CR, and Ta/Tr
Number of channels
The effect of number of channels was significant in the analysis which included single-channel compression. In this analysis, six-channel compression gave better results(0.5 dB) than single-channel compression. This significant difference was severely in-fluenced by a detrimental score for single-channel compression with small time con-stants and CR = 3/3 (see Fig. 2.3). However, for larger time constants NC = 1 gavelower scores than NC = 2 and 6 as well
In contrast to our result, the available literature often states that a larger number ofchannels ( < 3 or 4) leads to lower speech intelligibility (section 2.1.1: Hickson, 1994;Souza, 2002). However the (limited number of) available studies with moderately hear-ing impaired subjects and low compression ratios (CR≤ 3) did not show detrimentalresults for NC > 3 with CR≤ 3 (section 2.1.1: Barfod, 1978; Moore et al., 1999; Van Bu-uren et al., 1999). These results relate well to our finding that speech intelligibility did
53

Chapter 2: Compression in stationary noise
not decrease for compression with an increasing number of channels.
Compression ratio
A compression ratio of 3/3 resulted in consistently worse speech intelligibility than alllower compression ratios (CR = 1/2, 2/2, and 2/3). This detrimental effect of CR = 3/3was confirmed by post-hoc analysis, and was very consistent and virtually indepen-dent of NC and Ta/Tr. The differences between the other three compression ratios weresmall ( < 0.1 dB) and insignificant. Thus, no overall best compression ratio was found.The experiments of Van Buuren et al. (1999) also showed no significant difference inspeech intelligibility for CR = 1 and 2, and worse results for CR = 4. The experimentsof Neuman et al. (1998), which spanned compression ratios from 1 to 10, showed thatthe subjective quality of compressed speech declined for CR > 2.
Previous research with severely hearing-impaired subjects did not show such a cleardetrimental effect for CR = 3 in stationary noise (Dreschler et al., 1984; King and Mar-tin, 1984). In those experiments the results of CR = 3 might have been less detrimentalbecause compression allowed the entire speech signal to fit within the small dynamicrange of the subjects. In contrast, our subjects only had a moderate hearing loss, whichallowed us to present the uncompressed speech signal entirely within their dynamicrange, without the need for compression. A compression ratio of 3/3 was thus notrequired, and the detrimental effects of compression were dominant.
Time constants
The main effect of time constants was significant in both the analysis with and withoutsplit-frequency compression ratios. With our choice of parameter values, the effect oftime constants on speech intelligibility was larger and more significant than the effectof compression ratio and number of channels. Overall, larger time constants resultedin better scores. The best results were obtained for the largest time constants (Ta/Tr =
40/400). Analysis per number of channels (NC = 1, 2, or 6) showed that the effectof time constants on speech intelligibility was largest for single-channel compression.For speech quality, Neuman et al. (1998) also found a large effect of time constants forsingle-channel compression.
2.4.2 Attack and release time
Attack time
Most commercial hearing aids use a short attack time to prevent sudden loud noisesfrom overloading the aid or, more importantly, the ear. In the present experiment nostimuli with sudden large increases in sound level were used, since the experiment was
54

2.4 Discussion
designed to investigate the influence of compression on speech intelligibility and noton comfort or speech audibility. Thus, all stimuli were presented within the dynamicrange of hearing of the subjects and a short attack time was not required to protect thesubject from discomfort (or damage) caused by sudden high-level noises. Our resultsindicated that an attack time of 40 ms resulted in better speech intelligibility than 4 ms(∆SRTTa = 40 −∆SRTTa = 4 =−0.6 dB). This benefit of a longer attack time for speechintelligibility was consistently present for all number of channels and all compressionratios.
Nabelek performed an experiment in which he changed attack time andhis results are in agreement with ours (Nabelek, 1983, CP ( 1, 1 + 2.5,1/10 + 1/30 + 3/30 + 3/90 + 10/90 + 42/370)). He found that an attack time of10 ms gave better speech intelligibility than an attack time of 3 ms with nine severelyhearing-impaired subjects and noise added after compression. His attack time of10 and 3 ms were based on the IEC definition, and would be roughly equivalent toTexp = 4 and Texp = 1 ms according to our definition (see section 1.6.3).
Envelope fluctuations of speech mostly occur in a range from about 0.1 to 40 Hz (Ver-schuure et al., 1996) in each frequency band. For speech intelligibility the modulationsbetween 2 and 8 Hz are most important (Chi et al., 1999). Verschuure et al. (1996)measured the effective compression in quiet as a function of release time: CP ( 1, 4,5/15 + 5/30 + 5/60 + 5/120). Their results showed that for Tr, IEC = 120 ms (aboutTexp = 50 ms) only modulations up to about 5 Hz were compressed. For a release timeof 15 ms (about Texp = 6 ms) modulations up to 40 Hz were compressed. Extrapolatingthese results for release time to attack time, our longest attack time (40 ms) might haveleft important modulations ( > 5 Hz) intact, while the short attack time (4 ms) mighthave introduced temporal distortion.
Release time
Results indicated that on average longer release times gave better speech intelligibil-ity. This effect of long release times is typically attributed to less temporal distortiondue to less effective compression (see the previous section). Since our stimuli wereaudible without the need for compression, temporal distortion caused by compressionwith short release times might have dominated a possible beneficial effect of increasedaudibility.
Attack time confounded with release time
Results showed that attack time had more effect on speech intelligibility than releasetime: the maximal effect of attack time (∆SRTTa = 40 −∆SRTTa = 4 =−0.6 dB, p < 0.00001)was larger than the maximal effect of release time (∆SRTTr = 400 −∆SRTTr = 40 =−0.2 dB,p < 0.05). This might be related to two possible effects.
55

Chapter 2: Compression in stationary noise
First, compression with small time constants distorts the wave form. The amount ofdistortion can be diminished by choosing large time constants. If one time constant(Ta or Tr) is small, the effect of compression can be reduced by increasing the otherconstant. Thus, in order to limit the amount of distortion, either Ta or Tr (or preferablyboth) should be long. However, in the present experiment attack and release timeswere confounded. No combinations with Ta > Tr were used (Table 2.2). Changing thesmallest of Ta and Tr might have a more profound effect on speech intelligibility thanchanging the largest.Second, Ta might have more effect on syllable audibility than Tr. A short Ta causes again reduction during the occurrence of a (high intensity) vowel. If Tr is large, the gainwill be restored only slowly and it will still be lower than optimal during the followingconsonant, making this consonant less audible. In contrast, a long Ta (or a short Tr)will not decrease audibility of consonants following a vowel.Both arguments lead to the assumption that Ta should be long, albeit for different rea-sons. They are in agreement with the finding that Ta = 40 ms resulted in better speechintelligibility than Ta = 4 ms.
2.4.3 Interactions
The repeated measures analyses showed that the interaction terms NC * T andNC * CR * T both had significant effects. To our knowledge, both significant effects havenot been reported before.
NC * T: slowly-acting single-channel compression resulted in better speech intelli-gibility than fast-acting single-channel compression
Speech intelligibility with single-channel compression improved with increasing timeconstants (see Fig. 2.3). The frequency spectra of our materials (both male and fe-male speech) contained the most energy at low frequencies (roughly 100-600 Hz).With single-channel compression these dominant low frequencies mainly controlledthe compressor. The gain at higher frequencies ( > 600 Hz) was thus controlled by thesound energy at the dominant low frequencies. This caused intermodulation distortionof speech envelopes. Increasing the time constants decreased this distortion, whichmight have resulted in lower ∆SRTs. Another way of suppressing the (low-frequencycontrolled) high-frequency gain can be the use of high-frequency emphasis prior tosingle-channel compression, as is done in several commercially available hearing aids.Note that in this study the negative effect of fast-acting compression was not counter-acted by the advantage of an increased audibility of speech, since the dynamic rangeof hearing of the subjects was large enough to accommodate the stimuli, especially atthe dominant low frequencies.
NC * T: fast-acting two-channel compression gave better results than fast-acting
56
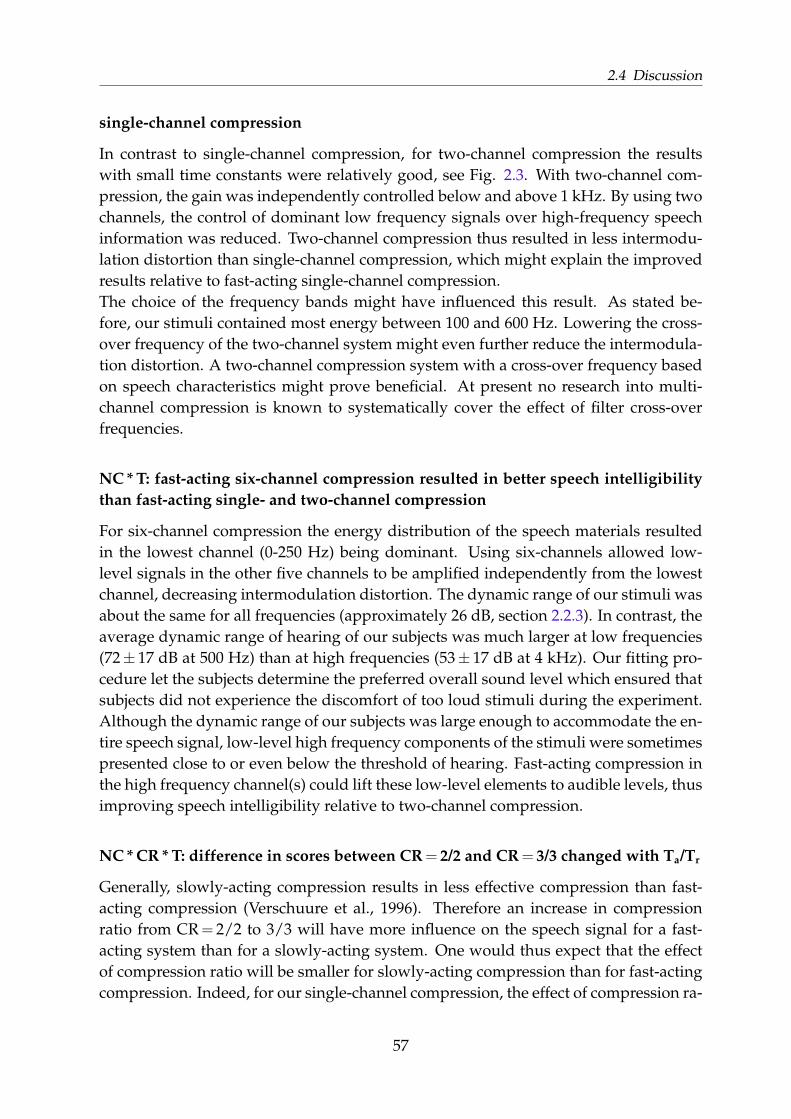
2.4 Discussion
single-channel compression
In contrast to single-channel compression, for two-channel compression the resultswith small time constants were relatively good, see Fig. 2.3. With two-channel com-pression, the gain was independently controlled below and above 1 kHz. By using twochannels, the control of dominant low frequency signals over high-frequency speechinformation was reduced. Two-channel compression thus resulted in less intermodu-lation distortion than single-channel compression, which might explain the improvedresults relative to fast-acting single-channel compression.The choice of the frequency bands might have influenced this result. As stated be-fore, our stimuli contained most energy between 100 and 600 Hz. Lowering the cross-over frequency of the two-channel system might even further reduce the intermodula-tion distortion. A two-channel compression system with a cross-over frequency basedon speech characteristics might prove beneficial. At present no research into multi-channel compression is known to systematically cover the effect of filter cross-overfrequencies.
NC * T: fast-acting six-channel compression resulted in better speech intelligibilitythan fast-acting single- and two-channel compression
For six-channel compression the energy distribution of the speech materials resultedin the lowest channel (0-250 Hz) being dominant. Using six-channels allowed low-level signals in the other five channels to be amplified independently from the lowestchannel, decreasing intermodulation distortion. The dynamic range of our stimuli wasabout the same for all frequencies (approximately 26 dB, section 2.2.3). In contrast, theaverage dynamic range of hearing of our subjects was much larger at low frequencies(72± 17 dB at 500 Hz) than at high frequencies (53± 17 dB at 4 kHz). Our fitting pro-cedure let the subjects determine the preferred overall sound level which ensured thatsubjects did not experience the discomfort of too loud stimuli during the experiment.Although the dynamic range of our subjects was large enough to accommodate the en-tire speech signal, low-level high frequency components of the stimuli were sometimespresented close to or even below the threshold of hearing. Fast-acting compression inthe high frequency channel(s) could lift these low-level elements to audible levels, thusimproving speech intelligibility relative to two-channel compression.
NC * CR * T: difference in scores between CR = 2/2 and CR = 3/3 changed with Ta/Tr
Generally, slowly-acting compression results in less effective compression than fast-acting compression (Verschuure et al., 1996). Therefore an increase in compressionratio from CR = 2/2 to 3/3 will have more influence on the speech signal for a fast-acting system than for a slowly-acting system. One would thus expect that the effectof compression ratio will be smaller for slowly-acting compression than for fast-actingcompression. Indeed, for our single-channel compression, the effect of compression ra-
57

Chapter 2: Compression in stationary noise
tio was larger for fast-acting compression (∆SRTCR = 3/3−∆SRTCR = 2/2 = +1.7 dB) thanfor slowly-acting compression (∆SRTCR = 3/3−∆SRTCR = 2/2 = +0.7 dB), see Fig. 2.3. Thiseffect was not present for NC=2, and 6. Similarly, Neuman et al. (1998) reported alarger influence of release time for CR = 3 than for CR = 2 on subjective quality assess-ments for their single-channel compression system.
2.4.4 Best settings
Unfortunately, nearly all obtained speech reception thresholds were higher than thosemeasured with linear amplification. Overall the best result (∆SRT =−0.7 dB) wasachieved with two-channel compression, CP ( 2, 2/3, 40/40). Besides this setting,only three others resulted in better scores than those obtained with linear amplifi-cation. These three were obtained with six-channel compression: CP ( 6, 2/2 + 2/3,40/400) which both resulted in ∆SRT =−0.4 dB, and CP ( 6, 1/2, 4/4) which resultedin ∆SRT =−0.1 dB. The best result with single-channel compression was equal to thatwith linear amplification.
∆SRT was averaged across subjects, which implies that the settings resulting in the best∆SRTs might not be optimal for each individual subject. However, the small standarddeviations between the scores at the 3 best results (1.7, 1.1, and 1.5 dB, respectively)indicate that these settings vary relatively little over subjects. Furthermore, for 11 sub-jects compression with CP ( 2, 2/3, 40/40) resulted in the best 25% of scores (and for 1subject it resulted in the worst 25%). Results for compression with CP ( 6, 2/2, 40/400)and CP ( 6, 2/3, 40/400) were among the top 25% for 8 and 12 subjects, respectively.Both were among the worst 25% for 2 subjects only.
Our results could be used as a general guideline in hearing aid fitting. If one wishes tooptimize an individual fit the present results demonstrate that such an optimization isdifficult to conduct, particularly within the time constraints in everyday practice. Theeffects of the compression parameters were small. One may consider to simply use thegeneral result for each individual.
2.5 ConclusionsIn the absence of audibility improvements, compression did not significantly improvespeech intelligibility of moderately hearing-impaired subjects in stationary noise. Infact, most compression settings resulted in lower scores than those obtained with linearamplification. Main effects showed that compression ratio should be smaller than 3,time constants should be large (Ta/Tr = 40/400 ms), and the number of channels largerthan 1. Six-channel compression resulted in approximately the same speech intelligi-bility as two-channel compression. Two interaction effects (NC * T and NC * CR * T)were significant, indicating that specific combinations of parameter values can lead to
58

2.5 Conclusions
different results. Finding the best settings for an individual based on speech intelligi-bility will be difficult if not almost impossible. One may consider relying on the bestresult from this experiment; for two-channel compression CP ( 2, 2/3, 40/40) and forsix-channel compression CP ( 6, 2/2 + 2/3, 40/400).
59

Chapter 2: Compression in stationary noise
60

The effect of compression onspeech intelligibility influctuating noise 3
Rolph Houben and Guido F. SmoorenburgManuscript in revision for Audiology & Neurotology

Chapter 3: Compression in fluctuating noise
3.1 IntroductionIn real-life communication, background noise often consists of one or more interferingspeakers. For normal-hearing listeners, speech intelligibility is higher in such a fluctu-ating noise than in stationary noise, at least when the noise is presented at the same rmssignal level and with the same spectral distribution. This difference in speech intelligi-bility between fluctuating and stationary noise is called the release of masking, and it isgenerally much smaller in listeners with a sensorineural hearing loss than in normal-hearing subjects (Festen and Plomp, 1990; Bronkhorst and Plomp, 1992; Gustafssonand Arlinger, 1994; Eisenberg et al., 1995; Stuart and Phillips, 1996; Hagerman, 1997).Amplitude compression might improve speech intelligibility of the hearing-impairedlisteners, by lifting the speech signal to higher levels during the gaps in fluctuatingnoise (Souza, 2002). However, the effect of different compression parameters on speechintelligibility can be quite complicated and compression parameters may interact. Pre-vious studies focused on varying one or two parameters per experiment. This studyfocuses on the combination of four parameters, namely the number of channels, com-pression ratio and attack and release time. The study is designed to investigate possibleinteraction effects of the parameters with respect to speech intelligibility in fluctuatingnoise.
3.1.1 Previous research on amplitude compression in fluctuatingnoise
Many publications have addressed the effects of amplitude compression on speechintelligibility. Their conclusions, focusing on stationary noise, were summarized inchapter 2. Here, an overview is presented with respect to speech intelligibility influctuating noise. For clarity the compression parameters are abbreviated as follows:NC = number of frequency channels, CR = compression ratio, Ta = attack time, andTr = release time.
Reviews
Rintelmann (1972) concluded that almost all research prior to that time had been per-formed in a quiet surrounding. He specifically suggested the use of various types ofbackground noise for investigating speech intelligibility with compression.
In Villchur’s review of amplitude compression hearing aids (1978), he did not dis-tinguish between speech intelligibility in quiet and in background noise. He includedonly one experiment in fluctuating noise in his review. This experiment (Yanick, 1976a)showed positive results in cafeteria noise with two-channel compression (CR > 1,Ta < 1 ms, Tr = 20 ms) relative to single-channel compression and linear amplification.Yanick’s subjects had a moderate to severe sensorineural hearing loss. In Villchur’sview, the gain in the single-channel compressor might have been kept at a rather con-
62
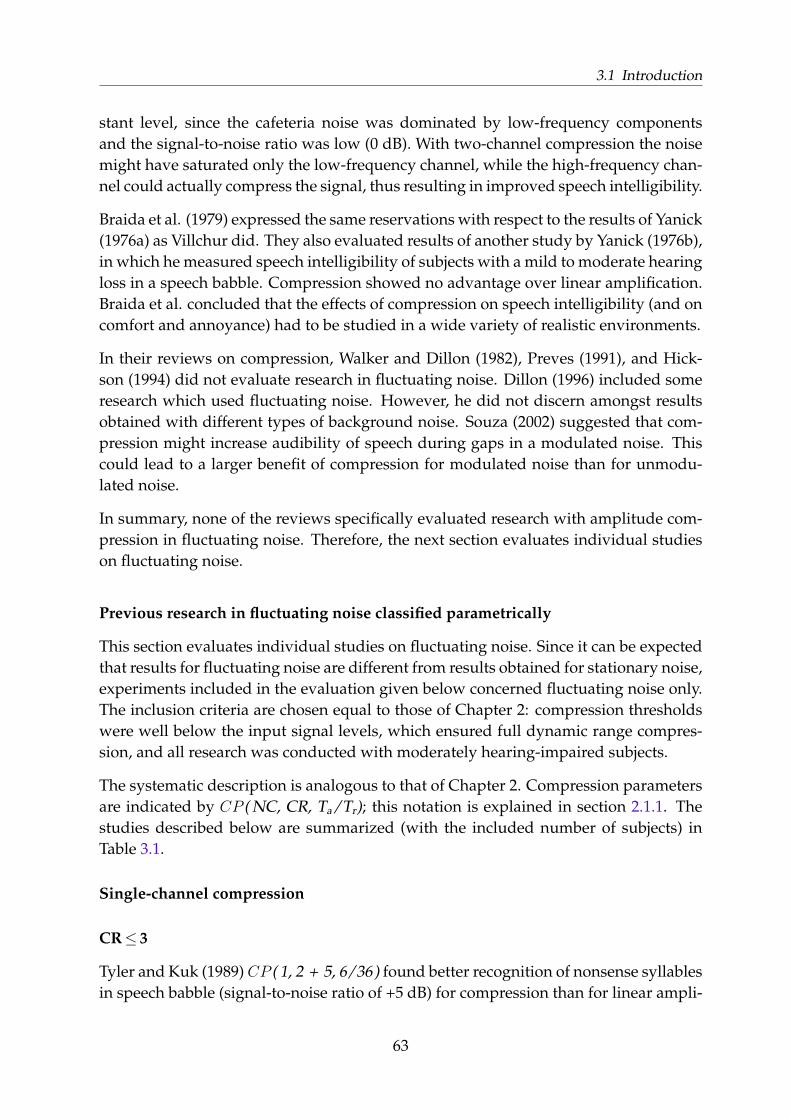
3.1 Introduction
stant level, since the cafeteria noise was dominated by low-frequency componentsand the signal-to-noise ratio was low (0 dB). With two-channel compression the noisemight have saturated only the low-frequency channel, while the high-frequency chan-nel could actually compress the signal, thus resulting in improved speech intelligibility.
Braida et al. (1979) expressed the same reservations with respect to the results of Yanick(1976a) as Villchur did. They also evaluated results of another study by Yanick (1976b),in which he measured speech intelligibility of subjects with a mild to moderate hearingloss in a speech babble. Compression showed no advantage over linear amplification.Braida et al. concluded that the effects of compression on speech intelligibility (and oncomfort and annoyance) had to be studied in a wide variety of realistic environments.
In their reviews on compression, Walker and Dillon (1982), Preves (1991), and Hick-son (1994) did not evaluate research in fluctuating noise. Dillon (1996) included someresearch which used fluctuating noise. However, he did not discern amongst resultsobtained with different types of background noise. Souza (2002) suggested that com-pression might increase audibility of speech during gaps in a modulated noise. Thiscould lead to a larger benefit of compression for modulated noise than for unmodu-lated noise.
In summary, none of the reviews specifically evaluated research with amplitude com-pression in fluctuating noise. Therefore, the next section evaluates individual studieson fluctuating noise.
Previous research in fluctuating noise classified parametrically
This section evaluates individual studies on fluctuating noise. Since it can be expectedthat results for fluctuating noise are different from results obtained for stationary noise,experiments included in the evaluation given below concerned fluctuating noise only.The inclusion criteria are chosen equal to those of Chapter 2: compression thresholdswere well below the input signal levels, which ensured full dynamic range compres-sion, and all research was conducted with moderately hearing-impaired subjects.
The systematic description is analogous to that of Chapter 2. Compression parametersare indicated by CP ( NC, CR, Ta/Tr); this notation is explained in section 2.1.1. Thestudies described below are summarized (with the included number of subjects) inTable 3.1.
Single-channel compression
CR≤ 3
Tyler and Kuk (1989) CP ( 1, 2 + 5, 6/36) found better recognition of nonsense syllablesin speech babble (signal-to-noise ratio of +5 dB) for compression than for linear ampli-
63

Chapter 3: Compression in fluctuating noise
Table 3.1: Results of previous research in a fluctuating background noise and for moderately hearing-impaired subjects. The reference is linear amplification. The symbol⊗ indicates that linear amplificationwas not investigated. Better, equal or worse scores are indicated by ⊕, �, and , respectively. Someresearch could not be classified and is indicated with ? instead of a number in the list below. Thenumber of subjects included (n) is shown after the name of the authors.
Single-channel (NC = 1) Multi-channel (NC > 1)CR≤ 3 CR > 3 CR≤ 3 CR > 3
Tr≤ 25 ms 2� 2� 2�� 210� 10�⊕⊕⊕⊕⊕
15�25 < Tr≤ 100 ms 1⊕ 1� 12⊗ 14
4� 5� 13⊗ 175� 146⊗ 1689⊕
Tr≥ 100 ms 3� 7 12⊗ 177�� 11 168
1 Tyler and Kuk (1989) n = 16 11 Peterson et al. (1990) n = 302 Van Buuren et al. (1999) n = 26 12 Hansen (2002) n = 63 Hickson et al. (1995) n = 15 CP ( 15, 2.1, 1/40+10/400+1/4000+100/4000)4 Kam and Wong (1999) n = 20 13 Hansen (2002) n = 65 Boike and Souza (2000) n = 9 CP ( 15, 2.1+3, 1/40)6 Neuman et al. (1995) n = 20 14 Lippmann et al. (1981) n = 57 Neuman et al. (1998) n = 20 15 Verschuure et al. (1998) n = 20
CP ( 1, 1+1.5+2+3+5+10, 5/200) 16 Moore et al. (2004) n = 58 Neuman et al. (1998) n = 20 17 Olsen et al. (2004) n = 20
CP ( 1, 1.5+2+3, 5/60+5/200+5/1000) ? Humes et al. (1999) n = 55 (�⊕)9 Dillon et al. (1998) n = 140 ? Novick et al. (2001) n = 10 (⊗)10 Moore et al. (1999) n = 18 ? Van Toor and Verschuure (2002) n = 38 (⊗)
? Humes et al. (2004) n = 53 (�)
fication. Although this result was only significant for 2 out of 15 subjects, the trendwas found for nearly all subjects.
Van Buuren et al. (1999) CP ( 1 + 4 + 16, 1 + 2 + 4, 0/0) measured speech receptionthresholds in a single-talker babble (the disturbing talker had the opposite sex of thespeaker). Single-channel compression with CR = 2 resulted in a slightly better speechreception threshold (−0.25 dB) than linear amplification, but this difference was notsignificant. In stationary noise, this compression resulted in slightly worse intelligibil-ity than obtained for linear amplification, but this was insignificant.
Hickson et al. (1995) CP ( 1, 1 + 1.3 + 1.8, 8/50-550) used a system with an adaptiverelease time (see section 1.7.4). Release time depended on the duration of the input
64

3.1 Introduction
signal: for short input sounds the release time was short (50 ms), and for long inputsounds the release time was longer (550 ms). They measured consonant perception intwo different background noises: a multi-talker babble and the sound of dishes in asink. This last noise was characterized by marked intensity fluctuations. Hickson et al.found a significant interaction between compression ratio and noise type. In the multi-talker babble, compression with CR = 1.8 resulted in the worst consonant score, andit was significantly worse than that obtained for linear amplification. In contrast, thissame compression ratio (CR = 1.8) resulted in the best score in the sink noise (signifi-cantly better than CR = 1.3, but not significantly different from linear amplification).
Kam and Wong (1999) CP ( 1, 1 + 1.1-2.7, 5/30) found no difference in speech recogni-tion scores between linear amplification and compression in a four-talker babble. Com-pression ratio was subject and channel dependent, and signal-to-noise ratios rangedfrom −9 to +9 dB.
Boike and Souza (2000) CP ( 1, 1 + 2 + 5 + 10, 3/70) used a multi-talker babble at asignal-to-noise ratio of +10 dB. Speech recognition scores for CR = 2 did not differ sig-nificantly from scores obtained with linear amplification. Subjective quality assess-ments for CR = 2 were worse than those achieved with linear amplification. However,this difference was insignificant.
Neuman et al. (1995) CP ( 1, 1.5 + 2 + 3, 5/60 + 5/200 + 5/1000) used paired-comparison judgements to investigate the effect of compression on speech quality inthree different background noises. They used fluctuating noise (cafeteria, and apart-ment noise), and stationary noise (ventilation noise, see Chapter 2). A significant in-teraction was found between noise type and release time. In cafeteria noise (signal-to-noise ratio of +14 dB) subjects preferred long release times (200 and 1000 ms) overa shorter release time (60 ms). In apartment noise no significant difference in releasetime preference was found. However this last result might have been caused by a highsignal-to-noise ratio (+26 dB) and a high compression threshold (6 dB above rms level).In stationary (ventilation) noise, no preference was found for any release time. Theirexperimental design did not allow for an analysis with compression ratio as main ef-fect.
Neuman et al. (1998) describe two experiments. For both experiments they usedthe same subjects and noise as Neuman et al. (1995). In the first experiment CP ( 1,1 + 1.5 + 2 + 3 + 5 + 10, 5/200) they varied compression ratio with only one Ta/Tr-setting. Quality ratings of clarity and pleasantness with all types of noise were worsefor CR = 3 than for CR = 1, 1.5, and 2. The perceived amount of background noise in-creased with increasing compression ratio. In their second experiment Neuman et al.(1998) CP ( 1, 1.5 + 2 + 3, 5/60 + 5/200 + 5/1000) performed a parametric study of theeffect of CR and Tr on subjective sound quality with the same subjects and backgroundnoises as their previous experiment. In this additional study, the highest compressionratios (CR = 5, and 10) of the previous study were omitted to give way to two extra
65
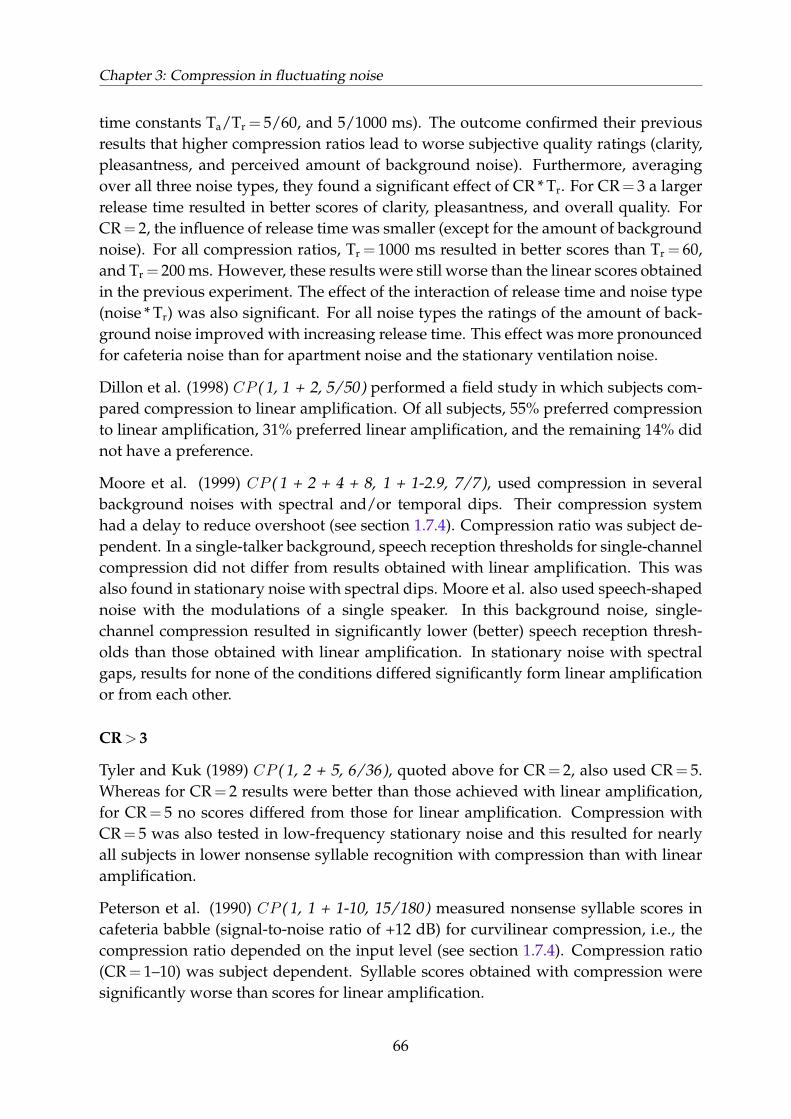
Chapter 3: Compression in fluctuating noise
time constants Ta/Tr = 5/60, and 5/1000 ms). The outcome confirmed their previousresults that higher compression ratios lead to worse subjective quality ratings (clarity,pleasantness, and perceived amount of background noise). Furthermore, averagingover all three noise types, they found a significant effect of CR * Tr. For CR = 3 a largerrelease time resulted in better scores of clarity, pleasantness, and overall quality. ForCR = 2, the influence of release time was smaller (except for the amount of backgroundnoise). For all compression ratios, Tr = 1000 ms resulted in better scores than Tr = 60,and Tr = 200 ms. However, these results were still worse than the linear scores obtainedin the previous experiment. The effect of the interaction of release time and noise type(noise * Tr) was also significant. For all noise types the ratings of the amount of back-ground noise improved with increasing release time. This effect was more pronouncedfor cafeteria noise than for apartment noise and the stationary ventilation noise.
Dillon et al. (1998) CP ( 1, 1 + 2, 5/50) performed a field study in which subjects com-pared compression to linear amplification. Of all subjects, 55% preferred compressionto linear amplification, 31% preferred linear amplification, and the remaining 14% didnot have a preference.
Moore et al. (1999) CP ( 1 + 2 + 4 + 8, 1 + 1-2.9, 7/7), used compression in severalbackground noises with spectral and/or temporal dips. Their compression systemhad a delay to reduce overshoot (see section 1.7.4). Compression ratio was subject de-pendent. In a single-talker background, speech reception thresholds for single-channelcompression did not differ from results obtained with linear amplification. This wasalso found in stationary noise with spectral dips. Moore et al. also used speech-shapednoise with the modulations of a single speaker. In this background noise, single-channel compression resulted in significantly lower (better) speech reception thresh-olds than those obtained with linear amplification. In stationary noise with spectralgaps, results for none of the conditions differed significantly form linear amplificationor from each other.
CR > 3
Tyler and Kuk (1989) CP ( 1, 2 + 5, 6/36), quoted above for CR = 2, also used CR = 5.Whereas for CR = 2 results were better than those achieved with linear amplification,for CR = 5 no scores differed from those for linear amplification. Compression withCR = 5 was also tested in low-frequency stationary noise and this resulted for nearlyall subjects in lower nonsense syllable recognition with compression than with linearamplification.
Peterson et al. (1990) CP ( 1, 1 + 1-10, 15/180) measured nonsense syllable scores incafeteria babble (signal-to-noise ratio of +12 dB) for curvilinear compression, i.e., thecompression ratio depended on the input level (see section 1.7.4). Compression ratio(CR = 1–10) was subject dependent. Syllable scores obtained with compression weresignificantly worse than scores for linear amplification.
66

3.1 Introduction
Neuman et al. (1998) CP ( 1, 1 + 1.5 + 2 + 3 + 5 + 10, 5/200), quoted above for CR≤ 3,also used CR = 5 and 10. Both these higher compression ratios resulted in worse scoresthan scores obtained with lower compression ratios.
Van Buuren et al. (1999) CP ( 1 + 4 + 16, 1 + 2 + 4, 0/0), quoted above for single-channel compression with CR = 2, also used compression with a compression ratioof 4. Speech reception thresholds with CR = 4 were worse than those obtained withCR = 2 and than those obtained with linear amplification, however, the differenceswere not significant. Note that in stationary noise, single-channel compression withCR = 4 resulted in significantly worse results than those for linear amplification.
Boike and Souza (2000) CP ( 1, 1 + 2 + 5 + 10, 3/70) were quoted above for CR = 2with speech recognition that did not significantly differ from scores obtained with lin-ear amplification. They also used higher compression ratios and found speech recog-nition to decrease with increasing compression ratios (going from 2 to 5 to 10). Speechquality also decreased with increasing compression ratio, although only compressionwith CR = 10 differed significantly from linear amplification.
In summary, when applying single-channel compression in fluctuating noise for sub-jects with a moderate sensorineural hearing impairment, few experiments showed con-sistently better speech intelligibility with compression than with linear amplification.Best results were achieved with compression ratios smaller than 3. The effect of timeconstants on speech intelligibility has not been sufficiently investigated and is still notclear. Sound quality experiments showed that compression ratios larger than 2 de-graded quality. Longer release times (up to at least 1000 ms) decreased the negativeeffect of compression on sound quality, but did not restore it to the level achieved withlinear amplification. Results from Moore et al. (1999), Van Buuren et al. (1999) andTyler and Kuk (1989) suggest that single-channel compression might be slightly lessdetrimental in fluctuating noise than in stationary noise.
Multi-channel compression
CR≤ 3
Lippmann et al. (1981) CP ( 16, 1 + 1-3 + 1-5, < 6/20-6/32) used two sixteen-channelcompression systems in cafeteria noise (signal-to-noise ratio of +10 dB). Compressionratios were subject and frequency dependent. For CR = 1–3, the measured phonemecorrect scores were slightly worse than for those obtained with linear amplification.
Verschuure et al. (1998) CP ( 2, 1 + 2, 5/15) evaluated compression with overshootreduction in four real-life background noises: restaurant noise, noise of an industrialplant, printing office noise, and city background noise. For restaurant and industrialnoise, speech intelligibility did not differ between compression and linear amplifica-tion. However, for both printing office and city noise, results with compression were
67
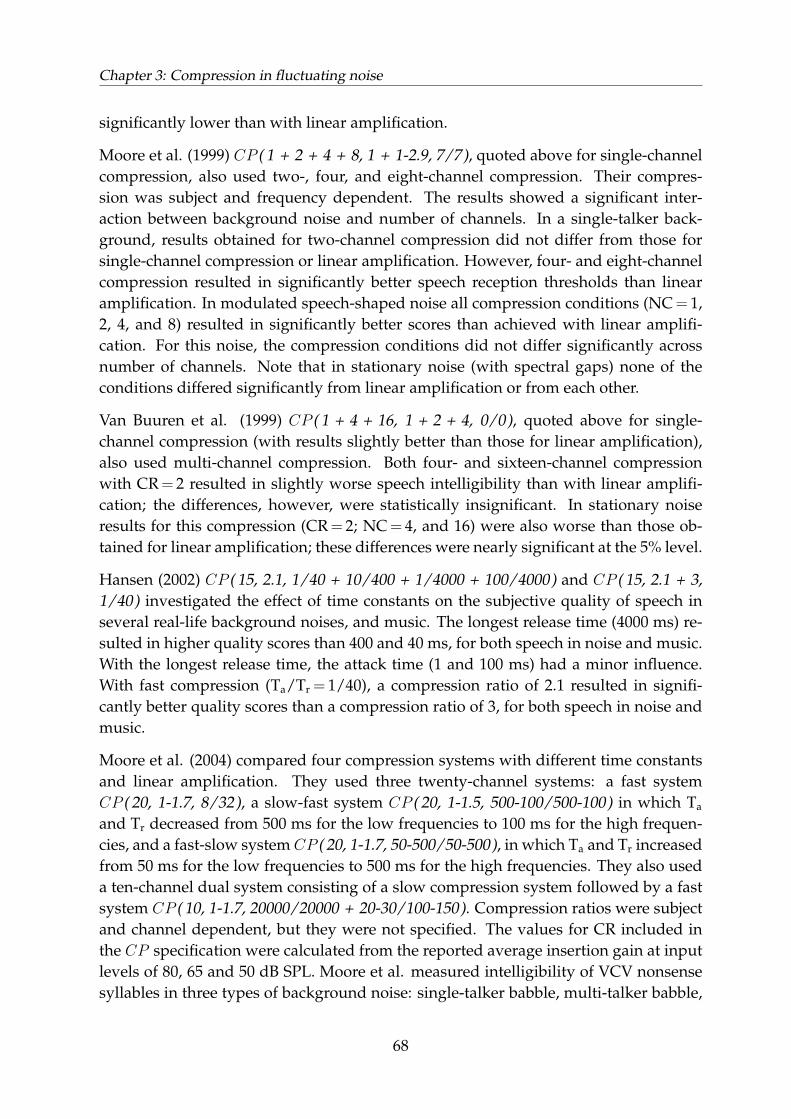
Chapter 3: Compression in fluctuating noise
significantly lower than with linear amplification.
Moore et al. (1999) CP ( 1 + 2 + 4 + 8, 1 + 1-2.9, 7/7), quoted above for single-channelcompression, also used two-, four, and eight-channel compression. Their compres-sion was subject and frequency dependent. The results showed a significant inter-action between background noise and number of channels. In a single-talker back-ground, results obtained for two-channel compression did not differ from those forsingle-channel compression or linear amplification. However, four- and eight-channelcompression resulted in significantly better speech reception thresholds than linearamplification. In modulated speech-shaped noise all compression conditions (NC = 1,2, 4, and 8) resulted in significantly better scores than achieved with linear amplifi-cation. For this noise, the compression conditions did not differ significantly acrossnumber of channels. Note that in stationary noise (with spectral gaps) none of theconditions differed significantly from linear amplification or from each other.
Van Buuren et al. (1999) CP ( 1 + 4 + 16, 1 + 2 + 4, 0/0), quoted above for single-channel compression (with results slightly better than those for linear amplification),also used multi-channel compression. Both four- and sixteen-channel compressionwith CR = 2 resulted in slightly worse speech intelligibility than with linear amplifi-cation; the differences, however, were statistically insignificant. In stationary noiseresults for this compression (CR = 2; NC = 4, and 16) were also worse than those ob-tained for linear amplification; these differences were nearly significant at the 5% level.
Hansen (2002) CP ( 15, 2.1, 1/40 + 10/400 + 1/4000 + 100/4000) and CP ( 15, 2.1 + 3,1/40) investigated the effect of time constants on the subjective quality of speech inseveral real-life background noises, and music. The longest release time (4000 ms) re-sulted in higher quality scores than 400 and 40 ms, for both speech in noise and music.With the longest release time, the attack time (1 and 100 ms) had a minor influence.With fast compression (Ta/Tr = 1/40), a compression ratio of 2.1 resulted in signifi-cantly better quality scores than a compression ratio of 3, for both speech in noise andmusic.
Moore et al. (2004) compared four compression systems with different time constantsand linear amplification. They used three twenty-channel systems: a fast systemCP ( 20, 1-1.7, 8/32), a slow-fast system CP ( 20, 1-1.5, 500-100/500-100) in which Ta
and Tr decreased from 500 ms for the low frequencies to 100 ms for the high frequen-cies, and a fast-slow system CP ( 20, 1-1.7, 50-500/50-500), in which Ta and Tr increasedfrom 50 ms for the low frequencies to 500 ms for the high frequencies. They also useda ten-channel dual system consisting of a slow compression system followed by a fastsystem CP ( 10, 1-1.7, 20000/20000 + 20-30/100-150). Compression ratios were subjectand channel dependent, but they were not specified. The values for CR included inthe CP specification were calculated from the reported average insertion gain at inputlevels of 80, 65 and 50 dB SPL. Moore et al. measured intelligibility of VCV nonsensesyllables in three types of background noise: single-talker babble, multi-talker babble,
68

3.1 Introduction
and cafeteria noise. No significant differences were found between the nonsense syl-lable scores for the four compression systems. Scores obtained for linear amplificationwere significantly better than those for compression.
CR > 3
Lippmann et al. (1981) CP ( 16, 1 + 1-3 + 1-5, < 6/20-32) used a system that was fittedaccording to the pure-tone dynamic range of the subjects. Because this led to compres-sion ratios of up to 5 for the high frequency channels, they also used a fitting with lowercompression ratios (CR = 1–3, quoted above). Both systems resulted in worse scoresthan those for linear amplification, and CR = 1–5 resulted in slightly worse scores thanCR = 1–3.
Van Buuren et al. (1999) CP ( 1 + 4 + 16, 1 + 2 + 4, 0/0), quoted above, used four- andsixteen-channel compression with a compression ratio of 4. They obtained significantlyworse speech reception thresholds for compression than for linear amplification. Instationary noise, results for two these systems (NC = 4 and 16, with CR = 4) were alsosignificantly worse than those obtained for linear amplification.
Humes et al. (1999) CP ( 2, 1 + 1-4, ?/?) used a wearable two-channel compressionsystem with an adaptive release time constant. Compression ratio was subject and fre-quency dependent. Speech was presented at two input levels (60 and 75 dB) and attwo signal-to-noise ratios (+5 and +10 dB) in a multi-talker babble. They used a mono-syllabic word test, a connected speech test, and a test of subjective ease of listening. Ata presentation level of 60 dB, compression gave slightly better results than linear am-plification (for both signal-to-noise ratios). This was found for all three tests, but it wasonly significant for the monosyllabic word test. At 75 dB, results were mixed: with themonosyllabic word test the compression system gave better results (only significantfor a signal-to-noise ratio of +10 dB). For the other two tests, the compression systemgave worse results than the linear system, but this was insignificant.
Novick et al. (2001) CP ( 2, ?, ?/40 + ?/160 + ?/320 + ?/640) used a wearable com-pression system with a directional microphone. Compression ratio was not specifiedbut it was subject and frequency dependent and was fitted according to a proprietaryalgorithm. A hearing-in-noise test in a twelve-talker babble (signal-to-noise ratio of+8 dB) showed no significant effect of release time on speech intelligibility.
Van Toor and Verschuure (2002) CP ( 4, ?, 2/16-64 + 2-16/64-512 + 32-64/1024-2048)compared three wearable, four-channel compression systems. They used a fast, anintermediate, and a slow system. Time constants changed over channels, the highfrequency channels being the fastest. All systems used a short signal delay to re-duce overshoot. Compression was curvilinear, i.e., the compression ratio dependedon the input level. The systems were fitted according to the DSL [i/o] algorithm (Cor-nelisse et al., 1995) with both a flat response, and a fitting with high-frequency em-
69

Chapter 3: Compression in fluctuating noise
phasis. They used three types of noises, stationary speech-shaped noise, fluctuatingspeech-shaped noise, and low-frequency car noise. No significant effect of time con-stants on speech reception threshold was found for both the stationary speech-shapednoise and the low-frequency car noise. Only for fluctuating noise did time constantshave a significant effect. With the flat frequency response the slow system gave sig-nificantly less improvement than the intermediate or fast system. When the data wasaveraged over all noises (including stationary noise) and time constants, compressionwith high-frequency emphasis gave significantly better results than compression witha flat frequency response. A subjective performance test (APHAB, developed by Coxand Alexander (1995) and translated into Dutch) also yielded no consistent preferencesfor any set of time constants.
Humes et al. (2004) CP ( 2, 1 + 2-4, ?/?) compared a wearable compression hearingaid to a linear aid. They tested speech intelligibility in a multi-talker background af-ter 1 month and 6 months acclimatization to the new aids. They also measured usersatisfaction and sound quality. No significant differences were found between the twosystems.
Olsen et al. (2004) CP ( 3, 1 + 2/5 + 5/10, 5-60/11-60 + 100-135/300-400) comparedfour fast-acting compression systems to linear amplification in fully modulated noise.Additionally they used a fifth system with a delay to reduce overshoot. The nominalcompression ratio was 2 or 5. For channels with a hearing loss exceeding 60 dB thecompression ratio was increased to 5 or 10. This occurred (mostly) for frequenciesabove 2000 Hz. The linear system resulted in significantly better speech intelligibilitythan the compression systems.
In summary, for multi-channel compression in fluctuating noise, results were mostlyworse than for linear amplification. Only the experiments of Moore et al. (1999)showed improved speech intelligibility for multi-channel compression. This improvedspeech intelligibility was not found for stationary noise. Previous studies did not re-veal a systematic effect of time constants, number of channels and noise type on speechintelligibility.
3.1.2 Conclusions based on previous research
The available results from previous research do not present a clear picture of the ef-fects of compression in fluctuating noise. Although some research did show improvedspeech intelligibility for amplitude compression relative to linear amplification, moststudies either showed a degradation or no difference. Compression results (relative tolinear amplification) tended to be slightly more favourable in fluctuating noise than instationary noise.
As was the case for stationary noise, for fluctuating noise possible interaction effectsof the compression parameters are still unknown. The current study is intended to in-
70

3.2 Methods
vestigate the effect of compression in fluctuating noise, and possible interaction effects.We therefore conducted a full parametric investigation with respect to the combinationof number of channels, compression ratio and the two time constants.
3.2 MethodsThe present experiment was performed in conjunction with the experiment in station-ary noise. Experimental methods and subjects in this experiment are the same as forstationary noise. Most of the details have been described in Chapter 2. Appropriatevalues of the compression parameters are based on previous research and are chosenidentical to the values for compression in stationary noise (as described in Table 2.2).
All compression conditions were presented with two types of background noise:speech-shaped fluctuating noise (the results of which are presented here) and speech-shaped stationary noise (Chapter 2). Ten subjects selected at random performed theexperiment with stationary noise first and with fluctuating noise second, the other tensubjects vice versa.
Speech materials consisted of Dutch sentence material for a Speech Reception Thresh-old in noise test (SRT test), developed by Versfeld et al. (2000). This material consistedof two sets (a male and a female speaker) of 39 lists of 13 sentences each. For each typeof noise (stationary or fluctuating) each subject was presented with materials from onespeaker only in all conditions.
The fluctuating noise used in this experiment consisted of the long-term averagespeech spectrum (LTASS) of each speaker with the modulations of a single talker. Thisnoise was constructed as follows. For each speaker, fifty sentences were concatenatedand passed through the same six-channel filter bank as used for compressing the stim-uli. From the output of each channel, the speech signal envelope was calculated bymeans of a Hilbert transform. The (six-channel) speech-shaped noise was then multi-plied by these speech envelopes. After multiplication the outputs of the six channelswere summed. This resulted in a single-talker modulated noise with the frequencycontent of the original speech material. Since this six-channel modulated noise mightto some extent be intelligible, we time-reversed this noise to avoid informational mask-ing (Summers and Molis, 2004).
The speech stimuli were embedded in the fluctuating background noise. For eachstimulus the starting point of the fluctuating noise was randomly chosen. The noiseextended from 2 seconds before speech (onset), to 1 second after speech (offset). Thedynamic range of both the original speech and the fluctuating noise was 26 ± 6 dB(the standard deviation was calculated from the dynamic range of all the separate sen-tences; wide band measurements between the 1st and 99th percentile, applying an in-tegration time constant of 125 ms). Within each list, sentence order was randomized.
71

Chapter 3: Compression in fluctuating noise
This was done to minimize possible recognition effects for a repeated list. The set ofsentences per list was fixed because the lists were balanced with respect to intelligibil-ity. For each subject a particular list was used only once or twice.
In order to estimate test-retest variance, measurements were made in duplicate. Dueto time constraints the duplicate measurements were made for only 13 predeterminedconditions. These duplicate conditions were evenly distributed over the experimentconsisting of several (3 to 6) sessions (2nd, 5th, 7th, 10th measurement, etc.). In total, thesame 50 compressive processing conditions as the previous chapter were used. Thefull parametric study consisted of three numbers of channels, four compression ratios,and five sets of time constants. The numbers of channels were 1, 2, and 6 channels(see Table 2.2). The compression ratios (CR = 1, 2, or 3) were divided in two separateratios for low and high frequencies. The cross-over frequency was 1 kHz. Note thatalthough the compression ratio in some channels might be equal, all channels wereindependently compressed. The time constants consisted of 5 combinations of attack(4–40 ms) and release times (4–400 ms), see Table 2.2.
3.3 Results
3.3.1 Learning effect
Using the duplicate measurements, a t-test for dependent samples (paired by condi-tion) showed a significant improvement (0.6 dB) of the retest score relative to the testscore (p < 0.0005). No significant interaction was found between this learning effectand subject (F = 1.0; p = 0.5), or compression condition (NC, CR, or Ta/Tr) (F = 0.7;p = 0.7). Test-retest measurements which occurred in the same session did not differsignificantly from test-retest pairs in two different sessions (F = 1.7; p = 0.2). Regres-sion analysis over all subjects showed that the learning effect depended only on thenumber of previous measurements, irrespective of the sessions involved (+0.023 dBper presentation number, r2 = 0.02, p < 0.05). Figure 3.1 gives the difference betweenthe retest and the test score for all subjects as a function of presentation number. Al-though the learning effect was small, it was significant and therefore a correction wasapplied. The maximum correction was +1.5 dB at the end of the experiment.
The learning effect in fluctuating noise corresponded well to the effect in stationarynoise (see Fig. 2.1). For both background noises the learning effect depended onlyon the number of previously encountered lists/conditions and not on the number ofprevious sessions. The correction for fluctuating noise was slightly larger than forstationary noise (+0.023 and +0,019 dB per presentation number, respectively).
The learning effect did not depend on which noise type was presented first to the sub-jects. Figure 3.2 shows the learning effect for the sequence in which the noise type was
72
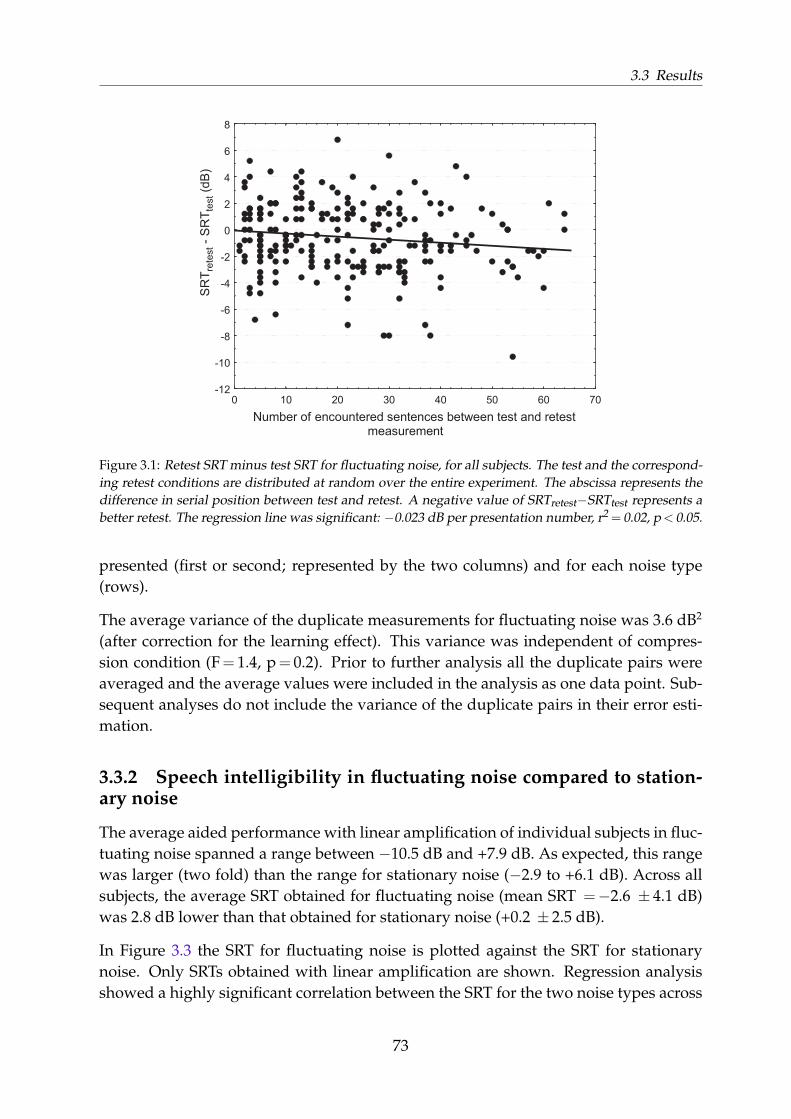
3.3 Results
measurement
0 10 20 30 40 50 60 70Number of encountered sentences between test and retest
-12
-10
-8
-6
-4
-2
0
2
4
6
8
SR
T ret
est-
SR
T tes
t(dB
)
Figure 3.1: Retest SRT minus test SRT for fluctuating noise, for all subjects. The test and the correspond-ing retest conditions are distributed at random over the entire experiment. The abscissa represents thedifference in serial position between test and retest. A negative value of SRTretest−SRTtest represents abetter retest. The regression line was significant: −0.023 dB per presentation number, r2 = 0.02, p < 0.05.
presented (first or second; represented by the two columns) and for each noise type(rows).
The average variance of the duplicate measurements for fluctuating noise was 3.6 dB2
(after correction for the learning effect). This variance was independent of compres-sion condition (F = 1.4, p = 0.2). Prior to further analysis all the duplicate pairs wereaveraged and the average values were included in the analysis as one data point. Sub-sequent analyses do not include the variance of the duplicate pairs in their error esti-mation.
3.3.2 Speech intelligibility in fluctuating noise compared to station-ary noise
The average aided performance with linear amplification of individual subjects in fluc-tuating noise spanned a range between −10.5 dB and +7.9 dB. As expected, this rangewas larger (two fold) than the range for stationary noise (−2.9 to +6.1 dB). Across allsubjects, the average SRT obtained for fluctuating noise (mean SRT =−2.6 ± 4.1 dB)was 2.8 dB lower than that obtained for stationary noise (+0.2 ± 2.5 dB).
In Figure 3.3 the SRT for fluctuating noise is plotted against the SRT for stationarynoise. Only SRTs obtained with linear amplification are shown. Regression analysisshowed a highly significant correlation between the SRT for the two noise types across
73

Chapter 3: Compression in fluctuating noise
Number of encountered sentences between test and retest
SR
Tre
test
- S
RT
test
(dB
) F
luct
uatin
g no
ise
-12-10
-8-6-4-202468
First measurement
Sta
tiona
ry n
oise
-10 0 10 20 30 40 50 60 70-12-10
-8-6-4-202468
Second measurement
-10 0 10 20 30 40 50 60 70
Figure 3.2: Retest SRT minus test SRT for all subjects. The left two graphs show the data for the firstpresented noise type, the right graphs for the second. The upper row represents fluctuating noise, thelower row stationary noise. The test and the corresponding retest conditions are distributed at randomover the entire experiment. The abscissa represents the difference in serial position between test andretest. A negative value of SRTretest−SRTtest represents a better retest. Two (out of four) regression lineswere significant: the first presentation of fluctuating noise (top left) with an average improvement of0.039 dB per presentation number (r2 = 0.04, p < 0.05) and the second presentation of stationary noise(bottom right) with an average improvement of 0.034 dB per presentation number (r2 = 0.06, p < 0.01).
subjects (r2 = 0.67; p = 0.00001). The difference between the two noise types increasedat lower SRTs (i.e., less hearing impairment). In our subjects, the SRT for fluctuatingnoise deteriorated with increasing hearing loss; linear regression analysis showed asignificant correlation between the SRT for fluctuating noise and pure tone averagehearing loss at 0.5, 1, and 2 kHz (r2 = 0.3, p < 0.01). For stationary noise, this trend wasinsignificant (r2 = 0.11; p = 0.15, Fig. 2.2). As stated in the introduction, one of the ra-tionales for using fluctuating noise is the common finding that speech intelligibility innormal-hearing listeners is better in fluctuating noise than in stationary noise, whereassensorineurally hearing-impaired listeners have less benefit from the fluctuations. Fig-ure 3.4 shows the difference between the SRT obtained for both kinds of noise (linearamplification) as a function of the subject’s pure tone average hearing loss across 0.5,1, and 2 kHz (PTA0.5, 1, 2, kHz). The figure shows that the benefit of the fluctuations de-creased with increasing hearing loss.
74

3.3 Results
-12 -10 -8 -6 -4 -2 0 2 4 6 8 10
SRTstat, linear (dB)
-12
-10
-8
-6
-4
-2
0
2
4
6
8
10
SR
T fl
uct,
linea
r (d
B)
1:1
Figure 3.3: SRTs obtained with linear amplification. The abscissa gives the speech reception thresholdsfor speech in stationary noise (SRTstat, linear), the ordinate for speech in fluctuating noise (SRTfluct, linear).The dashed line represents equal SRTs for fluctuating and stationary noise. Each dot shows data for onesubject.
Psychometric function for speech intelligibility in noise
Our psychometric function relates speech intelligibility in noise to the signal-to-noiseratio at which this intelligibility was obtained. Speech intelligibility is measured bythe sentence correct score, which constitutes the ratio of the number of entirely cor-rect responses and the total number of sentences that have been presented at a certainsignal-to-noise ratio.
We did not measure the sentence correct score directly; instead we used an adaptivemeasurement procedure to obtain the speech reception threshold (section 2.2.3). Theadaptive procedure is very efficient for estimating the signal-to-noise ratio at which50% of the sentences were correctly repeated (i.e., the SRT), but is not optimized forestimating the slope of the psychometric function (Brand, 2000). However, our stepsize of 2 dB in combination with the large number of measurements yields a range inthe excursions of the adaptive procedure around the 50% point sufficient for a reliableestimate of the psychometric slope.
The percentage of correct responses was calculated as follows. Data was pooled overdifferent lists and subjects. This was possible because the signal-to-noise ratio for eachsentence was expressed relative to the measured SRT for that list. Consistent withthe adaptive SRT procedure, the data for the first three sentences of each list were
75
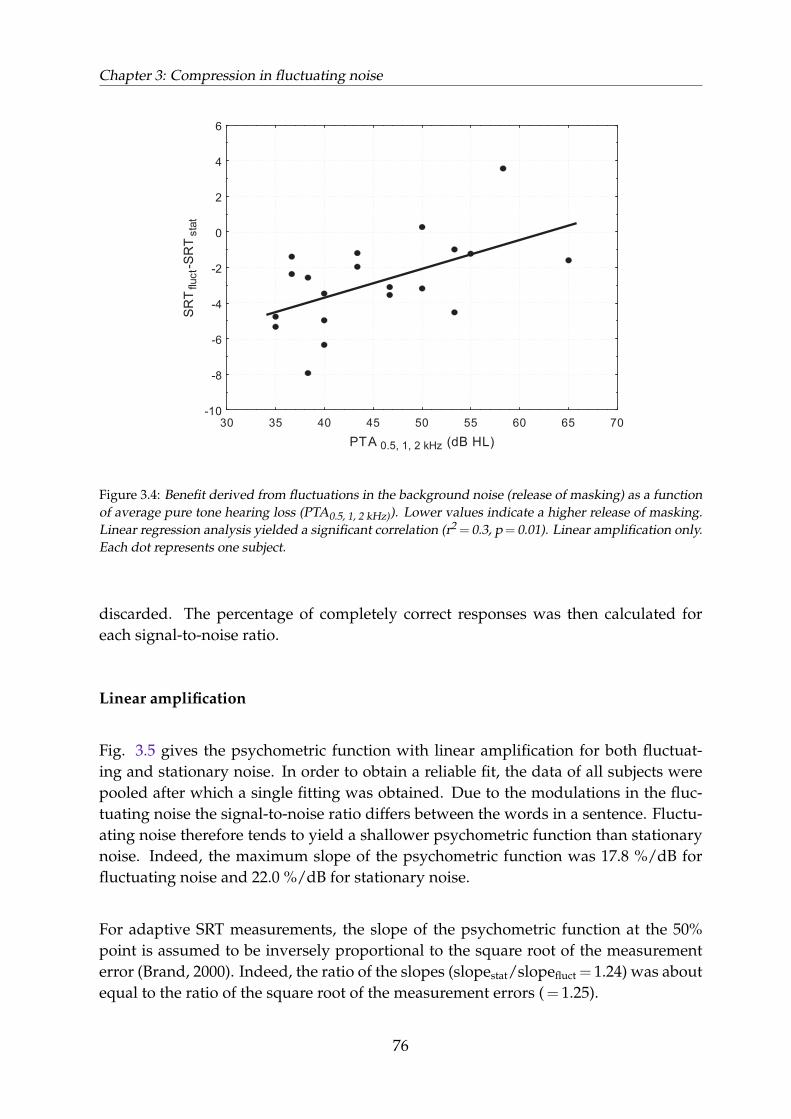
Chapter 3: Compression in fluctuating noise
30 35 40 45 50 55 60 65 70
PTA 0.5, 1, 2 kHz (dB HL)
-10
-8
-6
-4
-2
0
2
4
6
SR
Tflu
ct-S
RT
stat
Figure 3.4: Benefit derived from fluctuations in the background noise (release of masking) as a functionof average pure tone hearing loss (PTA0.5, 1, 2 kHz)). Lower values indicate a higher release of masking.Linear regression analysis yielded a significant correlation (r2 = 0.3, p = 0.01). Linear amplification only.Each dot represents one subject.
discarded. The percentage of completely correct responses was then calculated foreach signal-to-noise ratio.
Linear amplification
Fig. 3.5 gives the psychometric function with linear amplification for both fluctuat-ing and stationary noise. In order to obtain a reliable fit, the data of all subjects werepooled after which a single fitting was obtained. Due to the modulations in the fluc-tuating noise the signal-to-noise ratio differs between the words in a sentence. Fluctu-ating noise therefore tends to yield a shallower psychometric function than stationarynoise. Indeed, the maximum slope of the psychometric function was 17.8 %/dB forfluctuating noise and 22.0 %/dB for stationary noise.
For adaptive SRT measurements, the slope of the psychometric function at the 50%point is assumed to be inversely proportional to the square root of the measurementerror (Brand, 2000). Indeed, the ratio of the slopes (slopestat/slopefluct = 1.24) was aboutequal to the ratio of the square root of the measurement errors ( = 1.25).
76

3.3 Results
-8 -6 -4 -2 0 2 4 6 8
0
10
20
30
40
50
60
70
80
90
100
Signal to noise ratio (dB)
Sen
tenc
e co
rrec
t sco
re (%
)
Stationary noiseFluctuating noise
Figure 3.5: Average discrimination curves for sentences with linear amplification. For each measure-ment the SRT was translated to 0 dB by shifting the data along the abscissa for each sentence accordingto the measured SRT for the corresponding list. A cumulative normal distribution was fitted to thedata: S = 1
2 erf (−(SNR− µ)/σ√
2). In which S is the sentence score and SNR is the signal-to-noiseratio. Both the mean µ and standard deviation σ were estimated according the least squares procedure(µfluct = +0.04; σfluct = 2.2; µstat =−0.05; σstat = 1.8).
Compression
The maximum slope of the psychometric function at the 50% point for compressionconditions (excluding linear amplification) was 16.2 %/dB and 17.8 %/dB for fluctu-ating and stationary noise, respectively. For this calculation data was pooled across allcompression conditions and all subjects. The slope for fluctuating noise decreased lessunder the influence of compression than the slope for stationary noise (1.6 %/dB, and4.2 %/dB, respectively). For compression, the ratio of the slopes of the psychometricfunction (slopestat/slopefluct = 1.1) and the ratio of the square root of the measurementerrors ( = 1.25) were not equal anymore.
3.3.3 Concurrent analysis of single-, two-, and six-channel compres-sion
All SRTs that were measured for compression conditions will be presented relative tothe linear scores (like in Chapter 2). For this purpose, ∆SRT is defined as the SRT for aparticular compression condition minus the SRT for the linear condition found for thatsubject. Thus, negative values of ∆SRT indicate a better speech reception threshold forcompression than for linear amplification.
Single-channel compression does not allow for frequency dependent compression ra-tios, thus CR = 1/2 and CR = 2/3 were not included in this first analysis. A multivari-
77

Chapter 3: Compression in fluctuating noise
ate1 repeated measures analysis of variance was used to analyse ∆SRT. Number ofchannels (3 levels) compression ratios (2 levels) and time constants (5 levels) were alltreated as within subject variables. Table 3.2 shows the results of the analysis.
Table 3.2: Multi-variate repeated measures analysis of variance. Single-channel compression is in-cluded and therefore frequency dependent compression ratios are omitted. (NC = 1, 2, 6; CR = 2/2,3/3; Ta/Tr = 4/4, 4/40, 40/40, 4/400, 40/400).
Effect Degrees Wilks’ Lambda F p-valueof freedom
NC 2 0.65 4.8 < 0.05CR 1 0.96 0.7 0.4T 4 0.62 2.5 0.09NC * CR 2 0.98 0.1 0.9NC * T 8 0.55 1.2 0.4CR * T 4 0.84 0.8 0.6NC * CR * T 8 0.54 1.3 0.3
In Figure 3.6 ∆SRT is given as a function of time constants, CR being the parameterand a separate panel for each number of channels. The ordering of time constants isprimarily based on release time.
Interaction effects did not reach significance (p≥ 0.3). Only the main effectof number of channels was significant. Post-hoc analysis (HSD test) showedthat six-channel compression yielded worse speech intelligibility than single-channel (∆SRTNC = 6 −∆SRTNC = 1 = +0.4 dB, p < 0.05) and two-channel compression(∆SRTNC = 6 −∆SRTNC = 2 = +0.4 dB, p < 0.05). Results for NC = 1 and NC = 2 wereabout equal (∆SRT =−0.1).
Fig. 3.6 shows that CR = 3/3 yielded (insignificantly) higher ∆SRTs than CR = 2/2.For time constants the best results (low ∆SRTs) occurred for Ta/Tr = 40/40. However,this factor was not significant (p = 0.09, Table 3.2). The low ∆SRT for Ta/Tr = 40/40was largely caused by the good results for NC = 1, and 6.
None of the data points in Fig. 3.6 differed significantly from the results obtained withlinear amplification. The best (but statistically insignificant) result was obtained forCP ( 1, 2/2, 40/40): ∆SRT =−0.9± 2.3 dB. Note that for this condition the results withCR = 2/2 and CR = 3/3 are nearly equal, ∆SRT =−0.8 ± 2.4 dB for CP ( 1, 3/3, 40/40).
3.3.4 Analysis with the inclusion of split-frequency compression ra-tios (1/2 and 2/3)
Frequency dependent compression ratios were omitted in the previous analysis be-
1Mauchley’s test of sphericity yielded a significant result on Ta/Tr (p < 0.01). A multivariate analysisis thus required.
78
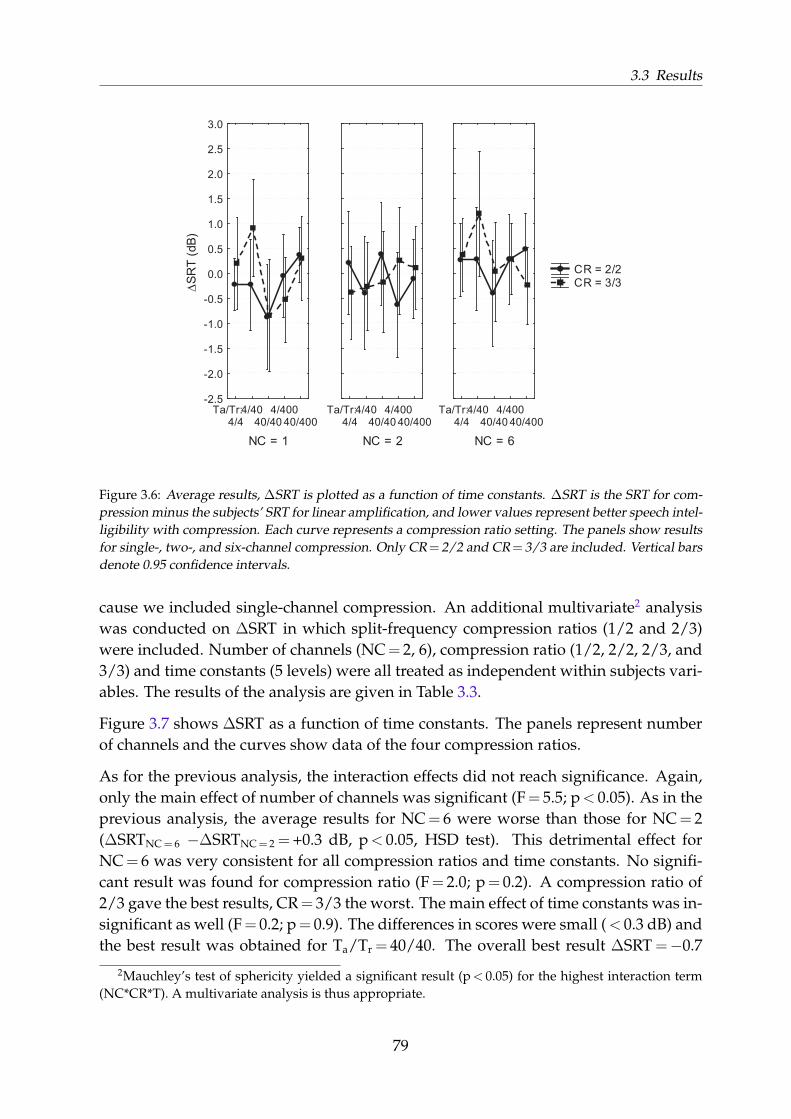
3.3 Results
CR = 2/2 CR = 3/3
NC = 1
Ta/Tr:4/4
4/4040/40
4/40040/400
-2.5
-2.0
-1.5
-1.0
-0.5
0.0
0.5
1.0
1.5
2.0
2.5
3.0
∆SR
T (d
B)
NC = 2
Ta/Tr:4/4
4/4040/40
4/40040/400
NC = 6
Ta/Tr:4/4
4/4040/40
4/40040/400
Figure 3.6: Average results, ∆SRT is plotted as a function of time constants. ∆SRT is the SRT for com-pression minus the subjects’ SRT for linear amplification, and lower values represent better speech intel-ligibility with compression. Each curve represents a compression ratio setting. The panels show resultsfor single-, two-, and six-channel compression. Only CR = 2/2 and CR = 3/3 are included. Vertical barsdenote 0.95 confidence intervals.
cause we included single-channel compression. An additional multivariate2 analysiswas conducted on ∆SRT in which split-frequency compression ratios (1/2 and 2/3)were included. Number of channels (NC = 2, 6), compression ratio (1/2, 2/2, 2/3, and3/3) and time constants (5 levels) were all treated as independent within subjects vari-ables. The results of the analysis are given in Table 3.3.
Figure 3.7 shows ∆SRT as a function of time constants. The panels represent numberof channels and the curves show data of the four compression ratios.
As for the previous analysis, the interaction effects did not reach significance. Again,only the main effect of number of channels was significant (F = 5.5; p < 0.05). As in theprevious analysis, the average results for NC = 6 were worse than those for NC = 2(∆SRTNC = 6 −∆SRTNC = 2 = +0.3 dB, p < 0.05, HSD test). This detrimental effect forNC = 6 was very consistent for all compression ratios and time constants. No signifi-cant result was found for compression ratio (F = 2.0; p = 0.2). A compression ratio of2/3 gave the best results, CR = 3/3 the worst. The main effect of time constants was in-significant as well (F = 0.2; p = 0.9). The differences in scores were small ( < 0.3 dB) andthe best result was obtained for Ta/Tr = 40/40. The overall best result ∆SRT =−0.7
2Mauchley’s test of sphericity yielded a significant result (p < 0.05) for the highest interaction term(NC*CR*T). A multivariate analysis is thus appropriate.
79

Chapter 3: Compression in fluctuating noise
Table 3.3: Multi-variate repeated measures analysis of variance. Split-frequency compression condi-tions were included, and single-channel compression was omitted. NC = 2, 6. CR = 1/2, 2/2, 2/3, 3/3.Ta/Tr = 4/4, 4/40, 40/40, 4/400,40/400.
Effect Degrees Wilks’ Lambda F p-valueof freedom
NC 1 0.77 5.5 < 0.05CR 3 0.74 2.0 0.2T 4 0.95 0.2 0.9NC*CR 3 0.98 0.1 0.9NC*T 4 0.90 0.4 0.8CR*T 12 0.57 0.4 0.9NC*CR*T 12 0.39 1.0 0.5
(± 2.5) dB was obtained for CP ( 2, 2/3, 40/40).
3.3.5 Analysis with attack and release time
In the previous analyses, Ta and Tr were combined. An additional repeated measuresanalysis was conducted on ∆SRT, with both Ta and Tr as independent within variables(Ta = 4, 40 ms; Tr = 40, 400 ms). All compression ratios and number of channels wereincluded. The analysis gave no significant main (Ta or Tr) or interaction (Ta * Tr) ef-fects. Although insignificant, the results indicated that the longest attack time yieldedslightly better ∆SRTs than the shortest one (∆SRTTa = 40ms −∆SRTTa = 4ms =−0.1dB). Incontrast, the longest release time yielded slightly worse results than the shortest one(∆SRTTr = 400ms −∆SRTTr = 40ms = +0.1 dB).
3.4 Discussion
3.4.1 Results for fluctuating noise compared to results for stationarynoise
Release of masking in fluctuating noise
No standard fluctuating noise was available for our speech materials. We thereforeconstructed a fluctuating noise by introducing the modulations of a speaker on sta-tionary speech-shaped noise while reversing the modulations in time to avoid informa-tional masking (section 3.2). In this section we will compare results of our fluctuatingnoise to the results from other research.
For normal-hearing listeners, speech intelligibility is generally better in fluctuatingnoise than in stationary noise with the same long-term energy content. This ’release ofmasking’ is caused by the temporal gaps in the fluctuating noise. During these gaps
80

3.4 Discussion
CR=1/2 CR=2/2 CR=2/3 CR=3/3
NC = 2
Ta/Tr:4/4
4/4040/40
4/40040/400
-2.5
-2.0
-1.5
-1.0
-0.5
0.0
0.5
1.0
1.5
2.0
2.5
3.0
∆SR
T
∆NC = 6
Ta/Tr:4/4
4/4040/40
4/40040/400
Figure 3.7: ∆SRT as a function of time constants (Ta/Tr), compression ratio (CR) and number of chan-nels (NC). ∆SRT is the SRT for compression minus the subjects’ SRT for linear amplification, andlower values represent better speech intelligibility with compression. Split-frequency compression ra-tios (CR = 1/2 and 2/3) have been included, single-channel compression has been omitted. The orderingof Ta/Tr is primarily based on release time. Confidence intervals are omitted for clarity. The average0.95 confidence interval was 1.5 dB.
the noise level is relatively low and this can lead to a momentary high signal-to-noiseratio. The amount of forward masking depends on the duration of the gaps in the noiseand on the temporal acuity of the listener, see section 1.3.3. Less forward masking leadsto a larger release of masking (Festen and Plomp, 1990; Gustafsson and Arlinger, 1994;Bronkhorst and Plomp, 1992; Dubno et al., 2003). The reason that hearing-impaired lis-teners have typically a smaller release of masking than normal-hearing listeners maylay in the fact that sensorineurally hearing-impaired subjects have shown slower re-covery (in dB/ms) from a masker noise, even when audibility effects were taken intoaccount (Nelson and Freyman, 1987), see Fig. 1.6.
In our case, release of masking can be expressed in the difference between the SRTfor fluctuating and for stationary noise. Since release of masking is generally less forhearing-impaired listeners, we expect that the SRT for fluctuating noise and for station-ary noise approach each other for listeners with a larger hearing loss. The data fromFig. 3.3 agrees with our expectation: the difference between SRTfluct and SRTstat waslargest for the lowest SRTs. Correlation analysis indicated that smaller hearing losses(i.e., lower SRTs) tended to show a larger benefit (up to 8 dB) from fluctuations in thebackground noise (see Fig. 3.4). Averaged over all subjects, the results for fluctuatingnoise were 2.8 dB better than for stationary noise.
81

Chapter 3: Compression in fluctuating noise
We will attempt to compare this benefit from fluctuations to results from previouslyperformed experiments. Eisenberg et al. (1995) found for single-channel sinusoidallymodulated noise (with a modulation frequency of 31.5 Hz) a 1.9 dB better SRT than forstationary noise. On average, their subjects had less sensorineural hearing impairmentthan our subjects (PTA0.5, 1, 2 kHz ranged from 25 to 37 dB, with an average of 30 dB; theaverage age was 62 yr).
Festen and Plomp (1990) also used single-channel modulated noise. They used speechmodulations rather than sinusoids. Their subject population had a sensorineural hear-ing loss which was comparable to that of our population (their subjects’ PTA0.5, 1, 2 kHz
ranged from 35 to 58 dB with an average of 47 dB; the average age was 57 yr). Theyfound an average difference in SRT between fluctuating and stationary noise of 1.4 dB.Besides single-channel modulated noise, Festen and Plomp (1990) also used noisewith two-channel speech modulations. For this background they found slightly worsespeech intelligibility (0.5 dB) than for stationary noise. In contrast to the results ofFesten and Plomp, our results indicate a relatively large benefit (on average 2.8 dB)for six-channel modulated noise. This difference is probably caused by differencesin experimental set-up. First, we used frequency dependent amplification, whereastheirs was frequency independent. Our amplification assured a higher audibility ofspeech segments, which might have resulted in a larger release of masking. However,it should be noted that some studies have shown that the effect of audibility is limited,since audibility effects alone are not sufficient to explain the difference in release ofmasking between normal hearing subjects and hearing impaired subjects (Eisenberg etal., 1995; Bacon et al., 1998). Second, our background noise was time-reversed whereasthe fluctuating noise of Festen and Plomp (1990) was not. For speech obtained froma speaker with the opposite-sex of the target speech, Festen and Plomp investigatedthe effect of time-reversal. Surprisingly, they found no difference in SRT between time-reversed speech and regular speech. Additionally, when the interfering time-reversedspeech and the target speech were obtained from the same speaker, they found evenworse speech intelligibility than for stationary noise with the same average long-termfrequency content. Unfortunately they did not investigate this for regular speech orfor many-channel speech modulated noise. Attempting to estimate the effect of time-reversal of background noise on speech intelligibility is difficult. Although the long-term frequency content is the same, regular and time-reversed fluctuating noise clearlydiffer in both temporal and informational content. This might lead to differences inspeech masking. Although the experiment of Festen and Plomp seems to indicate thattime-reversal of speech maskers does not increase the benefit of fluctuations in a back-ground noise, many experiments suggest otherwise. It is generally assumed that thetime-reversal of interfering speech causes an improved release of masking due to lessinformational masking. However, time-reversal might also lead to in increase in for-ward masking due to the asymmetrical shape of the temporal envelope of speech (Rhe-bergen et al., 2005). Summers and Molis (2004) found for moderately sensorineurally
82

3.4 Discussion
hearing impaired listeners (average PTA0.5, 1, 2 kHz = 27 dB) for a (single-talker) speechmasker a (insignificant) benefit of 1.4 dB with respect to stationary noise. They usedthe same speaker for both target and masker. For a time-reversed masker the signifi-cant benefit was 3.3 dB, and was thus 1.9 dB larger than for regular speech. The averagebenefit of 2.8 dB that we measured for six-channel modulated time reversed speech, issomewhat less (0.5 dB) than found by Summers and Molis (2004) for time reversed realspeech. This may be caused by the fact that their subjects were less hearing impaired,and that we used six-channel modulated noise instead of a single competing speaker.Our results lie between the results of Eisenberg et al. (1995), Festen and Plomp (1990)and Summers and Molis (2004).
Measurement error
In spite of the larger range in speech reception thresholds for fluctuating noise, fewerstatistically significant results were obtained for this noise than for stationary noise.Nearly all p- and F-values (Tables 3.2 and 3.3) were smaller than the correspondingvalues obtained for stationary noise (Tables 2.5 and 2.6). This lack of significant dif-ferences could be caused by the larger measurement error for the speech receptionthresholds in fluctuating noise. The average measurement error (both compressionand linear amplification) was 1.9 dB, whereas it was 1.5 dB for stationary noise. Drull-man and Bronkorst (2004) also found a larger measurement error for fluctuating noisethan for stationary noise. They used the same speech materials (Versfeld et al. 2000),combined with fluctuating noise constructed from speech materials from Plomp andMimpen (1979). For our data, the larger error might stem from two sources. First, forfluctuating noise the masking of specific words and syllables depended on the quasi-random occurrence of gaps in the noise. This typically increases the measurementerror (Hagerman, 1997), since the masking of speech segments which attribute muchto speech intelligibility can vary between sentences. Second, nearly all subjects men-tioned that the listening task was much more demanding for fluctuating noise thanfor stationary noise due to the masking of arbitrary speech segments. Although theparticipants were allowed frequent breaks, this might have diminished subjects’ atten-tiveness resulting in a larger measurement error.
The mean square of the effect, MSeffect, which can be seen as a measure of the varianceexplained by the variable under investigation, was for nearly all conditions smaller forfluctuating noise than the corresponding values for stationary noise3. This is supportedby Figures 3.6 and 3.7 which show that, on average, compression parameters did nothave a large influence on speech intelligibility in fluctuating noise. Thus the smallernumber of significant differences originated in a larger measurement error (MSerror) for
3For this comparison, we used MSeffect of a univariate analysis. For multivariate analyses this alsogives an acceptable estimate for MSeffect, with the exception of those effects for which Mauchley’stest of sphericity was significant (T, without split-frequency compression ratios; NC * CR * T, with split-frequency compression ratios).
83

Chapter 3: Compression in fluctuating noise
fluctuating noise, augmented by a smaller MSeffect.
For daily practice a larger measurement error in combination with a smaller effect onintelligibility implies that finding optimal parameter values based on speech intelli-gibility tests will prove to be more elaborate for fluctuating noise than for stationarynoise. However, the (detrimental) effects of compression were smaller for fluctuatingnoise and this implies that it might be less critical to find optimal parameter values forthis noise type.
3.4.2 Effect of compression on speech intelligibility
The effect of compression on speech intelligibility in fluctuating noise is somewhatdisappointing. It was expected that fast-acting compression could increase speech in-telligibility by lifting low level speech elements above the masking level. Althoughcompression did not improve speech intelligibility in fluctuating noise, clear detri-mental effects (as found in stationary noise for some compression parameters) wereabsent. For fluctuating noise, only the effect of number of channels was significant.Compression in six-channels yielded significantly worse speech reception thresholdsthan NC = 1 and NC = 2. This lower speech intelligibility might have originated ina reduction of spectral contrast caused by independent compression in six channels.Single- and two-channel compression resulted in SRTs near those obtained with linearamplification (∆SRT =−0.1 dB for both NC = 1 and NC = 2).
For stationary noise we did not find a detrimental effect for a larger number of chan-nels. There, NC = 1 yielded insignificantly worse results than NC = 2, and significantlyworse results than NC = 6. These results were largely influenced by detrimental effectsfor NC = 1 with short Ta/Tr. It was speculated that fast-acting single-channel compres-sion resulted in detrimental scores because of intermodulation distortion. In contrastto stationary noise, for fluctuating noise speech intelligibility for NC = 1 was not worsethan for NC = 2 and NC = 6. Apparently the ability of fast-acting single-channel com-pression to lift the level of speech during gaps in the noise alleviates possible detri-mental effects of spectral distortion.
Moore et al. (1999) found similar results for a single-talker background. For thisnoise type their experiment resulted in equal speech intelligibility for linear amplifi-cation and fast-acting compression with NC = 1 and NC = 2. For NC = 4 and NC = 8,speech intelligibility was significantly lower. Additionally, they used speech-shapednoise which had the (single-channel) modulations of a single-talker. In contrast tothe single-talker background, for this fluctuating noise no significant difference wasfound between results of fast-acting compression (NC = 1, 2, 4, and 8). Van Buuren etal. (1999) also found comparable results for a single-talker background. For CR = 2no significant differences were found. However, speech intelligibility for fast-actingcompression with NC = 1 was slightly better than for linear amplification. Results forNC = 4, and NC = 6 were worse than for both NC = 1 and linear amplification. For a
84

3.5 Conclusions
higher compression ratio (CR = 4), results for single-channel compression did not dif-fer significantly from results obtained with linear amplification. However, for NC = 4and NC = 16, results were significantly worse.
3.4.3 Best parameter values
The overall best result (∆SRT =−0.9 dB) was achieved with single-channel compres-sion, CP ( 1, 2/2, 40/40). The second best score was only 0.04 dB worse, and wasobtained with a CR of 3/3, CP ( 1, 3/3, 40/40). A difference of ∆SRT =−0.9 dB mayseem small. However, the psychometric function has shown that this corresponds toan increase in sentence score of 15%.
For two-channel compression the best result (∆SRT =−0.7 dB) was obtained for CP ( 2,2/3, 40/40). For stationary noise this setting led to the best overall score (also∆SRT =−0.7 dB). Since the effect of compression on speech intelligibility in fluctu-ating noise was rather limited, and since this setting resulted in good scores for bothfluctuating and stationary noise, one might consider using these parameter values.For six-channel compression, the average results were worse than for single- and two-channel compression. The best result for six-channel compression was obtained forCP ( 6, 1/2, 4/40) and was ∆SRT =−0.5 dB.
3.5 ConclusionsCompression in fluctuating noise did not significantly improve or degrade speech in-telligibility of moderately hearing-impaired subjects. Although multi-channel com-pression is known to reduce spectral and temporal contrasts, the effect on speech in-telligibility in fluctuating noise was limited. This is probably caused by improved au-dibility of otherwise masked weak speech elements.
Only one significant result was obtained: six-channel compression led to significantlyworse speech intelligibility than linear amplification. Contrary to stationary noise, fast-acting compression did not result in detrimental speech intelligibility, and interactioneffects were not significant.
The fact that hardly any significant effect of compression on speech intelligibility wasfound implies that using speech intelligibility in fluctuating noise for finding the bestsetting for an individual can be very tedious. Parameter values which resulted in thebest speech intelligibility for stationary noise yielded good results in fluctuating noiseas well. For two-channel compression, CP ( 2, 2/3, 40/40) resulted in best speech intel-ligibility for both stationary and fluctuating noise. For six-channel compression CP ( 6,2/3, 40/400) resulted in the best score for stationary noise and in a good score forfluctuating noise (∆SRT =−0.4 dB).
85

Chapter 3: Compression in fluctuating noise
86

Results for individual listeners 4
Rolph Houben and Guido F. SmoorenburgSubmitted for publication to Audiology & Neurotology

Chapter 4: Compression for individual subjects
4.1 IntroductionThe previous chapters addressed results averaged over twenty hearing-impaired sub-jects. The resulting group effects are important when comparing the efficacy of differ-ent processing schemes and for the formulation of generic fitting strategies. In clin-ical practice, hearing aids are often fitted based on these generic fitting rules; cur-rent examples are NAL-NL1, FIG6, DSL [i/o], and IHAFF (Dillon, 2001). These fit-ting rules, based on group averages, have the disadvantage that they may not coverinter-individual variation around the average value, which can be relatively large. Forinstance, Crain and Yund (1995) showed that the effect of compression parameters onspeech intelligibility can vary substantially between individual listeners.
It is currently unknown which compression parameters (e.g., number of channels,compression ratio, time constants) yield best speech intelligibility for an individual.Moreover, it is unknown how to predict which individuals might benefit from com-pression over linear amplification, for speech at a comfortable listening level.
This chapter examines the effect of number of channels, compression ratio, and timeconstants on speech intelligibility of individual subjects. We used the experimentaldata of the previous chapters to re-analyse the results for individual listeners.
4.1.1 Previous research reporting individual results of compression
Although most research on compression has been concerned with group results, sev-eral previous papers describe individual results. Table 4.1 lists the papers of which thefindings for individual subjects are described here.
For clarity, we have coded the compression characteristics. The nomenclature is iden-tical to that of the previous chapters (see section 2.1.1 and 3.1.1). Again, three para-meters are given, namely number of channels (NC), compression ratio (CR) and attackand release time (T = Ta/Tr). These three compression parameters (CP ) are indicatedby CP ( NC, CR, Ta/Tr). Linear amplification is indicated by CR = 1. A question markindicates that the parameter values were not specified by the authors. Note that incontrast to the previous chapters, we do not limit this review to research for a specificnoise type (e.g., stationary or fluctuating noise) or for a specified degree of hearing-loss(e.g., moderately hearing-impaired).
As early as 1978, Villchur propagated the presentation of results for individual listeners(Villchur, 1978). He ascribed the lack of clear results of compression experiments inpart to the common practice of averaging results over subjects. According to him, oneshould determine which compression conditions give beneficial or degraded resultsfor an individual, rather than averaging seemingly inconsistent results over severallisteners. Despite Villchur’s remark, most research on compression still presents onlygroup results.
88

4.1 Introduction
Tabl
e4.
1:O
verv
iew
ofpr
evio
usre
sear
chth
atpr
esen
tsre
sult
sfo
rin
divi
dual
liste
ners
.Q=
quie
t,S
=st
atio
nary
nois
e,an
dF
=flu
ctua
ting
nois
e.PT
Aan
dD
Rin
dica
teth
atth
eyus
edpu
re-t
one
audi
omet
ric
thre
shol
dor
dyna
mic
-ran
geba
sed
mea
sure
s.
Pape
rC
ompr
essi
onPa
ram
eter
sN
umbe
rof
PTA
0.5,
1,2
kHz
Back
grou
ndTe
sted
Qua
lity
CP
(NC
,CR
,Ta/
T r)
subj
ects
(dB
HL)
Noi
se*=
sign
ifica
ntav
erag
eor
rang
ePo
siti
veef
fect
ofco
mpr
essi
onde
crea
sed
wit
hhe
arin
glo
ss,o
rN
egat
ive
effe
ctof
com
pres
sion
incr
ease
dw
ith
hear
ing
loss
:Ve
rsch
uure
etal
.199
3C
P(1
,1+
2+
4+
8,10
/22
)18
15–>
50Q
sylla
ble
corr
ects
core
Yund
and
Buck
les
1995
aC
P(8
,1+
1-7,
4/4
)16
20–5
3S
PTA
Ols
enet
al.2
004
CP
(3,1
+2/
5+
5/10
,5-6
0/11
-60
+10
0-13
5/30
0-40
0)
2016
–54
FPT
A*
+SR
Tst
at*
+re
leas
eof
mas
king
Vers
chuu
reet
al.1
998
CP
(2,1
+2,
5/15
)10
47–7
2S
PTA
*N
egat
ive
effe
ctof
com
pres
sion
decr
ease
dw
ith
hear
ing
loss
(pos
itiv
efo
rla
rge
loss
):M
oore
etal
.199
2C
P(2
,1-3
,1/5
0-10
0)
2028
–62
FD
R*
Ston
eet
al.1
997
CP
(2,1
+2,
2/20
)12
33–6
7S
DR
*Ef
fect
ofco
mpr
essi
onno
tdep
ende
nton
hear
ing
loss
:St
one
etal
.199
7C
P(2
,1+
2,2/
20)
1233
–67
FD
RN
abel
ek19
83C
P(3
,1+
?,?/
?)10
25–7
3S
DR
+PT
AC
P(1
,1+
2.5,
1/10
+1/3
0+3/
30+3
/90+
10/9
0+42
/370
)9
25–7
3S
spee
chsc
ores
+D
R+
PTA
CP
(1,2
.5+
5+
10,1
/30
)9
25–7
3S
spee
chsc
ores
+D
R+
PTA
Neu
man
etal
.199
4C
P(1
,1+
1.5
+2
+3
+5
+10
,5/2
00)
10/1
032
–85/
42–7
0S
+F
DR
spee
chN
eum
anet
al.1
995
CP
(1,1
.5+
2+
3,5/
60+
5/20
0+
5/10
00)
2037
–85
S+
FD
Rsp
eech
+PT
A+
age
Cra
inan
dYu
nd19
95C
P(2
+4
+8
+16
+31
,1-9
,4/4
)9
42–6
8Q
-D
rullm
anan
dSm
oore
nbur
g19
97C
P(6
,1+
2+
3+
5,0/
0)
1690
–115
QD
RH
umes
etal
.199
7C
P(1
,1+
1∞,?
/?)
41/5
3/16
33/4
4/62
Fun
aide
dsp
eech
scor
eD
illon
etal
.199
8C
P(1
,2,?
)14
08–
75PT
A+
age
Vers
chuu
reet
al.1
998
CP
(2,1
+2,
5/15
)10
12–4
2F
+S
PTA
CP
(2,1
+2,
5/15
)10
47–7
2F
PTA
Moo
reet
al.1
999
CP
(1+
2+
4+
8,1
+1-
2.9,
7/7
)18
19–5
3S
+F
PTA
Fran
cket
al.1
999
CP
(1,2
,5/1
5)a
ndC
P(8
,2,0
.5/1
0)
826
–78
Q+
S+
FPT
A+
DR
+sl
ope
ofau
dito
ryfil
ter*
Goe
dege
bure
etal
.200
1C
P(1
,1+
2+
4,5/
5)
1413
–60
Q+
FPT
A+
DR
+U
CL
+lo
udne
ssgr
owth
Souz
aan
dK
itch
2001
CP
(1+
2+
3+
4,1
+2
+5,
3/25
)16
43Q
age
Van
Toor
and
Vers
chuu
re20
02C
P(4
,?,2
/16-
2/64
+2-
16/6
4-51
2+
32-6
4/10
24-2
048
)38
18–7
0S
+F
PTA
Shan
kset
al.2
002
CP
(1,1
-2.7
,1/7
0)
356
unkn
own
FPT
A(r
esul
tsdu
eto
incr
ease
dau
dibi
lity)
89

Chapter 4: Compression for individual subjects
Nabelek (1983) CP ( 3, 1 + ?, ?/?) used ten subjects to compare compression to lin-ear amplification. For a group of seven subjects with a small dynamic range (aver-age DR0.5, 1, 2 kHz = 13 dB) he found better speech intelligibility for multi-channel com-pression than for linear amplification. For a group of three subjects with a larger dy-namic range (average DR0.5, 1, 2 kHz = 42 dB) compression generally resulted in worsescores than linear amplification did. However, he found no significant correlation be-tween benefit of compression and dynamic range (DR0.5, 1, 2 kHz ranged from 7 to 49 dB).Note that stationary noise was added after compression (not simulating normal con-ditions where the combined signal of speech plus noise is compressed) and that thecompression ratios were subject and frequency dependent. Nabelek also investigatedthe effect of single-channel compression with different time constants CP ( 1, 1 + 2.5,1/10 + 1/30 + 3/30 + 3/90 + 10/90 + 42/370) and with different compression ratiosCP ( 1, 2.5 + 5 + 10, 1/30) for nine subjects. (Again the noise was added after com-pression.) He performed a correlation analysis between the benefit of compression(scores with compression minus scores for linear amplification) and the speech intel-ligibility scores without compression (linear amplification), PTA0.5, 1, 2 kHz, the slope ofPTA between PTA1 kHz and PTA4 kHz, DR1 kHz, and DR4 kHz. He found no significantcorrelations.
Moore et al. (1992) CP ( 2, 1-3, 1/50-100) compared speech intelligibility of twentymoderately hearing-impaired listeners (PTA0.5, 1, 2 kHz = 28–62 dB HL) with compres-sion to that with linear amplification. The experiments were performed in a twelve-talker babble. They found only weak correlations between the effect of compressionand several audiometric parameters (for instance DR0.5, 1, 2, 4 kHz and various other com-binations of DR for these frequencies; the slope of the loudness growth function atthe same frequencies and at various combinations, and dynamic range of hearing forspeech). The highest correlation (r = 0.48, p < 0.05) was found for DR2, 4 kHz. This corre-lation showed that the largest benefit of compression was obtained for subjects with thesmallest dynamic range. Their Figure 8 indicates that DR2, 4 kHz ≈ 20 dB correspondedto an improvement in speech reception threshold in noise of roughly 1.5 dB.
Verschuure et al. (1993) CP ( 1, 1 + 2 + 4 + 8, 10/22) measured speech intelligibilityfor 18 moderately to severely hearing-impaired listeners in quiet (PTA0.5, 1, 2 kHz rangedfrom about 15 to more than 50 dB HL). Their system used a delay to reduce overshoot(see section 1.7.4). Subjects were divided into three groups based on their syllablecorrect score for linear amplification: above 85%, between 85 and 75%, and below75%. The corresponding hearing losses (PTA) were not reported. Verschuure et al.found a trend in that the average benefit of compression was higher for the groupof seven subjects who achieved a high syllable correct score ( > 85%). For the othertwo groups compression tended to result in no difference or even in a deterioration ofspeech intelligibility.
Neuman et al. (1994) CP ( 1, 1 + 1.5 + 2 + 3 + 5 + 10, 5/200) did not find any sig-
90

4.1 Introduction
nificant correlations between the preferred compression ratio in several noise typesand the dynamic range of hearing (DRspeech, defined as the uncomfortable level ofbroadband speech minus the speech reception threshold in quiet). Yet, for two low-level noises (ventilation and apartment noise), subjects with a small dynamic rangeof hearing (group of 10 subjects, DRspeech < 30 dB, PTA0.5, 1, 2 kHz = 42-70 dB HL) pre-ferred compression over linear amplification more often than chance would predict.For cafeteria noise (their only noise with a presentation level that was always abovethe compression threshold) and for subjects with a dynamic range > 30 dB (10 sub-jects, PTA0.5, 1, 2 kHz = 32–85 dB HL), the preference of compression over linear amplifi-cation was at chance level for all three noise types. Only one subject out of 20 (DRspeech
was unspecified) showed a significant preference for compression over linear amplifi-cation, and only for CR = 1.5. These findings led Neuman et al. to the conclusion thatfor slowly-acting compression, a compression ratio of about 1.5 to 2 is appropriate, es-pecially for persons with a small dynamic range, and that it is not necessary to use anindividual selection of compression ratios. Note that the available data suggests thatfor situations other than relative quiet, or for subjects with a DRspeech > 30 dB, linearamplification might be suitable as well.
In a subsequent experiment, Neuman et al. (1995) CP ( 1, 1.5 + 2 + 3,5/60 + 5/200 + 5/1000) investigated the effect of release time on sound quality in bothstationary and fluctuating noise. The dynamic range (DRspeech) of the twenty subjectsspanned a range of 22 dB to 63 dB (and PTA0.5, 1, 2 kHz ranged from 37 to 85 dB HL).The results showed several significant differences in the preference for release time.Some subjects consistently preferred long release times, while others preferred shorttimes. For some, the preferred release time changed with compression ratio or noisetype. However, again no significant correlations between the individual preferencesand several audiometric characteristics (DRspeech, PTAunspecified, shape of the audiogram,age) were observed.
Crain and Yund (1995) CP ( 2 + 4 + 8 + 16 + 31, 1-9, 4/4) conducted a regressionanalysis between consonant discrimination score in quiet and the number of compres-sion channels. Their subjects had a PTA0.5, 1, 2 kHz of 42 to 68 dB HL. Crain and Yundfound a trend in that for about half of the nine subjects the scores improved with in-creasing number of channels. For the other half the scores decreased. However, thesetrends were statistically significant for two subjects only (one leading to an improve-ment of the scores with the number of channels, the other to a degradation).
Yund and Buckles (1995a) CP ( 8, 1 + 1-7, 4/4) compared results for compression tothose obtained for linear amplification. The compression system was fitted accord-ing to the frequency-dependent dynamic range of their sixteen subjects (PTA0.5, 1, 2 kHz
ranged from 20 to 53 dB HL). Benefit of multi-channel compression in stationary noisedecreased for increasing PTA0.5, 1, 2, 4 kHz, and thus, implicitly with decreasing dynamicrange. However, the correlation was insignificant (r2 = 0.16, p = 0.12).
91

Chapter 4: Compression for individual subjects
Drullman and Smoorenburg (1997) CP ( 6, 1 + 2 + 3 + 5, 0/0) measured the effect ofcompression on speech intelligibility of audiovisual stimuli in quiet for sixteen pro-foundly hearing-impaired subjects (PTA0.5, 1, 2 kHz ranged from 90 to 115 dB HL, esti-mated from their Fig. 2). They found no significant correlations between dynamicrange of hearing (DR0.125, 0.25, 0.5 kHz and DR1, 2, 4 kHz) and benefit of compression for dif-ferent compression ratios.
Humes et al. (1997) CP ( 1, 1 + 1∞, ?/?) used an amplification system in which the bassresponse was increased for low input levels (BILL). The experiments were conductedin both cafeteria noise and multi-talker babble. The subjects were divided into threegroups with an average PTA0.5, 1,2 of 33, 44, and 62 dB HL, consisting of 41, 53, and16 subjects, respectively (data was obtained from their Fig. 1). Group data showedonly small differences between the effect of compression and linear amplification. Nosignificant correlation was observed between effect of compression and the unaidedscores.
Stone et al. (1997) used a two-channel system CP ( 2, 1 + 2, 2/20) of which the high fre-quency channel consisted of a fast-acting compressor, and the low frequency channelconsisted of a linear amplifier. This system was preceded by a dual compression sys-tem that kept the overall signal level constant. The dual system consisted of a slowly-acting single-channel compressor (Ta = 330 ms, hold-off = 560 ms during which thegain was unchanged, Tr = 1000 ms) that was followed by a fast-acting single-channelcompressor (Ta = 3 ms, Tr = 80ms). The PTA0.5, 1, 2 kHz of the twelve subjects ranged be-tween 33 and 67 dB HL, and the DR2, 4 kHz between 20 and 65 dB. For a single-talkerbackground Stone et al. found no significant correlation between the effect of com-pression and DR2, 4 kHz. However, for stationary noise the correlation was significant,although small (r2 = 0.15, p < 0.05). The negative effect of compression tended to in-crease with dynamic range.
Dillon et al. (1998) CP ( 1, 2, ? ) compared the preference of listeners for a low compres-sion threshold (46 dB SPL) to that for a high threshold (56 dB SPL). Their 140 subjectshad a PTA0.5, 1, 2 kHz between 8 and 75 dB HL. Dillon et al. found no significant correla-tion between the preference scores and audiometric characteristics (PTA0.5, 1, 2 kHz, slopeof hearing thresholds, age, years of hearing aid use).
Verschuure et al. (1998) CP ( 2, 1 + 2, 5/15) evaluated compression with overshoot re-duction (identical to Verschuure et al., 1993) in four real-life background noises: restau-rant noise, industrial noise, printing-office noise, and city background noise. Theymeasured speech intelligibility of CVC words for two groups of subjects: moderatelyhearing impaired (10 subjects with PTA0.5, 1, 2 kHz between 12 to 42 dB HL, estimatedfrom their Fig. 6), and severely hearing impaired (10 subjects with PTA0.5, 1, 2 kHz be-tween 47 and 72 dB HL, estimated from their Fig. 8). The only significant correlationbetween the effect of compression and hearing threshold was found for the severelyhearing-impaired subjects and industrial noise. For this group and noise type, there
92

4.1 Introduction
was a negative effect of compression that correlated with PTA0.5, 1, 2 kHz (r2 = 0.56). Theindustrial noise had a flat frequency spectrum and it was the most steady of the noisesused (in Table 4.1 it is classified as stationary noise).
Moore et al. (1999) CP ( 1 + 2 + 4 + 8, 1 + 1-2.9, 7/7) compared the effect of thenumber of channels on speech intelligibility (SRT) in both stationary and fluctuatingnoise for 18 elderly subjects (PTA0.5, 1, 2 kHz = 19–53 dB HL). Their system used a de-lay to reduce overshoot. They found no significant correlation between effect of com-pression and threshold of hearing (PTA0.5, 1, 2, 4 kHz, ranging from 25 to 58 dB HL; andPTA2, 3, 4, 5 kHz, ranging from 42 to 76 dB) of the individual subjects. Moore et al. didnot report correlation analyses between benefit of compression and dynamic range ofhearing.
Franck et al. (1999) CP ( 1, 2, 5/15) and CP ( 8, 2, 0.5/10) applied compression onspeech materials that had been spectrally enhanced. Both the single-channel and themulti-channel system used a delay to reduce overshoot. The experiment included eightyoung subjects with PTA0.5, 1, 2 kHz ranging from 26 to 78 dB HL (estimated from theirFig. 1), and DR0.5, 1, 2 kHz ranging from 22 to 51 dB. Franck et al. found no significant cor-relation between audiometric data (threshold at several frequencies, dynamic range atseveral frequencies, auditory filter width at 0.5 and 3 kHz) and the effect of compres-sion on speech intelligibility of the spectrally enhanced materials. They also performedan analysis based on the slopes of the auditory filters (at 0.5 and 3 kHz), and foundthat the low-frequency skirt at 3 kHz was significantly related to the effect of single-channel compression. The benefit of compression was higher for subjects with a steeplow-frequency filter slope at 3 kHz.
Goedegebure et al. (2001) CP ( 1, 1 + 2 + 4, 5/5) used a compression system in quietand in restaurant noise. The system used overshoot reduction similar to the systemof Verschuure et al. (1993). The fourteen subjects were moderately to severely hear-ing impaired, PTA0.5, 1, 2 kHz ranged from 13 to 60 dB HL, estimated from their Fig. 5.Goedegebure et al. measured the effect of compression ratio on phoneme intelligibility.They investigated the relation between the effect of compression ratio and audiomet-ric characteristics. In the analysis they used PTA2, 4 kHz, low-high frequency contrast,slope of the thresholds, DR2, 4 kHz, UCL2, 4 kHz, and slope of the loudness growth func-tion averaged over 2 and 4 kHz. All correlations were insignificant. Besides the abovedescribed compression system, they used a second system with the same compressionparameters but in which the control signal was filtered to emphasize compression forthe high frequencies. In quiet, listeners with a large dynamic range (DR2, 4 kHz between30 to 50 dB) tended to have some benefit from compression, whereas listeners with asmall dynamic range (DR2, 4 kHz < 25 dB) only had worse phoneme intelligibility withcompression. In the restaurant background noise, this trend was not present.
Souza and Kitch (2001) CP ( 1 + 2 + 3 + 4, 1 + 2 + 5, 3/25) used compression on aspeech signal of which spectral information was removed (resulting in a flat spectrum)
93

Chapter 4: Compression for individual subjects
by randomly assigning a negative or positive sign to the waveform samples. Thisprocedure leaves the envelope of the speech intact. The moderately hearing-impairedsubjects were divided into two age groups. One group consisted of 7 young subjects(18 to 34 yr), the other of 9 aged subjects (71 to 95 yr). The thresholds of hearing forboth age groups were roughly equal: the average PTA0.5, 1, 2 kHz was 43 dB HL for bothage groups (estimate obtained from their Fig. 1.). For all conditions (compression andlinear amplification) the elderly had a significantly lower sentence recognition in quietthan the younger ones. All speech intelligibility scores decreased with increasing com-pression ratio, but the difference between the two age groups remained constant. Thisstrongly suggested that the effect of compression ratio on speech intelligibility doesnot depend on age.
Van Toor and Verschuure (2002) CP ( 4, ?, 2/16-2/64 + 2-16/64-512 + 32-64/1024-2048) did not find any significant correlation between individually favoured time con-stants and the degree or steepness of the hearing loss of their subjects. The 38 subjectshad a PTA0.5, 1, 2 kHz between 18 and 70 dB HL (obtained from their Fig. 3). The experi-ments included both stationary and fluctuating noise.
Shanks et al. (2002) CP ( 1, 1-2.7, 1/70) compared the effect of single-channel compres-sion on speech intelligibility to the effect of linear amplification. They analysed theobtained data separately for four groups of subjects with a different hearing loss. Theyused speech in fluctuating noise at three signal-to-noise ratios (−3, 0, and +3 dB) and atthree levels (52, 62, and 74 dB SPL). Nearly all significant differences occurred for thelowest presentation level (52 dB SPL) and can be attributed to an increased audibilityof speech due to more amplification for the compression condition than for the linearone. For the first group, consisting of 62 subjects with a large and sloping hearing loss(PTA0.5, 1, 2 kHz > 40 dB HL and slope0.5–4 kHz > 10 dB/octave), speech intelligibility wasbetter for compression than for linear amplification.For the second group, consisting of 54 subjects with a small and flat hearing loss(PTA0.5, 1, 2 kHz < 40 dB HL and slope0.5–4 kHz < 10 dB/octave), speech intelligibility wasworse for compression than for linear amplification.The third and fourth group consisted of 149 subjects with a small and sloping loss, andof 91 subjects with a large and flat loss, respectively. For these two groups, by and largeno significant results were found.
Olsen et al. (2004) CP ( 3, 1 + 2/5 + 5/10, 5-60/11-60 + 100-135/300-400) investigatedthe benefit from four fast-acting compression systems in relation to audiometric fac-tors. Two systems used CR = 2 for the channels in which the hearing loss was lessthan 60 dB HL, and CR = 5 for hearing loss exceeding 60 dB HL. The other twosystems used CR = 5, and CR = 10, respectively. The experiments were conductedwith twenty moderately hearing-impaired subjects (PTA0.5, 1, 2 kHz ranged from 16 to54 dB HL, obtained from their Fig. 1) in fully modulated noise (Hagerman, 2002). Forlinear amplification, they also measured speech intelligibility in slightly modulated
94

4.1 Introduction
noise: SRTslight, linear (Hagerman, 2002). In fully modulated noise, only about 30% of thelisteners showed better speech intelligibility with fast-acting compression than withlinear amplification. Correlation analysis showed that the negative effect of compres-sion increased significantly for subjects with a worse SRTslight, linear (r2 = 0.4, p < 0.01).Subjects with a good SRTslight, linear obtained benefit from compression (correlation sug-gested a benefit of 1 dB for subjects with a SRTslight, linear of about −8 dB). Olsen etal. also investigated the correlation between effect of compression and threshold datasuch as PTA0.5, 1, 2 kHz, PTA2, 3, 4 kHz, PTA3, 4, 6 kHz, slope of the thresholds: PTA2, 3, 4 kHz mi-nus threshold at 0.5 kHz. Of these measures, PTA2, 3, 4 kHz and PTA3, 4, 6 kHz correlatedslightly (r2 < 0.26) with the effect of compression. Correlation between the effect ofcompression and release of masking (i.e. the difference in score (SRTlinear) betweenfully and slightly modulated noise) showed no significant correlation. However, whenonly those subjects were selected that had improved speech intelligibility with com-pression (6 out of 20 subjects), the negative correlation between benefit of compressionand release of masking became nearly significant (r2 = 0.18, p = 0.07).
4.1.2 Conclusions based on previous research
Research on compression that reports significant results for individual subjects is rela-tively scarce, see Table 4.1.
Most research showed no significant correlation between the effect of compression andaudiometric characteristics. Some papers describe a decrease of the positive effect ofcompression with hearing loss (Verschuure et al., 1993; Yund and Buckles, 1995a; Olsenet al. 2004) and some papers a decrease of the negative effect with hearing loss (Mooreet al., 1992; Stone et al., 1997).
Neuman et al. (1994) found that subjects with a small dynamic range preferred com-pression ratios of 1.5 to 2 with slowly-acting compression. They concluded that indi-vidual selection of compression ratio was not necessary. Neuman et al. (1995) foundthat several subjects had a significant preference for a certain release time. However,they found no significant correlation between this preference and audiometric charac-teristics.
In conclusion, this extensive review shows that it is not clear which subjects would ben-efit most from compression. This however, does not negate the value of compressionfor hearing aids: the experiments were performed in situations in which the audibilityof the stimuli was guaranteed for both compression and linear amplification. It is clearthat compression can be very useful in situations where speech would not have beenaudible without compression (Dillon, 1996). Unfortunately, the present review showsthat we can not predict which compression characteristics will ensure optimal speechintelligibility at comfortable input levels. In view of the inconclusive results from theliterature quoted above we performed additional analyses on our data of which the
95

Chapter 4: Compression for individual subjects
average results were reported in the previous chapters.
4.2 Results
4.2.1 Learning effect
The previous analyses (Chapters 2 and 3) showed a small average learning effect forboth stationary (SRTretest – SRTtest =−0.5 dB, p < 0.001) and fluctuating noise (SRTretest –SRTtest =−0.6 dB, p < 0.0005). In Chapters 2 and 3 a correction for this effect was ap-plied based on regression analysis. An analysis for each subject individually showedthat the learning effect was insignificant in all subjects. Moreover, the overall learningeffect did not correlate significantly with hearing loss or age. Therefore, the correctionfrom Chapters 2 and 3 was applied again, here.
4.2.2 Correlation of hearing loss with age
Hearing thresholds and dynamic range did not correlate significantly with age. Weconducted an analysis for several combinations of pure tone average hearing loss(e.g., PTA0.5, 1, 2 kHz, PTA1, 2, 4 kHz, PTA2, 4 kHz, PTA2, 4, 8 kHz, etc.) and dynamic range (e.g.,DR0.5, 1, 2 kHz, DR1, 2, 4 kHz, DR2, 4 kHz, DR4 kHz, DR2, 4, 8 kHz, DR2, 4, 8 kHz–DR0.25, 0.5, 1 kHz, etc.).The age of our subjects ranged from 41 to 83 year (Table 2.3). Speech intelligibil-ity (50%-point) of consonant-vowel-consonant (CVC) words presented in quiet alsoshowed no significant correlation with age. This finding was probably caused by theetiology of the subjects included. Only four subjects had a hearing loss that originatedfrom aging, while the hearing loss of the other subjects was unknown or was ascribedto other factors (e.g., excessive noise exposure, heriditary hearing loss), see Table 2.2.1.
The speech reception threshold for both noise types (SRTstat, linear and SRTfluct, linear)tended to increase with age. For stationary noise the correlation was insignificant(r2 = 0.1, p = 0.15), and for fluctuating noise it was just significant (r2 = 0.2, p < 0.05).
4.2.3 Response errors
The place in the sentence where most errors were made might reveal individual dif-ferences in listening strategy or it might reveal an effect of compression on speechintelligibility. Our experimental design allowed for the recording of the location of in-correctly reproduced syllables. Figure 4.1 shows the total number of errors for eachlocation in a sentence, pooled over all experimental conditions and all subjects1. The
1Results for sentences consisting of 8 or 9 syllables are shown only. Together these two sentencelengths account for 98% of the measured errors. The remaining stimuli (consisting of sentences with 6,7, or 10 syllables) all showed the same trend.
96

4.2 Results
figure clearly shows that the number of errors increased towards the end of the sen-tences. This trend was very robust and was present for all but one subject (s10). More-over, different conditions (including linear amplification) all resulted in a comparableincrease in errors over the length of a sentence. This indicates that increase of errorstowards the end of the sentences is probably not related to listening strategy or signalprocessing.
1 5 90
500
1000
1500
2000
2500
3000
3500
Syllable postition in sentence
Num
bero
f erro
rs
8 syllables9 syllables
1 5 90
500
1000
1500
2000
2500
3000
3500
Syllable postition in sentence
Num
bero
f erro
rs
8 syllables9 syllables
(a) Stationary Noise
1 5 90
500
1000
1500
2000
2500
3000
3500
Syllable postition in sentence
Num
bero
f erro
rs8 syllables9 syllables
1 5 90
500
1000
1500
2000
2500
3000
3500
Syllable postition in sentence
Num
bero
f erro
rs8 syllables9 syllables
(b) Fluctuating Noise
Figure 4.1: Error distribution within the stimuli. The bars give the number of errors (all subjects, allmeasurement conditions) which occurred at the corresponding syllable position within the sentence.Data is shown for sentences consisting of eight and nine syllables only.
Figure 4.2(a) shows the average rms amplitude of the unprocessed speech materialsas a function of time. The figure is analogous to Fig. 4 of Versfeld et al. (2000). Itshows a large decrease in rms amplitude (dB) with time. The rms amplitude of thestationary noise (not shown in Fig. 4.2) was constant. For SRT measurements, thisresults in a decreasing signal-to-noise ratio during a sentence. This seems to explainthe increase of errors towards the end of the stimuli2. In contrast to stationary noise, theamplitude of our fluctuating noise was not constant because the fluctuating noise wasconstructed from the concatenated envelopes of the original speech material (Chapter3). However, the noise segments were always chosen at random, which ensured thatthe level variations were not synchronized with the speech.
In Figure 4.2(a) the average amplitude beyond 1.2 second is biased due to differences
2The adaptive measurement procedure only distinguished between entirely correct sentences and in-correct sentences. If a single mistake was made, the entire sentence was classified as incorrect. This im-plies that the last few syllables (which have the lowest signal-to-noise ratio) predominantly determinedthe score of the entire sentence. In other words, the sentence-based SRT shifted towards a word-basedSRT. One might consider correcting this phenomenon by equalizing the signal level prior to addingnoise. However, natural speech also shows a decline towards the end of the sentence. If an estimate ofreal-life speech intelligibility is required, this level decline might actually be desirable.
97

Chapter 4: Compression for individual subjects
0 0.5 1 1.5 2-45
-40
-35
-30
-25
-20
-15
Time (s)
rms
ampl
itude
(dB)
FemaleMale
0 0.5 1 1.5 2-45
-40
-35
-30
-25
-20
-15
Time (s)
rmsa
mpl
itude
(dB)
FemaleMale
(a) Original data
0 20 40 60 80 100-45
-40
-35
-30
-25
-20
-15
Relative Time (%)
rms
ampl
itude
(dB
)
FemaleMale
0 0.5 1 1.5 2-45
-40
-35
-30
-25
-20
-15
Time (s)
rms
ampl
itude
(dB)
FemaleMale
0 0.5 1 1.5 2-45
-40
-35
-30
-25
-20
-15
Time (s)
rmsa
mpl
itude
(dB)
FemaleMale
(b) Normalized sentence length
Figure 4.2: Mean rms amplitude of the unprocessed speech materials as a function of time. The leftpanel shows the original data, the right panel the data after the length of each sentence was normalized.All sentences were linearly scaled to obtain the same relative length. The lines represent the average forthe female and the male speaker. For each speaker all 507 sentences were used. The rms was averagedover 125 ms.
in sentence length (ranging from 1.2 to 3.0 s). Since we are specifically interested inthe amplitude over the duration of the sentence itself, we have scaled the duration ofthe individual sentences. Figure 4.2(b) shows the normalized results. The beginningof each sentence is indicated by 0% and the end by 100%. The figure shows that theaverage rms level decreased steadily from the beginning until about 80% of the sen-tence length. (The total decline between 10-80% was about 3.7 dB and 3.1 dB for thefemale and male materials, respectively.) At about 80% (i.e., during the last syllable)the amplitude dropped sharply.
The increase in error over the length of the sentence followed the steady decline inspeech amplitude. However, the sharp sharp drop in amplitude at 80% of the sentencelength does not correspond to an increased error for the last syllable. This last sylla-ble was probably relatively easy to predict, which might have compensated its loweramplitude.
4.2.4 Measurement error
Measurement error (i.e., the square root of the average variance of the repeated mea-surements, after correction for the learning effect) was 1.5 dB and 1.9 dB for stationaryand fluctuating noise, respectively (Chapters 2 and 3).
The measurement error tended to increase slightly with age (0.2 dB per 10 yr), how-ever this was insignificant (r2 = 0.1; p > 0.1, for both noise types). The error showedno significant correlation with PTA (e.g., PTA0.5, 1, 2 kHz, PTA1, 2, 4 kHz, etc.) and dynamic
98

4.2 Results
range (e.g., DR0.5, 1, 2 kHz, DR1, 2, 4 kHz, etc.). However, further analysis showed that themeasurement error was significantly larger for subjects with worse SRT scores. Figure4.3 displays the measurement error averaged over all compression conditions for eachsubject as a function of the subject’s SRT for stationary noise and linear amplification(SRTstat, linear). For comparison, an additional average value for normal-hearing subjectsis also shown (Versfeld et al., 2000). Correlation of measurement error with SRTstat, linear
was significant for both stationary (r2 = 0.4, p < 0.005) and fluctuating noise (r2 = 0.3,p < 0.01). Correlation of measurement error for fluctuating noise, against SRTfluct, linear
was weaker (r2 = 0.20, p = 0.05) and is not shown in the figure.
Stationary Noise Fluctuating NoiseStationary Noise, NH
-6 -4 -2 0 2 4 6 8SRTstat, linear (dB)
0.0
0.5
1.0
1.5
2.0
2.5
3.0
3.5
Mea
sure
men
t Erro
r (dB
)
Figure 4.3: Measurement error for stationary and fluctuating noise. The abscissa represents speech re-ception thresholds for stationary noise and linear amplification (SRTstat, linear). Linear regression yieldedsignificant correlations for both stationary (r2 = 0.4, p < 0.005) and fluctuating noise (r2 < 0.3, p < 0.01).The slopes of the regression lines are 0.10 dB/dB and 0.12 dB/dB for stationary and fluctuating noise,respectively. Additional data for normal hearing subjects from Versfeld et al. (2000) is represented bythe + symbol. This data point is not included in our regression analysis and represents average data of12 subjects for stationary noise and linear amplification.
4.2.5 Analysis of Variance
Analogous to the previous chapters, the SRTs measured with compression will be pre-sented relative to the subject’s linear score. For this purpose, ∆SRT was defined as theSRT for a particular condition minus the SRT for the linear condition found for thatsubject (see section 2.3). Negative values of ∆SRT indicate a better speech reception
99
Chapter 4: Compression for individual subjects
threshold for compression than obtained for linear amplification.
A five-way analysis of variance (ANOVA) was conducted on the data of each of thetwenty subjects. Prior to analysis, all the duplicate pairs were averaged and the av-erage values were treated as a single data point. In order to conduct a full factorialanalysis, the variance of the duplicate pairs (i.e., the square of the measurement error)was used as estimate of the error term of the ANOVA. An estimate was made for eachsubject separately3.
Analogous to the analyses in Chapters 2 and 3, the ANOVAs were conducted twice:first with the inclusion of single-channel compression (and without split-frequencycompression ratios) and second with split-frequency compression ratios (and withoutsingle-channel compression). The error variance for each subject was obtained from 13duplicate measurements only, therefore we lowered the degrees of freedom of the errorterm accordingly4, that is, from 30 (no split-frequency CRs) or 40 (with split-frequencyCRs) to 12. Tables 4.2 and 4.3 contain the results for stationary noise, and Tables 4.4 and4.5 the results for fluctuating noise. The tables show all p-values that were significantat the 5% level (which was the highest significance level that was found).
Stationary noise
Only two subjects (s7 and s18) had significant effects for interaction terms. For s7these significant results were caused by two points with a very high ∆SRT, first CP ( 6,2/3, 4/40) with ∆SRT = +9.4 dB, and second CP ( 1, 3/3, 4/40) with ∆SRT = +6.3 dB.Most likely these results were caused by a momentary lack of concentration. For s18,the significant result for CR * T was caused by consistently low values of ∆SRT forCR = 3/3 with Ta/Tr = 4/40. This effect was present for all number of channels (1, 2,and 6), but it was most prominent for NC = 1 (∆SRTNC = 1 =−1.8 dB). This explainswhy the effect of CR * T was significant in the analysis with NC = 1 (Table 4.2) and notin the analysis without NC = 1 (Table 4.3).
Only six significant main effects were found in five subjects (s7, s10, s13, s14, and s18).For subject s7 the significance was again caused by the two points with a very high∆SRT that were ascribed to lack of concentration. First, no significant effect was foundfor the number of channels. Second, for compression ratio, all five subjects had a sig-nificant effect. For s10, s13, and s14, a compression ratio of 3/3 resulted in significantlyworse speech intelligibility than a compression ratio of 2/2. For s18, it was oppo-
3Although the measurement error did depend on subject, it was independent of compression para-meters. For an individual it is therefore valid to use the error pooled over all compression conditionsfor that subject.
4Actually, the measured test-retest data is now used twice. The duplicate pairs were previously av-eraged and used as a single data point. Statistics suggest using the test (or retest) data only for thisanalysis, but in order to remain consistent to previous analyses we again used the average of the dupli-cate pairs.
100

4.2 Results
Table 4.2: Stationary noise; significant results of an analysis of variance for each subject separately.Single-channel compression was included and therefore split-frequency compression ratios (CR = 1/2,and 2/3) were omitted. The independent (between) factors were number of channels (NC = 1, 2, 6),compression ratio (CR = CRlow/CRhigh = 2/2, 3/3) and time constants (T = Ta/Tr = 4/4, 4/40, 40/40,4/400, 40/400).
Stationary noiseNC = 1, 2, 6 CR = 2/2, 3/3
p-valueSubject NC CR T NC * CR NC * T CR * T NC * CR * T
s1s2s3s4s5s6s7 < 0.05 < 0.05s8s9
s10 < 0.05s11s12s13 < 0.05s14 < 0.05s15s16s17s18 < 0.05 < 0.05s19s20
site: CR = 3/3 resulted in better speech intelligibility than CR = 2/2. Third, for timeconstants, only subject s18 (and s7) had a significant effect. For s18, both 40/400 and40/40 resulted in better intelligibility than Ta/Tr=4/4 and 4/40.
Overall, only few significant effects were found: 7 out of 140 conditions (5%) for Table4.2 and 5 out of 140 (4%) for Table 4.3. This small number of statistical results is atchance level (although one could argue about the significant results for CR, see Table4.2). However, it is important to further evaluate these results for individual subjects,because in daily-practise hearing-aid fitting has to target individual hearing-impairedclients as well.
A comparison of the individual data to the group results of Chapter 2 shows that manysubjects display similar (insignificant) trends as those seen for the statistically signif-icant group results. First, number of channels; the group data showed significantlybetter speech intelligibility for NC = 6 than for NC = 1. The same trend was found forfifteen subjects (the five exceptions were s1, s4, s8, s14, s20), however it was insignifi-
101

Chapter 4: Compression for individual subjects
Table 4.3: Stationary noise; significant results of an analysis of variance for each subject separately. Split-frequency compression ratios (CR = 1/2, and 2/3) were included and single-channel compression wasomitted. The independent (between) factors were number of channels (NC = 2, 6), compression ratio(CR = CRlow/CRhigh = 1/2, 2/2, 2/3, 3/3) and time constants (T = Ta/Tr = 4/4, 4/40, 40/40, 4/400,40/400).
Stationary noiseNC = 2, 6 CR = 1/2, 2/2, 2/3, 3/3
p-valueSubject NC CR T NC * CR NC * T CR * T NC * CR * T
s1s2s3s4s5s6s7 < 0.05 < 0.05 < 0.05 < 0.05s8s9
s10s11s12s13s14s15s16s17s18 < 0.05s19s20
cant for all. Second, compression ratio; in Chapter 2 a compression ratio of 3/3 resultedin the worst average speech intelligibility of all four compression ratios. All but twosubjects (s12 and s18) displayed a similar (insignificant) trend. Third, Ta/Tr; for thegroup data, larger time constants resulted in better speech intelligibility. This effectwas present (but insignificant) for eighteen subjects. The two remaining subjects (s2and s7) achieved best results for Ta/Tr = 4/4. The group result for NC * T (Fig. 2.4) in-dicated that the worst speech intelligibility was obtained for fast-acting single-channelcompression. This same effect was insignificantly present in the data of 10 subjects.
Fluctuating noise
The ANOVA results for fluctuating noise are shown in Tables 4.4 and 4.5. For fluc-tuating noise, no significant interaction effects were found. For the main effects, foursubjects (s8, s13, s17, s20) had significant results. First, number of channels; only s13showed a significant effect. In accordance with the group result, for this subject NC=2
102

4.2 Results
Table 4.4: Fluctuating noise; significant results of an analysis of variance for each subject separately.Single-channel compression was included and therefore split-frequency compression ratios were omit-ted. T represents the time constants (T = Ta/Tr). (NC = 1, 2, 6; CR = CRlow/CRhigh = 2/2, 3/3;Ta/Tr = 4/4, 4/40, 40/40, 4/400, 40/400).
Fluctuating noiseNC = 2, 6 CR = 1/2, 2/2, 2/3, 3/3
p-valueSubject NC CR T NC * CR NC * T CR * T NC * CR * T
s1s2s3s4s5s6s7s8 < 0.05s9
s10s11s12s13 < 0.05s14s15s16s17 < 0.05s18s19s20
gave better speech intelligibility than than NC=6. Second, compression ratio; twosubjects had significant effects: s20 for which CR=3/3 resulted in worse scores thanCR=2/2, and s17 for which the results were reversed (CR=3/3 better than 2/2). Third,time constants; s8 had better results with slowly-acting compression (Ta/Tr = 40/40,4/400, 40/400) than with fast-acting compression (Ta/Tr = 4/4, and 4/40). For subjects13, speech intelligibility for Ta/Tr = 40/400 was better than for Ta/Tr = 40/40.
The group data of Chapter 3 only yielded a significant result for the main effect ofnumber of channels. On average, six-channel compression resulted in worse speechintelligibility than both single- and two-channel compression. For eleven of the twentysubjects this same trend was found in the individual results, but it was only significantfor subject s13.
4.2.6 Significant results
The increase of measurement error for subjects with a worse SRTlinear suggests that theanalysis for these subjects had a lower statistical power. This might have contributed
103

Chapter 4: Compression for individual subjects
Table 4.5: Fluctuating noise; significant results of an analysis of variance for each subject separately.Split-frequency compression ratios were included and single-channel compression was omitted. T rep-resents the time constants (T = Ta/Tr). (NC = 2, 6; CR = CRlow/CRhigh = 1/2, 2/2, 2/3, 3/3; Ta/Tr =4/4, 4/40, 40/40, 4/400, 40/400).
Fluctuating noiseNC = 1, 2, 6 CR = 2/2, 3/3
p-valueSubject NC CR T NC * CR NC * T CR * T NC * CR * T
s1s2s3s4s5s6s7s8s9s10s11s12s13 < 0.05 < 0.05s14s15s16s17s18s19s20 < 0.05
to the small number of statistically significant results. Figure 4.4 shows the numberof significant post-hoc contrasts versus SRTstat, linear. We used Tukey’s Honestly Sig-nificantly Difference test on the highest level (NC * CR * T with adjusted degrees offreedom) for all compression conditions. The figure illustrates that compression ledto few statistically significant results. However, no clear trend in the number of sta-tistically significant results is visible. The results for subject s7 are biased due to twomeasurements with a high ∆SRT (see section 4.2.5).
4.2.7 Regression analysis
We analysed the effect of compression (∆SRT) as a function of audiometric character-istics. In the analysis all data for a subject were pooled, except the parameter (NC,CR, or T) under investigation. No significant results were found for correlations of∆SRT with pure-tone thresholds or dynamic range. However, for stationary noise sig-nificant results were obtained for the correlation between ∆SRT and SRTstat, linear andCR = 1/2 and CR = 2/2 (both, r2 = 0.3; p = 0.01). Figure 4.5 shows these correlations.
104

4.2 Results
Stationary Noise Fluctuating Noise
-4 -2 0 2 4 6 8
SRTstat, linear (dB)
0
20
40
60
80
100
120To
tal n
umbe
r of s
igni
fican
t diff
eren
ces
(p<0
.05)
s7
s17
s13
s6
s18
Figure 4.4: Total number of statistical significant results based on Tukey’s Honestly Significant Differ-ence post-hoc test (with adjusted degrees of freedom). The data represents all 50 compression condi-tions, including conditions with NC = 1, and split-frequency compression ratios 1/2 and 2/3. Data forsubjects with more than 10 significant results is marked with the subject number.
No significant correlation was present for the higher compression ratios (CR = 2/3 and3/3, r2 < 0.07 and p > 0.3, respectively) as was the case with fluctuating noise for allcompression ratios (r2 < 0.02, p > 0.5).
4.2.8 Best result
In an attempt to find a predictor for the benefit of compression, we looked at the best(lowest) ∆SRT for each subject. Figure 4.6 shows ∆SRTbest for each subject as a func-tion of the subject’s score for linear amplification and stationary noise. Each pointrepresents a single measurement (or the average of a duplicate pair). Only resultsfor stationary noise are shown; error bars give the measurement error for each subject.The correlation between ∆SRTbest and SRTstat, linear was significant (r2 = 0.53; p < 0.0005).For comparison, the figure also contains a regression line for the mean result of all 50compression conditions (r2 = 0.16; p = 0.07). Of course, a large part of the significantrelation between ∆SRT and SRTstat, linear was caused by the increase of the measurementerror for worse SRTstat, linear. However, ∆SRTbest improved with 0.3 dB for every 1 dBincrease in SRTstat, linear, while the measurement error increased with 0.1 dB/dB only.Besides the best result, the average result of all compression conditions (∆SRTall) also
105

Chapter 4: Compression for individual subjects
CR1/2 CR2/2
-4 -2 0 2 4 6 8
SRTstat, linear (dB)
-1.5
-1.0
-0.5
0.0
0.5
1.0
1.5
2.0
2.5
SR
T (d
B)
∆
Figure 4.5: Stationary noise; ∆SRT for CR = 1/2 and CR = 2/2 as a function of SRTstat, linear. ∆SRT isdefined as SRTcompression−SRTlinear. Lower values of ∆SRT indicate better results, and negative valuesrepresent a better SRT than obtained for linear amplification for that subject. Linear regression yieldeda significant correlation (r2 = 0.3; p = 0.01, for both CR = 1/2 and CR = 2/2).
improved with SRTstat, linear (−0.12 dB/dB), see Fig. 4.6. The fact that both ∆SRTbest and∆SRTall decreased for increasing SRTstat, linear suggests that the improvement of ∆SRTwith SRTstat, linear was not caused by the measurement error alone. For fluctuating noise(not shown in the figure) no significant correlations were found and the average re-sult (∆SRTall) did not improve with increasing SRTlinear. These results suggest that thehighest benefit of compression in stationary noise occurred for subjects with the worstSRTstat,linear.
We also studied the relationship between ∆SRTbest and audiometric characteristics. In-cluded were various combinations of PTAs, pure tone uncomfortably levels, and puretone dynamic ranges. Additionally, we used supra-threshold measures such as CVC-scores in quiet and release of masking (expressed as SRTfluct–SRTstat). None of the cor-relations was significant.
In an attempt to find a predictor for the compression parameter setting (CP ) that ledto the best ∆SRT for an individual, we calculated the correlations between the setting(NC, CR, T) which resulted in ∆SRTbest and audiometric parameters. Al correlationswere insignificant. Furthermore, we found no significant relationship between the set-ting for ∆SRTbest and setting of the subject’s own hearing aid. Additional analyses in
106

4.3 Discussion
-2 0 2 4 6-5
-4
-3
-2
-1
0
1
2
SRTstat, linear (dB)
∆ SR
T (d
B)
Figure 4.6: ∆SRTbest for stationary noise versus SRTlinear. The data points show the lowest (best) ∆SRTfor each subject for stationary noise only. Lower values of ∆SRTbest indicate better results. The errorbars give the measurement error in each subject. Linear regression based on the data points only showeda significant correlation (r2 = 0.53; p < 0.0005). The regression line showed an improvement in ∆SRT of-0.31 dB for every 1 dB increase in SRTstat, linear. The striped line shows the insignificant regression linefor the mean of all 50 compression conditions (−0.12 dB/dB).
which the subjects were split into two groups, a group with a sloping hearing loss anda group with a flat hearing loss, again yielded no significant results.
4.3 Discussion
The ANOVAs for individual subjects yielded disappointingly few significant results.However, the main effects of Chapters 2 and 3 were clearly (but insignificantly) presentin the data for many subjects. Interaction effects were not seen, except for the (insignif-icant) trend of a worse speech intelligibility for fast-acting single-channel compressionin stationary noise (relative to slowly-acting single-channel compression or fast-actingmulti-channel compression).
Correlation analyses between ∆SRTbest and pure-tone audiometric threshold, dynamicrange, uncomfortable loudness levels, and CVC-scores in quiet, did not yield any sig-nificant result for this set of subjects. This lack of significant relationship between ef-fect of compression and audiometric characteristics has also been described by severalother studies (see Table 4.1). Correlation between ∆SRT and release of masking (i.e.,SRTfluct–SRTstat) was also insignificant for both stationary and fluctuating noise. Olsen
107
Chapter 4: Compression for individual subjects
et al. (2004) also reported an insignificant correlation between benefit of compressionin fluctuating noise and release of masking.
However, the correlation between ∆SRTbest and SRTstat, linear was significant. This wasprobably not caused by the age distribution of our set of subjects since SRTfluct, linear
correlated only weakly with age, and the relationship between SRTstat, linear en age wasinsignificant. Moreover, the research of Souza and Kitch (2001) suggests that the effectof compression does not depend strongly on age.
The results for ∆SRTbest are most likely strongly influenced by measurement error. Still,the significant correlation was not entirely caused by measurement error, since the in-crease of measurement error with SRTstat, linear was three times as small as for ∆SRTbest.Moreover, the dependency of ∆SRTbest on SRTstat, linear was not present for fluctuatingnoise (for which measurement error increased equally). The correlation was also (in-significantly) present for the mean of all compression ratios (not for fluctuating noise).These other correlations suggest that the benefit of compression (∆SRTbest) for station-ary noise improved with increasing SRTstat, linear.
For stationary noise, both CR = 1/2 and CR = 2/2 (pooled over all number of channelsand time constants) had a significant correlation between ∆SRT and SRTstat, linear (Fig.4.5). ∆SRT improved with increasing SRTstat, linear. However, the measurement errorincreased with SRTstat, linear as well, resulting in few statistically significant differences(Fig. 4.4). The significant correlation for CR = 1/2 and 2/2 with SRTstat, linear suggeststhat for the system with CR = 1/2 or 2/2, subjects with a speech reception thresholdbetween about +2 and +6 dB enjoyed more benefit than subjects with lower (better)SRTs. However, the lack of significant results for the main effect of compression ratiosuggests that for these subjects ∆SRTCR = 1/2 and ∆SRTCR = 2/2 was not significantly bet-ter than results for higher compression ratios. These results do therefore not suggestto use low compression ratios.
The group data seems to represent the trends found for many individuals. The rela-tively large measurement error implies that the fine-tuning of a compression hearingaid based on the listener’s speech intelligibility can be vary laborious. Rather than ob-taining individual results for the fitting of compression in stationary noise, one mighttake the group results from Chapter 2. If individual results would be used, on mightconsider using main effects only, since the interaction effects seem less important.
Our results suggest that in order to predict the effect of compression in noise, onemight look at speech intelligibility in noise, instead of pure-tone audiometric thresholdor dynamic range.
4.4 ConclusionsThis study compared the effect of compression parameters on speech intelligibility in
108

4.4 Conclusions
stationary and fluctuating noise. The stimuli were presented entirely within the dy-namic range of hearing of all subjects, and they were therefore audible without theneed for compression. Thus, the effect of compression on speech intelligibility origi-nated with the ability of compression to alter the dynamics of the stimuli, and not inthe ability to increase audibility of the stimulus as a whole. This effect of compressioncould not be predicted with standard audiometric characteristics such as threshold ofhearing or dynamic range. However, benefit of compression for stationary noise wasshown to increase for subjects with a worse speech reception threshold (SRTstat, linear).This suggests that a speech signal in noise can be more useful than pure-tone audiomet-ric threshold or dynamic range data for determining a possible benefit of compression.Most current fitting rationales are threshold based, and prescribe a higher compres-sion ratio for a larger hearing loss. While this might lead to substantial improvementof speech intelligibility at too low or too high input levels, it did not give improvementat the moderate levels used in this study. No significant correlation was found betweendynamic range and the best compression ratio.
Overall, the effects of compression were rather small with respect to the within sub-ject variability. For stationary noise, the benefit of compression tended to increase forsubjects with a worse SRTstat, linear. However, for both noise types, the measurementerror was shown to increase with increasing SRTlinear as well. For a clinical setting,this indicates that the speech reception threshold is a laborious tool for assessing thebest compression characteristics for an individual subject. Results indicate, however,that the SRT might be more suitable than pure-tone audiometric threshold or dynamicrange. These results therefore agree with the results from the previous chapters: find-ing the best compression parameters based on optimizing speech intelligibility for anindividual, is, at best, tedious.
109

Chapter 4: Compression for individual subjects
110

Summary and clinicalapplicability 5

Chapter 5: Summary and Clinical Applicability
Many modern hearing aids apply compressive amplification to automatically increasethe amplification of low-level sounds while keeping the high-level sounds at a comfort-able loudness level. This amplification strategy can greatly improve user satisfaction.For instance, one of our subjects explained that with her new compression hearingaid she enjoyed her Sunday morning walks even more. Now she could hear birdssing without having to fumble with the volume knob or worry about too loud trafficsounds, simply because her hearing aid adjusted the volume automatically.
Compression can not only increase hearing aid comfort, but it can also influence speechintelligibility. There are many rationales for using compression to optimize speech in-telligibility, and the number of different implementations of compression is even larger(Chapter 1). However, even the most advanced hearing aids suffer from the fact thateventually all processed sounds have to pass through the damaged ear. Althoughsignal processing such as compression can counteract an impaired threshold and de-creased dynamic range, it does not seem to be able to compensate for pathologicallybroad auditory filters (section 1.4.2). This inability is most evident for speech in a back-ground noise, a condition in which hearing aids generally do not restore hearing tonormal. Actually, for a noisy situation compression can even degrade speech intelligi-bility. Currently, the effect of various compression parameters on speech intelligibilityin noise is unclear. Moreover, possible interactions between the various parameters arelargely unknown.
In view of this hiatus, we conducted an extensive experiment in which we comparedthe effect of several compression parameters on speech intelligibility in a backgroundnoise. The experiment was a full parametric investigation, meaning that all combina-tions of the chosen parameter values were used. The parameters under investigationwere number of channels (NC, 1, 2 or 6), compression ratio (CRlow/CRhigh for frequen-cies below and above 1 kHz, respectively, ranging from 1/2 to 3/3), and attack/releasetime (Ta/Tr, ranging from 4 to 400 ms). The reference condition was amplificationwithout compression (i.e., linear amplification). All subjects included had a moderatesensorineural hearing impairment.
Two types of background noise with a speech-shaped frequency spectrum were used:stationary and fluctuating noise. Stationary noise was chosen because it is well definedand can be regarded as a standard reference. Fluctuating noise was chosen becauseits resemblance to an interfering speaker is relevant for real-life communication, andbecause the benefit from temporal gaps in fluctuating noise is mostly less for hearing-impaired listeners than for normal-hearing listeners. In our experiments, the compres-sion threshold was well below the average stimulus level to ensure compression of theentire signal. All stimuli were presented within the dynamic range of hearing of theindividual subject and were therefore audible without the need for compression. Thisensures that the effect of compression on speech intelligibility originated in the abilityof compression to alter the dynamics of the stimuli and not in its ability to increase
112

Summary and clinical applicability
audibility of the stimulus as a whole (such as required for speech presented at too lowa level or the previously mentioned low-level bird songs).
Chapter 1: Introduction
Chapter 1 starts with an overview of the workings of the peripheral ear. It describessound transmission through the ear, and the consequences of damage to the ear. Thechapter focuses on the cochlea, and on the current view that the cochlea is the primaryorigin of compressive amplification in the ear. It is explained that compressive amplifi-cation has a marked influence on auditory perception and can account for many of itsnonlinear aspects. Based on literature, various estimates of the amount of compressionare presented and from the data it was estimated that the bio-mechanical amplifier inthe cochlea has a compression ratio of about 3± 2, depending on the level and fre-quency of the input sound wave. Hearing loss can lead to less cochlear compression,and many hearing aids apply compression to alleviate the hearing loss. Thus, the chap-ter concludes with a description of the properties and implementations of compressionin hearing aids.
Chapter 2: Stationary noise
Chapter 2 explores the effects of compression on speech in a stationary backgroundnoise. For moderately hearing-impaired subjects in stationary noise, previous studiesshowed that compression with a small number of channels and with a low compres-sion ratio did not degrade speech intelligibility relative to linear amplification. Someexperiments even showed a slight improvement in speech intelligibility. Experimentswith a large number of channels gave seemingly conflicting results. Hardly any previ-ous studies have been designed to investigate interactions between compression para-meters.
We measured the speech reception threshold (SRT) in noise, and expressed the SRT re-sults for compression relative to the subject’s result for linear amplification: ∆SRT.A lower value of ∆SRT means better speech intelligibility with compression thanwith linear amplification. We also introduced a notation to present the characteris-tics of compression under investigation by a set of compression parameters: CP ( NC,CRlow/CRhigh, Ta/Tr), see section 2.1.1.
Our results indicate that most compression settings yielded lower scores than thoseobtained with linear amplification. Single-channel compression resulted in the worstspeech intelligibility whereas the results for two-channel and six-channel compres-sion were roughly equal to each other. There are some indications that the two-channel system might be optimized by investigating the best cross-over frequency(ours was 1 kHz). A compression ratio of 3/3 (CRlow/CRhigh) gave worse speechintelligibility than lower compression ratios. The combination of largest time con-stants (Ta/Tr = 40/400 ms) gave best results. Our experiment was designed to investi-
113

Chapter 5: Summary and Clinical Applicability
gate possible interaction effects between compression parameters. In other words, thestudy was designed to determine if the effect of a parameter (e.g., release time) is influ-enced by the value of another parameter (e.g., number of channels). We found a signifi-cant effect of NC * T meaning that the effect of time constants depended on the numberof channels: fast-acting single-channel compression was detrimental for speech intel-ligibility. Moreover, the interaction NC * CR * T was significant, indicating that a spe-cific combination of parameter values led to degraded (for instance CP ( 1, 3/3, 4/4))or improved (CP ( 2, 2/3, 40/40)) results. Overall, the best result was obtained fortwo-channel compression CP ( 2, 2/3, 40/40) (∆SRT =−0.7 dB). For six-channel com-pression the best speech intelligibility was achieved with CP ( 6, 2/2 + 2/3, 40/400)(∆SRT =−0.4 dB) and the best result with single-channel compression was equal tothat with linear amplification.
Chapter 3: Fluctuating noise
Chapter 3 investigates the effect of compression on speech intelligibility in a fluctu-ating background noise. The fluctuating noise consisted of spectrally speech-shapednoise with the time-reversed modulations of the same speaker as the target speech. Theavailable results from previous research for moderately hearing-impaired subjects didnot present a clear picture of the effects of compression in fluctuating noise. Althoughsome studies showed improved speech intelligibility for amplitude compression (rela-tive to linear amplification), most studies either showed a degradation or no difference.Compression results tended to be slightly more favourable for fluctuating noise thanfor stationary noise. Similar to stationary noise, for fluctuating noise possible interac-tions between the compression parameters were largely unknown.
The results from our experiments showed that compression had only a small influ-ence on speech intelligibility. Although multi-channel compression is known to reducespectral and temporal contrasts, its effect on speech intelligibility in fluctuating noisewas limited. This is probably caused by the ability of compression to lift the level of thespeech during gaps in the noise. For fluctuating noise, only one significant result wasobtained: overall, six-channel compression led to significantly worse speech intelligi-bility than compression with NC = 1 or 2. Fast-acting single-channel compression gaveless degraded results for fluctuating than for stationary noise and in contrast to resultsfor stationary noise, interaction effects were not significant. Parameter values whichresulted in the best speech intelligibility for stationary noise yielded good results forfluctuating noise as well. The best score (∆SRT =−0.9 dB) was achieved with single-channel compression: CP ( 1, 2/2, 40/40). A difference of −0.9 dB may seem small,but this corresponds to an improvement in sentence score of about 15%. The best two-channel result was found for CP ( 2, 2/3, 40/40) (∆SRT =−0.7 dB). This combinationalso led to the overall best speech intelligibility for stationary noise (∆SRT =−0.7 dB,Chapter 2). CP ( 6, 2/3, 40/400), which led to the best speech intelligibility for six-channel compression with stationary noise (∆SRT =−0.4 dB), gave a good result for
114
Summary and clinical applicability
fluctuating noise (∆SRT =−0.4 dB) as well.
For fluctuating noise, the detrimental effects of compression were smaller than for sta-tionary noise and the variance in the SRT results was larger. This suggests that station-ary noise is more suited than fluctuating noise for measuring the effect of compressionon speech intelligibility.
Chapter 4: Results individually examined
Chapter 4 evaluates the effect of compression on speech intelligibility for individualsubjects. Most previous research did not find significant relationships between theeffect of compression and audiometric characteristics. Past studies that did find a sig-nificant correlation with hearing loss (mostly tone-audiometric threshold or dynamicrange of hearing) showed different effects: some studies found positive correlations,others reported negative correlations. It is therefore not clear which subjects can ben-efit most from compression. Moreover, we do not know which specific compressioncharacteristics will yield optimal speech intelligibility for individual listeners. In viewof these inconclusive results from the literature we conducted additional analyses onthe large amount of data of which the pooled results were reported Chapters 2 and 3.
For our subjects, the effect of compression was rather small with respect to the withinsubject variability. Additionally the measurement error was larger for subjects withworse speech intelligibility in noise. The effect of compression was not significantlyrelated to standard audiometric characteristics such as hearing threshold or dynamicrange. However, for stationary noise, a significant correlation was found betweenthe effect of compression (∆SRT) and the SRT for linear amplification for the lowesttwo compression ratios (CR = 1/2 and CR = 2/2) only. Moreover, for this noise type,the best results obtained with compression improved significantly for subjects with aworse SRT. These correlations tentatively suggest that speech in stationary noise mightbe more useful for determining a possible benefit of compression than pure-tone au-diometric threshold or dynamic range. In contrast, most current fitting rationales arethreshold based.
Considerations for clinical applicability
The current parametric study was much more elaborate than will ever be possible ina clinical setting. However, one might apply our results to the practice of hearing aidfitting. This section will briefly discuss some issues that may arise when interpretingour results for use in a clinical setting.
Firstly, our results were obtained with Dutch speech material. Generally, the resultsof compression research are not regarded language specific. This assumption seemsjustified because the long-term average frequency content and the dynamic properties
115

Chapter 5: Summary and Clinical Applicability
of many languages are very similar (Byrne et al., 1994)1. Moreover, Kam and Wong(1999) reported similar effects of compression for Cantonese (which is a tone language)as those obtained for English (which is an intonation language). It can therefore beexpected that our results are also valid for other languages.
Secondly, the benefit of hearing aids can increase over time after the initial fitting. Un-fortunately, our experimental design did not allow for acclimatization to each compres-sion condition because of the large number (50) of different conditions. However, pre-vious research indicates that the influence of acclimatization is rather limited. Turneret al. (1996) conducted a large review on previous research on acclimatization andconcluded that there was a general tendency for hearing aid benefit to increase onlyslightly over time. In reply to the paper of Turner et al. (1996), Byrne (1996) stressedthat measurements conducted without an acclimatization period may underestimatethe potential benefit. Furthermore, direct comparisons between hearing aids mightlead to the wrong conclusions because of a possible bias towards the characteristicsof the subject’s own hearing aid. Munro and Lutman (2003) found acclimatization fora high presentation level (about 90 dB SPL at the eardrum) only and not for lowerlevels. They suggested that the acclimatization effect depended on the sound level.Their subjects had not previously worn hearing aids and Munro and Lutman ascribedtheir finding to the fact that the subjects were not used to hearing sounds at this higha level. In our case, nearly all subjects used hearing aids prior to our experiments andwere accustomed to the moderate sound levels of our study. Since acclimatization ef-fects appear to be limited and since we found no significant correlation between thecompression characteristics of the subjects’ own hearing aid and their results in theexperiment (Chapter 4), we assume that the results of our experiments remain valid.Still, it might prove beneficial to conduct a field trial which allows for sufficient ac-climatization before using the results from our study.
Thirdly, this study investigated speech intelligibility at moderate input levels only. Inreal-life situations the range of encountered sound levels will be much larger than inour laboratory set-up with pre-recorded speech. However, our results can still be ap-plied by fitting the hearing aid for these large dynamic ranges, while keeping in mindthe influence of the parameter values on speech intelligibility. In other words, oneshould try to avoid compression with characteristics that lead to degraded speech in-telligibility at normal speech levels (e.g., fast-acting single channel compression or highcompression ratios).
1Note that whereas Dutch was not included in this study, closely related languages such as English,German, and Danish were, as well as more distant related languages such as Japanese, Russian, Arabic,etc.
116
Summary and clinical applicability
How should we fit compression hearing aids?
Results indicate that for determining the best compression characteristics the SRTmight be more suitable than pure-tone audiometric threshold or dynamic range. How-ever, measurement error increased for subjects with a larger (worse) SRT and was gen-erally larger for fluctuating noise. Moreover, the effects of compression seem limitedfor fluctuating noise, and since no clear individual predictors were found, one mightconsider using the average results. If one decides to use speech intelligibility to obtaina personalized fit, we suggest using stationary noise instead of fluctuating noise.
For our subjects, a compression ratio of 3 for the entire frequency spectrum gave lowerspeech intelligibility than lower compression ratios. Fast-acting single-channel com-pression led to degraded speech intelligibility for stationary noise. The influence ofthe number of channels was limited. For all channel configurations, short attack andrelease times resulted in lower speech intelligibility than longer time constants. Theseresults suggest using multi-channel compression with compression ratios smaller than3 and large time constants (Ta/Tr > 4/40).
Since there is more to life than speech intelligibility, it is important to look at other mea-sures as well. A speech-based optimization is of not much use if the hearing-impairedis unsatisfied with the sound quality of the hearing aid and decides not to use it at all.The relatively small effects of compression on speech intelligibility warrants the useof compression for comfort enhancement in hearing aids. We suggest to use a first fitbased on the average speech optimum for stationary noise, and then to individuallyoptimize other factors such as comfort and ease of listening, audibility and clarity ofsound, and music perception.
117

Chapter 5: Summary and Clinical Applicability
118

“They both savoured the strange warmglow of being much more ignorant thanordinary people, who were only igno-rant of ordinary things”
Discworld scientists at work,
Terry Pratchett, ‘Equal Rites’,
HarperCollins, New York , 1987

120

Bibliography
ANSI (1987), Specification of hearing aid characteristics, American National Standards In-stitute, S3.22-1987.
ANSI (1996), Specification of hearing aid characteristics, American National Standards In-stitute, S3.22-1996.
Bacon, S. P., Opie, J. M., and Montoya, D. Y. (1998), “The effects of hearing lossand noise masking on the masking release for speech in temporally complex back-grounds,” Journal of Speech Language and Hearing Research 41, 549–563.
Boike, K. T. and Souza, P. E. (2000), “Effect of compression ratio on speech recognitionand speech-quality ratings with wide dynamic range compression amplification,”Journal of Speech Language and Hearing Research 43, 456–468.
Boothroyd, A., Springer, N., Smith, L., and Schulman, J. (1988), “Amplitude compres-sion and profound hearing loss,” Journal of Speech and Hearing Research 31, 362–376.
Braida, L. D., Durlach, N. I., Lippmann, R. P., Hicks, B. L., Rabinowitz, W. M., andReed, C. M. (1979), “Hearing aids–a review of past research on linear amplification,amplitude compression, and frequency lowering,” Journal of the American Speechand Hearing Association Monographs 19, 1–114.
Brand, T. (2000), “Analysis and optimization of psychophysical procedures in audiol-ogy,” Ph.D. thesis, University Oldenburg.
Bronkhorst, A. W. and Plomp, R. (1992), “Effect of multiple speech-like maskers on bin-aural speech recognition in normal and impaired hearing,” Journal of the AcousticalSociety of America 92, 3132–3139.
Busby, P. A., Tong, Y. C., and Clark, G. (1988), “Underlying structure of auditory-visualconsonant perception by hearing-impaired children and the influences of syllabiccompression,” Journal of Speech and Hearing Research 31, 156–165.
Byrne, D. (1996), “Implications of acclimatization for hearing aid fitting practices andresearch,” Ear and Hearing 17, 25S–26S.
121

Bibliography
Byrne, D., Dillon, H., Tran, K., Arlinger, S., Wilbraham, K., Cox, R. M., Hagerman, B.,Hetu, R., Kei, J., Lui, C., Kiessling, J., Kotby, N. M., Nasser, N. H. A., El Kholy, W.A. H., Nakanishi, Y., Oyer, H., Powell, R., Stephens, D., Meredith, R., Sirimanna, T.,Tavartkiladze, G., Frolenkov, G. I., Westerman, S., and Ludvigsen, C. (1994), “An in-ternational comparison of long-term average speech spectra,” Journal of the Acousti-cal Society of America 96, 2108–2120.
Chi, T. S., Gao, Y. J., Guyton, M. C., Ru, P. W., and Shamma, S. (1999), “Spectro-temporalmodulation transfer functions and speech intelligibility,” Journal of the AcousticalSociety of America 106, 2719–2732.
Cornelisse, L. E., Seewald, R. C., and Jamieson, D. G. (1995), “The input/output for-mula: a theoretical approach to the fitting of personal amplification devices,” Journalof the Acoustical Society of America 97, 1854–1864.
Cox, R. M. and Alexander, G. C. (1995), “The abbreviated profile of hearing aid bene-fit,” Ear and Hearing 16, 176–186.
Crain, T. R. and Yund, E. W. (1995), “The effect of multichannel compression on voweland stop-consonant discrimination in normal-hearing and hearing-impaired sub-jects,” Ear and Hearing 16, 529–543.
De Gennaro, S., Braida, L. D., and Durlach, N. I. (1986), “Multichannel syllabic com-pression for severely impaired listeners,” Journal of Rehabilitation Research and De-velopment 23, 17–24.
Dillon, H. (1996), “Compression?: Yes, but for low or high frequencies, for low or highintensities, and with what response times?” Ear and Hearing 17, 287–307.
Dillon, H. (2001), Hearing Aids (Thieme Medical Publishers, New York).
Dillon, H., Storey, L., Grant, F., Philips, A., Skelt, L., Mavrias, G., Woytowych, W., andWalsh, M. (1998), “Preferred compression threshold with 2:1 wide dynamic rangecompression in everyday environments,” Australian Journal of Audiology 20, 33–44.
Dobie, R. (1997), “Drug treatments for sensorineural hearing loss and tinnitus.” in Neu-rotransmission and Hearing Loss, edited by C. Berlin (Singular Publishing, San Diego).
Dreschler, W. A., Eberhardt, D., and Melk, P. W. (1984), “The use of single-channelcompression for the improvement of speech intelligibility,” Scandinavian Audiology13, 231–236.
Drullman, R. and Bronkhorst, A. (2004), “Speech perception and talker segregation: ef-fects of level, pitch, and tactile support with multiple simultaneous talkers,” Journalof the Acoustical Society of America 116, 3090–3098.
122

Bibliography
Drullman, R. and Smoorenburg, G. F. (1997), “Audio-visual perception of compressedspeech by profoundly hearing-impaired subjects,” Audiology 36, 165–177.
Dubno, J. R., Horwitz, A. R., and Ahlstrom, J. B. (2003), “Recovery from prior stimu-lation: Masking of speech by interrupted noise for younger and older-adults withnormal hearing,” Journal of the Acoustical Society of America 113, 2084–2094.
Duijvestijn, J. A., Anteunis, L. J. C., Hendriks, J. J. T., and Manni, J. J. (1999), “Definitionof hearing impairment and its effect on prevalence figures - A survey among seniorcitizens,” Acta Oto-Laryngologica 119, 420–423.
Eguıluz, J. A., Ospeck, M., Choe, Y., Hudspeth, A., and Magnasco, M. (2000), “Essentialnonlinearities in hearing,” Physical Review Letters 84, 5232–5235.
Eisenberg, L. S., Dirks, D. D., and Bell, T. S. (1995), “Speech recognition in amplitude-modulated noise of listeners with normal and listeners with impaired hearing,” Jour-nal of Speech and Hearing Research 38, 222–233.
Festen, J. and Van Dijkhuizen, J. (1999), “Modeling the speech-reception threshold foramplitude-compressed speech,” in Psychophysics, Physiology and Models of Hearing,edited by T. Dau, V. Hohmann, and B. Kollmeier (World Scientific Publishers, Singa-pore).
Festen, J. M. and Plomp, R. (1990), “Effects of fluctuating noise and interfering speechon the speech-reception threshold for impaired and normal hearing.” Journal of theAcoustical Society of America 88, 1725–1736.
Franck, B. A., Kreveld-Bos, C. S., Dreschler, W. A., and Verschuure, H. (1999), “Eval-uation of spectral enhancement in hearing aids, combined with phonemic compres-sion,” Journal of the Acoustical Society of America 106, 1452–1464.
Geisler, C. D. (1998), From Sound to Synapse (Oxford University Press, Oxford).
Giguere, C. and Smoorenburg, G. (1997), “The generation of psychoacoustic combi-nation tones in relation to two-tone suppression effects in a computational model,”Journal of the Acoustical Society of America 102, 155–164.
Giguere, C. and Smoorenburg, G. (1999), “Computational modeling of outer hair celldamage: implications for hearing aid signal processing,” in Psychophysics, Physiol-ogy and Models of Hearing, edited by T. Dau, V. Hohmann, and B. Kollmeier (WorldScientific Publishers, Singapore).
Goedegebure, A., Hulshof, M., Maas, R. J. J., Dreschler, W. A., and Verschuure, H.(2001), “Effects of single-channel phonemic compression schemes on the under-standing of speech by hearing-impaired listeners,” Audiology 40, 10–25.
123

Bibliography
Goldstein, J. L. (1967), “Auditory nonlinearity,” Journal of the Acoustical Society ofAmerica 41, 676–689.
Grimwood, W. K. (1949), “Volume compressors for sound recordings.” Journal of theSociety for Motion Picture Engineers 52, 49–76.
Gustafsson, H. A. and Arlinger, S. D. (1994), “Masking of speech by amplitude-modulated noise,” Journal of the Acoustical Society of America 95, 518–529.
Hagerman, B. (1997), “Attempts to develop an efficient speech test in fully modulatednoise,” Scandinavian Audiology 26, 93–98.
Hagerman, B. (2002), “Speech recognition threshold in slightly and fully modulatednoise for hearing-impaired subjects,” International Journal of Audiology 41, 321–329.
Harte, J. M. and Elliott, S. J. (2005), “A comparison of various nonlinear models ofcochlear compression,” Journal of the Acoustical Society of America 117, 3777–3786.
Helmholtz, H. L. F. (1875), On the Sensations of Tone as a Physiological Basis for the Theoryof Music. (Reprint, Dover 1954, New York).
Hickson, L. (1994), “Compression amplification in hearing aids,” American Journal ofAudiology 3, 51–65.
Hickson, L., Dodd, B., and Byrne, D. (1995), “Consonant perception with linear andcompression amplification,” Scandinavian Audiology 24, 175–184.
Houtgast, T. (1972), “Psychophysical evidence for lateral inhibition in hearing,” Journalof the Acoustical Society of America 51, 1885–1894.
Humes, L. E., Christensen, L., Thomas, T., Bess, F. H., Hedley-Williams, A., and Bentler,R. A. (1999), “A comparison of the aided performance and benefit provided by alinear and a two-channel wide dynamic range compression hearing aid,” Journal ofSpeech Language and Hearing Research 42, 65–79.
Humes, L. E., Christensen, L. A., Bess, F. H., and Hedley-Williams, A. (1997), “A com-parison of the benefit provided by well-fit linear hearing aids and instruments withautomatic reductions of low-frequency gain,” Journal of Speech Language and Hear-ing Research 40, 666–685.
Humes, L. E. and Wilson, D. L. (2004), “A comparison of single-channel linear ampli-fication and two-channel wide-dynamic-range-compression amplification by meansof an independent-group design,” American Journal of Audiology 13, 39–53.
IEC (1983), Hearing Aids - Part 2: Hearing Aids with automatic gain control circuits, Inter-national Electrotechnical Commission, IEC60118-2.
124

Bibliography
Jerger, S. and Jerger, J. (1981), Auditory Disorders, A Manual for Clinical Evaluation (Little,Brows and Company, Boston).
Kam, A. C. and Wong, L. L. (1999), “Comparison of performance with wide dynamicrange compression and linear amplification,” Journal of the American Academy ofAudiology 10, 445–457.
Kates, J. M. (1993), “Optimal estimation of hearing-aid compression parameters,” Jour-nal of the Acoustical Society of America 94, 1–12.
Killion, M. C. (1993), “The K-Amp hearing aid: An attempt to present high fidelity forpersons with impaired hearing,” American Journal of Audiology 2, 52–74.
Killion, M. C., Staab, W. J., and Preves, D. (1990), “Classifying automatic signal proces-sors,” Hearing Instruments 41, 24–26.
King, A. B. and Martin, M. C. (1984), “Is AGC beneficial in hearing aids?” BritishJournal of Audiology 18, 31–38.
Kochkin, S. (1999), “’Baby Boomers’ spur growth in potential market, but penetrationrate declines,” Hearing Journal 52, 33–48.
Kochkin, S. (2000), “MarkeTrak V: Why are my hearing aids in the drawer: The con-sumers’ perspective,” The Hearing Journal 53, 34–41.
Kochkin, S. (2002), “MarkeTrak VI: Consumers Rate Improvements Sought in HearingInstruments,” Hearing Review 9, 18–22.
Lippmann, R., Braida, L. D., and Durlach, N. I. (1981), “Study of multichannel ampli-tude compression and linear amplification for persons with sensorineural hearingloss,” Journal of the Acoustical Society of America 69, 524–534.
Lopez-Poveda, E. A., Plack, C. J., and Meddis, R. (2003), “Cochlear nonlinearity be-tween 500 and 8000 Hz in listeners with normal hearing,” Journal of the AcousticalSociety of America 113, 951–960.
Lopez-Poveda, E. A., Plack, C. J., Meddis, R., and Blanco, J. L. (2005), “Cochlear com-pression in listeners with moderate sensorineural hearing loss,” Hearing Research205, 172–183.
Lyzenga, J., Festen, J., and Houtgast, T. (2002), “A speech enhancement scheme incor-porating spectral expansion evaluated with simulated loss of frequency selectivity,”Journal of the Acoustical Society of America 112, 1145–1157.
Mare, M. J., Dreschler, W. A., and Verschuure, H. (1992), “The effects of input-outputconfiguration in syllabic compression on speech perception,” Journal of Speech andHearing Research 35, 675–685.
125

Bibliography
Marriage, J. E. and Moore, B. C. J. (2003), “New speech tests reveal benefit of wide-dynamic-range, fast- acting compression for consonant discrimination in childrenwith moderate-to-profound hearing loss,” International Journal of Audiology 42,418–425.
Møller, A. (2000), Hearing. Its Physiology and Pathophysiology (Academic Press, SanDiego).
Moore, B. (1998), Cochlear Hearing Loss (Whurr Publishers Ltd., London).
Moore, B. C. and Glasberg, B. R. (1986), “A comparison of two-channel and single-channel compression hearing aids,” Audiology 25, 210–226.
Moore, B. C. and Glasberg, B. R. (1988), “A comparison of four methods of implement-ing automatic gain control (AGC) in hearing aids,” British Journal of Audiology 22,93–104.
Moore, B. C., Johnson, J. S., Clark, T. M., and Pluvinage, V. (1992), “Evaluation of adual-channel full dynamic range compression system for people with sensorineuralhearing loss,” Ear and Hearing 13, 349–370.
Moore, B. C., Peters, R. W., and Stone, M. A. (1999), “Benefits of linear amplification andmultichannel compression for speech comprehension in backgrounds with spectraland temporal dips,” Journal of the Acoustical Society of America 105, 400–411.
Moore, B. C., Stainsby, T. H., Alcantara, J. I., and Kuhnel, V. (2004), “The effect onspeech intelligibility of varying compression time constants in a digital hearing aid,”International Journal of Audiology 43, 399–409.
Munro, K. J. and Lutman, M. E. (2003), “The effect of speech presentation level on mea-surement of auditory acclimatization to amplified speech,” Journal of the AcousticalSociety of America 114, 484–495.
Murugasu, E. (2005), “Recent advances in the treatment of sensorineural deafness,”Annals Academy of Medicine Singapore 34, 313–321.
Nabelek, I. V. (1983), “Performance of hearing-impaired listeners under various typesof amplitude compression,” Journal of the Acoustical Society of America 74, 776–791.
Nabelek, I. V. (1984), “Discriminability of the quality of amplitude-compressedspeech,” Journal of Speech and Hearing Research 27, 571–577.
Nedzelnitsky, V. (1980), “Sound pressures in the basal turn of the cat cochlea,” Journalof the Acoustical Society of America 68, 1676–1689.
Nelson, D. A. and Freyman, R. L. (1987), “Temporal resolution in sensorineuralhearing-impaired listeners,” Journal of the Acoustical Society of America 81, 709–720.
126

Bibliography
Nelson, D. A., Schroder, A. C., and Wojtczak, M. (2001), “A new procedure for mea-suring peripheral compression in normal-hearing and hearing-impaired listeners,”Journal of the Acoustical Society of America 110, 2045–2064.
Neuman, A. C., Bakke, M. H., Hellman, S., and Levitt, H. (1994), “Effect of compressionratio in a slow-acting compression hearing aid: paired-comparison judgments ofquality,” Journal of the Acoustical Society of America 96, 1471–1478.
Neuman, A. C., Bakke, M. H., Mackersie, C., Hellman, S., and Levitt, H. (1995), “Ef-fect of release time in compression hearing aids: paired-comparison judgments ofquality,” Journal of the Acoustical Society of America 98, 3182–3187.
Neuman, A. C., Bakke, M. H., Mackersie, C., Hellman, S., and Levitt, H. (1998), “The ef-fect of compression ratio and release time on the categorical rating of sound quality,”Journal of the Acoustical Society of America 103, 2273–2281.
Novick, M. L., Bentler, R. A., Dittberner, A., and Flamme, G. A. (2001), “Effects ofrelease time and directionality on unilateral and bilateral hearing aid fittings in com-plex sound fields,” Journal of the American Academy of Audiology 12, 534–544.
Olsen, H. L., Olofsson, A., and Hagerman, B. (2004), “The effect of presentation leveland compression characteristics on sentence recognition in modulated noise,” Inter-national Journal of Audiology 43, 283–294.
Oppenheim, A. V. and Schafer, R. W. (1989), Discrete-Time Signal Processing (Prentice-Hall, Englewood Cliffs).
Oxenham, A. J. and Bacon, S. P. (2003), “Cochlear compression: Perceptual measuresand implications for normal and impaired hearing,” Ear and Hearing 24, 352–366.
Oxenham, A. J. and Plack, C. J. (1997), “A behavioral measure of basilar-membranenonlinearity in listeners with normal and impaired hearing,” Journal of the Acousti-cal Society of America 101, 3666–3675.
Palmer, A. and Shamma, S. (2004), “Physiological representations of speech,” in SpeechProcessing in the Auditory System, edited by S. Greenberg, W. A. Ainsworth, A. N.Popper, and R. R. Fay (Springer, New York).
Peterson, M. E., Feeney, M. P., and Yantis, P. A. (1990), “The effect of automatic gaincontrol in hearing-impaired listeners with different dynamic ranges,” Ear and Hear-ing 11, 185–194.
Pickles, J. (1988), An Introduction to the Physiology of Hearing (Academic Press, London).
Plack, C. J. and Drga, V. (2003), “Psychophysical evidence for auditory compressionat low characteristic frequencies,” Journal of the Acoustical Society of America 113,1574–1586.
127
Bibliography
Plomp, R. (1994), “Noise, amplification, and compression: considerations of three mainissues in hearing aid design,” Ear and Hearing 15, 2–12, published erratum appearsin Ear Hear 1994,15, 6 (following table of contents).
Plomp, R. and Mimpen, A. M. (1979), “Improving the reliability of testing the speechreception threshold for sentences.” Audiology 18, 43–52.
Preves, D. (1991), “Output limiting and speech enhancement,” in The Vanderbilt HearingAid Report II, edited by G. A. Studebaker, F. H. Bess, and L. B. Beck (York Press,Parkton, MD).
Recio, A., Rich, N. C., Narayan, S. S., and Ruggero, M. A. (1998), “Basilar-membraneresponses to clicks at the base of the chinchilla cochlea,” Journal of the AcousticalSociety of America 103, 1972–1989.
Rhebergen, K. S., Versfeld, N. J., and Dreschler, W. A. (2005), “Release from informa-tional masking by time reversal of native and non-native interfering speech,” Journalof the Acoustical Society of America 118, 1274–1277.
Rintelmann, W. F. (1972), “Effects of amplitude compression upon speech perception:a review of research,” Scandinavian Audiology 1, 127–134.
Robinson, C. E. and Huntington, D. A. (1973), “The intelligibility of speech processedby delayed long-term averaged compression amplification,” Journal of the Acousti-cal Society of America 54, 314.
Robles, L. and Ruggero, M. A. (2001), “Mechanics of the mammalian cochlea,” Physio-logical Reviews 81, 1305–1352.
Roeser, R. J., Valente, M., and Hosford-Dunn, H. (2000), Audiology - Diagnosis (ThiemeMedical Publishers, New York).
Rose, J., Brugge, J., Anderson, D., and Hind, J. (1967), “Phase-locked response to low-frequency tones in single auditory nerve fibres in the squirrel monkey,” Journal ofNeurophysiology 30, 769–793.
Rosengard, P. S., Oxenham, A. J., and Braida, L. D. (2005), “Comparing different es-timates of cochlear compression in listeners with normal and impaired hearing,”Journal of the Acoustical Society of America 117, 3028–3041.
Rouiller, E. M. (1997), “Functional organization of the auditory pathways,” in The Cen-tral Auditory System, edited by G. Ehret and R. Romand (Oxford University Press,Oxford).
Ruggero, M. A. and Rich, N. C. (1991), “Furosemide alters organ of corti mechanics:evidence for feedback of outer hair cells upon the basilar membrane,” Journal ofNeuroscience 11, 1057–1067.
128
Bibliography
Ruggero, M. A., Robles, L., and Rich, N. C. (1992), “Two-tone suppression in the basi-lar membrane of the cochlea: mechanical basis of auditory-nerve rate suppression,”Journal of Neurophysiology 68, 1087–1099.
Sachs, M. B. and Kiang, N. Y. S. (1968), “Two-tone inhibition in auditory nerve fibers.”Journal of the Acoustical Society of America 43, 1120–1128.
Shanks, J. E., Wilson, R. H., Larson, V., and Williams, D. (2002), “Speech recognitionperformance of patients with sensorineural hearing loss under unaided and aidedconditions using linear and compression hearing aids,” Ear and Hearing 23, 280–290.
Smith, S. (1997), The Scientist and Engineer’s Guide to Digital Signal Processing (CaliforniaTechnical Publishing, San Diego).
Smoorenburg, G. F. (1972), “Combination tones and their origin,” Journal of theAcoustical Society of America 52, 615–632.
Smoorenburg, G. F. (1974), “On the mechanisms of combination tone generations andlateral inhibition in hearing,” in Psychophysical Models and Physiological Facts in Hear-ing, edited by E. Zwicker and E. Terhardt (Springer, New York).
Souza, P. E. (2002), “Effects of compression on speech acoustics, intelligibility, andsound quality.” Trends in Amplification 6, 131–165.
Souza, P. E. and Kitch, V. (2001), “The contribution of amplitude envelope cues to sen-tence identification in young and aged listeners,” Ear and Hearing 22, 112–119.
Stone, M. A., Moore, B. C., Wojtczak, M., and Gudgin, E. (1997), “Effects of fast-actinghigh-frequency compression on the intelligibility of speech in steady and fluctuatingbackground sounds,” British Journal of Audiology 31, 257–273.
Stuart, A. and Phillips, D. P. (1996), “Word recognition in continuous and interruptedbroadband noise by young normal-hearing, older normal-hearing, and presbyacusiclisteners,” Ear and Hearing 17, 478–489.
Summers, V. and Molis, M. R. (2004), “Speech recognition in fluctuating and continu-ous maskers: effects of hearing loss and presentation level,” Journal of Speech Lan-guage and Hearing Research 47, 245–256.
The Capital Region Otitis Media Project (2000), Ear Infections in Children, State of NewYork, Department of Health, New York, NY, Publication 4815.
The Mathworks, Inc. (2001), “MATLAB, R12.1,” Natick, MA.
Turner, C. W., Humes, L., Bentler, R., and Cox, R. (1996), “A review of past research onchanges in hearing aid benefit over time,” Ear and Hearing 17, 14S–25S.
129

Bibliography
Tyler, R. S. and Kuk, F. K. (1989), “The effects of ’noise suppression’ hearing aids onconsonant recognition in speech-babble and low-frequency noise [published erra-tum appears in Ear Hear 1989 Dec;10(6):399],” Ear and Hearing 10, 243–249.
Van Buuren, R. A., Festen, J. M., and Houtgast, T. (1999), “Compression and expansionof the temporal envelope: evaluation of speech intelligibility and sound quality,”Journal of the Acoustical Society of America 105, 2903–2913.
Van Tasell, D. J. and Trine, T. D. (1996), “Effects of single-band syllabic amplitude com-pression on temporal speech information in nonsense syllables and in sentences,”Journal of Speech and Hearing Research 39, 912–922.
Van Toor, T. and Verschuure, H. (2002), “Effects of high-frequency emphasis and com-pression time constants on speech intelligibility in noise,” International Journal ofAudiology 41, 379–394.
Verschuure, J., Benning, F. J., Van Cappellen, M., Dreschler, W. A., and Boeremans, P. P.(1998), “Speech intelligibility in noise with fast compression hearing aids,” Audiol-ogy 37, 127–150.
Verschuure, J., Dreschler, W. A., De Haan, E. H., Van Cappellen, M., Hammerschlag,R., Mare, M. J., Maas, A. J., and Hijmans, A. C. (1993), “Syllabic compression andspeech intelligibility in hearing impaired listeners,” Scandinavian Audiology. Sup-plementum 38, 92–100.
Verschuure, J., Stikvoort, E., De Jong, R. M., Goedegebure, A., and Dreschler, W. A.(1996), “Compression and its effect on the speech signal,” Ear and Hearing 17, 162–175.
Versfeld, N. J., Daalder, L., Festen, J. M., and Houtgast, T. (2000), “Method for the selec-tion of sentence materials for efficient measurement of the speech reception thresh-old,” Journal of the Acoustical Society of America 107, 1671–1684.
Versfeld, N. J. and Dreschler, W. A. (2002), “The relationship between the intelligibil-ity of time-compressed speech and speech in noise in young and elderly listeners,”Journal of the Acoustical Society of America 111, 401–408.
Villchur, E. (1973), “Signal processing to improve speech intelligibility in perceptivedeafness,” Journal of the Acoustical Society of America 53, 1646–1657.
Villchur, E. (1978), “A critical survey of research on amplitude compression,” Scandi-navian Audiology. Supplementum 6, 305–314.
Villchur, E. (1987), “Multichannel compression processing for profound deafness,”Journal of Rehabilitation Research and Development 24, 135–148.
Von Bekesy, G. (1960), Experiments in Hearing (McGraw-Hill, New York).
130

Bibliography
Walker, G., Byrne, D., and Dillon, H. (1984), “The effects of multichannel compres-sion/expansion amplification on the intelligibility of nonsense syllables in noise,”Journal of the Acoustical Society of America 76, 746–757.
Yanick, P. (1976a), “Discrimination in the presence of competition with an AVC vs. aDRC hearing aid.” Journal of the American Audiology Society 1, 169–172.
Yanick, P. (1976b), “Effects of signal processing on intelligibility of speech in noise forpersons with sensorineural hearing loss,” Journal of the American Audiology Soci-ety 1, 229–238.
Yund, E. W. and Buckles, K. M. (1995a), “Enhanced speech perception at low signal-to-noise ratios with multichannel compression hearing aids,” Journal of the AcousticalSociety of America 97, 1224–1240.
Yund, E. W. and Buckles, K. M. (1995b), “Multichannel compression hearing aids: effectof number of channels on speech discrimination in noise,” Journal of the AcousticalSociety of America 97, 1206–1223.
Yund, E. W., Simon, H. J., and Efron, R. (1987), “Speech discrimination with an 8-channel compression hearing aid and conventional aids in background of speech-band noise,” Journal of Rehabilitation Research and Development 24, 161–180.
Zeng, F. G., Kong, Y. Y., Michalewski, H. J., and Starr, A. (2005), “Perceptual conse-quences of disrupted auditory nerve activity,” Journal of Neurophysiology 93, 3050–3063.
131

Bibliography
132

Nederlandstalige samenvatting
In moderne hoortoestellen gebruikt men geavanceerde signaalbewerking om het inko-mende geluid te bewerken en te versterken. Het hoortoestel is meer dan een eenvou-dige geluidversterker: het toestel reageert actief op het binnenkomende geluid. De sig-naalbewerking is complex. Het toestel wordt gestuurd door de eigenschappen van hetingaande geluid zoals geluidsterkte, fluctuaties in geluidsterkte en frequentie-inhoudvan het signaal.
Desondanks zijn veel hoortoestelgebruikers toch niet volledig tevreden met hun toe-stel. Een veelgehoorde klacht is dat het moeilijk is om een gesprek te volgen in eenrumoerige omgeving, zoals in een restaurant of op een feestje. Vooral mensen met eenzogenaamd perceptief gehoorverlies hebben veel last van achtergrondlawaai. Een per-ceptief gehoorverlies wordt veroorzaakt door schade aan het binnenoor: het komt door“kapotte gehoorcellen”. Zelfs als geavanceerde hoortoestellen worden gebruikt, leidteen perceptief gehoorverlies veelal tot een verminderd spraakverstaan in lawaai. He-laas komt deze vorm van gehoorverlies veelvuldig voor. Dit verlies heeft veel gangba-re oorzaken zoals ouderdom, excessieve blootstelling aan hoge geluidniveaus, erfelijkefactoren en voor het oor schadelijke medicatie.
Naast verminderd spraakverstaan heeft perceptief gehoorverlies nog een vervelendgevolg: geluiden met een laag niveau (“zachte geluiden”) worden niet meer waar-genomen terwijl geluiden met een hoog niveau (”harde geluiden”) even hard en somszelfs harder klinken. Er zit dus een kern van waarheid in de karikatuur van de (percep-tief) slechthorende die zegt “Kun je iets harder praten, ik versta je niet” en vervolgensroept “He! Je hoeft niet zo te schreeuwen, ik ben niet doof!”. Om dit gevolg van per-ceptief gehoorverlies te verminderen, wordt vaak gebruik gemaakt van compressieveversterking. Deze compressieve versterking (of kort: compressie) kan automatisch hetvolume van het hoortoestel regelen. Zachte geluiden worden automatisch versterkt enharde geluiden blijven comfortabel doordat ze weinig of geen versterking krijgen. Zovertelde een van onze proefpersonen dat ze door haar nieuwe compressieve hoortoe-stellen weer kan genieten van haar ochtendwandelingen. Ze kan nu de vogels horenfluiten zonder dat ze aan de volumeknop hoeft te draaien en zonder te vrezen voorpijnlijk harde geluiden van passerend verkeer.
133

Samenvatting
Compressie in hoortoestellen kan niet alleen het luistercomfort verbeteren, het kan ookde spraakverstaanbaarheid beınvloeden. Helaas is nog niet duidelijk wat de invloedis van belangrijke compressieparameters op het spraakverstaan in lawaai. Bovendienis het onbekend of het effect van een bepaalde parameter wordt beınvloed door deinstelling van een andere parameter (interactie). We hebben daarom een uitgebreidexperiment opgezet waarin de effecten van vier compressieparameters in onderlingesamenhang werden onderzocht. Ons onderzoek was volledig parametrisch. Dit wilzeggen dat alle mogelijke combinaties van de compressieparameters zijn gebruikt. Deonderzochte parameters zijn het aantal frequentiekanalen (NC = 1, 2, of 6), de compres-sieratio voor frequenties respectievelijk onder en boven 1 kHz (CRlow/CRhigh = 1/2 tot3/3), en de in- en uitregeltijd (Ta/Tr = 4 tot 400 ms). Als referentie hebben we verster-king zonder compressie, oftewel lineaire versterking, gebruikt.
In onze studies zijn twee soorten ruis gebruikt: stationaire en fluctuerende ruis. Beidetypen ruis hadden de spectrale kenmerken (frequentie-inhoud) van spraak. Stationai-re ruis klinkt als het constante geruis van een waterval. Deze ruis hebben we gekozenomdat deze eenduidig is gedefinieerd en omdat deze wordt gezien als een standaard.Onze fluctuerende ruis had de temporele veranderingen (modulaties) van achterstevo-ren afgespeelde spraak. Dit type achtergrondruis is gekozen omdat het klinkt als eenonverstaanbare spreker en dus relevant is voor de dagelijkse praktijk van een slecht-horende. Bovendien hebben slechthorenden in het algemeen minder profijt van demomenten van lage geluidsterkte in fluctuerende ruis dan normaalhorenden. Alle ex-perimenten zijn uitgevoerd met een lage compressiedrempel zodat het hele signaalwerd gecomprimeerd. Alle geıncludeerde proefpersonen hadden een matig percep-tief gehoorverlies. De stimuli werden aangeboden op een geluidniveau dat binnenhet resterend dynamisch bereik van de proefpersonen lag, zodat de spraak ook zon-der compressie hoorbaar was. Dit heeft als voordeel dat het effect van compressie ophet spraakverstaan werd veroorzaakt door de verandering in het spraaksignaal en nietdoor een betere hoorbaarheid van de spraak (zoals bijvoorbeeld nodig is voor te zachtespraak of voor de bovengenoemde zachte vogelgeluiden).
Hoofdstuk 1 geeft een overzicht van de werking van ons gehoor. Het beschrijft de ge-luidtransmissie door het oor en de gevolgen van schade aan het oor. De focus van hethoofdstuk ligt op de cochlea (het slakkenhuis). De huidige gedachte is dat de cochleade primaire bron is van compressieve versterking in het oor zelf. Deze cochleaire ver-sterking heeft een grote invloed op de auditieve perceptie. Het kan veel niet-lineaireaspecten van de geluidverwerking door het gehoor verklaren. Als de cochleaire com-pressie is verminderd door gehoorbeschadiging, dan is het wellicht zinvol om eenhoortoestel van compressie te voorzien. Het hoofdstuk eindigt daarom met een kortebeschrijving van eigenschappen en implementaties van compressie in hoortoestellen.
134

Samenvatting
Hoofdstuk 2 bestudeert het effect van compressie op het spraakverstaan in een stati-onaire achtergrondruis. De studie richt zich op mensen met een matig perceptief ge-hoorverlies. Enkele voorgaande onderzoeken lieten een kleine verbetering in spraak-verstaan zien met compressie ten opzichte van lineaire versterking. Hoewel sommigeexperimenten resulteerden in verslechterd spraakverstaan met compressie, bleek inhet algemeen dat compressie het spraakverstaan niet verslechterde ten opzichte vanlineaire versterking. Dit was met name het geval voor compressie met een beperktaantal frequentiekanalen en een lage compressieratio. Experimenten met een groteraantal frequentiekanalen gaven onderling verschillende resultaten. Nagenoeg geenenkel voorgaand onderzoek was gericht op het vaststellen van mogelijke interactiestussen de compressieparameters.
In ons onderzoek werd de ’Speech Reception Threshold in ruis’ (SRT) gebruikt als maatvoor spraakverstaanbaarheid. De focus lag op het effect van compressieve versterkingten opzichte van lineaire versterking. Daarom hebben we ∆SRT geıntroduceerd: ∆SRTis het verschil tussen de spraakverstaanbaarheid met enerzijds compressie en ander-zijds lineaire versterking. Een lagere ∆SRT komt overeen met een betere spraakver-staanbaarheid met compressie dan met lineaire versterking. De compressieparametersvan een specifiek compressiesysteem noteren we als CP ( NC, CRlow/CRhigh, Ta/Tr) (of-tewel: het aantal kanalen, de compressieratio en de in- en uitregeltijd).
Ons experiment liet zien dat de meeste compressiecondities een slechtere spraak-verstaanbaarheid opleverden dan lineaire versterking. De resultaten voor twee- enzeskanaals-compressie waren nagenoeg gelijk aan elkaar. Enkelkanaals-compressiegaf de slechtste resultaten. De resultaten suggeerden dat de tweekanaals-compressiewellicht zou kunnen worden verbeterd door optimalisatie van de frequentie waarbijde compressieratio werd gesplitst (1000 Hz). Een compressieratio van 3/3 gaf slechte-re resultaten dan de lagere compressieratio’s. De combinatie van de grootste tijdcon-stanten (Ta/Tr = 40/400 ms) resulteerde in betere spraakverstaanbaarheid dan snellerecompressie.
Het experiment was specifiek opgezet om mogelijke interactie-effecten te bestuderen.Of anders gezegd, we wilden weten of het effect van een bepaalde parameter (bijvoor-beeld de uitregeltijd) zou worden beınvloed door de instelling van een andere para-meter (bijvoorbeeld het aantal frequentiekanalen). De resultaten lieten een statistischsignificant effect van NC * T zien. Dit betekent dat het effect van de tijdconstanten afhing van het aantal frequentiekanalen: snelle enkelkanaals-compressie gaf een slech-tere spraakverstaanbaarheid dan snelle meerkanaals-compressie. Bovendien was deinteractie NC * CR * T significant. Dit geeft aan dat een specifieke combinatie van com-pressieparameters een verslechtering (bijvoorbeeld CP ( 1, 3/3, 4/4)) of een verbete-ring (zoals CP ( 2, 2/3, 40/40)) kan opleveren. De beste spraakverstaanbaarheid werdbereikt met tweekanaals-compressie (CP ( 2, 2/3, 40/40), ∆SRT =−0.7 dB). Het besteresultaat met zeskanaals-compressie werd gemeten voor CP ( 6, 2/2 + 2/3, 40/400)
135

Samenvatting
(∆SRT =−0.4 dB). De beste spraakverstaanbaarheid voor enkelkanaals-compressiewas gelijk aan de spraakverstaanbaarheid voor lineaire versterking. De verbeterin-gen van 0.7 en 0.4 dB komen overeen met verbeteringen in het spraakverstaan vanrespectievelijk 12 en 7%.
Hoofdstuk 3 richt zich op compressie van spraak in een fluctuerende achtergrond-ruis. De achtergrondruis had het frequentiespectrum van spraak, met de achterstevo-ren gedraaide temporele modulaties van de spreker. Voorgaand onderzoek voor ma-tig perceptief gehoorverlies gaf geen duidelijk beeld van het effect van compressie ineen fluctuerende ruis. Hoewel een enkel onderzoek een verbetering in spraakverstaan-baarheid liet zien onder invloed van compressie (ten opzichte van lineaire versterking),resulteerden de meeste onderzoeken in gelijke spraakverstaanbaarheid of zelfs in eenverslechtering. Compressie in fluctuerende ruis gaf iets betere resultaten dan in statio-naire ruis. Voor fluctuerende ruis is, net als voor stationaire ruis, weinig bekend overinteracties tussen de compressieparameters.
Ons experiment liet zien dat compressie slechts een kleine invloed had op de spraak-verstaanbaarheid. Ondanks de bekende spectrale en temporele contrastverlaging doormeerkanaals-compressie bleek het effect van meerkanaals-compressie op de spraak-verstaanbaarheid toch beperkt. Dit werd waarschijnlijk veroorzaakt doordat compres-sie de laag-energetische delen van spraak extra kan versterken tijdens de gaten in deruis waardoor de temporele maskering vermindert. Het experiment leverde slechtseen statistisch significant resultaat op: zeskanaals-compressie gaf slechtere spraakver-staanbaarheid dan enkel- en tweekanaals-compressie. Ten opzichte van stationaire ruisgaf enkelkanaals-compressie in fluctuerende ruis een minder slechte spraakverstaan-baarheid. In tegenstelling tot stationaire ruis waren interactie-effecten niet significantvoor fluctuerende ruis. De compressie-instellingen die goede resultaten opleverdenvoor stationaire ruis, gaven ook goede resultaten voor fluctuerende ruis. De beste sco-re (∆SRT =−0.9 dB) werd gemeten voor enkelkanaals-compressie: CP ( 1, 2/2, 40/40).Een verschil van −0.9 dB lijkt erg weinig, maar het komt overeen met een verbeteringin zinscore van ongeveer 15%. De beste spraakverstaanbaarheid voor tweekanaals-compressie was gemeten voor CP ( 2, 2/3, 40/40) (∆SRT =−0.7 dB). Deze combinatieleverde ook de beste spraakverstaanbaarheid voor stationaire ruis (∆SRT =−0.7 dB,hoofdstuk 2). De combinatie CP ( 6, 2/3, 40/400) gaf voor zeskanaals-compressie debeste spraakverstaanbaarheid in stationaire ruis en resulteerde in een goed resultaatvoor fluctuerende ruis (∆SRT =−0.4 dB).
De resultaten suggereren dat stationaire ruis beter geschikt is dan fluctuerende ruisom het effect van compressie op de spraakverstaanbaarheid te meten. Voor stationaireruis waren de (negatieve) effecten van compressie groter en de variantie in de SRT-resultaten kleiner.
136
Samenvatting
Hoofdstuk 4 evalueert het effect van compressie op het spraakverstaan voor indivi-duele luisteraars. In het merendeel van de voorgaande onderzoeken werd geen statis-tisch significante correlatie gevonden tussen het effect van compressie op de spraak-verstaanbaarheid en de audiometrische kenmerken. Voorgaande onderzoeken die weleen significante correlatie gaven, lieten zowel positieve als negatieve correlaties zien.Het bleef daarom onduidelijk voor welke slechthorenden compressie het meeste nutheeft. Bovendien werd niet duidelijk welke specifieke compressie-eigenschappen hetbeste spraakverstaan opleveren voor individuele luisteraars. Omdat in voorgaand on-derzoek geen duidelijk beeld werd geschetst, hebben we de grote hoeveelheid datavan de voorgaande hoofdstukken opnieuw geanalyseerd.
Voor onze proefpersonen was het effect van compressie nogal klein ten opzichte van devariantie binnen proefpersonen. Bovendien was de meetfout groter voor proefperso-nen met een slechter spraakverstaan in ruis. Het effect van compressie was niet signifi-cant gecorreleerd met standaard audiometrische kenmerken zoals de hoordrempel enhet dynamisch bereik. Voor stationaire ruis lieten de resultaten echter een significanterelatie zien tussen het effect van compressie (∆SRT) en de SRT voor lineaire verster-king voor de laagste twee compressie ratio’s (CR = 1/2 en CR = 2/2). Voor stationaireruis bleek het beste resultaat van compressie significant beter te zijn voor proefperso-nen met een slechtere SRT. Deze correlaties suggereren dat een eventueel effect vancompressie beter zou kunnen worden vastgesteld aan de hand van metingen van hetspraakverstaan in stationaire ruis dan aan de hand van toondrempels of het dynamischbereik. De meeste regels voor de aanpassing van hoortoestellen zijn echter gebaseerdop toondrempels.
Hoofdstuk 5 geeft een samenvatting en bespreekt kort de toepasbaarheid van de re-sultaten in de dagelijkse praktijk van hoortoestelaanpassing. Er wordt voorgesteld omeen hoortoestel in eerste aanleg aan te passen op basis van spraakverstaanbaarheid instationaire ruis, bijvoorbeeld aan de hand van de algemene resultaten van deze studie.Daarna kunnen andere belangrijke zaken individueel worden geoptimaliseerd zoalsbijvoorbeeld hoortoestelcomfort, luistergemak, hoorbaarheid, helderheid van het ge-luid en muziekbeleving.
137

Samenvatting
138

Dankwoord
In de afgelopen jaren heb ik in het AZU met veel plezier aan mijn proefschrift gewerkt.Graag wil ik enkele mensen bedanken voor hun ondersteuning. Zonder hen was deafgelegde weg een stuk zwaarder geweest.
Allereerst wil ik mijn promotor, prof.dr. Guido F. Smoorenburg, noemen. Guido, har-telijk bedankt voor al je hulp en voor de plezierige samenwerking. Je scherpe blik enkritische houding zorgden ervoor dat elke bespreking een leuke en leerzame ervaringwas.
Organisatorisch was het was wel eens lastig dat ik geen co-promotor of dagelijkse be-geleider had. Op zulke momenten sprong Sjaak Klis in de bres. Sjaak, ik heb je inzet,ondersteuning en gezelligheid erg gewaardeerd.
Tijdens een promotie breng je een groot gedeelte van je tijd door met je kamergeno-ten. Daarmee had ik het bijzonder getroffen op het AZU. Mijn eerste kamergenootwas Natalie Cappaert. Naast een liefde voor het vak deelde ik met haar een voorlief-de voor dropjes, punkmuziek en het spelen van squash. Bovendien heb ik als fysicusveel geleerd van haar biologielessen. Natalie, ik vond het erg fijn om met je gewerkt tehebben. Maar als ik je vaker met squash had laten winnen, was je dan wel in Utrechtgebleven? Ik vind het heel leuk dat je mijn paranimf wilt zijn! Nadat Natalie Utrechtverruild had voor Amsterdam kwam Huib Versnel. Huib, als fysicus heb je een nuch-tere blik op het vakgebied. Onder het genot van een ’tas koffie’ hebben wij dan ookvele leuke en waardevolle discussies gevoerd. Dank!
Als AiO zit je allemaal in hetzelfde schuitje. Eenmaal van wal vertrokken op ontdek-kingstocht in nieuwe gebieden is het erg fijn als je weet dat je enkele medevaardershebt. Bij deze wil ik de AiO’s bedanken die er mede voor gezorgd hebben dat ik nietafdwaalde of verdronk. Marjolein, vanaf het begin konden we het uitstekend samenvinden. Van ”maar het is toch maar 100 gulden” tot het geweldige ”Volkswagen in eenvolksbuurt”! Ciska, hartelijk dank voor je collegialiteit. Martijn, je eerst-praten-dan-denken-mentaliteit bracht een frisse sfeer op de afdeling, geweldig.
Hulpvaardige collega’s zijn onmisbaar en daarom wil ik Pieter Lamore bedanken. Piet,dankzij je grote audiologische kennis, je oog voor details en je hulpvaardigheid heb jemij heel goed geholpen, bedankt!
139

Dankwoord
”Do Lipton employees take coffee breaks?” vroeg de acteur Steven Wright zich ooitaf. Als fervent theedrinker was ik toch regelmatig in de koffiekamer te vinden. Ik wilde koffiekamerbezoekers bedanken voor hun gezelligheid: Bas, Frank, Frans, Ferry,Frits, Jan-Willem, Jeroen, John, Jurjaan, Kelly, Krista, Margreet, Tania, en alle anderen.Dankzij jullie heb ik een hele leuke tijd op het AZU gehad.
Onder het genot van een Guinness heb ik regelmatig gediscussieerd over allerhan-de akoestische onderwerpen met de leden van het ATO (Akoestisch Tafel Overleg).”Guinness for strength” luidt de slagzin. In welke mate het aan de Guinness lag ofaan het gezelschap weet ik niet, maar deze bijeenkomsten waren zonder uitzonderinguiterst inspirerend en boeiend. Jongens, bedankt!
Ook ben ik veel dank verschuldigd aan mijn proefpersonen. Ik heb veel respect voordeze mensen die urenlang naar zinnetjes hebben geluisterd in een kleine en vaak war-me audiologische cabine. Maar zoals het materiaal zelf vermeldde: ”het werk is nietvoor niets geweest” 1 en ”gelukkig is het eindpunt bijna bereikt” 1.
Ten slotte wil ik mijn familie en vrienden bedanken voor hun steun en welgemeendeinteresse. En Mark, heel erg bedankt dat je speciaal voor mij een pinguinpakje aantrekt!
1 Geparafraseerd uit het voor dit proefschrift gebruikte testmateriaal.
140

Curriculum Vitae
10 September 1972 Born in Weert, the Netherlands
1984–1990 VWO (‘pre-university education’),Philips van Horne Scholengemeenschap, Weert
1990–1996 Physics at Eindhoven University of Technology,Traineeship at IPO, Institute for Perception Research, Eindhoven,Traineeship at RTC Cork, department of Applied Physics, Cork, Ireland,Final research project at Philips Research Laboratories, Eindhoven
1997–2000 Peutz Consulting Engineers, MookDepartment of Industrial Noise and Vibration Control
2000–2005 PhD student at Hearing Research Laboratories,University Medical Center Utrecht
2005–now Academic Medical Center, Amsterdam,Department of Clinical and Experimental Audiology
141

Curriculum Vitae
142