the economics of leed for existing buildings - · pdf fileindividual prerequisites –...
TRANSCRIPT
Michael ArnyPresident, Leonardo Academy
The Economics of LEED for Existing Buildings
1

Introduction to Leonardo Academy
• A Charitable (501c3) nonprofit organization
• Mission: advancing sustainability
• A Think and Do Tank
• Develops new approaches and methods for sustainability
• Supports implementation of new approaches and methods
• Areas of Work
• Overall sustainability for organizations
• LEED® implementation and certification support
• Emissions footprints, reduction strategies and offsets– Cleaner and Greener Program certifies achievements
• ANSI Sustainability Standards Development– Emissions, organizations, vehicles, sustainable agriculture products
2

LEED-EB Economics: Based on Leonardo Academy 2008 Study
• “The Economics of LEED for Existing Buildings, 2008 Edition”
• About the Study:– All building owners/managers of LEED-EB certified – All building owners/managers of LEED-EB certified
buildings were sent a cost survey in 2006 & 2007
– 23 LEED-EB building owners/managers responded (43% response rate)
– Gathered data on LEED-EB Pilot and V2.0
– See full report at: www.leonardoacademy.org
– Report was sponsored by Johnson Controls

Mean Total Certification Costs by Certification Level
$1.73
$1.84
Gold
Platinum
Mean Total Certification Cost per Square Foot, By Level
$1.58
$1.59
$1.22
$1.73
$0.00 $0.20 $0.40 $0.60 $0.80 $1.00 $1.20 $1.40 $1.60 $1.80 $2.00
All Buildings
Certified
Silver
Gold
Cost per square foot
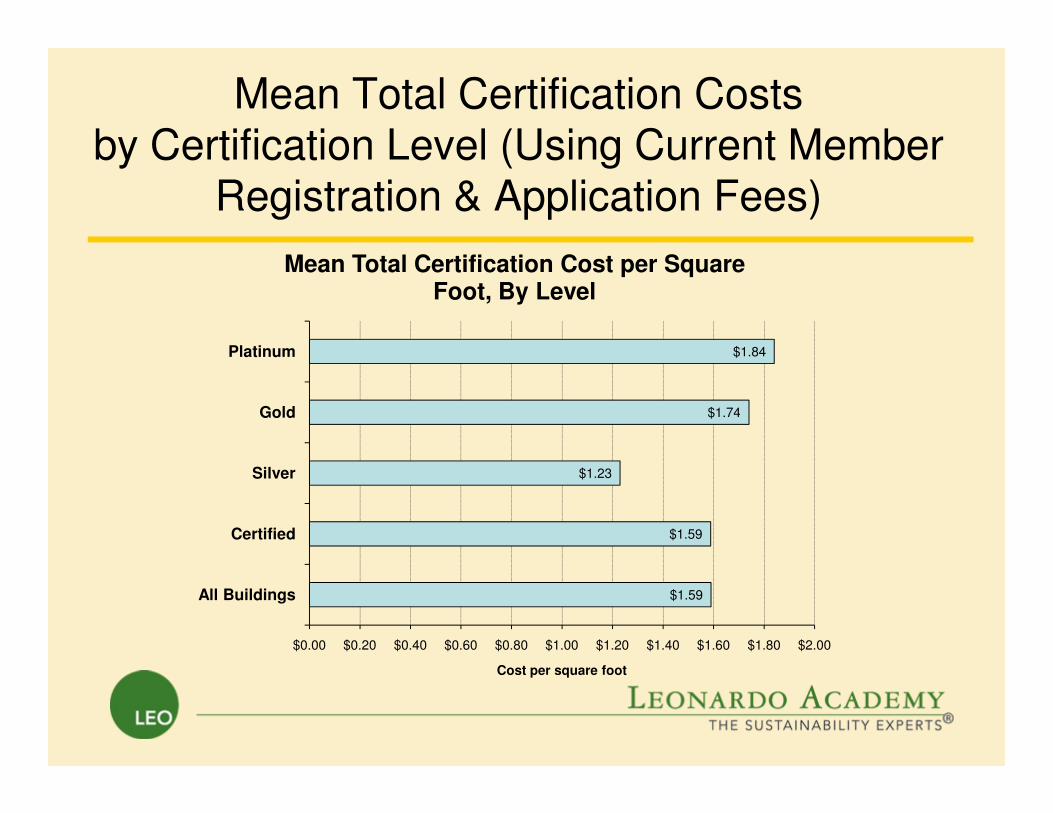
Mean Total Certification Costs by Certification Level (Using Current Member
Registration & Application Fees)
$1.74
$1.84
Gold
Platinum
Mean Total Certification Cost per Square Foot, By Level
$1.59
$1.59
$1.23
$1.74
$0.00 $0.20 $0.40 $0.60 $0.80 $1.00 $1.20 $1.40 $1.60 $1.80 $2.00
All Buildings
Certified
Silver
Gold
Cost per square foot

Mean Certification Cost Components by Certification Level
$0.54
$1.04
$1.19
$0.87
Gold
Platinum
Mean Certification Costs per Square Foot, By Level
$0.88
$1.01
$0.91
$0.54
$0.73
$0.57
$0.31
$0.00 $0.20 $0.40 $0.60 $0.80 $1.00 $1.20 $1.40
All Buildings
Certified
Silver
Mean Cost per Square Foot
Total Hard Costs
Total Soft Costs

Mean Certification Cost Components by Certification Level Using Current Member
Registration & Application Fees
$0.55
$0.97
$1.19
$0.87
Gold
Platinum
Mean Certification Costs per Square Foot, By Level
$0.87
$1.01
$0.93
$0.55
$0.73
$0.58
$0.31
$0.00 $0.20 $0.40 $0.60 $0.80 $1.00 $1.20 $1.40
All Buildings
Certified
Silver
Mean Cost per Square Foot
Total Hard Costs
Total Soft Costs

Mean Soft Cost Components by Certification Level
Gold
Platinum
Other
Application Fee
0.00 0.20 0.40 0.60 0.80 1.00 1.20
All Buildings
Certified
Silver
Application Fee
Registration Fee
Consulting
Staff
Total
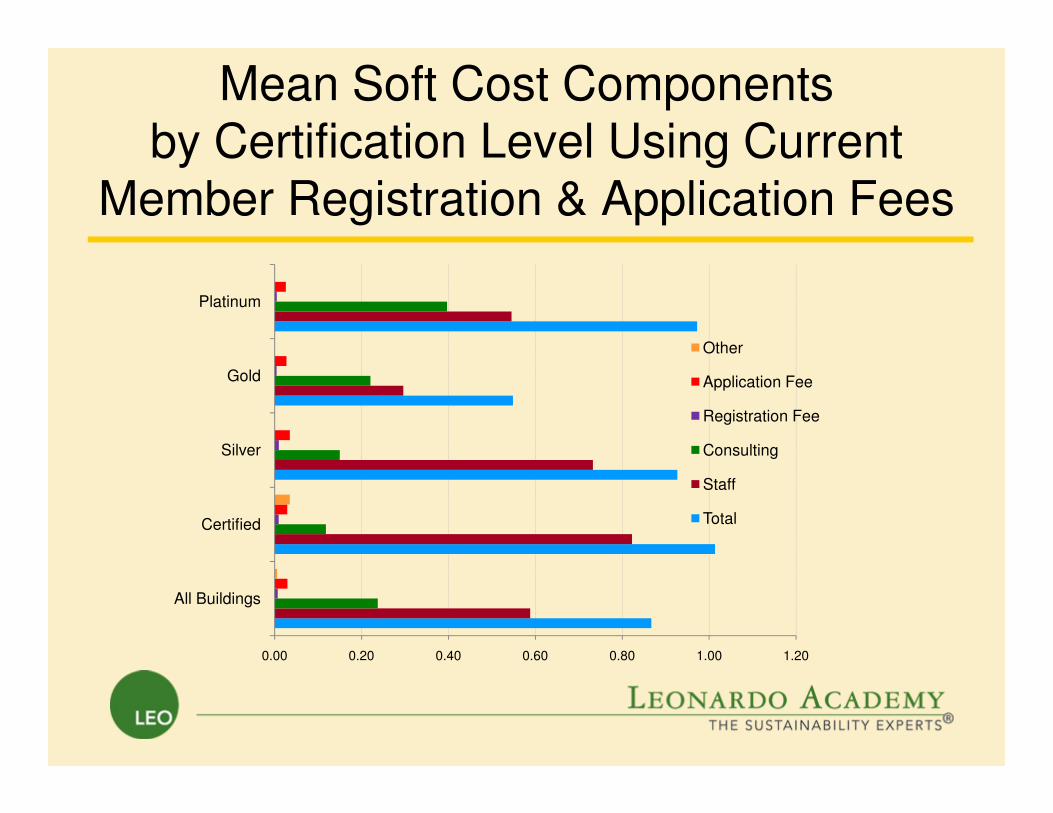
Mean Soft Cost Components by Certification Level Using Current
Member Registration & Application Fees
Gold
Platinum
Other
Application Fee
0.00 0.20 0.40 0.60 0.80 1.00 1.20
All Buildings
Certified
Silver
Registration Fee
Consulting
Staff
Total

Mean Certifications Costs forAll Certification Levels Combined
Mean Median Minimum Maximum
Staff Hours 0.013 hr 0.008 hr 0.001 hr 0.041 hr
Staff Costs (internal labor) $0.59 $0.33 $0.04 $1.78
Consulting Costs $0.24 $0.41 $0.00 $1.49 Consulting Costs $0.24 $0.41 $0.00 $1.49
Registration Fee $0.02 $0.01 $0.00 $0.10
Application Fee $0.01 $0.01 $0.00 $0.04
Total Soft Costs $0.86 $0.67 $0.01 $1.89
Total Soft Cost without internal labor
$0.27 $0.10 $0.01 $1.54
Total Hard Costs $0.73 $0.11 $0.00 $3.14
Total: All Costs $1.58 $1.52 $0.02 $5.01

Mean Certifications Costs forAll Certification Levels Combined Using Current
Member Registration & Application Fees
Mean Median Minimum Maximum
Staff Hours 0.013 hr 0.008 hr 0.001 hr 0.041 hr
Staff Costs (internal labor) $0.59 $0.33 $0.04 $1.78
Consulting Costs $0.24 $0.41 $0.00 $1.49
Registration Fee $0.01 $0.003 $0.00 $0.02
Application Fee $0.03 $0.25 $0.01 $0.06
Other Soft Costs $0.01 $0.00 $0.00 $0.06
Total Soft Costs $0.86 $0.70 $0.03 $1.87
Total Soft Cost without internal labor
$0.28 $0.10 $0.03 $1.54
Total Hard Costs $0.73 $0.11 $0.03 $3.14
Total: All Costs $1.59 $1.55 $0.03 $5.01

Cost Chart Definitions
– Soft Costs =
• Internal Labor + Consulting Costs + USGBC Registration Fees + USGBC Application Fees (Note: the 2 building added costs in an “other” (Note: the 2 building added costs in an “other” category)
– Hard Costs =
• Building improvement costs + equipment costs

• Respondents were asked to identify which prerequisites and credits they found to be:
– Low or no cost actions
Low/No Cost vs. Significant Costs
– Low or no cost actions
– Significant cost actions

Mean Scores Across All Categories
n = 23
75.5%
73.7%
24.5%
26.3%
Water Efficiency
Sustainable Sites
Low or No Cost
Significant Cost
Actions Found to be Low/No Cost vs. Significant Cost
60.9%
71.4%
82.5%
58.4%
28.3%
28.6%
17.5%
41.6%
0% 10% 20% 30% 40% 50% 60% 70% 80% 90% 100%
Innovations
Indoor Environmental Quality
Materials and Resources
Energy and Atmosphere
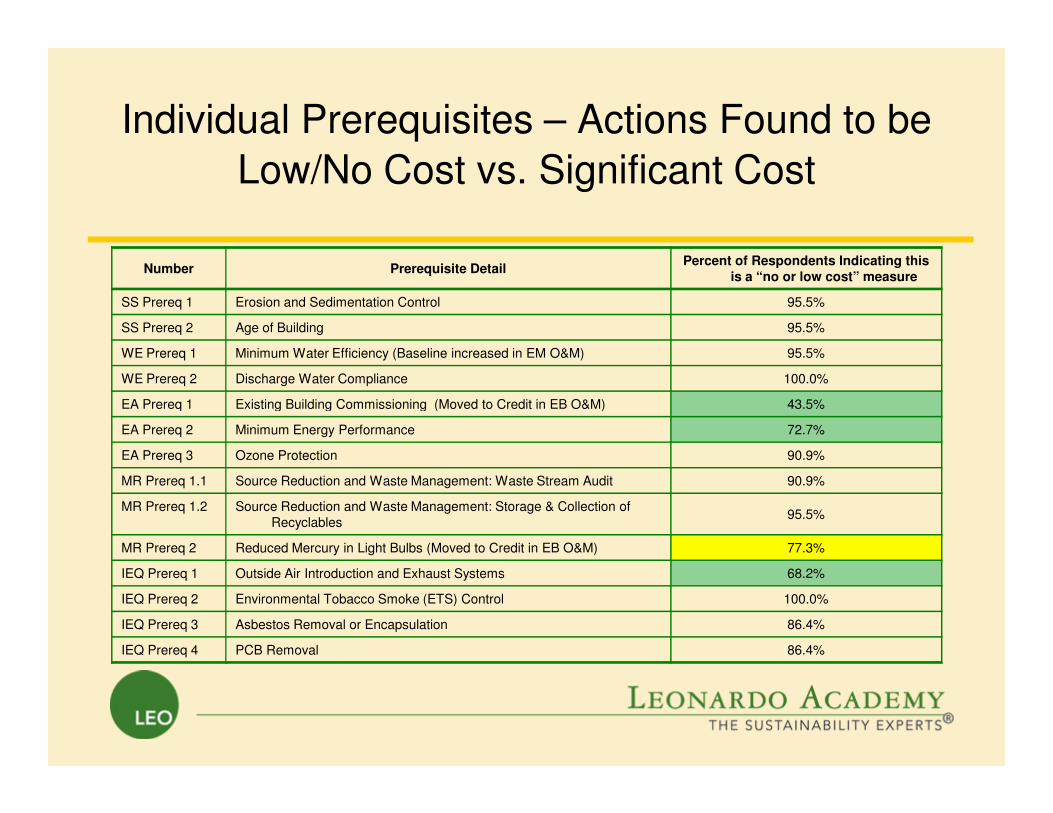
Individual Prerequisites – Actions Found to be
Low/No Cost vs. Significant Cost
Number Prerequisite DetailPercent of Respondents Indicating this
is a “no or low cost” measure
SS Prereq 1 Erosion and Sedimentation Control 95.5%
SS Prereq 2 Age of Building 95.5%
WE Prereq 1 Minimum Water Efficiency (Baseline increased in EM O&M) 95.5%
WE Prereq 2 Discharge Water Compliance 100.0%
EA Prereq 1 Existing Building Commissioning (Moved to Credit in EB O&M) 43.5%EA Prereq 1 Existing Building Commissioning (Moved to Credit in EB O&M) 43.5%
EA Prereq 2 Minimum Energy Performance 72.7%
EA Prereq 3 Ozone Protection 90.9%
MR Prereq 1.1 Source Reduction and Waste Management: Waste Stream Audit 90.9%
MR Prereq 1.2 Source Reduction and Waste Management: Storage & Collection of Recyclables
95.5%
MR Prereq 2 Reduced Mercury in Light Bulbs (Moved to Credit in EB O&M) 77.3%
IEQ Prereq 1 Outside Air Introduction and Exhaust Systems 68.2%
IEQ Prereq 2 Environmental Tobacco Smoke (ETS) Control 100.0%
IEQ Prereq 3 Asbestos Removal or Encapsulation 86.4%
IEQ Prereq 4 PCB Removal 86.4%

LEED-EB Prerequisite Cost Curve Per Cent Respondents Identifying as Significant Cost
40
50
60C
en
t R
esp
on
den
ts
0
10
20
30
40
Per
Cen
t R
esp
on
den
ts

LEED-EB Credit Cost Curve Per Cent Respondents Identifying as Significant Cost
60
70
80
90
Cen
t R
esp
on
den
ts
0
10
20
30
40
50
60
Per
Cen
t R
esp
on
den
ts
LEED-EB Credits

Key Changes in LEED-EB VersionsFrom: v2.0 to vO&M to vO&M 2009
With Cost Impacts
• Energy Prerequisite (EAp2)
– v2.0 before June 2007: Min. Energy Star Score: 60
– v2.0 after June 2007: Min. Energy Star Score: 67– v2.0 after June 2007: Min. Energy Star Score: 67
– vO&M: Min. Energy Star Score: 69
– vO&M 2009 Min. Energy Star Score: 69

Key Changes in LEED-EB VersionsFrom: v2.0 to vO&M to vO&M 2009
With Cost Impacts
• Commissioning – v2.0:
» Prerequisite: Full commissioning in 1-5 years
» Credit: 1 point for additional commissioning» Credit: 1 point for additional commissioning
– vO&M:
» Prerequisite: Operating plan plus basic energy audit
» Credit: 6 points for implementing commissioning
– vO&M:
» Prerequisite: ??Operating plan plus basic energy audit
» Credit: ??6 points for implementing commissioning

• Water Fixture Prerequisite (WEp1)– V2.0:
» All Fixtures:
» Baseline = Water use of EPACT fixtures x 1.2
– O&M:
Key Changes in LEED-EB VersionsFrom: v2.0 to vO&M to vO&M 2009
With Cost Impacts
– O&M:
» Fixtures installed before 1994:
» Baseline = Water use of IPC/UPC-2006 fixtures x 1.6
» Fixtures installed 1994 or later:
» Baseline = Water use of EPACT fixtures x 1.2
• Water Fixture Points (WEc2)– V2.0: 2 points, O&M: ?4 points

– Respondents were asked for specific operating costs for their buildings.
– The responses were broken down to per
LEED-EB Operating Costs
– The responses were broken down to per square foot costs.
– Then compared to the 2007 BOMA data available for their region.
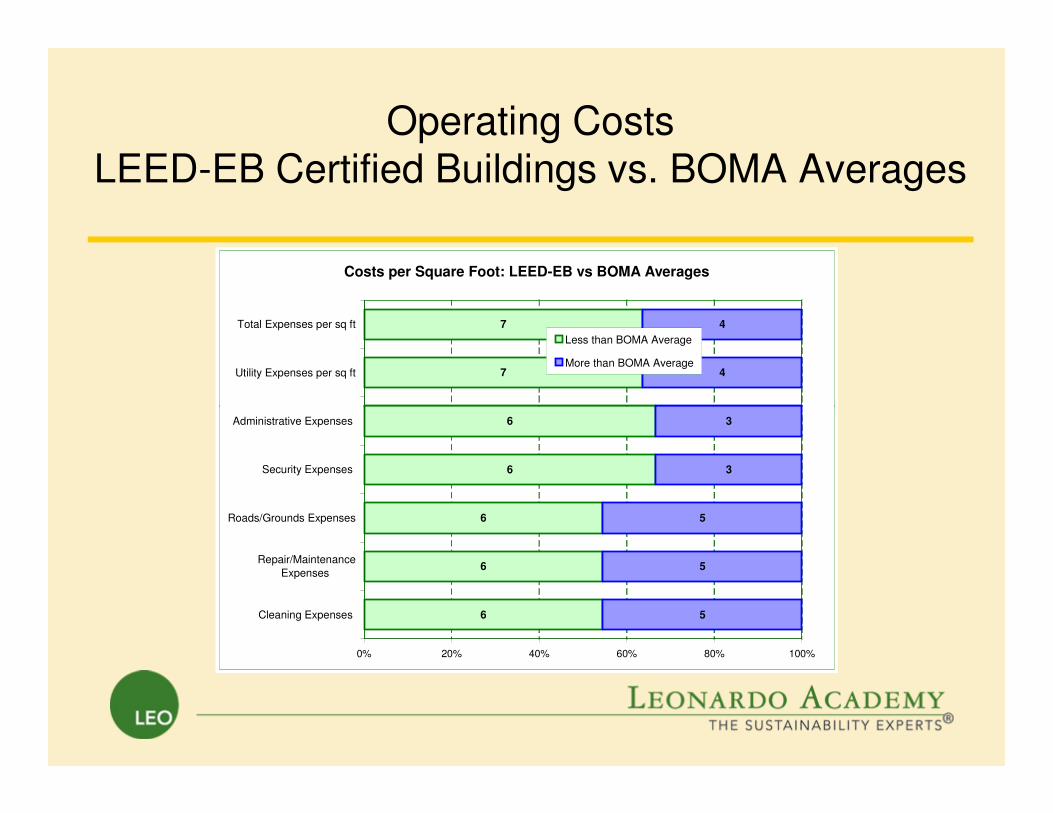
Operating Costs LEED-EB Certified Buildings vs. BOMA Averages
Costs per Square Foot: LEED-EB vs BOMA Averages
7
7
4
4
Utility Expenses per sq ft
Total Expenses per sq ft
Less than BOMA Average
More than BOMA Average
6
6
6
6
6
5
5
5
3
3
0% 20% 40% 60% 80% 100%
Cleaning Expenses
Repair/Maintenance
Expenses
Roads/Grounds Expenses
Security Expenses
Administrative Expenses

Competitive Market-Based Benefits of Sustainable Buildings

The Competitive Market:
Creating Financial Benefits for Certification
• As benefits of LEED Certified buildings gain recognition in the marketplace these will be recognized in financial transactions:
– Building insurance rates:– Building insurance rates:
– The impact of sustainability on sales in retail environments is starting to be recognized.
– Office Building Leasing

Reduced Building Insurance Costs
– For LEED Certified buildings:• Provides reduced building insurance rates
• If the building is destroyed, they provide coverage for rebuilding to LEED standards
– All commercial buildings they insure:• If the building is destroyed, they provide coverage for
rebuilding to LEED standards
– Note: Fireman’s Fund Insurance was the first insurance company to offer this type of benefits in 2006 and now 4 or 5 insurance companies provide some sort of LEED certification benefits.
Increased Sales in Sustainable Buildings
Skylighting and Retail Sales, Heshong Mahone Group, 1999
– All other things being equal, an average non-skylit store in the chain would likely have 40% higher sales with the addition of skylights, with a probable range between 31% and 49%. This was found with 99% statistical certainty.
– If a typical non-skylit store were averaging sales of $2/sf, then its sales might be expected to increase to between $2.61 and $2.98 with the addition of a skylighting system.

Commercial Office Buildings –Impact of LEED Certification
– Increased Occupancy: 4.1 % *
– Increased Rents: $ 11.33 per sq. ft.*
– Increased Sale Price: $ 171 per sq. ft.*– Increased Sale Price: $ 171 per sq. ft.*
– * Ref: CoStar Report. March 26, 2008

The Competitive Market: Expect Growth
in Financial Benefits for LEED Certification
– The door has been opened for financial recognition in the competitive marketplace of the benefits of LEED certification!
– Expect the scope and magnitude of – Expect the scope and magnitude of financial recognition to expand in the future.

Soft Now but Expected to be Powerful in the Future -Occupant Productivity, etc.
The Soft Benefits of LEED Buildings

Overview of the Soft Benefits of LEED
– While the soft benefits of LEED are a nice positive extra now, as the evidence on these benefits grow they will become a compelling driver for increased building sustainability.building sustainability.
– The current soft benefits include:– Occupant productivity
– Recruiting
– Reduced turnover
– Increase sales in retail buildings
– Reduced building insurance costs
– Potential for reduce health care costs
Why is increasing occupant productivity occupant productivity
so important?

Occupants’ Salaries are 85%of the Cost of Office Building Operation
130
80
100
120
140
An
nu
al*
$/s
q.f
t
21
1.53 0.28 1.370
20
40
60
80
An
nu
al*
$/s
q.f
t
Salaries Rent Electricity Other
Energy
O & M
* 1991 Source: BOMA, EPRI, Statistical Abstract in RMI "Greening the Building and the Bottom Line, 1994

Studies onIncreased Occupant Productivity Increased Occupant Productivity
in Sustainable Buildings
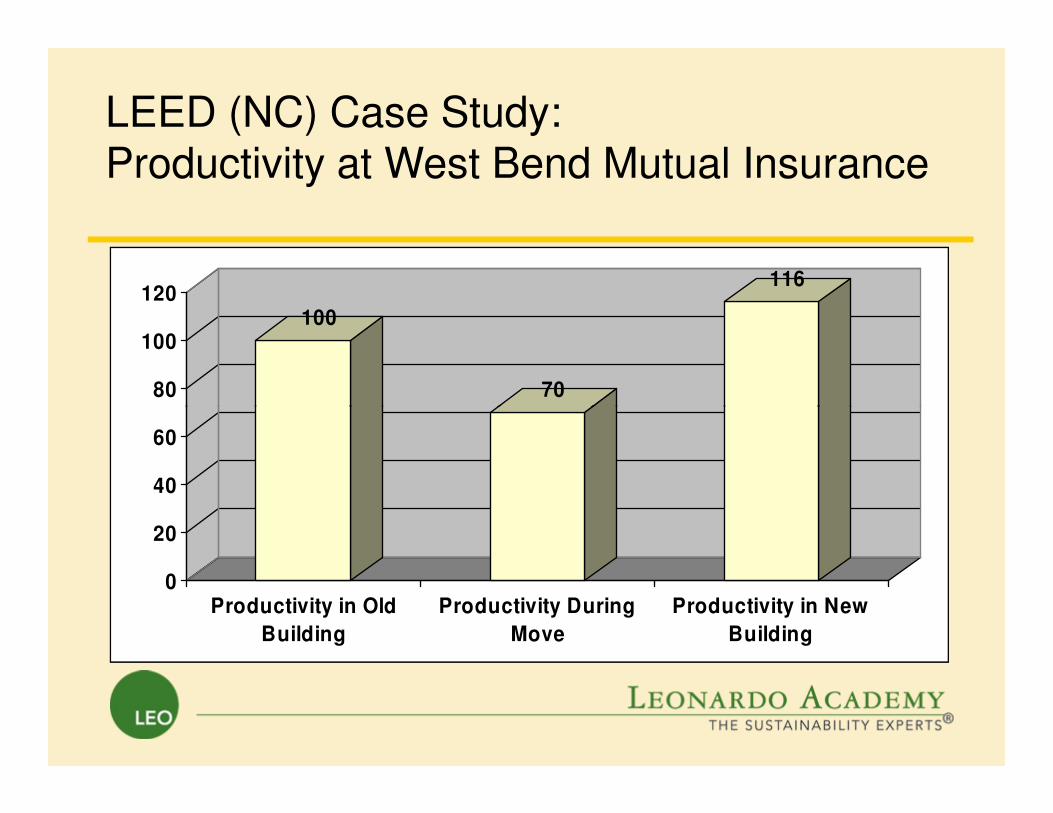
100
70
116
80
100
120
LEED (NC) Case Study: Productivity at West Bend Mutual Insurance
0
20
40
60
Productivity in Old
Building
Productivity During
Move
Productivity in New
Building

LEED-EB Case Studies

Case Study 1: JohnsonDiversey Distribution Center

Building History Overview
• Building History – Operation started on
July 1, 2007
– Built to suit leased building owned by Liberty Property
– JohnsonDiversey specified levels of LEED-NC and – JohnsonDiversey specified levels of LEED-NC and LEED-EB performance:
» in RFP and
» in Lease Contract

Project History Overview
• LEED Design and Construction Team» Owner: Liberty Property Trust
» Lessor: JohnsonDiversey
» LEED-NC Consultant: ReVision Architects» LEED-NC Consultant: ReVision Architects
» LEED-EB Consultant: Leonardo Academy
» Lessor Representative: A. Epstein and Sons International
» Building Architect: Stephen Perry Smith Architects
» Builder: Riley Construction

Project History Bottom Line Overview
• By specifying LEED-NC and LEED-EB performance in RFP and lease agreement and picking great partners who could deliver
– JohnsonDiversey got a great building with the – JohnsonDiversey got a great building with the benefits of both:
» LEED-NC achievements of reduced environmental impacts of construction and potential for sustainable performance
» A building designed to make it easy to succeed with delivered sustainable performance under LEED-EB

LEED-EB Implementation
and Certification
• JohnsonDiversey– LEED-EB implementation lead: David Nicklas
– Building Manager: Bruce Maples
– LEED Team includes: All internal staff and external service providers that support building operations and Leonardo providers that support building operations and Leonardo Academy
• Cost of Implementing LEED-EB– Dave Nicklas, “There is a significant staff time commitment for
getting up the leaning curve on implementing LEED-EB. Our goal is for this to become standard practice and not and extra activity. Beyond registration and certification fees and consultant guidance, there are no significant costs for our implementing LEED-EB”.
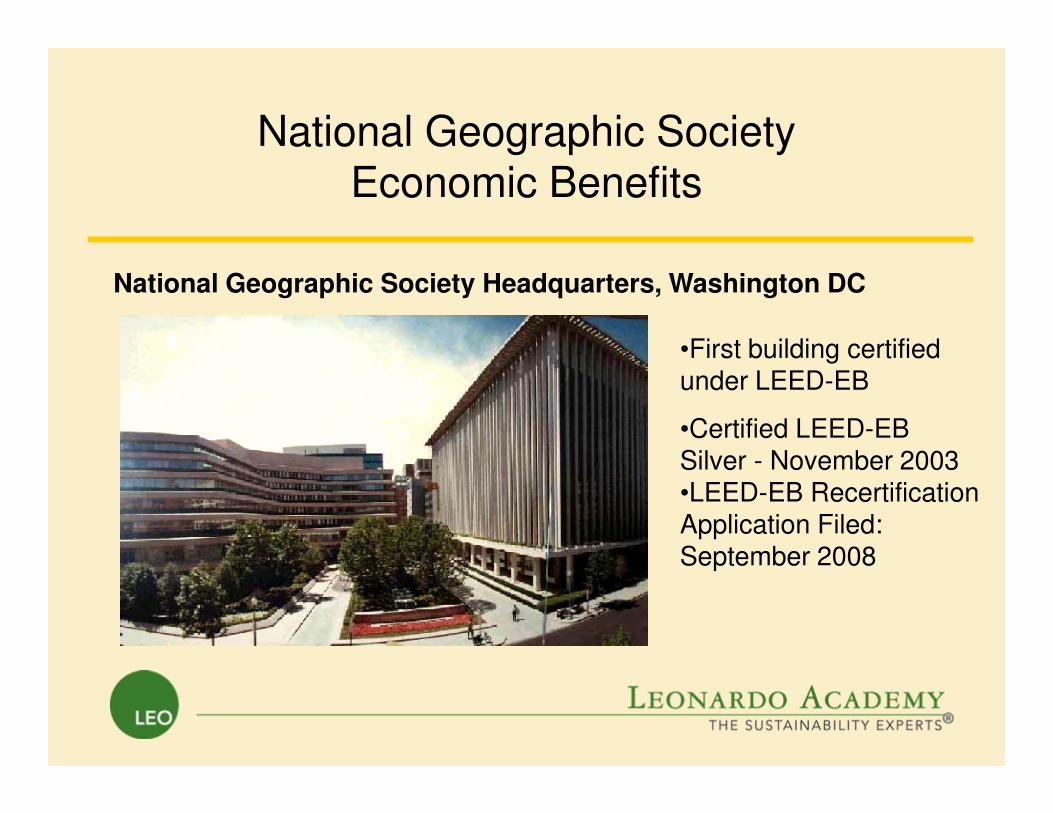
National Geographic Society Economic Benefits
•First building certified under LEED-EB
National Geographic Society Headquarters, Washington DC
•Certified LEED-EB Silver - November 2003•LEED-EB Recertification Application Filed: September 2008

National Geographic Society LEED-EB Costs & Benefits
• Consistent with National Geographic Society mission
• Operating cost savings– Lower energy cost– Lower energy cost– Lower water consumption– Lower waste disposal expenses– Increased awareness of building operation
• Increased Market Value– Increased building valuation– Improved equity and debt borrowing capacity

National Geographic SocietyFiled Recertification Application
• Project leaders:
– Bob Cline, Director, General Services
– Richard Neal, Chief Engineer
• Focus is on implementing operational improvements
• Using LEED-EB v2.0

Johnson Controls Brengel Center Economic Benefits
Johnson Controls Brengel Technology Center, Milwaukee, WI
•Initially Certified LEED Silver under LEED-NC in 2000
•Re-certified LEED Gold under LEED-EB March 2004

Johnson Controls Brengel Center Economic Benefits
• 25-30 percent operational savings (maintenance costs, janitorial costs) relative to other similar JCI facilities in Milwaukee area due to LEED Programs (NC and EB)Programs (NC and EB)
• No FTEs for maintenance and operations were added, even though 130,000 sq. feet were added
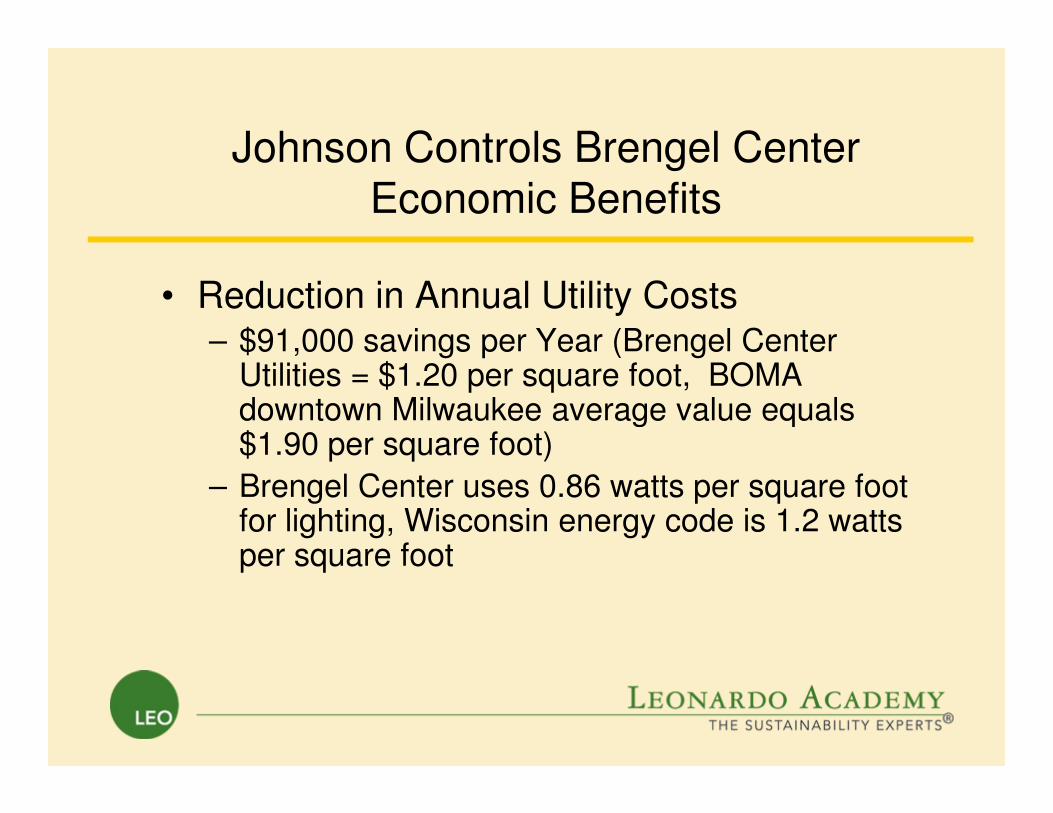
Johnson Controls Brengel Center Economic Benefits
• Reduction in Annual Utility Costs– $91,000 savings per Year (Brengel Center
Utilities = $1.20 per square foot, BOMA downtown Milwaukee average value equals downtown Milwaukee average value equals $1.90 per square foot)
– Brengel Center uses 0.86 watts per square foot for lighting, Wisconsin energy code is 1.2 watts per square foot

Johnson Controls Brengel Center Economic Benefits
Director of Facilities and Building Services, Ward Komorowski, of Johnson Controls states,
“I spend a good deal of time – at least once or twice a “I spend a good deal of time – at least once or twice a week – giving tours of the facility. Visits to the Brengel’s Showcase for Building Environments have been tracked, and they’re able to show an impact of $223M in business.”

Contact for Additional Information
Michael Arny
President
Leonardo Academy
608.280.0255
www.leonardoacademy.org
File: \\Server\Leonardo_Data\Conferences and Presentations\1 - Standard Leonardo Academy Presentations\LEED-EB Economics\2009-1-27 LEO-LEED-EB Economics
49