the economics of good governance, or what the south can ... · the belief that a high-quality...
TRANSCRIPT

Working Paper Research Unit EU Integration
Stiftung Wissenschaft und
Politik
German Institute for
International
and Security Affairs
©
Ognian N. Hishow
The economics of good governance, or what the South can learn from Eastern Europe
Working papers are papers in
the subject area of a Research
Unit, which are not officially
published by SWP. These papers
are either preliminary studies
that later become papers
published by SWP or papers
that are published elsewhere.
Your comments are always
welcome.
Ludwigkirchplatz 3 4
10719 Berlin
Phone +49 30 880 07-0
Fax +49 30 880 07-100
www.swp-berlin.org
Working Paper FG 1, 2007/ 16, August 2007SWP Berlin

Table of Content
Abstract 3
Introduction 3
Institutions and growth 4
The path to prosperity 12Eastern Europe: Administrative framework and regulation imported or copied 13Supply-side policies for catching-up 16
Conclusions 17
Appendix 19
Sources and References 20
Key words: institutions and growth, economic governance and catch-up, development under globalization, labor and human capital utilization

Abstract
SWP-BerlinAugust 2007
3
Abstract
In the following paper the depth and direction of an assumed correlation between good governance and output growth in a globalized world is discussed. Poorly performing economies tend to have an institutional matrix suppressing incentives and productive innovations. The dismal tax collection in Sub-Saharan Africa and in many Latin American countries as well as the sprawling black economy there is tale-telling how vested interests can marginalize official structures.
The methodological approach employs several correlations to visualize some crucial links in the sense of the conference theme. To avoid the confusion between simple correlation and causation, some more regres-sions using a broader range of variables were run. Since suitable explana-tory variables often display greater cross-country variance than time series we conduct cross-country tests using most recent data. The variable to be foremost explained is the country rank in terms of per capita GDP as defined by the World Bank.
The findings are in line with the vast body of literature on the subject, i.e. there are not specific factors linked to the Third world only. Hence, the question which specific action can be taken by governments to escape poverty remains open. Instead of repeating well known “recommenda-tions”, we believe the experience of the European post communist states, which are as diverse as the developing world, serves as a guide how economies in disarray can return to growth and more prosperity. The Eastern Europeans had to comply with the requirements of the highly detailed Acquis communautaire in terms of shape and quality of institu-tions and governance. The reorganization of the old oppressive systems was painful but also fruitful, especially as regards taming corruption. The paper concludes that the European experience is applicable to the develop-ing word: opening up, adjustment to the best practices and removing institutional barriers to growth is paying off. The respective tailor-made policy measures are left to the governments and international aid organi-zations.
Introduction
The belief that a high-quality public administration and governance, other things equal, facilitates greater economic output and thus higher standard of living is not new. This applies to the opposite case too: poor governance is a source of poverty and low income per capita. Why then, is the world
Institutions and growth
SWP-BerlinAugust 2007
4
divided – in terms of income – in a smaller rich and a bigger poorer part? Obviously, the task to make a country’s economy in general, and its public administration in particular, fit for up-to-date requirements is less easy than widely assumed. Some claim that sensitivity to local customs and indigenous local cultures, as well as the notion of spirituality, and the need to embark on a more holistic and multicultural course didn’t seem to matter in rapidly globalizing world (Jabbra, 2006). Perhaps they are right: it is a tenet of contemporary economics and growth theories that low-income economies should develop faster because of higher marginal product of capital. Therefore they eventually would converge on the developed nations, local cultures or not. But as research results point out, good institutional framework and good governance is required to over-come path dependence in places which can be a major source of poor performance.
The paper is organized as follows: In a first section the link between institutions and growth is discussed by employing cross-country statistical data. The role of sound budgets and broader revenue base as well as the effect of foreign development assistance is highlighted. In a second section the recent experience of the new member states of the European Union in terms of institutional modernization and the respective lessons for the developing world is commented. The conclusion part contains a few policy recommendations and best practice measures by drawing on the experi-ence of the integration process in Europe.
The data used are foremost from the World Bank Doing Business research project that has developed a database to measure the effect of institutional framework by country on the respective country’s investment, productiv-ity, growth, and so forth. Various indicators of business regulations indicate the institutional costs of doing business and are used to analyze specific regulations that enhance or constrain the economy.
Institutions and growth
Voices to adopt best practices by developing countries (DCs) and the need for opening-up the economy to international competition and investment have been heard for decades. At the same time critics believe that the imitative system has not worked well, for example because demands on the public sector in the countries of the South to provide more services to citizens are coupled with the counterproductive urge to shrink their bureaucracies, privatize, and follow the costly competitive fads prevailing in the industrialized nations (Jabbra, 2006). But what ensures that gov-ernments provide better services than the private sector? And is the pressure to modernize solely exogenous? In 1960 the Central African

Institutions and growth
SWP-BerlinAugust 2007
5
Republic was 50 percent wealthier than Taiwan but in 2000 Taiwan proved to be 17 times richer- due to much higher growth (Barro, 2004). Yet it is hardly convincing to think Taiwan, a country with an old and rich history, has given up his traditions in an attempt to westernize. As well as Japan, China, and currently India, and others did not and do not.
Hence wisdom is emerging that nations which meet international stan-dards for development move up the ladder of economic prospect: “second world” countries become advanced ones while developing countries modernize and catch-up with the second and first world, and so on. More recently the experience of the enlarged European Union regarding real convergence seems to justify such an assumption. In their rush for EU membership the Central and Eastern European States (CEES) had to comply with the requirements of the Union in terms of shape and quality of institutions and governance. But in the old-EU institution building is still going on too, even after half a century of integration. This is first of all because since the foundation of the European Communities there never has been a complete, i.e. finished, political system in place. Neither was there a clear consensus on how a European institutional backbone should look like in detail. And as the European Union is constantly changing its face due to continuous enlargement and due to the extension of compe-tences, its political system must remain flexible in order to accommodate these changes. For that reason institutional dynamism is one of the key characteristics of the European Union, and it is probably also the most important resource for its future success (Metz, 2006). East Europeans have accepted the necessity of rebuilding their institutions foremost against the background of the catching-up process, which they must speed up to raise their income and quality of life. In the same line of thinking developing countries eager to converge on the developed world are called on for better institution building and good economic governance.
But some heavy-weight economist warn that opening-up and removing barriers to trade will harm if there is lack of proper governance and decently working institutions (Bhagwati, 2002). The latter are basically related to an efficient tax system, transparent and participatory budgets centered on key development tasks, an independent Central bank guard-ing price stability, and public control of government spending to prevent embezzlement and corruption. The Millennium Development Goals (MDGs) contain a broader list of the most urgent tasks, and a swelling body of literature figure out international capital is a key prerequisite for faster development. This finding followed a previously pursued idea of import-substituting industrialization, a model initially applied in the former Soviet bloc. But in the late 1980s a new conventional wisdom in favor of liberalization and free market emerged, and the importance of capital and know-how import became a central in the debate about development. According to this view the attractiveness of a nation as regards foreign investment is linked to differences in institution-building (Winiecki, 2004). Countries lacking good governance may not succeed in pulling an econ-omy out of poverty and crisis. This is the case when foreign direct invest-

Institutions and growth
SWP-BerlinAugust 2007
6
ment (FDI) circumvents nations with a poor infrastructure and weak institutions (Sachs et al., 2004). Statistically, there is a robust link between the quality of institutions and the level of development in a cross-country comparison (Figure 1).
Figure 1: Worldwide* correlation between institutional quality and level of
income, 2004/2005
R2 = 0,610
50
100
150
200
250
0 50 100 150 200
Quality of institutions
Ran
k of
dev
elop
men
t
A sample of 172 developed and developing countries is considered. Source: World Bank,
Doing Business 2005, http://www.doingbusiness.org/; World Bank, Fact and Figures, Per
Capita Income 2004, http://www.worldfactsandfigures.com/gdp_country_desc.php
While FDI allow for better integration into the world economy, their pay-off is usually less, as governments in DG often embark on a “race to the bottom” in terms of tax preferences, investment subsidies and profit repatriation. Hence, for local development projects the countries must generate more own resources and invest them properly. This is what the Millennium Project calls for: a drastic increase in the public expenditures of developing countries themselves. In low-income countries, the propor-tion of public expenditures to gross national income would need to increase by 4 percentage points by the year 2015 (Martens, 2007). Govern-ments are required to double public spending on the MDGs to fight poverty, improve nutrition and water quality as well as health care, and involve more persons into education. The challenge is to fund more spending through higher tax revenues on the one hand, and redirection of the current spending towards more “democratic” goals serving the entire society.
This gives an idea of the critical importance of a global institutional framework for growth in DC, as called for in the MDGs. The rationale of the MDGs idea was to embark on a broad program to stimulate a general process of mutually strengthening reforms in the DCs labor, financial, product-related and service-related markets. Specifically, some emerging economies, foremost China, Korea and Taiwan, achieved remarkable growth which resulted in a per capita GDP around the OECD average (Korea), or in rapidly closing the gap (China). In other countries however,
Institutions and growth
SWP-BerlinAugust 2007
7
the catch-up process has not been even. Rather, after a rapid convergence in the wake of the industrialization at the turn of the 20th century, Argentina’s economy had entered a long period of decay which culmi-nated in an intensively discussed financial collapse 100 years later. Chile succeeded in switching to a more sustained convergence path back in the 1970s. Indonesia did well until the mid-nineties when the catch-up process flagged under conditions of weak growth. Worse, Bangladesh has not been able to noticeably narrow the gap yet.
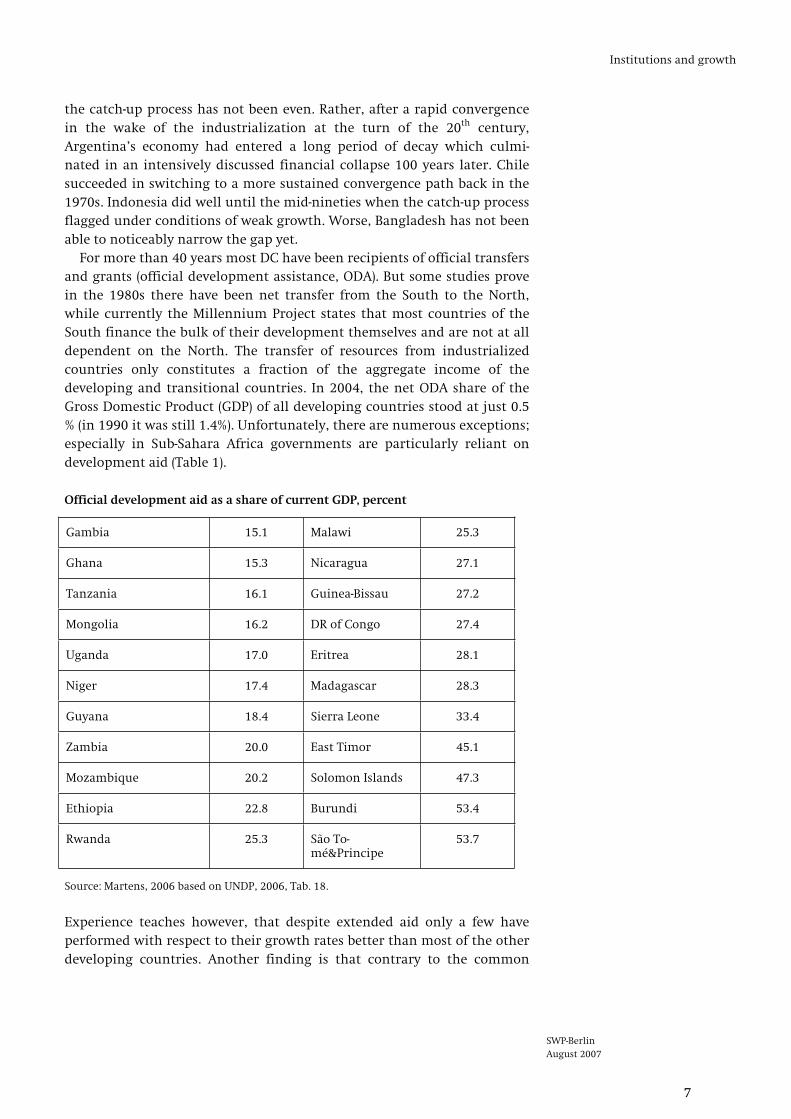
For more than 40 years most DC have been recipients of official transfers and grants (official development assistance, ODA). But some studies prove in the 1980s there have been net transfer from the South to the North, while currently the Millennium Project states that most countries of the South finance the bulk of their development themselves and are not at all dependent on the North. The transfer of resources from industrialized countries only constitutes a fraction of the aggregate income of the developing and transitional countries. In 2004, the net ODA share of the Gross Domestic Product (GDP) of all developing countries stood at just 0.5 % (in 1990 it was still 1.4%). Unfortunately, there are numerous exceptions; especially in Sub-Sahara Africa governments are particularly reliant on development aid (Table 1).
Official development aid as a share of current GDP, percent
Gambia 15.1 Malawi 25.3
Ghana 15.3 Nicaragua 27.1
Tanzania 16.1 Guinea-Bissau 27.2
Mongolia 16.2 DR of Congo 27.4
Uganda 17.0 Eritrea 28.1
Niger 17.4 Madagascar 28.3
Guyana 18.4 Sierra Leone 33.4
Zambia 20.0 East Timor 45.1
Mozambique 20.2 Solomon Islands 47.3
Ethiopia 22.8 Burundi 53.4
Rwanda 25.3 São To-mé&Principe
53.7
Source: Martens, 2006 based on UNDP, 2006, Tab. 18.
Experience teaches however, that despite extended aid only a few have performed with respect to their growth rates better than most of the other developing countries. Another finding is that contrary to the common

Institutions and growth
SWP-BerlinAugust 2007
8
perception, especially the rapidly advancing DCs are not on the payroll of the West. In China and India the ODA share lies at 0.1 % of the GDP, in Malaysia at 0.2 % (Martens, 2007). Central to their success are their own efforts to mobilize financial resources by employing, inter alia, better rule of law.
Research results identify the most frequent reasons for the failure of governments to mobilize more budget revenues being boiled down to (Martens, 2006):
1. Ineffective tax systems and weak tax authorities helpless to prevent a thriving shadow economy.
2. Trade liberalization and tariff reductions as well as pressure from foreign investors for tax race to the bottom.
3. Uncertain monetary environment encouraging capital flight to tax havens.
While countries cannot circumvent the pressure of globalization they surely can address the domestic reasons for being unattractive to investors. Crucial is a group of “environmental” variables, among them reliability, accountability, impartiality, integrity, fairness. These are universal givens of public administration and are applicable everywhere, irrespective of local traditions, cultures and context (Jabbra, 2006). But differences between economic policies persist, so in the share of direct taxes of the overall tax revenue by country. While rich countries rely to a greater extent – up to one third of their GDP if social security contributions are added - on direct taxation, DC collect as a rule less income and more sales taxes and VAT. A progressive tax rate is understood to serve social justice in the West, but many DC and emerging markets lure investors by flat rates and write-off schemes.
However, there is only a weak link between the source of government revenues and the level of development across countries. While countries with higher direct tax shares tend to be more wealthy, DC relying more on indirect taxes and customs duties must not be necessarily the poorest and vice versa (Figure 2). As a rule, resource rich nations – Iran, Venezuela, Panama and others - enjoy higher revenues from their oil industry, or from the Panama Canal traffic. But at the same time countries with labour based growth like Thailand, the Philippines and Chile report not only a higher level of development but also of direct taxation.

Institutions and growth
SWP-BerlinAugust 2007
9
Figure 21: Correlation between direct taxation (%) and GDP per capita*, 2004
R2 = 0,20
0
50
100
150
200
250
0 20 40 60 80 100direct taxes, % of total
Leve
l of i
ncom
e, ra
nk
*World Bank ranking from 1 (high income) to 250 (poor). Source: World Bank (2006), Global
Development Finance, Washington, D. C.; ditto, World facts and figures, GDP per Capita, at:
http://www.worldfactsandfigures.com/gdp_country_desc.php
What is more important, however, is the ability of the government on all levels – central, regional, local - to collect taxes and thus to built up resources for funding of development projects. A cross-country analysis of the correlation between the level of development and budget revenues including 177 emerging markets and developing economies tends to support the view that higher government revenues are associated with higher level of development. But the responsiveness is statistically not very strong, as a number of countries with upper-middle income, which is currently between $2,976 and $9,205 per capita1, enjoy due to historically high commodity prices lavish budget revenues. This is not a problem when the commodity producers are nationalized; therefore many governments in DCs collect and redistribute large shares of the GDP. The hard part is to tax business and labor in market economies, especially to keep the shadow economy in check and to broaden the tax base.
Here the importance of institutions becomes visible. To better under-stand the role of good governance across nations expressed as the ability of the authorities to collect taxes, an inspection of the link between the level of development and the size of government is instructive2. Among a sample of 96 less and least developed nations ranking from 100 to 250 out of the World Bank’s total of 250 countries in the world the picture is remarkably clear-cut. Poor nations face obviously greater problems to
1 Source: United Nations development indicators, Section “High, Middle, and Low Income
Countries” , http://cyberschoolbus.un.org/infonation3/glossary.html. 2 The level of development is defined as the international rank from low (high income
nations) to high (emerging markets and DCs) of the respective country regarding its
current per capita income. The size of government is the share of the General Govern-
ment revenues of the country’s GDP. Source: World Bank, World Fact and Figures
(http://www.worldfactsandfigures.com/gdp_country_desc.php), Nation Master, Statistics
Economy, Budget revenues per $ GDP
(http://www.nationmaster.com/red/graph/eco_bud_rev_pergdp-economy-budget-revenues-
per-gdp&b_map=1)

Institutions and growth
SWP-BerlinAugust 2007
10
collect taxes and hence tend to end up with smaller tax revenues and – as a result of budget constraints – with restricted spending (Figure 3a). The poorest countries are even less able to deal with budgetary challenges on their own, as the respective revenue shares net of foreign aid tell (Figure 3b). In many countries the main source of financing the expenditure are foreign transfers and development aid. Hence massive budget deficits and high inflation rates are only avoided due to significant transfers from abroad. Such aid flows not only provide funding of public programs but also prevent the central banks from printing money on behalf of the government.
Figure 3a: Less and least developed countries: General Government revenues as
a share of GDP; Figure 3b: Least developed counties: Revenues net of foreign aid,
share of GDP (when negative – deficits)
100
150
200
250
0 50 100
Revenues, %
Ran
k of
dev
elop
men
t
0
50
100
150
200
250
-50 -25 0 25 50 75 100
Revenues, net (%)
Ran
k of
dev
elop
men
t
Source: World Bank, World Fact and Figures
(http://www.worldfactsandfigures.com/gdp_country_desc.php); Nation Master, Statistics
Economy, Budget revenues per $ GDP
(http://www.nationmaster.com/red/graph/eco_bud_rev_pergdp-economy-budget-revenues-
per-gdp&b_map=1); Table 1.
Comparisons across the developing world reveal sharp differences in the ability of the individual authorities to employ good governance. The respective correlation is negative: the least developed countries in terms of per capita income tend to face the greatest difficulties to establish working institutions. This failing entails two major restraints: First, the poorer the country, the greater the need to provide financial support to large parts of the population, the smaller the financial room for maneuvering. A vicious cycle of poverty, fiscal pressure and income redistribution at the expense

Institutions and growth
SWP-BerlinAugust 2007
11
of the bottom income groups arises. Second, the weaker the institutions, the bigger the shadow economy,
which in turn tends to further weaken the institutions. Large sectors which are off limits to the authorities exacerbate the problem of income inequality: many persons with healthy earnings evade taxation but at the same time use public services and infrastructure for free. The departure from the official economy is fuelled as a rule by improperly working institutions like weak and unreliable tax authorities, dependent central banks, arbitrary law enforcement, etc. As a result the level of income in those countries is low because the informal sectors usually remain pre-modern with marginal monetization and trade mostly restricted to physical exchange of goods. In this sector the productivity and hence the income per worker as well as per capita is low compared to the official sector in “normal” countries. The analysis reveals that countries with weak institutions and therefore large informal sectors are poor and less devel-oped (Figure 4).
Figure 4: Correlation between the size of the shadow economy as percentage of
the GDP and the level of development, 2004
0
50
100
150
200
250
0 20 40 60 80
Shadow economy, %
Ran
k of
dev
elop
men
t
Source: World Bank, World Fact and Figures
(http://www.worldfactsandfigures.com/gdp_country_desc.php); Martens, op. cit, Table 4.
As established above, DCs need sustained growth to enlarge their capital stock per worker and to boost productivity. The small national saving rate is not the prevalent problem in this respect, at least not at early stages of the catching-up process. Even in the poorest countries, the poor save. The value of savings among the poor is, in fact, immense - forty times all the foreign aid received throughout the world since 1945 (de Soto, 2000). DCs can enlarge their investment rate and investment amount by attracting foreign capital, as myriad of positive experiences prove. China is a stan-dard example, but also the former centralized economies in Eastern Europe, some of which succeeded to lure Western European investors on a large scale and to speed-up the transition from plan to market. Hereby too, institutions played a role. While Russia, the Ukraine, and others were erecting barriers to foreign capital, the Baltic countries, Hungary and

The path to prosperity
SWP-BerlinAugust 2007
12
Slovakia opened up. Up to one quarter of all investment was foreign direct investment pouring into those emerging markets and helping them overcome the crisis and to switch on a path of stable growth. The opposite occurred to Russia – she suffered from her Great Depression much longer while the economic pain inflicted to the population was extreme.
Investment occurs when businesses expect an increase in demand for their products and when there are reasonable conditions for risk-taking. As international experience has shown, the latter is the decisive element: In many developing countries it was possible to increase output in the 1960s and 1970, but unrest, corruption, lack of legal security, insufficient infrastructure and institutional weaknesses make investors to feel uneasy later. So the challenge in many DCs is to join the worldwide trend of improving institutions as a precondition for growth (see Figure 1). Once a country has gotten rid of extreme poverty, it can on the expenditure side rely on improving its budgetary position. Moreover, it can accelerate growth by redirecting current programs towards health and education (thus increasing the quality of human capital), income redistribution in favor of the poor (thus invigorating aggregate demand for growth), and infrastructure (to boost transport, communications and improve storage of crop), etc.
The path to prosperity
But do such recommendations make sense? They would only do if they provided guide to action, i.e. to alter the current dire conditions resulting in poverty and inaction. Unfortunately, the developing world is too diverse to formulate a “one-size-fits-all” strategy for growth. Many former stagnat-ing Third world nations are about to escape the league of the poorest – China’s convergence on the advanced world is the most spectacular example. Regarding the role of given institutions for development the respective countries score very differently. Regression analysis, although suggesting a link between good governance and development, fails to explain the performance of individual nations. Also, a comparison with the CEE/EU and other countries in Western and Eastern Europe points out that both groups are with respect to the role of institutions for develop-ment less distinct than one would expect (see Appendix, example of OLS regression results). Obviously, individual policies matter, as do patterns of international specialization (the country is exporter of natural resources, or it is labor abundant), or political (internal conflicts, refugees problem) and natural environment (draught, arable land available), etc.
Here international aid enters the stage: As Hernando de Soto put is, the rich countries had failed to explain the mystery of capital to other nations

The path to prosperity
SWP-BerlinAugust 2007
13
yet specifically how indispensable a formal property system is to capital formation. It is not the resource problem, as the DCs do not lack resources; they just hold these resources in defective forms. Houses are built on land whose ownership rights are not adequately recorded, businesses are often unincorporated and pressed by undefined liabilities, industries are located where financiers and investors cannot see them. Because the rights to these possessions are not adequately documented, these assets cannot readily be turned into capital. They cannot be traded outside of narrow local circles where people know and trust each other, cannot be used as collateral for a loan, and cannot be used as a share against an investment (de Soto, 2000).
Would, therefore, the solution be to simply “educate” the DCs to repli-cate the West? Well, property law does not work satisfactorily somewhere outside the advanced world, but it does so in other places. After all, since the nineteenth century, nations have been copying the laws of the industrialized countries to obtain the institutional framework to produce wealth. Unlike de Soto we do not claim they continue to copy such laws further without success. Not everywhere in the world people can use the law to convert their savings into capital, but this is changing. The question is, correctly, why things have changed in some parts of the world – Eastern Europe is one example - and what is needed to make the law work in the remaining part (de Soto, 2000).
Eastern Europe: Administrative framework and regulation imported or copied
In the early 1990s the countries of the former “Second world” were very much resembling DCs. Not only were they poor in terms of per capita income; infrastructure, industrial organization and labor skills were far from meeting high standards. Large parts of the population lived on a few dollars per day – much like poor nations elsewhere. Since then the post-communist and new member states of the European Union (CEE) have been implementing the body of institutional rules and regulations of the EU. They have heavily adjusted their national regulations to comply with it and have invested into infrastructure and communications industries. Corruption has been paid attention: it is a hindrance to growth and it is hard to be tamed. Studies on the economic costs of corruption in CEE have proved that businesses pay a part of their revenue for protection against criminal groups, for bribing civil servants, for the purchase of security equipment, bodyguards, etc. These costs are passed on to the consumer, resulting in higher priced merchandise and reduced competitiveness.

The path to prosperity
SWP-BerlinAugust 2007
14
Figure 5: Corruption and wealth in the enlarged EU and CIS,
R2 = 0,860
2
4
6
8
10
0 10.000 20.000 30.000
GDP per capita, $
Cor
rupt
ion
perc
eptio
n,
inve
rted
BG
Ita
Gr
Ger
Sk
Est
Source: Transparency international; World Bank, Worldwide Governance Indicators: 1996-
2005, various tables,
http://web.worldbank.org/WBSITE/EXTERNAL/WBI/EXTWBIGOVANTCOR/0,,contentMDK:2077
1165~menuPK:1866365~pagePK:64168445~piPK:64168309~theSitePK:1740530,00.html
Those businesses that cannot afford to increase prices accept reduction in profits instead. Lack of funds for investment is the outcome. Thus corrup-tion is both a commercial and an economic problem and stemming corruption is a prerequisite for growth and prosperity. Prosperous states are less corrupt and corrupt states are less prosperous. In an international comparison of countries where the rule of law applies, some of the new members already do quite well (Figure 5), but on average the CEE do not achieve the levels of the West.3
The top ranking countries that are institutionally honest and economi-cally in the forefront have a value close to 100. The world average is around 50. The new member countries exceed this value. Several reform economies with a longer free-market tradition, such as Slovenia and Hungary, but also westernized Estonia are ranked just below the top. These countries already have a relatively high per capita income (Slovenia) or high economic growth (Estonia).4 For the rest it can be said that they have reserves that will allow them to catch up with the EU average.
What has been achieved and the path ahead becomes obvious when comparing the average values with those of the same income group (Figure 6). In addition to the “rule of law” indicators, the average value for the advanced OECD countries, the countries with a medium and those with a
3 The weighted average is close to the Polish value, since Poland has a share of around
50% in its evaluation. To simplify matters only two western countries were chosen for a
comparison: Germany as representative of the EU average for per capita income and the
US as the leading economic nation. 4 Russia, whose legal certainty lies under that of the reform countries and the world
average, was included for the sake of comparison. Irregardless of this fact, the Russian
economy is currently growing at considerable speed. In the 1990s when there was mas-
sive uncertainty in the legal system, economic output declined by 50%.

The path to prosperity
SWP-BerlinAugust 2007
15
low income are listed. Slovenia, which is considered an industrial nation, lies with its rule of law evaluation close to the advanced West. The countries with a medium per capita income – Hungary, Estonia, Czech Republic and Poland – do better than the average of their group. The same is true for Slovakia, which is ranked slightly above the average. The new member countries with low incomes – Latvia and Lithuania – are already comparable to the average of the group of wealthier countries with a medium per capita income; in fact their values are even above those of this average.
Two conclusions can be drawn from these figures: Firstly the new mem-ber countries have an improving grip on corruption, which explains their good economic output especially in the 1990s. They will not increase the crime rate in the EU; on the contrary, with their membership the institu-tional and psychological prerequisites necessary to effectively implement European standards or rule of law have been improved.
Secondly, the reduction of corruption to an acceptable level, which keeps income losses in check or to a minimum (as in Western Europe and North America), is subject to the algebraic law of diminishing returns. With continued progress in fighting corruption, it becomes ever harder to eliminate it entirely. Thus these countries have succeeded in a series of steps in stemming the visible excesses of corruption – bribing civil servants to influence the awarding of state-financed contracts, insider trading when privatizing, embezzlement of large amounts and their transfer to “safe havens.” Now they face the challenge of bringing under control the diffuse and legally unclear forms of influential networks, the lack of sense of right and wrong, and the bribery of civil servants and other service officials. This is the more difficult task, but it will result in larger gains, namely a higher institutional and economic level in Eastern Europe and in the developing world.

The path to prosperity
SWP-BerlinAugust 2007
16
Graph 6: Rule of law (black bars) in relationship to the individual income group
average (grey bars) in OECD and CEE countries, 2004
0 20 40 60 80 100
Russia
Slovakia
Latvia
Lithuania
Poland
CZ
Estonia
Hungary
Slovenia
USA
Germany
Source: World Bank, op. cit.
Supply-side policies for catching-up
Since the prime task of economic policy in almost any country is to cope with undesirable unemployment, it is reasonable to look at the labor input over time. A crucial question related to growth and employment is therefore how vigorously nations utilize the available labor potential to achieve high employment ratios and to avoid foregone national income. If, for instance, a nation is suffering from high labor costs, enforcing arbi-trary minimum wages, or is over-regulating the labor market, then companies in this country will try to rely heavily on capital input (and technological progress) instead of creating jobs. The unemployment rate will rise, causing losses of national income and slowing the economy.5 InEastern Europe nations like Poland, Slovakia, Latvia, and others need to reduce significantly their unemployment rates which currently lie between 18 and 10 percent of the labor force.
But in a number of developing countries labor force is extremely cheap while at the same time the unemployment rate is high and a large portion of the labor force is idle. Why is so much potential for growth dumped? There are many small entrepreneurs in the DCs but only rarely they dare to expand their businesses to employ the cheap labor around. Actually they would, as the people in the developing countries possess talent, enthusiasm, and an impressive ability to wring a profit out of practically
5 According to Okun’s law, one extra point of unemployment over the natural rate of
unemployment costs 2 percentage points of output.

Conclusions
SWP-BerlinAugust 2007
17
nothing. Yet without capital on hand their productivity and income remain low. In this respect the situation in the developing world is very similar with vast regions in Eastern Europe struggling to create more jobs. So what is the solution?
In order to explain the divergent growth dynamics even within the same European country, the policies for employment come into consideration. Understanding of developments in employment is important because all CEE countries have shown a growing capital intensity (capital per em-ployee) and labor productivity (GDP per employee) since 1993. With the exceptions of Hungary and Slovenia, they have cut jobs massively and reduced employment, or have not been able to compensate the loss of jobs since the early 1990s. From the perspective of the national economy and according to formulae, productivity gains are not enough to ensure wealth to expand (expressed as growth of output per capita): growth in employ-ment is also important. In growth accounting, labor growth carries twice as much weight as growth in capital, so that countries with a positive employment development will, amongst other things, enjoy a greater GDP growth than countries with a stagnating or sinking level of employment. Since the beginning of the 1990s, that included Hungary and Slovenia in CEE, and - in the old market economies - Cyprus and Malta. In these countries, the economic growth constituted by productivity and employ-ment growth increased, and the unemployment rates remained under control.
Also the experience of the Western European catch-up economies, in particular of Spain, shows that growth correlates more strongly with the dynamic of labor growth than of capital growth. Spain’s growth was, over a long term, labor-intensive: employment has risen with a yearly average of almost 2 percent since 1986. This was for this country, with its massive latent unemployment under General Franco and its high - sometimes more than 18% - official unemployment rates in the 1980s and 1990s, a success-ful strategy. This compares with the economic developments in those developing countries which are lagging behind when it comes to open up and abandon a centralistic approach towards industrialization. Since human capital is dependent upon employment, a preference for capital based growth in catching-up countries is to be critically judged.
Conclusions
In the following section a brief list of the most urgent tasks as derived from the experience of the CEE countries is presented.
Institutional transfer: Overall analytical findings appear to support a hypothesis of an institution facilitated growth in the young market

Conclusions
SWP-BerlinAugust 2007
18
economies of East Central Europe. Here an intensive institutional adjust-ment had freed market forces to better supply of factors of production and to respond properly to previously restricted aggregate demand. The admittedly painful adoption and implementation of the European institutional framework is gradually paying off, as the quality of govern-ance is improving. Reliable institutions attract investors, expand the investment rate and speed-up the GDP growth. The recommendation to the DCs is to copy more and to invent less, as implementing the others’ experience is less costly. But due to their heterogeneity the countries of the South are facing different economic challenges. Some of them – natural capital abundant countries - primarily need to maintain their output growth and to broaden employment. They can draw inspiration from the redistribution policies of some Western oil-rich countries like Norway which do not suffer from mass unemployment and resource curse. Labor abundant countries with some industrial basis in place like Brazil, Angola, Mexico and others should expand their stock of capital more slowly than before because of their sinking capital productivity. If they are to reduce their currently very high unemployment levels, they must rethink their model of growth: it must become more labor-based (as opposed to capital-based). Labor-intensive growth occurs in modern national economies in the services, rather than the agricultural, sector.
Western support: While FDI allow for profit transfer to the owners of capital in the rich world, official development aid serves local projects as if for free. That is why the call for more aid sounds convincing not only to the respective recipient authorities, but also to aid workers, NGOs and the UN. This is wrong: market access is of much bigger importance to devel-opment than development aid, as the European experience tells. In order to materialize on their comparative advantages in the industrial, agricul-ture and services sector, the new member states of the EU have gained much from the European free common goods and services market. Without an open market, the new member states are disadvantaged in terms of their trade and capital balance, since they are overshadowed by the EU-15 as providers of manufactured goods. A heated debate about the costs of the enlargement is going on in Europe, but it is very ideological in nature. Also, it is counterproductive: the Eastern enlargement has created an excess supply of labor in the EU, which requires its more efficient allocation across all member countries. This gives an idea what is wrong with the similar debate about the cost of market opening in favor of the DCs. It is as much ideological as it is misleading: the West cannot disen-tangle itself from the South. With respect to the DCs’ comparative advan-tages a broader opening of the agriculture and services markets of the North is vital for growth in the South and in the rest of the world.
European support: Due to the integration of CEE the Western European economy is supposed to pick up in the medium and long run. But assess-ments of the effect of the EU enlargement come to the conclusion that the overall effect will be distributed asymmetrically in favor of the CEE entrants, with higher GDP and job gains over time and faster rising

Appendix
SWP-BerlinAugust 2007
19
income per capita (Bchir et al., 2003). This is consistent with the finding that countries in a common economic space (common market, customs union, free trade area) tend to specialize on specific products and thus economic integration is associated with divergence in their sectoral structures (Midelfart et al., 2003). Hence specialization is boosting produc-tivity and is facilitating the catch-up process in the low income re-gion/country (in this case CEE).
Similarly, a greater market opening by Europe will facilitate initially the DCs more, but there will be instant rewards to the European economy in the form of expanding import demand on the side of the picking-up South. The central EU institutions, foremost the Commission, can contribute insofar as it can audibly insert itself in counterproductive anti-globalization debates and clearly draw attention to the economic costs, which could arise from a continued protectionism and egoistic economic model. Institutions should also make clear that, in an increasingly integrated world economy, in which all states participate, "the right of the strong" cannot win out. Even large economic blocs cannot exist at autarchy without expanding exchange with the rest of the countries. If countries tried to isolate themselves from this process of economic intertwining, which is driven by costs and productivity, it would incur a loss of position in the world economy. This would run contrary to the core development idea of gaining ground by higher growth.
Appendix
OLS Regressions-Statistics
DCs EU 27 and CIS/OECD countries
R2 0,39 0,40
Adjusted R2 0,36 0.30
SE 34,22 29.6
Observations 125 35
Coefficients SE t-
Statistics Coefficients SE t-
Statistics
Starting a Business 0.23 0.07 3.10 0.30 0.17 1.71
Registering Property 0.17 0.07 2.33 0.19 0.11 1.64
Getting Credit 0.39 0.07 5.29 0.24 0.15 1.58
Protecting Investors 0 0.07 -0.38 -0.0404 0.13 -0.29
Enforcing Contracts 0.07 0.07 0.89 0.00615 0.17 0.04
Source: World Bank, Doing Business, http://www.doingbusiness.org/

Sources and References
SWP-BerlinAugust 2007
20
Sources and References
A. Avdoulos, Ph. Derveaux: Cyclical Adjustment of Budget Balances. In: European Commission. Directorate General Ecfin, Ecfin/Rep/50885/2005, p. 9.
Baldwin, R., Martin, Ph.: Agglomeration and Regional Growth. CEPR Discussion Paper No. 3960. http://ssrn.com/abstract=436996 (July 2003).
Barro, R.J.: Economic Growth Across Countries. In: Marc A. Miles (Ed).: The Road to Prosperity. Heritage Foundation, 2004, pp. 209-246.
Barro, R. J.: The Interplay between Economic and Political Development. In: ‘Determinants of Economic Growth’, Cambridge: MIT Press. 1997. pp. 49-87.
Barry, F.: Economic Integration and Convergence Process in the EU Cohesion Countries. Journal of Common Market Studies, 41, 5/2003, pp. 897-922.
Bchir, H., Fontagné, L., Zanghieri. P.: The Impact of EU Enlargement on Member States: a CGE Approach, CEPII Working Paper No 2003-10, August 2003.
Bhagwati, J.: Free Trade Today, Princeton and Oxford, 2002.
Doyle, P., Kuijs. L., Jiang. G.: Real Convergence to EU Income Levels: Central Europe from 1990 to the Long Term, IMF Working Paper 01/146, September 2001, IMF, Washington, DC.
EU Commission, European Economy, No 6/2004, Statistical Annex, Brussels, 2005
Geppert, K., Goring. M., Stephan. A.: ‘Productivity Differences in the EU: National. Regional and Spatial Effects’. German Institute for Economic Research Berlin, DIW-Diskussionspapiere, No 383, November, 2003.
GKI Economic Research Co.: Direct Investment Flows in CEE. In: Economic Trends and Research Summaries 2004, No 4, Budapest 2004.
Haynes, M.J.: Husan, R.: Somewhere Over the Rainbow: The Post-Soviet Transition, the Market and the Mythical Process of Convergence. Post-Communist Economies,14, 3/2002, pp. 381-398
Hishow, O.N.: ‘EU Extension to the East and Exporting Jobs. Tax harmonization may hurt more and benefit less’, SWP Comments 2004/08, May 2004.
Hishow, O.N.: ‘Economic Effects of EU Eastern Expansion. High Growth in the New Member Economies with a Continuing Prosperity Gap. SWP Research Paper2004/S 26, July 2004.
Hishow, O.N.: Wachstumsfaktoren in den Beitrittsökonomien: Kann die Lissabon-Strategie umgesetzt werden? Osteuropa-Wirtschaft, 50, June 2005, pp.96 – 110.
Hospers, G.J.: ‘Beyond the Blue Banana? Structural Change in Europe’s Geo-Economy’, Intereconomics, Hamburg Institute of International Economics (HWWA),

Sources and References
SWP-BerlinAugust 2007
21
Vol. 38, No 2, March/April 2003, pp. 76-85.
Jabbra, J.G.: Global Competitiveness and Public Administration: implications for education and training. Rapporteur General: Dr. Joseph G. Jabbra, IIAS 27th International Congress of Administrative Sciences, Abu Dhabi, United Arab Emirates, July 9-14, 2007.
Kaitila, V.: ‘Convergence of Real GDP per Capita in the EU 15. How Do the Acces-sion Countries Fit in?’, ENEPRI, Working Paper No. 25/January 2004,http://www.enepri.org
Krugman, P.: ‘Increasing Returns and Economic Geography’. Journal of Political Economy, Vol. 99, No 3, June 1991.
Krugman, P., Venables, A.J.: ‘Integration, Specialization, and Adjustment’. European Economic Review, Vol. 40, 1996, pp. 959-967.
Metz, A.: Strengthening Capacities for Reform - Perspectives of Institution Building in the European Union. C·A·P Working Paper, December 2006, at: www.cap.lmu.de/download/2006/2006_eu-china_metz.pdf.
Miderfart, K.-H., Overman, H. G., Venables, A.J.: ‘Monetary Union and the Economic Geography of Europe’. Journal of Common Market Studies, Vol. 41, No 5, December 2003, pp. 847-868.
North, D. C.: Understanding the process of economic change. Prince-ton/Oxford, 2005
Nunnenkamp, P.: Wachstumseffekte von Direktinvestitionen in Entwick-lungsländern (Growth Effects of Direct Investment in Developing Countries). Die Weltwirtschaft, No 1/2004, Institute of World Economics, Kiel, pp. 99-118.
Sachs, J. D., McArthur, J., Schmidt-Traub, G., Kruk, M., Bahadur, Ch., Faye, M., McCord, G.: ‘Ending Africa’s Poverty Trap’. Brookings Papers on Economic Acriticvity, 1/2004, pp. 117-240.
Sapir, A., et al.: An Agenda for a Growing Europe. Making the EU Economic System Deliver, Oxford 2004.
Sinn, H.-W., Ochel, W.: Social Union, Convergence and Migration. Journal of Common Market Studies, 41, 5/2003, pp. 869-896.
De Soto, H.: The Mystery of Capital, Basic Books, NY et al, 2000.
Winiecki, J.: Determinants of Catching Up or Falling Behind: Interaction of Formal and Informal Institutions. Post-Communist Economies, 16, 2/2004, pp. 137-152.
UNECE, Economic Survey of Europe, 2005 No 1, Statistical Appendix.