the economic impacts of epas in sadc countries · web viewthe economic impact of epas in sadc...
TRANSCRIPT
Staff Working Paper ERSD-2005-04 August, 2005___________________________________________________________________________________
World Trade Organization
Economic Research and Statistics Division___________________________________________________________________________________
The Economic Impact of EPAs in SADC Countries
Alexander Keck: WTO
Roberta Piermartini: WTO
Manuscript date: August 2005
___________________________________________________________________________________
Disclaimer: This is a working paper, and hence it represents research in progress. This paper represents the opinions of individual staff members or visiting scholars, and is the product of professional research. It is not meant to represent the position or opinions of the WTO or its Members, nor the official position of any staff members. Any errors are the fault of the authors. Copies of working papers can be requested from the divisional secretariat by writing to: Economic Research and Statistics Division, World Trade Organization, rue de Lausanne 154, CH-1211 Genève 21, Switzerland. Please request papers by number and title.

The Economic Impact of EPAs in SADC Countries
Alexander Keck and Roberta PiermartiniWTO, Economic Research and Statistics Division1
August 2005Abstract
The Cotonou Agreement introduces new fundamental principles with respect to trade between the European Union and African, Caribbean and Pacific countries relative to the Lomé Convention: in particular non-reciprocal preferential market access for ACP economies will only last until 1 January 2008. After that date, it will be replaced by a string of Economic Partnership Agreements meant to progressively liberalise trade in a reciprocal way. The progressive removal of barriers to trade is expected to result in the establishment of Free Trade Agreements between the EU and ACP regional groups in accordance with the relevant WTO rules and help further existing regional integration efforts among the ACP.
In this paper, an applied general equilibrium model (15 regions, 9 sectors) is used to simulate the impact of EPAs for countries of the Southern African Development Community. The standard Global Trade Analysis Project (GTAP) model has been extended to include the elimination of textile quotas, EU enlargement to 25 members as well as tax revenue sharing and a common external tariff among Southern African Customs Union countries. A number of comparisons between different scenarios are undertaken, in particular: (i) the EPA scenario is compared to the multilateral liberalization scenario; (ii) SADC liberalization with the EU only is compared to a scenario with simultaneous regional integration among African economies and to the case of the EU also signing an FTA with Mercosur; and (iii) a complete reduction of import barriers is contrasted with partial liberalization (i.e. only 50 per cent tariff reductions in agriculture) and with full trade liberalization that includes the elimination of subsidies. The issue of tariff revenue loss is also addressed and the required tax replacement is calculated. Selected experiments are re-run under an unemployment closure.
Simulation results show that EPAs with the EU are welfare-enhancing for SADC overall, leading also to substantive increases in real GDP. For most countries further gains may arise from intra-SADC liberalization. The possibility of the EU entering an FTA with other countries, such as Mercosur, reduces estimated gains, but they still remain largely positive. Similarly, estimated gains need to be revised downwards if agriculture liberalization is not as far reaching as a reduction of import barriers for manufactures. At the sectoral level, the largest expansions in SADC economies take place in the animal agriculture and processed food sectors, while manufacturing becomes comparatively less attractive following EU-SADC liberalization. Interestingly, multilateral liberalization would instead foster some of the manufacturing sectors (textile and clothing and light manufacturing). Results also show the need for the SACU tariff pooling formula to be adjusted to reflect new import patterns as tariffs are removed.
Key words: Cotonou Agreement, SADC, regionalism, CGE modelling.
JEL classification: F15, F17, O55.
1 Disclaimer and acknowledgements: The opinions expressed in this paper should be attributed to the authors. They are not meant to represent the positions or opinions of the WTO and its Members and are without prejudice to Members' rights and obligations under the WTO. The authors would like to thank participants at the 9th GTAP Annual Conference (Lübeck, 9-11 June 2005) for their comments on earlier drafts of this paper. All remaining errors and omissions are the fault of the authors.

I. INTRODUCTION.......................................................................................................3
II. DATA AND MODELLING STRATEGY.................................................................5
A. DATA..............................................................................................................................5
B. MODIFICATIONS OF THE STANDARD GTAP MODEL.....................................................13
III. POLICY EXPERIMENTS........................................................................................14
IV. RESULTS...................................................................................................................15
A. WELFARE EFFECTS.......................................................................................................16
1. Regional and multilateral trade liberalization........................................................17
(a) Allocative efficiency and terms of trade effects..........................................................17
(b) Changes in real GDP....................................................................................................20
(c) Sensitivity analysis......................................................................................................21
2. The proliferation of regional trade agreements and preference erosion..............21
3. Partial and full trade liberalization..........................................................................22
B. REALLOCATION OF RESOURCES....................................................................................23
1. Resource reallocation across sectors........................................................................23
2. Income redistribution................................................................................................25
C. CHANGES IN TRADE PATTERNS.....................................................................................26
D. EMPLOYMENT EFFECTS................................................................................................30
E. IMPACT ON TARIFF REVENUE........................................................................................34
V. CONCLUSIONS........................................................................................................36
VI. REFERENCES...........................................................................................................38
VII. ANNEX.......................................................................................................................39
2

I. INTRODUCTION
Relations between the African, Caribbean and Pacific (ACP) countries and the European Union (EU) go back more than 50 years. For most of the time, trade relations were characterized by non-reciprocal duty-free access to the EU market for most ACP exports with the exception of certain agricultural products facing positive tariffs and quotas. Before the Cotonou Agreement was signed in 2000, the EU-ACP relationship was governed by successive agreements under the Lomé Convention. Throughout this long-lasting process, both sides showed dissatisfaction with certain aspects of these agreements. Some of the recurrent ACP demands were duty-free access for products covered by the Common Agricultural Policy (CAP), simplified rules of origin as well as increased aid and faster disbursement. The EU seemed increasingly dissatisfied with the slow progress in terms of good governance, human rights and democratisation as well as the use of its development funds. In addition, Lomé preferences, with few exceptions, seemed to have done little to help expand and diversify ACP exports.
The Cotonou Agreement redefines the relationship between the EU and the ACP. While the performance of Lomé may have been an important factor leading to this change in course, external developments have also played a role, not least the enlargement of the EU to include Eastern European countries, the interest by the EU in trade relations with other regions and the unwillingness of other developing countries to continue to agree to waivers from WTO rules for EU-ACP non-reciprocal preferences beyond 2007. With respect to trade, the Cotonou Agreement introduces some major changes: Preferential market access commitments are to be made on the basis of reciprocity, with the terms and conditions to be negotiated in the context of so-called Economic Partnership Agreement (EPAs) between the EU and different country groupings within the ACP. These negotiations are to be concluded by 1 January 2008, until which date non-reciprocal preferences under the Cotonou Agreement will be preserved. Least-Developed Countries (LDCs) from the ACP region are part of the negotiation process, while continuing to enjoy duty- and quota-free market access under the EU's unilateral Everything But Arms (EBA) initiative given to all LDCs. The progressive removal of trade barriers after 2008 is to lead to Free Trade Agreements (FTAs) between the EU and ACP regional groupings2 in conformity with WTO rules. The Cotonou Agreement also addresses the issue of trade-related aid, in particular to address supply-side constraints.
In this paper, we analyse the impact of the creation of an FTA between the EU and SADC countries. 3
SADC comprises the following 13 countries, which are quite heterogeneous in both size and economic performance: Angola, Botswana, the Democratic Republic of Congo (DRC), Lesotho, Malawi, Mauritius, Mozambique, Namibia, South Africa,4 Swaziland, Tanzania, Zambia and Zimbabwe. In parallel, we examine intra-SADC liberalization. In 2000, agreement was reached to create a SADC Free Trade Area. SADC countries undertook to phase out tariffs on "non-sensitive" products by 2008 with the remaining items to be liberalized by 2012. Besides the staggered
2 The EU is set to negotiate with six regional groupings of the ACP group of countries: West Africa group: Economic Community of Western African States (ECOWAS) and Mauritania; Central Africa group: Communauté Economique et Monétaire de l'Afrique Centrale (CEMAC) and São Tomé and Príncipe; Eastern and Southern Africa (ESA) group: Eligible members of the Common Market for Eastern and Southern Africa (COMESA), with the exception of certain Southern African Development Community (SADC) members; SADC group: Angola, Mozambique, Tanzania as well as Botswana, Lesotho, Namibia, Swaziland (BLNS) that together with South Africa (observer to the SADC negotiating group) belong to the Southern African Customs Union (SACU); other SADC members form part of the ESA group; Caribbean: 14 ACP members of the Caribbean Community (CARICOM) and the Dominican Republic; and Pacific: Pacific ACP members; negotiations not yet underway.
3 I.e. we make no distinction between outcomes in the SADC and ESA negotiating groups.4 We include South Africa in our analysis despite the existence of an FTA with the EU (the so-called
Trade and Development Co-operation Agreement (TDCA)) and South Africa's mere observer role in the EPA negotiations. The TDCA still features substantial protection in a number of areas, and we assume that if full liberalization by developing country members of SADC with the EU were to happen under EPAs, this would also be matched by South Africa.
3

implementation and exempted products, the accord also contains special flexibilities for certain members, for instance special transitory preferences for Malawi, Mozambique, Tanzania and Zimbabwe in the area of textiles and clothing. Angola and the DRC so far have not signed the trade protocol.5 Five SADC countries form a customs union. The Southern African Customs Union (SACU) came into being already in 1910. Its members are Botswana, Lesotho, Namibia, Swaziland (BLNS) as well as South Africa. The five countries have a common external tariff (CET), and proceeds go to a common revenue pool.
The paper explores a number of issues, in particular the following two central themes: First, it estimates the effects of an FTA between the EU and SADC countries on SADC members both under a full liberalization scenario and in case of partial exclusions in agriculture. And second, it examines whether SADC countries should simultaneously proceed with further intra-SADC liberalization. Our analysis not only focuses on the effects in terms of welfare and real GDP growth, but also stresses redistribution effects and cost of adjustments. It looks at resource reallocation across sectors, variations in the remuneration of factors of production and changes in trade patterns. The focus is on the impacts in SADC countries only, as no major effects are expected for the EU given the minor share of SADC in the EU's overall trade. Our results appear to justify this decision: For instance, we find that the EU cannot expect major growth impacts from liberalization with SADC, with its real GDP barely rising by 0.01 per cent.
The paper goes further than previous studies on the effects of free trade arrangements between the EU and southern African countries (notably Lewis et al., 2003; and McDonald and Walmsley, 2001)6 in a number of respects: First, it uses the GTAP 6 database, which has a 2001 reference year and includes, for the first time, non-reciprocal tariff preferences for certain developing and least-developed countries, including SADC economies. This is a very important feature of the data, as it allows to capture the erosion of preferences enjoyed by beneficiary countries (i.e. a reduction of the competitive advantage owing to preference margins) when further liberalization is pursued by preference-providers.
Second, the paper takes into account that preference erosion does not only occur as a consequence of multilateral liberalization, but also takes place when preferential treatment is extended to more trading partners through other FTAs. Therefore, it seeks to determine how results on expected gains from trade liberalization in Southern Africa are affected by the ongoing FTA negotiations between the EU and other regional groups outside Africa, such as Mercosur.
Third, the paper takes account of the formation of the EU-25 and the resulting free access of the ten new members to the EU market, and of the phase-out of the quotas on textiles and clothing in the context of the termination of the WTO's Agreement on Textiles and Clothing (ATC).
Another new feature of this paper is the focus on the fiscal impact of the EU-SADC FTA. Tsikata (1999) uses a partial equilibrium model to estimate revenue losses from intra-SADC liberalization. She finds that the countries with the highest tariffs and whose total fiscal revenue is more trade-dependent are more likely to suffer from revenue losses. Like McDonald and Walmsley (2001) we include considerations of the consequences of revenue sharing conditions for SACU members in the analysis of the various policy scenarios and highlight the need for a reform of the revenue sharing formula to avoid unwanted consequences. In addition, we look at the possibility to substitute tariffs with various forms of taxation.
Finally, we assess how results change when alternative values for key parameters of the model are 5 For a more detailed discussion of the SADC trade protocol, see Chauvin and Gaulier (2002).6 Earlier CGE studies on the regional trade options for Southern Africa, such as Masters et al. (1999)
and Lewis et al. (1999) are based on the GTAP Data Base version 4. In this version of the GTAP Data Base, SADC countries are aggregated as a region. Consequently, these studies only analyze the impact of the formation of a regional trade agreement on South Africa and the SADC region, without distinguishing across SADC members. Version 5 disaggregated Malawi, Mozambique, Tanzania, Zambia and Zimbabwe.
4
postulated and when some of the assumptions are changed. In particular, we perform a sensitivity analysis on the variation of the parameter values for the Armington elasticities, and we look at how outcomes change when the assumption of full factor employment is dropped.
In our experiments, despite phase-ins and product exclusions that are usually part of international trade agreements, we assume immediate and complete liberalization (unless stated otherwise). We also include Angola and the DRC as part of the "Rest of SADC" region (together with Mauritius). 7
The analysis is comparative static and does not take account of dynamic effects triggered by further liberalization through, for instance, increased competition, economies of scale, improvements of the investment climate and technological change.
The rest of the paper is organised as follows. Part II provides a description of the data and the modelling strategy. Part III describes the policy scenarios and Part IV reports the results. Part V concludes.
II. DATA AND MODELLING STRATEGY
The data and the model used in this paper are derived from the GTAP 6 database. GTAP 6 includes 87 regions, 57 sectors and 5 factors of production (natural resources, land, unskilled labour, skilled labour and capital). The underlying model is a Computable General Equilibrium (CGE) model that uses variants of the Armington assumption to model intra-industry trade.8 It is important to keep in mind that as a consequence of the Armington assumption, the results of the simulations will be driven to a large extent by terms of trade changes and will be sensitive to both substitution elasticities and trade shares. In this Part we provide a description of the specific regional and sectoral specification adopted in this paper, an analysis of the data and an explanation of the specific assumptions introduced in our model.
A. DATA
The GTAP 6 database is well-suited to examine the consequences of FTAs among SADC countries as well as between them and the EU-25 both in terms of country and sector coverage. We aggregate the GTAP database into 15 regions and 9 sectors. This Section provides the background for our aggregation strategy and descriptive statistics of the data on production, trade patterns and import protection resulting from the aggregation.
Country aggregation
SADC countries are detailed in the database with the exception of Lesotho, Namibia and Swaziland forming the composite "Rest of SACU" region, and Angola, the DRC and Mauritius, which make up the "Rest of SADC" region together with the Seychelles that still belonged to SADC in the 2001 reference year. The remaining SADC countries are kept as separate regions in order to distinguish the economic effects of trade policy changes by country and highlight the importance of certain sectors to specific countries. Madagascar was not a SADC member, when the simulations were carried out, and therefore has not been included in the analysis.9
7 This group also contains the Seychelles which used to be a SADC member until July 2004. 8 Armington (1969) has proposed that similar domestic and imported goods, as well as goods imported
from different origins, should be regarded as imperfect substitutes. Trade models like GTAP incorporate this assumption by differentiating products on the basis of their country of origin. The effect of a trade policy measure on the relative price of similar traded and domestically produced goods leads to a substitution of domestic for imported goods or vice versa, or to a substitution between imports from different sources.
9 However, Madagascar has been kept as a separate region, as it is our understanding that its joining of SADC is imminent following its award of "candidate membership status" at the 2004 Summit in Mauritius.
5
All ten countries that have acceded to the EU in May 2004 as well as the original 15 EU members are detailed separately in the database, but have been aggregated into the EU accession region "eua" and the EU-15 region "eu" respectively. The Mercosur region has been singled out in order to simulate a possible EU-Mercosur FTA and gain an idea of the effects on SADC economies of other FTAs concluded by the EU. However, it only combines Argentina, Brazil and Uruguay, since the database does not contain country data for Paraguay. With Paraguay being rather small in relation to the other Mercosur partners, this seems an acceptable approximation. Finally, given the potential for trade diversion from other countries following an EU-SADC FTA, we split the rest of the world in separate developing and developed country groups in order to see whether other developing countries may be particularly disadvantaged.
The following 15-region aggregation was employed:
eua EU accession countries (10)eu EU-15
bwa Botswanazaf South Africa SACUxsc Rest of SACUmoz Mozambiquemwi Malawi SADCzmb Zambia zwe Zimbabwetza Tanzaniaxsd Rest of SADCmdg Madagascarmrc Mercosurxdd Rest of developed countriesxdg Rest of developing countries
Sector aggregation
Traded commodities are divided in the following nine sectors:
AnAg Animal agriculture, i.e. animal products not elsewhere classified (nec); raw milk; wool, silkworm cocoons; cattle etc.; meat; meat products
Sugar Sugar cane and beetCrops Paddy rice; wheat; cereal grains nec; oil seeds; crops nec; vegetables, fruit, nutsFoodP Food products, i.e. vegetable oils and fats; dairy products; processed rice; food
products nec; sugar; beverages and tobacco products
Welfare results for Madagascar are not discussed in the text, but can be seen from the tables contained in the Annex. However, it should be recalled that Madagascar has not been counted among SADC members.
Agricultural commodities
6
FuelMin Fuels and minerals, i.e. coal; oil; gas; minerals necTexClo Textiles and clothing, i.e. textiles; plant-based fibers, e.g. cotton; wearing
apparel; leather productsHMnfcs Heavy manufactures and metals, i.e. chemical, rubber and plastic products;
paper products and publishing; wood products; petroleum, coal products; mineral products nec; metals; ferrous metals; metals nec; metal products
LMnfcs Light manufactures, i.e. motor vehicles and parts; transport equipment nec; electronic equipment; machinery and equipment nec; forestry; fishing; manufactures nec
Svces Services, i.e. electricity; gas manufacture, distribution; water; construction; trade; transport nec; sea transport; air transport; communication; financial services nec; insurance; business services nec; recreation and other services; public administration, defence, health, education; dwellings
While this nine-commodity grouping still remains at a fairly high level of aggregation, it captures the most important sectoral impacts of different policy scenarios. We had experimented with more disaggregated versions of the database (up to 15 sectors), but did not find the trade-off between more detailed results and the additional complexity involved worth our while.
Total output and production structure
An analysis of output data shows that SADC countries are quite heterogeneous in terms of both size and specialization patterns. It is therefore legitimate to expect that EPAs have different effects across countries. Chart 1 provides a cross-country comparison of the relative size of SADC economies. South Africa is by far the largest SADC member. The "Rest of SADC" region is also relatively important, being larger than Tanzania and Zimbabwe taken together.
Chart 1: Relative size of SADC countries (based on value added)(per cent)
bwa3%
zaf66%
xsc3%
moz2%
mwi1%
zmb2%
zwe5%
tza6%
xsd12%
Source: GTAP 6 database
Turning to the production structure of SADC countries, it is important to stress that services constitute the largest share of value added for most SADC countries. It represents less than 50 per cent of value added only for the "Rest of SADC" and Tanzania. Chart 2 shows the production structure for merchandise sectors. It appears that crops production is very important in Mozambique, Tanzania,
7
Malawi and Zambia, fuel and mineral production in the "Rest of SADC" (probably oil extraction in Angola in particular), heavy manufacturing in South Africa (but also in most other SADC countries), processed foodstuffs in Zimbabwe and light manufacturing and animal agriculture in Botswana. The "Rest of SACU" (e.g. Lesotho), "Rest of SADC" (e.g. Mauritius) as well as Zimbabwe also seem to have a quite important textiles and clothing sector.
A few interesting sectoral characteristics that may be hidden in the aggregated data should be kept in mind, in particular: (i) Animal agriculture: For several countries, this sector is dominated by meat and meat products, in particular in Botswana, where it accounts for almost 90 per cent of total animal agriculture output, as well as in South Africa, the Rest of SACU and Zimbabwe where meat and meat products represent about three quarters of output in that sector. (ii) Food products: For South Africa, the "Rest of SACU" region and the "Rest of SADC" region (notably Mauritius in this case), the food products sector includes a significant share (between about 15 and 25 per cent) of (refined) sugar production. Conversely, for other countries, such as Tanzania, Zambia and Zimbabwe most sugar production takes place in the "sugar" sector, i.e. refers to sugar cane and beet. And (iii) Heavy manufactures and metals: For some countries, metals and mineral products are important components of this sector. In Botswana, South Africa, Mozambique, Zambia, Zimbabwe and the "Rest of SADC" region (notably Angola and the DRC in this case), diamonds, gold, bauxite etc. mining activities account for more than 50 per cent of output in this sector.
Chart 2: Value added by merchandise sector(per cent)
0%
20%
40%
60%
80%
100%
bwa zaf xsc mwi zmb zwe moz tza xsd
LMnfcsHMnfcs
FuelMinTexCloFoodP
CropsSugar
AnAg
Source: GTAP 6 database
Data on value added by factor of production are shown in Chart 3. As expected, unskilled labour, for all countries, represents the most important factor of production. Natural resources appear relatively more important in the "Rest of SADC" and South Africa. A high proportion of value added seems to be accounted for by returns to "capital". The reason for this is that in GTAP remunerations for self-employed workers appear in this category. For many developing countries, a high proportion of capital is likely to reflect the importance of own employment.
8

Chart 3: Value added by factor of production employed(per cent)
0%
20%
40%
60%
80%
100%
bwa zaf xsc mwi zmb zwe moz tza xsd
NaturalResourcesCapital
Skilled
Unskilled
Land
Source: GTAP 6 database
Trade patterns
Tables 1a and 1b report the total value of exports and imports by sector. SADC countries' imports appear to be concentrated in the light and heavy manufacturing sectors as well as services. Most countries also feature significant imports of food products. In particular, Botswana, Malawi, Mozambique, the "Rest of SADC", Tanzania and Zambia are net importers of processed food products. Exports are more differentiated across SADC countries with the most exported goods being fuels and minerals in the "Rest of SADC", crops in Malawi and Zimbabwe as well as light manufacturing in Botswana and the "Rest SACU".
Table 1a: Total value of imports at market prices by sector and destination(2001 $ million)
bwa zaf xsc mwi zmb zwe moz tza xsdSectorAnAg 15 361 75 4 5 13 23 13 188Sugar 0 0 0 0 0 0 0 0 0Crops 67 403 106 39 42 38 66 106 124FoodP 222 1272 339 60 96 78 197 216 832TexClo 112 1752 336 54 63 92 66 171 625FuelMin 22 2551 29 4 68 12 3 8 24HMnfcs 737 7616 1138 259 461 845 421 788 1537LMnfcs 715 13617 880 211 566 506 371 676 2814Svces 321 3867 721 82 214 673 403 608 3462
Total 2211 31439 3624 713 1516 2258 1550 2586 9606Source: GTAP 6 database
Table 1b: Total value of exports at market prices by sector and destination
9

(2001 $ million)
bwa zaf xsc mwi zmb zwe moz tza xsdSectorAnAg 80 340 160 1 7 42 1 29 24Sugar 0 0 0 0 0 0 0 5 0Crops 3 1695 43 452 72 783 47 330 49FoodP 17 1959 563 58 53 136 124 191 708TexClo 58 1092 422 46 59 259 23 117 1021FuelMin 65 4483 154 19 3 81 12 29 4729HMnfcs 204 18245 592 15 1040 498 463 275 228LMnfcs 2487 7975 737 13 72 56 35 125 1637Svces 248 4098 458 73 174 390 590 348 1756
Total 3163 39887 3128 677 1480 2247 1296 1449 10153Source: GTAP 6 database
Bilateral trade flows show the importance for SADC countries of trading with the EU. Table 2 reports values of bilateral imports. The EU is an important source of imports for all SADC countries. In particular, it is the most important source of imports for the "Rest of SADC" region, the second most important source of imports for Botswana, Mozambique, Tanzania and Zimbabwe, and it is the third most important for the "Rest of SACU" region, Malawi and Zambia. South Africa is the most important source of imports for all SACU members, but also for most of the other SADC countries with the exception of Tanzania and the "Rest of SADC" group. As far as exports are concerned, the EU is the most important destination market for all SADC countries except for South Africa that primarily exports to the "Rest of developing countries" region.
Table 2: Bilateral imports at market prices by import source and destination(2001 $ million)
Source: GTAP 6 database
Desti-nation eua eu bwa zaf xsc moz mwi zmb zwe mdg tza xsd mrc xdg xdd
Sourceeua 19484 105630 16 261 18 16 2 7 6 9 23 78 1183 30301 17631eu 112747 1402290 319 12529 433 348 96 245 374 586 716 4103 34096 588736 464182bwa 7 2617 0 202 3 0 3 17 42 0 3 3 5 106 250zaf 279 13947 1470 0 2206 680 303 693 999 87 204 845 631 14700 7270xsc 9 1445 5 916 1 40 8 8 17 3 16 148 11 416 580moz 5 696 0 287 4 0 18 1 101 0 1 2 5 145 73mwi 36 232 1 62 0 26 0 12 6 0 6 1 6 214 175zmb 5 712 4 172 18 0 11 0 17 0 4 3 2 555 91zwe 22 997 53 199 26 4 30 91 0 0 5 10 25 787 305mdg 3 582 0 4 0 0 0 0 0 0 0 24 1 203 287tza 17 774 0 12 0 2 8 7 1 1 0 11 8 572 176xsd 38 4812 2 41 3 2 0 6 78 124 8 15 193 1687 3949mrc 1165 29818 5 937 22 24 10 6 31 13 17 285 14858 47374 24871xdg 42481 609262 193 10449 494 253 158 306 347 423 1129 3562 32383 1326467 855605xdd 14669 419231 142 5368 395 155 65 117 240 152 453 1847 29885 589956 440534
10

Tariff profile
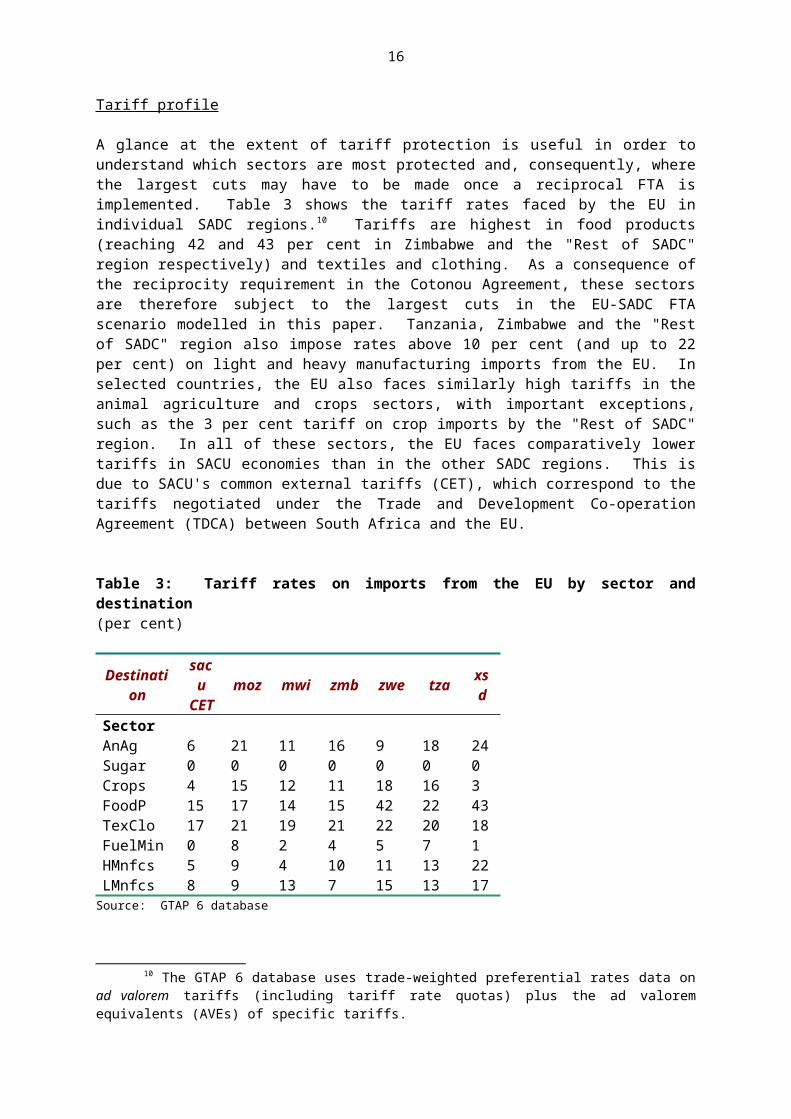
A glance at the extent of tariff protection is useful in order to understand which sectors are most protected and, consequently, where the largest cuts may have to be made once a reciprocal FTA is implemented. Table 3 shows the tariff rates faced by the EU in individual SADC regions. 10 Tariffs are highest in food products (reaching 42 and 43 per cent in Zimbabwe and the "Rest of SADC" region respectively) and textiles and clothing. As a consequence of the reciprocity requirement in the Cotonou Agreement, these sectors are therefore subject to the largest cuts in the EU-SADC FTA scenario modelled in this paper. Tanzania, Zimbabwe and the "Rest of SADC" region also impose rates above 10 per cent (and up to 22 per cent) on light and heavy manufacturing imports from the EU. In selected countries, the EU also faces similarly high tariffs in the animal agriculture and crops sectors, with important exceptions, such as the 3 per cent tariff on crop imports by the "Rest of SADC" region. In all of these sectors, the EU faces comparatively lower tariffs in SACU economies than in the other SADC regions. This is due to SACU's common external tariffs (CET), which correspond to the tariffs negotiated under the Trade and Development Co-operation Agreement (TDCA) between South Africa and the EU.
Table 3: Tariff rates on imports from the EU by sector and destination(per cent)
Destination sacu CET moz mwi zmb zwe tza xsd
SectorAnAg 6 21 11 16 9 18 24Sugar 0 0 0 0 0 0 0Crops 4 15 12 11 18 16 3FoodP 15 17 14 15 42 22 43TexClo 17 21 19 21 22 20 18FuelMin 0 8 2 4 5 7 1HMnfcs 5 9 4 10 11 13 22LMnfcs 8 9 13 7 15 13 17
Source: GTAP 6 database
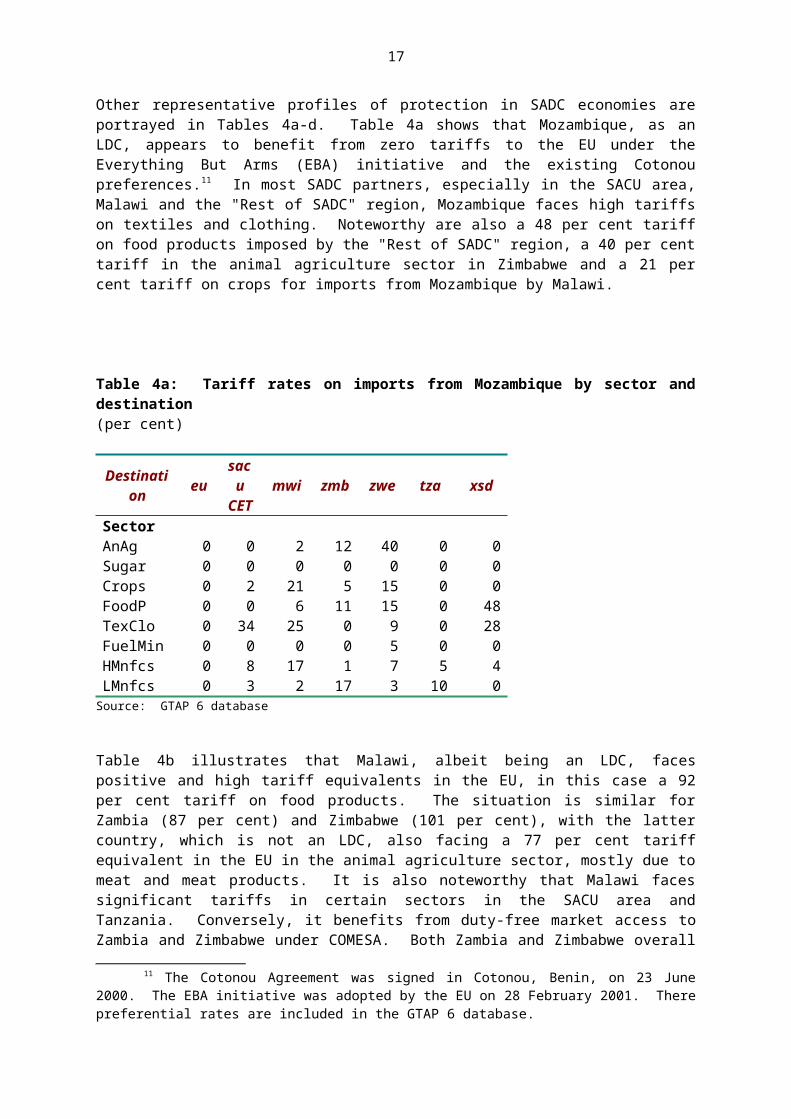
Other representative profiles of protection in SADC economies are portrayed in Tables 4a-d. Table 4a shows that Mozambique, as an LDC, appears to benefit from zero tariffs to the EU under the Everything But Arms (EBA) initiative and the existing Cotonou preferences.11 In most SADC partners, especially in the SACU area, Malawi and the "Rest of SADC" region, Mozambique faces high tariffs on textiles and clothing. Noteworthy are also a 48 per cent tariff on food products imposed by the "Rest of SADC" region, a 40 per cent tariff in the animal agriculture sector in Zimbabwe and a 21 per cent tariff on crops for imports from Mozambique by Malawi.
10 The GTAP 6 database uses trade-weighted preferential rates data on ad valorem tariffs (including tariff rate quotas) plus the ad valorem equivalents (AVEs) of specific tariffs.
11 The Cotonou Agreement was signed in Cotonou, Benin, on 23 June 2000. The EBA initiative was adopted by the EU on 28 February 2001. There preferential rates are included in the GTAP 6 database.
11

Table 4a: Tariff rates on imports from Mozambique by sector and destination(per cent)
Destination eu sacu CET mwi zmb zwe tza xsd
SectorAnAg 0 0 2 12 40 0 0Sugar 0 0 0 0 0 0 0Crops 0 2 21 5 15 0 0FoodP 0 0 6 11 15 0 48TexClo 0 34 25 0 9 0 28FuelMin 0 0 0 0 5 0 0HMnfcs 0 8 17 1 7 5 4LMnfcs 0 3 2 17 3 10 0
Source: GTAP 6 database
Table 4b illustrates that Malawi, albeit being an LDC, faces positive and high tariff equivalents in the EU, in this case a 92 per cent tariff on food products. The situation is similar for Zambia (87 per cent) and Zimbabwe (101 per cent), with the latter country, which is not an LDC, also facing a 77 per cent tariff equivalent in the EU in the animal agriculture sector, mostly due to meat and meat products. It is also noteworthy that Malawi faces significant tariffs in certain sectors in the SACU area and Tanzania. Conversely, it benefits from duty-free market access to Zambia and Zimbabwe under COMESA. Both Zambia and Zimbabwe overall are confronted with similar tariff profiles as Malawi.
Table 4b: Tariff rates on imports from Malawi by sector and destination(per cent)
Destination eu sacu CET moz zmb zwe tza xsd
SectorAnAg 0 0 5 0 0 12 0Sugar 0 0 0 0 0 0 0Crops 0 15 0 0 0 12 0FoodP 92 28 8 0 0 25 0TexClo 0 33 7 0 0 7 0FuelMin 0 0 1 0 0 0 0HMnfcs 0 2 6 0 0 21 0LMnfcs 0 9 0 0 0 6 0
Source: GTAP 6 database
In Table 4c, it can be seen that the EU imposes a high tariff on meat imports (covered in animal agriculture) from Botswana, a non-LDC. Botswana (and a similar profile applies for the "Rest of SACU" region) also faces high tariffs in other SADC countries, in particular in Malawi, Zambia and Zimbabwe in the processed food sector.
12

Table 4c: Tariff rates on imports from Botswana by sector and destination(per cent)
Destination eu moz mwi zmb zwe tza xsdSectorAnAg 64 0 0 10 12 0 0Sugar 0 0 0 0 0 0 0Crops 0 0 0 15 0 0 0FoodP 1 0 23 22 37 0 0TexClo 0 0 6 25 40 25 0FuelMin 0 0 0 3 10 0 0HMnfcs 0 2 18 15 8 6 19LMnfcs 0 7 16 11 26 11 1
Source: GTAP 6 database
Finally, while Tanzania faces zero or low duties in the EU and (except in textiles and clothing) also in SACU countries, it is confronted with some relatively high rates in other SADC partners, especially in regard to crops (15 to 17 per cent, with a 64 per cent peak in Zimbabwe), textiles and clothing and animal agriculture (except in Mozambique and the "Rest of SADC" region) and in food products (except for its duty-free access in Zimbabwe and a relatively low tariff in the "Rest of SADC" region).
Table 4d: Tariff rates on imports from Tanzania by sector and destination(per cent)
Destination eu sacu CET moz mwi zmb zwe xsd
SectorAnAg 0 0 0 9 13 19 1Sugar 0 0 0 0 0 0 0Crops 0 1 2 15 17 64 17FoodP 5 1 20 13 12 0 7TexClo 0 12 7 16 18 28 0FuelMin 0 0 0 0 0 0 0HMnfcs 0 1 11 9 9 0 11LMnfcs 0 1 5 12 12 14 0
Source: GTAP 6 database
The preceding analysis shows that there is a significant potential for liberalization by SADC economies both towards the EU and amongst themselves. Given the overall low or zero tariffs faced by SADC countries' exports in many sectors, liberalization by the EU will be most significant for certain agricultural commodities.
B. MODIFICATIONS OF THE STANDARD GTAP MODEL
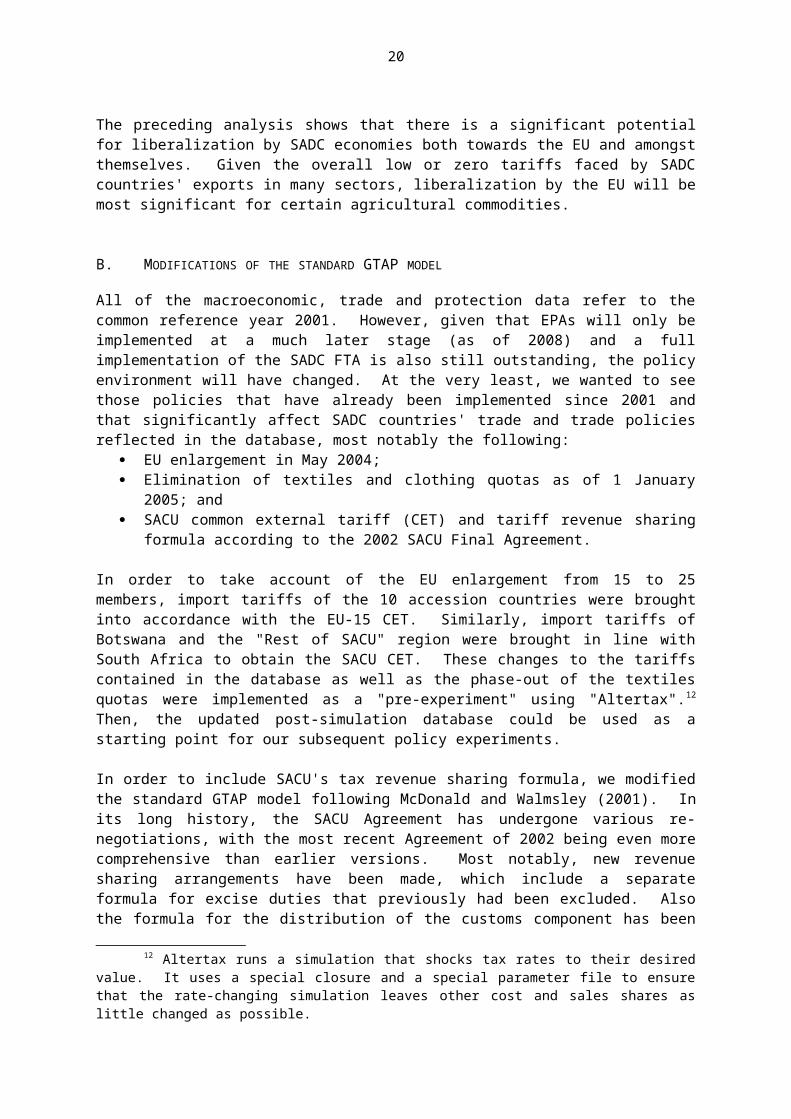
All of the macroeconomic, trade and protection data refer to the common reference year 2001. However, given that EPAs will only be implemented at a much later stage (as of 2008) and a full implementation of the SADC FTA is also still outstanding, the policy environment will have changed. At the very least, we wanted to see those policies that have already been implemented since 2001 and
13

that significantly affect SADC countries' trade and trade policies reflected in the database, most notably the following:
EU enlargement in May 2004; Elimination of textiles and clothing quotas as of 1 January 2005; and SACU common external tariff (CET) and tariff revenue sharing formula according to the
2002 SACU Final Agreement.
In order to take account of the EU enlargement from 15 to 25 members, import tariffs of the 10 accession countries were brought into accordance with the EU-15 CET. Similarly, import tariffs of Botswana and the "Rest of SACU" region were brought in line with South Africa to obtain the SACU CET. These changes to the tariffs contained in the database as well as the phase-out of the textiles quotas were implemented as a "pre-experiment" using "Altertax".12 Then, the updated post-simulation database could be used as a starting point for our subsequent policy experiments.
In order to include SACU's tax revenue sharing formula, we modified the standard GTAP model following McDonald and Walmsley (2001). In its long history, the SACU Agreement has undergone various re-negotiations, with the most recent Agreement of 2002 being even more comprehensive than earlier versions. Most notably, new revenue sharing arrangements have been made, which include a separate formula for excise duties that previously had been excluded. Also the formula for the distribution of the customs component has been revised on the basis of each country's share in total intra-SACU imports (Botswana: 27 per cent; Lesotho: 13 per cent; Namibia: 25 per cent; Swaziland: 15 per cent; and South Africa: 20 per cent). These arrangements are meant to compensate for the cost-raising effects of the customs union and, by including excise duties, ensure greater stability of revenues for the BLNS countries, when tariff income will decline over time. The new accord also provides for a development component, funded out of the excise duty pool, which results in higher transfers to the lesser developed SACU members (Kirk and Stern, 2003). In our model, we only take account of the customs component of the new tariff revenue sharing arrangements. We have decided to do so, as GTAP protection data based on MAcMap appears to contain the statutory tariffs without excise duty components.
III. POLICY EXPERIMENTS
The reference experiment involves the full removal of ad valorem import tariffs and tariff equivalents of bilateral non-tariff barriers (NTBs) among the EU-25 and SADC economies. The outcomes of this experiment can then be compared to a range of other experiments with differing country coverage, degrees of liberalization as well as FTA partners. Specifically, the following experiments were performed:
1. EU-SADC: Free trade agreement between the EU-25 and SADC in the context of the EPA negotiations. In order to estimate the impact of reciprocity, this experiment simulates a complete, symmetrical removal of import protection. Although a complete removal of import protection is unlikely, commitments are expected to be asymmetrical (with a larger number of exceptions for SADC countries) and their implementation by SADC countries is to be staggered over a longer time-period, this experiment provides a useful benchmark of the potential economic effects of EPAs on SADC countries.
2. EU-SADC & SADC: Free trade agreement between the EU-25 and SADC and preferential free trade area among SADC economies. In addition to the reference scenario, import protection (both tariffs and NTBs) within the SADC region are removed, but external protection by each country
12 Altertax runs a simulation that shocks tax rates to their desired value. It uses a special closure and a special parameter file to ensure that the rate-changing simulation leaves other cost and sales shares as little changed as possible.
14

against the rest of the world is maintained. A comparison to the reference experiment provides an important indication of the extent to which trade diversion from other SADC partners to the EU can be avoided through simultaneous intra-SADC liberalization.
3. SADC: SADC free trade area. This experiment serves to isolate the effects of exclusive liberalization among SADC economies.
4. Multilateral: Full multilateral trade liberalization. This experiment simulates a hypothetical scenario of a Doha Round that would eliminate all import barriers by all regions. It gives a useful benchmark of how various regional integration efforts measure up to a total multilateral removal of import protection.
5. EU-SADC 50%Ag: Partial liberalization. In this experiment, import protection is entirely removed for manufactures, while tariffs in agriculture are only reduced by 50 per cent. The results can be compared to scenarios that include agricultural liberalization in order to estimate the importance of the latter for individual SADC economies.
6. EU-SADC Subs: Total liberalization of not only import barriers, but also of export subsides and taxes as well as product-specific domestic support and taxes. This experiment can be used to identify those countries in the SADC region that would particularly benefit from a simultaneous elimination of agricultural subsidies in the context of the Doha negotiations.
7. EU-SADC & EU-Mercosur: Under this scenario the EU-25 is assumed to sign two FTA agreements, one with SADC and one with Mercosur countries. Although the complete removal of import barriers between the EU and Mercosur is an unlikely outcome of the on-going EU-Mercosur negotiations, this experimental set-up can be used to show how benefits from an EU-SADC FTA following the EPA negotiations may be affected by a simultaneous engagement of the EU-25 with other FTA partners. A potential FTA by the EU with Mercosur has been chosen for the simulation, since it is likely to have a significant impact on SADC countries' expected gains from EPAs due to the importance of Mercosur countries in EU trade and their relative competitiveness in agriculture.
All of the experiments were carried out in the standard GTAP closure which allows for output, prices and factor incomes to adjust to external shocks. Selected experiments were then repeated for an "unemployment" closure, whereby nominal wages for unskilled labour in developing countries are fixed and equilibrium is re-established by changes in the quantity of unskilled labour. This is a more realistic set-up for countries disposing of a large excess supply of unskilled labour. Hence, increases in unskilled labour lead to a reduction of latent unemployment. Finally, the reference experiment of symmetric liberalization between the EU and SADC countries in the context of EPAs was also repeated under different closures that allow for a replacement of tariff revenues lost through either a VAT tax on private consumption or combinations of different levels of the VAT tax and an income tax on skilled and unskilled labour. These experiments highlight the welfare implications of the design of the tax regime that is meant to replace government income from trade taxes.
IV. RESULTS
This Part analyses the results of the experiments described above. It is organised in four Sections. The first one (Section A) focuses on the welfare effects for SADC countries of different liberalization policies. On the basis of the payoffs estimated in the simulations of different scenarios of liberalization, the benefits of further intra-SADC liberalization, EPAs and multilateral liberalization relative to one another will be discussed for each SADC region. In this context, the consequences for SADC countries of the EU signing multiple regional agreements with different partners will be analysed by including an EU-Mercusur FTA in the simulations. Moreover, separate experiments will attempt to isolate the importance of agriculture in the negotiations and, in particular, the removal of subsidies.
15

Section B analyses the redistributive effects of liberalization. Specialization impacts on the production structure and factor incomes (of skilled and unskilled labour, capital, land and natural resources) will be highlighted. Sections C and D focus on the impact of the EU-SADC free trade agreement on trade patterns and the rate of unemployment in SADC economies respectively. Finally, the effects of trade liberalization on tax revenue will be highlighted, and the relative merits of different tax replacement scenarios will be examined. In order to provide the reader with a clear message, each Section only compares a subset of experiments.
A. WELFARE EFFECTS
Taking as a benchmark for discussion the case of the EU-SADC FTA, we examine the following policy questions:
(i) How do SADC countries compare to each other in terms of welfare, and how do welfare effects under a EU-SADC FTA measure up to further intra-regional liberalization within SADC (separately and simultaneously) as well as to multilateral liberalization at the global level?
(ii) How would the welfare of SADC countries be affected if the EU concluded multiple FTAs with other regions? And
(iii) Is it worthwhile pursuing an EU-SADC FTA if the agricultural sector is partially excluded, and how important is a simultaneous removal of subsidies?
GTAP measures the impact of trade liberalization on welfare in terms of equivalent variations (EV) in income (2001 $ millions in the GTAP 6 database). EV represents the money-metric equivalent to the utility change brought about by a change in prices. It measures the amount of money that would need to be taken away from the consumer before the price change to leave her as well off as she would be after the change in prices.
The main sources for welfare changes in our model are the following: (i) Welfare may be affected by a reallocation of existing resources (allocative efficiency effect (alloc eff)). (ii) Prices of imports and exports faced by a country may become more or less favourable (terms of trade effect (tot)). (iii) Welfare may vary due to a change in the amount of resource endowments (endowment effect (endw)). As endowments in the standard GTAP closure are exogenous, this effect, in our paper, only occurs for the unemployment closure. (iv) Welfare may increase if net inflows are received by a country from tax revenue pooling. In this paper, this is relevant only for the SACU countries. The welfare results for all 15 regions examined in the paper and all scenarios under the standard GTAP closure are given in the Annex.13
In this Section, we do not further discuss the welfare results brought about by tax revenue pooling. The reason for this is that the tax-pooling system among SACU countries has strong consequences on overall welfare effects, except when SADC members liberalize just among themselves. Tax revenue net receiving countries, such as Botswana and the "Rest of SACU" region, experience increasingly negative welfare tax-pooling effects with higher levels of liberalization (see Chart 4). These welfare losses are due to the overall loss in tax-revenue in the common pool, when tariffs are removed, and
13 Under this closure, there are no endowment effects. However, the tables in the Annex contain a component "IS", which denotes Investment and Savings Prices. Like exports, investment sales generate income, but do not enter into regional utility. A higher investment price index increases real income. The opposite is the case for savings, which like imports enter the regional utility function, but do not generate current income. If the savings price goes up, real income falls. Hence, due to the mechanics of the GTAP model, investment and savings prices appear in the welfare decomposition, although no substantive economic insights about welfare can be gained from these terms. This is not surprising that the true costs and benefits of savings and investment cannot be well represented in a comparative static model.
16
lower transfers from South Africa if the revenue sharing formula remains unchanged. For the latter reason, South Africa sees its tax-pooling welfare increase. It should also be noted that the same nominal tariff revenue transfer can have different welfare impacts in the recipient and donor country owing to differences in preferences. Since it can be assumed that SACU countries would re-adjust tax revenue shares in order to redistribute gains and losses more equally among themselves when tariff reductions are imminent, we exclude this component from our welfare analysis of various liberalization scenarios and concentrate on the sum of allocative efficiency and terms-of-trade effects. In addition, we separately highlight the real GDP growth rates brought about by the allocative efficiency gains for each country and examine how sensitive these results are to a variation of key parameters.
Chart 4: Welfare effects from SACU tax pooling by country, selected scenarios(2001 $ million)
-1000
-500
0
500
1000
1500
SADC EU-SADC EU-SADC& SADC
Multilateral
bwazafxsc
Source: Authors' simulations.
1. Regional and multilateral trade liberalization
(a) Allocative efficiency and terms of trade effects
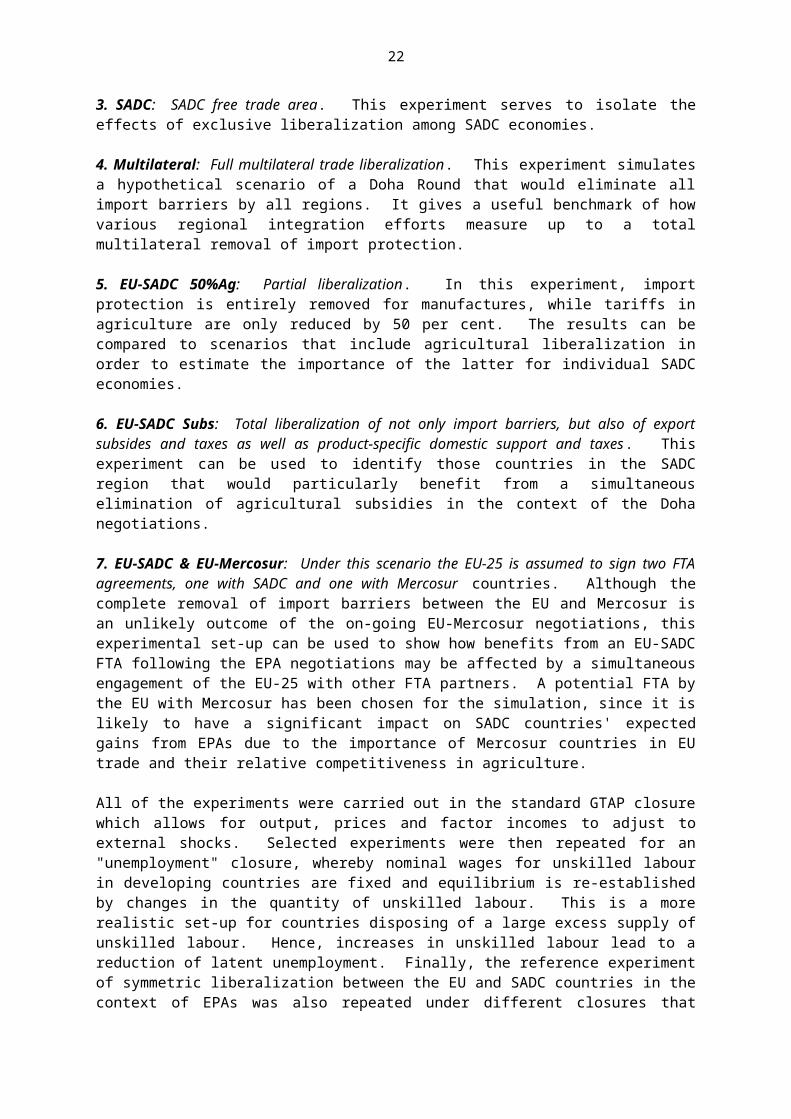
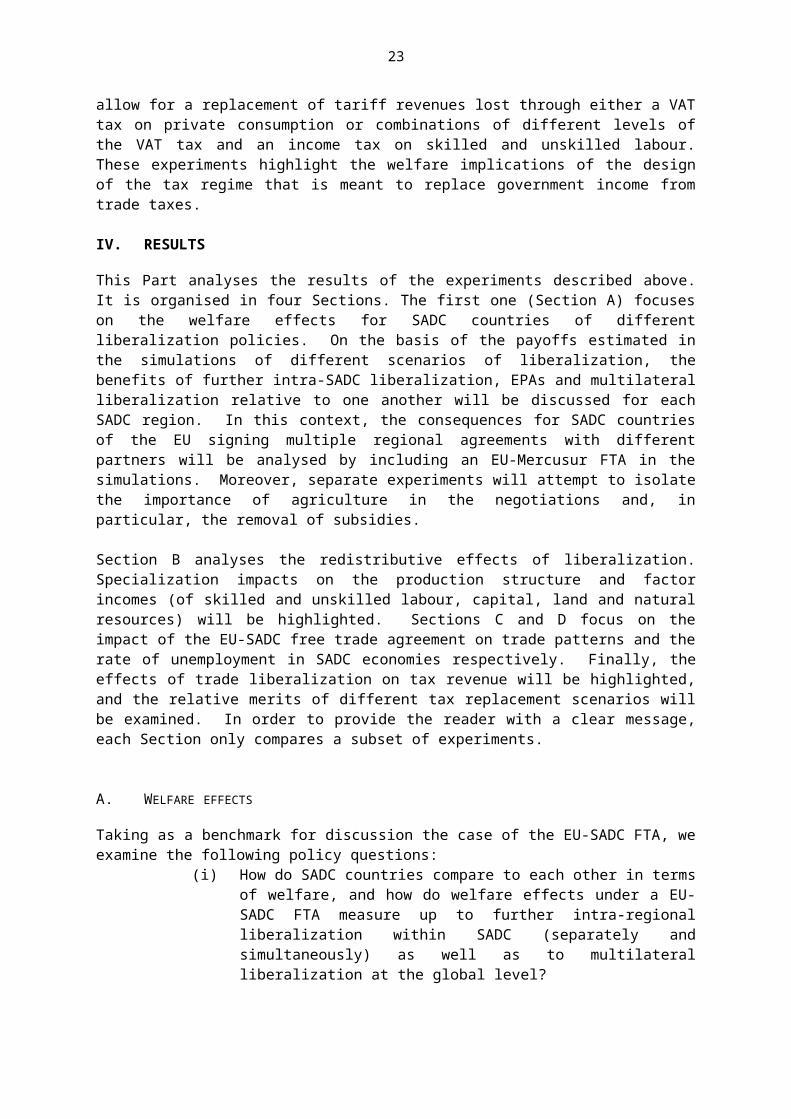
Charts 5a-c report the welfare results (in terms of the sum of allocative efficiency and terms of trade effects) of the simulations of an FTA among all SADC partners (hereafter referred to as "SADC"), an FTA between the EU and SADC ("EU-SADC"), both FTAs simultaneously ("EU-SADC & SADC") as well as multilateral trade liberalization at the global scale ("Multilateral"). All four scenarios involve the removal of all import tariffs and non-tariff equivalents (as represented by tms in GTAP) between the regions involved. A number of SADC countries do best under a multilateral trade liberalization scenario. Several of them realize substantive welfare gains under an EU-SADC FTA, which do not vary much depending on whether or not simultaneous integration within SADC is pursued. Some countries seem to experience hardly any changes in welfare. A more detailed look at the individual country results seems on the order as well as an analysis of the driving forces behind those results. For the data, on which the discussion below on allocative efficiency vs. terms of trade effects is based, the reader is kindly referred to the Annex.
Chart 5a displays the welfare effects in SACU members. South Africa is best off under a multilateral liberalization outcome in terms of allocative efficiency. It also sees its terms of trade increase in a similar manner, albeit less so, when an EU-SADC FTA is concluded than when SADC partners liberalize just among themselves. Some of South Africa's gains may be shaved off by the large terms of trade gains by Botswana and the "Rest of SACU" under a EU-SADC FTA as opposed to intra-SADC liberalization alone. Botswana faces only negligible allocative efficiency effects under any scenario, but increasing terms of trade gains, raising from a slightly negative number under "SADC"
17
to significant gains under "Multilateral". Whether or not SADC liberalizes simultaneously to an EU-SADC FTA does not make a difference for Botswana in terms of welfare. For the "Rest of SACU" region, i.e. Lesotho, Swaziland and Namibia, it makes a large difference whether liberalization takes place just within SADC or between the EU and SADC. The results are also "terms of trade-driven". This explains why the positive welfare effect of multilateral trade liberalization is slightly lower than under the "EU-SADC" and "EU-SADC & SADC" scenarios. Although allocative efficiency increases by one third under the multilateral scenario as opposed to "EU-SADC & SADC" liberalization, these gains are offset by a somewhat lesser terms of trade improvement in a multilateral setting.
Chart 5b features the group of countries - Malawi, Zambia and Zimbabwe - that, as shown above in the discussion of tariff profiles, appear to have lifted import barriers towards one another in the context of COMESA and are principal SADC members forming part of the ESA group in the EPA negotiations. The pattern of welfare effects faced by Malawi and Zimbabwe, albeit with much larger absolute gains for the latter, are similar to one of the "Rest of SACU". They are mainly driven by terms of trade effects, although to a much larger extent for Zimbabwe than for Malawi. Zimbabwe moves from minor terms of trade losses in a SADC liberalization scenario to significant gains under liberalization with the EU and, to a slightly lesser extent, under a multilateral scenario. For Malawi, which sees positive allocative efficiency and terms of trade effects under all scenarios, between one fourth and one third of welfare effects are due to gains in allocative efficiency. Again, under a multilateral scenario, a marginal increase in allocative efficiency is overcompensated by a lesser improvement in Malawi's terms of trade in comparison to both liberalization scenarios with the EU. Welfare effects in Zambia are close to nil and somewhat erratic with marginal allocative efficiency gains being cancelled out by small terms of trade deteriorations or vice versa.
In Chart 5c, the welfare effects of the remaining SADC countries are presented – Mozambique and Tanzania - that, together with the relevant SACU countries, form the SADC negotiating group for the purposes of the EPA negotiations. The chart also features the results for the mixed "Rest of SADC" region, with Angola being part of the SADC negotiating group and the DRC, Mauritius and the Seychelles being part of the ESA negotiating group. The latter region follows a similar welfare pattern as Botswana and South Africa. It is, however, noteworthy that, similar to South Africa, allocative efficiency effects play a significant role for the "Rest of SADC" region, to a particularly large extent in the case of multilateral trade liberalization where allocative efficiency exceeds terms of trade gains by a factor of almost three. Mozambique and Tanzania struggle with negative terms of trade effects under all four scenarios. While Mozambique, except for a small negative value in the EU-SADC scenario, always faces positive allocative efficiency effects, this is the case for Tanzania only when multilateral liberalization is achieved at the global level.
18

Charts 5a, 5b and 5c: Welfare effects by country, selected scenarios(2001 $ million)
-200
0
200
400
600
800
1000
1200
1400
1600
SADC EU-SADC EU-SADC &SADC
Multilateral
bwaxsczaf
-50
0
50
100
150
200
250
300
SADC EU-SADC EU-SADC &SADC
Multilateral
mwizmbzwe
-100
0
100
200
300
400
500
600
SADC EU-SADC EU-SADC &SADC
Multilateral
moztzaxsd
Source: Authors' simulations.
The overall negative values for these two countries seem worrying, but may be due to inherent limitations of the concept of EV as a welfare measure. In our study, the main problem appears to relate to the importance of terms of trade changes. The GTAP model differentiates products by country of origin (Armington assumption). Changes in the terms of trade can come about from changes in the relative prices of different source-specific varieties of the same commodity, as every
19

region in the model acts as a "large" country that can influence prices. For instance, a region will tend to experience a terms of trade deterioration if it imports source-specific varieties that rise in price relative to prices of the same commodity from other sources. This may lead to an exaggeration of terms of trade effects, as, in reality, a country may import at a world price that remains largely unaffected by other "small" countries. It is therefore useful to look at the sensitivity of welfare results in response to alternative values for key parameters, in particular the Armington elasticities.
Also, policy-makers can be expected to be more interested in real output changes than in equivalent variation as a money-metric expression of consumer utility. We, therefore, focus in the next Subsection on real GDP growth resulting from allocative efficiency gains in the four scenarios, before conducting a sensitivity analysis for the EU-SADC FTA reference scenario.
(b) Changes in real GDP
From Chart 6, it can be seen that all countries register positive growth in real GDP under the multilateral scenario. Moreover, for all regions of the model, except Malawi featuring slightly higher rates under an EU-SADC FTA, multilateral trade liberalization results in the highest real GDP increases (with a maximum 1.9 per cent in the "Rest of SADC" region). South Africa, the "Rest of SACU" region, Malawi and Zimbabwe are the major beneficiaries from liberalization with the EU in terms of real GDP expansion. For Mozambique and the "Rest of SADC" region, simultaneous liberalization within SADC is crucial in order to reap such benefits.
Nevertheless, it should also be noted that "EU-SADC" is the only scenario (except for Tanzania, which experiences a positive development in real GDP only for multilateral trade liberalization), in which some countries face real GDP reductions. These are relatively small though (ranging from 0.06 per cent in Botswana to 0.17 per cent in Zambia), especially in comparison to the increases achieved by other SADC members under an EU-SADC FTA, amounting to 0.22 per cent for Zimbabwe, 0.28 per cent for the "Rest of SACU" region and 0.87 per cent for Malawi. For Malawi and Zimbabwe, the difference between an FTA with the EU plus intra-SADC liberalization and multilateral trade liberalization is almost negligible. These results reflect the relatively high proportion of trade by these two countries accounted for by the EU and other SADC partners.
Chart 6: Real GDP growth rates by country, selected scenarios(per cent)
-0.4
-0.2
0
0.2
0.4
0.6
0.8
1
bwa zaf xsc mwi zmb zwe moz tza xsd
SADC
EU-SADC
EU-SADC & SADC
Multilateral
Source: Authors' simulations.
20
(c) Sensitivity analysis
Given our positive assessment of all four liberalization scenarios in terms of real GDP developments, how reliable are these results? In particular, given the model set-up, as discussed earlier, how sensitive are they to the assumed values for the Armington parameters? We have carried out a sensitivity analysis by solving the model several times (for different values of the Armington parameters within a range of plus/minus 50 per cent of the original value). The distributions of the values of each endogenous variable, including the one of our interest, changes in real GDP, are summarised by their means and standard deviations. From these, it is possible to infer information about the likely values and range of the endogenous variables and to attach confidence intervals depending on the assumed shape of the distribution of the respective endogenous variable. If no assumptions about its distribution are made, according to Chebyshev’s inequality, one can be about 75 per cent confident that the values for real GDP changes lie within two standard deviations (SD) of the mean (when the Armington parameters vary as indicated above). These estimates are wider than they would be if the distribution was known and, hence, probably too pessimistic. If the assumption is made that the results are approximately normally distributed, the confidence level rises to 95 per cent that the true value lies two standard deviations above or below the mean.
The estimated mean values and standard deviations of real GDP growth rates under an EU-SADC FTA assuming a plus/minus 50 per cent variation in the Armington parameters are given below in Chart 7. For most SADC regions, variability, as displayed by plus/minus two standard deviations in the Chart, is quite large, in particular for Malawi with a lower bound of 0.18 per cent and an upper bound of 1.6 per cent (not shown in the Chart). With the exception of the "Rest of SADC" region, variation as given in the Chart does not tend to lead to a change in sign. If a normal distribution is assumed, Malawi, for instance, has only a 1.24 per cent risk that real GDP growth will be negative. It is also noteworthy that for most countries, the estimated average real GDP growth, despite large variations in the Armington parameters, are higher than in the original scenario.
Chart 7: Sensitivity of real GDP growth rates to 50 per cent variations in Armington parameters(per cent)
-0.4
-0.2
0
0.2
0.4
0.6
0.8
1
bwa zaf xsc mwi zmb zwe moz tza xsd
qgdp Mean witn +/- 2*SD interval
Source: Authors' simulations.
2. The proliferation of regional trade agreements and preference erosion
When economists analyze the impact of the formation of a preferential FTA on a country's welfare, they usually perform their analysis ceteris paribus, with everything else unchanged. This is what we have done so far when examining the impact of the formation of an FTA between the EU and SADC. But we have neglected that the EU is currently negotiating an FTA with Mercusur countries as well, which could be assumed to be implemented at the same time as its FTA with SADC. The EU is the most important source of imports for Mercosur but it is also an important destination for Mercosur
21

countries' exports (second only to the aggregate of the "Rest of developing countries" region in our model). In theory, an EU-Mercosur FTA can be expected to divert trade away from SADC countries and reduce gains from an EU-SADC preferential arrangement.
The welfare results (in terms of the sum of allocative efficiency and terms of trade effects) of the simulations of the formation of EU-SADC and EU-Mercosur FTAs are portrayed in Chart 8. It is important to note that taking into account the possibility of the EU signing an FTA with another group of developing countries (say, Mercosur) significantly lowers the expected gains from preferential trade with the EU for SADC countries. Like multilateral liberalization, competitive regional trade agreements erode the margin of preference that preference-beneficiaries enjoy. The advantage of multilateral negotiations is that concessions must be extended to all countries (most-favourite-nation principle), while to the extent that preferences are granted unilaterally they can be withdrawn or better market access can be granted to third countries.
Chart 8: Welfare impact on SADC countries of the formation of an EU-Mercosur FTA(2001 $ million)
-100
0
100
200
300
400
500
bwa zaf xsc mwi zmb zwe moz tza xsd
EU-SADCEU-SADC& EU-Mercosur
Note: Welfare is calculated as the sum of allocative efficiency and terms of trade effect.Source: Authors' simulations.
3. Partial and full trade liberalization
Chart 9 reports the allocative efficiency and terms of trade effects across SADC countries under an EU-SADC FTA for the three cases of a full reduction of import barriers (first bar), a partial liberalization whereby tariffs and tariff equivalents in agricultural products are only reduced by 50 per cent (second bar), and a full liberalization that includes the removal of both export subsidies and product-specific domestic support for agricultural commodities by the EU-25 (third bar). For a number of SADC countries, the reduction of welfare gains, when agricultural import protection is reduced by 50 per cent only, is quite substantial, in particular for Zimbawbe, which loses almost half of its benefits, and Botswana, where gains are completely wiped out. The importance of agricultural market access for these countries was to be expected, given the EU's high rates of protection in the animal agriculture sector (77 for Zimbabwe and 64 per cent for Botswana). South Africa, which, despite the TDCA, is still facing positive tariffs and tariff equivalents of 5 to 10 per cent in the three agricultural sectors of the model, retains significant welfare gains from even a more modest agricultural liberalization, owing to strong improvements in allocative efficiency.
22
In terms of welfare, it hardly makes any difference for other SADC regions in the model, except for South Africa, whether or not, in addition to the reference scenario of a complete elimination of import barriers under an EU-SADC FTA, the EU abolishes export subsidies as well as product-specific domestic support in agriculture. The result is the same, including for South Africa, if real GDP changes are considered.
Chart 9: Welfare effects by country, selected scenarios(2001 $ million)
-100
0
100
200
300
400
500
EU-S
AD
C50
%A
gSu
bsEU
-SA
DC
50%
Ag
Subs
EU-S
AD
C50
%A
gSu
bsEU
-SA
DC
50%
Ag
Subs
EU-S
AD
C50
%A
gSu
bsEU
-SA
DC
50%
Ag
Subs
EU-S
AD
C50
%A
gSu
bsEU
-SA
DC
50%
Ag
Subs
EU-S
AD
C50
%A
gSu
bs
bwa zaf xsc mwi zmb zwe moz tza xsd
alloc eff tot
Note: Selected scenarios are EU-SADC; EU-SADC and only 50 per cent reductions of import barriers in agriculture; and EU-SADC and abolition of agricultural support by the EU-25. Source: Authors' simulations.
B. REALLOCATION OF RESOURCES
The results for real GDP growth and welfare described in the previous Section refer to the steady-state outcome of the liberalization process. The analysis of the impact of liberalization with GTAP is a comparative static exercise. That is, it is assumed that all adjustments have taken place, i.e. all regions have optimized their behaviour in accordance with the new price levels, and all resource shifts have taken place. Comparative static analysis provides no information on the costs of adjustment.
We argue that an indication of the extent of the adjustment costs can be deduced from the impact of liberalization on a country's production structure. In the next Subsections, we compare adjustment costs across a number of scenarios and analyse the impact of an EU-SADC FTA on the distribution of production across sectors. We identify the most dynamic sectors and the sectors that are likely to be most affected by import competition. Moreover, we identify the category of owners of factors of production that most gain or lose from such liberalization.
1. Resource reallocation across sectors
When a country opens up to trade, it tends to specialize in the production of goods for which it has a comparative advantage. This requires resources to be reallocated towards the relatively most efficient sectors. In practice, this implies that, for example, workers need to be retrained and machines have to be adapted. All of these changes induce costs. Ceteris paribus these costs are likely to be higher the larger the shifts in the production structure. Both increase in the size of a sector and reductions induce
23
costs. Therefore, the variability of the production structure as measured by the standard deviations of the variation in value added may be a good measure of the adjustment cost that a country will face after liberalizing. In order to make comparisons across countries and scenarios, this measure of variability must be standardized. We therefore calculate the coefficient of variation (CV), which is the standard deviation divided by the mean. Chart 10 reports the coefficients of variation for the changes in value added across sectors by country and for three selected policy experiments: an EU-SADC FTA, an EU-SADC FTA including further intra-SADC liberalization, and multilateral liberalization. This index is used to measure the extent of structural adjustment under the three different scenarios.14 It appears that for some countries, such as Botswana, the "Rest of SACU" region, Malawi and Zimbabwe, the required overall structural adjustment is low. In addition, for some other countries, such as Tanzania and South Africa, the required structural adjustment under the multilateral liberalization scenario is less than under the EU-SADC FTA.
Chart 10: The extent of structural adjustment by country, selected scenarios(per cent)
0
200
400
600
800
1000
1200
bwa zaf xsc mwi zmb zwe moz tza xsd
EU-SADC
EU-SADC & SADC
Multilateral
Note: Coefficients of variation of the changes in value added across sectors are reported on the vertical axis.Source: Authors' simulations.
Table 5 provides a description of the sectoral adjustments that are likely to occur at the country level. It appears that Botswana, the "Rest of SACU" region and Zimbabwe have a large incentive to shift resources towards animal agriculture. Beyond this, Malawi, the "Rest of SACU", the "Rest of SADC", Zimbabwe and Zambia tend to move resources towards sugar and/or processed food. In general, the model predicts that SADC countries will move resources away from the manufacturing sectors towards agriculture. Processed food and animal agriculture are among the most dynamic sectors.
14 The index cannot be calculated when the average across sectors of changes in value added is zero. For this reason some values are inputed as missing in the Chart, for instance for Mozambique.
24

Table 5: Changes in sectoral value added by country and sector, EU-SADC FTA(2001 $ million and per cent)a
bwa zaf xsc mwi zmb zwe moz tza xsdAnAg 363 45 171 3 1 202 -1 -4 -9
133 3 105 11 1 83 -1 -1 -2
Sugar 0 2 31 3 4 12 0 0 34-12 2 72 77 14 23 -1 0 41
Crops -23 207 13 -55 8 -101 2 7 74-20 9 5 -13 2 -14 1 0 7
FoodP -43 63 282 77 24 226 -1 2 624-14 2 73 78 15 23 -1 0 43
TexClo -5 -88 -96 -12 -6 -108 -2 0 -171-15 -5 -39 -37 -8 -25 -6 0 -23
FuelMin -2 -28 -39 -1 -2 -38 0 1 -140-2 -1 -25 -7 -4 -16 -1 1 -4
HMnfcs -27 -365 -155 -15 -11 -139 -3 -2 -183-9 -2 -27 -12 -4 -17 -2 -1 -16
LMnfcs -176 -308 -140 -8 -3 -57 -6 -16 -259-18 -4 -33 -11 -1 -28 -4 -3 -22
Svces -123 468 -101 5 -14 -10 11 11 22 -4 1 -4 1 -1 0 1 0 0a The second row for each sector shows percentage variations.Source: Authors' simulations.
The patterns of change are similar in the case of the EU-SADC FTA when SADC countries also liberalize trade among themselves and in the case of multilateral liberalization. There are however some remarkable differences. In the case of the EU-SADC FTA and simultaneous intra-SADC liberalization, the textile sector value added increases in Botswana, Mozambique and Malawi by between 10 to 25 per cent. The case of multilateral liberalization shows interesting results for Zambia and Tanzania that experience an increase in the value added of light manufacturing of around 5 per cent.
To sum up, the results suggest that there might be substantial structural change among SADC countries following trade liberalization. Zambia and Tanzania appear to be the countries where these changes are likely to be highest. The results also show a tendency of SADC countries to specialize in agriculture, in particular animal production as well as processed food, and away from manufacturing. The development of some industrial sectors (notably light manufacturing) only appears to take place under the multilateral liberalization scenario.
2. Income redistribution
Liberalization also affects a country's income distribution. Shifts of resources across sectors also bring about variations in the demand for different factors. The demand for the factor of production used intensively in the sectors in which a country tends to specialize will increase and so will the remuneration of this factor.
As a result of the specialization in agriculture, real remunerations for land owners and unskilled workers increase in most SADC countries. In particular, the estimated figures show a significant
25

increase in the remuneration of land in Botswana and the "Rest of SACU" region. This is consistent with tendency of these countries to specialize in animal agriculture.15 A comparison across different scenarios demonstrates that results are quite robust. The patterns of income redistribution are similar in the case of the EU-SADC FTA with intra-SADC liberalization and in the case of multilateral liberalization. Significant differences only emerge for Mozambique and Zambia where the remuneration for capital and skilled labour is expected to increase relatively more both in the case of the "EU-SADC & SADC" scenario and in the case of multilateral liberalization. This is consistent with the results for changes in value added, and it is likely to be driven by Mozambique's move towards textile production and Zambia's increase in the value added of light manufacturing.
It is worth keeping in mind that GTAP does not allow for an analysis of the impact of trade liberalization on inequality within a country or on poverty, and household survey data would be required for such analysis. The GTAP database does not contain information on the number of poor people. However, assuming that most of the poor population falls in the category "unskilled workers", the results of our simulations seem to hint to a positive impact of liberalization on poverty. Also, revenues from self-employment, as an important source of income for the poor, are recorded as returns to capital. This may bias the results and render difficult the analysis of redistribution effects within GTAP. The net effect of liberalization on the income of the poor will depend on the impact on their wages (if that is their only source of income), but also on the employment effects. The analysis of wage variations of this Section is carried out under the assumption of full employment. An analysis of the effects of liberalization in the case of unemployment is reported in Section D.
C. CHANGES IN TRADE PATTERNS
Table 6 compares the variations in the total volume of trade across scenarios. For most SADC countries, the highest increases in exports take place in the case of multilateral liberalization. However, the comparison also shows that, for several SADC economies, liberalization among themselves can be seen as a key component of overall export performance. For instance, for Malawi intra-SADC liberalization alone generates export increases of 6.5 per cent. In relative terms, this result compares quite favourably to the 9.5 per cent more exports if liberalization includes the EU and 11.1 per cent if liberalization is pursued at the global level. With a few exceptions, exports do not change drastically under an EU-SADC FTA given the wide-ranging preferential market access that SADC countries already enjoy in the EU. On the import side, total imports under an EU-SADC FTA increase for all SADC countries with the exception of Botswana. Malawi, "Rest of SACU", Zimbabwe and "Rest of SADC" show the highest percentage increases. Import surges are similarly significant under all scenarios owing to the general level of protection in SADC countries.
15 It should also be noted that land is a very sluggish factor. Therefore, higher demand will have a strong impact on return.
26

Table 6: Changes in trade volumes by country, all scenarios(per cent)
EU-SADC
EU-SADC &
SADCSADC Multi-
lateral
EU-SADC
50% Ag
EU-SADC
Subs
EU-SADC & EU-
Mercosur
Volume of exports (per cent change)bwa 0.7 1.2 0.5 3.0 3.6 0.7 1.7zaf -0.1 0.1 0.3 2.7 0.0 -0.2 -0.1xsc 13.3 14.3 1.7 24.6 12.7 13.1 13.2mwi 3.3 9.5 6.5 11.1 3.4 3.2 3.2zmb 0.7 5.4 5.3 7.2 0.8 0.6 0.7zwe -0.4 6.8 8.2 10.1 -1.1 -0.5 -0.5moz 0.5 4.4 4.4 5.3 0.5 0.4 0.4tza 6.0 8.9 4.1 23.1 5.9 5.8 6.0xsd 8.1 9.7 3.7 10.0 7.8 7.7 8.1 Volume of imports (per cent change)bwa -1.3 -1.1 0.2 -3.3 -1.3 -1.4 -1.3zaf 7.5 9.6 2.3 18.1 7.2 7.6 7.2xsc 18.4 20.4 4.1 16.1 12.5 18.2 16.2mwi 26.7 39.3 18.4 36.4 27.1 27.4 26.5zmb 2.0 8.8 7.5 10.5 2.5 1.9 2.1zwe 24.4 35.4 13.3 32.6 15.9 24.4 21.4moz 1.0 5.4 5.2 4.7 0.9 0.9 0.9tza 3.8 5.4 2.2 11.9 3.8 3.9 3.8xsd 20.3 22.1 4.1 25.5 19.9 19.6 19.9
Source: Authors' simulations.
Tables 7 and 8 provide the percentage variations in trade patterns following an EU-SADC FTA at the sectoral level for exports and imports, respectively. Exceptionally high growth rates are estimated in exports of processed food products for the "Rest of SACU" region, Malawi, Zambia, Zimbabwe and the "Rest of SADC" region, and in animal agriculture exports for Botswana, the "Rest of SACU" region and Zimbabwe. The largest export losses are recorded in light manufacturing and textiles and clothing, where exports fall by over 50 per cent in Malawi and Zimbabwe. Large export reductions also are estimated for crops in Zimbabwe (-40 per cent). With respect to imports, the largest increases are recorded for heavy and light manufactures in most SADC economies.
27
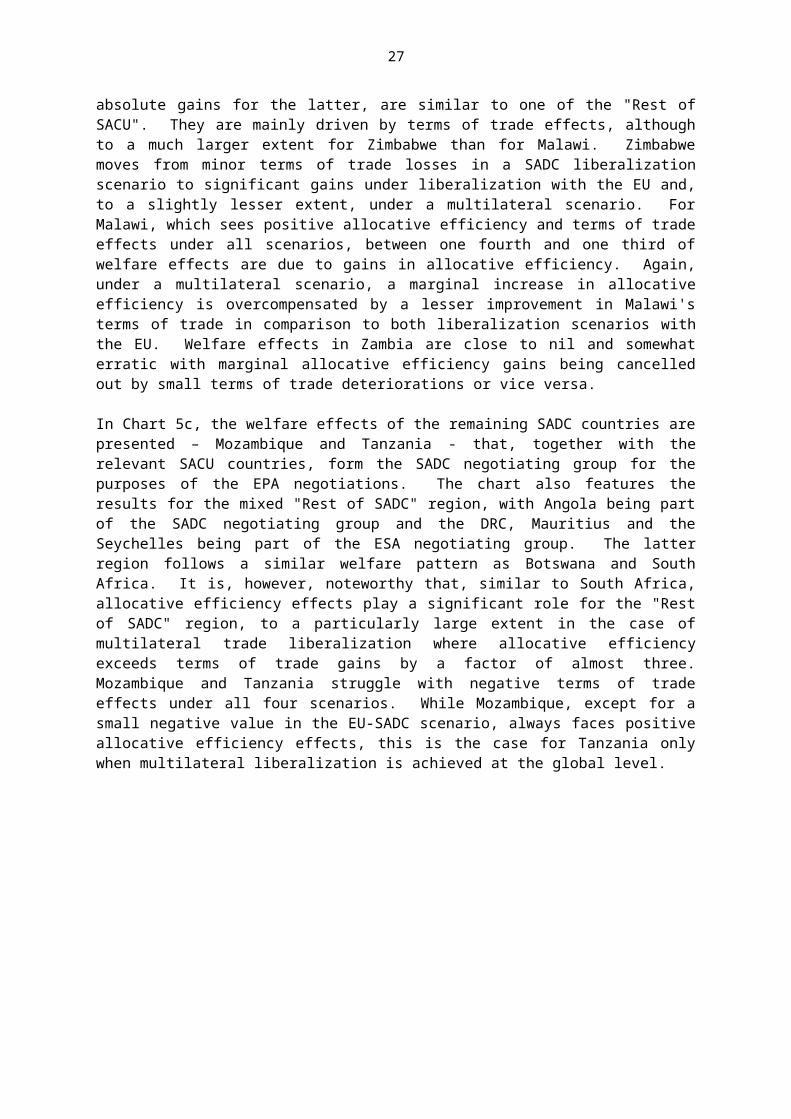
Table 7: Change in commodity exports by country and sector, EU-SADC FTA(2001 $ millions, fob prices)
AnAg Sugar Crops FoodP TexClo FueMin HMnfcs LMnfcs Srvcsbwa 587.84 0.00 -1.13 -2.11 -8.16 -0.04 -16.20 -391.95 -12.92zaf 90.65 0.01 434.27 217.03 -17.75 7.41 -535.33 144.01 -87.95xsc 615.14 -0.05 -21.57 1122.88 -174.31 -38.99 -219.69 -313.38 -108.36mwi -0.42 0.00 -92.00 229.11 -23.60 -1.22 -5.90 -6.11 -20.52zmb 0.03 0.00 -4.63 93.61 -7.32 0.09 -46.46 -6.98 -0.73zwe 539.15 0.00 -246.49 450.20 -127.82 -32.31 -187.38 -28.43 -107.07moz -0.03 0.00 0.98 -2.97 -0.49 -0.30 -8.44 -1.73 24.61tza 0.82 0.23 7.75 28.14 4.89 1.66 16.67 10.41 6.95xsd -5.52 0.00 -11.62 1982.30 -204.03 -105.63 -35.29 -327.81 -185.28
Table 8: Change in commodity imports by country and sector, EU-SADC FTA(2001 $ millions, cif prices)
AnAg Sugar Crops FoodP TexClo FueMin HMnfcs LMnfcs Srvcsbwa 15.42 0.00 10.71 -1.85 -8.80 -1.27 -32.04 9.16 -3.99zaf 3.03 0.00 25.38 116.91 188.95 -62.20 448.00 1508.53 97.75xsc 76.75 0.05 134.88 153.05 -8.44 -4.32 43.38 169.08 114.78mwi 1.42 0.00 2.80 16.71 9.63 -0.34 56.29 71.32 22.65zmb 0.74 0.00 2.92 1.24 8.83 -2.74 5.21 19.13 4.64zwe 6.00 0.01 19.21 33.15 40.77 1.78 103.24 154.56 156.51moz 0.40 0.00 -1.44 3.23 2.95 0.12 6.57 10.64 1.34tza 0.90 0.00 0.96 9.35 4.25 0.82 33.68 49.91 -7.85xsd 102.17 0.01 31.30 466.68 86.80 -0.68 473.79 601.90 196.82
Source: Authors' simulations.
As a note of caution, it should be highlighted that no large movements are predicted by our model for the sugar sector following EU-SADC liberalization. Neither imports nor exports increase to any significant extent for any of the SADC countries. However, percentage variations show a strong reduction of exports and increase in imports (in Botswana, "Rest of SACU", Malawi, Zimbabwe and "Rest of SADC"). The small initial size of the sector among SADC countries (see Chart on the production structure of SADC countries by sector) explain these results. Also, in our sectoral aggregation, the "Sugar" sector only covers sugar beet and cane. Within the GTAP database, large part of the sugar production is probably classified as (refined) sugar under food products.
Part of the large expansion of exports in certain sectors under an EU-SADC FTA is likely to be due to trade diversion away from other developing countries. Indeed, Table 9 shows that in the animal agriculture and processed food sectors SADC exports to the EU increase at the expense of exports from Mercosur and other developing countries. No significant trade diverting effects are found for the other sectors.
28
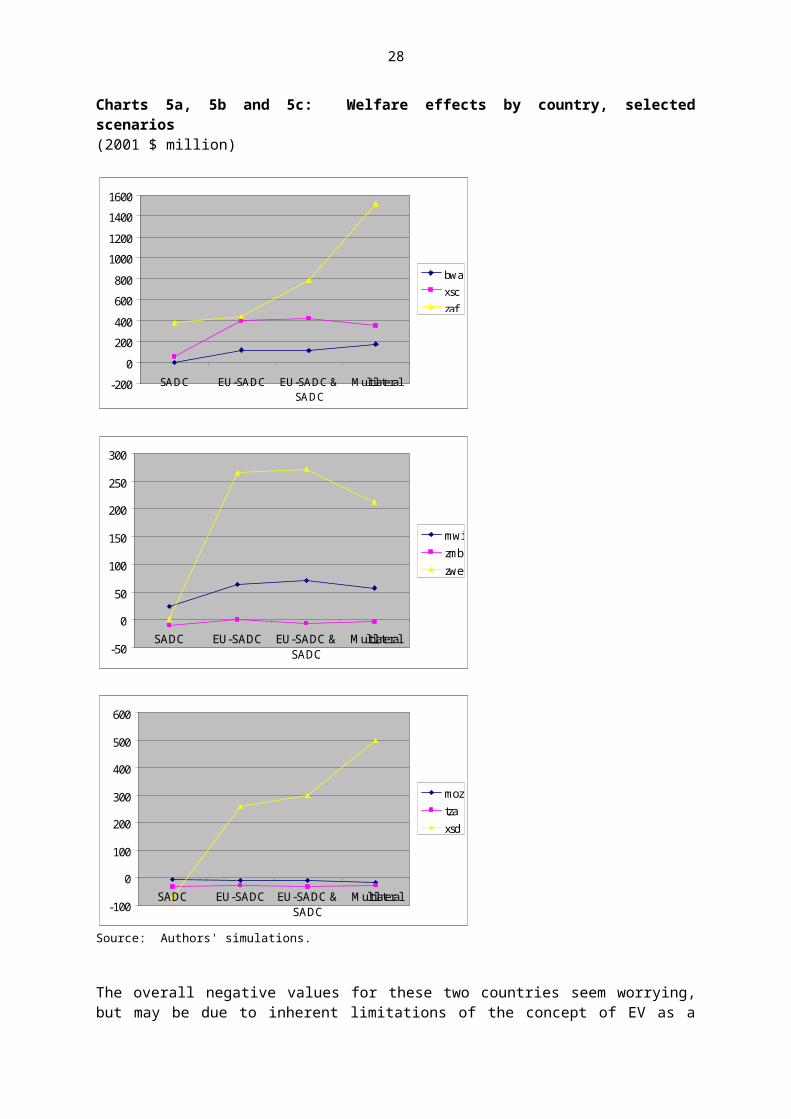
Table 9: Changes in exports to the EU by country, selected sectors and scenarios(2001 $ million)
Animal agriculture Food productsEU-SADC Multilateral EU-SADC Multilateral
eua -62.0 -480.9 -71.4 -284.1eu -974.0 -7972.7 -2313.9 -9930.2bwa 588.7 231.1 -0.2 -0.4zaf 21.8 -39.6 150.0 79.3xsc 658.7 455.6 1175.5 1122.4moz 0.0 -0.1 -3.4 -8.4mwi -0.3 -0.4 234.9 219.9zmb -0.1 -0.3 96.4 84.2zwe 556.0 437.4 473.0 451.2tza -0.1 -2.2 25.0 18.2xsd -3.1 -5.3 1854.2 1793.1mrc -101.9 12194.7 -170.1 657.6xdg -145.2 1339.2 -477.9 8447.8xdd -140.8 -390.8 -302.0 3500.0
Source: Authors' simulations.
The sectoral results on both resource reallocation and trade patterns seem to suggest that except when trade is liberalized at the multilateral level, agricultural sectors in most SADC economies expand at the expense of manufacturing. Conversely, multilateral liberalization, for some SADC countries, fosters diversification with higher levels of manufacturing output.
However, these results may be slightly biased for at least two reasons: First, many of the bilateral trade flows in the database, especially between SADC countries, are practically zero. Given the way the GTAP model is set up, an absence of current trade cannot result in any trade flows after liberalization has taken place. In reality, this may not hold true, as liberalization, especially in combination with trade-facilitating measures in terms of customs control or infrastructure, usually has positive effects across-the-board. This means that trade further develops which is already taking place in certain sectors, but may not be recorded, or that trade picks up in commodities that hitherto have not been traded. We have simulated this possibility by introducing a horizontal trade-facilitating import shock across SADC countries, making bilateral trade flows in all sectors, albeit still small, at least non-zero. We have then re-run the "EU-SADC & SADC" experiment. The results suggest that liberalization, while still leading to specialization, can also have further diversifying effects on the economy. For instance, in the countries with a strong traditional comparative advantage in one sector, such as animal agriculture in Botswana and Zimbabwe, exports in this sector still register by far the largest growth, but less so than in the original scenario. More importantly, exports are now recorded in sectors that originally stagnated or shrunk at the expense of the dominant sector, such as crops, food products and heavy manufactures in the case of Botswana, and crops and textiles and clothing in the case of Zimbabwe.
Second, as could be seen from the tariff profiles in Tables 4b and 4c, countries like Zimbabwe face high levels of protection in the EU in the animal agriculture and food products sectors owing to the conversion of tariff quotas into tariff equivalents in GTAP. The complete removal of trade barriers in these sensitive sectors, which is assumed in the simulations of an EU-SADC FTA, is unrealistic. If market access liberalization in these cases remains incomplete, as is to be expected, the expansion of traditional sectors, such as animal agriculture in Botswana and Zimbabwe, is bound to be less
29

pronounced. Fewer resources are consequently drawn away from other sectors, thus enabling a move towards higher levels of diversification. This was tested by re-running the "EU-SADC" experiment, excluding the animal agriculture sector in the EU-25 from any commitments. Indeed, for example in Botswana, instead of the massive expansion of beef exports at the expense of all other sectors, the animal agriculture expands very little alongside positive export growth in the sugar, crops, fuels and minerals, heavy and light manufacturing as well as services sectors.
D. EMPLOYMENT EFFECTS
The standard GTAP model assumes full employment of resources. Since this assumption may not be appropriate for many countries, including SADC, especially for unskilled labour, we re-run the scenario of an EU-SADC FTA under an alternative closure. In order to allow for unemployment in the unskilled labour force, the standard GTAP closure has been changed such that the wage rate for unskilled labour is fixed and the quantity supplied is allowed to adjust to changed market conditions post-liberalization. This alteration more accurately reflects labour market conditions especially in developing countries, where typically an excess supply of unskilled labour is prevalent, which can be employed by industry at the going wage rate in the event of an expansion of production. Hence, in all SADC regions as well as other developing countries (i.e. Madagascar, Mercosur and the "Rest of developing world" region) the wage rate was made exogenous and the supply of unskilled labour endogenized in order to take the effects of an EU-SADC FTA on unemployment into account.
Chart 11 shows that, under the (more realistic) assumption that developing countries feature a large pool of unemployed unskilled labour and, hence, wages remain unchanged, welfare effects of an EU-SADC FTA are higher than under a scenario, in which wages are allowed to adjust in order to equate demand to a given quantity of unskilled labour supply. Even without considering the direct welfare effects of increased employment, welfare improvements are more pronounced in almost all countries, as measured by allocative efficiency and terms of trade developments. With the exception of Tanzania, allocative efficiency increases by several multiples in all SADC regions of the model, in particular in the "Rest of SADC" region and Zimbabwe, where allocative efficiency turns into a main driver of welfare gains. It is also noteworthy that even Mozambique and Zambia register positive allocative efficiency gains under a EU-SADC FTA with latent unemployment. Except for South Africa, which further improves its terms of trade, SADC economies see slightly lower, but still largely positive terms of trade gains. When endowment effects are added, welfare gains are further amplified. The comparison of welfare outcomes also demonstrates that GTAP results are quite sensitive to closure rules. In view of the implications this may have for policy decisions, it is important to subject the underlying assumptions to a reality-check in each individual country.
30
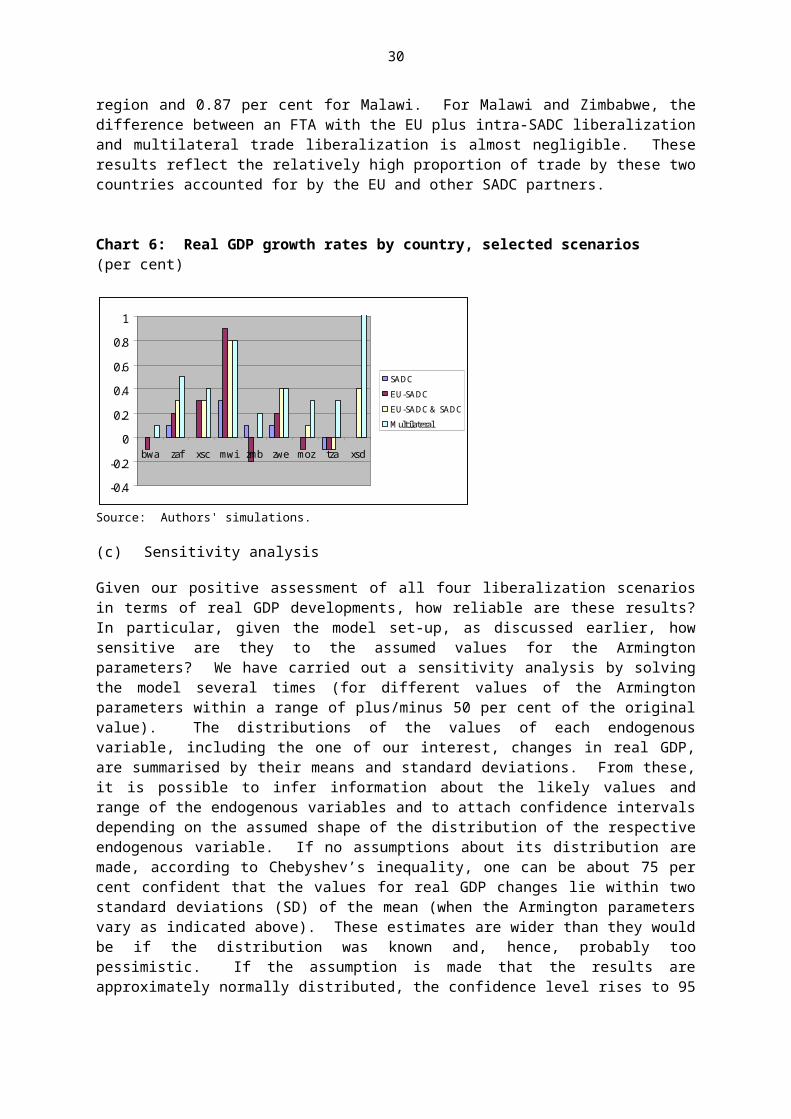
Chart 11: Welfare effects by country, EU-SADC FTA(2001 $ million)
-100
100
300
500
700
900
1100
bwa zaf xsc mwi zmb zwe moz tza xsd
EU-SADC (a+tot) EU-SADC, unempl. (a+tot)EU-SADC, unempl. (a+tot+endw)
Note: Allocative efficiency and terms of trade effects of the reference scenario are compared to the same scenario under an unemployment closure with and without addition of endowment welfare effects.Source: Authors' simulations.
In Chart 12, the relative importance of allocative efficiency, terms of trade and endowment effects (i.e. employment increases of unskilled labour) for each country are illustrated.16 The relative impact of terms of trade changes on overall welfare, i.e. of a component that is particularly sensitive to the underlying structure of GTAP (as discussed above), is significantly reduced, except for Botswana, where it still accounts for more than half of welfare effects. While the impact on employment is clearly dominant, allocative efficiency gains have also expanded in most countries. In Malawi, for instance, they are about as important as endowment effects under this closure. Again, this Chart highlights that for Mozambique and Zambia an EU-SADC FTA is all the more worthwhile the higher the degree of latent unemployment and the more sticky wages turn out to be in reality.
16 Absolute, i.e. non-negative values, were used. This is important to bear in mind mainly for Mozambique and Tanzania.
31

Chart 12: Relative contribution of allocative efficiency, terms of trade and endowment effects to overall welfare by country(per cent)
0%
20%
40%
60%
80%
100%
bwa zaf xsc mwi zmb zwe moz tza xsd
endwtotalloc eff
Source: Authors' simulations.
Chart 13 portrays the changes in the employment of unskilled labour under an EU-SADC FTA for both full and partial liberalization (i.e. 50 per cent reductions of agricultural import barriers and complete removal of tariffs and tariff equivalents on other merchandise). With the exception of Tanzania, employment creation for unskilled labour in SADC countries is quite significant, in particular in Zimbabwe, the "Rest of SACU" region and Malawi with about 29, 23 and 16 per cent increases respectively. However, if liberalization is only partial in agriculture, the potential employment boost that could be achieved with full liberalization between the EU and SADC is nearly halved in Zimbabwe and practically vanishes in Botswana. Conversely, it makes hardly any difference for employment growth in Malawi, the "Rest of SADC" region and Zambia.
Chart 13: Changes in employment of unskilled labour by country, selected scenarios(per cent)
-5
0
5
10
15
20
25
30
bwa zaf xsc mwi zmb zwe moz tza xsd
EU-SADC EU-SADC (50% Ag)
Source: Authors' simulations.
32
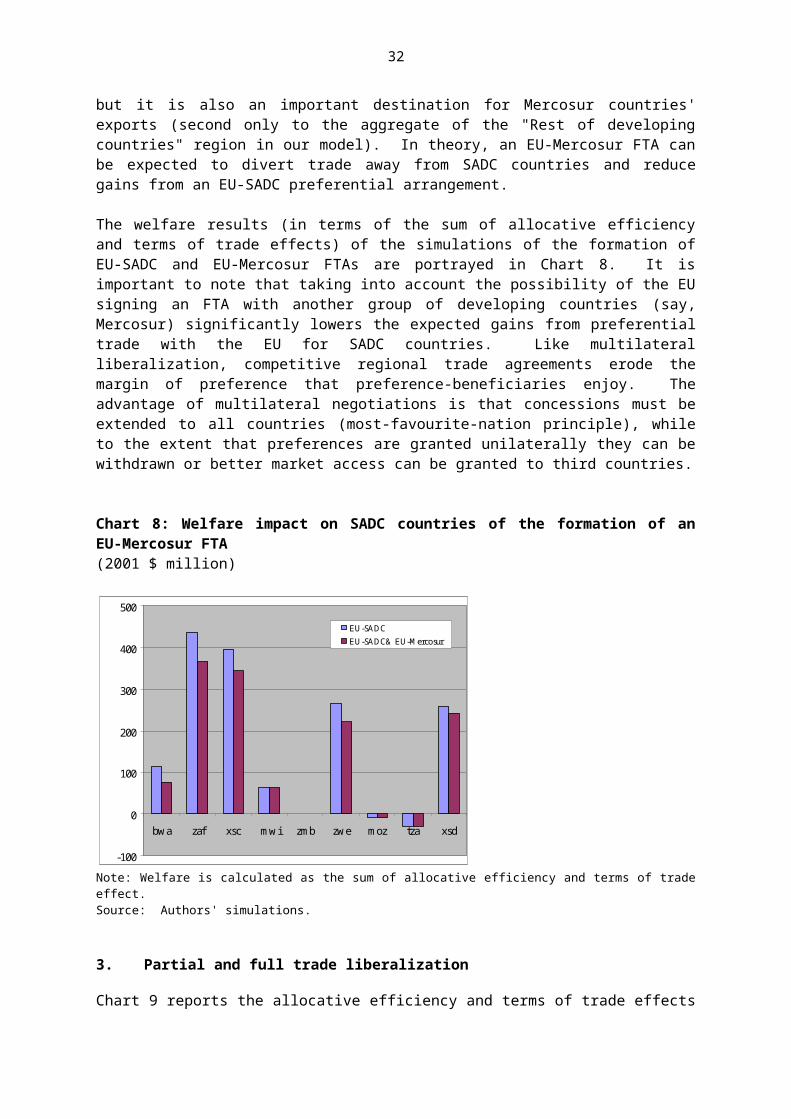
The diversity of employment effects has to do with the expansion of production in different sectors with different factor intensities. In Botswana, the animal agriculture sector provides practically all of the newly created employment opportunities and, in addition, bids away unskilled labour from all other sectors except services, in particular from the light and heavy manufacturing sectors, including diamond and metal mining. In Zimbabwe, animal agriculture absorbs an additional 120 per cent of the existing employment of unskilled labour in that sector, but other sectors also attract unskilled labour, most notably the processed food and heavy manufactures sectors, and to a smaller extent, the sugar sector. Employment expansion in the processed food and heavy manufactures sectors explains the still significant overall employment surge in Zimbabwe even when agricultural liberalization is incomplete. Unskilled labour in the crops sector is reduced by about 6.6 per cent of the original value. Although the resulting value of demand of unskilled labour in this sector is small compared to the potential employment increases in animal agriculture, it must still be born in mind that the crops sector, across all merchandise production, features the highest absorption of unskilled labour in the pre-liberalization situation of Zimbabwe. In the "Rest of SACU" region, the demand for unskilled labour strongly increases in the processed food sector, which, alongside textiles and clothing, light and heavy manufacturing, is one of the principal employers of unskilled labour in these economies in the pre-liberalization situation. In the latter three sectors, employment of unskilled labour decreases after liberalization, and besides food products, also shifts into a strongly expanding animal agriculture sector.
Developments in Malawi are quite different. Employment in the crops sector, the most important employer in merchandise production for unskilled workers before an EU-SADC FTA, contracts, releasing workers for the heavily expanding production of processed foods, including sugar. The situation is similar in the processed food sector in Zambia, but firms in the crops sector, the main employer of unskilled labour before liberalization, hire even more unskilled workers under an EU-SADC FTA. Zambia also registers higher employment figures in the light manufacturing sector with workers moving out of the heavy manufacturing (-1.6 per cent of existing employment) and textiles and clothing sectors (-4.3 per cent). On an economy-wide level, these negative employment effects may be manageable, as neither of the two sectors acts as a major employer of unskilled labour before liberalization. As usual, the picture in the "Rest of SADC" region is quite mixed. The strongest employment effects across this diverse set of countries are also in the processed food and crops sectors, both of which play a major role for employment before liberalization and experience an even stronger demand for unskilled labour after an EU-SADC FTA is in place. Contracting sectors in terms of employment of unskilled labour are textiles and clothing and heavy manufacturing.
Both Tanzania and Mozambique do not experience major changes in employment of unskilled labour. In particular, employment in the crops sector, which is the largest job arena for unskilled labour in Tanzania and the second largest in Mozambique (behind services), remains practically unaffected in Tanzania and expands slightly in Mozambique. Employment of unskilled labour contracts in all sectors in Tanzania, albeit only marginally, and is probably only significant in the light manufacturing sector. In Mozambique, employment of unskilled labour is reduced in the light manufacturing and textiles and clothing sectors. However, these sectors do not seem to give work to many people, and, hence, lay-offs do not result in large overall employment effects.
The picture that emerges from this scenario for the SADC region as a whole is not dissimilar to what was said for an EU-SADC FTA with flexible wages. The shift towards agricultural activities creates positive welfare effects that are even more pronounced through the additional employment that an EU-SADC FTA creates for many unskilled workers that had remained latently unemployed. These substantial increases in agricultural employment may foster rural development, where the majority of the poor live. Countries, such as Botswana and Zimbabwe, built on some of the areas of revealed comparative advantage, notably beef and beef products. Other countries, notably Malawi and Zambia, receive an employment boost in their transition towards processed food products. The effects in light manufacturing are mixed, which may not be surprising given that employment expansion for unskilled workers is likely to hit certain limits beyond which higher skills and education become indispensable.
33
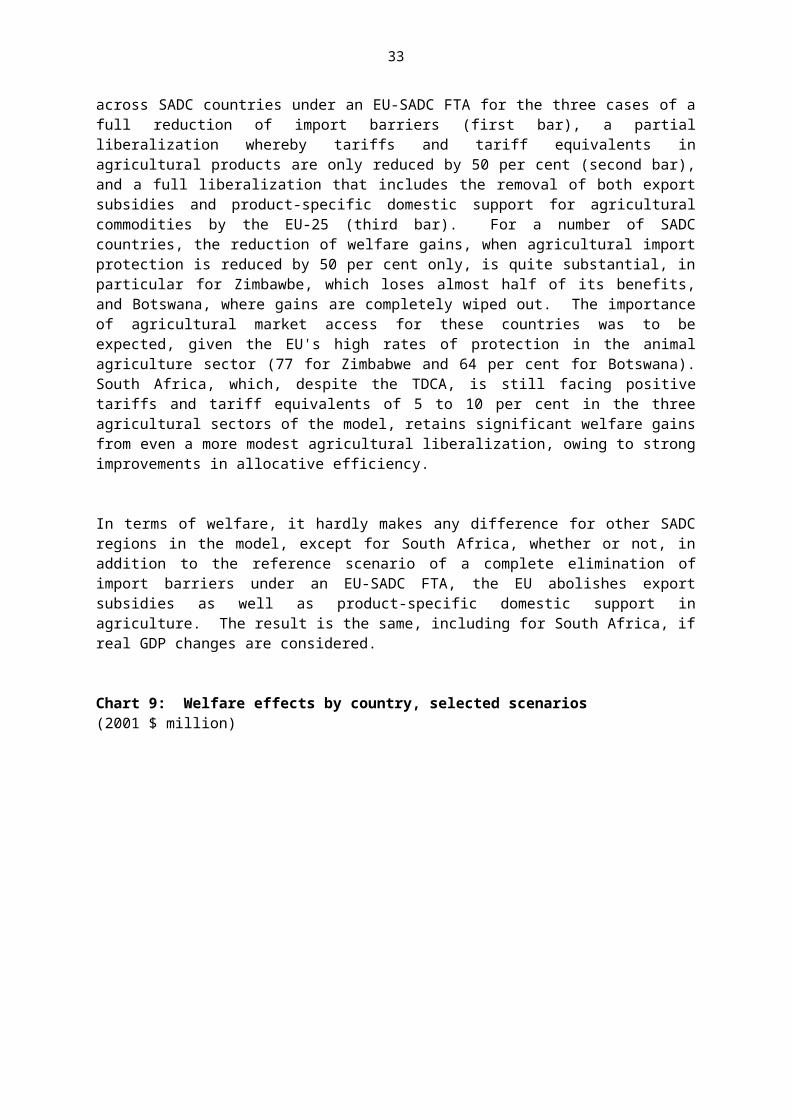
E. IMPACT ON TARIFF REVENUE
Chart 14 shows the increase in a uniform (i.e. across all sectors) tax on private consumption (implemented, for instance, within a VAT system) that would be necessary in order to replace tariff revenues lost when trade is fully liberalized between the EU and SADC.17 The Chart only shows five countries, as results for the "Rest of SADC" region cannot be meaningfully interpreted as consumption tax increases required at the national level. Also, the results for Botswana and the "Rest of SACU" region are widely exaggerated, while those for South Africa are underestimated, due to the effects of the tariff revenue formula, which, if unchanged, would lead to large transfers of receipts from all SACU members to South Africa. In view of the development considerations already present in the current arrangement for distributing the revenue pool, the formula is likely to be adjusted leading to significantly reduced tax replacement needs in Botswana and the "Rest of SACU" region. In the remaining five SADC countries, consumption tax increases to recover lost tariff revenues are on the order of 1.1 to 1.5 per cent. While this seems to be a reasonable scope for a possible VAT increase, this type of trade tax replacement may be comparatively easy (and less costly) to implement in countries, such as Zambia, where a functioning VAT system is already in place. This is not the case, for example, in Botswana.
Chart 14: Uniform increase in consumption tax to replace tariff revenue lost, selected countries,, EU-SADC FTA(per cent)
0
0.2
0.4
0.6
0.8
1
1.2
1.4
1.6
mwi zmb zwe moz tza
Source: Authors' simulations.
For the five countries above, we also have toyed with alternative tax arrangements. For the case of an EU-SADC FTA, we have re-run the experiment with differing income tax rates (up to 30 per cent) that "crowded out" the need to raise the consumption tax in order to preserve revenue. The overall result is that the design of the tax regime that is to replace tariff revenues matters in terms of total welfare.
The situation is quite different for the five countries we examined. Chart 15 shows that for Tanzania and Zambia the optimal mix of consumption and income tax increases lies somewhere around a 10 per cent tax increase on income earned from skilled and unskilled labour. The chart of Malawi shows that welfare improvements at increasing income tax rates are minor, with a turning point already at around 5 per cent. The opposite is the case for Mozambique, where the peak is reached only at around 25 per cent. Interestingly, for both Mozambique and Zambia the originally slightly negative
17 More precisely, the uniform consumption tax increase ensures that taxes remain a constant share of national income post-liberalization.
34

welfare effects become positive if the right income tax rate is chosen. Contrary to the other countries, Zimbabwe has nothing to gain in terms of welfare from mixed taxation of labour income and private consumption, and, hence, may stick to the moderate VAT increases if it wishes to replace tariff revenues.
Chart 15: Total welfare for various tax rates on labour income to replace tariff revenue lost, selected countries, EU-SADC FTA(2001 $ million and per cent)a
tza
-51
-50.5
-50
-49.5
-49
-48.50 5 10 15 20
zmb
-2.5
-2
-1.5
-1
-0.5
0
0.5
1
0 5 10 15 20
mwi
64.65
64.67
64.69
64.71
64.73
64.75
64.77
64.79
64.81
64.83
64.85
0 5 10
moz
-12
-10
-8
-6
-4
-2
0
2
4
0 5 10 15 20 25 30
zwe
235
240
245
250
255
260
0 5 10 15 20
a Welfare in 2001 $ million is given on the vertical axis for various increases (per cent) of the income tax.Source: Authors' simulations.
35

How can the possible welfare improvements through different combinations of taxes (entirely driven by allocative efficiency aspects) be explained? The inverse U-shaped curves derive from the fact that income tax increases distort the allocation of resources comparatively less than consumption taxes. Therefore, as income taxes increase, the consumption tax required to compensate for the tariff revenue loss falls, thus improving welfare. When consumption taxes are sufficiently low (or not existent, as in the case of Zimbabwe), further increases in income taxes simply lower welfare. One possibility to explain the different resource allocation effects of income and consumption taxes is the reflection in the GTAP model of the non-homotheticity of final demand. This means that income elasticities are not necessarily equal to unity and are different across products. If private spending decreases (due to higher levels of income taxes), with prices unchanged, quantity demanded of different commodities still varies. This means that budget shares for different commodities change in the household consumption bundle. In other words, households do not continue to consume the same mix of products when they get richer or poorer. For instance, in our model, private consumers in SADC countries tend to spend less on manufactures and more on crops and food products when they have less money to spend. Private consumers may thereby increase the consumption of goods with higher consumption taxes. An expansion of production in taxed sectors, in turn, reduces excess burden and, hence, improves welfare. This is the case, for instance, for food products in which face relative high consumption taxes in Mozambique, Malawi and Zambia. However, as explained earlier, the higher the income tax, the lower consumption tax increases are needed to safeguard government revenues. Further tax increases on labour income, at a certain point, not only reduce consumption taxes, but may even turn some of them into subsidies for certain products. Welfare subsequently deteriorates owing to the new distortions introduced in the economy.
V. CONCLUSIONS
This paper has developed a CGE model that focuses on the potential impact of EPAs with the EU on SADC countries. The model has also been employed to assess the effects on SADC economies of simultaneous progress in regional integration within SADC and of further trade liberalization activities by the EU, using the example of Mercosur. Multilateral trade liberalization at the global level has been simulated as an important benchmark. More than the absolute levels, the relative impact of different scenarios in terms of welfare, production structure, trade, employment and government revenues may provide useful guidance to policy-makers in SADC countries. In particular, the empirical simulations lead us to the following set of conclusions:
SACU revenue sharing arrangements may require further adjustments to ensure a net transfer of resources to lesser developed members post-liberalization.
For SADC countries overall, real GDP growth is stimulated most by multilateral trade liberalization. Due to the importance of the EU as a trading partner for many SADC economies, liberalization in the context of EPAs already goes a long way towards realizing such gains. For some, however, it is crucial to seek further integration within SADC at the same time in order to reap these benefits. The positive results of an EU-SADC FTA are robust to variations in key assumptions, notably the Armington parameters.
The possibility of the EU signing an FTA with another group of developing countries (Mercosur) significantly lowers the expected gains from preferential trade with the EU for SADC. This implies that, for most SADC countries, multilateral liberalization becomes relatively more appealing.
For a number of SADC countries, meaningful liberalization of agricultural import barriers explains large part of the expected gains from an EU-SADC FTA. Conversely, SADC economies are hardly affected by the abolishment of agricultural subsidies on the part of the EU.
All liberalization scenarios lead to significant structural change in SADC countries. For some of them, the required structural adjustment under the multilateral liberalization scenario is less than under an EU-SADC FTA. In particular, under the latter scenario agricultural sectors expand at the expense of manufacturing in most SADC economies, whereas multilateral
36

liberalization, for some of them, fosters manufacturing, leading to higher levels of diversification. Trade patterns follow this trend in production: Overall imports, especially of manufactures, and exports, notably of agricultural and processed food products, increase. Part of this increased trade can be explained by trade diversion away from other developing countries.
If the existence of a large pool of unemployed unskilled labour in SADC countries is assumed, the positive welfare effects of an EU-SADC FTA are even more pronounced. In many SADC countries more jobs are created in agricultural sectors that are already major employers of unskilled labour. Others receive an employment boost in their transition towards processed food products. Employment expansion in manufacturing seems to be limited by increasing skill requirements.
Tariff revenue losses can be replaced by moderate increases of, for instance, consumption taxes. However, the design of the tax regime appears to matter if tariff revenues are to be replaced: For certain SADC countries, a mix of higher income and consumption taxes proves to be superior in terms of welfare.
37

VI. REFERENCES
Armington, J. S. (1969) "A theory of demand for products distinguished by place of production", IMF Staff Papers 16: 159-177.
Chauvin, S. and G. Gaulier (2002) "Regional Trade Integration in Southern Africa", CEPII Working Paper No 2002-12.
Kirk, R. and M. Stern (2003) "The New Southern African Customs Union Agreement", African Region Working Paper Series No. 57.
Lewis J.D., S. Robinson and K. Thierfelder (2003) "Free Trade Agreements and the SADC Economies", Journal of African Economies, Vol. 12(2): 156-206.
Lewis J.D., S. Robinson and K. Thierfelder (1999) "After the Negotiations: Assessing the Impact of Regional Trade Agreements in Southern Africa", Trade and Macroeconomics Division Working Paper N. 46, Washington DC: International Food Policy Research institute.
Masters W., R. Davies, T.W. Hertel (1999) "Europe, South Africa and Southern Africa: Regional Integration in a Global Context", African Economic Policy Discussion Paper N. 30.
McDonald S. and T. Walmsley (2001) "Bilateral Free Trade Agreements and Customs Unions: The Impact of the EU - Republic of South Africa Free Trade Agreement on Botswana", Paper presented at the Annual Conference on Global Economic Analysis, Purdue University.
Tsikata Y.M. (1999) " Southern Africa: Trade Liberalization and Implication for a Free Trade Area", Washington DC: World Bank.
38
VII. ANNEX
Total welfare effects (experiments conducted under the standard closure)
EU-SADC alloc eff tot IS taxpool Totaleua 5.4 -0.2 -0.8 0 4.4eu 1117.6 -519.3 -2.1 0 596.3bwa -3.4 116.6 -8.5 -228.8 -124.1zaf 224.3 213.4 66.9 705.1 1209.6xsc 15.9 380.3 -14.7 -463.3 -81.8moz -5.1 -4.1 -0.2 0 -9.4mwi 15.6 48.5 0.7 0 64.8zmb -6.1 5.9 0.1 0 -0.1zwe 21 244.7 -8.4 0 257.2mdg 0.5 -5.8 -0.7 0 -6tza -13.1 -15.5 -21.5 0 -50.2xsd 1.2 257.9 3.5 0 262.6mrc -26 -72.7 -1.2 0 -99.9xdg -126.1 -459 103.8 0 -481.3xdd -44.9 -225 -116.2 0 -386.1Total 1176.7 -34.5 0.7 12.9 1155.9
EU-SADC & SADC alloc eff tot IS taxpool Totaleua 5 0.8 -1.2 0 4.6eu 1095.1 -641 10.6 0 464.7bwa -0.5 109.6 -11.5 -231.2 -133.6zaf 294 489.6 16.9 714.2 1514.7xsc 18.2 399.2 -17.3 -470.2 -70.1moz 4.1 -12.6 -1.1 0 -9.6mwi 14 57.2 1.2 0 72.5zmb -0.3 -5.8 2.3 0 -3.8zwe 37.5 234.1 -2.8 0 268.8mdg 0.5 -6.3 -0.7 0 -6.6tza -9.9 -23.9 -26.6 0 -60.4xsd 85.9 214.3 5 0 305.1mrc -27.2 -77.4 -0.4 0 -105xdg -155.8 -530 141.3 0 -544.5xdd -48.5 -246.2 -115.2 0 -409.9Total 1312.1 -38.4 0.6 12.7 1287
SADC alloc eff tot IS taxpool Totaleua -1 0 0 0 0eu -29 -96 16 0 -109bwa 2 -7 -4 -2 -11zaf 75 303 -60 15 333xsc 1 53 -7 -12 35moz 2 -10 -1 0 -9mwi 5 19 0 0 25zmb 3 -13 2 0 -8zwe 13 -11 3 0 4mdg 0 0 0 0 -1tza -8 -11 -8 0 -27xsd 0 -70 6 0 -64mrc -2 -7 1 0 -9xdg -43 -119 50 0 -113xdd -9 -34 3 0 -40Total 7 -3 0 0 5
Multilateral alloc eff tot IS taxpool Totaleua 144 33 26 0 203eu 3634 3204 167 0 7005bwa 3 172 -12 -442 -278zaf 602 915 8 1297 2823xsc 24 325 -11 -849 -511moz 9 -27 -2 0 -19mwi 15 42 1 0 58
39

zmb 6 -9 3 0 1zwe 39 174 -3 0 210mdg 3 -32 -8 0 -36tza 29 -58 -53 0 -82xsd 367 131 8 0 506mrc 1677 6496 140 0 8313xdg 30888 -9825 1424 0 22487xdd 1801 -1746 -1698 0 -1643Total 39243 -204 -9 6 39037
EU-SADC, 50% Ag alloc eff tot IS taxpool Totaleua 4.1 1.7 0.3 0 6.1eu 925.6 -89.9 -14.3 0 821.4bwa 0.4 -2.1 11.9 -232.8 -222.5zaf 198.5 127.9 80.6 709.7 1116.6xsc 4.4 252.4 -11 -469.3 -223.5moz -4.6 -4.3 -0.5 0 -9.4mwi 15.4 49.8 0.7 0 66zmb -6.2 8.9 0.2 0 2.9zwe -0.2 136 -5.7 0 130mdg 0.6 -5.7 -0.7 0 -5.8tza -12.6 -14.5 -21.4 0 -48.5xsd 5.9 263.5 3.3 0 272.7mrc -24.9 -62.9 -1.8 0 -89.6xdg -131.9 -448.4 70.3 0 -510xdd -39.5 -227.7 -111.8 0 -379Total 934.7 -15.2 0.2 7.7 927.4
EU-SADC, Subs alloc eff tot IS taxpool Totaleua -3 -59.3 -6.1 0 -68.4eu 2190.5 -410.6 13.4 0 1793.3bwa -3.4 113.9 -7.7 -228.5 -125.8zaf 231.1 236.3 66.3 703.9 1237.5xsc 15.7 377.7 -14.6 -462.6 -83.9moz -5.2 -4.2 -0.2 0 -9.7mwi 16.1 51.8 0.7 0 68.6zmb -6.6 6.1 0.1 0 -0.5zwe 21.1 247.4 -8.5 0 259.9mdg 0.5 -4.6 -0.5 0 -4.5tza -13 -12.8 -20.8 0 -46.6xsd -3.6 244.9 3.4 0 244.7mrc -17 78.7 -1.3 0 60.4xdg -1042.9 -1079.8 100.9 0 -2021.8xdd -424.6 179 -124.3 0 -369.9Total 955.5 -35.6 0.7 12.7 933.4
EU-SADC & EU-Mercosur alloc eff tot IS taxpool Totaleua 71.9 -50 -6.7 0 15.2eu 5002.8 -1605.4 -3.3 0 3394.1bwa -2.4 78.1 -1.9 -232.6 -158.8zaf 202.7 163.5 74.6 714.1 1154.9xsc 11.5 332 -13.3 -469.8 -139.6moz -5 -4.9 -0.4 0 -10.2mwi 15.4 48.6 0.7 0 64.7zmb -6.1 6.6 0.2 0 0.7zwe 14.3 207 -7.9 0 213.5mdg 0.4 -5.9 -0.9 0 -6.3tza -13.3 -15.5 -21.9 0 -50.6xsd -2.2 243.3 3.6 0 244.7mrc 451.7 3362.1 73 0 3886.8xdg -1286.9 -1936.5 280.5 0 -2942.9xdd -199.9 -900.3 -377.5 0 -1477.8Total 4255 -77.3 -1 11.7 4188.4
40