the economic impacts of cigarette tax reductions … economic impacts of cigarette tax reductions on...
TRANSCRIPT
1
The Economic Impacts of Cigarette Tax Reductions on Youth Smoking in Canada Diane P. Dupont and Anthony J. Ward
Economics, Brock University December 2002
Abstract
Cigarettes are the most commonly consumed recreational chemicals used by Canadians. The current smoking rates (using 1999 data) are 33.7 % for young adults (20-24 years of age) and 28.1 % for youth (aged 15 to 19). These numbers for younger persons are particularly alarming to health officials and policy makers since most smokers begin smoking in their youth with a “single puff”. As is well documented, cigarette consumption is linked with premature death and supplemental morbidity effects that put increased stresses upon the provision of health care in Canada. Health officials need to know what tools are particularly useful in discouraging youth from taking up smoking in the first place.
This paper estimates smoking demand models for Canadian youth and young
adults using the National Population Health Data (NPHS) data from over the period of 1994-1998. The data span a five year period starting after the introduction of very large tax cuts to stem a big increase in the smuggling of illegal cigarettes into Canada from the United States. Since the initial tax cuts, taxes have crept up gradually. In spite of these increases real cigarette prices in 1998 were still less than they were in 1994 for more than half of the Canadian population.
Using the NPHS data we calculate a participation elasticity of -0.914 for youth
aged 14 to 18. This suggests that a 1 % decrease in the price of cigarettes would increase the number of daily smokers in this age group by 0.9 %. Thus, the tax cuts almost certainly led to increases in both the number of daily youth smokers and also to increases in the numbers of young people who begin smoking at earlier ages. JEL Classification: D120, H210, I12, Keywords: cigarettes, price elasticity of demand, adolescents, taxes, Acknowledgements This project was funded by a Brock University General Research Grant supported by the Social Sciences and Humanities Research Council of Canada. We would like to thank Steven Renzetti for helpful comments and discussion about the issues and Klemen Zumer and Megan Ihrig for their very helpful research assistance. We would also like to thank Statistics Canada for the opportunity to access the NPHS microdata and the McMaster Research Data Centre for providing the facilities for working with the data. Finally, many thanks are due to the staff at the RDC, particularly Cindy Cook, James Chowhan, and Carl Bertoia, for quick turn around times on the disclosure output.

2
1. Introduction
Cigarettes are the most commonly consumed recreational chemicals used by
Canadians (CPA, 2000). The 1999 smoking rate for Canadians aged 15 and over is about
25 %1. In looking at the rates for younger smokers, the comparable rate for young adults
(20-24 years of age) is 33.7%, while the rate for youth (aged 15 to 19) is 28.1% (Gilmore,
2000). These point statistics mask an important difference in the trend rates for smoking
over the last decade. While the overall smoking rate in the population fell by 10 % points
from a high of 35.1 % in 1985 and the young adult rate fell from 42.7 % to its current
rate, the youth rate actually rose from its 1985 level of 26.2 %. Figure 1 illustrates the
trend rates over the period 1981-1999. Of particular note is the rapid increase in the
prevalence rate for youth aged 15-19 during the period 1990-1996, for this was a period
of great flux in the overall smoking environment. Changes that took place during this
period included the availability of cheap, illegally imported cigarettes and the consequent
move by the Federal government to discourage this activity through a large cut in
cigarette taxes that ultimately saw retail cigarette prices reduced from between 10% to 44
% in the ten provinces. (See Table 1.)
Public health officials find this situation worrisome since cigarette smoking has
been correlated with an increased incidence of a number of serious health conditions,
including heart disease, lung cancer, emphysema, and other chronic lung diseases. In
addition to these morbidity effects, smoking is implicated in 45,000 premature Canadian
deaths annually (Makomaski-Illing and Kaisermann, 1995), which is approximately 21 %
of all deaths in Canada (Health Canada, 1996). Of further concern is the fact that

3
detrimental health effects are felt not only by the individual who chooses to smoke, but
also by individuals who chose not to smoke. External effects from smoking include
asthma caused by breathing, second-hand smoke and low birth weights for children of
women who smoke during pregnancy. Kaisermann (1997) shows how the costs to
Canadian society from smoking have increased steadily over the period 1966-1991 to $15
billion in 1991 (1991 Canadian $). This is an underestimate, however, since he includes
only direct costs2 – these include both health care costs of $2.5 billion and $10.5 billion
in lost future income due to premature death, as well as costs of residential care, fires,
and absenteeism – only for individuals who have ever smoked.
A particular focus for health research and policy in the last decade has been to
discourage adolescents from starting to smoke. The argument to support such a policy
comes from evidence showing that most adult smokers develop their addictions during
their teenage years starting with an occasional ‘puff’. (Mao, Gibbons, and Wong, 1992)
provides data to show that 80 % of adult smokers start regular tobacco consumption
before their 18th birthday. Thus, in order to prevent established adult smoking and the
attendant health effects, it is necessary to reduce the number of adolescents who initiate
smoking. The key question is which tools are most effective at providing disincentive
effects for potential youth smokers.
In the United States, research has shown that package warnings, negative health
publicity and restrictions on the locations in which people may smoke are not really
effective at reducing the incidence of smoking (Chaloupka and Grossman, 1996). What
does appear to work, however, is an increase in the price of cigarettes via tax increases.
1 This is somewhat higher than the comparable rate in the US of 23.2 % (WHO, 1997).

4
This is an important observation since economic models suggest that young smokers are
more likely to be sensitive to the price of cigarettes than older, addicted smokers.
Empirical evidence from the United States provides support for this view with elasticity
estimates that are used to predict how responsive individuals may be to price or tax
changes.3 There are two aspects to the nature of responsiveness to tax changes. The first,
the elasticity of participation, shows the percentage decrease in numbers of smokers in a
population in response to a tax increase. The second, conditional elasticity of demand,
applies to actual smokers and shows how many fewer cigarettes are smoked in response
to a tax increase. The current consensus using micro data from a number of different
surveys conducted in the United States is that the overall price elasticity of youth
cigarette demand (this is the sum of the participation and conditional demand elasticities)
ranges between -0.9 and -1.5 (Ross and Chaloupka, 2002). Chaloupka and Warner (2000)
and Evans et al. (1999), looking at estimates from cross-sectional studies, suggest that the
elasticity of smoking participation among youth falls in the range of −0.5 to −0.7 and that
adults have a much less elastic demand for cigarettes – their elasticity estimates fall in the
range of 0 to –0.25. Taxation, therefore, appears to be an attractive tool that may
discourage young people from taking the puff that turns into an addiction.
This discussion and the statistics cited provide the background for the issue of
interest to this paper, which is the impact of adjustments made to the level of cigarette
excise taxes in Canada over the early part of the 1990s upon smoking decisions of
2 He does not include any estimates of the indirect costs imposed by cigarette smokers upon non-smokers. 3 The elasticity of demand is a unit-free measure that yields information about the responsiveness of quantity demanded to a change in the price of a good. It is defined as the percentage change in quantity demanded associated with a one percentage change in the price of a good. A value less than one is considered to be inelastic, thus a one percentage change in price results in a less than one percentage change in quantity demanded (consumed).

5
Canadian youth. This period saw excise taxes first increase and then fall dramatically in
1994 when officials realized that increased excise taxes led a large increase in cigarettes
smuggled into Canada from the United States. Data exist that suggest that the smoking
rate for youth, aged 15 to 19, actually rose significantly by 6.5 % from the period of 1991
to January 1, 1994, however, this is found by comparing aggregate rates of consumption
across different surveys. There are no Canadian estimates of elasticities that are based
upon the decisions of individual consumers. From a public policy perspective, it is
necessary to know what the participation and conditional demand elasticities are in order
to determine effective future excise tax increases might be at reducing youth participation
rates that will, in turn, lead to reduced adult smoking consumption.
While it is possible to apply elasticity estimates from the large number of studies
that have looked at smoking decisions of American youth to the Canadian situation, it is
preferable to obtain estimates from Canadian data, if possible. Canadian observations
reflect not only different regulatory and tax policies, but also different ethnic and cultural
influences, than American observations. Thus, the American estimates may not be
entirely applicable to the Canadian situation. For example, prices in Canada have tended
to be higher than in the United States, although Canada has seen more drastic changes in
excise taxes. Moreover, a number of states support large tobacco industries and this has
led to somewhat relaxed views in these states about cigarette consumption. Canada does
not have a similar situation. Finally, the socio-demographic characteristics of the two
countries differ in terms of ethnic backgrounds and racial characteristics and some of
these characteristics have been shown to be important factors in determining both the
decision to smoke and the intensity of smoking once that decision has been made.

6
This paper estimates smoking demand models for Canadian youth and young
adults using the National Population Health Data (NPHS) data from over the period of
1994-1998. The elasticity estimates are the first ones produced for youth using this
micro-level data set.
The remainder of the paper is structured as follows. Section 2 provides
institutional background about the consumption and taxation of cigarettes in Canada.
Section 3 discussed the previous, largely American, literature on youth smoking. In
Section 4 the dataset and variable construction are described. The empirical model and
results are discussed in Section 5. The paper concludes with a discussion of the
implications of the results in Section 6.
2. Institutional Background
In order to understand how government policy might have an impact upon smoking
prevalence, it is instructive to examine the composition of the final cigarette price faced
by consumers. Cigarette sales in Canada are subject to a number of different taxes,
including a federal excise tax, provincial excise taxes, and both federal and provincial
sales taxes. Beginning in the late 1980’s both federal and provincial excise taxes were
increased by an average of 84 % per pack of 20 cigarettes (from an average of $1.90 per
pack to $3.50 per pack). By doing so the Department of Finance hoped to reinforce the
government’s national strategy (the National Strategy to Reduce Tobacco Use or NSRT)
to reduce tobacco use in Canada. Ironically due to events south of the border, this had
the opposite effect to that intended.
Traditionally, cigarette prices have been lower in the United States than in Canada.
For example, over the 1980s and 1990s the average real price per pack of cigarettes in the

7
United States was $1.86 (1999 US $). The comparable average price in Canada was
$2.33 (1999 US $) (Gruber, Sen, and Stabile, 2002). However, the gap between Canadian
and U.S. prices widened in the early 1990’s from a combination of two actions. The first
was the increase in both federal and provincial excise taxes on cigarettes in Canada. The
second was a price reduction in the United States by the Philip Morris Company on its
teen-oriented brand of cigarettes (Marlboro)4, which encouraged other American cigarette
manufacturers to lower their prices. In spite of two increases in US Federal excise taxes
on cigarettes, the real price of cigarettes fell by 10 % after inflation-adjustment. This
encouraged an increase in smoking prevalence among youth and young adults over the
1990’s, which was in contrast to the reduction in smoking prevalence among adults.
The widening price gap for cigarettes in the two countries created an arbitrage
opportunity5 and encouraged the smuggling of cigarettes from the United States to
Canada, thereby giving Canadians access to relatively cheaper cigarettes. Ironically, the
smuggling was permitted through the channel of legal export of Canadian-produced
cigarettes to the United States and illegal re-import of these cigarettes to Canada. At its
peak, it is claimed that smuggled cigarettes amounted to one third of all domestic
cigarette consumption (Gruber, Sen, and Stabile, 2002).
In response to the problems of large numbers of cigarettes being smuggled into
Canada, the Federal government decided to reduce cigarette and tobacco taxes
dramatically, although, not to the same extent in all provinces since the smuggling was
concentrated largely in Eastern Canada (namely, in the provinces of Ontario, Quebec,
New Brunswick, Prince Edward Island, and Nova Scotia) where the prevalence of native
4 Gruber and Zinman (2000) provide evidence that 60 % of youth smokers use this brand.
8
reservations (not subject to the same regulations as non-native land) close to the border
meant that it was relatively easy to re-import legally exported cigarettes. These provinces
followed suit and lowered their excise taxes. These tax cuts took place over a very short
period of time beginning in January 1994 and ending by mid-April 1994. Combined tax
cuts by the latter time amounted to between $14 and $21 ($C1994) per carton (Hamilton
et al., 1997a).
3. Previous Literature
While a number of studies have examined the price sensitivity of cigarette demand
using aggregate or state level consumption data (Becker, Grossman and Murphy, 1994),
the literature most directly relevant to this paper is that which uses micro-based data
sets.6 Lewit, Coate and Grossman (1981) use Cycle III of the Health Examination Survey
(HES-111) conducted from March 1966 through March 1970, which provides data on
individual smoking behavior of 5,308 individuals, aged 12 to 17, to estimate smoking
participation and condition cigarette demand equations. They estimate two-part cigarette
demand models that look first at the probability of smoking participation and then at the
quantity of cigarettes smoked as separate decisions. The overall price elasticity they
obtain is -1.44 which is found by summing the participation elasticity of -1.20 to the
conditional demand elasticity of -0.25. In a later 1982 study Lewit and Coate use the
1976 Health Interview Survey (HIS) to examine the behavior of individuals 20-74 years
of age. For the older age groups they find a much lower price elasticity of demand (-0.42
5 When the same product can be purchased in one market for a low price and sold in a different market at a higher price, the individual undertaking these two transactions can make a profit. 6 Aggregate studies using state level observations are likely to provide elasticity estimates that are upwardly biased (in an absolute value sense) since the unit of observation is the state and quantity of cigarettes consumed is usually taken to be tax-paid cigarette sales per capita (Lewit and Coate, 1982).

9
overall). As before, however, their findings suggest that the participation elasticity is
much larger than the conditional demand elasticity. Thus, an increase in the price of
cigarettes is expected to have a much larger impact upon the decision to smoke as
compared with its impact upon the quantity of cigarettes smoked.
Since Lewit and Coate use cross-sectional data, they rely upon price differences
across the states for price variation. However, these states (particularly those that grow
tobacco) employ different types of smoking regulations. Wasserman et al. (1991) argue
that the finding of significant price elasticities may be the result of neglecting to account
for differences in state level antismoking regulations that would have an effect upon
indivdiual’s behavior. They use National Health and Nutrition Examination Survey II
(NHANESII) for individuals aged 12-17. When they include variables such as
antismoking regulations, they find that the price variable does not have a significant
effect upon the number of cigarettes smoked by youth. A positive correlation between
cigarette prices and state tobacco control policies is seen as the culprit in biasing upwards
the coefficients found in the earlier studies. However, other studies that include such an
index of antismoking regulations find it to be insignificant.
These early studies neglect the role of nicotine addiction in cigarette consumption.
Chaloupka (1991) explicitly takes up this issue by developing a model of rational
economic behavior and then uses data on 17 to 24 year olds from the National Health and
Nutrition Examination Survey II (NHANESII) to estimate smoking demand functions
that include previous and future cigarette prices. He finds strong evidence that cigarette
smoking is addictive and that men are more responsive to price changes than women.
However, such sales do not reflect actual consumption in a number of states, particularly where smuggling or bootlegging is wide-spread.

10
Interestingly, he also finds that the group of young adults being studied, who are aged 17
to 24, are less responsive to price changes than older groups of individuals, which
contradicts the earlier findings of Lewis and Coate (1981). Finally, the long-run price
elasticity of demand is estimated to be about double that of the short run price elasticity.
Chaloupka and Grossman (1996) use three years of data (1992-94) on students in
grades 8, 10, and 12 from the Monitoring the Future Project to focus upon how youth
smoking is affected by a number of different anti-smoking policies, including the use of
excise taxes to raise cigarette prices, restrictions on smoking in public places, and limits
on the accessibility of cigarettes to youth. The dataset includes information on a
nationally representative sample of individuals and is used to estimate both a smoking
participation demand model and a conditional smoking demand model. The authors find
that cigarette prices have negative and significant coefficients in both equations. When
they control for the percentage of excise tax revenues devoted to anti-smoking activities,
however, they find that the value of the price coefficient falls by a large amount.7 The
authors calculate a set of average elasticities from their various model specifications. The
participation (or prevalence) elasticity is found to be -0.675, while the conditional
demand elasticity is -0.638, leading to an overall (or unconditional) elasticity of -1.313.
These results suggest that youth do have a larger degree of price sensitivity than adults
since the consensus on the adults’ price elasticity is that it falls within the range of -0.3 to
-0.5 (National Cancer Institute, 1993). However, anti-smoking regulations appear to
have little impact upon choices, possibly because they are not strictly enforced. Outright
7 They argue that this result is to be expected since the percentage of excise taxes devoted to anti-smoking activities and cigarette prices are highly correlated. The reason for this correlation is that states with the largest excise tax increases (leading to higher cigarette prices) are those which have increased the tax-supported anti-smoking activities the most, especially, California, Massachusetts, and Michigan.

11
bans on smoking in public places that are stringently enforced appear to have more effect
than restrictions on youth access to cigarette purchases.
Evans and Huang (1998) take up the challenge of trying to control for state-specific
attitudes towards smoking that might influence the results. They use repeated cross-
sections of the Monitoring the Future data and include state fixed effects to control for
fixed state tastes towards smoking. They find a significant participation price elasticity
of -0.5 for teenagers over the 1985- 1992 period.
Using the Monitoring the Future data described above, Chaloupka and Pacula (1998)
look at the implications of limits on youth access for smoking rates. Their total price
elasticity demand estimate is -1.141, with the participation elasticity being -0.618 and the
conditional price elasticity being -0.523. They also find differences in the price elasticity
by gender, with young males being more responsive to price than young females, and
race, with young blacks being more sensitive to price than young whites.
More recently, researchers have begun to look at heterogeneity of responses to
cigarette price changes among adolescents. Gruber (2000) and Gruber and Zinman
(2000) compare teen smoking elasticities from a number of different surveys conducted
over the 1990’s. These surveys include: the public use data set from the Monitoring the
Future (MTF) surveys over the 1976-1997 period, (only high school seniors and little
locational information), the restricted use MTF data on 8th, 10th, and 12th graders, from
1991 through 1997, Youth Risk Behavior Survey (YRBS) with data from 1991, 1993,
1995, and 1997 on a large sample of 9-12th graders, and the Vital Statistics Natality
Detail Files. The data yield information on the smoking behavior of mothers during
pregnancy. The authors find that high school seniors in the MTF data set have a
12
participation elasticity of -0.67 and a conditional elasticity of -0.06. However, they find
no significant price impacts for younger students (8th and 10th graders) in the MTF data
set. Over the full sample of MTF data, the price elasticity for participation is only -0.31,
with a conditional intensity elasticity of -0.03. In contrast, the elasticities obtained from
the YRBS data are very large: the elasticity of participation is -1.5, as is the elasticity of
conditional intensity. Using the Natality data, however, the elasticities are -0.38 for
participation and -0.15 for conditional intensity.
Thus, they find that older teens are more price sensitive. It may be that that younger
teens experiment with cigarettes by borrowing from friends and not through their own
purchases. In this case, they are likely to be less sensitive to prices. However, as they get
older, these teens are purchasing the cigarettes themselves and we would expect them to
be more sensitive to price changes. A further reason for differences in the elasticities
arises from the population sampled. In this case, it is important to note that, for the
YRBS and MTF data sets, observations are only available for students and not high
school dropouts. These latter may have a different price sensitivity, particularly if they
are earning their own money and using that to purchase cigarettes.
Confirmation of some of the concerns expressed by Gruber and Zinman (2000) about
the role of experimentation among younger teens is provided by Emery, White and Pierce
(2001). These authors use the 1993 data from TAPS (the longitudinal teenage attitudes
and practices survey) conducted in the United States to identify three categories of
smokers: never smoked, experimenters, and established smokers. Their hypothesis is that
experimenters may have different price elasticities from established smokers. They find
that cigarette prices are not significant explanatory variables for experimenters.

13
However, the overall price elasticity of demand that they calculate for so-called
established smokers (individuals who have smoked in the last 30 days and have smoked
more than 100 cigarettes in their lifetime) who are 14 to 22 years of age was -2.24 (-1.56
for participation and -0.68 conditional demand). Current smokers of 14 to 22 years of
age are defined as having smoked in the last 30 days but not having smoked 100
cigarettes in their lifetime. For this group, the elasticity of demand was smaller: -1.70
overall comprised of -0.83 for participation and -0.87 for conditional demand.
Most recently, Ross and Chaloupka (in press) use data from a survey conducted in
1996 amongst high school students in the United States. Using a number of different
measures of cigarette price (including individually perceived prices and high school
average perceived prices along with state average prices), they find the elasticity values
associated with the perceived prices are higher than those associated with the state prices.
Their total price elasticity values range from -0.670 using state average prices to -1.514
using individually perceived prices.
Some general conclusions can be made about the sensitivity of youth to cigarette
prices and anti-smoking policies that take the form of excise tax increases. First, results
from cross-sectional micro data on individual respondents generally confirm that youth
smokers are sensitive to prices with a current consensus for the overall price elasticity of
youth cigarette demand is in the range from -0.9 to -1.5 (U.S. Department of Health and
Human Services, 2000). Second, not all youth are the same and there are likely to be
differences amongst daily smokers and casual smokers, as well as differences by gender
and racial/ethnic group. Third, it appears that the participation elasticity is generally
larger than the intensity elasticity, thereby providing partial confirmation about the

14
addictive nature of cigarettes. Thus, if public policy aimed at increasing taxes in order to
reduce smoking rates is to be effective, it should be aimed at discouraging participation in
the first place.
In contrast to the many studies from the United States, there have far fewer
Canadian efforts to look at price elasticity of cigarette demand. Those studies that have
used Canadian data have tended to use national time series data on aggregate
consumption, although work by Hamilton et al. (1997b) and Sen and Wirjanto (2002) are
exceptions. The estimates of the overall elasticity of cigarette demand using a number of
different periods within 1950-1981 of national time series data are around -0.73
(Thompson and McLeod, 1976; Collinshaw and Rogers, 1984). Using more recent data
for the period of 1968 to 1990 Reinhardt and Giles (2001) obtain an overall estimate of -
0.62. Galbraith and Kaiserman (1997) also use national time series data on legal cigarette
sales over 1980 to 1994 and add estimates of smuggled exports to it in order to obtain the
total number of cigarettes sold. They find a short run elasticity of legal consumption of -
1.01, but a much lower elasticity of -0.40 for total consumption. Hamilton et al (1997b)
obtain elasticities in the range of -0.3 but do not focus especially upon youth. Sen and
Wirjanto (2002) use a longitudinal data set for the period 1990-1996 (the third Waterloo
Smoking Prevention Project (WSPP-3)) of smoking habits of children from grades 8 to
12, attending schools in the Waterloo region of Ontario. They find participation
elasticities that range between -0.155 and -0.393 with the former pertaining to individuals
who do not have smoking peers and the latter pertaining to youth with smoking peers.
They also calculate daily smoking elasticities for the same two groups -0.105 and -0.491.
In order to compare their Ontario-based results, the authors also use a single year (1994)

15
of nationally representative data from the Youth Smoking Survey (YSS). However, they
find the coefficient on price in the smoking participation equation is positive and
insignificant. The coefficient on price in the conditional demand equation is positive and
significantly different from zero. The YSS data confirm that smoking behaviour of
family and friends is significantly and positively linked to the respondent’s own smoking
choices.
4. Data
Our study uses data from the National Population Health Survey (NPHS). This is a
national longitudinal data set intended to provide information about the health of
Canadians. The target population is persons aged 12 and older in all provinces, territories
and residents of institutions. Data to date have been collected in three waves. Cycle 1
data were collected over the period from June 1994 to March 1995 (in four quarters,
June, August, November, and March). Data collection included a personal interview
conducted at the individual’s home using computer-assisted technology. A random group
of individuals were chosen from Cycle 1 respondents to participate in subsequent cycles.
Cycle 2 data were collected two years later, mostly by telephone interview, and again
collected in quarters (June, August, November of 1996 and February 1997). The attrition
rate between these two cycles was quite small; only 1.7 % of longitudinal respondents
could not be found for Cycle 2. Cycle 3 data were collected over the period June 1998 to
March 1999.
In our analysis we look at individuals who range in age from 14 o 24 during the Cycle
1 (1994) collection period. We divide respondents into two groups based upon their

16
ages: individuals in the first group included are between the ages of 14 and 18, while
those in the second group are between the ages of 19 and 24. We choose these age ranges
for two reasons. First, we want to have a group of teenage smokers so that we can
compare our results to those from the U.S. studies. Since the data are not collected in a
high school setting, unlike many of the U.S. surveys, this group includes both individuals
still in high school (grades 9 through 12 or 13, in the case of Ontario) and individuals
who dropped out of school. Second, since much of the literature suggests that the price
elasticity of demand decreases with age, we want to have a group of younger adolescents
and a group of young adults in order to examine differential impacts of the cigarette tax
price increases upon the two groups. This second group includes university and college
students, as well as individuals who dropped out of high school. Table 1 gives mean
information about the respondents in the sample.
Since the 1994 survey was conducted over the period following shortly after the tax
cuts in five of the provinces we anticipate that responses to the price decreases for the
younger respondents might not be complete or fully reflect the full response to the tax
cuts, in particular, for regular (daily) smokers. In order to have a second look at the
impacts of the tax decrease a couple of years removed, therefore, we create a second
sample of individuals, aged 14 to 18 years. This group is drawn from the third cycle of
the survey conducted in 1998 and consists of individuals who were under 14 years of age
during Cycle 1. Our second group in 1998 includes those individuals who were in the 14
to 18 group from 1994, along with those who were already 19 in 1994. Thus, it contains
individuals aged 19 to 28. Since the survey was designed to be nationally representative,

17
the unfortunate consequence is that the numbers of observations on youth are relatively
small. Our sample sizes reflect this.
As with other studies we have two measures to describe smoking behaviour. The first,
a measure of smoking participation, is a dichotomous choice indicator. The variable
SMOKER takes on a value of 1 if the respondent said he/she smoked daily and 0
otherwise. The NPHS survey question was: At the present time, do you smoke cigarettes
daily, occasionally or not at all? We choose to focus upon daily smokers in this paper.8
Table 2 provides information on the different types of smokers in the data set. It is
notable that the percentages of daily smokers in the various categories have increased,
substantially in a number of cases, particularly for males in the 14 to 18 year old group.
We have a second variable for smoking behaviour. This is conditioned upon the
respondent being a smoker since NUMCIG describes the intensity of smoking for
individuals who are classified as smokers. The measure we use is the number of
cigarettes usually smoked each day. As in other studies, we take the natural log of this
variable. Table 3 gives information on the mean numbers of cigarettes smoked each day
by daily smokers in the data set. As might be expected, the Table suggests that younger
smokers tend to smoke fewer cigarettes per day than do older smokers. One potential
finding that is of concern is that, while a smaller percentage of males in the younger age
group are heavy smokers in 1998 as compared to 1994, the trend is opposite for females
of this age group. This might suggest that they are more heavily influenced by the price
reductions.
8 This latter group includes occasional smokers as well as non-smokers and we are looking into a closer examination of this group up at a later date.

18
The NPHS data contain much socio-demographic information about each of the
respondents, including the province of residence, the census metropolitan area, and
whether the respondent lives in a rural or urban location. We use this information to
pinpoint the respondent’s location, which we subsequently use to obtain a match with
cigarette price data. Unfortunately, the survey does not ask any cigarette price
information. In order to construct an appropriate price series we begin with data
collected by Statistics Canada, which we have obtained from the Non-Smokers' Rights
Association. These price data cover the period of 1994-2000 and consist of average retail
prices (including PST and GST) collected from grocery stores, gas stations, pharmacies
for each month within 18 major cities across the country. The retail prices are the
monthly nominal price per package and nominal price per carton containing 200
cigarettes. For individuals living in a city we use the price data specific to that census
metropolitan area. For those individuals not living in a large city, we use province-
specific prices. Finally, we take note of the information on when each person’s survey
was completed to determine which monthly price to use. We adjust the prices by city-
specific CPI to create real prices with a base year of 1992. We use the same CPI to adjust
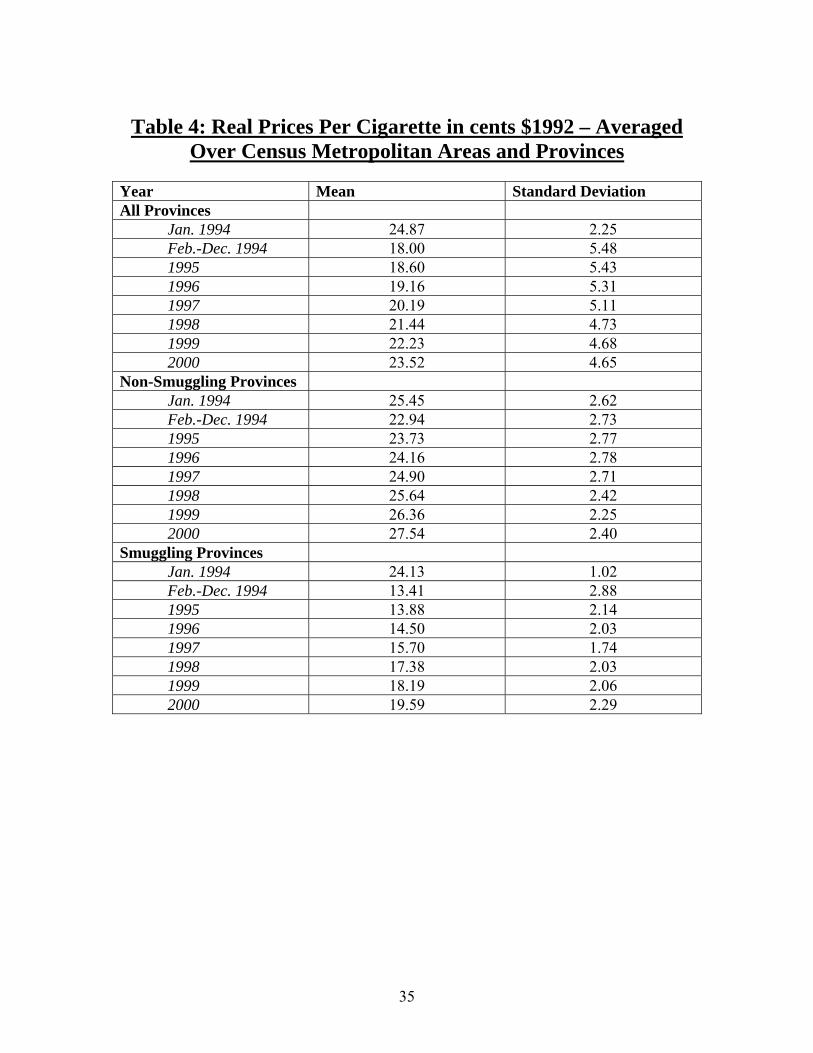
nominal household incomes in the survey. Table 4 gives annual mean real prices per
cigarette averaged over all Canadian provinces, then averaged separately for the five
provinces that experienced the biggest tax cuts (the smuggling provinces) and the five
other provinces that saw only minor tax cuts (the non-smuggling provinces). The January
1994 prices are included separately from those of the rest of the year in order to illustrate
the impact upon real cigarette prices of the tax cuts. As the Table illustrates, by 2000 real

19
prices in the so-called smuggling provinces have not yet climbed back to their pre-tax cut
levels.
In addition to price and household income data that are of interest to models
describing economic demand, we include variables that have proven to be of interest in
other smoking behaviour studies. MALE is a dichotomous choice variable that takes on a
value of 1 for males and 0 otherwise. NATIVE is a dichotomous choice variable that
takes on a value of 1 for natives and 0 otherwise.9 Two variables are included to explore
the importance of staying in school or higher education upon smoking behaviour. INSCH
and HSGRAD are dichotomous choice variables. The former takes on a value of 1 if the
respondent is still in school and 0 otherwise; while the HSGRAD takes on a value of 1 if
the respondent has graduated from high school and 0 otherwise. Personal circumstances
are accounted for by four variables. PREG is a dichotomous choice variable indicating
whether the respondent is pregnant or not, while HHSMOKE takes on a value of 1 if the
respondent indicated that someone else in the household smokes (unfortunately, the
identity of this person – parent or sibling – was not specified) and 0 otherwise.
SINGPAR is a variable taking on the value of 1 if the respondent indicates that she/he
lives with a single parent. YEARSMOKE indicates the number of years that the
respondent has been smoking.
For 1994 we have 830 observations on individuals aged 14 to 18, with 130 of
those observations belonging to daily smokers. The corresponding numbers of
observations for that age group in the 1998 data set is 650 (132). For the older age group,
the numbers of total observations/daily smokers in 1994 are 1140 (364) and for 1998 the
20
numbers are 1778 (539). It is interesting to compare the proportions of smokers in these
two periods. For 1994 the percentages of daily smokers in the younger age group/older
age group are 15.7 %/31.9%, while for 1998 the corresponding percentages are 20.0
%/30.3 %. The large increase in the proportion of daily smokers amongst the younger
group appears to support the view that these individuals have responded to the tax/price
cuts by increasing their daily smoker participation rates. Since we do not have many
observations we are unable to include dummy variables for each province and, therefore,
completely control for the so-called state effects that have been important in the U.S.
studies (Gruber and Zinman, 2000). However, we have undertake to control for an
important provincial effect by including a dummy variable to indicate whether a
respondent lives in one of the five provinces that struggled with smuggling problems and
tried to solve these with very large tax cuts. DUMSMUG takes on a value of 1 if the
province is Ontario, Quebec, Nova Scotia, New Brunswick or Prince Edward Island and
0 otherwise.
5. Empirical Methodology and Results
Following the smoking demand literature we adapt Cragg’s (1971) approach to
modeling two separate but related decisions. The first part of the model estimates the
propensity to smoke, while the second part estimates the conditional demand function.
The propensity to smoke function is modeled as a probit function where the dependent
variable is the binary variable indicating whether the individual is a daily smoker
9 We explore the role of race with our data set, since this has been of interest in the American studies (Chaloupka and Pacula, 1998) by including a dummy variable for individuals indicating that they were black. This is insignificant largely because so few individuals in the sample indicate that they are black.

21
(SMOKER). The conditional demand function uses only the observations on those
individuals who are daily smokers. The dependent variable is the natural log of the
number of cigarettes smoked daily (LN(NUMCIG)) and it is estimated using a linear
regression model.
Equation (1) represents the propensity to smoke function where Φ is the standard
normal cumulative density function. The index i represents individuals and the variables
are those described earlier.
iii
iiiiii
iiiii
YEARSMOKEPREGINSCHHSGRADHHSMOKEAGEHHINCSINGPAR
NATIVEMALESMUGPROVPRICESMOKERPROB
ξαααααααα
αααααφ
+++++++++
++++=>
)
()0(
1211
1098765
43210
(1)
The conditional demand function is shown in equation (2).
iii
iiiiii
iiiii
YEARSMOKEPREGINSCHHSGRADHHSMOKEAGEHHINCSINGPAR
NATIVEMALESMUGPROVPRICENUMCIGLN
εββββββββ
βββββ
+++++++++
++++=
1211
1098765
43210)(
(2)
The pair of equations (1)-(2) is estimated using maximum likelihood to obtain
coefficient estimates and standard errors. In total, four sets of estimation are done using
the 1994 and 1998 data separately for each of the two age groups: 14 to 18 and 19+.
Coefficient estimates and their standard errors are presented in Table 5 (for the 14 to 18
year olds) and in Table 6 (for the 19 + age group).
The price coefficients are always negative when the 1994 data are used, but for
both the smoking participation model and the conditional demand model these
coefficients are positive in the 1998 data for the older age group. The smoking
participation coefficient for the younger age group is also positive but not significantly

22
different from zero in 1998. However, it is only the smoking participation coefficient for
youth aged 14 to 18 in 1994 that is significantly different from zero (-0.0021). It is not
uncommon to find insignificant and even positive coefficients when using cross-sectional
data (Emery, White and Pierce, 2001; Gruber and Zinman, 2000)10, which makes the
finding of the negative coefficient on participation for 14 to 18 year olds even more
important. This finding may arise from the fact that survey respondents completed their
questions within six to eight months of the tax cuts. One interpretation is that young
people were particularly affected by such price reductions, which encouraged them to
become daily smokers.
Table 7 gives the estimated participation and conditional demand elasticities, as
well as the overall elasticity of cigarette demand for the two age groups and for each of
the years 1994 and 1998. The participation elasticity for youth aged 14 to 18 is -0.914 in
1994, however, this falls to 0.434 with the 1998 sample of respondents. The conditional
demand elasticity moves in the opposite direction as we move through time, going from -
0.0005 in 1994 for this group to -0.555 for 1998. For the older age group the
participation elasticity is -0.260 in 1994 and, since the conditional elasticity is virtually
zero, this is effectively the overall elasticity of cigarette demand. However, for 1998
both elasticities are positive, although not significantly different from zero. Since the
individuals in this group include people who were 14 to 18 in 1994 and daily smokers the
compositional effect discussed in footnote 9 may be at play in generating these positive
elasticities.
10 Gruber and Zinman (2000) note that such a finding may arise since the pool of daily smokers may have changed in the sample. Individuals who choose not to remain daily smokers are likely to have the lowest intensity of smoking. This might lead to a positive bias to the estimates.

23
These results are comparable to those obtained from the United States. First, we
find that the elasticity of demand for our younger age group (14 to 18 years of age) is
higher than that for the older age group. Second, the conditional elasticity is generally
smaller than the participation elasticity (the exception is the 14 to 18 year old group in
1998). Third, our magnitudes are within the consensus ranges for both age groups but at
the lower end which is to be expected since the smokers in our group are daily smokers.
Returning to Tables 5 and 6 provides some insight into non-price factors that may
be important to smoking decisions. We begin our discussion with the younger age group.
For this group a number of factors are significant determinants of the smoking
participation decision. In 1994, but not 1998, being female meant a much higher
likelihood of being a daily smoker for the 14 to 18 year old age group, although this
finding is not obtained for 1998. It could be that the tax cuts really impacted upon young
girls of this age who tend to have less pocket money than young boys since the job
options are more limited for them. During the early part of this period health authorities
did notice a large upswing in smoking prevalence rates among teenage girls.
Living with a single parent is also highly significant in determining participation
in 1994, as is the presence of another smoker in the household. In fact, this variable is
highly significant in each of the four participation models. One might speculate about the
various reasons why this might be the case. First, the presence of another smoker in the
house likely means easier access to cigarettes, particularly, for young people who are not
legally able to purchase them. This lowers the overall opportunity cost to these
individuals of obtaining cigarettes. Second, the presence of smoke in the house may
increase the physiological dependence upon nicotine. Third, observation of a family

24
member smoking may generate what psychologists call normative behaviour – that is,
smoking is the default behaviour. Sen and Wirjanto (2002) discuss the literature on peer
effects and use a longitudinal data set (the third Waterloo Smoking Prevention Project
(WSPP-3)) of smoking habits of children from grades 8 to 12, attending schools in the
Waterloo region of Ontario between 1990 to 1996 to show that smoking participation is
greater for individuals whose peers also smoke.
As with other work in the field, we find that older individuals in the 14 to 18 year
old age group are more likely to smoke than younger ones but only for 1994. In 1998,
the age variable is negative and significantly different from zero. Thus, older individuals
in the 14 to 18 year old age group were less likely to be daily smokers. However, for
1998, the number of years smoked is positive and significantly different from zero in the
participation model, thereby lending support to the view of cigarette smoking as
addicting. Together, these factors suggest that those individuals who were in the lower
range of the 10-13 year old span over the period between 1994 and 1998 (and thus are in
the 1998 data as 14 to 18 year olds) may have been induced by the tax cuts immediately
in 1994 to become experimenters (Emery, White and Pierce, 2001) and became addicted.
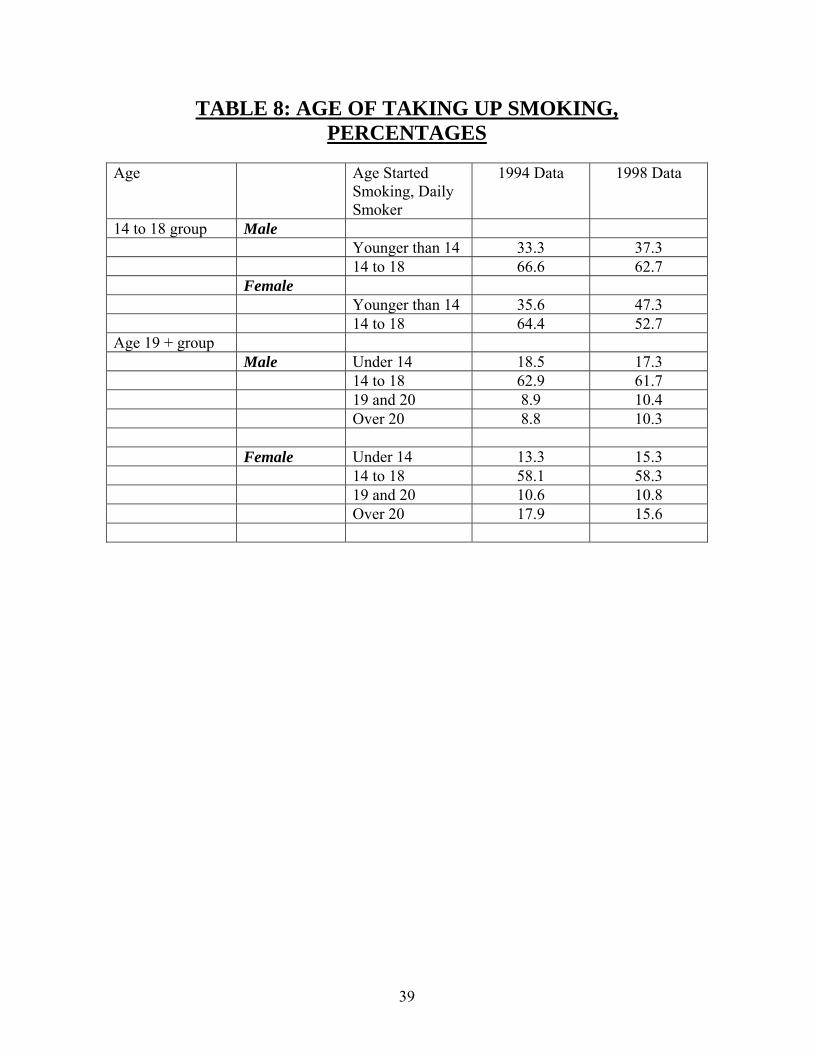
Table 8 provides some evidence that this may have happened in Canada. The Table
shows the percentages of respondents who started smoking at different ages. The 1998
group of younger individuals (14 to 18 years of age) are more likely to have started
smoking prior to age 14 than the 1994 group of individuals of the same age. The ages at
which older individuals (19 +) started smoking are not significantly different over the two
data sets (1994 and 1998).

25
Factors that tend to reduce the likelihood of an individual being a smoker include
education and income. Thus, respondents who have not dropped out of the education
system, ie., they are either high school graduates or still in school, are significantly less
likely to be daily smokers. In addition, smoking participation among those aged 14 to 18
is more likely to arise in low income households (the coefficient on household in come is
negative). This finding is not uncommon (Emery, White and Pierce, 2001). Indeed,
research on adult smoking suggests that it tends to be concentrated amongst lower
income individuals and that price elasticities for adults fall with income (Evans et al.
1999). Finally, being pregnant tends to reduce the likelihood of a female smoker being a
daily smoker, especially with the 14 to 18 year olds in the 1998 data set, where the
coefficient is very large (-1.4452) and significantly difference from zero at the 5 % level.
Gruber and Kosgrezi (2001) find that pregnant women have higher price elasticities of
cigarette demand.
Turning next to the conditional demand model we see that teenage boys (age 14 to
18) have significantly higher smoking intensities than teenage girls in 1994, although this
does not show up in the 1998 data. This is consistent with other work. The only other
significant determinants are the number of years smoked (for 1994), age (for 1998) and
being native (significant and negative in 1998).
Table 4 reports coefficient estimates for the older group of individuals examined
in this paper. For 1994 this corresponds to individuals aged 19 to 24, however, for 1998
we do not remove any individuals from this sample, so the age range extends to 28. In
both years age is negatively related to smoking participation, suggesting that individuals
who have passed through their adolescence without becoming daily smokers are less

26
likely to take up the habit as adults. (Data in Table 8 confirm this.) This reinforces the
concern that potential smokers need to be prevented from ever beginning as youth.
Having other smokers in the household contributes significantly to the likelihood of one’s
being a daily smoker, whereas being pregnant is a significant deterrent to being a daily
smoker. In terms of the role played by the variables in determining the smoking intensity
of daily smokers, we see that men are significantly heavier smokers than women of this
age group, as are lower income individuals and pregnant women are less likely to smoke
heavily than non-pregnant women. However, once the habit has become engrained in
terms of the number of years smoked the greater the daily consumption. The role of
education appears to be less significant a smoking deterrent for the older group of
individuals. While the coefficient is negative in three of the four models, it is significant
only for smoking intensity in 1998.
6. Conclusions and Directions for Future Research
This paper presents the first estimates of youth and young adult elasticities of
cigarette demand using the Canadian National Population Health Survey data set for 1994
and 1998. We find that youth aged 14 to 18 are more responsive to cigarette price
changes than are their slightly older counterparts (young adults aged 19 to 28). This is
unfortunate given the large tax cuts in 1994 that drastically reduced the prices of
cigarettes for more than half the Canadian population. Using our 1994 estimate of a
participation elasticity of -0.914 for youth aged 14 to 18, our results suggest that a 1 %
decrease in the price of cigarettes would increase the number of daily smokers in this age
group by 0.9 %. In fact, the average tax cut between January 1994 and the rest of the

27
year meant that cigarette prices fell on average in Canada by 27 %, thereby suggesting a
25 % increase in the number of youth daily smokers. The data from the NPHS as shown
in Tables 2 and 8 support this finding. Table 2 shows the large increase in daily youth
smokers, particularly males, over the period 1994 to 1998. Table 8 shows the increase
over the same period in the number of youth smokers who begin smoking prior to age 14.
Both of these trends are worrisome since cigarettes tend to be addicting and youth
smokers go on to become adult smokers who tend to place additional burdens upon the
Canadian health care system.
While the results in this paper are suggestive of price sensitivity amongst young
smokers, our plans to continue this work involve a number of additions to the modeling.
Two particular modifications are foreseen. First, we want to explore two further
determinants of smoking decisions. They are: the role played by provincial and
municipal access restrictions and smoking location bans and the efforts undertaken by
cigarette manufacturers to aim their advertisements at youth interests. The second
modification involves modeling the addictive nature of cigarette consumption through
use of the longitudinal data provided by the NPHS.

28
References
Becker, G.S., Grossman, M. and Murphy, K.M. 1994. "An Empirical Analysis of Cigarette Addiction" American Economic Review Vol. 84, pp. 396-418. Chaloupka, F., 1991. Rational addictive behavior and cigarette smoking. J. Political Econ. 99, 722–742. Chaloupka, F., Grossman, M., 1996. Price, tobacco control policies and youth smoking. Working Paper 5740. National Bureau of Economic Research, Cambridge, MA. Chaloupka, F. and Pacula, R. 1998. An Examination of Gender and Race Differences in Youth Smoking Responsiveness to Price and Tobacco Control Policies. NBER Working Paper No. w6541. April. Chaloupka, F.J.,Warner, K., 2000. The economics of smoking. In: Culyer, Newhouse (Eds.), Handbook of Health Economics. Elsevier, Amsterdam, pp. 1539–1629. Collishaw, N.E., Rogers, B. 1984. "Tobacco in Canada" Canadian Pharmaceutical Journal 117(4): 147-150. Cragg, J.G., 1971. Some statistical models for limited dependent variables with applications to demand for durable goods. Econometrica 39 5. Drug Therapy and Hazardous Substances Committee, Canadian Paediatric Society (2000) “Effects of changes in the price of cigarettes on the rate of adolescent smoking” Paediatrics and and Child Health 1998 3(2):97-98. Emery, S., et al., 1999. How adolescents get their cigarettes: implications for policies on access and price. J. Nat. Cancer Inst. 91 (2), 184–186. Emery, S., White, M. and Pierce, J. 2001. Does cigarette price influence adolescent experimentation? Journal of Health Economics 20 (2001) 261–270. Evans, W. and Huang, L. 1998. “Cigarette Taxes and Teen Smoking: new Evidence from Panels of Repeated Cross-Sections”, working paper, University of Maryland Department of Economics. Evans, W.; Ringel, J. and Stech, D. 1999. “Tobacco Taxes and Public Policy to Discourage Smoking” in James Poterba, ed., Tax Policy and the Economy. Cambridge, MA: MIT Press, p. 1-56. Galbraith, J. and Kaiserman, M. (1997) “Taxation, smuggling, and demand for cigarettes in Canada: evidence from time-series data” Journal of Health Economics 16:287-301.

29
Gilmore, J. 2000. Report on Smoking Prevalence in Canada 1985 to 1999. Statistics Canada Health Statistics Division. Catalogue No. 82F0077XIE. Glied, S. 2002. Youth tobacco control: reconciling theory and empirical evidence. Journal of Health Economics 21 (2002) 117–135 Gruber, J., 2000. Youth smoking in the US: prices and policies. NBER Working Paper, Vol. W7506, Cambridge, MA. Gruber, J., Zinman, J., 2000. Youth smoking in the US: evidence and implications. NBER Working Paper, Vol. W7780, Cambridge, MA. Hamilton, V.H., Levinton, C., St.-Pierre, Y., and Grimard, F. 1997a. “The effect of tobacco tax cuts on cigarette smoking in Canada” Canadian Medical Association Journal 156(2):187-191. Hamilton, V.H., Levinton, C., St.-Pierre, Y., and Grimard, F. 1997b. “An economic analysis of poor smokers”. NHRDP Working Paper, Project No. 6605-4870-801. March. Health Canada, Deaths in Canada due to Smoking, (Ottawa: Health Canada News Release, November 1996). Kaiserman, M.J. 1997. The Cost of Smoking in Canada, 1991. Chronic Diseases in Canada. 18(1). Lewit, E.M., Coate, D. 1982. The potential for using excise taxes to reduce smoking. J. Health Econ. 1, 121–145. Lewit, E.M., Coate, D. and Grossman, M. 1981. The effects of government regulations on teenage smoking. J. Law Econ. 24, 545–569. Mao, Y., Gibbons, L. and Wong, T. 1992 “The impact of decreased prevalence of smoking in Canada”. Canadian Journal of Public Health 83:413-416. Makomaski-Illing E.M., Kaiserman M.J. 1995. Mortality attributable to tobacco use in Canada and its regions, 1991. Can J Public Health 86:257–65. National Cancer Institute. 1993. The impact of cigarette excise taxes on smoking among children and adults: summary report of a National Cancer Institute Expert Panel. Division of Cancer Prevention and Control, Cancer Control Science Program. Bethesda, MD. Reinhardt, R. and Giles, D. (2001) “Are cigarette bans really good economic policy?” Applied Economics33(11):1365-1368.

30
Ross, H. and Chaloupka, F. (in press) “The effect of cigarette prices on youth smoking” Health Economics 10.1002. Sen, A. and Wirjanto, T. 2002. “Social Interactions, Taxes, and Youth Smoking” University of Waterloo, Department of Economics Working Paper. Manuscript. Stephens T, Kaiserman MJ, McCall DJ, Sutherland-Brown C. School-based smoking cessation: economic costs versus benefits. Chronic Diseases in Canada 2000; 21: 62-67. Thompson, M.E. and McLeod, I. (1976), "The Effects of Economic Variables Upon the Demand for Cigarettes in Canada" Mathematical Scientist Vol. 1, pp. 121-132. U.S. Department of Health and Human Services. 2000. Reducing Tobacco Use: A Report of the Surgeon General. Atlanta, Georgia: U.S. Department of Health and Human Services, Centers for Disease Control and Prevention, National Center for Chronic Disease Prevention and Health Promotion, Office on Smoking and Health. World Health Organization (1997) Tobacco or Health: a Global Status Report. Geneva.

31
Figure 1: Smoking Prevalence in Canada – 1981 to 1999
Sources: Sources: 1981-1986 Labour Force Survey supplements; 1989 National Alcohol and Other Drugs Survey; 1990 Health Promotion Survey; 1991 General Social Survey; 1994 Survey on Smoking in Canada, Cycle 1; 1996-97 National Population Health Survey; 1999 Canadian Tobacco Use Monitoring Survey, Full Year

32
Table 1: Information on Variables in Data Set (Mean Values)
1994 1998 Variable 14-18 year olds 19+ 14-18 year olds 19+
Price per Cigarette
17.04a 17.11 20.77 20.65
Smuggling Province Dummy
61% 58% 60% 59%
Male
48 % 47% 52% 47%
Native
-b - - -
Lives with Single Parent
19% 9% 20% 9%
Household Income
Age
15.95 21.56 16.49 23.72
Someone in Household Smokes
46% 45% 43% 37%
High School Graduate
16% 80% 22% 81%
Still in School
66% 34% 85% 25%
Pregnant
-b 6.2%
Daily Smokers
16 % 32% 20% 30%
Number of Years Smoked (Daily
Smokers)
2.56 6.24 2.86 7.94
Number of Cigarettes Smoked Daily (by
Daily Smokers)
9.8 10.5 12.5 13.2
a Real price (1992 index) per cigarette b Value is less than 5 % and cannot be reported due to confidentiality concerns.

33
TABLE 2: Percentages of People that Smoke in NPHS Data Set
Percentage of People that Smoke Daily
Age 1994 Data 1998 Data
Male 12.6 16.2 14 to 18 group Female 18.5 19.3
Male 18.4 27.7 19 + group Female 21.5 23.1
Percentage of People that Smoke Occasionally
Age 1994 Data 1998 Data
Male 5.8 6.2 14 to 18 group Female 8.8 7.0
Male 7.1 3.6 19 + group Female 11.3 3.6

34
TABLE 3 Number of Cigarettes Smoked Daily by Daily Smokers, by Percentages
Number of Cigarettes Smoked Daily by Daily Smokers,
Percentage Age 1994 Data 1998 Data 14 to 18 Group Male 1 to 10 38.0 50.0 11 to 15 34.0 32.3 16 to 20 12.0 8.8 Over 20 16.0 8.8 Female 1 to 10 65.0 54.1 11 to 15 26.3 21.7 Over 15 8.7 24.5 19 + Group Male 1 to 10 14.6 17.1 11 to 15 19.5 22.8 16 to 20 22.2 19.4 21 to 25 28.9 27.8 Over 25 14.9 11.1 Female 1 to 10 26.6 33.3 11 to 15 24.7 26.7 16 to 20 20.5 17.4 21 to 25 22.8 18.5 Over 25 5.3 3.4
35
Table 4: Real Prices Per Cigarette in cents $1992 – Averaged
Over Census Metropolitan Areas and Provinces Year Mean Standard Deviation All Provinces
Jan. 1994 24.87 2.25 Feb.-Dec. 1994 18.00 5.48 1995 18.60 5.43 1996 19.16 5.31 1997 20.19 5.11 1998 21.44 4.73 1999 22.23 4.68 2000 23.52 4.65
Non-Smuggling Provinces Jan. 1994 25.45 2.62 Feb.-Dec. 1994 22.94 2.73 1995 23.73 2.77 1996 24.16 2.78 1997 24.90 2.71 1998 25.64 2.42 1999 26.36 2.25 2000 27.54 2.40
Smuggling Provinces Jan. 1994 24.13 1.02 Feb.-Dec. 1994 13.41 2.88 1995 13.88 2.14 1996 14.50 2.03 1997 15.70 1.74 1998 17.38 2.03 1999 18.19 2.06 2000 19.59 2.29

36
Table 5: Parameter Estimates: Individuals aged 14 to 18
1994 1998 Smoking
Status Smoking
Participation Model (N=830)
Conditional Demand Model
(N=130)
Smoking Participation
Model (N=650)
Conditional Demand Model
(N=132)
Independent Variable
Intercept
-4.1539 (0.9789)*
1.5556 (0.8457) ** 0.06331 (1.5800) 0.9291 (1.1446)
Price
-0.0021 (0.0011)** -0.0003 (0.0011) 0.0010 (0.0018) -0.0019 (0.0013)
Smuggling Province Dummy
-0.3917 (0.2681) -0.6052 (0.8095) 0.4248 (0.3496) 0.3148 (0.2496)
Male
-0.2185 (0.1166)** 0.3377 (0.0986) * 0.0191 (0.1478) 0.0548 (0.1018)
Native
0.1963 (0.2471) 0.0052 (0.1872) 0.1416 (0.3432) -0.5082 (0.2105) *
Lives with Single Parent
0.3442 (0.1369) * -0.0578 (0.1077) 0.2574 (0.1691) -0.0765 (0.1164)
Household Income
-0.0500 (0.0209) * -0.0100 (0.0177) -0.0071 (0.0201) 0.0081 (0.0146)
Age
0.2639 (0.0521) * 0.0400 (0.0513) -0.1349 (0.0795) ** 0.1340 (0.0561) *
Someone in Household Smokes
0.7861 (0.1206) * 0.0279 (0.1168) 0.4531 (0.1511) * 0.1861 (0.1182)
High School Graduate
-0.2856 (0.1756) ** 0.0203 (0.1414) 0.2911 (0.2136) -0.1708 (0.1293)
Still in School
-0.3077 (0.1346) * -0.1251 (0.1073) -0.2685 (0.2161) -0.1692 (0.1220)
Pregnant
-0.4488 (0.8771) -0.5721 (0.5680) -1.4452 (0.7321) * -0.5933 (0.5903)
Number of Years Smoked
-0.0002 (0.0015) 0.0729 (0.0299) * 0.6072 (0.0518) * 0.0316 (0.0263)
* Significant at 95 % ** Significant at 90 %

37
Table 6: Parameter Estimates: Individuals aged 19 and over
1994 1998 Smoking
Status Smoking
Participation Model
(N=1140)
Conditional Demand Model
(N=364)
Smoking Participation
Model (N=1778)
Conditional Demand Model
(N=539)
Independent Variable
Intercept
2.4301 (1.1065) * 2.6246 (0.4402) * 2.1003 (0.7920) * 1.7291 (0.3487) *
Price
-0.0010 (0.0014) -0.00003 (0.0005) 0.0004 (0.0011) 0.0007 (0.0005)
Smuggling Province Dummy
-0.1221 (0.2954) 0.0961 (0.1191) 0.1095 (0.2101) 0.1350 (0.0927)
Male
-0.0758 (0.1406) 0.1979 (0.0554) * 0.0782 (0.0985) 0.1580 (0.0440) *
Native
0.4629 (0.3024) -0.1081 (0.0993) -0.0612 (0.2405) -0.0864 (0.0861)
Lived with Single Parent
-0.3233 (0.2453) -0.0307 (0.1071) -0.0220 (0.1575) -0.0535 (0.0758)
Household Income
-0.0093 (0.0240) -0.0272 (0.0106) * -0.0310 (0.0161) ** -0.0023 (0.0076)
Age
-0.2153 (0.0435) * -0.0223 (0.0177) -0.1892 (0.0220) * 0.0034 (0.0106)
Someone in Household Smokes
1.6137 (0.1500) * 0.2880 (0.0940) * 1.3034 (0.0974) * 0.3178 (0.0549) *
High School Graduate
0.0953 (0.1642) -0.0255 (0.0584) -0.0982 (0.1182) -0.2146 (0.0479) *
Still in School
-0.1998 (0.1465) -0.1046 (0.0672) -0.1701 (0.1182) -0.0146 (0.0586)
Pregnant
-0.7015 (0.3626) ** -0.3101 (0.1628) ** -0.6841 (0.3525) ** -0.0799 (0.1402)
Number of Years Smoked
0.4173 (0.0263) * 0.0426 (0.0112) * 0.3003 (0.0150) * 0.0230 (0.0078) *
* Significant at 95 % ** Significant at 90 %

38
Table 7: Elasticity Estimates
1994 14-18 years
1998 14-18 years
1994 19 + years
1998 19+ years
Participation Elasticity
-0.914 0.434 -0.260 0.117
Conditional Elasticity
-0.005 -0.555 -0.0004 0.107
Total Elasticity
-0.919 -0.121 -0.2604 0.224
39
TABLE 8: AGE OF TAKING UP SMOKING, PERCENTAGES
Age Age Started
Smoking, Daily Smoker
1994 Data 1998 Data
14 to 18 group Male Younger than 14 33.3 37.3 14 to 18 66.6 62.7 Female Younger than 14 35.6 47.3 14 to 18 64.4 52.7 Age 19 + group Male Under 14 18.5 17.3 14 to 18 62.9 61.7 19 and 20 8.9 10.4 Over 20 8.8 10.3 Female Under 14 13.3 15.3 14 to 18 58.1 58.3 19 and 20 10.6 10.8 Over 20 17.9 15.6