the economic impact of the central arizona …...• alliance of arizona nonprofits • arizona...
TRANSCRIPT

THE ECONOMIC IMPACT OF
THE CENTRAL ARIZONA PROJECT TO THE STATE OF ARIZONA
L William Seidman Research Institute, W. P. Carey School of Business,
Arizona State University
October 22, 2019
The L. William Seidman Research Institute serves as a link between the local, national, and international business communities and the W. P. Carey School of Business at Arizona State University (ASU). First established in 1985 to serve as a center for applied business research and a consultancy resource for the Arizona business community, Seidman collects, analyzes and disseminates information about local economies, benchmarks industry practices, and identifies emerging business research issues that affect productivity and competitiveness. Using tools that support sophisticated statistical modeling and planning, supplemented by an extensive understanding of the local, state and national economies, Seidman today offers a host of economic research and consulting services, including economic impact analyses, economic forecasting, general survey research, attitudinal and qualitative studies, and strategic analyses of economic development opportunities. Working on behalf of government agencies, regulatory bodies, public or privately-owned firms, academic institutions, and non-profit organizations, Seidman specializes in studies at the city, county or state-wide level. Recent and current clients include:
• Alliance of Arizona Nonprofits • Arizona Commerce Authority (ACA) • Arizona Corporation Commission (ACC) • Arizona Community Foundation • Arizona Dept. Mines and Mineral Resources • Arizona Diamondbacks • Arizona Investment Council (AIC) • Arizona Public Service Corporation (APS) • Arizona School Boards Association • Arizona Technology Council • BHP Billiton • The Boeing Company • Business for Water Stewardship • The Cactus League Association • The Central Arizona Project • City of Phoenix • City of Scottsdale • Curis Resources (Arizona) • EDF • Epic Rides/The City of Prescott • EPCOR • Excelsior Mining
• Executive Budget Office - State of Arizona • First Things First • Freeport McMoRan • Glendale Community College • Greater Phoenix Economic Council • Intel Corporation • iState Inc. • Navajo Nation Division Economic Development • The NFL • Phoenix Convention Center • Phoenix Sky Harbor International Airport • Plexus • Public Service New Mexico (PNM) • Raytheon • Republic Services, Inc. • Rosemont Copper • Science Foundation Arizona (SFAZ) • Salt River Project (SRP) • Turf Paradise • Valley METRO Light Rail • Vote Solar Initiative • Waste Management, Inc.
i
EXECUTIVE SUMMARY
• This study estimates the economic impact of the Central Arizona Project (CAP) to the State of Arizona in three
aspects:
o The construction of CAP, 1973-1993;
o The impact of CAP’s water supply delivery operations, 1986-2017; and
o The impact of CAP’s inhouse operations, 2011-2017.
• A modified IMPLAN input-output model for the State of Arizona is used to implement the analysis.1
• The economic impacts are assessed in terms of Gross Domestic Product (GDP) by State and employment.
CONSTRUCTION PHASE, 1973-1993
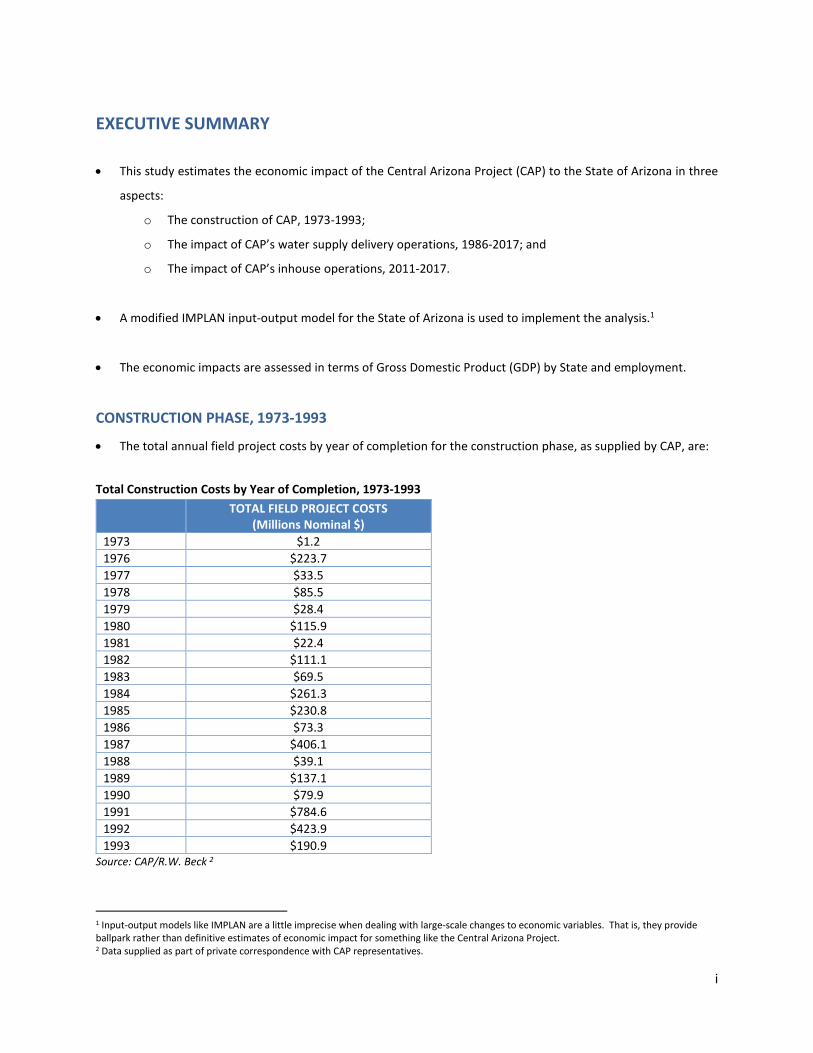
• The total annual field project costs by year of completion for the construction phase, as supplied by CAP, are:
Total Construction Costs by Year of Completion, 1973-1993
TOTAL FIELD PROJECT COSTS (Millions Nominal $)
1973 $1.2 1976 $223.7 1977 $33.5 1978 $85.5 1979 $28.4 1980 $115.9 1981 $22.4 1982 $111.1 1983 $69.5 1984 $261.3 1985 $230.8 1986 $73.3 1987 $406.1 1988 $39.1 1989 $137.1 1990 $79.9 1991 $784.6 1992 $423.9 1993 $190.9
Source: CAP/R.W. Beck 2
1 Input-output models like IMPLAN are a little imprecise when dealing with large-scale changes to economic variables. That is, they provide ballpark rather than definitive estimates of economic impact for something like the Central Arizona Project. 2 Data supplied as part of private correspondence with CAP representatives.
ii
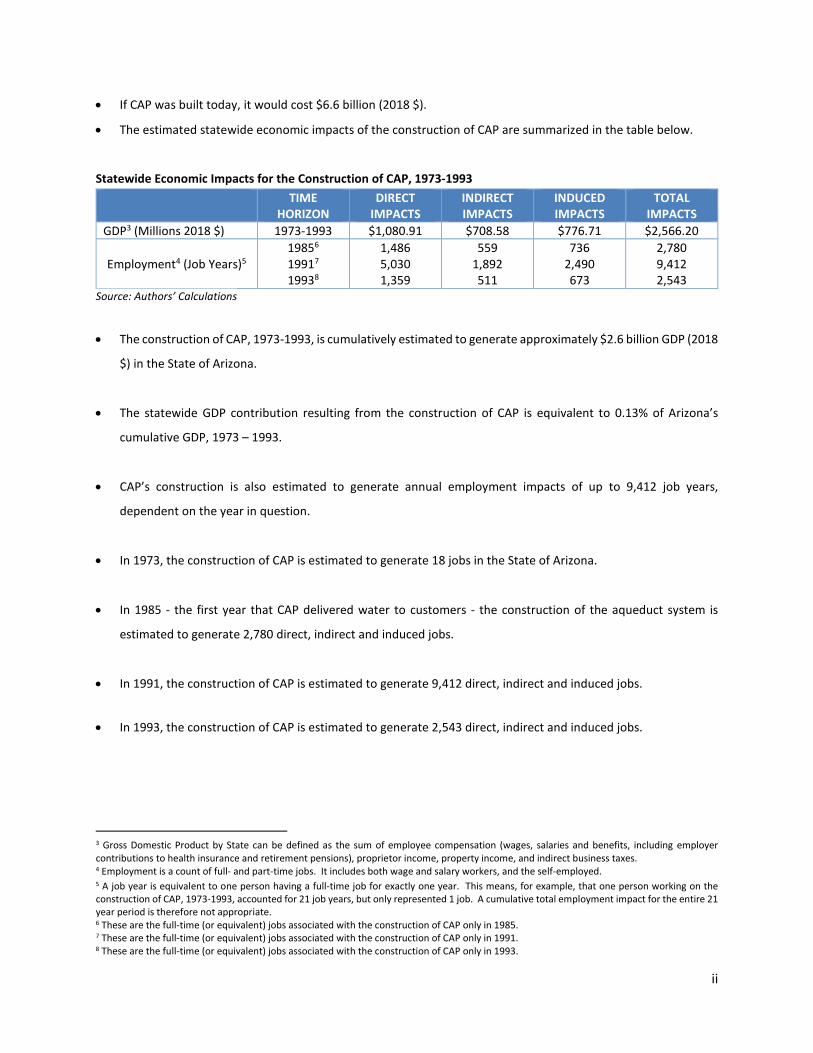
• If CAP was built today, it would cost $6.6 billion (2018 $).
• The estimated statewide economic impacts of the construction of CAP are summarized in the table below.
Statewide Economic Impacts for the Construction of CAP, 1973-1993 TIME
HORIZON DIRECT
IMPACTS INDIRECT IMPACTS
INDUCED IMPACTS
TOTAL IMPACTS
GDP3 (Millions 2018 $) 1973-1993 $1,080.91 $708.58 $776.71 $2,566.20
Employment4 (Job Years)5 19856 19917 19938
1,486 5,030 1,359
559 1,892 511
736 2,490 673
2,780 9,412 2,543
Source: Authors’ Calculations
• The construction of CAP, 1973-1993, is cumulatively estimated to generate approximately $2.6 billion GDP (2018
$) in the State of Arizona.
• The statewide GDP contribution resulting from the construction of CAP is equivalent to 0.13% of Arizona’s
cumulative GDP, 1973 – 1993.
• CAP’s construction is also estimated to generate annual employment impacts of up to 9,412 job years,
dependent on the year in question.
• In 1973, the construction of CAP is estimated to generate 18 jobs in the State of Arizona.
• In 1985 - the first year that CAP delivered water to customers - the construction of the aqueduct system is
estimated to generate 2,780 direct, indirect and induced jobs.
• In 1991, the construction of CAP is estimated to generate 9,412 direct, indirect and induced jobs.
• In 1993, the construction of CAP is estimated to generate 2,543 direct, indirect and induced jobs.
3 Gross Domestic Product by State can be defined as the sum of employee compensation (wages, salaries and benefits, including employer contributions to health insurance and retirement pensions), proprietor income, property income, and indirect business taxes. 4 Employment is a count of full- and part-time jobs. It includes both wage and salary workers, and the self-employed. 5 A job year is equivalent to one person having a full-time job for exactly one year. This means, for example, that one person working on the construction of CAP, 1973-1993, accounted for 21 job years, but only represented 1 job. A cumulative total employment impact for the entire 21 year period is therefore not appropriate. 6 These are the full-time (or equivalent) jobs associated with the construction of CAP only in 1985. 7 These are the full-time (or equivalent) jobs associated with the construction of CAP only in 1991. 8 These are the full-time (or equivalent) jobs associated with the construction of CAP only in 1993.
iii
WATER SUPPLY DELIVERY OPERATIONS, 1986 - 2017
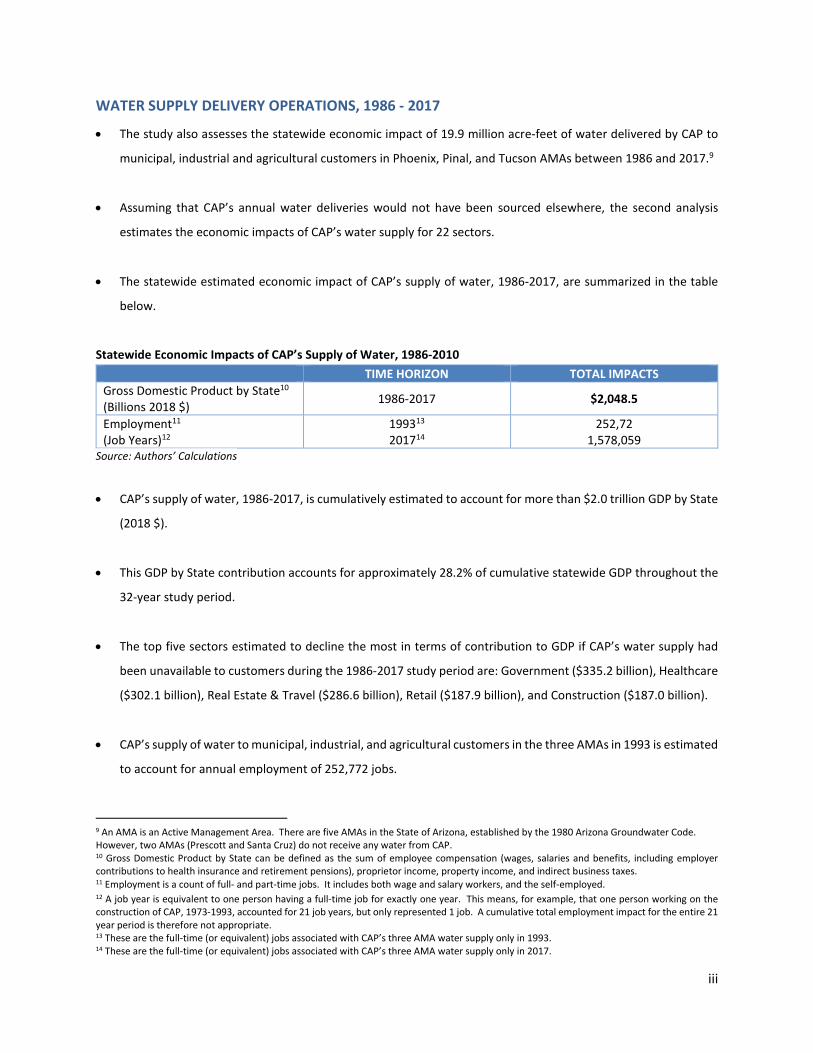
• The study also assesses the statewide economic impact of 19.9 million acre-feet of water delivered by CAP to
municipal, industrial and agricultural customers in Phoenix, Pinal, and Tucson AMAs between 1986 and 2017.9
• Assuming that CAP’s annual water deliveries would not have been sourced elsewhere, the second analysis
estimates the economic impacts of CAP’s water supply for 22 sectors.
• The statewide estimated economic impact of CAP’s supply of water, 1986-2017, are summarized in the table
below.
Statewide Economic Impacts of CAP’s Supply of Water, 1986-2010 TIME HORIZON TOTAL IMPACTS Gross Domestic Product by State10 (Billions 2018 $) 1986-2017 $2,048.5
Employment11 (Job Years)12
199313 201714
252,72 1,578,059
Source: Authors’ Calculations
• CAP’s supply of water, 1986-2017, is cumulatively estimated to account for more than $2.0 trillion GDP by State
(2018 $).
• This GDP by State contribution accounts for approximately 28.2% of cumulative statewide GDP throughout the
32-year study period.
• The top five sectors estimated to decline the most in terms of contribution to GDP if CAP’s water supply had
been unavailable to customers during the 1986-2017 study period are: Government ($335.2 billion), Healthcare
($302.1 billion), Real Estate & Travel ($286.6 billion), Retail ($187.9 billion), and Construction ($187.0 billion).
• CAP’s supply of water to municipal, industrial, and agricultural customers in the three AMAs in 1993 is estimated
to account for annual employment of 252,772 jobs.
9 An AMA is an Active Management Area. There are five AMAs in the State of Arizona, established by the 1980 Arizona Groundwater Code. However, two AMAs (Prescott and Santa Cruz) do not receive any water from CAP. 10 Gross Domestic Product by State can be defined as the sum of employee compensation (wages, salaries and benefits, including employer contributions to health insurance and retirement pensions), proprietor income, property income, and indirect business taxes. 11 Employment is a count of full- and part-time jobs. It includes both wage and salary workers, and the self-employed. 12 A job year is equivalent to one person having a full-time job for exactly one year. This means, for example, that one person working on the construction of CAP, 1973-1993, accounted for 21 job years, but only represented 1 job. A cumulative total employment impact for the entire 21 year period is therefore not appropriate. 13 These are the full-time (or equivalent) jobs associated with CAP’s three AMA water supply only in 1993. 14 These are the full-time (or equivalent) jobs associated with CAP’s three AMA water supply only in 2017.

iv
• CAP’s supply of water to municipal, industrial, and agricultural customers in the three AMAs in 2000 is estimated
to account for annual employment of 540,349 jobs.
• CAP’s supply of water to municipal, industrial, and agricultural customers in the three AMAs in 2010 is estimated
to account for annual employment of approximately 1.3 million jobs.
• CAP’s supply of water to municipal, industrial, and agricultural customers in the three AMAs in 2017 is estimated
to account for annual employment of approximately 1.6 million jobs.
• A cumulative employment impact for the 1986-2017 study period is not appropriate as the unit of measurement
is job years.
• The Healthcare, Government, Retail, Construction, and Real Estate & Travel sectors benefited from
approximately 60 percent of the job year impacts, all of which could have been lost if CAP’s water supply had
been unavailable to customers during the 1986-2017 study period.
• CAP’s establishment and subsequent delivery of water to municipal, industrial, and agricultural customers in the
three AMAs has therefore had a crucial impact on the economic development of the State of Arizona.
CAP’s Contribution to Statewide GDP, 1986-2017
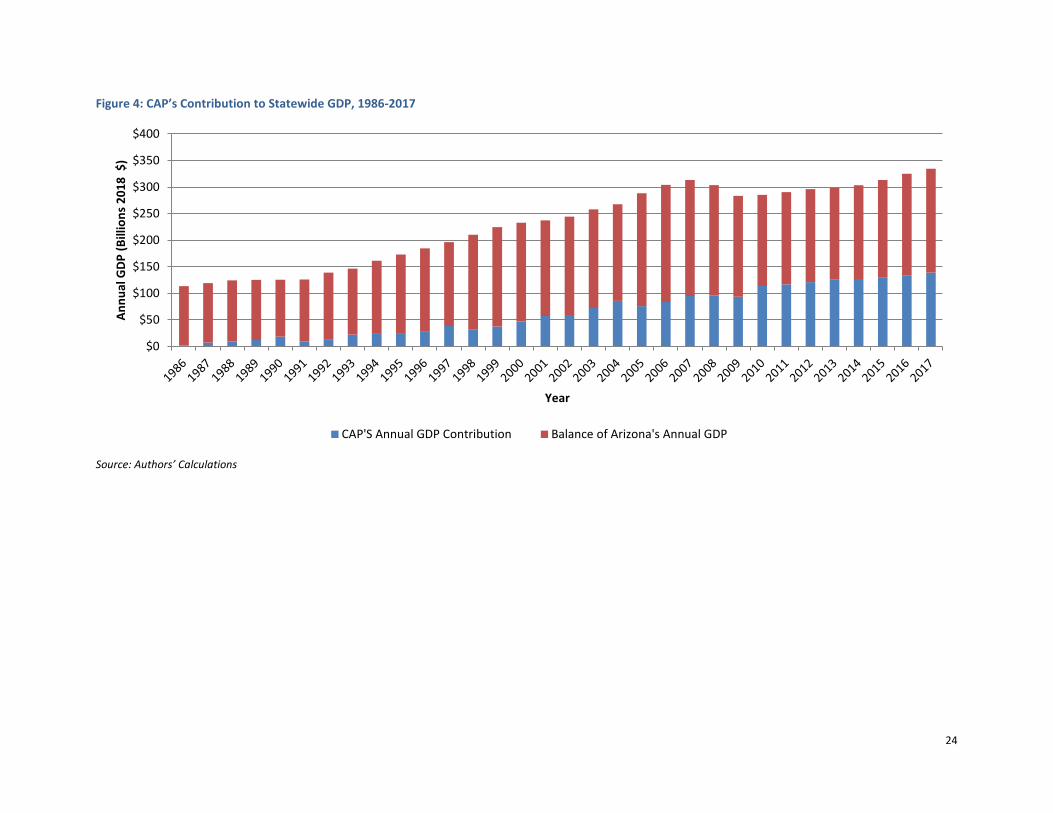
Source: Authors’ Calculations • Without the availability of water from CAP, Arizona’s economic development would have followed a radically
different trajectory.
$0
$100
$200
$300
$400
1986
1987
1988
1989
1990
1991
1992
1993
1994
1995
1996
1997
1998
1999
2000
2001
2002
2003
2004
2005
2006
2007
2008
2009
2010
2011
2012
2013
2014
2015
2016
2017
Annu
al G
DP (B
illio
ns 2
018
$)
Year
CAP'S Annual GDP Contribution Balance of Arizona's Annual GDP
v
• If CAP’s leisure benefits are added to the water supply analysis, the statewide economic impacts would be even
greater.
INHOUSE OPERATIONS, 2011 - 2017
• Between 2011 and 2017, annual inhouse employment at CAP ranges from 461 to 484 people, dependent on the
year in question.
• The total annual employment contribution of CAP’s operations is estimated to range from 786 jobs in 2014,15
to 1,778 jobs in 2017.16
• The cumulative GDP contribution of CAP’s inhouse operations for the same seven-year time horizon is estimated
at $829.4 million (2018 $).
• The inclusion of CAP’s inhouse staff and supplier purchases since the agency’s inception would also increase the
estimated economic value of CAP’s water delivery in the State of Arizona.
15 These are the direct, indirect and induced jobs associated with CAP’s inhouse operations and supplier purchases only in 2014. 16 These are the direct, indirect and induced jobs associated with CAP’s inhouse operations and supplier purchases only in 2017.
vi
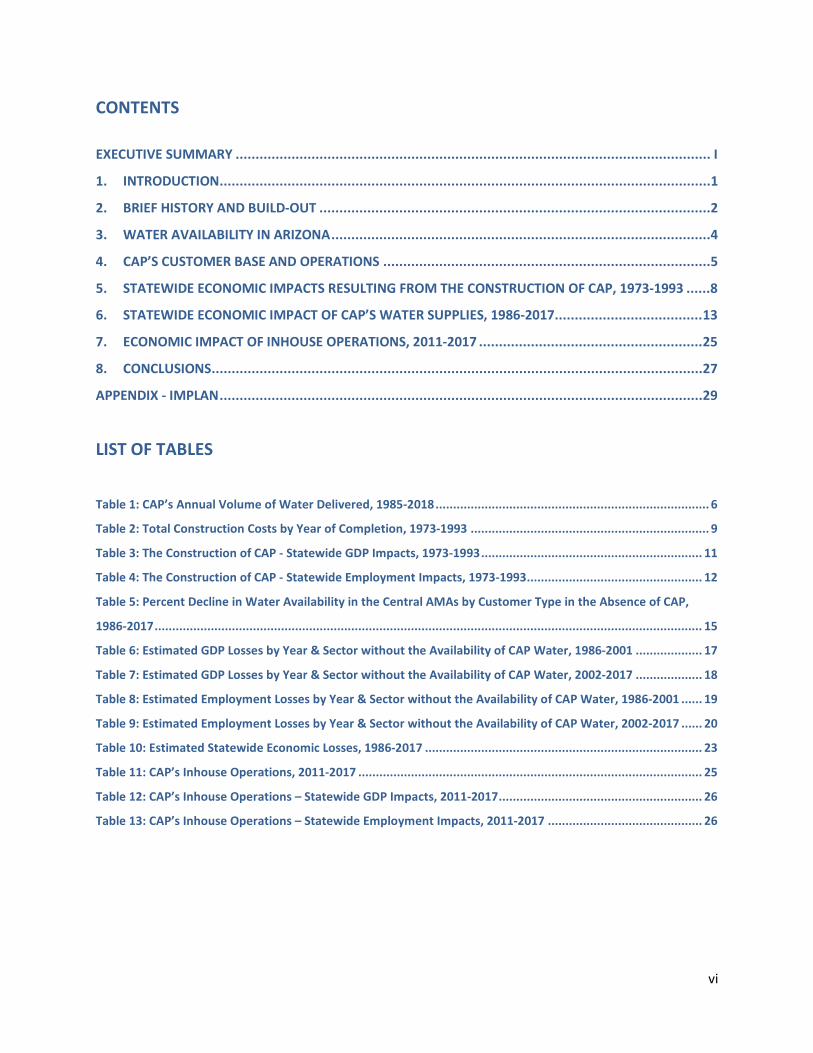
CONTENTS
EXECUTIVE SUMMARY ....................................................................................................................... I
1. INTRODUCTION ...........................................................................................................................1
2. BRIEF HISTORY AND BUILD-OUT ..................................................................................................2
3. WATER AVAILABILITY IN ARIZONA ...............................................................................................4
4. CAP’S CUSTOMER BASE AND OPERATIONS ..................................................................................5
5. STATEWIDE ECONOMIC IMPACTS RESULTING FROM THE CONSTRUCTION OF CAP, 1973-1993 ......8
6. STATEWIDE ECONOMIC IMPACT OF CAP’S WATER SUPPLIES, 1986-2017 ..................................... 13
7. ECONOMIC IMPACT OF INHOUSE OPERATIONS, 2011-2017 ........................................................ 25
8. CONCLUSIONS ........................................................................................................................... 27
APPENDIX - IMPLAN ......................................................................................................................... 29
LIST OF TABLES
Table 1: CAP’s Annual Volume of Water Delivered, 1985-2018 .............................................................................. 6
Table 2: Total Construction Costs by Year of Completion, 1973-1993 .................................................................... 9
Table 3: The Construction of CAP - Statewide GDP Impacts, 1973-1993 ............................................................... 11
Table 4: The Construction of CAP - Statewide Employment Impacts, 1973-1993 .................................................. 12
Table 5: Percent Decline in Water Availability in the Central AMAs by Customer Type in the Absence of CAP,
1986-2017 ............................................................................................................................................................ 15
Table 6: Estimated GDP Losses by Year & Sector without the Availability of CAP Water, 1986-2001 ................... 17
Table 7: Estimated GDP Losses by Year & Sector without the Availability of CAP Water, 2002-2017 ................... 18
Table 8: Estimated Employment Losses by Year & Sector without the Availability of CAP Water, 1986-2001 ...... 19
Table 9: Estimated Employment Losses by Year & Sector without the Availability of CAP Water, 2002-2017 ...... 20
Table 10: Estimated Statewide Economic Losses, 1986-2017 ............................................................................... 23
Table 11: CAP’s Inhouse Operations, 2011-2017 .................................................................................................. 25
Table 12: CAP’s Inhouse Operations – Statewide GDP Impacts, 2011-2017 .......................................................... 26
Table 13: CAP’s Inhouse Operations – Statewide Employment Impacts, 2011-2017 ............................................ 26

vii
LIST OF FIGURES
Figure 1: CAP - A Historical Timeline, 1967-2017 .................................................................................................... 3
Figure 2: Arizona’s Water Supplies, 2018 ............................................................................................................... 4
Figure 3: CAP’s Water Delivery by Customer Type, 1987-2017 ............................................................................... 7
Figure 4: CAP’s Contribution to Statewide GDP, 1986-2017 ................................................................................. 24
1
1. INTRODUCTION
The Central Arizona Project (CAP) supplies approximately 1.5 million acre-feet of Colorado River water per year to
businesses and residents in Pima, Pinal and Maricopa counties. A 336-mile aqueduct with 14 pumping plants, 1
hydroelectric pump, 8 inverted siphons, 39 radial gate structures, over 50 turnouts, and 3 tunnels, the entire system
is operated 24/7 from a control center in north Phoenix. As the largest single resource of renewable water supplies
in the State of Arizona, CAP carries water from Lake Havasu to the southern boundary of the San Xavier Indian
Reservation.
Approved by Congress in 1968, construction began at Lake Havasu in 1973, and was declared “…substantially
complete” 20 years later southwest of Tucson. The largest and most expensive aqueduct system ever constructed
in the United States, CAP cost over $3.3 billion to build (nominal $), and is currently managed and operated by the
Central Arizona Water Conservation District (CAWCD).
In summer 2013, CAWCD commissioned the Seidman Research Institute to estimate the economic impact of CAP for
the State of Arizona. The primary objective of this request was to quantify the direct, indirect and induced effects
of CAP’s construction, and to also estimate the economic impact of CAP’s water deliveries to the economic
development of the State of Arizona. Seidman estimated that the construction of CAP, 1973-1993, cumulatively
generated approximately $2.4 billion GDP (2013 $). That is, the cumulative GDP by State contribution resulting from
the construction of CAP was equivalent to 0.13% of Arizona’s cumulative GDP, 1973 – 1993. Seidman also estimated
that CAP’s supply of water, 1986-2010, generated $1,090 billion GDP by State (2013 $). That is, the cumulative GDP
by State contribution resulting from CAP’s water deliveries accounted for approximately 23.3% of cumulative
statewide GDP, 1986-2010.
The purpose of the current study is to update the key findings up to and including 2017.
Section 2 offers a brief history of CAP. Section 3 describes water availability in Arizona, and Section 4 outlines CAP’s
current customer base and operations. The direct, indirect and induced economic impacts of the construction of
CAP are quantified in Section 5, followed by an estimate of statewide economic losses likely if CAP had not been
built to supply water to Phoenix, Pinal, and Tucson AMAs in Section 6. An estimate of the impact of CAP’s inhouse
operations, 2011-2017, is offered in Section 7. Conclusions and recommendations are provided in Section 8.
2
2. BRIEF HISTORY AND BUILD-OUT Authorized by Congress and signed by President Johnson as part of the September 1968 Colorado River Basin Project
Act, the Bureau of Land Reclamation began the construction of CAP at Lake Havasu on May 6, 1973. The first CAP
water was delivered through the early segments of the aqueduct to the Harquahala Valley Irrigation District in 1985,
with CAP water reaching the Phoenix Metropolitan Area by November of that year. Tucson customers received their
first CAP water in 1992; and in 1993, Reclamation declared the CAP water supply system “…substantially complete”,
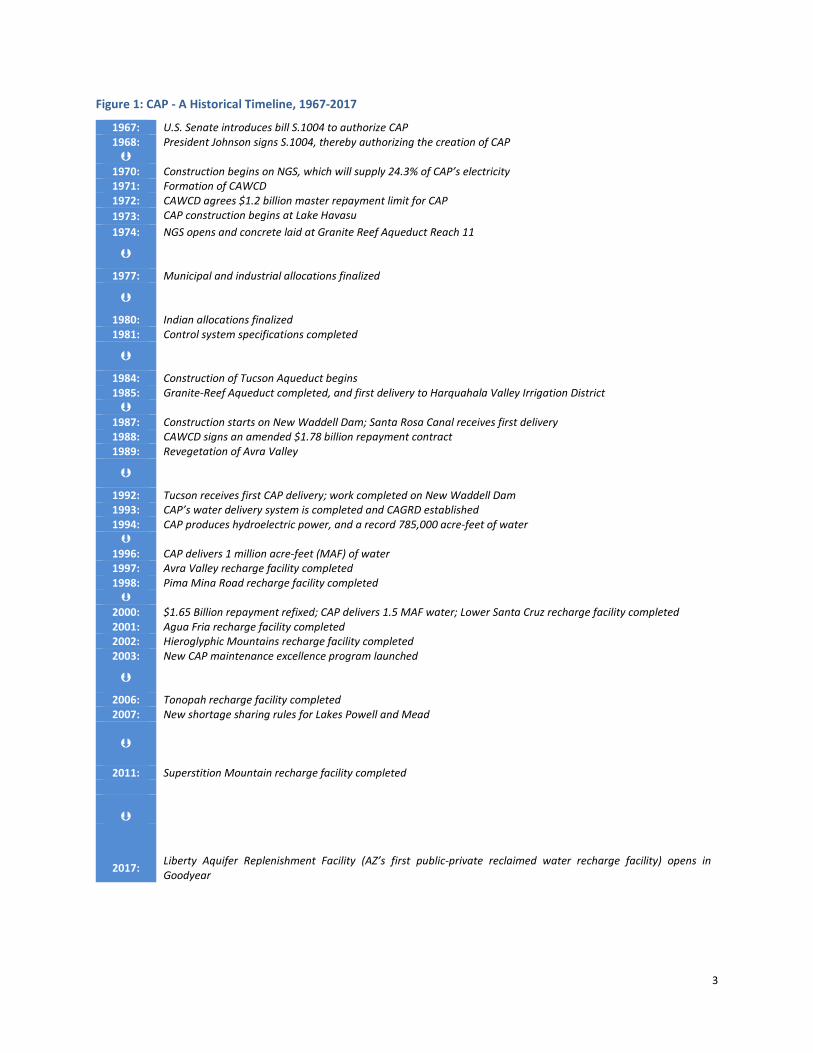
although several ancillary Indian distribution systems took another 10 to 20 years to construct. Figure 1 presents a
historical chronology of events.
The largest and most expensive aqueduct system ever constructed in the United States, CAP cost over $3.3 billion
to build (nominal $). Currently managed and operated by CAWCD, this latter organization was first established in
1971 in Maricopa, Pinal and Pima Counties to repay the state’s share of the construction costs.
Since 1993, CAP has also developed and operated seven recharge facilities, one of which (Avra Valley) was sold to
Metro Water in 2010.17 Two of the recharge facilities are in the Tucson Active Management Area (AMA) and have a
cumulative recharge capacity of 80,000 acre-feet per year. The other four recharge facilities are in Phoenix AMA
and have a combined annual permitted capacity of 310,000 acre-feet per year.
17 Recharge is a long-established and effective water management tool that allows renewable surface water supplies to be stored underground now for recovery later during periods of reduced water supply.
3
Figure 1: CAP - A Historical Timeline, 1967-2017
1967: U.S. Senate introduces bill S.1004 to authorize CAP 1968: President Johnson signs S.1004, thereby authorizing the creation of CAP
1970: Construction begins on NGS, which will supply 24.3% of CAP’s electricity 1971: Formation of CAWCD 1972: CAWCD agrees $1.2 billion master repayment limit for CAP 1973: CAP construction begins at Lake Havasu 1974: NGS opens and concrete laid at Granite Reef Aqueduct Reach 11
1977: Municipal and industrial allocations finalized
1980: Indian allocations finalized 1981: Control system specifications completed
1984: Construction of Tucson Aqueduct begins 1985: Granite-Reef Aqueduct completed, and first delivery to Harquahala Valley Irrigation District
1987: Construction starts on New Waddell Dam; Santa Rosa Canal receives first delivery 1988: CAWCD signs an amended $1.78 billion repayment contract 1989: Revegetation of Avra Valley
1992: Tucson receives first CAP delivery; work completed on New Waddell Dam 1993: CAP’s water delivery system is completed and CAGRD established 1994: CAP produces hydroelectric power, and a record 785,000 acre-feet of water
1996: CAP delivers 1 million acre-feet (MAF) of water 1997: Avra Valley recharge facility completed 1998: Pima Mina Road recharge facility completed
2000: $1.65 Billion repayment refixed; CAP delivers 1.5 MAF water; Lower Santa Cruz recharge facility completed 2001: Agua Fria recharge facility completed 2002: Hieroglyphic Mountains recharge facility completed 2003: New CAP maintenance excellence program launched
2006: Tonopah recharge facility completed 2007: New shortage sharing rules for Lakes Powell and Mead
2011: Superstition Mountain recharge facility completed
2017: Liberty Aquifer Replenishment Facility (AZ’s first public-private reclaimed water recharge facility) opens in Goodyear
4
3. WATER AVAILABILITY IN ARIZONA
Four categories of water supply are available in the State of Arizona. These are surface water, Colorado River water,
groundwater, and effluent.
Surface water comes from lakes, rivers, and streams, stored in reservoirs or delivery systems. The availability of
surface water can vary dramatically by year or location.
The State of Arizona has the right to use 2.8 million acre feet of water from the Colorado River each year, over half
of which is delivered by CAP to Maricopa, Pinal, and Pima Counties. Mohave, La Paz, and Yuma Counties also rely
on the Colorado River as their principal water supply.18
Groundwater is found beneath the earth’s surface in natural reservoirs called aquifers. The Arizona Department of
Water Resources estimates that up to 43% of the state’s water comes from groundwater sources; and this category
of supply is carefully managed by an Arizona Groundwater Management Code first launched in 1980.
Effluent is reclaimed water, used by agriculture, on golf courses, in parks, for industrial cooling, and to maintain
wildlife areas.
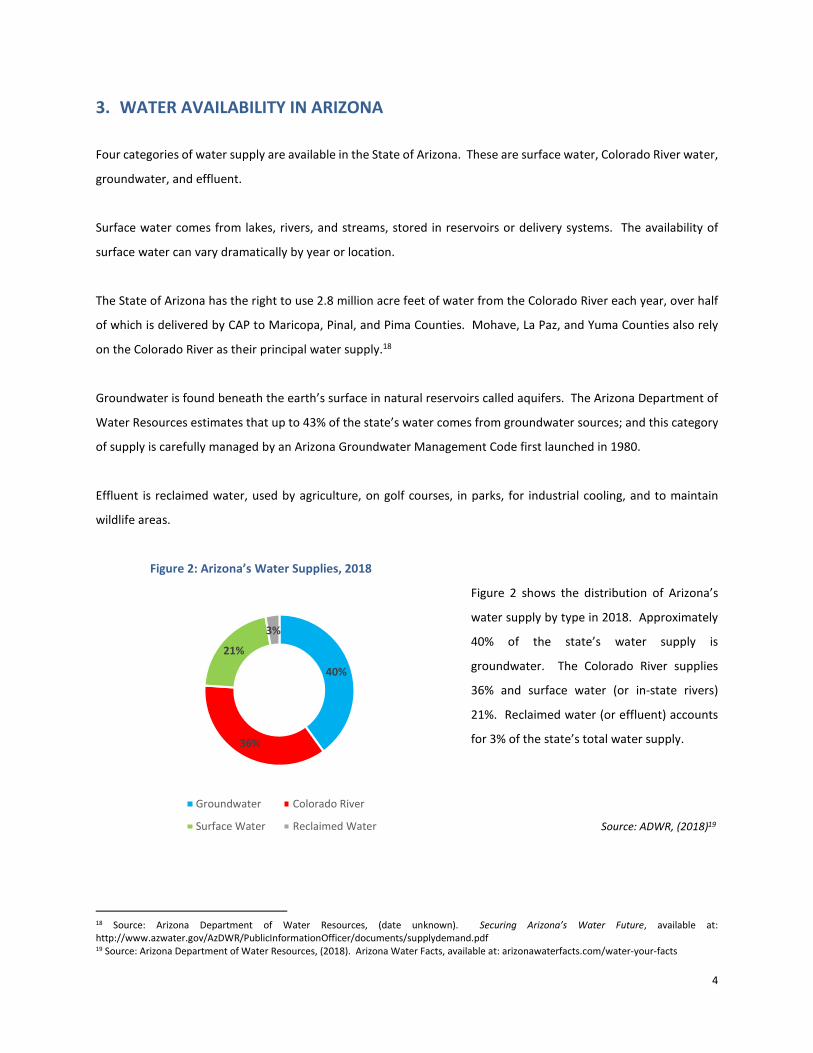
Figure 2: Arizona’s Water Supplies, 2018
Figure 2 shows the distribution of Arizona’s
water supply by type in 2018. Approximately
40% of the state’s water supply is
groundwater. The Colorado River supplies
36% and surface water (or in-state rivers)
21%. Reclaimed water (or effluent) accounts
for 3% of the state’s total water supply.
Source: ADWR, (2018)19
18 Source: Arizona Department of Water Resources, (date unknown). Securing Arizona’s Water Future, available at: http://www.azwater.gov/AzDWR/PublicInformationOfficer/documents/supplydemand.pdf 19 Source: Arizona Department of Water Resources, (2018). Arizona Water Facts, available at: arizonawaterfacts.com/water-your-facts
40%
36%
21%
3%
Groundwater Colorado River
Surface Water Reclaimed Water
5
4. CAP’S CUSTOMER BASE AND OPERATIONS
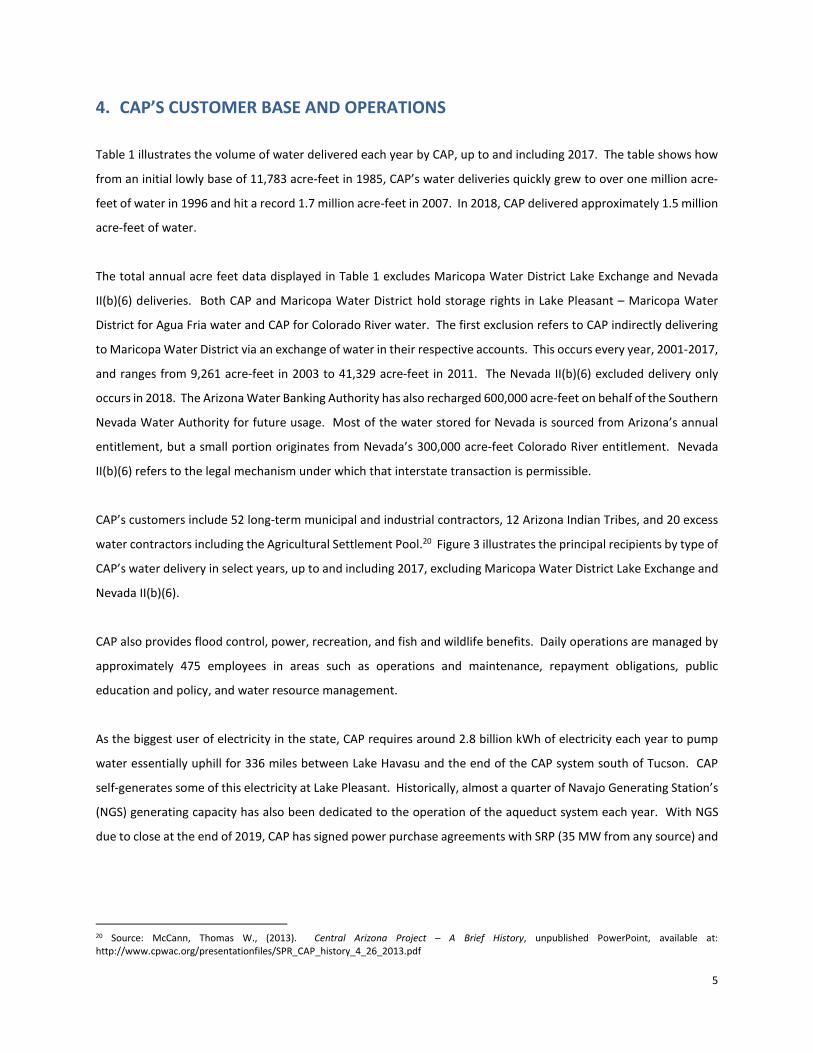
Table 1 illustrates the volume of water delivered each year by CAP, up to and including 2017. The table shows how
from an initial lowly base of 11,783 acre-feet in 1985, CAP’s water deliveries quickly grew to over one million acre-
feet of water in 1996 and hit a record 1.7 million acre-feet in 2007. In 2018, CAP delivered approximately 1.5 million
acre-feet of water.
The total annual acre feet data displayed in Table 1 excludes Maricopa Water District Lake Exchange and Nevada
II(b)(6) deliveries. Both CAP and Maricopa Water District hold storage rights in Lake Pleasant – Maricopa Water
District for Agua Fria water and CAP for Colorado River water. The first exclusion refers to CAP indirectly delivering
to Maricopa Water District via an exchange of water in their respective accounts. This occurs every year, 2001-2017,
and ranges from 9,261 acre-feet in 2003 to 41,329 acre-feet in 2011. The Nevada II(b)(6) excluded delivery only
occurs in 2018. The Arizona Water Banking Authority has also recharged 600,000 acre-feet on behalf of the Southern
Nevada Water Authority for future usage. Most of the water stored for Nevada is sourced from Arizona’s annual
entitlement, but a small portion originates from Nevada’s 300,000 acre-feet Colorado River entitlement. Nevada
II(b)(6) refers to the legal mechanism under which that interstate transaction is permissible.
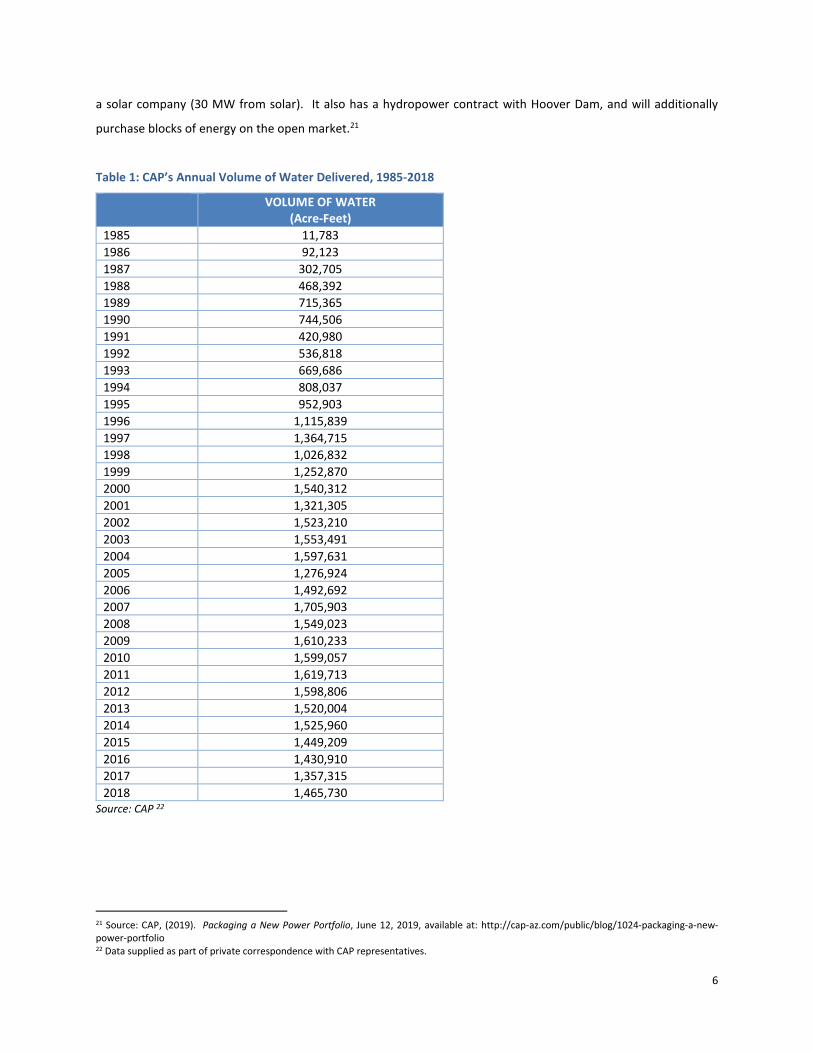
CAP’s customers include 52 long-term municipal and industrial contractors, 12 Arizona Indian Tribes, and 20 excess
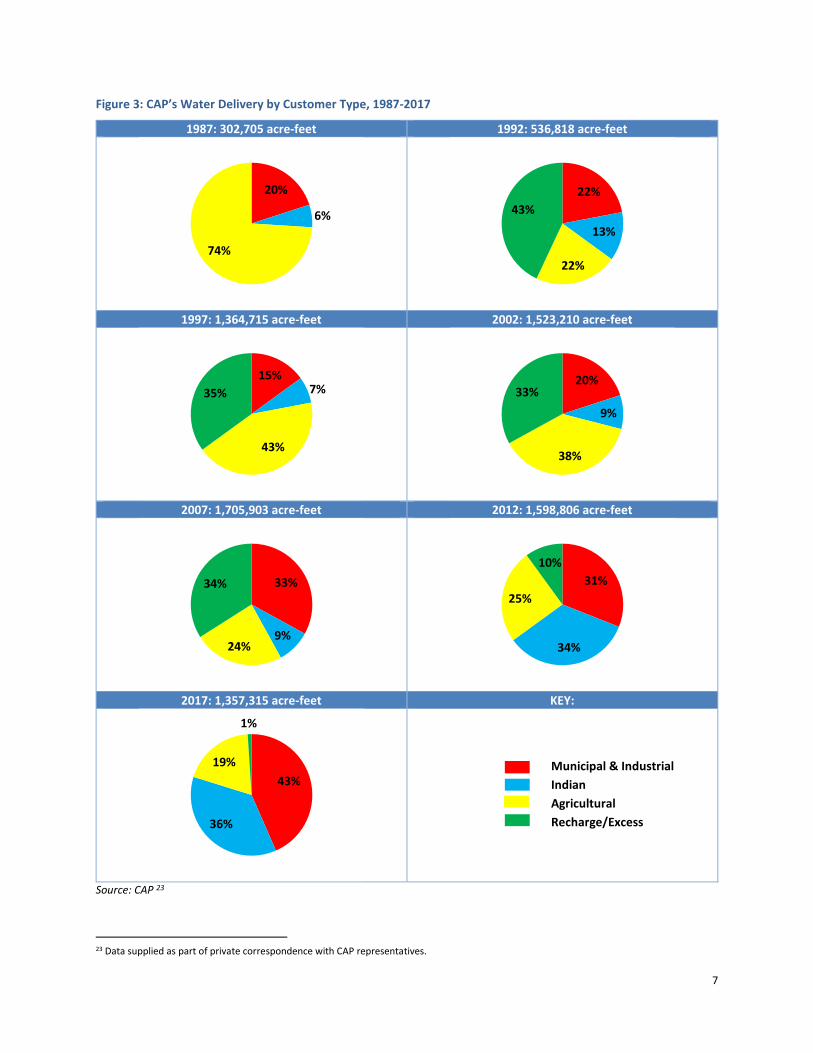
water contractors including the Agricultural Settlement Pool.20 Figure 3 illustrates the principal recipients by type of
CAP’s water delivery in select years, up to and including 2017, excluding Maricopa Water District Lake Exchange and
Nevada II(b)(6).
CAP also provides flood control, power, recreation, and fish and wildlife benefits. Daily operations are managed by
approximately 475 employees in areas such as operations and maintenance, repayment obligations, public
education and policy, and water resource management.
As the biggest user of electricity in the state, CAP requires around 2.8 billion kWh of electricity each year to pump
water essentially uphill for 336 miles between Lake Havasu and the end of the CAP system south of Tucson. CAP
self-generates some of this electricity at Lake Pleasant. Historically, almost a quarter of Navajo Generating Station’s
(NGS) generating capacity has also been dedicated to the operation of the aqueduct system each year. With NGS
due to close at the end of 2019, CAP has signed power purchase agreements with SRP (35 MW from any source) and
20 Source: McCann, Thomas W., (2013). Central Arizona Project – A Brief History, unpublished PowerPoint, available at: http://www.cpwac.org/presentationfiles/SPR_CAP_history_4_26_2013.pdf
6
a solar company (30 MW from solar). It also has a hydropower contract with Hoover Dam, and will additionally
purchase blocks of energy on the open market.21
Table 1: CAP’s Annual Volume of Water Delivered, 1985-2018
VOLUME OF WATER (Acre-Feet)
1985 11,783 1986 92,123 1987 302,705 1988 468,392 1989 715,365 1990 744,506 1991 420,980 1992 536,818 1993 669,686 1994 808,037 1995 952,903 1996 1,115,839 1997 1,364,715 1998 1,026,832 1999 1,252,870 2000 1,540,312 2001 1,321,305 2002 1,523,210 2003 1,553,491 2004 1,597,631 2005 1,276,924 2006 1,492,692 2007 1,705,903 2008 1,549,023 2009 1,610,233 2010 1,599,057 2011 1,619,713 2012 1,598,806 2013 1,520,004 2014 1,525,960 2015 1,449,209 2016 1,430,910 2017 1,357,315 2018 1,465,730
Source: CAP 22
21 Source: CAP, (2019). Packaging a New Power Portfolio, June 12, 2019, available at: http://cap-az.com/public/blog/1024-packaging-a-new-power-portfolio 22 Data supplied as part of private correspondence with CAP representatives.
7
Figure 3: CAP’s Water Delivery by Customer Type, 1987-2017
1987: 302,705 acre-feet 1992: 536,818 acre-feet
1997: 1,364,715 acre-feet 2002: 1,523,210 acre-feet
2007: 1,705,903 acre-feet 2012: 1,598,806 acre-feet
2017: 1,357,315 acre-feet KEY:
Source: CAP 23
23 Data supplied as part of private correspondence with CAP representatives.
20%
6%
74%
22%
13%
22%
43%
15%7%
43%
35%20%
9%
38%
33%
33%
9%24%
34% 31%
34%
25%
10%
43%
36%
19%
1%
Municipal & Industrial Indian Agricultural Recharge/Excess
8
5. STATEWIDE ECONOMIC IMPACTS RESULTING FROM THE CONSTRUCTION OF CAP, 1973-199324
5.1 Method
Economic impact analysis traces the full impact - direct, indirect and induced - of an economic activity on jobs and
incomes in a defined economy. The construction of CAP has directly affected the State of Arizona’s economy through
the direct jobs provided to construction workers. Indirect effects have arisen through the purchase of construction
materials from suppliers to support the build-out. Induced effects have occurred when workers either directly or
indirectly associated with the construction of CAP spent their incomes in the local economy, when suppliers placed
upstream demands on other producers, and when governments spent new tax revenues. The cumulative changes
in jobs and incomes associated with the construction of CAP are a multiple of the initial direct effects.
To estimate the economic impacts of the construction of CAP, the Seidman Research Institute has used a modified
version of an IMPLAN input-output model for the State of Arizona.
Originally developed by the University of Minnesota, IMPLAN is widely used for economic assessment and can
provide detailed estimates of secondary expenditures and income generated as a result of a business investment or
operation for a finite period of time (typically one full calendar year). The research team has calculated impacts for
each year of CAP’s construction, and summed the results to arrive at cumulative multi-year (1973-1993) estimate of
impacts.
Two variables are used to quantify the economic impacts of CAP’s construction phase in Seidman’s analysis. These
are:
• Gross Domestic Product (GDP) by State: this is synonymous with value added. It represents the dollar value of
all goods and services produced for final demand in the state. It excludes the value of intermediate goods and
services purchased as inputs to final production. It can also be defined as the sum of employee compensation
(wages, salaries and benefits, including employer contributions to health insurance and retirement pensions),
proprietor income, property income, and indirect business taxes.
• Employment: this is a count of full- and part-time jobs. It includes both wage and salary workers, and the self-
employed.
24 Section 5 in the current report differs from the 2014 report in one aspect. That is, all monetary amounts (unless otherwise stated) are expressed in 2018 dollars rather than 2013 dollars.
9
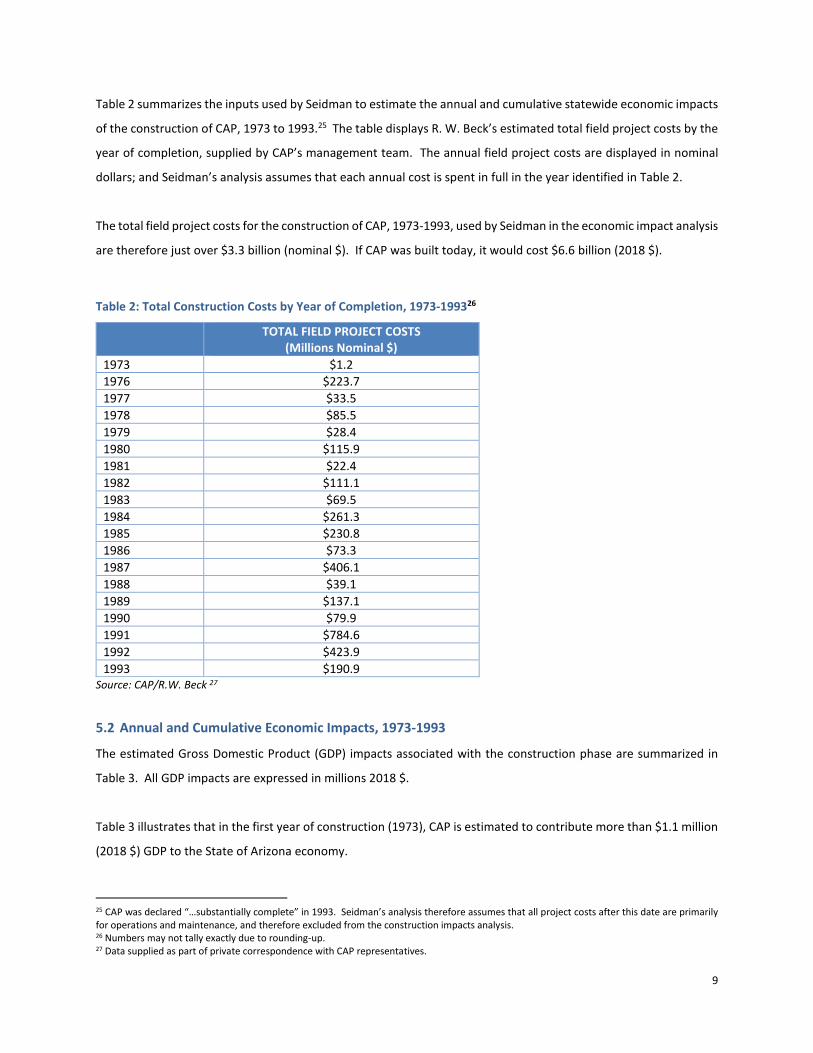
Table 2 summarizes the inputs used by Seidman to estimate the annual and cumulative statewide economic impacts
of the construction of CAP, 1973 to 1993.25 The table displays R. W. Beck’s estimated total field project costs by the
year of completion, supplied by CAP’s management team. The annual field project costs are displayed in nominal
dollars; and Seidman’s analysis assumes that each annual cost is spent in full in the year identified in Table 2.
The total field project costs for the construction of CAP, 1973-1993, used by Seidman in the economic impact analysis
are therefore just over $3.3 billion (nominal $). If CAP was built today, it would cost $6.6 billion (2018 $).
Table 2: Total Construction Costs by Year of Completion, 1973-199326
TOTAL FIELD PROJECT COSTS (Millions Nominal $)
1973 $1.2 1976 $223.7 1977 $33.5 1978 $85.5 1979 $28.4 1980 $115.9 1981 $22.4 1982 $111.1 1983 $69.5 1984 $261.3 1985 $230.8 1986 $73.3 1987 $406.1 1988 $39.1 1989 $137.1 1990 $79.9 1991 $784.6 1992 $423.9 1993 $190.9
Source: CAP/R.W. Beck 27
5.2 Annual and Cumulative Economic Impacts, 1973-1993
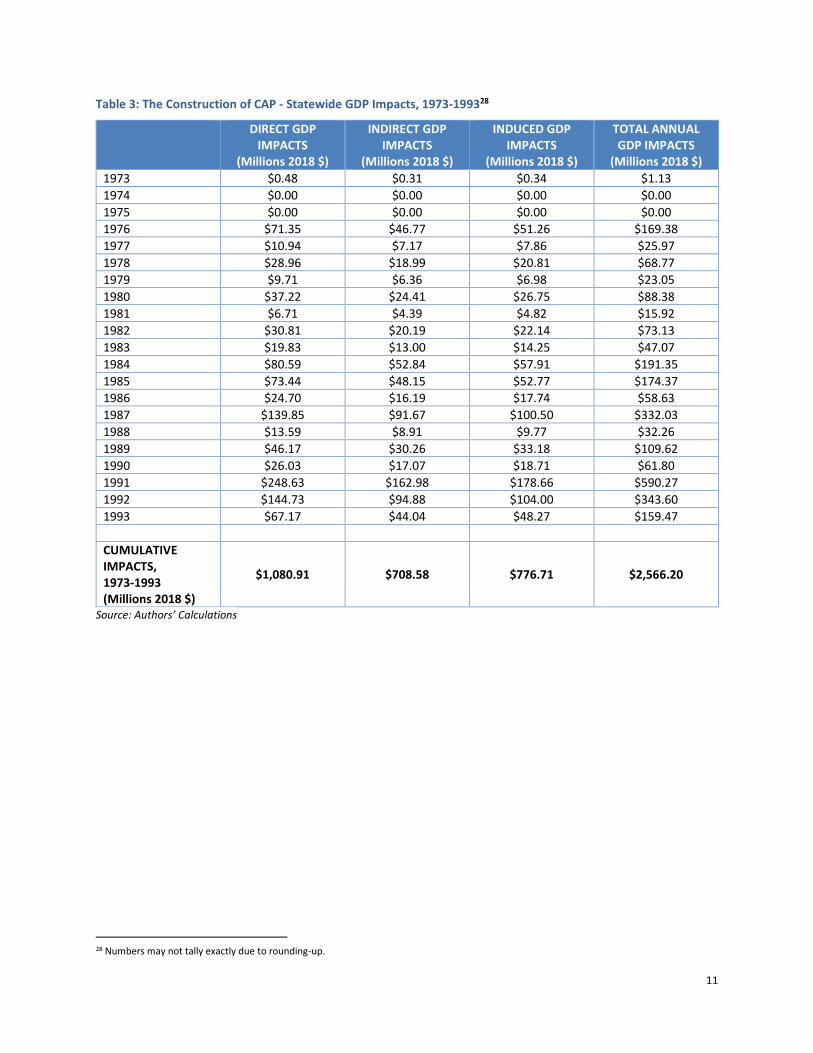
The estimated Gross Domestic Product (GDP) impacts associated with the construction phase are summarized in
Table 3. All GDP impacts are expressed in millions 2018 $.
Table 3 illustrates that in the first year of construction (1973), CAP is estimated to contribute more than $1.1 million
(2018 $) GDP to the State of Arizona economy.
25 CAP was declared “…substantially complete” in 1993. Seidman’s analysis therefore assumes that all project costs after this date are primarily for operations and maintenance, and therefore excluded from the construction impacts analysis. 26 Numbers may not tally exactly due to rounding-up. 27 Data supplied as part of private correspondence with CAP representatives.
10
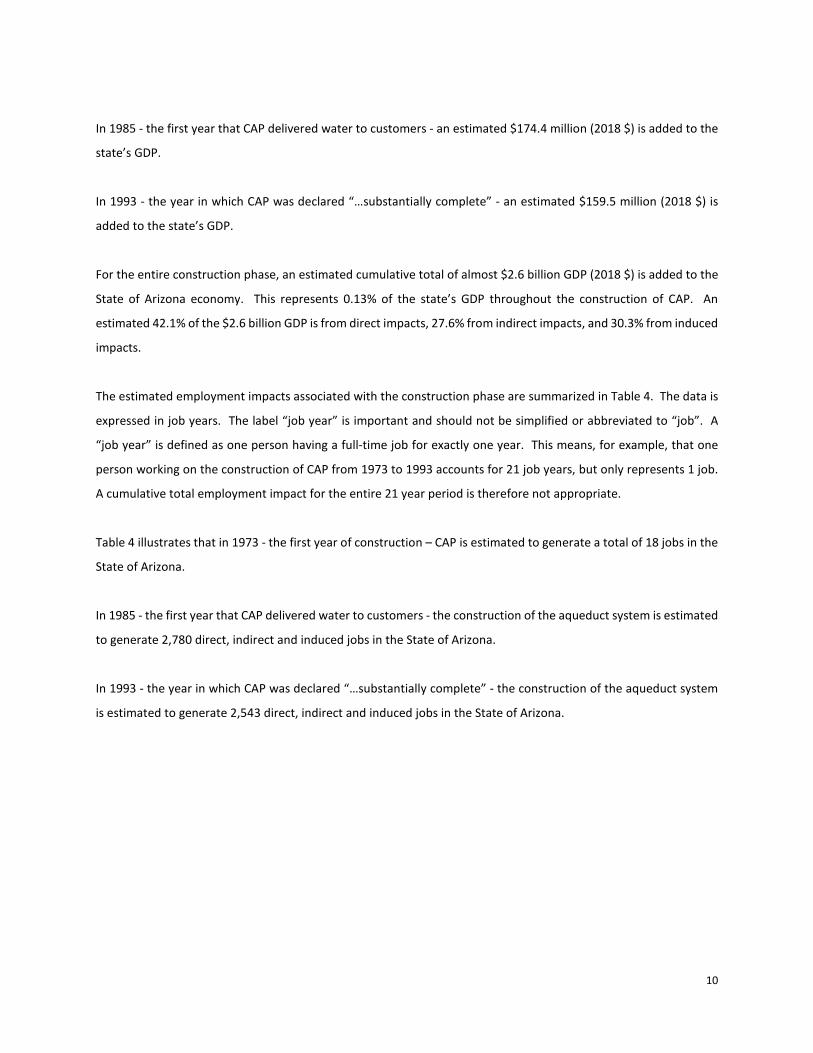
In 1985 - the first year that CAP delivered water to customers - an estimated $174.4 million (2018 $) is added to the
state’s GDP.
In 1993 - the year in which CAP was declared “…substantially complete” - an estimated $159.5 million (2018 $) is
added to the state’s GDP.
For the entire construction phase, an estimated cumulative total of almost $2.6 billion GDP (2018 $) is added to the
State of Arizona economy. This represents 0.13% of the state’s GDP throughout the construction of CAP. An
estimated 42.1% of the $2.6 billion GDP is from direct impacts, 27.6% from indirect impacts, and 30.3% from induced
impacts.
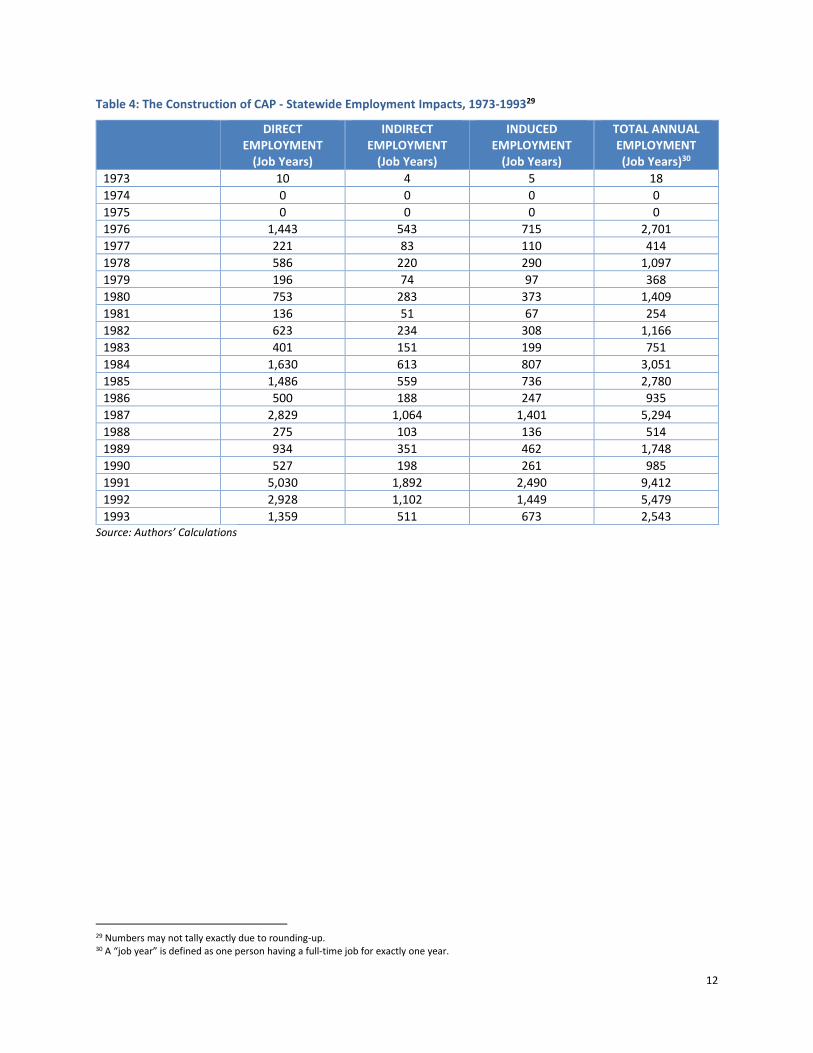
The estimated employment impacts associated with the construction phase are summarized in Table 4. The data is
expressed in job years. The label “job year” is important and should not be simplified or abbreviated to “job”. A
“job year” is defined as one person having a full-time job for exactly one year. This means, for example, that one
person working on the construction of CAP from 1973 to 1993 accounts for 21 job years, but only represents 1 job.
A cumulative total employment impact for the entire 21 year period is therefore not appropriate.
Table 4 illustrates that in 1973 - the first year of construction – CAP is estimated to generate a total of 18 jobs in the
State of Arizona.
In 1985 - the first year that CAP delivered water to customers - the construction of the aqueduct system is estimated
to generate 2,780 direct, indirect and induced jobs in the State of Arizona.
In 1993 - the year in which CAP was declared “…substantially complete” - the construction of the aqueduct system
is estimated to generate 2,543 direct, indirect and induced jobs in the State of Arizona.
11
Table 3: The Construction of CAP - Statewide GDP Impacts, 1973-199328
DIRECT GDP IMPACTS
(Millions 2018 $)
INDIRECT GDP IMPACTS
(Millions 2018 $)
INDUCED GDP IMPACTS
(Millions 2018 $)
TOTAL ANNUAL GDP IMPACTS
(Millions 2018 $) 1973 $0.48 $0.31 $0.34 $1.13 1974 $0.00 $0.00 $0.00 $0.00 1975 $0.00 $0.00 $0.00 $0.00 1976 $71.35 $46.77 $51.26 $169.38 1977 $10.94 $7.17 $7.86 $25.97 1978 $28.96 $18.99 $20.81 $68.77 1979 $9.71 $6.36 $6.98 $23.05 1980 $37.22 $24.41 $26.75 $88.38 1981 $6.71 $4.39 $4.82 $15.92 1982 $30.81 $20.19 $22.14 $73.13 1983 $19.83 $13.00 $14.25 $47.07 1984 $80.59 $52.84 $57.91 $191.35 1985 $73.44 $48.15 $52.77 $174.37 1986 $24.70 $16.19 $17.74 $58.63 1987 $139.85 $91.67 $100.50 $332.03 1988 $13.59 $8.91 $9.77 $32.26 1989 $46.17 $30.26 $33.18 $109.62 1990 $26.03 $17.07 $18.71 $61.80 1991 $248.63 $162.98 $178.66 $590.27 1992 $144.73 $94.88 $104.00 $343.60 1993 $67.17 $44.04 $48.27 $159.47 CUMULATIVE IMPACTS, 1973-1993 (Millions 2018 $)
$1,080.91 $708.58 $776.71 $2,566.20
Source: Authors’ Calculations
28 Numbers may not tally exactly due to rounding-up.
12
Table 4: The Construction of CAP - Statewide Employment Impacts, 1973-199329
DIRECT EMPLOYMENT
(Job Years)
INDIRECT EMPLOYMENT
(Job Years)
INDUCED EMPLOYMENT
(Job Years)
TOTAL ANNUAL EMPLOYMENT (Job Years)30
1973 10 4 5 18 1974 0 0 0 0 1975 0 0 0 0 1976 1,443 543 715 2,701 1977 221 83 110 414 1978 586 220 290 1,097 1979 196 74 97 368 1980 753 283 373 1,409 1981 136 51 67 254 1982 623 234 308 1,166 1983 401 151 199 751 1984 1,630 613 807 3,051 1985 1,486 559 736 2,780 1986 500 188 247 935 1987 2,829 1,064 1,401 5,294 1988 275 103 136 514 1989 934 351 462 1,748 1990 527 198 261 985 1991 5,030 1,892 2,490 9,412 1992 2,928 1,102 1,449 5,479 1993 1,359 511 673 2,543
Source: Authors’ Calculations
29 Numbers may not tally exactly due to rounding-up. 30 A “job year” is defined as one person having a full-time job for exactly one year.
13
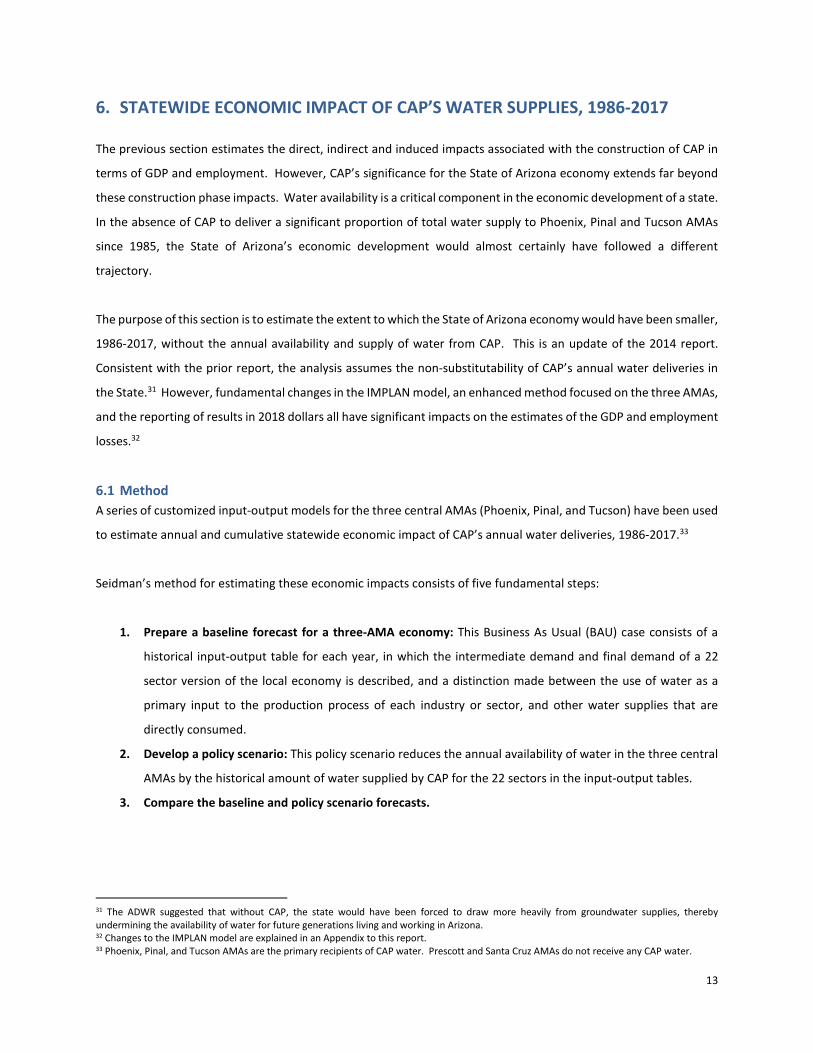
6. STATEWIDE ECONOMIC IMPACT OF CAP’S WATER SUPPLIES, 1986-2017 The previous section estimates the direct, indirect and induced impacts associated with the construction of CAP in
terms of GDP and employment. However, CAP’s significance for the State of Arizona economy extends far beyond
these construction phase impacts. Water availability is a critical component in the economic development of a state.
In the absence of CAP to deliver a significant proportion of total water supply to Phoenix, Pinal and Tucson AMAs
since 1985, the State of Arizona’s economic development would almost certainly have followed a different
trajectory.
The purpose of this section is to estimate the extent to which the State of Arizona economy would have been smaller,
1986-2017, without the annual availability and supply of water from CAP. This is an update of the 2014 report.
Consistent with the prior report, the analysis assumes the non-substitutability of CAP’s annual water deliveries in
the State.31 However, fundamental changes in the IMPLAN model, an enhanced method focused on the three AMAs,
and the reporting of results in 2018 dollars all have significant impacts on the estimates of the GDP and employment
losses.32
6.1 Method A series of customized input-output models for the three central AMAs (Phoenix, Pinal, and Tucson) have been used
to estimate annual and cumulative statewide economic impact of CAP’s annual water deliveries, 1986-2017.33
Seidman’s method for estimating these economic impacts consists of five fundamental steps:
1. Prepare a baseline forecast for a three-AMA economy: This Business As Usual (BAU) case consists of a
historical input-output table for each year, in which the intermediate demand and final demand of a 22
sector version of the local economy is described, and a distinction made between the use of water as a
primary input to the production process of each industry or sector, and other water supplies that are
directly consumed.
2. Develop a policy scenario: This policy scenario reduces the annual availability of water in the three central
AMAs by the historical amount of water supplied by CAP for the 22 sectors in the input-output tables.
3. Compare the baseline and policy scenario forecasts.
31 The ADWR suggested that without CAP, the state would have been forced to draw more heavily from groundwater supplies, thereby undermining the availability of water for future generations living and working in Arizona. 32 Changes to the IMPLAN model are explained in an Appendix to this report. 33 Phoenix, Pinal, and Tucson AMAs are the primary recipients of CAP water. Prescott and Santa Cruz AMAs do not receive any CAP water.
14
4. Produce the “delta” results: Differences between the values for each sector estimate the potential
economic impact of the non-availability of water supplied by CAP on the local economy, relative to the
baseline, for each year of study.
5. Run an IMPLAN analysis on each series of delta results: This produces annual and cumulative estimates
of the importance of CAP’s water deliveries for GDP and employment.
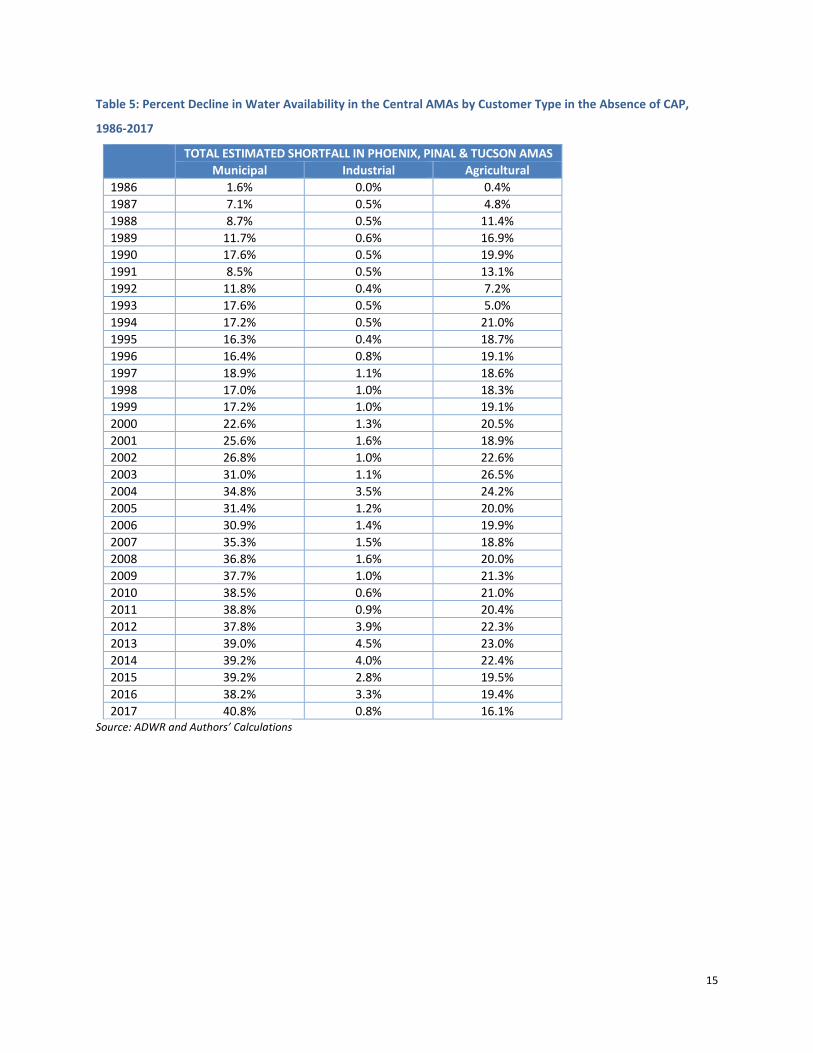
Table 5 estimates the annual extent to which municipal, industrial, and agricultural water availability in the three
central AMAs (Phoenix, Pinal, and Tucson) would have declined if CAP had not been established, based on AMA data
supplied by the ADWR, and an assumption that other sources of water are not available to compensate for the loss
of CAP’s water deliveries.
The table estimates, for example, that the non-availability of CAP water in 1986 would have resulted in a 1.6% total
decline in water availability for municipal users in the three AMAs, and a 0.4% decline in water availability for
agricultural users.
In 1993, the table estimates that the non-availability of CAP water would have resulted in a 17.6% decline in water
availability for municipal users in the three AMAs, a 0.5% decline in water availability for industrial users in the three
AMAs, and a 5.0% decline in water availability for agricultural users.
In 2010, the table estimates that the non-availability of CAP water would have resulted in a 38.5% decline in water
availability for municipal users in the three AMAs, a 0.6% decline in water availability for industrial users in the three
AMAs, and a 21.0% decline in water availability for agricultural users.
In 2017, the table estimates that the non-availability of CAP water would have resulted in a 40.8% decline in water
availability for municipal users in the three AMAs, a 0.8% decline in water availability for industrial users in the three
AMAs, and a 16.1% decline in water availability for agricultural users.
15
Table 5: Percent Decline in Water Availability in the Central AMAs by Customer Type in the Absence of CAP,
1986-2017
TOTAL ESTIMATED SHORTFALL IN PHOENIX, PINAL & TUCSON AMAS Municipal Industrial Agricultural
1986 1.6% 0.0% 0.4% 1987 7.1% 0.5% 4.8% 1988 8.7% 0.5% 11.4% 1989 11.7% 0.6% 16.9% 1990 17.6% 0.5% 19.9% 1991 8.5% 0.5% 13.1% 1992 11.8% 0.4% 7.2% 1993 17.6% 0.5% 5.0% 1994 17.2% 0.5% 21.0% 1995 16.3% 0.4% 18.7% 1996 16.4% 0.8% 19.1% 1997 18.9% 1.1% 18.6% 1998 17.0% 1.0% 18.3% 1999 17.2% 1.0% 19.1% 2000 22.6% 1.3% 20.5% 2001 25.6% 1.6% 18.9% 2002 26.8% 1.0% 22.6% 2003 31.0% 1.1% 26.5% 2004 34.8% 3.5% 24.2% 2005 31.4% 1.2% 20.0% 2006 30.9% 1.4% 19.9% 2007 35.3% 1.5% 18.8% 2008 36.8% 1.6% 20.0% 2009 37.7% 1.0% 21.3% 2010 38.5% 0.6% 21.0% 2011 38.8% 0.9% 20.4% 2012 37.8% 3.9% 22.3% 2013 39.0% 4.5% 23.0% 2014 39.2% 4.0% 22.4% 2015 39.2% 2.8% 19.5% 2016 38.2% 3.3% 19.4% 2017 40.8% 0.8% 16.1%
Source: ADWR and Authors’ Calculations
16
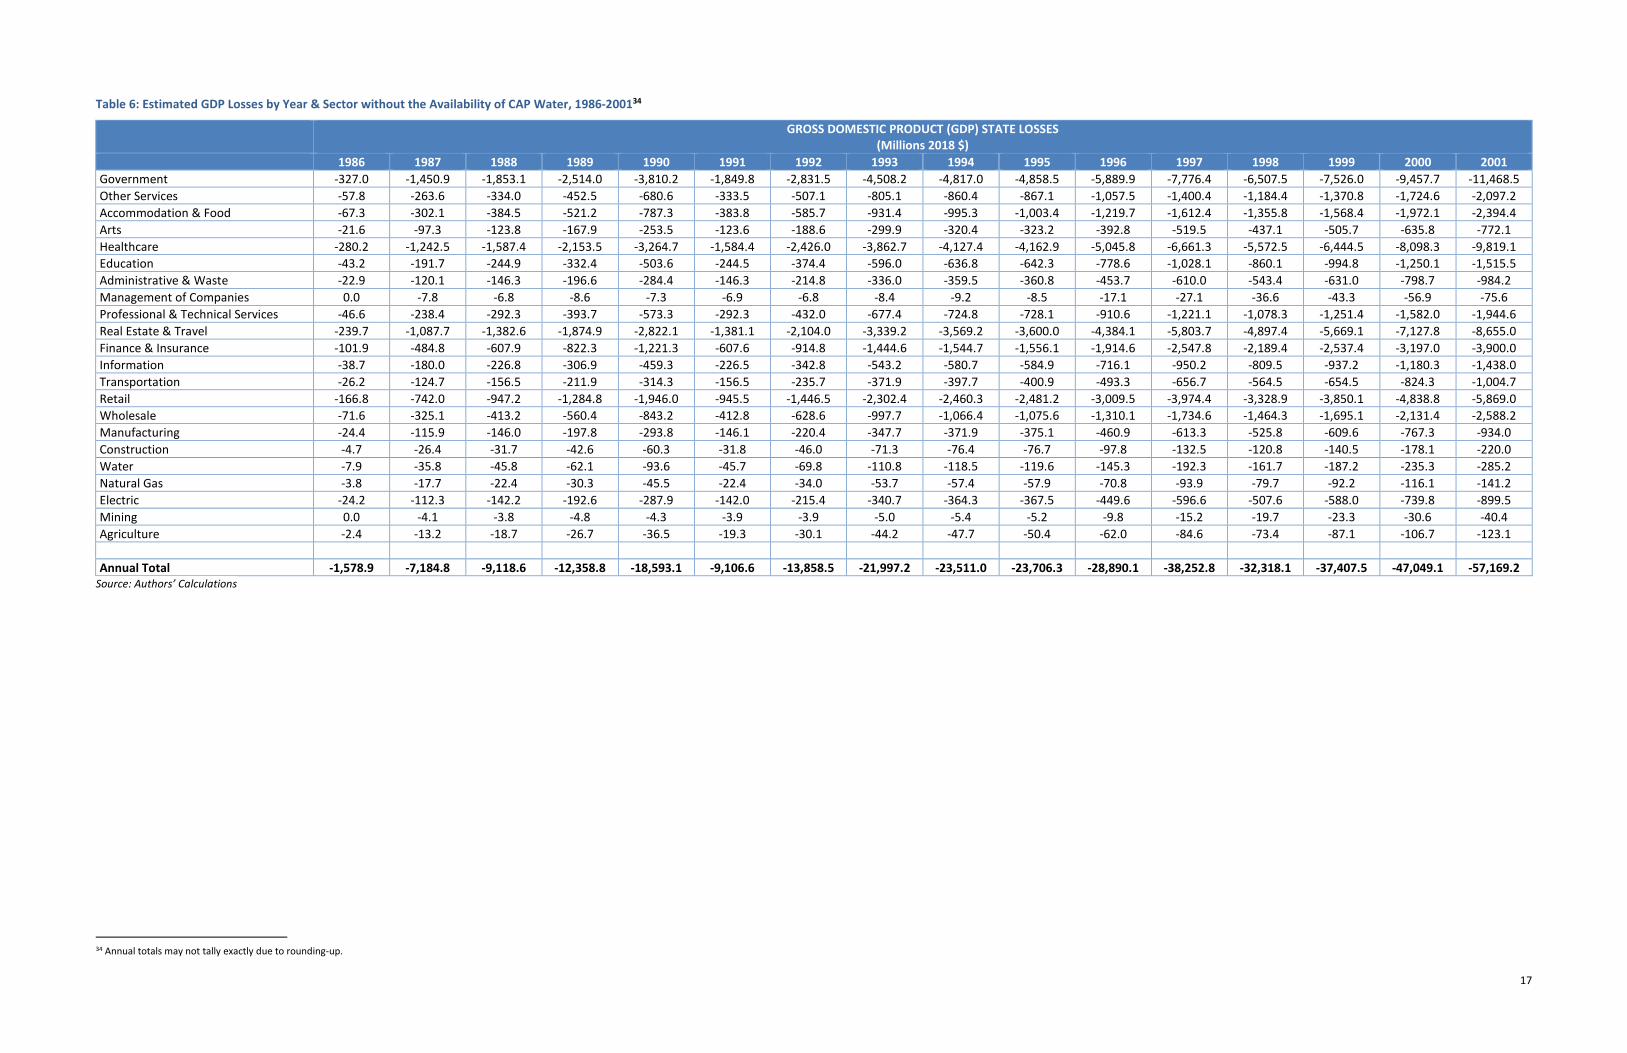
6.2 Sectoral Economic impact by Year, 1986-2017 Tables 6 through 9 illustrate the annual importance of CAP’s water deliveries by sector for the State of Arizona
economy if there was a shortfall in water availability caused by the non-existence of CAP. Tables 6 and 7 focus on
changes in total GDP by State. Tables 8 and 9 examines changes in total employment.
Table 6 estimates the GDP by State losses by year and sector without the availability of CAP’s water supply, 1986-
2001.
The table estimates that in 1986, Arizona’s GDP across all sectors would have been lower by almost $1.6 billion (2018
$). The top five sectors estimated to decline the most in terms of contribution to GDP in 1986 are: Government
($327.0 million), Healthcare ($280.2 million), Real Estate & Travel ($239.7 million), Retail ($166.8 million), and
Finance and Insurance ($101.9 million).
In 1993 - the year that CAP was declared “…substantially complete” - Arizona’s GDP across all sectors would have
been lower by $22.0 billion (2018 $). The top five sectors estimated to decline the most in terms of contribution to
GDP in 1993 are: Government ($4.5 billion), Healthcare ($3.9 billion), Real Estate & Travel ($3.3 billion), Retail ($2.3
billion), and Finance and Insurance ($1.4 billion).
In 2001, Arizona’s GDP across all sectors would have been lower by $57.2 billion (2018 $). The top five sectors
estimated to decline the most in terms of contribution to GDP in 2001 are: Government ($11.5 billion), Healthcare
($9.8 billion), Real Estate & Travel ($8.7 billion), Retail ($5.9 billion), and Finance and Insurance ($3.9 billion).
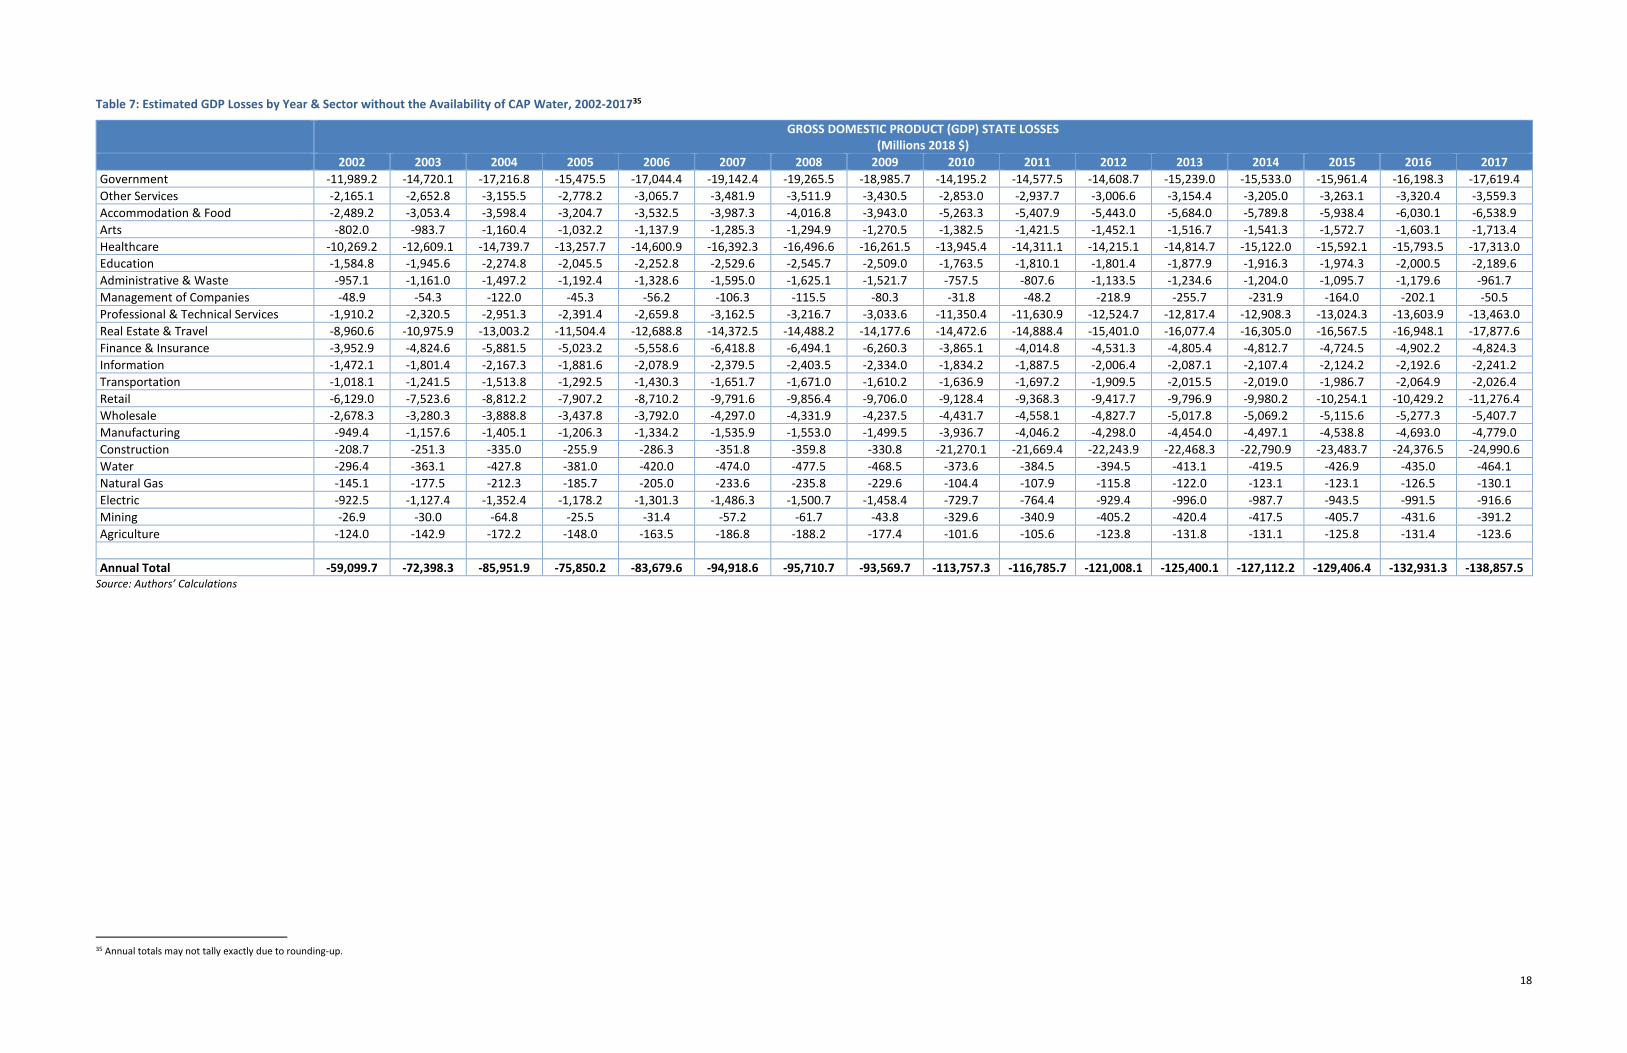
Table 7 estimates the GDP by State losses by year and sector without the availability of CAP’s water supply, 2002-
2017.
The table estimates that in 2002, total GDP across all sectors would have been lower by $59.1 billion (2018 $). The
top five sectors estimated to decline the most in terms of contribution to GDP in 2002 are: Government ($12.0
billion), Healthcare ($10.3 billion), Real Estate & Travel ($9.0 billion), Retail ($6.1 billion), and Finance and Insurance
($4.0 billion).
In 2010, total GDP across all sectors would have been lower by almost $113.8 billion (2018 $). The top five sectors
estimated to decline the most in terms of contribution to GDP in 2010 are: Construction ($21.3 billion), Real Estate
& Travel ($14.5 billion), Government ($14.2 billion), Healthcare ($13.9 billion), and Professional and Technical
Services ($11.4 billion).
17
Table 6: Estimated GDP Losses by Year & Sector without the Availability of CAP Water, 1986-200134
GROSS DOMESTIC PRODUCT (GDP) STATE LOSSES (Millions 2018 $)
1986 1987 1988 1989 1990 1991 1992 1993 1994 1995 1996 1997 1998 1999 2000 2001 Government -327.0 -1,450.9 -1,853.1 -2,514.0 -3,810.2 -1,849.8 -2,831.5 -4,508.2 -4,817.0 -4,858.5 -5,889.9 -7,776.4 -6,507.5 -7,526.0 -9,457.7 -11,468.5 Other Services -57.8 -263.6 -334.0 -452.5 -680.6 -333.5 -507.1 -805.1 -860.4 -867.1 -1,057.5 -1,400.4 -1,184.4 -1,370.8 -1,724.6 -2,097.2 Accommodation & Food -67.3 -302.1 -384.5 -521.2 -787.3 -383.8 -585.7 -931.4 -995.3 -1,003.4 -1,219.7 -1,612.4 -1,355.8 -1,568.4 -1,972.1 -2,394.4 Arts -21.6 -97.3 -123.8 -167.9 -253.5 -123.6 -188.6 -299.9 -320.4 -323.2 -392.8 -519.5 -437.1 -505.7 -635.8 -772.1 Healthcare -280.2 -1,242.5 -1,587.4 -2,153.5 -3,264.7 -1,584.4 -2,426.0 -3,862.7 -4,127.4 -4,162.9 -5,045.8 -6,661.3 -5,572.5 -6,444.5 -8,098.3 -9,819.1 Education -43.2 -191.7 -244.9 -332.4 -503.6 -244.5 -374.4 -596.0 -636.8 -642.3 -778.6 -1,028.1 -860.1 -994.8 -1,250.1 -1,515.5 Administrative & Waste -22.9 -120.1 -146.3 -196.6 -284.4 -146.3 -214.8 -336.0 -359.5 -360.8 -453.7 -610.0 -543.4 -631.0 -798.7 -984.2 Management of Companies 0.0 -7.8 -6.8 -8.6 -7.3 -6.9 -6.8 -8.4 -9.2 -8.5 -17.1 -27.1 -36.6 -43.3 -56.9 -75.6 Professional & Technical Services -46.6 -238.4 -292.3 -393.7 -573.3 -292.3 -432.0 -677.4 -724.8 -728.1 -910.6 -1,221.1 -1,078.3 -1,251.4 -1,582.0 -1,944.6 Real Estate & Travel -239.7 -1,087.7 -1,382.6 -1,874.9 -2,822.1 -1,381.1 -2,104.0 -3,339.2 -3,569.2 -3,600.0 -4,384.1 -5,803.7 -4,897.4 -5,669.1 -7,127.8 -8,655.0 Finance & Insurance -101.9 -484.8 -607.9 -822.3 -1,221.3 -607.6 -914.8 -1,444.6 -1,544.7 -1,556.1 -1,914.6 -2,547.8 -2,189.4 -2,537.4 -3,197.0 -3,900.0 Information -38.7 -180.0 -226.8 -306.9 -459.3 -226.5 -342.8 -543.2 -580.7 -584.9 -716.1 -950.2 -809.5 -937.2 -1,180.3 -1,438.0 Transportation -26.2 -124.7 -156.5 -211.9 -314.3 -156.5 -235.7 -371.9 -397.7 -400.9 -493.3 -656.7 -564.5 -654.5 -824.3 -1,004.7 Retail -166.8 -742.0 -947.2 -1,284.8 -1,946.0 -945.5 -1,446.5 -2,302.4 -2,460.3 -2,481.2 -3,009.5 -3,974.4 -3,328.9 -3,850.1 -4,838.8 -5,869.0 Wholesale -71.6 -325.1 -413.2 -560.4 -843.2 -412.8 -628.6 -997.7 -1,066.4 -1,075.6 -1,310.1 -1,734.6 -1,464.3 -1,695.1 -2,131.4 -2,588.2 Manufacturing -24.4 -115.9 -146.0 -197.8 -293.8 -146.1 -220.4 -347.7 -371.9 -375.1 -460.9 -613.3 -525.8 -609.6 -767.3 -934.0 Construction -4.7 -26.4 -31.7 -42.6 -60.3 -31.8 -46.0 -71.3 -76.4 -76.7 -97.8 -132.5 -120.8 -140.5 -178.1 -220.0 Water -7.9 -35.8 -45.8 -62.1 -93.6 -45.7 -69.8 -110.8 -118.5 -119.6 -145.3 -192.3 -161.7 -187.2 -235.3 -285.2 Natural Gas -3.8 -17.7 -22.4 -30.3 -45.5 -22.4 -34.0 -53.7 -57.4 -57.9 -70.8 -93.9 -79.7 -92.2 -116.1 -141.2 Electric -24.2 -112.3 -142.2 -192.6 -287.9 -142.0 -215.4 -340.7 -364.3 -367.5 -449.6 -596.6 -507.6 -588.0 -739.8 -899.5 Mining 0.0 -4.1 -3.8 -4.8 -4.3 -3.9 -3.9 -5.0 -5.4 -5.2 -9.8 -15.2 -19.7 -23.3 -30.6 -40.4 Agriculture -2.4 -13.2 -18.7 -26.7 -36.5 -19.3 -30.1 -44.2 -47.7 -50.4 -62.0 -84.6 -73.4 -87.1 -106.7 -123.1 Annual Total -1,578.9 -7,184.8 -9,118.6 -12,358.8 -18,593.1 -9,106.6 -13,858.5 -21,997.2 -23,511.0 -23,706.3 -28,890.1 -38,252.8 -32,318.1 -37,407.5 -47,049.1 -57,169.2
Source: Authors’ Calculations
34 Annual totals may not tally exactly due to rounding-up.
18
Table 7: Estimated GDP Losses by Year & Sector without the Availability of CAP Water, 2002-201735
GROSS DOMESTIC PRODUCT (GDP) STATE LOSSES (Millions 2018 $)
2002 2003 2004 2005 2006 2007 2008 2009 2010 2011 2012 2013 2014 2015 2016 2017 Government -11,989.2 -14,720.1 -17,216.8 -15,475.5 -17,044.4 -19,142.4 -19,265.5 -18,985.7 -14,195.2 -14,577.5 -14,608.7 -15,239.0 -15,533.0 -15,961.4 -16,198.3 -17,619.4 Other Services -2,165.1 -2,652.8 -3,155.5 -2,778.2 -3,065.7 -3,481.9 -3,511.9 -3,430.5 -2,853.0 -2,937.7 -3,006.6 -3,154.4 -3,205.0 -3,263.1 -3,320.4 -3,559.3 Accommodation & Food -2,489.2 -3,053.4 -3,598.4 -3,204.7 -3,532.5 -3,987.3 -4,016.8 -3,943.0 -5,263.3 -5,407.9 -5,443.0 -5,684.0 -5,789.8 -5,938.4 -6,030.1 -6,538.9 Arts -802.0 -983.7 -1,160.4 -1,032.2 -1,137.9 -1,285.3 -1,294.9 -1,270.5 -1,382.5 -1,421.5 -1,452.1 -1,516.7 -1,541.3 -1,572.7 -1,603.1 -1,713.4 Healthcare -10,269.2 -12,609.1 -14,739.7 -13,257.7 -14,600.9 -16,392.3 -16,496.6 -16,261.5 -13,945.4 -14,311.1 -14,215.1 -14,814.7 -15,122.0 -15,592.1 -15,793.5 -17,313.0 Education -1,584.8 -1,945.6 -2,274.8 -2,045.5 -2,252.8 -2,529.6 -2,545.7 -2,509.0 -1,763.5 -1,810.1 -1,801.4 -1,877.9 -1,916.3 -1,974.3 -2,000.5 -2,189.6 Administrative & Waste -957.1 -1,161.0 -1,497.2 -1,192.4 -1,328.6 -1,595.0 -1,625.1 -1,521.7 -757.5 -807.6 -1,133.5 -1,234.6 -1,204.0 -1,095.7 -1,179.6 -961.7 Management of Companies -48.9 -54.3 -122.0 -45.3 -56.2 -106.3 -115.5 -80.3 -31.8 -48.2 -218.9 -255.7 -231.9 -164.0 -202.1 -50.5 Professional & Technical Services -1,910.2 -2,320.5 -2,951.3 -2,391.4 -2,659.8 -3,162.5 -3,216.7 -3,033.6 -11,350.4 -11,630.9 -12,524.7 -12,817.4 -12,908.3 -13,024.3 -13,603.9 -13,463.0 Real Estate & Travel -8,960.6 -10,975.9 -13,003.2 -11,504.4 -12,688.8 -14,372.5 -14,488.2 -14,177.6 -14,472.6 -14,888.4 -15,401.0 -16,077.4 -16,305.0 -16,567.5 -16,948.1 -17,877.6 Finance & Insurance -3,952.9 -4,824.6 -5,881.5 -5,023.2 -5,558.6 -6,418.8 -6,494.1 -6,260.3 -3,865.1 -4,014.8 -4,531.3 -4,805.4 -4,812.7 -4,724.5 -4,902.2 -4,824.3 Information -1,472.1 -1,801.4 -2,167.3 -1,881.6 -2,078.9 -2,379.5 -2,403.5 -2,334.0 -1,834.2 -1,887.5 -2,006.4 -2,087.1 -2,107.4 -2,124.2 -2,192.6 -2,241.2 Transportation -1,018.1 -1,241.5 -1,513.8 -1,292.5 -1,430.3 -1,651.7 -1,671.0 -1,610.2 -1,636.9 -1,697.2 -1,909.5 -2,015.5 -2,019.0 -1,986.7 -2,064.9 -2,026.4 Retail -6,129.0 -7,523.6 -8,812.2 -7,907.2 -8,710.2 -9,791.6 -9,856.4 -9,706.0 -9,128.4 -9,368.3 -9,417.7 -9,796.9 -9,980.2 -10,254.1 -10,429.2 -11,276.4 Wholesale -2,678.3 -3,280.3 -3,888.8 -3,437.8 -3,792.0 -4,297.0 -4,331.9 -4,237.5 -4,431.7 -4,558.1 -4,827.7 -5,017.8 -5,069.2 -5,115.6 -5,277.3 -5,407.7 Manufacturing -949.4 -1,157.6 -1,405.1 -1,206.3 -1,334.2 -1,535.9 -1,553.0 -1,499.5 -3,936.7 -4,046.2 -4,298.0 -4,454.0 -4,497.1 -4,538.8 -4,693.0 -4,779.0 Construction -208.7 -251.3 -335.0 -255.9 -286.3 -351.8 -359.8 -330.8 -21,270.1 -21,669.4 -22,243.9 -22,468.3 -22,790.9 -23,483.7 -24,376.5 -24,990.6 Water -296.4 -363.1 -427.8 -381.0 -420.0 -474.0 -477.5 -468.5 -373.6 -384.5 -394.5 -413.1 -419.5 -426.9 -435.0 -464.1 Natural Gas -145.1 -177.5 -212.3 -185.7 -205.0 -233.6 -235.8 -229.6 -104.4 -107.9 -115.8 -122.0 -123.1 -123.1 -126.5 -130.1 Electric -922.5 -1,127.4 -1,352.4 -1,178.2 -1,301.3 -1,486.3 -1,500.7 -1,458.4 -729.7 -764.4 -929.4 -996.0 -987.7 -943.5 -991.5 -916.6 Mining -26.9 -30.0 -64.8 -25.5 -31.4 -57.2 -61.7 -43.8 -329.6 -340.9 -405.2 -420.4 -417.5 -405.7 -431.6 -391.2 Agriculture -124.0 -142.9 -172.2 -148.0 -163.5 -186.8 -188.2 -177.4 -101.6 -105.6 -123.8 -131.8 -131.1 -125.8 -131.4 -123.6 Annual Total -59,099.7 -72,398.3 -85,951.9 -75,850.2 -83,679.6 -94,918.6 -95,710.7 -93,569.7 -113,757.3 -116,785.7 -121,008.1 -125,400.1 -127,112.2 -129,406.4 -132,931.3 -138,857.5
Source: Authors’ Calculations
35 Annual totals may not tally exactly due to rounding-up.
19
Table 8: Estimated Employment Losses by Year & Sector without the Availability of CAP Water, 1986-200136
ESTIMATED EMPLOYMENT LOSSES (Job Years)
1986 1987 1988 1989 1990 1991 1992 1993 1994 1995 1996 1997 1998 1999 2000 2001 Government -3,503 -15,544 -19,854 -26,934 -40,821 -19,818 -30,336 -48,299 -51,609 -52,052 -63,103 -83,315 -69,720 -80,631 -101,327 -122,870 Other Services -867 -3,955 -5,012 -6,789 -10,211 -5,004 -7,608 -12,078 -12,909 -13,011 -15,866 -21,010 -17,770 -20,566 -25,876 -31,465 Accommodation & Food -1,165 -5,234 -6,661 -9,030 -13,640 -6,649 -10,148 -16,137 -17,244 -17,386 -21,132 -27,938 -23,490 -27,175 -34,169 -41,487 Arts -416 -1,872 -2,382 -3,229 -4,875 -2,378 -3,628 -5,767 -6,163 -6,214 -7,555 -9,990 -8,405 -9,724 -12,228 -14,848 Healthcare -3,558 -15,778 -20,158 -27,347 -41,457 -20,120 -30,806 -49,052 -52,412 -52,864 -64,075 -84,590 -70,764 -81,837 -102,838 -124,691 Education -680 -3,016 -3,854 -5,228 -7,924 -3,847 -5,889 -9,376 -10,018 -10,106 -12,250 -16,173 -13,532 -15,650 -19,666 -23,843 Administrative & Waste -375 -1,970 -2,397 -3,223 -4,662 -2,397 -3,520 -5,506 -5,892 -5,914 -7,436 -9,998 -8,907 -10,341 -13,090 -16,131 Management of Companies 0 -85 -75 -94 -80 -76 -75 -92 -101 -93 -188 -298 -402 -476 -625 -831 Professional & Technical Services -542 -2,773 -3,401 -4,580 -6,669 -3,401 -5,026 -7,880 -8,431 -8,471 -10,592 -14,205 -12,543 -14,557 -18,404 -22,620 Real Estate & Travel -1,769 -8,027 -10,205 -13,838 -20,828 -10,193 -15,528 -24,645 -26,343 -26,570 -32,357 -42,835 -36,145 -41,840 -52,607 -63,878 Finance & Insurance -1,112 -5,293 -6,636 -8,977 -13,332 -6,633 -9,986 -15,769 -16,862 -16,986 -20,900 -27,812 -23,900 -27,698 -34,898 -42,572 Information -363 -1,684 -2,122 -2,871 -4,297 -2,119 -3,207 -5,081 -5,432 -5,471 -6,699 -8,889 -7,572 -8,767 -11,041 -13,452 Transportation -310 -1,480 -1,858 -2,515 -3,730 -1,858 -2,798 -4,413 -4,720 -4,758 -5,855 -7,794 -6,700 -7,768 -9,783 -11,925 Retail -2,297 -10,218 -13,043 -17,692 -26,796 -13,019 -19,918 -31,704 -33,877 -34,166 -41,440 -54,727 -45,838 -53,016 -66,630 -80,814 Wholesale -638 -2,897 -3,682 -4,993 -7,512 -3,678 -5,602 -8,889 -9,501 -9,583 -11,673 -15,455 -13,047 -15,103 -18,990 -23,061 Manufacturing -227 -1,074 -1,354 -1,834 -2,724 -1,354 -2,044 -3,223 -3,448 -3,478 -4,273 -5,686 -4,874 -5,652 -7,113 -8,658 Construction -60 -337 -406 -545 -771 -406 -589 -911 -976 -980 -1,250 -1,694 -1,543 -1,796 -2,276 -2,811 Water -72 -322 -411 -558 -841 -411 -627 -995 -1,064 -1,074 -1,305 -1,727 -1,453 -1,682 -2,113 -2,561 Natural Gas -29 -136 -172 -233 -349 -172 -261 -413 -441 -445 -544 -721 -612 -709 -892 -1,084 Electric -138 -642 -812 -1,101 -1,646 -812 -1,231 -1,947 -2,082 -2,100 -2,569 -3,410 -2,901 -3,361 -4,228 -5,141 Mining 0 -28 -25 -32 -29 -26 -27 -34 -37 -35 -65 -102 -132 -157 -205 -271 Agriculture -30 -168 -237 -338 -462 -245 -380 -559 -604 -637 -785 -1,071 -928 -1,103 -1,351 -1,557 Annual Total -18,151 -82,535 -104,755 -141,978 -213,656 -104,615 -159,232 -252,772 -270,166 -272,394 -331,913 -439,440 -371,180 -429,610 -540,349 -656,573
Source: Authors’ Calculations
36 Annual totals may not tally exactly due to rounding-up.
20
Table 9: Estimated Employment Losses by Year & Sector without the Availability of CAP Water, 2002-201737
ESTIMATED EMPLOYMENT LOSSES (Job Years)
2002 2003 2004 2005 2006 2007 2008 2009 2010 2011 2012 2013 2014 2015 2016 2017 Government -128,450 -157,708 -184,456 -165,801 -182,610 -205,087 -206,407 -203,409 -152,696 -156,808 -157,144 -163,923 -167,086 -171,695 -174,243 -189,529 Other Services -32,485 -39,801 -47,344 -41,683 -45,996 -52,242 -52,691 -51,471 -45,015 -46,351 -47,439 -49,770 -50,568 -51,486 -52,389 -56,158 Accommodation & Food -43,129 -52,905 -62,346 -55,525 -61,205 -69,085 -69,597 -68,317 -92,188 -94,720 -95,334 -99,556 -101,410 -104,012 -105,618 -114,530 Arts -15,425 -18,919 -22,316 -19,851 -21,884 -24,718 -24,904 -24,433 -21,725 -22,339 -22,820 -23,835 -24,221 -24,715 -25,192 -26,926 Healthcare -130,405 -160,118 -187,175 -168,355 -185,412 -208,160 -209,486 -206,500 -177,133 -181,778 -180,559 -188,175 -192,078 -198,049 -200,607 -219,908 Education -24,931 -30,608 -35,788 -32,180 -35,442 -39,795 -40,050 -39,473 -29,749 -30,534 -30,387 -31,678 -32,325 -33,304 -33,746 -36,935 Administrative & Waste -15,685 -19,028 -24,537 -19,542 -21,774 -26,140 -26,635 -24,940 -11,475 -12,234 -17,170 -18,703 -18,239 -16,599 -17,869 -14,568 Management of Companies -538 -596 -1,340 -497 -618 -1,169 -1,268 -882 -322 -488 -2,215 -2,587 -2,347 -1,660 -2,045 -511 Professional & Technical Services -22,221 -26,993 -34,332 -27,818 -30,941 -36,788 -37,419 -35,288 -131,377 -134,624 -144,969 -148,357 -149,409 -150,752 -157,461 -155,829 Real Estate & Travel -66,134 -81,008 -95,970 -84,908 -93,650 -106,076 -106,930 -104,638 -105,227 -108,250 -111,977 -116,895 -118,550 -120,459 -123,226 -129,984 Finance & Insurance -43,150 -52,665 -64,203 -54,833 -60,678 -70,068 -70,889 -68,337 -41,174 -42,768 -48,271 -51,191 -51,268 -50,329 -52,222 -51,392 Information -13,772 -16,851 -20,274 -17,602 -19,448 -22,259 -22,484 -21,833 -16,646 -17,130 -18,209 -18,941 -19,126 -19,278 -19,899 -20,340 Transportation -12,083 -14,736 -17,966 -15,340 -16,975 -19,603 -19,833 -19,110 -19,083 -19,787 -22,262 -23,498 -23,539 -23,162 -24,073 -23,625 Retail -84,395 -103,600 -121,343 -108,881 -119,938 -134,829 -135,721 -133,650 -120,278 -123,439 -124,089 -129,086 -131,501 -135,111 -137,418 -148,581 Wholesale -23,864 -29,228 -34,648 -30,630 -33,786 -38,286 -38,597 -37,756 -37,300 -38,364 -40,633 -42,233 -42,665 -43,056 -44,417 -45,515 Manufacturing -8,801 -10,732 -13,026 -11,183 -12,369 -14,239 -14,397 -13,901 -35,173 -36,151 -38,401 -39,795 -40,181 -40,553 -41,930 -42,699 Construction -2,667 -3,212 -4,281 -3,270 -3,659 -4,495 -4,599 -4,226 -243,310 -247,877 -254,450 -257,016 -260,706 -268,632 -278,844 -285,869 Water -2,662 -3,261 -3,843 -3,422 -3,772 -4,257 -4,288 -4,207 -2,953 -3,039 -3,118 -3,265 -3,316 -3,374 -3,438 -3,668 Natural Gas -1,115 -1,363 -1,630 -1,426 -1,574 -1,794 -1,811 -1,763 -916 -947 -1,015 -1,070 -1,080 -1,080 -1,110 -1,141 Electric -5,272 -6,443 -7,729 -6,734 -7,437 -8,495 -8,576 -8,335 -4,222 -4,422 -5,377 -5,762 -5,715 -5,459 -5,736 -5,303 Mining -180 -201 -434 -171 -210 -383 -414 -294 -2,776 -2,871 -3,413 -3,541 -3,517 -3,417 -3,635 -3,295 Agriculture -1,571 -1,809 -2,180 -1,874 -2,071 -2,365 -2,383 -2,247 -1,443 -1,498 -1,757 -1,870 -1,861 -1,786 -1,865 -1,754 Annual Total -678,934 -831,787 -987,163 -871,524 -961,449 -1,090,333 -1,099,379 -1,075,010 -1,292,179 -1,326,420 -1,371,008 -1,420,747 -1,440,707 -1,467,964 -1,506,983 -1,578,059
Source: Authors’ Calculations
37 Annual totals may not tally exactly due to rounding-up.
21
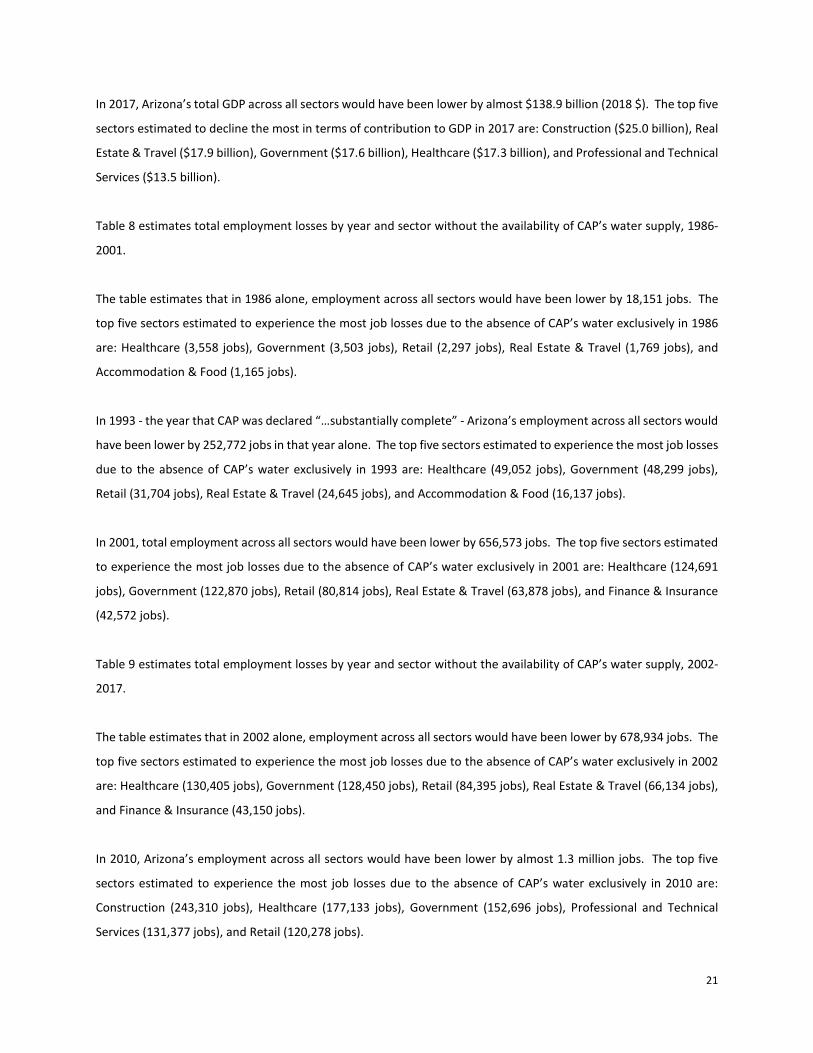
In 2017, Arizona’s total GDP across all sectors would have been lower by almost $138.9 billion (2018 $). The top five
sectors estimated to decline the most in terms of contribution to GDP in 2017 are: Construction ($25.0 billion), Real
Estate & Travel ($17.9 billion), Government ($17.6 billion), Healthcare ($17.3 billion), and Professional and Technical
Services ($13.5 billion).
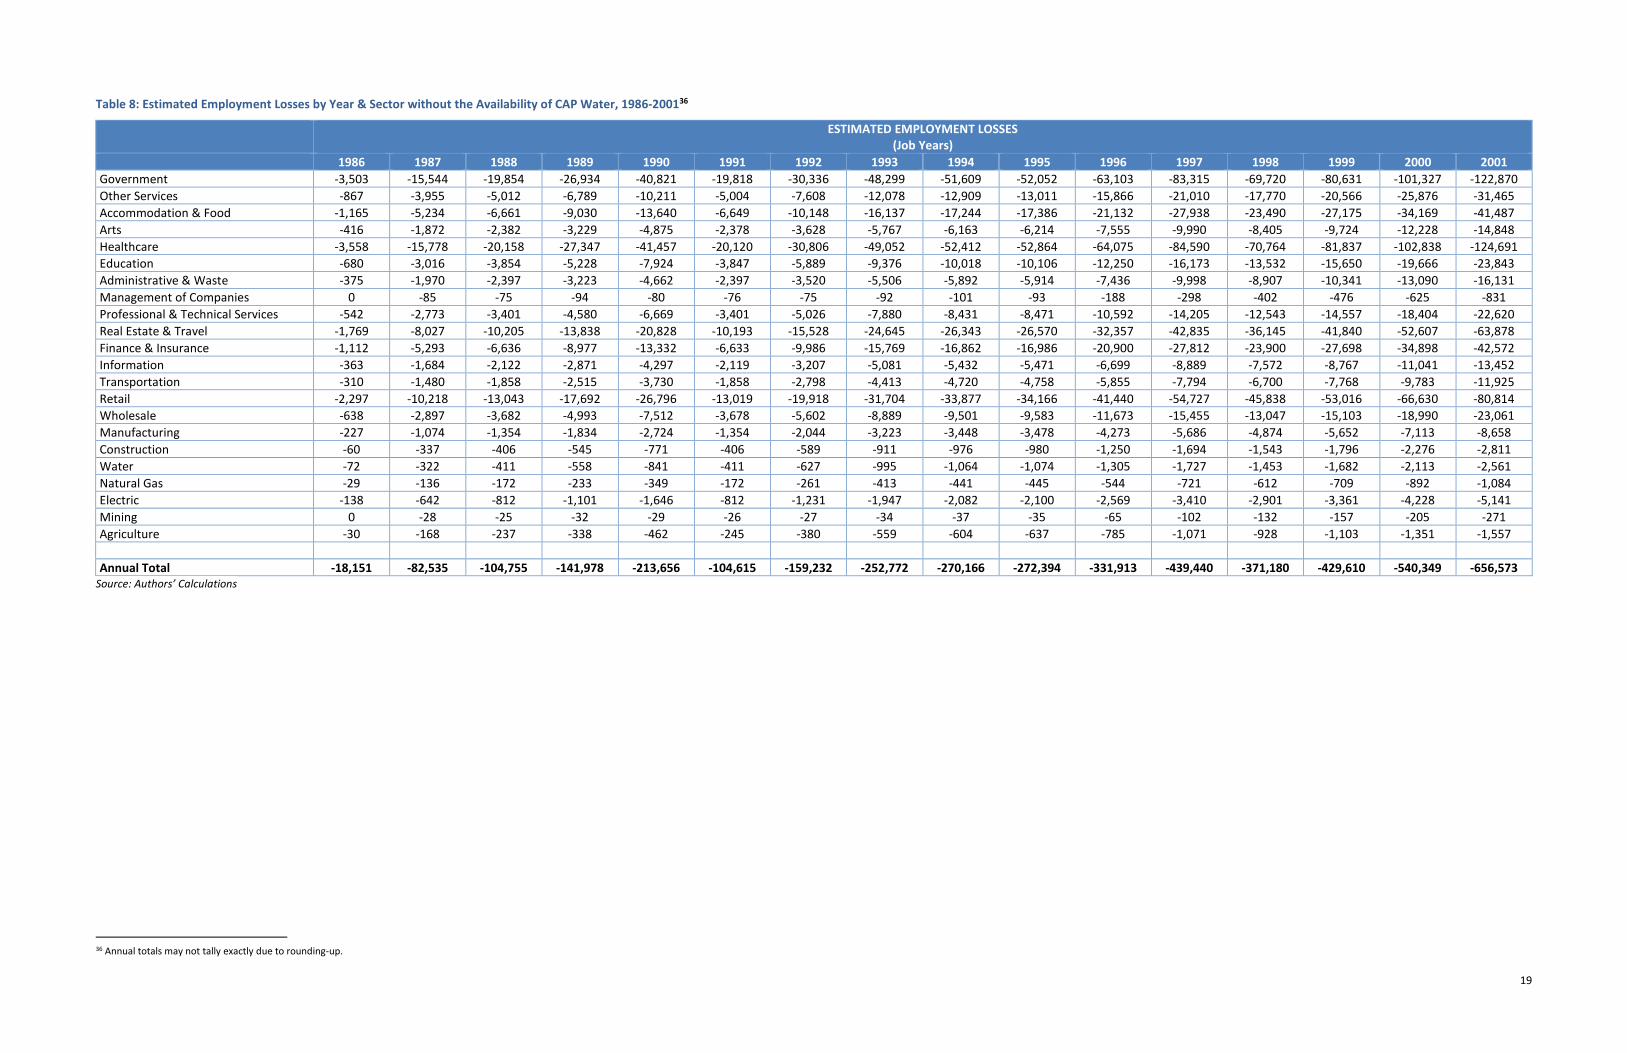
Table 8 estimates total employment losses by year and sector without the availability of CAP’s water supply, 1986-
2001.
The table estimates that in 1986 alone, employment across all sectors would have been lower by 18,151 jobs. The
top five sectors estimated to experience the most job losses due to the absence of CAP’s water exclusively in 1986
are: Healthcare (3,558 jobs), Government (3,503 jobs), Retail (2,297 jobs), Real Estate & Travel (1,769 jobs), and
Accommodation & Food (1,165 jobs).
In 1993 - the year that CAP was declared “…substantially complete” - Arizona’s employment across all sectors would
have been lower by 252,772 jobs in that year alone. The top five sectors estimated to experience the most job losses
due to the absence of CAP’s water exclusively in 1993 are: Healthcare (49,052 jobs), Government (48,299 jobs),
Retail (31,704 jobs), Real Estate & Travel (24,645 jobs), and Accommodation & Food (16,137 jobs).
In 2001, total employment across all sectors would have been lower by 656,573 jobs. The top five sectors estimated
to experience the most job losses due to the absence of CAP’s water exclusively in 2001 are: Healthcare (124,691
jobs), Government (122,870 jobs), Retail (80,814 jobs), Real Estate & Travel (63,878 jobs), and Finance & Insurance
(42,572 jobs).
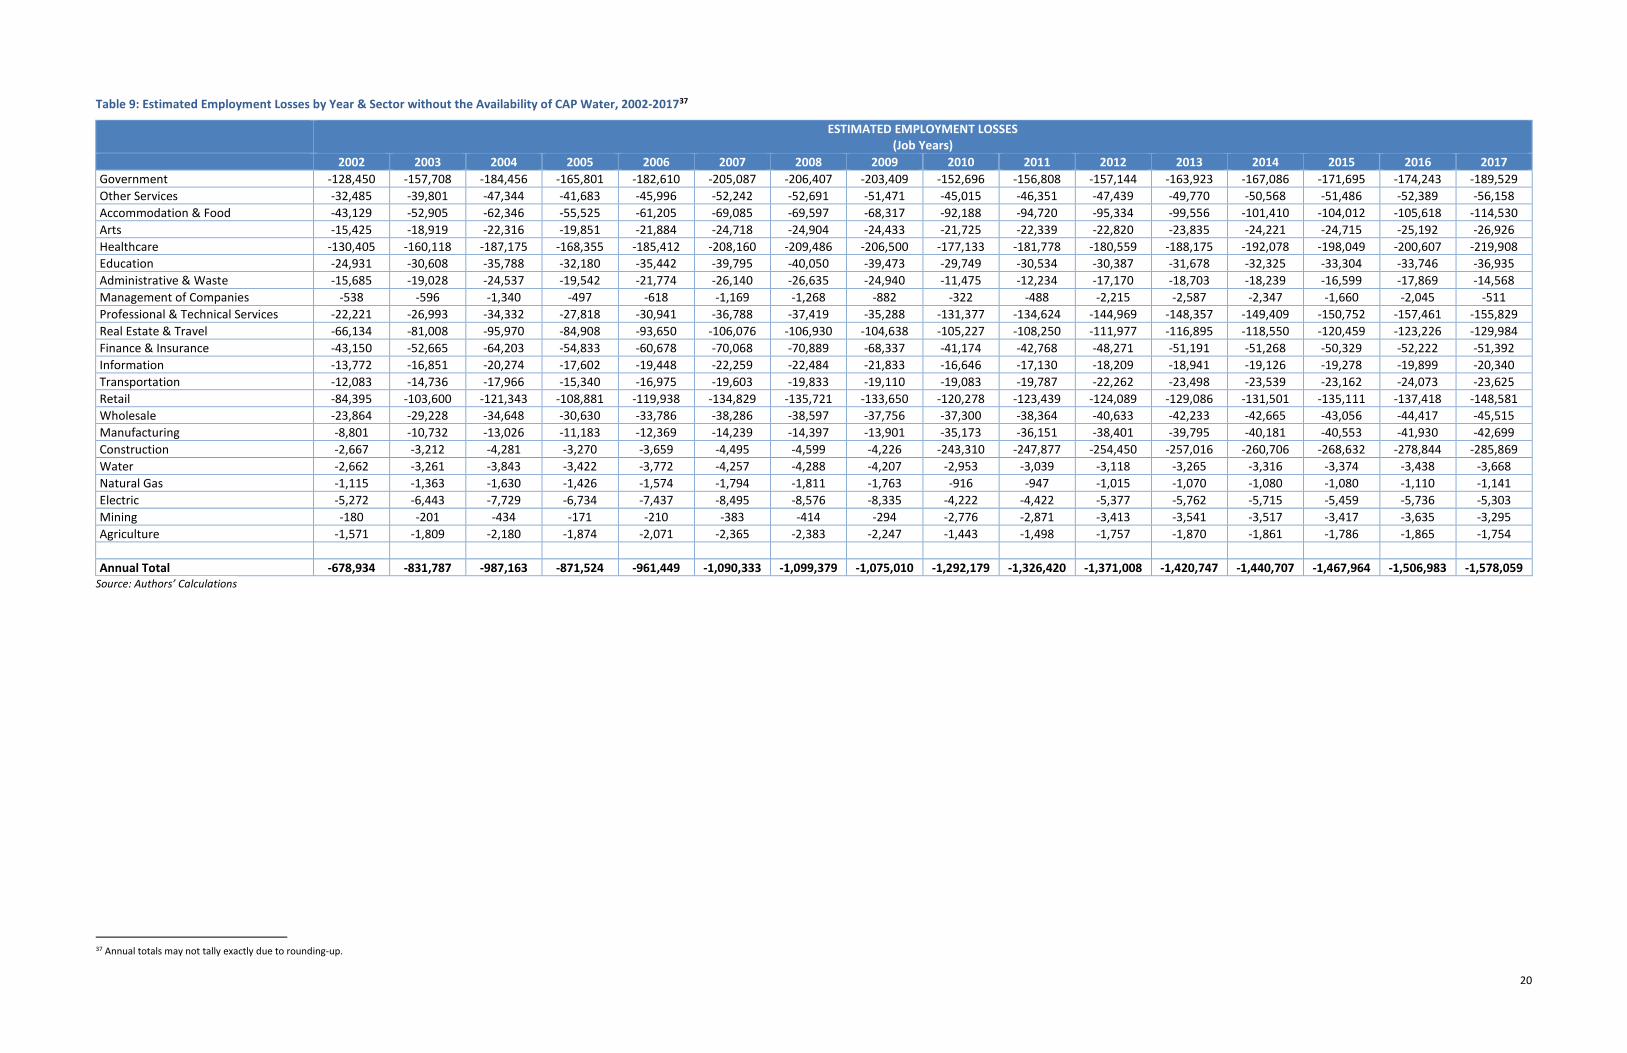
Table 9 estimates total employment losses by year and sector without the availability of CAP’s water supply, 2002-
2017.
The table estimates that in 2002 alone, employment across all sectors would have been lower by 678,934 jobs. The
top five sectors estimated to experience the most job losses due to the absence of CAP’s water exclusively in 2002
are: Healthcare (130,405 jobs), Government (128,450 jobs), Retail (84,395 jobs), Real Estate & Travel (66,134 jobs),
and Finance & Insurance (43,150 jobs).
In 2010, Arizona’s employment across all sectors would have been lower by almost 1.3 million jobs. The top five
sectors estimated to experience the most job losses due to the absence of CAP’s water exclusively in 2010 are:
Construction (243,310 jobs), Healthcare (177,133 jobs), Government (152,696 jobs), Professional and Technical
Services (131,377 jobs), and Retail (120,278 jobs).
22
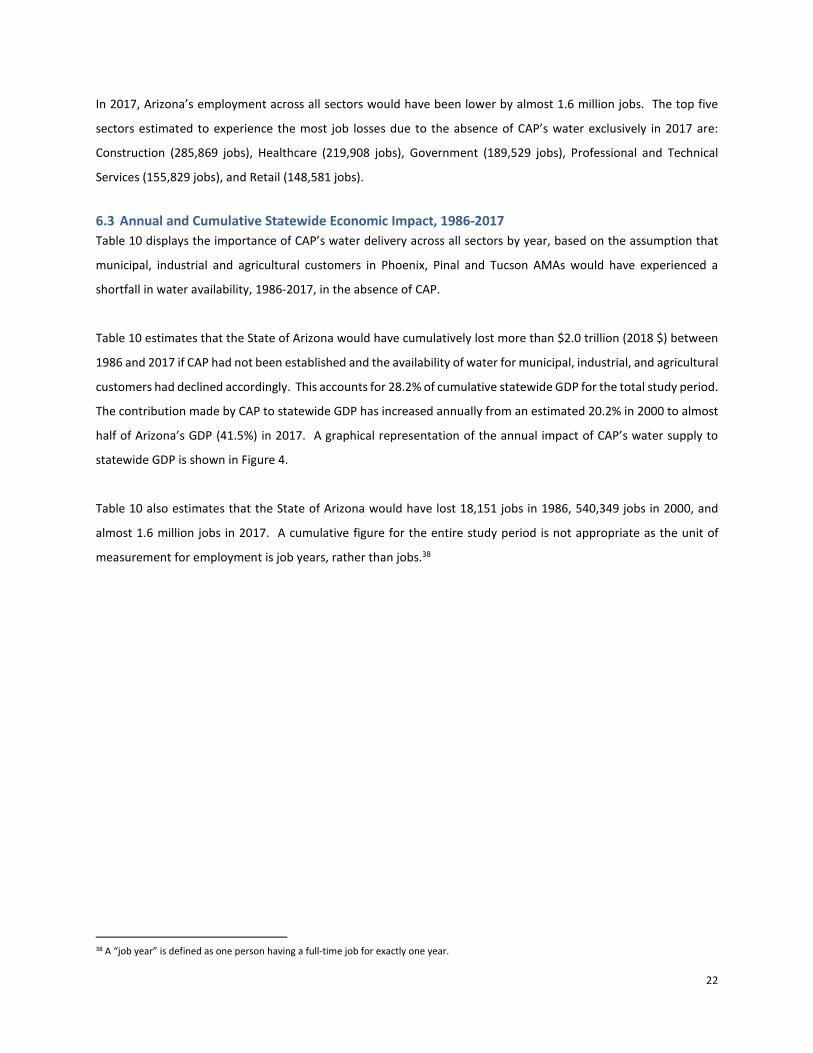
In 2017, Arizona’s employment across all sectors would have been lower by almost 1.6 million jobs. The top five
sectors estimated to experience the most job losses due to the absence of CAP’s water exclusively in 2017 are:
Construction (285,869 jobs), Healthcare (219,908 jobs), Government (189,529 jobs), Professional and Technical
Services (155,829 jobs), and Retail (148,581 jobs).
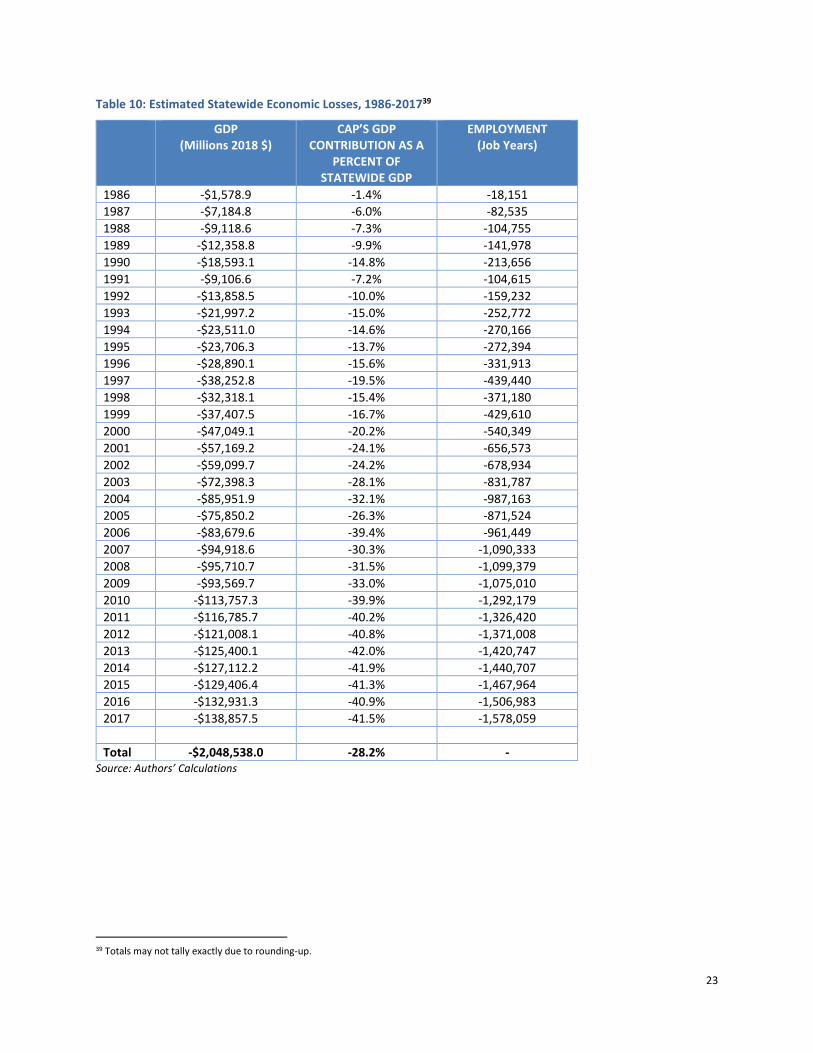
6.3 Annual and Cumulative Statewide Economic Impact, 1986-2017 Table 10 displays the importance of CAP’s water delivery across all sectors by year, based on the assumption that
municipal, industrial and agricultural customers in Phoenix, Pinal and Tucson AMAs would have experienced a
shortfall in water availability, 1986-2017, in the absence of CAP.
Table 10 estimates that the State of Arizona would have cumulatively lost more than $2.0 trillion (2018 $) between
1986 and 2017 if CAP had not been established and the availability of water for municipal, industrial, and agricultural
customers had declined accordingly. This accounts for 28.2% of cumulative statewide GDP for the total study period.
The contribution made by CAP to statewide GDP has increased annually from an estimated 20.2% in 2000 to almost
half of Arizona’s GDP (41.5%) in 2017. A graphical representation of the annual impact of CAP’s water supply to
statewide GDP is shown in Figure 4.
Table 10 also estimates that the State of Arizona would have lost 18,151 jobs in 1986, 540,349 jobs in 2000, and
almost 1.6 million jobs in 2017. A cumulative figure for the entire study period is not appropriate as the unit of
measurement for employment is job years, rather than jobs.38
38 A “job year” is defined as one person having a full-time job for exactly one year.
23
Table 10: Estimated Statewide Economic Losses, 1986-201739
GDP (Millions 2018 $)
CAP’S GDP CONTRIBUTION AS A
PERCENT OF STATEWIDE GDP
EMPLOYMENT (Job Years)
1986 -$1,578.9 -1.4% -18,151 1987 -$7,184.8 -6.0% -82,535 1988 -$9,118.6 -7.3% -104,755 1989 -$12,358.8 -9.9% -141,978 1990 -$18,593.1 -14.8% -213,656 1991 -$9,106.6 -7.2% -104,615 1992 -$13,858.5 -10.0% -159,232 1993 -$21,997.2 -15.0% -252,772 1994 -$23,511.0 -14.6% -270,166 1995 -$23,706.3 -13.7% -272,394 1996 -$28,890.1 -15.6% -331,913 1997 -$38,252.8 -19.5% -439,440 1998 -$32,318.1 -15.4% -371,180 1999 -$37,407.5 -16.7% -429,610 2000 -$47,049.1 -20.2% -540,349 2001 -$57,169.2 -24.1% -656,573 2002 -$59,099.7 -24.2% -678,934 2003 -$72,398.3 -28.1% -831,787 2004 -$85,951.9 -32.1% -987,163 2005 -$75,850.2 -26.3% -871,524 2006 -$83,679.6 -39.4% -961,449 2007 -$94,918.6 -30.3% -1,090,333 2008 -$95,710.7 -31.5% -1,099,379 2009 -$93,569.7 -33.0% -1,075,010 2010 -$113,757.3 -39.9% -1,292,179 2011 -$116,785.7 -40.2% -1,326,420 2012 -$121,008.1 -40.8% -1,371,008 2013 -$125,400.1 -42.0% -1,420,747 2014 -$127,112.2 -41.9% -1,440,707 2015 -$129,406.4 -41.3% -1,467,964 2016 -$132,931.3 -40.9% -1,506,983 2017 -$138,857.5 -41.5% -1,578,059 Total -$2,048,538.0 -28.2% -
Source: Authors’ Calculations
39 Totals may not tally exactly due to rounding-up.
24
Figure 4: CAP’s Contribution to Statewide GDP, 1986-2017
Source: Authors’ Calculations
$0
$50
$100
$150
$200
$250
$300
$350
$400An
nual
GDP
(Bill
ions
201
8 $
)
Year
CAP'S Annual GDP Contribution Balance of Arizona's Annual GDP
25
7. ECONOMIC IMPACT OF INHOUSE OPERATIONS, 2011-2017
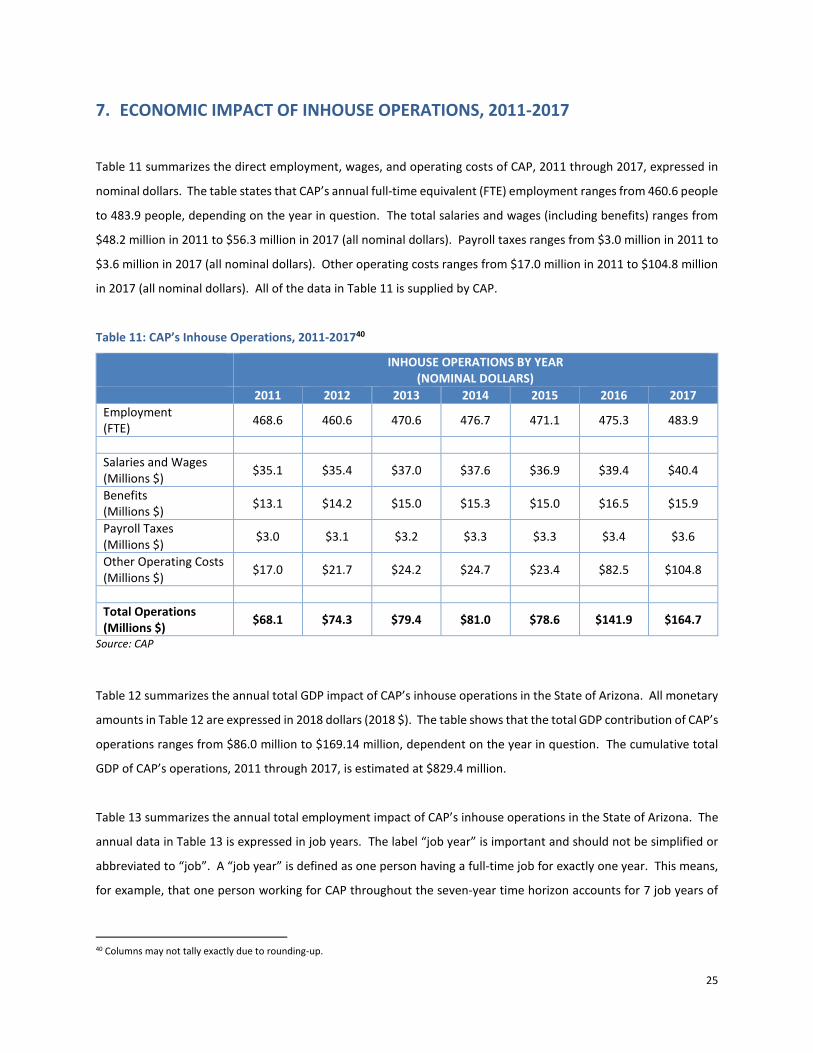
Table 11 summarizes the direct employment, wages, and operating costs of CAP, 2011 through 2017, expressed in
nominal dollars. The table states that CAP’s annual full-time equivalent (FTE) employment ranges from 460.6 people
to 483.9 people, depending on the year in question. The total salaries and wages (including benefits) ranges from
$48.2 million in 2011 to $56.3 million in 2017 (all nominal dollars). Payroll taxes ranges from $3.0 million in 2011 to
$3.6 million in 2017 (all nominal dollars). Other operating costs ranges from $17.0 million in 2011 to $104.8 million
in 2017 (all nominal dollars). All of the data in Table 11 is supplied by CAP.
Table 11: CAP’s Inhouse Operations, 2011-201740
INHOUSE OPERATIONS BY YEAR (NOMINAL DOLLARS)
2011 2012 2013 2014 2015 2016 2017 Employment (FTE) 468.6 460.6 470.6 476.7 471.1 475.3 483.9
Salaries and Wages (Millions $) $35.1 $35.4 $37.0 $37.6 $36.9 $39.4 $40.4
Benefits (Millions $) $13.1 $14.2 $15.0 $15.3 $15.0 $16.5 $15.9
Payroll Taxes (Millions $) $3.0 $3.1 $3.2 $3.3 $3.3 $3.4 $3.6
Other Operating Costs (Millions $) $17.0 $21.7 $24.2 $24.7 $23.4 $82.5 $104.8
Total Operations (Millions $) $68.1 $74.3 $79.4 $81.0 $78.6 $141.9 $164.7
Source: CAP
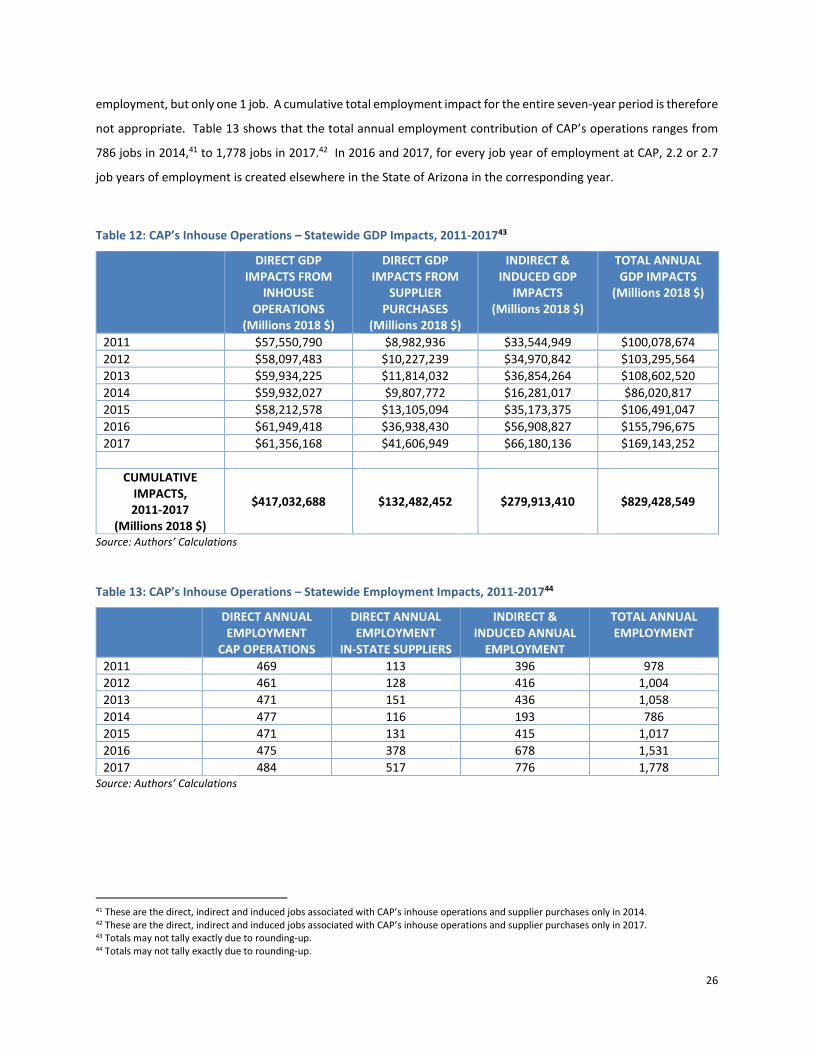
Table 12 summarizes the annual total GDP impact of CAP’s inhouse operations in the State of Arizona. All monetary
amounts in Table 12 are expressed in 2018 dollars (2018 $). The table shows that the total GDP contribution of CAP’s
operations ranges from $86.0 million to $169.14 million, dependent on the year in question. The cumulative total
GDP of CAP’s operations, 2011 through 2017, is estimated at $829.4 million.
Table 13 summarizes the annual total employment impact of CAP’s inhouse operations in the State of Arizona. The
annual data in Table 13 is expressed in job years. The label “job year” is important and should not be simplified or
abbreviated to “job”. A “job year” is defined as one person having a full-time job for exactly one year. This means,
for example, that one person working for CAP throughout the seven-year time horizon accounts for 7 job years of
40 Columns may not tally exactly due to rounding-up.
26
employment, but only one 1 job. A cumulative total employment impact for the entire seven-year period is therefore
not appropriate. Table 13 shows that the total annual employment contribution of CAP’s operations ranges from
786 jobs in 2014,41 to 1,778 jobs in 2017.42 In 2016 and 2017, for every job year of employment at CAP, 2.2 or 2.7
job years of employment is created elsewhere in the State of Arizona in the corresponding year.
Table 12: CAP’s Inhouse Operations – Statewide GDP Impacts, 2011-201743
DIRECT GDP IMPACTS FROM
INHOUSE OPERATIONS
(Millions 2018 $)
DIRECT GDP IMPACTS FROM
SUPPLIER PURCHASES
(Millions 2018 $)
INDIRECT & INDUCED GDP
IMPACTS (Millions 2018 $)
TOTAL ANNUAL GDP IMPACTS
(Millions 2018 $)
2011 $57,550,790 $8,982,936 $33,544,949 $100,078,674 2012 $58,097,483 $10,227,239 $34,970,842 $103,295,564 2013 $59,934,225 $11,814,032 $36,854,264 $108,602,520 2014 $59,932,027 $9,807,772 $16,281,017 $86,020,817 2015 $58,212,578 $13,105,094 $35,173,375 $106,491,047 2016 $61,949,418 $36,938,430 $56,908,827 $155,796,675 2017 $61,356,168 $41,606,949 $66,180,136 $169,143,252
CUMULATIVE IMPACTS, 2011-2017
(Millions 2018 $)
$417,032,688 $132,482,452 $279,913,410 $829,428,549
Source: Authors’ Calculations
Table 13: CAP’s Inhouse Operations – Statewide Employment Impacts, 2011-201744
DIRECT ANNUAL EMPLOYMENT
CAP OPERATIONS
DIRECT ANNUAL EMPLOYMENT
IN-STATE SUPPLIERS
INDIRECT & INDUCED ANNUAL
EMPLOYMENT
TOTAL ANNUAL EMPLOYMENT
2011 469 113 396 978 2012 461 128 416 1,004 2013 471 151 436 1,058 2014 477 116 193 786 2015 471 131 415 1,017 2016 475 378 678 1,531 2017 484 517 776 1,778
Source: Authors’ Calculations
41 These are the direct, indirect and induced jobs associated with CAP’s inhouse operations and supplier purchases only in 2014. 42 These are the direct, indirect and induced jobs associated with CAP’s inhouse operations and supplier purchases only in 2017. 43 Totals may not tally exactly due to rounding-up. 44 Totals may not tally exactly due to rounding-up.
27
8. CONCLUSIONS
The purpose of this study has been to calculate the economic impact of CAP for the State of Arizona, assessed in
terms of GDP by State and employment, in three aspects:
• The construction of CAP, 1973-1993;
• The impact of CAP’s water supply delivery operations, 1986-2017; and
• The impact of CAP’s inhouse operations, 2011-2017.
The total field project costs used in the construction analysis are $3.3 billion (nominal $).
Seidman estimates that the construction of CAP cumulatively generates approximately $2.6 billion GDP between
1973 and 1993 (2018 $). It also estimates annual employment impacts of up to 9,412 job years, dependent on the
year in question.
The statewide GDP contribution resulting from the construction of CAP is equivalent to 0.13% of Arizona’s
cumulative GDP, 1973-1993.
The construction sector is the primary direct beneficiary during the construction of CAP.
Seidman also estimates the impact of the loss of 19.9 million acre-feet of water delivered by CAP to municipal,
industrial and agricultural customers in Phoenix, Pima, and Tucson AMAs, 1986-2017.
Central to this analysis is an assumption that CAP’s annual water deliveries would not have been sourced elsewhere.
The water supply analysis estimates that the State of Arizona’s GDP would have been cumulatively lower by
approximately $2.0 trillion (2018 $) between 1986 and 2017, if CAP had not been established, and the availability of
water for municipal, industrial, and agricultural customers had declined accordingly. This represents a loss of
approximately 28.2% of cumulative statewide GDP throughout the study period.
Seidman also estimates that the annual importance of CAP’s water supply to statewide GDP is greater than 40%
from 2011 onwards.

28
The top five sectors estimated to decline the most in terms of contribution to GDP if CAP’s water supply had been
unavailable to customers during the 1986-2017 study period are: Government ($335.2 billion), Healthcare ($302.1
billion), Real Estate & Travel ($286.6 billion), Retail ($187.9 billion), and Construction ($187.0 billion).
Annual employment losses of 18,151 to approximately 1.6 million jobs, dependent on the year in question, would
also have occurred if CAP’s water supply had been unavailable during the 1986-2017 study period. Over 60 percent
of these job losses would have occurred in the Healthcare, Government, Retail, Construction, and Real Estate &
Travel sectors.
Seidman’s water supply analysis therefore demonstrates the growing importance of CAP for the State of Arizona
economy. CAP’s establishment and subsequent delivery of water to municipal, industrial, and agricultural customers
in the three central AMAs has had a crucial impact on the economic development of the state.
Without the availability of water from CAP, the economic development of the State would almost certainly have
followed a different trajectory.
It is important to note that Seidman’s estimated economic value of CAP’s water delivery has not taken into account
any leisure benefits associated with CAP, such as the 10,000-acre Lake Pleasant Park, the Reach 11 recreation area
in Phoenix, or the TPC golf course and Westworld in Scottsdale. The inclusion of leisure would in all probability
increase the estimated economic value of CAP’s water delivery in the State of Arizona, 1986 through 2017.
The direct, indirect and induced effects of the staff and suppliers needed to operate and maintain CAP are also
excluded from Seidman’s estimated economic value of water delivery. Between 2011 and 2017, annual inhouse
employment at CAP ranges from 461 to 484 people, dependent on the year in question. The total annual
employment contribution of CAP’s operations ranges from 786 jobs in 2014,45 to 1,778 jobs in 2017.46 The
cumulative GDP contribution of CAP’s inhouse operations for the same seven-year time horizon is $829.4 million.
The inclusion of CAP’s inhouse staff and supplier purchases will therefore also increase the estimated economic
value of water delivery in the State of Arizona.
45 These are the direct, indirect and induced jobs associated with CAP’s inhouse operations and supplier purchases only in 2014. 46 These are the direct, indirect and induced jobs associated with CAP’s inhouse operations and supplier purchases only in 2017.
29
APPENDIX - IMPLAN
IMPLAN is a commercially-licensed input-output model that combines a set of extensive databases, economic
factors, multipliers, and demographic statistics with a highly refined and customizable modeling system.
IMPLAN’s sectoring scheme is based largely on the U.S. Bureau of Economic Analysis’ (BEA’s) sectoring scheme. The
BEA updates these sectors every five years, and this is usually reflected in major changes to the IMPLAN model.
Seidman’s original 2014 CAP study used a 2011 version of IMPLAN, which primarily drew from the BEA’s 2002
sectoring scheme.
The current updated version of the CAP study uses a 2018 version of IMPLAN, which primarily draws from the BEA’s
2012 sectoring scheme, supplemented by BEA insights in 2007, 2002, and 1997.
The BEA only identifies 405 sectors. However, the latest version of IMPLAN has 546 sectors (compared to 440 sectors
in the original CAP study). Using input from industry experts, IMPLAN therefore provides production functions for
sectors not included in any BEA benchmark. IMPLAN also uses earlier BEA benchmarks to split the absorption
coefficients, byproduct coefficients, and institutional spending into greater levels of disaggregation.
It is usually possible to compare data across time using IMPLAN. However, the significant changes made to the
IMPLAN model between 2011 and 2018 reduce the efficacy of sectoral comparisons over time in the current report.
This is of particular significance for the sectoral distribution of impacts shown in Tables 6-9 in this report. The
sectoral splits for 1986-2009 are based on the original 2011 version of IMPLAN, which draws from the BEA’s 2002
national census of production. The sectoral splits for 2010-2017 are based on the updated 2018 version of IMPLAN,
which draws from the BEA’s 2012 national census of production.

660 S MILL AVENUE, SUITE 300 TEMPE
AZ 85281
Tel: (480) 965 5362 Fax: (480) 965 5458
www.seidmaninstitute.com
@SeidmanResearch