the economic impact of passing the development, relief, and education for … · 2014-06-04 · the...
TRANSCRIPT

!!
!!!!!!!!!!!!!!!!!
T H E E C O N O M I C I M P A C T O F P A S S I N G T H E D E V E L O P M E N T , R E L I E F , A N D E D U C A T I O N F O R A L I E N M I N O R S
( D R E A M A C T ) : A R E P O R T B Y S T A T E S
Juan Carlos Guzmán Raúl C. Jara
October, 2012

Alabama
Population Eligible for the DREAM Act : 11,000
Projection of Eligible Population Attaining College Education by Passage
of DREAM Act
0%
5%
10%
15%
20%
25%
30%
2010 2015 2020 2025 2030
Without DREAM Act With DREAM Act
Cumulative Gain in Earnings of Eligible Population by the Passage of DREAM
Act
0
100
200
300
400
500
600
700
800
2010 2015 2020 2025 2030M
illio
ns 2
012
$
!"#$%&'"()*%&+',-')*++"./'&0$'!#$*('*%&
2010-2020
$181.5
2020-2025
$207
2025-2030
$343
Total
$732Increase in Earnings (Millons)
Category
Increase in college-educated workers 200 500 700 1,300
Number of eligible DREAMERs 11,000 9,000 7,000
".!1%$!'"()*%&+',-')*++"./'&0$'!#$*('*%&
Category
Jobs generated 1,572
2020-2025
1,775
2025-2030
2,934
Total
6,280
2010-2020
$55.7Increase in Labor income (Millions) $64 $106 $226
Increase in Value Added (Millions) $99.2 $115 $191 $405
Increase in Total Production (Millions) $165.3 $191 $315 $671
Increase Individual Income Taxes (Millions) $4.1 $4.8 $7.9 $16.7Increase Business taxes (Millions) $4.0 $4.6 $7.8 $16.3
$347 $398 $658
Total Economic Impact $1,403,000,000
TOTAL ECONOMIC IMPACT[Increase in Earnings + Total Production] $1,403
! "#$%&' (# )*+#,

Alaska -%(*+.+*( &/(/ 01(2 3/$(1#%
Population Eligible for the DREAM Act : <1000
Projection of Eligible Population Attaining College Education by Passage
of DREAM Act
0%
5%
10%
15%
20%
25%
2010 2015 2020 2025 2030
Without DREAM Act With DREAM Act
Cumulative Gain in Earnings of Eligible Population by the Passage of DREAM
Act
0
5
10
15
20
25
30
2010 2015 2020 2025 2030M
illio
ns 2
012
$
!"#$%&'"()*%&+',-')*++"./'&0$'!#$*('*%&
2010-2020
$11.6
2020-2025
$5
2025-2030
$8
Total
$25Increase in Earnings (Millons)
Category
Increase in college-educated workers # # # #
Number of eligible DREAMERs <1000 <1000 <1000
".!1%$!'"()*%&+',-')*++"./'&0$'!#$*('*%&
Category
Jobs generated 84
2020-2025
41
2025-2030
54
Total
178
2010-2020
$3.5Increase in Labor income (Millions) $2 $2 $7
Increase in Value Added (Millions) $6.3 $3 $4 $14
Increase in Total Production (Millions) $10.2 $5 $7 $22
Increase Individual Income Taxes (Millions) $.3 $.1 $.2 $.6Increase Business taxes (Millions) $.2 $.1 $.1 $.4
$22 $11 $15
Total Economic Impact $47,000,000
TOTAL ECONOMIC IMPACT[Increase in Earnings + Total Production] $47
! "#$%&' (# )*+#,

Arizona
Population Eligible for the DREAM Act : 90,000
Projection of Eligible Population Attaining College Education by Passage
of DREAM Act
0%
5%
10%
15%
20%
25%
2010 2015 2020 2025 2030
Without DREAM Act With DREAM Act
Cumulative Gain in Earnings of Eligible Population by the Passage of DREAM
Act
0
1000
2000
3000
4000
5000
6000
7000
8000
9000
2010 2015 2020 2025 2030M
illio
ns 2
012
$
!"#$%&'"()*%&+',-')*++"./'&0$'!#$*('*%&
2010-2020
$2,785.6
2020-2025
$2,434
2025-2030
$3,108
Total
$8,327Increase in Earnings (Millons)
Category
Increase in college-educated workers 1,700 4,400 6,400 12,500
Number of eligible DREAMERs 90,000 65,000 56,000
".!1%$!'"()*%&+',-')*++"./'&0$'!#$*('*%&
Category
Jobs generated 28,107
2020-2025
24,474
2025-2030
31,068
Total
83,648
2010-2020
$1,186.3Increase in Labor income (Millions) $1,032 $1,309 $3,527
Increase in Value Added (Millions) $2,134.7 $1,848 $2,351 $6,334
Increase in Total Production (Millions) $3,381.9 $2,942 $3,740 $10,064
Increase Individual Income Taxes (Millions) $90.6 $78.8 $100.0 $269.4Increase Business taxes (Millions) $83.9 $72.4 $92.3 $248.7
$6,168 $5,376 $6,848
Total Economic Impact $18,392,000,000
TOTAL ECONOMIC IMPACT[Increase in Earnings + Total Production] $18,392
! "#$%&' (# )*+#,

Arkansas
Population Eligible for the DREAM Act : 11,000
Projection of Eligible Population Attaining College Education by Passage
of DREAM Act
0%
5%
10%
15%
20%
25%
2010 2015 2020 2025 2030
Without DREAM Act With DREAM Act
Cumulative Gain in Earnings of Eligible Population by the Passage of DREAM
Act
0
100
200
300
400
500
600
700
800
900
2010 2015 2020 2025 2030M
illio
ns 2
012
$
!"#$%&'"()*%&+',-')*++"./'&0$'!#$*('*%&
2010-2020
$229.6
2020-2025
$233
2025-2030
$340
Total
$803Increase in Earnings (Millons)
Category
Increase in college-educated workers 200 600 800 1,700
Number of eligible DREAMERs 11,000 8,000 7,000
".!1%$!'"()*%&+',-')*++"./'&0$'!#$*('*%&
Category
Jobs generated 1,886
2020-2025
1,892
2025-2030
2,751
Total
6,528
2010-2020
$65.2Increase in Labor income (Millions) $66 $96 $227
Increase in Value Added (Millions) $115.7 $118 $172 $405
Increase in Total Production (Millions) $195.1 $198 $287 $680
Increase Individual Income Taxes (Millions) $4.8 $4.8 $7.0 $16.6Increase Business taxes (Millions) $4.5 $4.5 $6.7 $15.7
$425 $431 $626
Total Economic Impact $1,482,000,000
TOTAL ECONOMIC IMPACT[Increase in Earnings + Total Production] $1,482
! "#$%&' (# )*+#,

California
Population Eligible for the DREAM Act : 550,000
Projection of Eligible Population Attaining College Education by Passage
of DREAM Act
0%
5%
10%
15%
20%
25%
2010 2015 2020 2025 2030
Without DREAM Act With DREAM Act
Cumulative Gain in Earnings of Eligible Population by the Passage of DREAM
Act
0
5000
10000
15000
20000
25000
30000
35000
40000
45000
2010 2015 2020 2025 2030M
illio
ns 2
012
$
!"#$%&'"()*%&+',-')*++"./'&0$'!#$*('*%&
2010-2020
$12,300.3
2020-2025
$12,230
2025-2030
$17,132
Total
$41,662Increase in Earnings (Millons)
Category
Increase in college-educated workers 8,200 21,900 30,200 60,400
Number of eligible DREAMERs 550,000 375,000 323,000
".!1%$!'"()*%&+',-')*++"./'&0$'!#$*('*%&
Category
Jobs generated 115,958
2020-2025
112,354
2025-2030
155,704
Total
384,016
2010-2020
$5,629.9Increase in Labor income (Millions) $5,574 $7,776 $18,980
Increase in Value Added (Millions) $10,146.1 $10,091 $14,131 $34,368
Increase in Total Production (Millions) $16,560.5 $16,455 $23,011 $56,026
Increase Individual Income Taxes (Millions) $578.7 $572.9 $799.2 $1,950.8Increase Business taxes (Millions) $417.6 $416.5 $585.3 $1,419.4
$28,861 $28,685 $40,143
Total Economic Impact $97,688,000,000
TOTAL ECONOMIC IMPACT[Increase in Earnings + Total Production] $97,688
! "#$%&' (# )*+#,

Colorado
Population Eligible for the DREAM Act : 44,000
Projection of Eligible Population Attaining College Education by Passage
of DREAM Act
0%
5%
10%
15%
20%
25%
2010 2015 2020 2025 2030
Without DREAM Act With DREAM Act
Cumulative Gain in Earnings of Eligible Population by the Passage of DREAM
Act
0
500
1000
1500
2000
2500
3000
2010 2015 2020 2025 2030M
illio
ns 2
012
$
!"#$%&'"()*%&+',-')*++"./'&0$'!#$*('*%&
2010-2020
$764.1
2020-2025
$807
2025-2030
$1,143
Total
$2,715Increase in Earnings (Millons)
Category
Increase in college-educated workers 800 2,300 3,100 6,200
Number of eligible DREAMERs 44,000 32,000 28,000
".!1%$!'"()*%&+',-')*++"./'&0$'!#$*('*%&
Category
Jobs generated 6,271
2020-2025
6,707
2025-2030
9,480
Total
22,459
2010-2020
$262.9Increase in Labor income (Millions) $282 $398 $942
Increase in Value Added (Millions) $494.5 $526 $745 $1,766
Increase in Total Production (Millions) $787.0 $838 $1,185 $2,810
Increase Individual Income Taxes (Millions) $24.5 $26.3 $37.1 $87.9Increase Business taxes (Millions) $22.7 $24.1 $34.4 $81.1
$1,551 $1,645 $2,328
Total Economic Impact $5,524,000,000
TOTAL ECONOMIC IMPACT[Increase in Earnings + Total Production] $5,524
! "#$%&' (# )*+#,

Connecticut
Population Eligible for the DREAM Act : 17,000
Projection of Eligible Population Attaining College Education by Passage
of DREAM Act
0%5%
10%15%20%25%30%35%40%
2010 2015 2020 2025 2030
Without DREAM Act With DREAM Act
Cumulative Gain in Earnings of Eligible Population by the Passage of DREAM
Act
-100
0100
200
300
400500
600
700800
900
2010 2015 2020 2025 2030M
illio
ns 2
012
$
!"#$%&'"()*%&+',-')*++"./'&0$'!#$*('*%&
2010-2020
$72.5
2020-2025
$262
2025-2030
$476
Total
$810Increase in Earnings (Millons)
Category
Increase in college-educated workers -100 # # -200
Number of eligible DREAMERs 17,000 13,000 11,000
".!1%$!'"()*%&+',-')*++"./'&0$'!#$*('*%&
Category
Jobs generated 429
2020-2025
1,919
2025-2030
3,499
Total
5,847
2010-2020
$14.2Increase in Labor income (Millions) $101 $187 $302
Increase in Value Added (Millions) $30.9 $181 $334 $546
Increase in Total Production (Millions) $39.3 $267 $496 $802
Increase Individual Income Taxes (Millions) $1.8 $12.7 $23.5 $37.9Increase Business taxes (Millions) $1.7 $7.4 $13.5 $22.6
$112 $528 $972
Total Economic Impact $1,612,000,000
TOTAL ECONOMIC IMPACT[Increase in Earnings + Total Production] $1,612
! "#$%&' (# )*+#,

Delaware -%(*+.+*( &/(/ 01(2 3/$(1#%
Population Eligible for the DREAM Act : 4,000
Projection of Eligible Population Attaining College Education by Passage
of DREAM Act
0%
5%
10%
15%
20%
25%
30%
2010 2015 2020 2025 2030
Without DREAM Act With DREAM Act
Cumulative Gain in Earnings of Eligible Population by the Passage of DREAM
Act
0
50
100
150
200
250
300
2010 2015 2020 2025 2030M
illio
ns 2
012
$
!"#$%&'"()*%&+',-')*++"./'&0$'!#$*('*%&
2010-2020
$58.8
2020-2025
$85
2025-2030
$125
Total
$268Increase in Earnings (Millons)
Category
Increase in college-educated workers # 200 300 500
Number of eligible DREAMERs 4,000 3,000 3,000
".!1%$!'"()*%&+',-')*++"./'&0$'!#$*('*%&
Category
Jobs generated 467
2020-2025
666
2025-2030
977
Total
2,111
2010-2020
$19.5Increase in Labor income (Millions) $28 $41 $89
Increase in Value Added (Millions) $34.8 $51 $74 $159
Increase in Total Production (Millions) $55.2 $80 $117 $252
Increase Individual Income Taxes (Millions) $1.7 $2.4 $3.5 $7.7Increase Business taxes (Millions) $1.3 $1.9 $2.9 $6.1
$114 $165 $241
Total Economic Impact $520,000,000
TOTAL ECONOMIC IMPACT[Increase in Earnings + Total Production] $520
! "#$%&' (# )*+#,

District of Columbia -%(*+.+*( &/(/ 01(2 3/$(1#%
Population Eligible for the DREAM Act : 2,000
Projection of Eligible Population Attaining College Education by Passage
of DREAM Act
0%
5%
10%
15%
20%
25%
30%
2010 2015 2020 2025 2030
Without DREAM Act With DREAM Act
Cumulative Gain in Earnings of Eligible Population by the Passage of DREAM
Act
0
50
100
150
200
250
2010 2015 2020 2025 2030M
illio
ns 2
012
$
!"#$%&'"()*%&+',-')*++"./'&0$'!#$*('*%&
2010-2020
$66.2
2020-2025
$63
2025-2030
$78
Total
$207Increase in Earnings (Millons)
Category
Increase in college-educated workers # # 100 100
Number of eligible DREAMERs 2,000 2,000 2,000
".!1%$!'"()*%&+',-')*++"./'&0$'!#$*('*%&
Category
Jobs generated 275
2020-2025
253
2025-2030
307
Total
834
2010-2020
$18.0Increase in Labor income (Millions) $16 $20 $54
Increase in Value Added (Millions) $30.5 $28 $35 $94
Increase in Total Production (Millions) $45.5 $42 $51 $139
Increase Individual Income Taxes (Millions) $1.2 $1.1 $1.3 $3.6Increase Business taxes (Millions) $.8 $.8 $.9 $2.5
$112 $105 $129
Total Economic Impact $346,000,000
TOTAL ECONOMIC IMPACT[Increase in Earnings + Total Production] $346
! "#$%&' (# )*+#,

Florida
Population Eligible for the DREAM Act : 151,000
Projection of Eligible Population Attaining College Education by Passage
of DREAM Act
0%
5%
10%
15%
20%
25%
30%
2010 2015 2020 2025 2030
Without DREAM Act With DREAM Act
Cumulative Gain in Earnings of Eligible Population by the Passage of DREAM
Act
-2000
0
2000
4000
6000
8000
10000
2010 2015 2020 2025 2030M
illio
ns 2
012
$
!"#$%&'"()*%&+',-')*++"./'&0$'!#$*('*%&
2010-2020
$1,328.1
2020-2025
$2,957
2025-2030
$4,941
Total
$9,227Increase in Earnings (Millons)
Category
Increase in college-educated workers 1,600 4,900 6,500 12,900
Number of eligible DREAMERs 151,000 108,000 96,000
".!1%$!'"()*%&+',-')*++"./'&0$'!#$*('*%&
Category
Jobs generated 14,817
2020-2025
32,376
2025-2030
53,728
Total
100,921
2010-2020
$564.6Increase in Labor income (Millions) $1,319 $2,198 $4,082
Increase in Value Added (Millions) $1,024.6 $2,378 $3,974 $7,376
Increase in Total Production (Millions) $1,636.7 $3,828 $6,390 $11,854
Increase Individual Income Taxes (Millions) $40.2 $94.0 $156.7 $290.9Increase Business taxes (Millions) $42.9 $97.2 $162.7 $302.9
$2,965 $6,785 $11,331
Total Economic Impact $21,081,000,000
TOTAL ECONOMIC IMPACT[Increase in Earnings + Total Production] $21,081
! "#$%&' (# )*+#,

Georgia
Population Eligible for the DREAM Act : 71,000
Projection of Eligible Population Attaining College Education by Passage
of DREAM Act
0%
5%
10%
15%
20%
25%
30%
2010 2015 2020 2025 2030
Without DREAM Act With DREAM Act
Cumulative Gain in Earnings of Eligible Population by the Passage of DREAM
Act
0
1000
2000
3000
4000
5000
6000
2010 2015 2020 2025 2030M
illio
ns 2
012
$
!"#$%&'"()*%&+',-')*++"./'&0$'!#$*('*%&
2010-2020
$1,179.6
2020-2025
$1,504
2025-2030
$2,231
Total
$4,915Increase in Earnings (Millons)
Category
Increase in college-educated workers 900 2,800 3,900 7,500
Number of eligible DREAMERs 71,000 54,000 46,000
".!1%$!'"()*%&+',-')*++"./'&0$'!#$*('*%&
Category
Jobs generated 11,640
2020-2025
14,731
2025-2030
21,801
Total
48,172
2010-2020
$483.6Increase in Labor income (Millions) $616 $910 $2,010
Increase in Value Added (Millions) $873.7 $1,114 $1,653 $3,641
Increase in Total Production (Millions) $1,400.4 $1,783 $2,634 $5,817
Increase Individual Income Taxes (Millions) $41.0 $52.2 $77.1 $170.2Increase Business taxes (Millions) $42.3 $54.2 $81.1 $177.7
$2,580 $3,287 $4,864
Total Economic Impact $10,731,000,000
TOTAL ECONOMIC IMPACT[Increase in Earnings + Total Production] $10,731
! "#$%&' (# )*+#,

Hawaii -%(*+.+*( &/(/ 01(2 3/$(1#%
Population Eligible for the DREAM Act : 5,000
Projection of Eligible Population Attaining College Education by Passage
of DREAM Act
0%
10%
20%
30%
40%
50%
60%
2010 2015 2020 2025 2030
Without DREAM Act With DREAM Act
Cumulative Gain in Earnings of Eligible Population by the Passage of DREAM
Act
0
100
200
300
400
500
600
2010 2015 2020 2025 2030M
illio
ns 2
012
$
!"#$%&'"()*%&+',-')*++"./'&0$'!#$*('*%&
2010-2020
$101.7
2020-2025
$173
2025-2030
$236
Total
$511Increase in Earnings (Millons)
Category
Increase in college-educated workers -100 -100 -200 -400
Number of eligible DREAMERs 5,000 4,000 4,000
".!1%$!'"()*%&+',-')*++"./'&0$'!#$*('*%&
Category
Jobs generated 750
2020-2025
1,191
2025-2030
1,614
Total
3,555
2010-2020
$29.0Increase in Labor income (Millions) $47 $64 $140
Increase in Value Added (Millions) $54.4 $90 $123 $267
Increase in Total Production (Millions) $87.8 $146 $199 $433
Increase Individual Income Taxes (Millions) $2.4 $4.0 $5.4 $11.8Increase Business taxes (Millions) $2.2 $3.6 $5.0 $10.7
$189 $319 $435
Total Economic Impact $943,000,000
TOTAL ECONOMIC IMPACT[Increase in Earnings + Total Production] $943
! "#$%&' (# )*+#,

Idaho -%(*+.+*( &/(/ 01(2 3/$(1#%
Population Eligible for the DREAM Act : 8,000
Projection of Eligible Population Attaining College Education by Passage
of DREAM Act
0%
5%
10%
15%
20%
25%
2010 2015 2020 2025 2030
Without DREAM Act With DREAM Act
Cumulative Gain in Earnings of Eligible Population by the Passage of DREAM
Act
050
100150200250300350400450500
2010 2015 2020 2025 2030M
illio
ns 2
012
$
!"#$%&'"()*%&+',-')*++"./'&0$'!#$*('*%&
2010-2020
$136.8
2020-2025
$134
2025-2030
$185
Total
$456Increase in Earnings (Millons)
Category
Increase in college-educated workers 100 400 500 1,100
Number of eligible DREAMERs 8,000 6,000 5,000
".!1%$!'"()*%&+',-')*++"./'&0$'!#$*('*%&
Category
Jobs generated 1,170
2020-2025
1,156
2025-2030
1,593
Total
3,919
2010-2020
$36.8Increase in Labor income (Millions) $37 $51 $124
Increase in Value Added (Millions) $67.2 $66 $92 $225
Increase in Total Production (Millions) $112.2 $111 $153 $376
Increase Individual Income Taxes (Millions) $2.7 $2.7 $3.7 $9.2Increase Business taxes (Millions) $2.9 $2.8 $3.9 $9.6
$249 $245 $339
Total Economic Impact $832,000,000
TOTAL ECONOMIC IMPACT[Increase in Earnings + Total Production] $832
! "#$%&' (# )*+#,

Illinois
Population Eligible for the DREAM Act : 99,000
Projection of Eligible Population Attaining College Education by Passage
of DREAM Act
0%
5%
10%
15%
20%
25%
30%
2010 2015 2020 2025 2030
Without DREAM Act With DREAM Act
Cumulative Gain in Earnings of Eligible Population by the Passage of DREAM
Act
-1000
0
1000
2000
3000
4000
5000
6000
7000
2010 2015 2020 2025 2030M
illio
ns 2
012
$
!"#$%&'"()*%&+',-')*++"./'&0$'!#$*('*%&
2010-2020
$1,074.2
2020-2025
$1,968
2025-2030
$2,957
Total
$5,999Increase in Earnings (Millons)
Category
Increase in college-educated workers 1,800 4,600 6,000 12,400
Number of eligible DREAMERs 99,000 69,000 61,000
".!1%$!'"()*%&+',-')*++"./'&0$'!#$*('*%&
Category
Jobs generated 11,084
2020-2025
19,298
2025-2030
28,610
Total
58,992
2010-2020
$543.4Increase in Labor income (Millions) $930 $1,372 $2,845
Increase in Value Added (Millions) $925.7 $1,649 $2,449 $5,024
Increase in Total Production (Millions) $1,522.8 $2,647 $3,913 $8,083
Increase Individual Income Taxes (Millions) $50.7 $86.9 $128.2 $265.8Increase Business taxes (Millions) $34.3 $64.4 $96.4 $195.2
$2,597 $4,615 $6,869
Total Economic Impact $14,081,000,000
TOTAL ECONOMIC IMPACT[Increase in Earnings + Total Production] $14,081
! "#$%&' (# )*+#,

Indiana
Population Eligible for the DREAM Act : 19,000
Projection of Eligible Population Attaining College Education by Passage
of DREAM Act
0%
5%
10%
15%
20%
25%
30%
2010 2015 2020 2025 2030
Without DREAM Act With DREAM Act
Cumulative Gain in Earnings of Eligible Population by the Passage of DREAM
Act
0
200
400
600
800
1000
1200
2010 2015 2020 2025 2030M
illio
ns 2
012
$
!"#$%&'"()*%&+',-')*++"./'&0$'!#$*('*%&
2010-2020
$199.1
2020-2025
$310
2025-2030
$455
Total
$964Increase in Earnings (Millons)
Category
Increase in college-educated workers 300 900 1,300 2,500
Number of eligible DREAMERs 19,000 14,000 13,000
".!1%$!'"()*%&+',-')*++"./'&0$'!#$*('*%&
Category
Jobs generated 1,879
2020-2025
2,940
2025-2030
4,258
Total
9,078
2010-2020
$70.1Increase in Labor income (Millions) $112 $160 $342
Increase in Value Added (Millions) $122.6 $196 $284 $602
Increase in Total Production (Millions) $207.4 $328 $472 $1,008
Increase Individual Income Taxes (Millions) $6.1 $9.8 $14.0 $29.9Increase Business taxes (Millions) $4.7 $7.6 $11.1 $23.3
$407 $638 $927
Total Economic Impact $1,972,000,000
TOTAL ECONOMIC IMPACT[Increase in Earnings + Total Production] $1,972
! "#$%&' (# )*+#,

Iowa -%(*+.+*( &/(/ 01(2 3/$(1#%
Population Eligible for the DREAM Act : 9,000
Projection of Eligible Population Attaining College Education by Passage
of DREAM Act
0%5%
10%15%
20%25%
30%35%
2010 2015 2020 2025 2030
Without DREAM Act With DREAM Act
Cumulative Gain in Earnings of Eligible Population by the Passage of DREAM
Act
050
100150200250300350400450500
2010 2015 2020 2025 2030M
illio
ns 2
012
$
!"#$%&'"()*%&+',-')*++"./'&0$'!#$*('*%&
2010-2020
$97.2
2020-2025
$144
2025-2030
$218
Total
$458Increase in Earnings (Millons)
Category
Increase in college-educated workers 200 400 600 1,200
Number of eligible DREAMERs 9,000 6,000 6,000
".!1%$!'"()*%&+',-')*++"./'&0$'!#$*('*%&
Category
Jobs generated 875
2020-2025
1,277
2025-2030
1,923
Total
4,074
2010-2020
$30.1Increase in Labor income (Millions) $46 $68 $144
Increase in Value Added (Millions) $52.7 $80 $120 $252
Increase in Total Production (Millions) $88.8 $134 $201 $424
Increase Individual Income Taxes (Millions) $2.5 $3.8 $5.7 $11.9Increase Business taxes (Millions) $2.1 $3.1 $4.8 $10.0
$186 $277 $419
Total Economic Impact $882,000,000
TOTAL ECONOMIC IMPACT[Increase in Earnings + Total Production] $882
! "#$%&' (# )*+#,

Kansas
Population Eligible for the DREAM Act : 13,000
Projection of Eligible Population Attaining College Education by Passage
of DREAM Act
0%
5%
10%
15%
20%
25%
2010 2015 2020 2025 2030
Without DREAM Act With DREAM Act
Cumulative Gain in Earnings of Eligible Population by the Passage of DREAM
Act
0
100
200
300
400
500
600
700
2010 2015 2020 2025 2030M
illio
ns 2
012
$
!"#$%&'"()*%&+',-')*++"./'&0$'!#$*('*%&
2010-2020
$152.8
2020-2025
$202
2025-2030
$298
Total
$652Increase in Earnings (Millons)
Category
Increase in college-educated workers 200 700 900 1,900
Number of eligible DREAMERs 13,000 10,000 8,000
".!1%$!'"()*%&+',-')*++"./'&0$'!#$*('*%&
Category
Jobs generated 1,301
2020-2025
1,694
2025-2030
2,495
Total
5,490
2010-2020
$46.8Increase in Labor income (Millions) $62 $90 $199
Increase in Value Added (Millions) $82.8 $109 $160 $352
Increase in Total Production (Millions) $139.8 $184 $268 $593
Increase Individual Income Taxes (Millions) $4.1 $5.5 $8.0 $17.6Increase Business taxes (Millions) $3.2 $4.3 $6.3 $13.8
$293 $386 $566
Total Economic Impact $1,245,000,000
TOTAL ECONOMIC IMPACT[Increase in Earnings + Total Production] $1,245
! "#$%&' (# )*+#,

Kentucky -%(*+.+*( &/(/ 01(2 3/$(1#%
Population Eligible for the DREAM Act : 7,000
Projection of Eligible Population Attaining College Education by Passage
of DREAM Act
0%
5%
10%
15%
20%
25%
30%
2010 2015 2020 2025 2030
Without DREAM Act With DREAM Act
Cumulative Gain in Earnings of Eligible Population by the Passage of DREAM
Act
050
100150200250300350400450500
2010 2015 2020 2025 2030M
illio
ns 2
012
$
!"#$%&'"()*%&+',-')*++"./'&0$'!#$*('*%&
2010-2020
$97.0
2020-2025
$120
2025-2030
$221
Total
$438Increase in Earnings (Millons)
Category
Increase in college-educated workers 100 300 400 700
Number of eligible DREAMERs 7,000 5,000 4,000
".!1%$!'"()*%&+',-')*++"./'&0$'!#$*('*%&
Category
Jobs generated 846
2020-2025
1,024
2025-2030
1,884
Total
3,754
2010-2020
$30.8Increase in Labor income (Millions) $38 $70 $139
Increase in Value Added (Millions) $54.3 $67 $123 $244
Increase in Total Production (Millions) $91.0 $112 $206 $410
Increase Individual Income Taxes (Millions) $2.4 $3.0 $5.5 $10.9Increase Business taxes (Millions) $2.4 $2.9 $5.4 $10.7
$188 $233 $427
Total Economic Impact $848,000,000
TOTAL ECONOMIC IMPACT[Increase in Earnings + Total Production] $848
! "#$%&' (# )*+#,

Louisiana -%(*+.+*( &/(/ 01(2 3/$(1#%
Population Eligible for the DREAM Act : 8,000
Projection of Eligible Population Attaining College Education by Passage
of DREAM Act
0%
5%
10%
15%
20%
25%
30%
2010 2015 2020 2025 2030
Without DREAM Act With DREAM Act
Cumulative Gain in Earnings of Eligible Population by the Passage of DREAM
Act
0
100
200
300
400
500
600
700
2010 2015 2020 2025 2030M
illio
ns 2
012
$
!"#$%&'"()*%&+',-')*++"./'&0$'!#$*('*%&
2010-2020
$172.8
2020-2025
$167
2025-2030
$266
Total
$606Increase in Earnings (Millons)
Category
Increase in college-educated workers 100 300 500 800
Number of eligible DREAMERs 8,000 6,000 5,000
".!1%$!'"()*%&+',-')*++"./'&0$'!#$*('*%&
Category
Jobs generated 1,475
2020-2025
1,402
2025-2030
2,206
Total
5,083
2010-2020
$55.2Increase in Labor income (Millions) $53 $83 $191
Increase in Value Added (Millions) $97.0 $93 $148 $337
Increase in Total Production (Millions) $163.6 $156 $246 $565
Increase Individual Income Taxes (Millions) $3.9 $3.8 $6.0 $13.7Increase Business taxes (Millions) $3.7 $3.5 $5.7 $12.9
$336 $323 $512
Total Economic Impact $1,171,000,000
TOTAL ECONOMIC IMPACT[Increase in Earnings + Total Production] $1,171
! "#$%&' (# )*+#,

Maine -%(*+.+*( &/(/ 01(2 3/$(1#%
Population Eligible for the DREAM Act : <1000
Projection of Eligible Population Attaining College Education by Passage
of DREAM Act
0%5%
10%15%20%25%30%35%40%
2010 2015 2020 2025 2030
Without DREAM Act With DREAM Act
Cumulative Gain in Earnings of Eligible Population by the Passage of DREAM
Act
0
5
10
15
20
25
2010 2015 2020 2025 2030M
illio
ns 2
012
$
!"#$%&'"()*%&+',-')*++"./'&0$'!#$*('*%&
2010-2020
$7.3
2020-2025
$5
2025-2030
$9
Total
$21Increase in Earnings (Millons)
Category
Increase in college-educated workers # # # #
Number of eligible DREAMERs <1000 <1000 <1000
".!1%$!'"()*%&+',-')*++"./'&0$'!#$*('*%&
Category
Jobs generated 71
2020-2025
46
2025-2030
84
Total
200
2010-2020
$2.4Increase in Labor income (Millions) $2 $3 $7
Increase in Value Added (Millions) $4.2 $3 $5 $12
Increase in Total Production (Millions) $6.6 $5 $9 $20
Increase Individual Income Taxes (Millions) $.2 $.1 $.3 $.6Increase Business taxes (Millions) $.2 $.1 $.2 $.5
$14 $10 $18
Total Economic Impact $41,000,000
TOTAL ECONOMIC IMPACT[Increase in Earnings + Total Production] $41
! "#$%&' (# )*+#,

Maryland
Population Eligible for the DREAM Act : 36,000
Projection of Eligible Population Attaining College Education by Passage
of DREAM Act
0%5%
10%15%
20%25%
30%35%
2010 2015 2020 2025 2030
Without DREAM Act With DREAM Act
Cumulative Gain in Earnings of Eligible Population by the Passage of DREAM
Act
0
500
1000
1500
2000
2500
3000
2010 2015 2020 2025 2030M
illio
ns 2
012
$
!"#$%&'"()*%&+',-')*++"./'&0$'!#$*('*%&
2010-2020
$561.5
2020-2025
$751
2025-2030
$1,105
Total
$2,417Increase in Earnings (Millons)
Category
Increase in college-educated workers 200 800 1,000 2,100
Number of eligible DREAMERs 36,000 27,000 23,000
".!1%$!'"()*%&+',-')*++"./'&0$'!#$*('*%&
Category
Jobs generated 4,525
2020-2025
5,961
2025-2030
8,752
Total
19,238
2010-2020
$200.2Increase in Labor income (Millions) $268 $395 $863
Increase in Value Added (Millions) $358.4 $484 $715 $1,557
Increase in Total Production (Millions) $558.6 $754 $1,111 $2,424
Increase Individual Income Taxes (Millions) $22.7 $30.5 $44.8 $98.1Increase Business taxes (Millions) $14.5 $19.7 $29.2 $63.4
$1,120 $1,505 $2,216
Total Economic Impact $4,842,000,000
TOTAL ECONOMIC IMPACT[Increase in Earnings + Total Production] $4,842
! "#$%&' (# )*+#,

Massachusetts
Population Eligible for the DREAM Act : 27,000
Projection of Eligible Population Attaining College Education by Passage
of DREAM Act
0%5%
10%15%20%25%30%35%40%
2010 2015 2020 2025 2030
Without DREAM Act With DREAM Act
Cumulative Gain in Earnings of Eligible Population by the Passage of DREAM
Act
-200
0
200
400
600
800
1000
1200
1400
2010 2015 2020 2025 2030M
illio
ns 2
012
$
!"#$%&'"()*%&+',-')*++"./'&0$'!#$*('*%&
2010-2020
$125.2
2020-2025
$387
2025-2030
$713
Total
$1,225Increase in Earnings (Millons)
Category
Increase in college-educated workers -100 # # #
Number of eligible DREAMERs 27,000 20,000 18,000
".!1%$!'"()*%&+',-')*++"./'&0$'!#$*('*%&
Category
Jobs generated 937
2020-2025
3,171
2025-2030
5,860
Total
9,968
2010-2020
$34.2Increase in Labor income (Millions) $168 $315 $517
Increase in Value Added (Millions) $65.4 $295 $552 $913
Increase in Total Production (Millions) $89.0 $446 $839 $1,374
Increase Individual Income Taxes (Millions) $3.8 $18.5 $34.8 $57.1Increase Business taxes (Millions) $3.3 $12.5 $23.0 $38.8
$214 $833 $1,552
Total Economic Impact $2,599,000,000
TOTAL ECONOMIC IMPACT[Increase in Earnings + Total Production] $2,599
! "#$%&' (# )*+#,

Michigan
Population Eligible for the DREAM Act : 22,000
Projection of Eligible Population Attaining College Education by Passage
of DREAM Act
0%5%
10%15%20%25%30%35%40%
2010 2015 2020 2025 2030
Without DREAM Act With DREAM Act
Cumulative Gain in Earnings of Eligible Population by the Passage of DREAM
Act
0
200
400
600
800
1000
1200
2010 2015 2020 2025 2030M
illio
ns 2
012
$
!"#$%&'"()*%&+',-')*++"./'&0$'!#$*('*%&
2010-2020
$143.9
2020-2025
$345
2025-2030
$615
Total
$1,104Increase in Earnings (Millons)
Category
Increase in college-educated workers 200 700 800 1,700
Number of eligible DREAMERs 22,000 17,000 16,000
".!1%$!'"()*%&+',-')*++"./'&0$'!#$*('*%&
Category
Jobs generated 1,531
2020-2025
3,696
2025-2030
6,564
Total
11,790
2010-2020
$58.1Increase in Labor income (Millions) $148 $263 $469
Increase in Value Added (Millions) $107.0 $268 $475 $849
Increase in Total Production (Millions) $173.7 $438 $778 $1,390
Increase Individual Income Taxes (Millions) $4.9 $12.4 $22.1 $39.4Increase Business taxes (Millions) $4.2 $10.4 $18.5 $33.1
$318 $784 $1,392
Total Economic Impact $2,494,000,000
TOTAL ECONOMIC IMPACT[Increase in Earnings + Total Production] $2,494
! "#$%&' (# )*+#,

Minnesota
Population Eligible for the DREAM Act : 16,000
Projection of Eligible Population Attaining College Education by Passage
of DREAM Act
0%5%
10%15%
20%25%
30%35%
2010 2015 2020 2025 2030
Without DREAM Act With DREAM Act
Cumulative Gain in Earnings of Eligible Population by the Passage of DREAM
Act
0
100
200
300
400
500
600
700
800
900
2010 2015 2020 2025 2030M
illio
ns 2
012
$
!"#$%&'"()*%&+',-')*++"./'&0$'!#$*('*%&
2010-2020
$156.5
2020-2025
$222
2025-2030
$386
Total
$765Increase in Earnings (Millons)
Category
Increase in college-educated workers 100 400 600 1,100
Number of eligible DREAMERs 16,000 13,000 11,000
".!1%$!'"()*%&+',-')*++"./'&0$'!#$*('*%&
Category
Jobs generated 1,651
2020-2025
2,284
2025-2030
3,892
Total
7,827
2010-2020
$69.5Increase in Labor income (Millions) $98 $168 $336
Increase in Value Added (Millions) $122.0 $174 $299 $595
Increase in Total Production (Millions) $202.4 $287 $493 $982
Increase Individual Income Taxes (Millions) $6.8 $9.7 $16.5 $33.0Increase Business taxes (Millions) $4.9 $7.0 $12.1 $24.0
$359 $509 $879
Total Economic Impact $1,747,000,000
TOTAL ECONOMIC IMPACT[Increase in Earnings + Total Production] $1,747
! "#$%&' (# )*+#,

Mississippi -%(*+.+*( &/(/ 01(2 3/$(1#%
Population Eligible for the DREAM Act : 4,000
Projection of Eligible Population Attaining College Education by Passage
of DREAM Act
0%
5%
10%
15%
20%
25%
2010 2015 2020 2025 2030
Without DREAM Act With DREAM Act
Cumulative Gain in Earnings of Eligible Population by the Passage of DREAM
Act
0
50
100
150
200
250
300
2010 2015 2020 2025 2030M
illio
ns 2
012
$
!"#$%&'"()*%&+',-')*++"./'&0$'!#$*('*%&
2010-2020
$60.8
2020-2025
$79
2025-2030
$129
Total
$269Increase in Earnings (Millons)
Category
Increase in college-educated workers # 100 200 400
Number of eligible DREAMERs 4,000 3,000 3,000
".!1%$!'"()*%&+',-')*++"./'&0$'!#$*('*%&
Category
Jobs generated 484
2020-2025
628
2025-2030
1,032
Total
2,144
2010-2020
$16.1Increase in Labor income (Millions) $21 $34 $72
Increase in Value Added (Millions) $28.6 $38 $63 $129
Increase in Total Production (Millions) $49.4 $65 $105 $219
Increase Individual Income Taxes (Millions) $1.0 $1.4 $2.2 $4.6Increase Business taxes (Millions) $1.1 $1.4 $2.4 $4.9
$110 $143 $235
Total Economic Impact $488,000,000
TOTAL ECONOMIC IMPACT[Increase in Earnings + Total Production] $488
! "#$%&' (# )*+#,

Missouri -%(*+.+*( &/(/ 01(2 3/$(1#%
Population Eligible for the DREAM Act : 8,000
Projection of Eligible Population Attaining College Education by Passage
of DREAM Act
0%
5%
10%
15%
20%
25%
30%
2010 2015 2020 2025 2030
Without DREAM Act With DREAM Act
Cumulative Gain in Earnings of Eligible Population by the Passage of DREAM
Act
0
50
100
150
200
250
300
350
400
2010 2015 2020 2025 2030M
illio
ns 2
012
$
!"#$%&'"()*%&+',-')*++"./'&0$'!#$*('*%&
2010-2020
$46.1
2020-2025
$113
2025-2030
$192
Total
$351Increase in Earnings (Millons)
Category
Increase in college-educated workers 100 400 500 1,000
Number of eligible DREAMERs 8,000 6,000 6,000
".!1%$!'"()*%&+',-')*++"./'&0$'!#$*('*%&
Category
Jobs generated 457
2020-2025
1,122
2025-2030
1,898
Total
3,477
2010-2020
$17.1Increase in Labor income (Millions) $44 $75 $136
Increase in Value Added (Millions) $30.5 $77 $130 $238
Increase in Total Production (Millions) $50.2 $127 $215 $393
Increase Individual Income Taxes (Millions) $1.4 $3.5 $6.0 $10.9Increase Business taxes (Millions) $1.3 $3.2 $5.4 $9.9
$96 $241 $407
Total Economic Impact $744,000,000
TOTAL ECONOMIC IMPACT[Increase in Earnings + Total Production] $744
! "#$%&' (# )*+#,

Montana -%(*+.+*( &/(/ 01(2 3/$(1#%
Population Eligible for the DREAM Act : <1000
Projection of Eligible Population Attaining College Education by Passage
of DREAM Act
0%5%
10%15%20%25%30%35%40%45%
2010 2015 2020 2025 2030
Without DREAM Act With DREAM Act
Cumulative Gain in Earnings of Eligible Population by the Passage of DREAM
Act
-1
0
1
2
3
4
5
6
7
2010 2015 2020 2025 2030M
illio
ns 2
012
$
!"#$%&'"()*%&+',-')*++"./'&0$'!#$*('*%&
2010-2020
$.5
2020-2025
$3
2025-2030
$3
Total
$6Increase in Earnings (Millons)
Category
Increase in college-educated workers # # # #
Number of eligible DREAMERs <1000 <1000 <1000
".!1%$!'"()*%&+',-')*++"./'&0$'!#$*('*%&
Category
Jobs generated 4
2020-2025
22
2025-2030
28
Total
54
2010-2020
$.1Increase in Labor income (Millions) $1 $1 $2
Increase in Value Added (Millions) $.2 $1 $2 $3
Increase in Total Production (Millions) $.4 $2 $3 $5
Increase Individual Income Taxes (Millions) $.0 $.1 $.1 $.1Increase Business taxes (Millions) $.0 $.1 $.1 $.1
$1 $5 $6
Total Economic Impact $12,000,000
TOTAL ECONOMIC IMPACT[Increase in Earnings + Total Production] $12
! "#$%&' (# )*+#,

Nebraska -%(*+.+*( &/(/ 01(2 3/$(1#%
Population Eligible for the DREAM Act : 8,000
Projection of Eligible Population Attaining College Education by Passage
of DREAM Act
0%
5%
10%
15%
20%
25%
30%
2010 2015 2020 2025 2030
Without DREAM Act With DREAM Act
Cumulative Gain in Earnings of Eligible Population by the Passage of DREAM
Act
0
50
100
150
200
250
300
350
400
450
2010 2015 2020 2025 2030M
illio
ns 2
012
$
!"#$%&'"()*%&+',-')*++"./'&0$'!#$*('*%&
2010-2020
$100.8
2020-2025
$128
2025-2030
$190
Total
$419Increase in Earnings (Millons)
Category
Increase in college-educated workers 100 400 500 1,000
Number of eligible DREAMERs 8,000 6,000 5,000
".!1%$!'"()*%&+',-')*++"./'&0$'!#$*('*%&
Category
Jobs generated 919
2020-2025
1,169
2025-2030
1,721
Total
3,809
2010-2020
$32.9Increase in Labor income (Millions) $42 $62 $138
Increase in Value Added (Millions) $56.2 $73 $108 $237
Increase in Total Production (Millions) $96.3 $123 $183 $402
Increase Individual Income Taxes (Millions) $2.5 $3.2 $4.8 $10.5Increase Business taxes (Millions) $2.1 $2.7 $4.0 $8.7
$197 $251 $373
Total Economic Impact $821,000,000
TOTAL ECONOMIC IMPACT[Increase in Earnings + Total Production] $821
! "#$%&' (# )*+#,

Nevada
Population Eligible for the DREAM Act : 39,000
Projection of Eligible Population Attaining College Education by Passage
of DREAM Act
0%
5%
10%
15%
20%
25%
2010 2015 2020 2025 2030
Without DREAM Act With DREAM Act
Cumulative Gain in Earnings of Eligible Population by the Passage of DREAM
Act
0
500
1000
1500
2000
2500
3000
2010 2015 2020 2025 2030M
illio
ns 2
012
$
!"#$%&'"()*%&+',-')*++"./'&0$'!#$*('*%&
2010-2020
$871.9
2020-2025
$736
2025-2030
$993
Total
$2,601Increase in Earnings (Millons)
Category
Increase in college-educated workers 500 1,600 2,300 4,500
Number of eligible DREAMERs 39,000 27,000 24,000
".!1%$!'"()*%&+',-')*++"./'&0$'!#$*('*%&
Category
Jobs generated 6,902
2020-2025
5,790
2025-2030
7,815
Total
20,507
2010-2020
$283.8Increase in Labor income (Millions) $237 $320 $840
Increase in Value Added (Millions) $523.3 $436 $591 $1,550
Increase in Total Production (Millions) $819.6 $687 $929 $2,436
Increase Individual Income Taxes (Millions) $22.2 $18.5 $25.0 $65.8Increase Business taxes (Millions) $20.8 $17.4 $23.6 $61.7
$1,692 $1,423 $1,922
Total Economic Impact $5,036,000,000
TOTAL ECONOMIC IMPACT[Increase in Earnings + Total Production] $5,036
! "#$%&' (# )*+#,

New Hampshire -%(*+.+*( &/(/ 01(2 3/$(1#%
Population Eligible for the DREAM Act : 2,000
Projection of Eligible Population Attaining College Education by Passage
of DREAM Act
0%
10%
20%
30%
40%
50%
60%
2010 2015 2020 2025 2030
Without DREAM Act With DREAM Act
Cumulative Gain in Earnings of Eligible Population by the Passage of DREAM
Act
-20
0
20
40
60
80
100
120
2010 2015 2020 2025 2030M
illio
ns 2
012
$
!"#$%&'"()*%&+',-')*++"./'&0$'!#$*('*%&
2010-2020
$13.0
2020-2025
$30
2025-2030
$65
Total
$108Increase in Earnings (Millons)
Category
Increase in college-educated workers # -100 -100 -200
Number of eligible DREAMERs 2,000 1,000 1,000
".!1%$!'"()*%&+',-')*++"./'&0$'!#$*('*%&
Category
Jobs generated 112
2020-2025
267
2025-2030
551
Total
930
2010-2020
$4.1Increase in Labor income (Millions) $11 $23 $38
Increase in Value Added (Millions) $7.7 $19 $41 $68
Increase in Total Production (Millions) $11.1 $30 $64 $105
Increase Individual Income Taxes (Millions) $.3 $.9 $1.9 $3.1Increase Business taxes (Millions) $.3 $.8 $1.7 $2.8
$24 $60 $129
Total Economic Impact $213,000,000
TOTAL ECONOMIC IMPACT[Increase in Earnings + Total Production] $213
! "#$%&' (# )*+#,

New Jersey
Population Eligible for the DREAM Act : 75,000
Projection of Eligible Population Attaining College Education by Passage
of DREAM Act
0%5%
10%15%
20%25%
30%35%
2010 2015 2020 2025 2030
Without DREAM Act With DREAM Act
Cumulative Gain in Earnings of Eligible Population by the Passage of DREAM
Act
-500
0
500
1000
1500
2000
2500
3000
3500
4000
2010 2015 2020 2025 2030M
illio
ns 2
012
$
!"#$%&'"()*%&+',-')*++"./'&0$'!#$*('*%&
2010-2020
$289.2
2020-2025
$1,159
2025-2030
$1,960
Total
$3,408Increase in Earnings (Millons)
Category
Increase in college-educated workers 500 1,800 2,200 4,600
Number of eligible DREAMERs 75,000 55,000 50,000
".!1%$!'"()*%&+',-')*++"./'&0$'!#$*('*%&
Category
Jobs generated 1,984
2020-2025
9,239
2025-2030
15,571
Total
26,794
2010-2020
$80.8Increase in Labor income (Millions) $484 $822 $1,386
Increase in Value Added (Millions) $154.3 $866 $1,475 $2,495
Increase in Total Production (Millions) $204.7 $1,330 $2,275 $3,810
Increase Individual Income Taxes (Millions) $8.9 $53.1 $90.2 $152.1Increase Business taxes (Millions) $6.9 $34.1 $57.9 $98.9
$494 $2,488 $4,236
Total Economic Impact $7,218,000,000
TOTAL ECONOMIC IMPACT[Increase in Earnings + Total Production] $7,218
! "#$%&' (# )*+#,

New Mexico
Population Eligible for the DREAM Act : 19,000
Projection of Eligible Population Attaining College Education by Passage
of DREAM Act
0%
5%
10%
15%
20%
25%
2010 2015 2020 2025 2030
Without DREAM Act With DREAM Act
Cumulative Gain in Earnings of Eligible Population by the Passage of DREAM
Act
0
200
400
600
800
1000
1200
1400
2010 2015 2020 2025 2030M
illio
ns 2
012
$
!"#$%&'"()*%&+',-')*++"./'&0$'!#$*('*%&
2010-2020
$379.5
2020-2025
$350
2025-2030
$470
Total
$1,199Increase in Earnings (Millons)
Category
Increase in college-educated workers 400 1,000 1,500 2,900
Number of eligible DREAMERs 19,000 14,000 12,000
".!1%$!'"()*%&+',-')*++"./'&0$'!#$*('*%&
Category
Jobs generated 3,032
2020-2025
2,786
2025-2030
3,739
Total
9,557
2010-2020
$105.8Increase in Labor income (Millions) $97 $130 $332
Increase in Value Added (Millions) $191.9 $175 $235 $602
Increase in Total Production (Millions) $311.7 $285 $381 $978
Increase Individual Income Taxes (Millions) $8.0 $7.4 $9.9 $25.3Increase Business taxes (Millions) $6.9 $6.3 $8.5 $21.6
$691 $635 $851
Total Economic Impact $2,177,000,000
TOTAL ECONOMIC IMPACT[Increase in Earnings + Total Production] $2,177
! "#$%&' (# )*+#,

New York
Population Eligible for the DREAM Act : 106,000
Projection of Eligible Population Attaining College Education by Passage
of DREAM Act
0%5%
10%15%
20%25%
30%35%
2010 2015 2020 2025 2030
Without DREAM Act With DREAM Act
Cumulative Gain in Earnings of Eligible Population by the Passage of DREAM
Act
0
1000
2000
3000
4000
5000
6000
7000
8000
9000
2010 2015 2020 2025 2030M
illio
ns 2
012
$
!"#$%&'"()*%&+',-')*++"./'&0$'!#$*('*%&
2010-2020
$1,342.6
2020-2025
$2,616
2025-2030
$3,871
Total
$7,829Increase in Earnings (Millons)
Category
Increase in college-educated workers 300 1,200 1,000 2,600
Number of eligible DREAMERs 106,000 76,000 69,000
".!1%$!'"()*%&+',-')*++"./'&0$'!#$*('*%&
Category
Jobs generated 8,489
2020-2025
18,069
2025-2030
26,931
Total
53,489
2010-2020
$467.0Increase in Labor income (Millions) $1,054 $1,569 $3,091
Increase in Value Added (Millions) $832.6 $1,871 $2,793 $5,497
Increase in Total Production (Millions) $1,214.5 $2,784 $4,160 $8,158
Increase Individual Income Taxes (Millions) $55.6 $125.6 $187.1 $368.3Increase Business taxes (Millions) $32.5 $72.1 $108.1 $212.7
$2,557 $5,400 $8,030
Total Economic Impact $15,987,000,000
TOTAL ECONOMIC IMPACT[Increase in Earnings + Total Production] $15,987
! "#$%&' (# )*+#,

North Carolina
Population Eligible for the DREAM Act : 53,000
Projection of Eligible Population Attaining College Education by Passage
of DREAM Act
0%
5%
10%
15%
20%
25%
30%
2010 2015 2020 2025 2030
Without DREAM Act With DREAM Act
Cumulative Gain in Earnings of Eligible Population by the Passage of DREAM
Act
0
500
1000
1500
2000
2500
3000
3500
4000
2010 2015 2020 2025 2030M
illio
ns 2
012
$
!"#$%&'"()*%&+',-')*++"./'&0$'!#$*('*%&
2010-2020
$939.4
2020-2025
$1,138
2025-2030
$1,688
Total
$3,765Increase in Earnings (Millons)
Category
Increase in college-educated workers 900 2,600 3,800 7,200
Number of eligible DREAMERs 53,000 40,000 35,000
".!1%$!'"()*%&+',-')*++"./'&0$'!#$*('*%&
Category
Jobs generated 9,062
2020-2025
10,839
2025-2030
16,035
Total
35,935
2010-2020
$354.0Increase in Labor income (Millions) $426 $628 $1,408
Increase in Value Added (Millions) $627.1 $755 $1,119 $2,501
Increase in Total Production (Millions) $1,027.5 $1,235 $1,822 $4,084
Increase Individual Income Taxes (Millions) $30.4 $36.6 $54.0 $121.0Increase Business taxes (Millions) $25.8 $31.1 $46.5 $103.4
$1,967 $2,372 $3,510
Total Economic Impact $7,849,000,000
TOTAL ECONOMIC IMPACT[Increase in Earnings + Total Production] $7,849
! "#$%&' (# )*+#,

North Dakota -%(*+.+*( &/(/ 01(2 3/$(1#%
Population Eligible for the DREAM Act : <1000
Projection of Eligible Population Attaining College Education by Passage
of DREAM Act
0%
5%
10%
15%
20%
25%
2010 2015 2020 2025 2030
Without DREAM Act With DREAM Act
Cumulative Gain in Earnings of Eligible Population by the Passage of DREAM
Act
-2
0
2
4
6
8
10
12
14
2010 2015 2020 2025 2030M
illio
ns 2
012
$
!"#$%&'"()*%&+',-')*++"./'&0$'!#$*('*%&
2010-2020
$2.5
2020-2025
$2
2025-2030
$7
Total
$12Increase in Earnings (Millons)
Category
Increase in college-educated workers # # # #
Number of eligible DREAMERs <1000 <1000 <1000
".!1%$!'"()*%&+',-')*++"./'&0$'!#$*('*%&
Category
Jobs generated 19
2020-2025
18
2025-2030
56
Total
94
2010-2020
$.6Increase in Labor income (Millions) $1 $2 $3
Increase in Value Added (Millions) $1.0 $1 $3 $5
Increase in Total Production (Millions) $1.8 $2 $6 $9
Increase Individual Income Taxes (Millions) $.1 $.1 $.2 $.3Increase Business taxes (Millions) $.0 $.0 $.1 $.2
$4 $4 $12
Total Economic Impact $21,000,000
TOTAL ECONOMIC IMPACT[Increase in Earnings + Total Production] $21
! "#$%&' (# )*+#,

Ohio
Population Eligible for the DREAM Act : 16,000
Projection of Eligible Population Attaining College Education by Passage
of DREAM Act
0%5%
10%15%20%25%30%35%40%
2010 2015 2020 2025 2030
Without DREAM Act With DREAM Act
Cumulative Gain in Earnings of Eligible Population by the Passage of DREAM
Act
-100
0
100
200
300
400
500
600
700
800
2010 2015 2020 2025 2030M
illio
ns 2
012
$
!"#$%&'"()*%&+',-')*++"./'&0$'!#$*('*%&
2010-2020
$72.7
2020-2025
$227
2025-2030
$396
Total
$696Increase in Earnings (Millons)
Category
Increase in college-educated workers # 200 300 600
Number of eligible DREAMERs 16,000 13,000 12,000
".!1%$!'"()*%&+',-')*++"./'&0$'!#$*('*%&
Category
Jobs generated 726
2020-2025
2,262
2025-2030
3,918
Total
6,906
2010-2020
$24.7Increase in Labor income (Millions) $87 $152 $263
Increase in Value Added (Millions) $44.2 $153 $267 $464
Increase in Total Production (Millions) $73.8 $256 $445 $774
Increase Individual Income Taxes (Millions) $2.2 $7.8 $13.5 $23.5Increase Business taxes (Millions) $1.7 $5.8 $10.2 $17.7
$147 $483 $841
Total Economic Impact $1,470,000,000
TOTAL ECONOMIC IMPACT[Increase in Earnings + Total Production] $1,470
! "#$%&' (# )*+#,
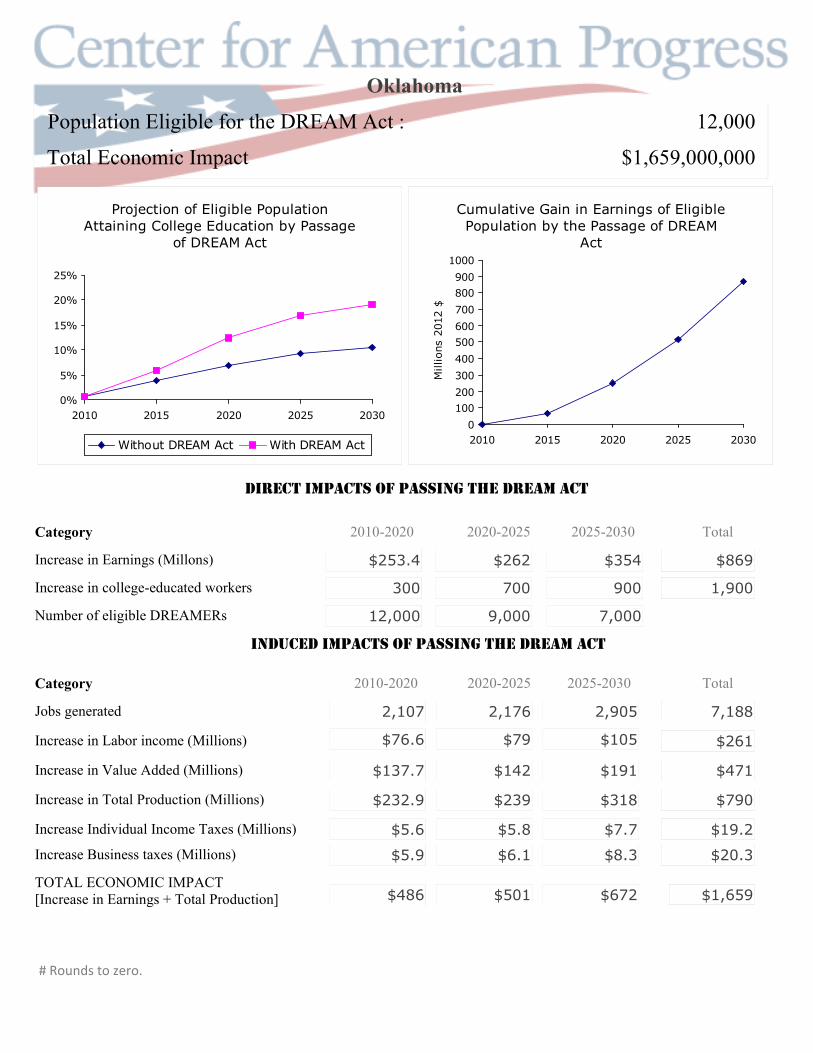
Oklahoma
Population Eligible for the DREAM Act : 12,000
Projection of Eligible Population Attaining College Education by Passage
of DREAM Act
0%
5%
10%
15%
20%
25%
2010 2015 2020 2025 2030
Without DREAM Act With DREAM Act
Cumulative Gain in Earnings of Eligible Population by the Passage of DREAM
Act
0100200300400500600700800900
1000
2010 2015 2020 2025 2030M
illio
ns 2
012
$
!"#$%&'"()*%&+',-')*++"./'&0$'!#$*('*%&
2010-2020
$253.4
2020-2025
$262
2025-2030
$354
Total
$869Increase in Earnings (Millons)
Category
Increase in college-educated workers 300 700 900 1,900
Number of eligible DREAMERs 12,000 9,000 7,000
".!1%$!'"()*%&+',-')*++"./'&0$'!#$*('*%&
Category
Jobs generated 2,107
2020-2025
2,176
2025-2030
2,905
Total
7,188
2010-2020
$76.6Increase in Labor income (Millions) $79 $105 $261
Increase in Value Added (Millions) $137.7 $142 $191 $471
Increase in Total Production (Millions) $232.9 $239 $318 $790
Increase Individual Income Taxes (Millions) $5.6 $5.8 $7.7 $19.2Increase Business taxes (Millions) $5.9 $6.1 $8.3 $20.3
$486 $501 $672
Total Economic Impact $1,659,000,000
TOTAL ECONOMIC IMPACT[Increase in Earnings + Total Production] $1,659
! "#$%&' (# )*+#,

Oregon
Population Eligible for the DREAM Act : 32,000
Projection of Eligible Population Attaining College Education by Passage
of DREAM Act
0%
5%
10%
15%
20%
25%
30%
2010 2015 2020 2025 2030
Without DREAM Act With DREAM Act
Cumulative Gain in Earnings of Eligible Population by the Passage of DREAM
Act
0
500
1000
1500
2000
2500
2010 2015 2020 2025 2030M
illio
ns 2
012
$
!"#$%&'"()*%&+',-')*++"./'&0$'!#$*('*%&
2010-2020
$606.7
2020-2025
$585
2025-2030
$806
Total
$1,998Increase in Earnings (Millons)
Category
Increase in college-educated workers 400 1,200 1,700 3,300
Number of eligible DREAMERs 32,000 23,000 20,000
".!1%$!'"()*%&+',-')*++"./'&0$'!#$*('*%&
Category
Jobs generated 6,086
2020-2025
5,823
2025-2030
7,981
Total
19,890
2010-2020
$236.8Increase in Labor income (Millions) $227 $309 $773
Increase in Value Added (Millions) $420.3 $402 $548 $1,370
Increase in Total Production (Millions) $679.9 $651 $890 $2,221
Increase Individual Income Taxes (Millions) $22.5 $21.5 $29.4 $73.4Increase Business taxes (Millions) $18.4 $17.6 $24.1 $60.1
$1,287 $1,236 $1,696
Total Economic Impact $4,218,000,000
TOTAL ECONOMIC IMPACT[Increase in Earnings + Total Production] $4,218
! "#$%&' (# )*+#,

Pennsylvania
Population Eligible for the DREAM Act : 25,000
Projection of Eligible Population Attaining College Education by Passage
of DREAM Act
0%5%
10%15%
20%25%
30%35%
2010 2015 2020 2025 2030
Without DREAM Act With DREAM Act
Cumulative Gain in Earnings of Eligible Population by the Passage of DREAM
Act
-200
0
200
400
600
800
1000
1200
1400
2010 2015 2020 2025 2030M
illio
ns 2
012
$
!"#$%&'"()*%&+',-')*++"./'&0$'!#$*('*%&
2010-2020
$60.8
2020-2025
$405
2025-2030
$697
Total
$1,163Increase in Earnings (Millons)
Category
Increase in college-educated workers 100 500 600 1,200
Number of eligible DREAMERs 25,000 19,000 17,000
".!1%$!'"()*%&+',-')*++"./'&0$'!#$*('*%&
Category
Jobs generated 515
2020-2025
3,726
2025-2030
6,419
Total
10,661
2010-2020
$12.0Increase in Labor income (Millions) $163 $285 $460
Increase in Value Added (Millions) $27.7 $289 $502 $819
Increase in Total Production (Millions) $30.2 $461 $806 $1,297
Increase Individual Income Taxes (Millions) $1.1 $15.6 $27.2 $43.9Increase Business taxes (Millions) $1.6 $11.6 $20.0 $33.2
$91 $866 $1,503
Total Economic Impact $2,460,000,000
TOTAL ECONOMIC IMPACT[Increase in Earnings + Total Production] $2,460
! "#$%&' (# )*+#,

Rhode Island -%(*+.+*( &/(/ 01(2 3/$(1#%
Population Eligible for the DREAM Act : 5,000
Projection of Eligible Population Attaining College Education by Passage
of DREAM Act
0%
5%
10%
15%
20%
25%
30%
2010 2015 2020 2025 2030
Without DREAM Act With DREAM Act
Cumulative Gain in Earnings of Eligible Population by the Passage of DREAM
Act
-50
0
50
100
150
200
250
2010 2015 2020 2025 2030M
illio
ns 2
012
$
!"#$%&'"()*%&+',-')*++"./'&0$'!#$*('*%&
2010-2020
$25.4
2020-2025
$65
2025-2030
$116
Total
$206Increase in Earnings (Millons)
Category
Increase in college-educated workers # 100 100 300
Number of eligible DREAMERs 5,000 3,000 3,000
".!1%$!'"()*%&+',-')*++"./'&0$'!#$*('*%&
Category
Jobs generated 215
2020-2025
554
2025-2030
957
Total
1,726
2010-2020
$7.7Increase in Labor income (Millions) $23 $41 $72
Increase in Value Added (Millions) $14.7 $41 $72 $128
Increase in Total Production (Millions) $21.4 $64 $113 $199
Increase Individual Income Taxes (Millions) $.7 $2.0 $3.6 $6.3Increase Business taxes (Millions) $.6 $1.5 $2.7 $4.8
$47 $130 $229
Total Economic Impact $405,000,000
TOTAL ECONOMIC IMPACT[Increase in Earnings + Total Production] $405
! "#$%&' (# )*+#,

South Carolina -%(*+.+*( &/(/ 01(2 3/$(1#%
Population Eligible for the DREAM Act : 9,000
Projection of Eligible Population Attaining College Education by Passage
of DREAM Act
0%
5%
10%
15%
20%
25%
30%
2010 2015 2020 2025 2030
Without DREAM Act With DREAM Act
Cumulative Gain in Earnings of Eligible Population by the Passage of DREAM
Act
0
100
200
300
400
500
600
700
2010 2015 2020 2025 2030M
illio
ns 2
012
$
!"#$%&'"()*%&+',-')*++"./'&0$'!#$*('*%&
2010-2020
$149.0
2020-2025
$187
2025-2030
$280
Total
$616Increase in Earnings (Millons)
Category
Increase in college-educated workers 200 500 700 1,300
Number of eligible DREAMERs 9,000 7,000 6,000
".!1%$!'"()*%&+',-')*++"./'&0$'!#$*('*%&
Category
Jobs generated 1,454
2020-2025
1,783
2025-2030
2,687
Total
5,924
2010-2020
$48.1Increase in Labor income (Millions) $59 $89 $196
Increase in Value Added (Millions) $88.2 $108 $164 $361
Increase in Total Production (Millions) $143.3 $177 $266 $586
Increase Individual Income Taxes (Millions) $3.4 $4.2 $6.4 $14.0Increase Business taxes (Millions) $4.4 $5.4 $8.3 $18.1
$292 $364 $546
Total Economic Impact $1,202,000,000
TOTAL ECONOMIC IMPACT[Increase in Earnings + Total Production] $1,202
! "#$%&' (# )*+#,

South Dakota -%(*+.+*( &/(/ 01(2 3/$(1#%
Population Eligible for the DREAM Act : <1000
Projection of Eligible Population Attaining College Education by Passage
of DREAM Act
0%
5%
10%
15%
20%
2010 2015 2020 2025 2030
Without DREAM Act With DREAM Act
Cumulative Gain in Earnings of Eligible Population by the Passage of DREAM
Act
-0.5
0
0.5
1
1.5
2
2010 2015 2020 2025 2030
Mill
ions
201
2 $
!"#$%&'"()*%&+',-')*++"./'&0$'!#$*('*%&
2010-2020
-$.2
2020-2025
$
2025-2030
$2
Total
$2Increase in Earnings (Millons)
Category
Increase in college-educated workers # # # #
Number of eligible DREAMERs <1000 <1000 <1000
".!1%$!'"()*%&+',-')*++"./'&0$'!#$*('*%&
Category
Jobs generated -2
2020-2025
-2
2025-2030
15
Total
12
2010-2020
-$.1Increase in Labor income (Millions) $ $ $
Increase in Value Added (Millions) -$.1 $ $1 $1
Increase in Total Production (Millions) -$.2 $ $2 $1
Increase Individual Income Taxes (Millions) $.0 $.0 $.0 $.0Increase Business taxes (Millions) $.0 $.0 $.0 $.0
$ $ $4
Total Economic Impact $3,000,000
TOTAL ECONOMIC IMPACT[Increase in Earnings + Total Production] $3
! "#$%&' (# )*+#,

Tennessee
Population Eligible for the DREAM Act : 19,000
Projection of Eligible Population Attaining College Education by Passage
of DREAM Act
0%
5%
10%
15%
20%
25%
30%
2010 2015 2020 2025 2030
Without DREAM Act With DREAM Act
Cumulative Gain in Earnings of Eligible Population by the Passage of DREAM
Act
0
200
400
600
800
1000
1200
1400
2010 2015 2020 2025 2030M
illio
ns 2
012
$
!"#$%&'"()*%&+',-')*++"./'&0$'!#$*('*%&
2010-2020
$271.0
2020-2025
$346
2025-2030
$580
Total
$1,198Increase in Earnings (Millons)
Category
Increase in college-educated workers 200 700 1,000 1,900
Number of eligible DREAMERs 19,000 14,000 12,000
".!1%$!'"()*%&+',-')*++"./'&0$'!#$*('*%&
Category
Jobs generated 2,737
2020-2025
3,456
2025-2030
5,754
Total
11,946
2010-2020
$116.4Increase in Labor income (Millions) $149 $248 $513
Increase in Value Added (Millions) $201.0 $257 $430 $887
Increase in Total Production (Millions) $329.7 $421 $701 $1,452
Increase Individual Income Taxes (Millions) $7.2 $9.1 $15.2 $31.5Increase Business taxes (Millions) $7.9 $10.2 $17.2 $35.3
$601 $768 $1,282
Total Economic Impact $2,650,000,000
TOTAL ECONOMIC IMPACT[Increase in Earnings + Total Production] $2,650
! "#$%&' (# )*+#,

Texas
Population Eligible for the DREAM Act : 325,000
Projection of Eligible Population Attaining College Education by Passage
of DREAM Act
0%
5%
10%
15%
20%
25%
2010 2015 2020 2025 2030
Without DREAM Act With DREAM Act
Cumulative Gain in Earnings of Eligible Population by the Passage of DREAM
Act
0
5000
10000
15000
20000
25000
30000
2010 2015 2020 2025 2030M
illio
ns 2
012
$
!"#$%&'"()*%&+',-')*++"./'&0$'!#$*('*%&
2010-2020
$8,390.2
2020-2025
$8,430
2025-2030
$11,474
Total
$28,294Increase in Earnings (Millons)
Category
Increase in college-educated workers 6,500 17,300 24,100 47,800
Number of eligible DREAMERs 325,000 231,000 196,000
".!1%$!'"()*%&+',-')*++"./'&0$'!#$*('*%&
Category
Jobs generated 84,362
2020-2025
84,074
2025-2030
114,035
Total
282,470
2010-2020
$3,792.7Increase in Labor income (Millions) $3,778 $5,106 $12,676
Increase in Value Added (Millions) $6,895.5 $6,874 $9,313 $23,082
Increase in Total Production (Millions) $11,289.7 $11,251 $15,193 $37,734
Increase Individual Income Taxes (Millions) $277.7 $276.5 $373.7 $927.9Increase Business taxes (Millions) $293.3 $292.9 $398.7 $984.9
$19,680 $19,681 $26,667
Total Economic Impact $66,028,000,000
TOTAL ECONOMIC IMPACT[Increase in Earnings + Total Production] $66,028
! "#$%&' (# )*+#,

Utah
Population Eligible for the DREAM Act : 23,000
Projection of Eligible Population Attaining College Education by Passage
of DREAM Act
0%
5%
10%
15%
20%
25%
2010 2015 2020 2025 2030
Without DREAM Act With DREAM Act
Cumulative Gain in Earnings of Eligible Population by the Passage of DREAM
Act
0
200
400
600
800
1000
1200
1400
1600
2010 2015 2020 2025 2030M
illio
ns 2
012
$
!"#$%&'"()*%&+',-')*++"./'&0$'!#$*('*%&
2010-2020
$379.6
2020-2025
$416
2025-2030
$603
Total
$1,398Increase in Earnings (Millons)
Category
Increase in college-educated workers 300 1,100 1,700 3,100
Number of eligible DREAMERs 23,000 17,000 15,000
".!1%$!'"()*%&+',-')*++"./'&0$'!#$*('*%&
Category
Jobs generated 4,092
2020-2025
4,505
2025-2030
6,539
Total
15,137
2010-2020
$141.2Increase in Labor income (Millions) $156 $226 $523
Increase in Value Added (Millions) $255.5 $280 $407 $943
Increase in Total Production (Millions) $433.5 $476 $691 $1,601
Increase Individual Income Taxes (Millions) $12.0 $13.3 $19.3 $44.6Increase Business taxes (Millions) $10.4 $11.4 $16.6 $38.3
$813 $892 $1,294
Total Economic Impact $2,999,000,000
TOTAL ECONOMIC IMPACT[Increase in Earnings + Total Production] $2,999
! "#$%&' (# )*+#,

Vermont -%(*+.+*( &/(/ 01(2 3/$(1#%
Population Eligible for the DREAM Act : <1000
Projection of Eligible Population Attaining College Education by Passage
of DREAM Act
0%5%
10%15%
20%25%
30%35%
2010 2015 2020 2025 2030
Without DREAM Act With DREAM Act
Cumulative Gain in Earnings of Eligible Population by the Passage of DREAM
Act
02468
101214161820
2010 2015 2020 2025 2030M
illio
ns 2
012
$
!"#$%&'"()*%&+',-')*++"./'&0$'!#$*('*%&
2010-2020
$7.0
2020-2025
$4
2025-2030
$7
Total
$18Increase in Earnings (Millons)
Category
Increase in college-educated workers # # # #
Number of eligible DREAMERs <1000 <1000 <1000
".!1%$!'"()*%&+',-')*++"./'&0$'!#$*('*%&
Category
Jobs generated 62
2020-2025
35
2025-2030
63
Total
159
2010-2020
$2.3Increase in Labor income (Millions) $1 $2 $6
Increase in Value Added (Millions) $4.1 $2 $4 $10
Increase in Total Production (Millions) $6.6 $4 $6 $17
Increase Individual Income Taxes (Millions) $.2 $.1 $.2 $.5Increase Business taxes (Millions) $.2 $.1 $.1 $.4
$14 $8 $13
Total Economic Impact $35,000,000
TOTAL ECONOMIC IMPACT[Increase in Earnings + Total Production] $35
! "#$%&' (# )*+#,

Virginia
Population Eligible for the DREAM Act : 38,000
Projection of Eligible Population Attaining College Education by Passage
of DREAM Act
0%5%
10%15%
20%25%
30%35%
2010 2015 2020 2025 2030
Without DREAM Act With DREAM Act
Cumulative Gain in Earnings of Eligible Population by the Passage of DREAM
Act
0
500
1000
1500
2000
2500
3000
2010 2015 2020 2025 2030M
illio
ns 2
012
$
!"#$%&'"()*%&+',-')*++"./'&0$'!#$*('*%&
2010-2020
$537.5
2020-2025
$805
2025-2030
$1,298
Total
$2,641Increase in Earnings (Millons)
Category
Increase in college-educated workers 100 900 1,200 2,200
Number of eligible DREAMERs 38,000 29,000 26,000
".!1%$!'"()*%&+',-')*++"./'&0$'!#$*('*%&
Category
Jobs generated 4,230
2020-2025
6,171
2025-2030
9,880
Total
20,280
2010-2020
$181.9Increase in Labor income (Millions) $270 $431 $883
Increase in Value Added (Millions) $334.4 $498 $799 $1,632
Increase in Total Production (Millions) $524.6 $784 $1,252 $2,560
Increase Individual Income Taxes (Millions) $18.3 $27.2 $43.4 $89.0Increase Business taxes (Millions) $14.0 $21.0 $33.9 $68.9
$1,062 $1,589 $2,551
Total Economic Impact $5,202,000,000
TOTAL ECONOMIC IMPACT[Increase in Earnings + Total Production] $5,202
! "#$%&' (# )*+#,

Washington
Population Eligible for the DREAM Act : 40,000
Projection of Eligible Population Attaining College Education by Passage
of DREAM Act
0%
5%
10%
15%
20%
25%
30%
2010 2015 2020 2025 2030
Without DREAM Act With DREAM Act
Cumulative Gain in Earnings of Eligible Population by the Passage of DREAM
Act
0
500
1000
1500
2000
2500
3000
2010 2015 2020 2025 2030M
illio
ns 2
012
$
!"#$%&'"()*%&+',-')*++"./'&0$'!#$*('*%&
2010-2020
$745.1
2020-2025
$801
2025-2030
$1,106
Total
$2,653Increase in Earnings (Millons)
Category
Increase in college-educated workers 600 1,800 2,500 4,900
Number of eligible DREAMERs 40,000 28,000 25,000
".!1%$!'"()*%&+',-')*++"./'&0$'!#$*('*%&
Category
Jobs generated 6,628
2020-2025
7,040
2025-2030
9,654
Total
23,321
2010-2020
$292.0Increase in Labor income (Millions) $312 $427 $1,030
Increase in Value Added (Millions) $527.6 $563 $775 $1,865
Increase in Total Production (Millions) $856.2 $916 $1,255 $3,027
Increase Individual Income Taxes (Millions) $22.2 $23.7 $32.4 $78.2Increase Business taxes (Millions) $19.6 $21.0 $29.0 $69.6
$1,601 $1,717 $2,361
Total Economic Impact $5,680,000,000
TOTAL ECONOMIC IMPACT[Increase in Earnings + Total Production] $5,680
! "#$%&' (# )*+#,

West Virginia -%(*+.+*( &/(/ 01(2 3/$(1#%
Population Eligible for the DREAM Act : <1000
Projection of Eligible Population Attaining College Education by Passage
of DREAM Act
0%
5%
10%
15%
20%
25%
30%
2010 2015 2020 2025 2030
Without DREAM Act With DREAM Act
Cumulative Gain in Earnings of Eligible Population by the Passage of DREAM
Act
0
2
4
6
8
10
12
2010 2015 2020 2025 2030M
illio
ns 2
012
$
!"#$%&'"()*%&+',-')*++"./'&0$'!#$*('*%&
2010-2020
$2.7
2020-2025
$4
2025-2030
$4
Total
$10Increase in Earnings (Millons)
Category
Increase in college-educated workers # # # #
Number of eligible DREAMERs <1000 <1000 <1000
".!1%$!'"()*%&+',-')*++"./'&0$'!#$*('*%&
Category
Jobs generated 20
2020-2025
28
2025-2030
27
Total
75
2010-2020
$.6Increase in Labor income (Millions) $1 $1 $3
Increase in Value Added (Millions) $1.2 $2 $2 $5
Increase in Total Production (Millions) $1.9 $3 $3 $8
Increase Individual Income Taxes (Millions) $.0 $.1 $.1 $.2Increase Business taxes (Millions) $.0 $.1 $.1 $.2
$5 $7 $6
Total Economic Impact $18,000,000
TOTAL ECONOMIC IMPACT[Increase in Earnings + Total Production] $18
! "#$%&' (# )*+#,

Wisconsin
Population Eligible for the DREAM Act : 16,000
Projection of Eligible Population Attaining College Education by Passage
of DREAM Act
0%
5%
10%
15%
20%
25%
30%
2010 2015 2020 2025 2030
Without DREAM Act With DREAM Act
Cumulative Gain in Earnings of Eligible Population by the Passage of DREAM
Act
0
100
200
300
400
500
600
700
800
900
2010 2015 2020 2025 2030M
illio
ns 2
012
$
!"#$%&'"()*%&+',-')*++"./'&0$'!#$*('*%&
2010-2020
$200.2
2020-2025
$235
2025-2030
$389
Total
$825Increase in Earnings (Millons)
Category
Increase in college-educated workers 200 700 1,100 1,900
Number of eligible DREAMERs 16,000 11,000 10,000
".!1%$!'"()*%&+',-')*++"./'&0$'!#$*('*%&
Category
Jobs generated 2,047
2020-2025
2,414
2025-2030
3,928
Total
8,390
2010-2020
$76.3Increase in Labor income (Millions) $92 $149 $317
Increase in Value Added (Millions) $133.3 $159 $259 $551
Increase in Total Production (Millions) $223.4 $269 $434 $926
Increase Individual Income Taxes (Millions) $7.2 $8.7 $14.1 $30.1Increase Business taxes (Millions) $4.9 $5.8 $9.5 $20.1
$424 $504 $823
Total Economic Impact $1,751,000,000
TOTAL ECONOMIC IMPACT[Increase in Earnings + Total Production] $1,751
! "#$%&' (# )*+#,

Wyoming -%(*+.+*( &/(/ 01(2 3/$(1#%
Population Eligible for the DREAM Act : <1000
Projection of Eligible Population Attaining College Education by Passage
of DREAM Act
0%
5%
10%
15%
20%
25%
30%
2010 2015 2020 2025 2030
Without DREAM Act With DREAM Act
Cumulative Gain in Earnings of Eligible Population by the Passage of DREAM
Act
-2
0
2
4
6
8
10
12
2010 2015 2020 2025 2030M
illio
ns 2
012
$
!"#$%&'"()*%&+',-')*++"./'&0$'!#$*('*%&
2010-2020
$.5
2020-2025
$3
2025-2030
$7
Total
$11Increase in Earnings (Millons)
Category
Increase in college-educated workers # # # #
Number of eligible DREAMERs <1000 <1000 <1000
".!1%$!'"()*%&+',-')*++"./'&0$'!#$*('*%&
Category
Jobs generated 3
2020-2025
21
2025-2030
46
Total
69
2010-2020
$.1Increase in Labor income (Millions) $1 $1 $2
Increase in Value Added (Millions) $.2 $1 $3 $4
Increase in Total Production (Millions) $.3 $2 $5 $7
Increase Individual Income Taxes (Millions) $.0 $.1 $.1 $.2Increase Business taxes (Millions) $.0 $.1 $.1 $.2
$1 $6 $12
Total Economic Impact $18,000,000
TOTAL ECONOMIC IMPACT[Increase in Earnings + Total Production] $18
! "#$%&' (# )*+#,