the economic impact of ferrous and non-ferrous mining
TRANSCRIPT
The Economic Impact
of Ferrous and
Non-Ferrous Mining
on the State of Minnesota and the
Arrowhead Region, including Douglas County, Wisconsin
November 2012
For
Minnesota Department of Employment and Economic Development (DEED)
Minnesota Power
Natural Resources and Research Institute (NRRI) University of Minnesota
Iron Range Resources and Rehabilitation Board (IRRRB)
Iron Mining Association of Minnesota
Mining Minnesota
Labovitz School OF BUSINESS AND ECONOMICS
UNIVERSITY OF MINNESOTA DULUTH Bureau of Business and Economic Research

Bureau of Business and Economic Research Labovitz School of Business and Economics, University of Minnesota Duluth
ii
Research Team
UMD Labovitz School of Business and Economics
Bureau of Business and Economic Research James A. Skurla, Director Gina Grensing, Editor Jenna Jacobson, Undergraduate Research Assistant Colleen Swenson, Undergraduate Research Assistant Vickie Almquist-Minko, Executive Administrative Specialist Bureau of Business and Economic Research 213 Labovitz School of Business and Economics 1318 Kirby Drive University of Minnesota Duluth Duluth, MN 55812 (218) 726-8614 http://www.d.umn.edu/lsbe/bber.php
The Bureau of Business and Economic Research extends a thank you to industry representatives from ArcelorMittal/Minorca Mine, Cardero, Cliffs Natural Resources, Duluth Metals, Encampment Minerals, Essar Steel Minnesota, Hibbing Taconite, Keetac, Kennecott Exploration, Magnetation, Mesabi Nugget, Mining Resources, Minntac, Northshore Mining, PolyMet, Teck American, Twin Metals, U.S. Steel, Vermillion Gold, United Taconite, and others for their willingness to provide information. The BBER also thanks Minnesota State representatives from the Department of Natural Resources, the Department of Revenue, and the Department of Employment and Economic Development, along with the University of Minnesota Natural Resources Research Institute for their assistance with fact-finding and background information.

Bureau of Business and Economic Research Labovitz School of Business and Economics, University of Minnesota Duluth
iii
Table of Contents
RESEARCH TEAM .................................................................................................................................................... II
TABLE OF CONTENTS ............................................................................................................................................. III
TABLE OF TABLES .................................................................................................................................................. IV
TABLE OF FIGURES ................................................................................................................................................ VI
EXECUTIVE SUMMARY ......................................................................................................................................... VII
I. PROJECT DESCRIPTION .................................................................................................................................. 1
MODELING ......................................................................................................................................................... 2 DELIVERABLES ...................................................................................................................................................... 2 STUDY AREA ........................................................................................................................................................ 3
II. IMPACT PROCEDURES AND INPUT ASSUMPTIONS ............................................................................................. 5
IMPLAN MODELS ............................................................................................................................................... 5 DATA ................................................................................................................................................................. 5 DEFINITIONS USED IN THIS REPORT ......................................................................................................................... 6 INDUSTRY DEFINITIONS .......................................................................................................................................... 6 MODEL ASSUMPTIONS .......................................................................................................................................... 7 PROJECT TIME LINES AND SELECTION OF IMPACT YEAR ................................................................................................ 8
III. FINDINGS: FERROUS MINING IMPACTS ........................................................................................................... 10
FERROUS MINING INDUSTRY’S CONTRIBUTION TO THE STATE’S ECONOMY .................................................................... 10 ECONOMIC IMPACT: PROPOSED FERROUS MINING EXPANSIONS AND NEW PROJECTS ..................................................... 13 MINNESOTA CONSTRUCTION: PROPOSED FERROUS MINING EXPANSIONS AND NEW PROJECTS ......................................... 13 MINNESOTA OPERATIONS: PROPOSED FERROUS EXPANSIONS AND MINING PROJECTS .................................................... 14 MINNESOTA OPERATIONS: ALL PROPOSED AND CONTINUING FERROUS MINING, 2016 .................................................. 14 REGION CONSTRUCTION: PROPOSED FERROUS MINING EXPANSIONS AND NEW PROJECTS ............................................... 14 REGION OPERATIONS: PROPOSED FERROUS MINING EXPANSIONS AND NEW PROJECTS ................................................... 15 REGION OPERATIONS: ALL PROPOSED AND CONTINUING FERROUS MINING, 2016 ........................................................ 15 FERROUS MINING TAX IMPACTS ............................................................................................................................ 15 FERROUS MINING TAX IMPACTS ON MINNESOTA AND THE REGION .............................................................................. 15 FERROUS MINING DEVELOPMENT SCENARIOS .......................................................................................................... 17 75% OR 50% IMPACT: POSSIBLE FERROUS MINING PROJECTS COMPLETED, MINNESOTA AND THE REGION ........................ 18
IV. FINDINGS: NON-FERROUS MINING IMPACTS .................................................................................................. 18
NON-FERROUS MINING’S CONTRIBUTION TO THE STATE’S ECONOMY .......................................................................... 19 THE ECONOMIC IMPACTS OF NON-FERROUS MINING PROPOSED PROJECTS .................................................................. 22 MINNESOTA CONSTRUCTION: PROPOSED NON-FERROUS MINING PROJECTS ................................................................. 22 MINNESOTA OPERATIONS: ALL PROPOSED AND CONTINUING NON-FERROUS MINING, 2016 .......................................... 23 REGION CONSTRUCTION: PROPOSED NON-FERROUS MINING PROJECTS ....................................................................... 23 REGION OPERATIONS: PROPOSED NON-FERROUS MINING PROJECTS ........................................................................... 23 REGION OPERATIONS: ALL PROPOSED AND CONTINUING NON-FERROUS MINING, 2016 ................................................ 24 NON-FERROUS TAX IMPACTS ................................................................................................................................ 24 NON-FERROUS MINING TAX IMPACTS ON MINNESOTA AND THE REGION ...................................................................... 24 NON-FERROUS DEVELOPMENT SCENARIOS .............................................................................................................. 25 75% AND 50% IMPACT: POSSIBLE NON-FERROUS MINING PROJECTS COMPLETED, MINNESOTA AND REGION .................... 25

Bureau of Business and Economic Research Labovitz School of Business and Economics, University of Minnesota Duluth
iv
V. FINDINGS: FERROUS AND NON-FERROUS MINING IMPACTS ........................................................................... 25
CONTRIBUTION TO THE STATE’S ECONOMY .............................................................................................................. 26 THE ECONOMIC IMPACTS OF PROPOSED PROJECTS ................................................................................................... 27 MINNESOTA CONSTRUCTION: EXPANSIONS AND PROPOSED FERROUS AND NEW NON-FERROUS MINING PROJECTS ............. 28 MINNESOTA OPERATIONS: EXPANSIONS AND PROPOSED FERROUS AND NON-FERROUS MINING PROJECTS ......................... 28 MINNESOTA OPERATIONS: ALL FERROUS AND NON-FERROUS MINING OPERATIONS ...................................................... 28 REGION CONSTRUCTION: EXPANSIONS AND PROPOSED FERROUS AND NON-FERROUS MINING PROJECTS ........................... 29 REGION OPERATIONS: FERROUS AND NON-FERROUS EXPANSIONS AND PROPOSED PROJECTS ........................................... 29 REGION OPERATIONS: ALL FERROUS AND NON-FERROUS MINING OPERATIONS ............................................................ 29 FERROUS AND NON-FERROUS TAX IMPACTS ........................................................................................................... 30 FERROUS AND NON-FERROUS DEVELOPMENT SCENARIOS .......................................................................................... 31 75% AND 50% IMPACT: POSSIBLE FERROUS AND NON-FERROUS MINING PROJECTS COMPLETED, MINNESOTA AND REGION ............. 31
VII. CONCLUSIONS ............................................................................................................................................... 32
REFERENCES ...................................................................................................................................................... 36
APPENDIX A: TAXES, SCHOOL SUPPORT, AND THE STATE OF MINNESOTA’S MINERAL REVENUE…………………….. A-1
APPENDIX B: OTHER INFORMATION ………………………………………………………………………………………………………………A-16
Table of Tables TABLE 1. SECTOR PERCENTAGES OF TOTAL GRP IN BILLIONS, NORTHEAST MINNESOTA 2010 .......................................................... 4 TABLE 2. FERROUS MINING INDUSTRY DEFINITION .................................................................................................................... 6 TABLE 3. NON-FERROUS INDUSTRY DEFINITION ....................................................................................................................... 6 TABLE 4: MINNESOTA FERROUS MINING, ECONOMIC IMPACTS, BASELINE 2010 .......................................................................... 11 TABLE 5: ARROWHEAD AND DOUGLAS COUNTY, WISCONSIN, FERROUS MINING, ECONOMIC IMPACTS, BASELINE 2010 ..................... 11 TABLE 6: IRON ORE MINING EMPLOYMENT IMPACTS IN MINNESOTA, TOP TWENTY-FIVE DETAIL, BASELINE 2010 ............................. 12 TABLE 7. FERROUS MINING CONSTRUCTION’S VALUE ADDED, OUTPUT, AND EMPLOYMENT IMPACTS ON THE STATE OF MINNESOTA
2012–2016, PROPOSED EXPANSIONS AND NEW PROJECTS ............................................................................................ 13 TABLE 8. FERROUS MINING OPERATION’S VALUE ADDED, OUTPUT, AND EMPLOYMENT IMPACTS ON THE STATE OF MINNESOTA,
2016, PROPOSED EXPANSIONS AND NEW PROJECTS ...................................................................................................... 14 TABLE 9. FERROUS MINING OPERATION’S VALUE ADDED, OUTPUT, AND EMPLOYMENT IMPACTS ON THE STATE OF MINNESOTA,
2016, ALL OPERATIONS ........................................................................................................................................... 14 TABLE 10. FERROUS MINING CONSTRUCTION’S VALUE ADDED, OUTPUT, AND EMPLOYMENT IMPACTS ON THE ARROWHEAD
REGION AND DOUGLAS COUNTY, WISCONSIN, 2012–2016............................................................................................ 14 TABLE 11. FERROUS MINING OPERATION’S VALUE ADDED, OUTPUT, AND EMPLOYMENT IMPACTS ON THE ARROWHEAD
REGION AND DOUGLAS COUNTY, WISCONSIN, EXPANSIONS AND NEW PROJECTS, 2016 ....................................................... 15 TABLE 12. FERROUS MINING OPERATION’S VALUE ADDED, OUTPUT, AND EMPLOYMENT IMPACTS ON THE ARROWHEAD
REGION AND DOUGLAS COUNTY, WISCONSIN, 2013, ALL OPERATIONS ............................................................................. 15 TABLE 13. MINNESOTA’S IRON MINES DIRECT SUPPORT FOR THE STATE ..................................................................................... 16 TABLE 14. MINNESOTA’S IRON MINING INDUSTRY SUPPORT FOR EDUCATION .............................................................................. 16 TABLE 15. MINNESOTA FERROUS MINERAL ROYALTIES AND RENTALS RECEIPTS, 2010 AND 2011 .................................................. 17 TABLE 16. FERROUS MINING IMPACT ON MINNESOTA: 75% AND 50% IMPACT OF COMPLETION OF ALL PROPOSED EXPANSIONS
AND NEW PROJECTS ................................................................................................................................................. 18 TABLE 17. FERROUS MINING IMPACT ON THE ARROWHEAD REGION AND DOUGLAS COUNTY, WISCONSIN: 75% AND 50%
IMPACT OF COMPLETION OF ALL PROPOSED EXPANSIONS AND NEW PROJECTS .................................................................... 18 TABLE 18. MINNESOTA NON-FERROUS MINING ECONOMIC IMPACTS, BASELINE 2010 ................................................................. 20 TABLE 19. ARROWHEAD AND DOUGLAS COUNTY, WISCONSIN, NON-FERROUS MINING ECONOMIC IMPACTS, BASELINE 2010 ............ 20

Bureau of Business and Economic Research Labovitz School of Business and Economics, University of Minnesota Duluth
v
TABLE 20. NON-FERROUS MINING EMPLOYMENT IMPACTS IN MINNESOTA, TOP TWENTY-FIVE DETAIL, BASELINE 2010 .................... 21 TABLE 21. NON-FERROUS MINING CONSTRUCTION’S VALUE ADDED, OUTPUT, AND EMPLOYMENT IMPACTS ON THE STATE OF
MINNESOTA 2012–2016, NEW PROJECTS, AGGREGATED .............................................................................................. 22 TABLE 22. NON-FERROUS MINING OPERATION’S VALUE ADDED, OUTPUT, AND EMPLOYMENT IMPACTS ON THE STATE OF
MINNESOTA, NEW PROJECTS, 2016 ........................................................................................................................... 22 TABLE 23. NON-FERROUS MINING OPERATION’S VALUE ADDED, OUTPUT, AND EMPLOYMENT IMPACTS ON THE STATE OF
MINNESOTA, 2016, ALL OPERATIONS ......................................................................................................................... 23 TABLE 24. NON-FERROUS MINING CONSTRUCTION’S VALUE ADDED, OUTPUT, AND EMPLOYMENT IMPACTS ON THE ARROWHEAD
REGION AND DOUGLAS COUNTY, WISCONSIN, NEW PROJECTS, AGGREGATED, 2012-2016 .................................................. 23 TABLE 25. NON-FERROUS MINING OPERATION’S VALUE ADDED, OUTPUT, AND EMPLOYMENT IMPACTS ON THE ARROWHEAD
REGION AND DOUGLAS COUNTY, WISCONSIN, NEW PROJECTS, 2016 ............................................................................... 23 TABLE 26. NON-FERROUS MINING OPERATION’S VALUE ADDED, OUTPUT, AND EMPLOYMENT IMPACTS ON THE ARROWHEAD
REGION AND DOUGLAS COUNTY, WISCONSIN, 2016, ALL OPERATIONS ............................................................................. 24 TABLE 27. MINNESOTA NON-FERROUS MINERAL ROYALTIES AND RENTALS RECEIPTS, 2010 AND 2011 .......................................... 24 TABLE 28. NON-FERROUS MINING IMPACT ON MINNESOTA: 75% AND 50% IMPACT OF COMPLETION OF ALL PROPOSED
EXPANSIONS AND NEW PROJECTS ............................................................................................................................... 25 TABLE 29. NON-FERROUS MINING IMPACT ON THE ARROWHEAD REGION AND DOUGLAS COUNTY, WISCONSIN: 75% AND 50%
IMPACT OF COMPLETION OF ALL PROPOSED EXPANSIONS AND NEW PROJECTS .................................................................... 25 TABLE 30. MINNESOTA FERROUS AND NON-FERROUS MINING ECONOMIC IMPACTS, BASELINE 2010 ............................................. 27 TABLE 31. ARROWHEAD AND DOUGLAS COUNTY, WISCONSIN, FERROUS AND NON-FERROUS MINING ECONOMIC IMPACTS,
BASELINE 2010 ....................................................................................................................................................... 27 TABLE 32. FERROUS AND NON-FERROUS MINING CONSTRUCTION’S VALUE ADDED, OUTPUT, AND EMPLOYMENT IMPACTS ON
THE STATE OF MINNESOTA 2012–2016 (AGGREGATED, ALL PROJECTS) ............................................................................ 28 TABLE 33. FERROUS AND NON-FERROUS MINING EXPANSIONS AND NEW PROJECTS OPERATION’S VALUE ADDED, OUTPUT, AND
EMPLOYMENT IMPACTS ON THE STATE OF MINNESOTA, 2016 ......................................................................................... 28 TABLE 34. MINNESOTA FERROUS AND NON-FERROUS MINING ECONOMIC IMPACTS: EXPANSIONS, STARTUPS, AND ALL OTHER
OPERATIONS, AGGREGATED, 2016 ............................................................................................................................. 28 TABLE 35. FERROUS AND NON-FERROUS MINING CONSTRUCTION’S VALUE ADDED, OUTPUT, AND EMPLOYMENT IMPACTS ON THE
ARROWHEAD AND DOUGLAS COUNTY, WISCONSIN, 2012–2016 (AGGREGATED, ALL PROJECTS) .......................................... 29 TABLE 36. FERROUS AND NON-FERROUS MINING EXPANSIONS AND NEW PROJECTS OPERATION’S VALUE ADDED, OUTPUT, AND
EMPLOYMENT IMPACTS ON THE ARROWHEAD AND DOUGLAS COUNTY, WISCONSIN, 2016 ................................................... 29 TABLE 37. ARROWHEAD AND DOUGLAS COUNTY, WISCONSIN, FERROUS AND NON-FERROUS MINING ECONOMIC IMPACTS:
EXPANSIONS, STARTUPS, AND ALL OTHER OPERATIONS, AGGREGATED, 2016 ..................................................................... 29 TABLE 38. MINNESOTA FERROUS AND NON-FERROUS ROYALTIES AND RENTALS RECEIPTS, 2010 AND 2011 .................................... 30 TABLE 39. FERROUS AND NON-FERROUS MINING IMPACT ON MINNESOTA: 75% AND 50% IMPACT OF COMPLETION OF ALL PROPOSED
EXPANSIONS AND NEW PROJECTS ............................................................................................................................... 31 TABLE 40. FERROUS AND NON-FERROUS MINING IMPACT ON THE ARROWHEAD REGION AND DOUGLAS COUNTY, WISCONSIN,
75% AND 50% IMPACT OF COMPLETION OF ALL PROPOSED EXPANSIONS AND NEW PROJECTS .............................................. 31 TABLE 41. SUMMARIES: FERROUS AND NON-FERROUS OPERATIONS IMPACTS ON MINNESOTA, BASELINE 2010, AND PROPOSED
EXPANSIONS AND NEW PROJECTS, IN 2012 DOLLARS ..................................................................................................... 32 TABLE 42. SUMMARIES: FERROUS AND NON-FERROUS OPERATIONS IMPACTS ON THE ARROWHEAD REGION AND DOUGLAS
COUNTY, WISCONSIN, BASELINE 2010, AND PROPOSED EXPANSIONS AND NEW PROJECTS, IN 2012 DOLLARS ......................... 33 TABLE 43. FERROUS MINING TAX IMPACT ON MINNESOTA, 2016 ........................................................................................ A-15 TABLE 44. TAX IMPACT TOTALS, INCLUDING PROPOSED EXPANSIONS AND NEW PROJECTS AS WELL AS ON-GOING FERROUS
AND NON-FERROUS OPERATIONS, 2016.................................................................................................................. A-15 TABLE 45. MINNESOTA MINING EMPLOYMENT AND PAYROLL .............................................................................................. A-16 TABLE 46. LOCATION QUOTIENTS, ARROWHEAD REGION, COMPARED TO THE STATE OF MINNESOTA, 2011 ................................. A-17 TABLE 47. INDIRECT AND INDUCED JOBS DEPENDENT ON IRON ORE MINING EMPLOYMENT IN MINNESOTA, 2010 ........................ A-18

Bureau of Business and Economic Research Labovitz School of Business and Economics, University of Minnesota Duluth
vi
Table of Figures FIGURE 1: NE MINNESOTA PERCENTAGE GROSS REGIONAL PRODUCT (GRP) BY INDUSTRY SECTOR ................................................... X FIGURE 2: LOCAL SUPPLIER PURCHASES ................................................................................................................................ XIII FIGURE 3. COUNTIES OF MINNESOTA’S ARROWHEAD REGION AND DOUGLAS COUNTY, WISCONSIN .................................................. 3 FIGURE 4. NE MINNESOTA PERCENTAGE GROSS REGIONAL PRODUCT (GRP) BY INDUSTRY SECTORS ................................................. 4 FIGURE 5. BBER’S ASSUMPTIONS FOR PROJECT TIME LINES AND SELECTION OF IMPACT YEAR 2016* ............................................... 9 FIGURE 6. TOTAL ECONOMIC IMPACT OF FERROUS AND NON-FERROUS MINING PAYROLLS (VALUE ADDED) IN 2012 MILLIONS
OF DOLLARS ............................................................................................................................................................ 34 FIGURE 7. TOTAL ECONOMIC IMPACT OF FERROUS AND NON-FERROUS MINING PRODUCTION (OUTPUT) IN 2012 MILLIONS
OF DOLLARS ............................................................................................................................................................ 35 FIGURE 8. TOTAL ECONOMIC IMPACT OF FERROUS AND NON-FERROUS MINING (EMPLOYMENT) .................................................... 36 FIGURE 9. TACONITE PRODUCTION TAX .............................................................................................................................. A-2 FIGURE 10. OCCUPATION TAX PAID BY COMPANY ................................................................................................................ A-3 FIGURE 11. USE TAX PAID................................................................................................................................................ A-4 FIGURE 12. ROYALTY PAID AND INCOME TAX WITHHELD ....................................................................................................... A-5 FIGURE 13. TACONITE PRODUCTION TAX DISTRIBUTIONS TO SCHOOL DISTRICTS, 2011 ............................................................... A-6 FIGURE 14. TACONITE PRODUCTION TAX SCHOOL BOND PAYMENTS ........................................................................................ A-7 FIGURE 15. IRON ORE AD VALOREM TAX PAYABLE ............................................................................................................... A-8 FIGURE 16. TACONITE RAILROAD AD VALOREM TAX ASSESSED ............................................................................................... A-9 FIGURE 17. TAX COLLECTION AND DISTRIBUTION ................................................................................................................. A-9 FIGURE 18. UNMINED TACONITE TAX PAID ....................................................................................................................... A-10 FIGURE 19. FY 2011 PROCEEDS TO BE TRANSFERRED TO THE PUF ........................................................................................ A-10 FIGURE 20. FY 1992-2011 MINERAL LEASE REVENUE DISTRIBUTION BY ACCOUNT ................................................................. A-11 FIGURE 21. FY 1994-2011 DISTRIBUTION OF ENDOWED SCHOLARSHIP ACCOUNT INCOME* ..................................................... A-12 FIGURE 22. MINERAL REVENUE (IN THOUSANDS) FY 2002-2011 ......................................................................................... A-13 FIGURE 23. REVENUE FROM MINERAL LEASES, FY 2010-2011 ............................................................................................ A-13 FIGURE 24. SCHOOL TRUST FUND GROSS MINERALS REVENUE FY 1994-2011 ....................................................................... A-14
Bureau of Business and Economic Research Labovitz School of Business and Economics, University of Minnesota Duluth
vii
Executive Summary
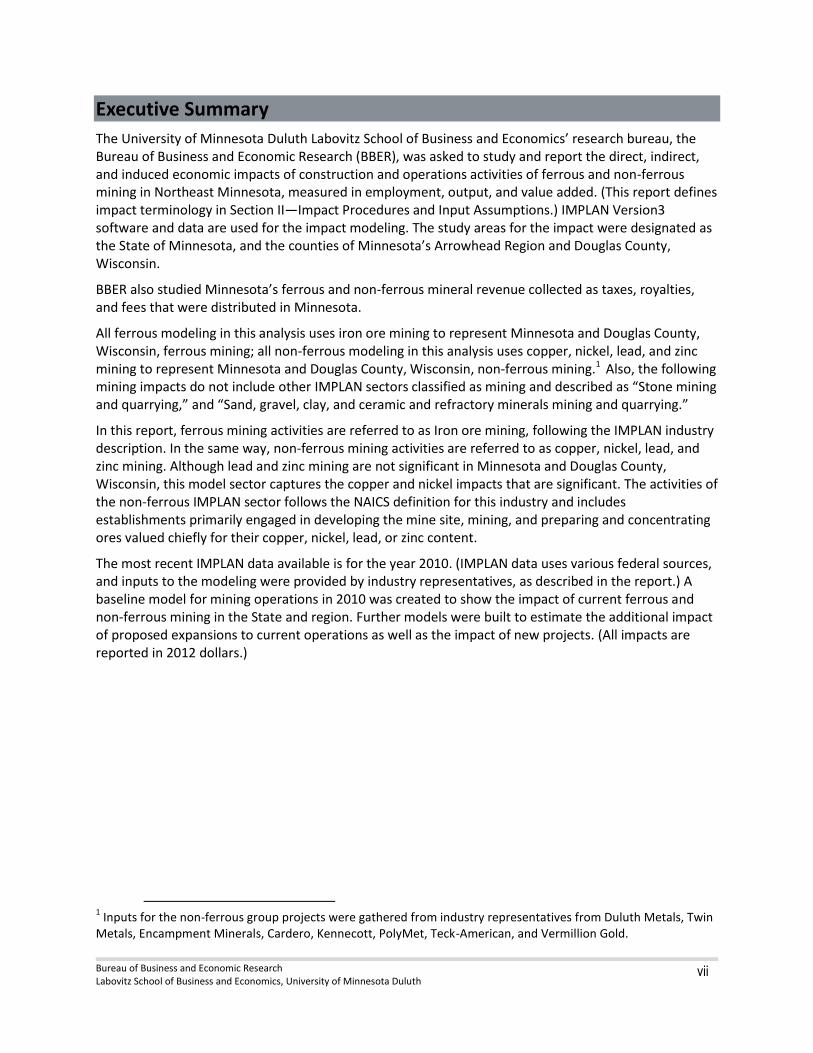
The University of Minnesota Duluth Labovitz School of Business and Economics’ research bureau, the Bureau of Business and Economic Research (BBER), was asked to study and report the direct, indirect, and induced economic impacts of construction and operations activities of ferrous and non-ferrous mining in Northeast Minnesota, measured in employment, output, and value added. (This report defines impact terminology in Section II—Impact Procedures and Input Assumptions.) IMPLAN Version3 software and data are used for the impact modeling. The study areas for the impact were designated as the State of Minnesota, and the counties of Minnesota’s Arrowhead Region and Douglas County, Wisconsin.
BBER also studied Minnesota’s ferrous and non-ferrous mineral revenue collected as taxes, royalties, and fees that were distributed in Minnesota.
All ferrous modeling in this analysis uses iron ore mining to represent Minnesota and Douglas County, Wisconsin, ferrous mining; all non-ferrous modeling in this analysis uses copper, nickel, lead, and zinc mining to represent Minnesota and Douglas County, Wisconsin, non-ferrous mining.1 Also, the following mining impacts do not include other IMPLAN sectors classified as mining and described as “Stone mining and quarrying,” and “Sand, gravel, clay, and ceramic and refractory minerals mining and quarrying.”
In this report, ferrous mining activities are referred to as Iron ore mining, following the IMPLAN industry description. In the same way, non-ferrous mining activities are referred to as copper, nickel, lead, and zinc mining. Although lead and zinc mining are not significant in Minnesota and Douglas County, Wisconsin, this model sector captures the copper and nickel impacts that are significant. The activities of the non-ferrous IMPLAN sector follows the NAICS definition for this industry and includes establishments primarily engaged in developing the mine site, mining, and preparing and concentrating ores valued chiefly for their copper, nickel, lead, or zinc content.
The most recent IMPLAN data available is for the year 2010. (IMPLAN data uses various federal sources, and inputs to the modeling were provided by industry representatives, as described in the report.) A baseline model for mining operations in 2010 was created to show the impact of current ferrous and non-ferrous mining in the State and region. Further models were built to estimate the additional impact of proposed expansions to current operations as well as the impact of new projects. (All impacts are reported in 2012 dollars.)
1 Inputs for the non-ferrous group projects were gathered from industry representatives from Duluth Metals, Twin
Metals, Encampment Minerals, Cardero, Kennecott, PolyMet, Teck-American, and Vermillion Gold.
Bureau of Business and Economic Research Labovitz School of Business and Economics, University of Minnesota Duluth
viii
Key Results
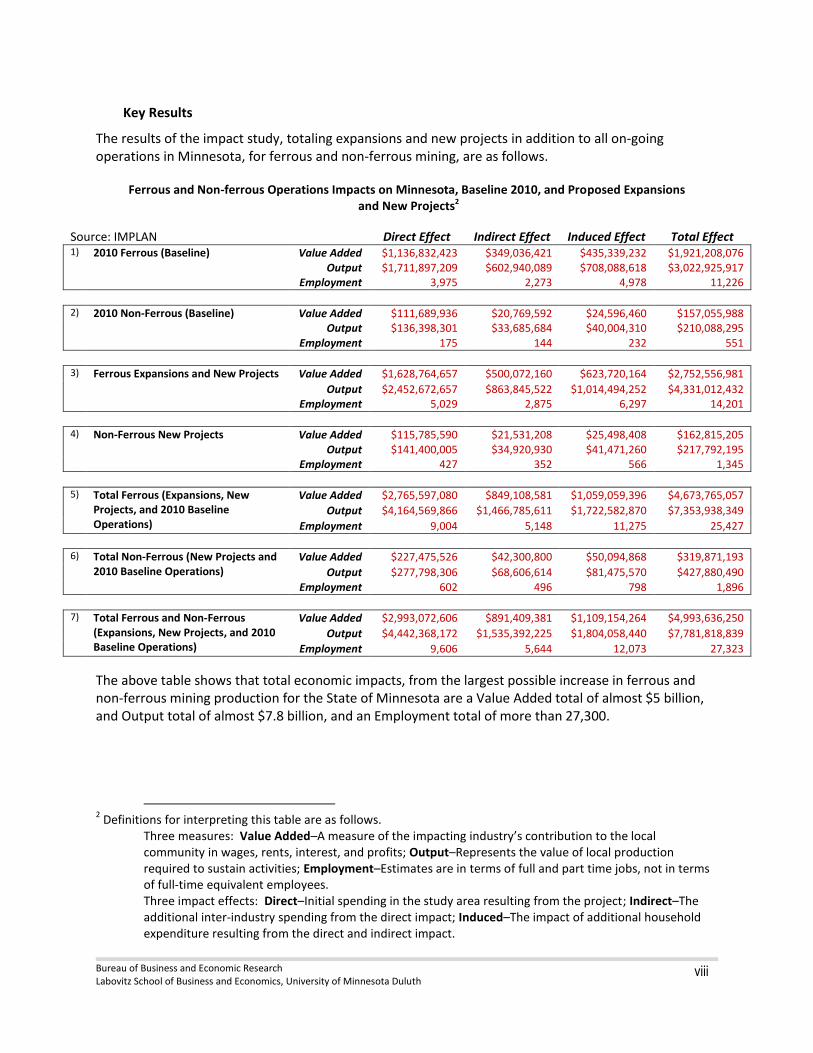
The results of the impact study, totaling expansions and new projects in addition to all on-going operations in Minnesota, for ferrous and non-ferrous mining, are as follows.
Ferrous and Non-ferrous Operations Impacts on Minnesota, Baseline 2010, and Proposed Expansions and New Projects2
Source: IMPLAN Direct Effect Indirect Effect Induced Effect Total Effect 1) 2010 Ferrous (Baseline) Value Added $1,136,832,423 $349,036,421 $435,339,232 $1,921,208,076
Output $1,711,897,209 $602,940,089 $708,088,618 $3,022,925,917
Employment 3,975 2,273 4,978 11,226
2) 2010 Non-Ferrous (Baseline) Value Added $111,689,936 $20,769,592 $24,596,460 $157,055,988
Output $136,398,301 $33,685,684 $40,004,310 $210,088,295
Employment 175 144 232 551
3) Ferrous Expansions and New Projects Value Added $1,628,764,657 $500,072,160 $623,720,164 $2,752,556,981
Output $2,452,672,657 $863,845,522 $1,014,494,252 $4,331,012,432
Employment 5,029 2,875 6,297 14,201
4) Non-Ferrous New Projects Value Added $115,785,590 $21,531,208 $25,498,408 $162,815,205
Output $141,400,005 $34,920,930 $41,471,260 $217,792,195
Employment 427 352 566 1,345
5) Total Ferrous (Expansions, New
Projects, and 2010 Baseline Operations)
Value Added $2,765,597,080 $849,108,581 $1,059,059,396 $4,673,765,057
Output $4,164,569,866 $1,466,785,611 $1,722,582,870 $7,353,938,349
Employment 9,004 5,148 11,275 25,427
6) Total Non-Ferrous (New Projects and
2010 Baseline Operations) Value Added $227,475,526 $42,300,800 $50,094,868 $319,871,193
Output $277,798,306 $68,606,614 $81,475,570 $427,880,490
Employment 602 496 798 1,896
7) Total Ferrous and Non-Ferrous
(Expansions, New Projects, and 2010 Baseline Operations)
Value Added $2,993,072,606 $891,409,381 $1,109,154,264 $4,993,636,250
Output $4,442,368,172 $1,535,392,225 $1,804,058,440 $7,781,818,839
Employment 9,606 5,644 12,073 27,323
The above table shows that total economic impacts, from the largest possible increase in ferrous and non-ferrous mining production for the State of Minnesota are a Value Added total of almost $5 billion, and Output total of almost $7.8 billion, and an Employment total of more than 27,300.
2 Definitions for interpreting this table are as follows.
Three measures: Value Added–A measure of the impacting industry’s contribution to the local community in wages, rents, interest, and profits; Output–Represents the value of local production required to sustain activities; Employment–Estimates are in terms of full and part time jobs, not in terms of full-time equivalent employees. Three impact effects: Direct–Initial spending in the study area resulting from the project; Indirect–The additional inter-industry spending from the direct impact; Induced–The impact of additional household expenditure resulting from the direct and indirect impact.

Bureau of Business and Economic Research Labovitz School of Business and Economics, University of Minnesota Duluth
ix
Existing ferrous mining industry contributions to Minnesota’s economy
Source: IMPLAN, BBER
Minnesota Arrowhead and Douglas County, Wisconsin
Iron ore mining: Direct, Indirect, and Induced Total Effect Direct, Indirect, and Induced Total Effect
Operations Value Added Output Employment Value Added Output Employment
2010 Baseline $1,921,208,076 $3,022,925,917 11,226 $1,631,590,282 $2,492,315,978 8,795
— Using the base year of 2010, the IMPLAN model’s Value Added total impact shows that iron-ore mining contributed more than $1.9 billion in wages, rents, interest, and profits to Minnesota’s economy. This total represents the direct value, plus additional inter-industry spending that resulted from the direct, as well as additional household spending that resulted from the direct and inter-industry spending.
— The Output total shows that iron-ore mining produced more than $3 billion in local production required to sustain activities. This total represents the direct value, plus additional inter-industry spending resulting from production, as well as additional household spending resulting from direct and inter-industry spending.
— The Employment total of more than 11,000 full- and part-time jobs represents the direct
employment plus other jobs dependent on the sector, as well as jobs created by the additional household spending linked to direct and indirect jobs in the iron-ore mining industry.
The IMPLAN input-output model also provides an opportunity to calculate a multiplier value associated with each of these measures (Value Added, Output, and Employment). For example, the employment multiplier for iron-ore mining in the State of Minnesota of 2.8 estimates that for every job in the iron-ore mining industry, another 1.8 jobs are created elsewhere in the economy. In the same way, the model estimates that for every dollar of wages, rents, interest, and profits, another $0.69 is generated throughout the economy of the State. The impact of mining employment and the payroll associated with these jobs may be the most obvious impacts. However, an Output measure can show contribution to the region and to the State, through production taxes, royalties, and fees on the exported ore. Although the total economic impacts for the State are always greater than the impacts for the region, the importance of the mining sector to the region’s economy is proportionately greater. From a regional point of view, for the period from 2004 to 2010, compared to other sectors of the economy in Northeast Minnesota, mining has led all other sectors contributing to Gross Regional Product (GRP). (See the report for details.) Note that the GRP for the State of Minnesota was $281.1 billion. When compared to the State, mining GRP totals approximately 5.3% for 2010.

Bureau of Business and Economic Research Labovitz School of Business and Economics, University of Minnesota Duluth
x
Figure 1: NE Minnesota Percentage Gross Regional Product (GRP) by Industry Sector
Source: IMPLAN, BBER
Potential additions to ferrous mining expansions and new projects to the State’s economy, if and when full operations are reached
Source: IMPLAN, BBER
Minnesota Arrowhead and Douglas County, Wisconsin
Iron ore mining: Direct, Indirect, and Induced Total Effect Direct, Indirect, and Induced Total Effect
Operations Value Added Output Employment Value Added Output Employment
2010 Baseline $1,921,208,076 $3,022,925,917 11,226 $1,631,590,282 $2,492,315,978 8,795
Expansions, 2016 $2,752,556,981 $4,331,012,432 14,201 $2,337,615,098 $3,570,795,747 11,127
For the following impacts, it is assumed that all currently proposed expansions and new projects in the ferrous mining industry sector are brought to full operations. These impacts are in addition to regular ferrous mining operations (but do not include construction impacts).
Mining 30%
Forestry 10%
Tourism 11%
All Other 49%
Sector Percentage of Total GRP Northeast Minnesota 2010
Bureau of Business and Economic Research Labovitz School of Business and Economics, University of Minnesota Duluth
xi
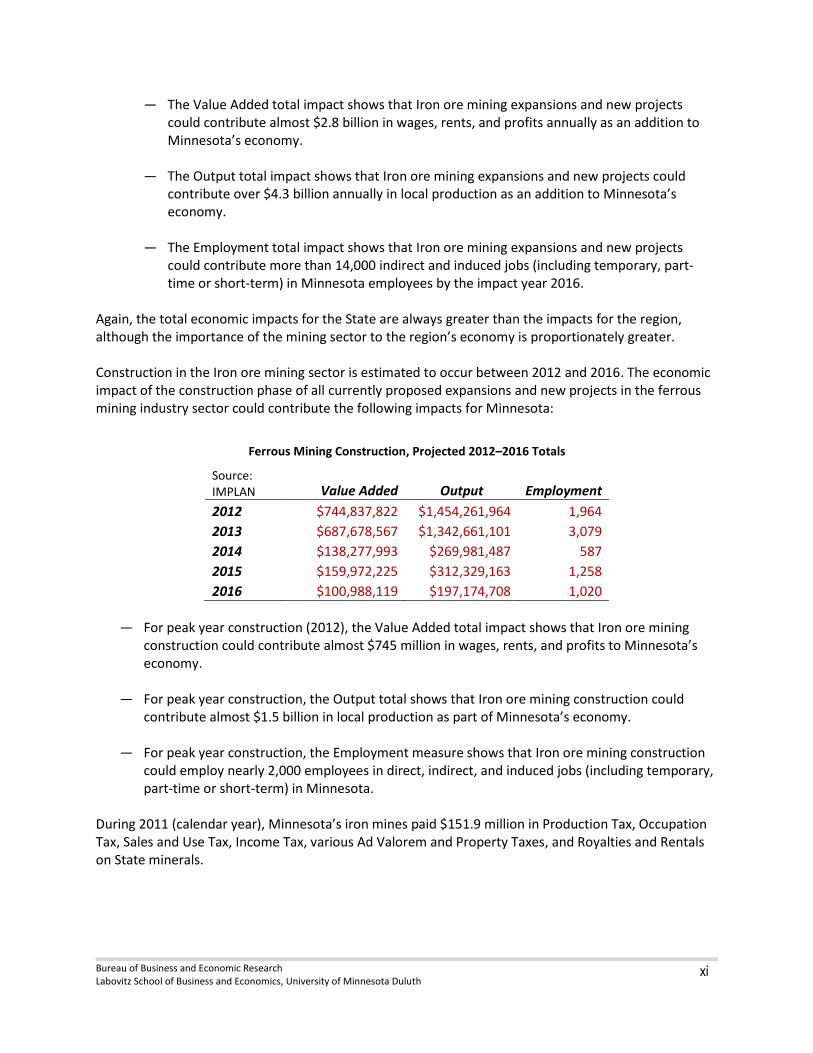
— The Value Added total impact shows that Iron ore mining expansions and new projects could contribute almost $2.8 billion in wages, rents, and profits annually as an addition to Minnesota’s economy.
— The Output total impact shows that Iron ore mining expansions and new projects could
contribute over $4.3 billion annually in local production as an addition to Minnesota’s economy.
— The Employment total impact shows that Iron ore mining expansions and new projects
could contribute more than 14,000 indirect and induced jobs (including temporary, part- time or short-term) in Minnesota employees by the impact year 2016.
Again, the total economic impacts for the State are always greater than the impacts for the region, although the importance of the mining sector to the region’s economy is proportionately greater. Construction in the Iron ore mining sector is estimated to occur between 2012 and 2016. The economic impact of the construction phase of all currently proposed expansions and new projects in the ferrous mining industry sector could contribute the following impacts for Minnesota:
Ferrous Mining Construction, Projected 2012–2016 Totals
Source: IMPLAN Value Added Output Employment
2012 $744,837,822 $1,454,261,964 1,964
2013 $687,678,567 $1,342,661,101 3,079
2014 $138,277,993 $269,981,487 587
2015 $159,972,225 $312,329,163 1,258
2016 $100,988,119 $197,174,708 1,020
— For peak year construction (2012), the Value Added total impact shows that Iron ore mining
construction could contribute almost $745 million in wages, rents, and profits to Minnesota’s economy.
— For peak year construction, the Output total shows that Iron ore mining construction could contribute almost $1.5 billion in local production as part of Minnesota’s economy.
— For peak year construction, the Employment measure shows that Iron ore mining construction could employ nearly 2,000 employees in direct, indirect, and induced jobs (including temporary, part-time or short-term) in Minnesota.
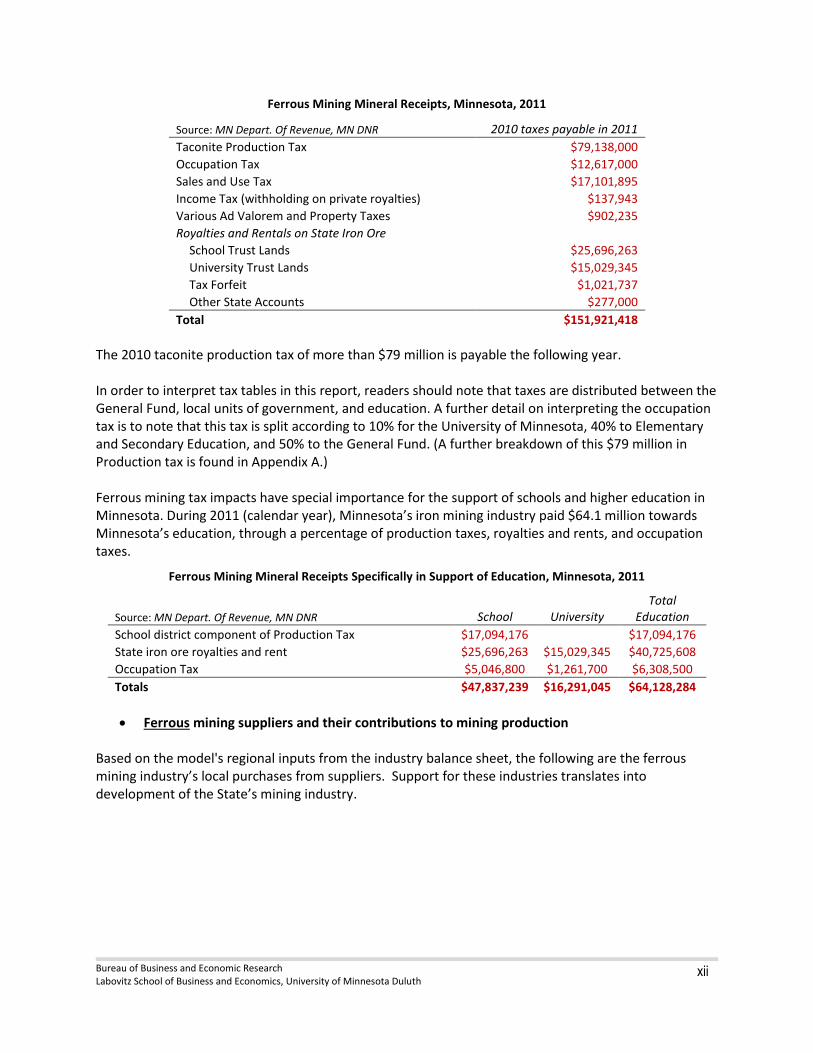
During 2011 (calendar year), Minnesota’s iron mines paid $151.9 million in Production Tax, Occupation Tax, Sales and Use Tax, Income Tax, various Ad Valorem and Property Taxes, and Royalties and Rentals on State minerals.
Bureau of Business and Economic Research Labovitz School of Business and Economics, University of Minnesota Duluth
xii
Ferrous Mining Mineral Receipts, Minnesota, 2011
Source: MN Depart. Of Revenue, MN DNR 2010 taxes payable in 2011
Taconite Production Tax $79,138,000
Occupation Tax $12,617,000
Sales and Use Tax $17,101,895
Income Tax (withholding on private royalties) $137,943
Various Ad Valorem and Property Taxes $902,235
Royalties and Rentals on State Iron Ore
School Trust Lands $25,696,263
University Trust Lands $15,029,345
Tax Forfeit $1,021,737
Other State Accounts $277,000
Total $151,921,418
The 2010 taconite production tax of more than $79 million is payable the following year. In order to interpret tax tables in this report, readers should note that taxes are distributed between the General Fund, local units of government, and education. A further detail on interpreting the occupation tax is to note that this tax is split according to 10% for the University of Minnesota, 40% to Elementary and Secondary Education, and 50% to the General Fund. (A further breakdown of this $79 million in Production tax is found in Appendix A.) Ferrous mining tax impacts have special importance for the support of schools and higher education in Minnesota. During 2011 (calendar year), Minnesota’s iron mining industry paid $64.1 million towards Minnesota’s education, through a percentage of production taxes, royalties and rents, and occupation taxes.
Ferrous Mining Mineral Receipts Specifically in Support of Education, Minnesota, 2011
Source: MN Depart. Of Revenue, MN DNR School University Total
Education
School district component of Production Tax $17,094,176 $17,094,176
State iron ore royalties and rent $25,696,263 $15,029,345 $40,725,608
Occupation Tax $5,046,800 $1,261,700 $6,308,500
Totals $47,837,239 $16,291,045 $64,128,284
Ferrous mining suppliers and their contributions to mining production Based on the model's regional inputs from the industry balance sheet, the following are the ferrous mining industry’s local purchases from suppliers. Support for these industries translates into development of the State’s mining industry.

Bureau of Business and Economic Research Labovitz School of Business and Economics, University of Minnesota Duluth
xiii
Figure 2: Local Supplier Purchases
Source: IMPLAN, BBER
In the chart above, Energy Sources include Electric Power, Natural Gas, and Petroleum. The section of Transportation includes both transports by truck and by rail.
Existing non-ferrous mining additions to Minnesota’s economy
Source: IMPLAN, BBER
Copper, nickel, lead, and zinc mining:
Minnesota Arrowhead and Douglas County, W
Direct, Indirect, and Induced Total Effect Direct, Indirect, and Induced Total Effect
Operations Value Added Output Employment Value Added Output Employment
2010 Baseline $157,055,988 $210,088,295 551 $154,976,119 $194,830,341 507
— Using the 2010 base year model (operations in the year 2010), the Value Added total impact shows that copper, nickel, lead, and zinc mining contributed more than $157 million in wages, rents, and profits to Minnesota’s economy. (This figure represents the value received from exploration and supporting industries.)
— The Output total impact shows copper, nickel, lead, and zinc mining produced over $210 million
in local production as part of Minnesota’s economy.
— The Employment total impact shows that copper, nickel, lead, and zinc mining directly and indirectly employed 551 employees (including temporary, part-time or short-term jobs) in
Energy Sources 40.09%
Transportation 11.92%
Mining support services 9.08%
Management 6.39%
Refractory minerals 5.12%
Wholesale trade 4.46%
Machinery 3.72%
Other 19.23%
Bureau of Business and Economic Research Labovitz School of Business and Economics, University of Minnesota Duluth
xiv
Minnesota.
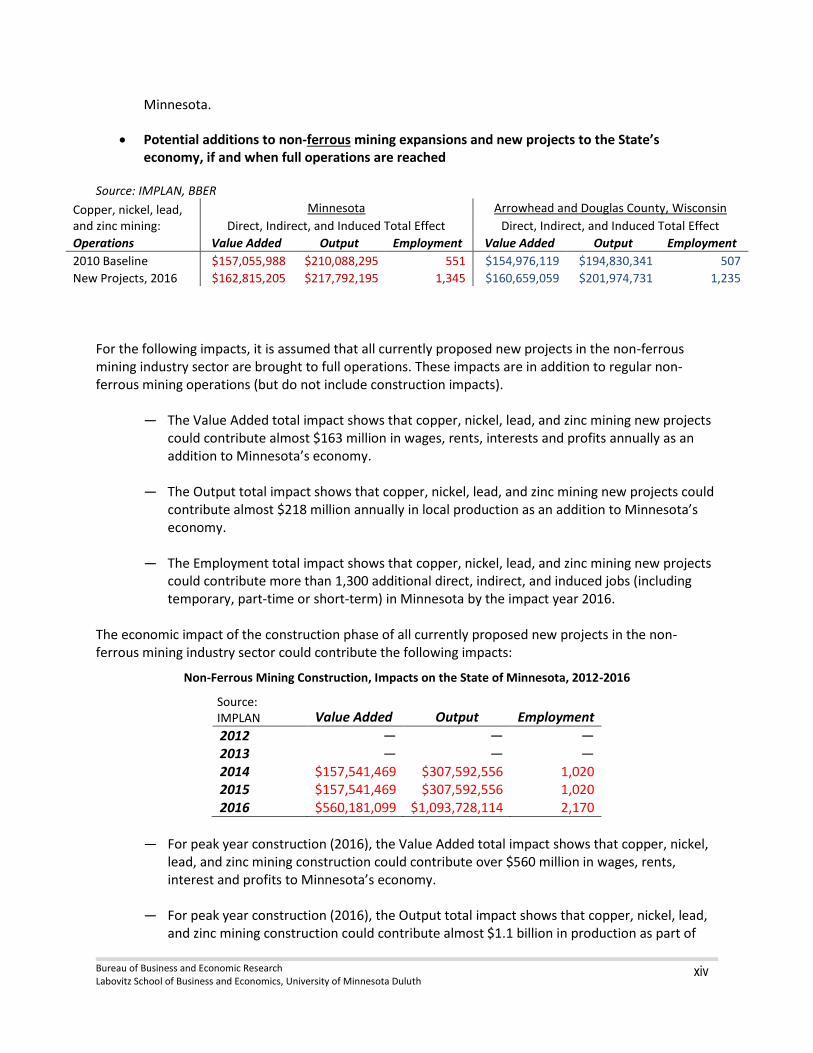
Potential additions to non-ferrous mining expansions and new projects to the State’s economy, if and when full operations are reached
Source: IMPLAN, BBER
Copper, nickel, lead, and zinc mining:
Minnesota Arrowhead and Douglas County, Wisconsin
Direct, Indirect, and Induced Total Effect Direct, Indirect, and Induced Total Effect
Operations Value Added Output Employment Value Added Output Employment
2010 Baseline $157,055,988 $210,088,295 551 $154,976,119 $194,830,341 507
New Projects, 2016 $162,815,205 $217,792,195 1,345 $160,659,059 $201,974,731 1,235
For the following impacts, it is assumed that all currently proposed new projects in the non-ferrous mining industry sector are brought to full operations. These impacts are in addition to regular non-ferrous mining operations (but do not include construction impacts).
— The Value Added total impact shows that copper, nickel, lead, and zinc mining new projects could contribute almost $163 million in wages, rents, interests and profits annually as an addition to Minnesota’s economy.
— The Output total impact shows that copper, nickel, lead, and zinc mining new projects could
contribute almost $218 million annually in local production as an addition to Minnesota’s economy.
— The Employment total impact shows that copper, nickel, lead, and zinc mining new projects
could contribute more than 1,300 additional direct, indirect, and induced jobs (including temporary, part-time or short-term) in Minnesota by the impact year 2016.
The economic impact of the construction phase of all currently proposed new projects in the non-ferrous mining industry sector could contribute the following impacts:
Non-Ferrous Mining Construction, Impacts on the State of Minnesota, 2012-2016
Source: IMPLAN Value Added Output Employment
2012 — — — 2013 — — — 2014 $157,541,469 $307,592,556 1,020 2015 $157,541,469 $307,592,556 1,020 2016 $560,181,099 $1,093,728,114 2,170
— For peak year construction (2016), the Value Added total impact shows that copper, nickel,
lead, and zinc mining construction could contribute over $560 million in wages, rents, interest and profits to Minnesota’s economy.
— For peak year construction (2016), the Output total impact shows that copper, nickel, lead,
and zinc mining construction could contribute almost $1.1 billion in production as part of
Bureau of Business and Economic Research Labovitz School of Business and Economics, University of Minnesota Duluth
xv
Minnesota’s economy.
— For peak year construction (2016), the Employment total impact shows that copper, nickel, lead, and zinc mining construction could employ more than 2,100 employees in direct, indirect, and induced jobs (including temporary, part-time or short-term) in Minnesota.
In order to report non‐ferrous taxes in Minnesota, the BBER followed the Minnesota DNR’s Mineral Receipts by Account for 2010 and 2011. Compared to ferrous mining, non‐ferrous mining contributes much less to the State.
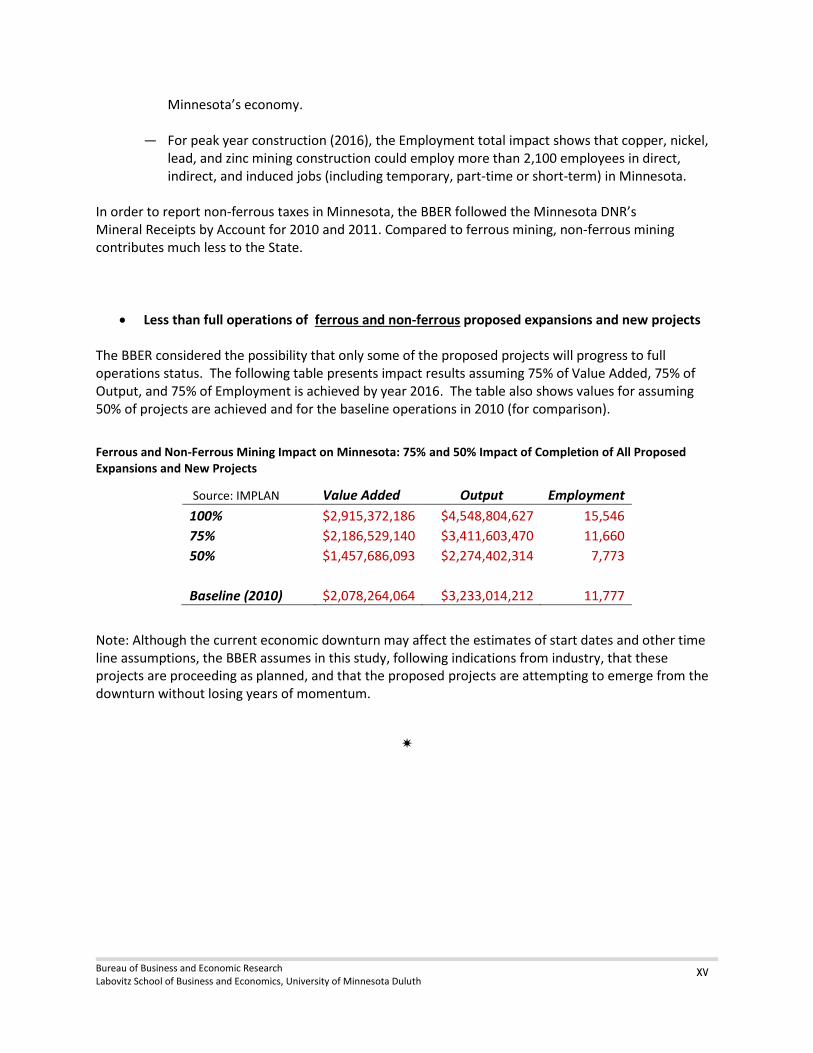
Less than full operations of ferrous and non-ferrous proposed expansions and new projects The BBER considered the possibility that only some of the proposed projects will progress to full operations status. The following table presents impact results assuming 75% of Value Added, 75% of Output, and 75% of Employment is achieved by year 2016. The table also shows values for assuming 50% of projects are achieved and for the baseline operations in 2010 (for comparison).
Ferrous and Non-Ferrous Mining Impact on Minnesota: 75% and 50% Impact of Completion of All Proposed Expansions and New Projects
Source: IMPLAN Value Added Output Employment
100% $2,915,372,186 $4,548,804,627 15,546
75% $2,186,529,140 $3,411,603,470 11,660
50% $1,457,686,093 $2,274,402,314 7,773
Baseline (2010) $2,078,264,064 $3,233,014,212 11,777
Note: Although the current economic downturn may affect the estimates of start dates and other time line assumptions, the BBER assumes in this study, following indications from industry, that these projects are proceeding as planned, and that the proposed projects are attempting to emerge from the downturn without losing years of momentum.

Bureau of Business and Economic Research Labovitz School of Business and Economics, University of Minnesota Duluth
1
The Economic Impact of Ferrous and Non-Ferrous Mining on the State of Minnesota and on the Arrowhead Region,
including Douglas County, Wisconsin
I. Project Description This project assesses the economic impact of ferrous and non-ferrous mining in Northeast Minnesota on
the economy of the State of Minnesota and on the Arrowhead Region that, for this report, includes
Douglas County, Wisconsin. Normally, Douglas County is not considered part of the Arrowhead Region,
but since the taconite is transported through it, it is being included in this study.
The UMD Labovitz School of Business and Economics’ research bureau, the Bureau of Business and
Economic Research (BBER), studied and estimated the economic impacts of ferrous and non-ferrous
mining construction and operations in Northeast Minnesota. The BBER has previously studied and
reported a similar analysis of the ferrous and non-ferrous mining in Northeastern Minnesota in 2009.
Additionally, it has studied and reported the prospective regional socio-economic impacts of a project in
Menominee County, Michigan, in 2010; the economic impact of Essar Steel Minnesota in 2010; and the
economic impact of U.S. Steel’s Keetac mine expansion in 2009. Several further analyses, studies, and
reports for the mining industry by the BBER were also conducted in 2006 and 2003.
The economic modeling data and software used for this project was IMPLAN, version 3.0, created in
Minnesota by MIG, Inc. The study used IMPLAN’s economic multiplier analysis and input/output
modeling with the most recent IMPLAN data, which is for year 2010. Results of modeling are presented
here in a written report.
The research objectives of the study included:
— To study the recent economic activity of ferrous and non-ferrous mining industries in Northeast
Minnesota, including employment and production in unit tons.
— To model construction and operations impacts using three measures and three effects of mining
activity. This will include the measures of employment, output, and value added, and will also
model direct, indirect, and induced economic effects in the economies of the State of
Minnesota, and the Arrowhead Region including Douglas County, Wisconsin.
— To describe Minnesota’s mineral revenue collected from ferrous and non-ferrous mining
industries in Northeast Minnesota, including 1) production taxes, 2) occupation taxes and
royalties, 3) sales and use taxes, and 4) a discussion of how mineral revenue is being spent by
the State of Minnesota.
— To draft the findings of the impact analysis into a report.

Bureau of Business and Economic Research Labovitz School of Business and Economics, University of Minnesota Duluth
2
Modeling
The BBER needed inputs from companies involved in mining construction and estimates for construction
project start dates and estimates of full operations.
Models were created to include projects, such as Essar's (Minnesota Steel) plant construction and the
Mesabi Nugget project, as well as individual non-ferrous proposed projects like PolyMet. The
construction impact model years were designated to begin with 2012. BBER’s modeling used the
completion date supplied by companies involved for any new project.
Operations models were created to include mining impacts from years beginning with 2012. The full
operations year, when construction is complete and all projects are fully operational, was determined to
be 2016.
Some IMPLAN modeling issues associated with small study areas like that in this report of county-level
impacts, as noted in the IMPLAN User’s Guide3 include the following:
A small area will have a high level of leakage. Leakages are any payments made to imports or value
added sectors, which do not in turn re-spend the dollars within the region.
Also, it can be expected that input-output multipliers are larger when more economic activity is
incorporated into the local transactions matrix. The more imports are internalized, the larger the
calculated multipliers become. At the state level all counties are incorporated, and for the state, the
greatest level of internalized economic activity is attained. Theoretically, therefore, the state IMPLAN
multipliers will always be greater than multipliers for any individual or subset of counties. But, as with
most theories, this one has exceptions. It is possible, for example, for the same impact run on both a
state and county models to yield lower impact results in the state model compared to the county model.
It does not happen that frequently, but it is possible.
Deliverables
1) The BBER will report the direct, indirect, and induced economic impacts of construction and operations activities of ferrous and non-ferrous mining in Northeast Minnesota, measured in employment, output, and value added.
2) The BBER will report a description of the Northeast Minnesota mining industries in terms of a global mining context.
3) The BBER will report Minnesota’s mineral revenue collected from ferrous and non-ferrous mining industries in Northeast Minnesota, including 1) production taxes, 2) occupation taxes and royalties, and 3) sales and use taxes.
4) The BBER will report ferrous and non-ferrous mineral revenue spent by the State of Minnesota.
3 IMPLAN is used by state governments and the USDA Forest Service, among others. See MIG, Inc., IMPLAN System
(data and software), MIG, Inc. 502 2nd St., Ste 301, PO Box 837, Hudson, WI 54016-1543. www.implan.com

Bureau of Business and Economic Research Labovitz School of Business and Economics, University of Minnesota Duluth
3
5) The BBER will draft a final written report that will present the findings and analysis.
6) The BBER will offer an oral PowerPoint presentation of the BBER findings, if so requested.
Study Area
The geographic scope for this economic impact analysis is proposed to be the Arrowhead region of Minnesota and the State of Minnesota. The Arrowhead Region of Northeast Minnesota includes Aitkin, Carlton, Cook, Itasca, Koochiching, Lake, and St. Louis Counties. For this study, it also includes Douglas County in Wisconsin.
The BBER worked closely with mining companies, the Iron Range Resources and Rehabilitation Board, the Minnesota Department of Employment and Economic Development, the Minnesota Department of Natural Resources—Lands and Minerals Division, and the University of Minnesota Natural Resources Research Institute, as well as the Iron Mining Association of Minnesota and Mining Minnesota and others, in determining key assumptions in the development of the IMPLAN models. Inputs required for these models include average employment for each year during any construction periods and dollar cost on a year-by-year basis for such construction periods. Operating assumptions required for the models include employment estimates, local purchases, and operations dollar value of sales or output production.
Regional data for the impact models for value added, employment, and output measures have been supplied by IMPLAN for this impact. Employment assumptions were provided to the BBER to enable construction of the impact model. From these data, Social Accounts, Production, Absorption, and Byproducts information were generated from the national level data and were incorporated into the model. All region study definitions and impact model assumptions were agreed on before work with the models began.
Figure 3. Counties of Minnesota’s Arrowhead Region and Douglas County, Wisconsin
As background, the BBER estimated a simplified industry sector percentage of Gross Regional Product (GRP) for the major sectors of the Northeast Minnesota economy. Mining in the Arrowhead Region and

Bureau of Business and Economic Research Labovitz School of Business and Economics, University of Minnesota Duluth
4
for the Duluth Metropolitan Statistical Area has been the leading industrial sector of the economy. Note that the GRP for the State of Minnesota was $281.1 billion. When compared to the State, mining GRP totals approximately 5.3% for 2010. However, comparing Northeast Minnesota economic activity by sector, GRP for mining shows that over time, mining has been the leading industrial sector, and that the mining industry has increased in relative importance.
Table 1. Sector Percentages of Total GRP in Billions, Northeast Minnesota 2010
Industry 2004 % of
Total 2006 % of
Total 2007 % of
Total 2010 % of
Total
Mining 3.1 26% 3.9 30% 4.7 34% 4.5 30%
Forestry 1.9 16% 1.8 14% 1.6 12% 1.5 10%
Tourism 1.3 11% 1.4 11% 1.5 11% 1.6 11%
All Other 5.6 47% 5.2 45% 5.9 43% 7.3 49%
Total 11.9 100.0% 12.3 100.0% 13.7 100.0% 14.9 100.0% Source: J. Skurla, UMD Labovitz School of Business and Economics, Bureau of Business and Economic Research
See also U.S. BEA at http://www.bea.gov/bea/regional/gsp/ Note: Tourism is estimated from the IMPLAN sectors, “amusements, gambling, and recreation,” and “accommodation and food services.” Also note: The above estimated GRP for an industry sector (for example, mining) includes estimations for indirect and induced effects (such as healthcare) provided to the industry.
From 2004 to 2010, mining has contributed to the GRP by almost three times that of the Forestry and Tourism sectors of the economy in Northeast Minnesota.
Mining 30%
Forestry 10%
Tourism 11%
All Other 49%
Sector Percentage of Total GRP Northeast Minnesota 2010
Figure 4. NE Minnesota Percentage Gross Regional Product (GRP) by Industry Sectors

Bureau of Business and Economic Research Labovitz School of Business and Economics, University of Minnesota Duluth
5
II. Impact Procedures and Input Assumptions
IMPLAN Models
There are two components to the IMPLAN system, the software and databases. The databases provide all information to create regional IMPLAN models. The software performs the calculations and provides an interface for the user to make final demand changes. IMPLAN software version 3.0 was used in this analysis.
Comprehensive and detailed data coverage of the IMPLAN study areas by county, and the ability to incorporate user-supplied data at each stage of the model building process, provides a high degree of flexibility both in terms of geographic coverage and model formulation—in this case, definition of the State of Minnesota, and the Arrowhead region including Douglas County, Wisconsin, as a study area, and the definition of specific models for construction and operations, with adjusted production functions to reflect the proposed plant expansion. Using the IMPLAN software and data, the BBER identified the industry’s proposed expenditures in terms of the sectoring scheme for the model, in producer prices, in historical dollars based on the year of the model, and applied those dollars spent within the study area definition given for the impact analysis.
Data
IMPLAN data files use federal government data sources including:
US Bureau of Economic Analysis Benchmark I/O Accounts of the US
US Bureau of Economic Analysis Output Estimates
US Bureau of Economic Analysis REIS Program
US Bureau of Labor Statistics County Employment and Wages (CEW) Program
US Bureau of Labor Statistics Consumer Expenditure Survey
US Census Bureau County Business Patterns
US Census Bureau Decennial Census and Population Surveys
US Census Bureau Economic Censuses and Surveys
US Department of Agriculture Crop and Livestock Statistics
IMPLAN data files consist of the following components: employment, industry output, value added,
institutional demands, national structural matrices and inter-institutional transfers.
Impacts for this model use the most recent IMPLAN data available, which is for the year 2010. The
impact is reported in 2012 dollars.
Economic impacts are made up of direct, indirect, and induced impacts. The following cautions are
suggested assumptions for accepting the impact model:
IMPLAN input-output is a production-based model.
Local or export based purchases that represent transfers from other potential local purchases are
not counted.
Bureau of Business and Economic Research Labovitz School of Business and Economics, University of Minnesota Duluth
6
The numbers (from U.S. Department of Commerce secondary data) treat both full and part-time
individuals as being employed.
Assumptions need to be made concerning the nature of the local economy before impacts can be
interpreted.
The IMPLAN model was constructed for the year 2010 (most recent data available).
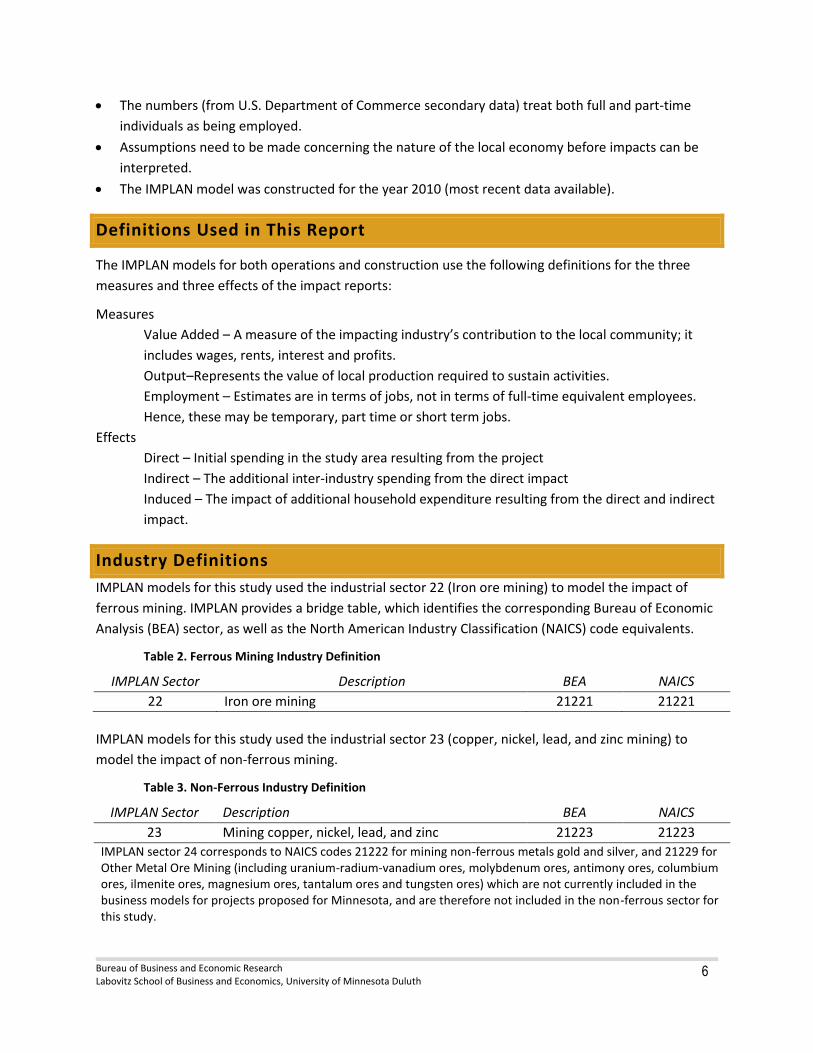
Definitions Used in This Report
The IMPLAN models for both operations and construction use the following definitions for the three
measures and three effects of the impact reports:
Measures
Value Added – A measure of the impacting industry’s contribution to the local community; it
includes wages, rents, interest and profits.
Output–Represents the value of local production required to sustain activities.
Employment – Estimates are in terms of jobs, not in terms of full-time equivalent employees.
Hence, these may be temporary, part time or short term jobs.
Effects
Direct – Initial spending in the study area resulting from the project
Indirect – The additional inter-industry spending from the direct impact
Induced – The impact of additional household expenditure resulting from the direct and indirect
impact.
Industry Definitions
IMPLAN models for this study used the industrial sector 22 (Iron ore mining) to model the impact of
ferrous mining. IMPLAN provides a bridge table, which identifies the corresponding Bureau of Economic
Analysis (BEA) sector, as well as the North American Industry Classification (NAICS) code equivalents.
Table 2. Ferrous Mining Industry Definition
IMPLAN Sector Description BEA NAICS
22 Iron ore mining 21221 21221
IMPLAN models for this study used the industrial sector 23 (copper, nickel, lead, and zinc mining) to
model the impact of non-ferrous mining.
Table 3. Non-Ferrous Industry Definition
IMPLAN Sector Description BEA NAICS
23 Mining copper, nickel, lead, and zinc 21223 21223
IMPLAN sector 24 corresponds to NAICS codes 21222 for mining non-ferrous metals gold and silver, and 21229 for Other Metal Ore Mining (including uranium-radium-vanadium ores, molybdenum ores, antimony ores, columbium ores, ilmenite ores, magnesium ores, tantalum ores and tungsten ores) which are not currently included in the business models for projects proposed for Minnesota, and are therefore not included in the non-ferrous sector for this study.

Bureau of Business and Economic Research Labovitz School of Business and Economics, University of Minnesota Duluth
7
Mining impacts in this report have been sectored for analysis as ferrous and non-ferrous and do not include other IMPLAN sectors classified as mining, such as “Stone mining and quarrying,” and “Sand, gravel, clay, and ceramic and refractory minerals mining and quarrying.” Excluded sectors include such activities as “Stone mining and quarrying,” “Dimension stone mining and quarrying,” “Crushed and broken limestone mining,” “Crushed and broken granite mining,” “Other crushed and broken stone mining,” “Sand, gravel, clay, and refractory mining,” “Construction sand and gravel mining,” “Industrial sand mining,” and “Clay, ceramic, and refractory minerals mining.”
Ferrous mining activities in this report are modeled in IMPLAN sector 22, and the sector is referred to as “Iron ore mining” in the text following the designation of the IMPLAN industry description. The same is true for non-ferrous mining activities, which are referred to in this report by the IMPLAN sector description “Mining copper, nickel, lead, and zinc.” Although lead and zinc mining is not significant in Minnesota, the model sector “Mining copper, nickel, lead, and zinc” captures the copper and nickel impacts, which are significant. The impact of mining exploration and drilling, identified under NAICS industry code 213 (Support Activities for Mining), are not the focus of this impact, although these activities are accounted for in the IMPLAN model, specifically through IMPLAN sector 27 (Other nonmetallic mineral mining and quarrying) and sector 30 (Support activities for other mining).
Model Assumptions
Construction years for various projects are staggered between 2012 and 2016. Construction impacts are reported by years 2012, 2013, 2014, 2015, and 2016 and include all projects active during the reporting year.
The operations year for all has been determined to be 2016. This impact study recognizes the broadest number of possible ferrous expansion projects, as well as start-ups in ferrous and non-ferrous mining.
All impacts are reported in 2012 dollars.
Special considerations for interpreting these impact numbers include the following cautions:
Regional indirect and induced effects are driven by assumptions in the model. One problem is that the assumptions can mask the true multiplier. This is especially true of the assumption of constant returns to scale: This assumption most affects induced effects and says that if I drink coffee, and my income increases, I will drink proportionally more than before. The amount of weight placed on the induced effects (the percentage of the total induced effect you would want to use) could be further analyzed with an in-depth impact study, involving much more specific data collection and more detailed analysis.
The BBER suggests caution in regard to the interpretation of the tax impacts from these projects: Tax law changes frequently and will be difficult to forecast through the years proposed as operations for these projects. Also, taxes impacts in this report are based on different formulations. For instance, it has been suggested that occupation taxes could be expected to decrease.
Readers should also note that estimated changes in production technology and employee productivity for industry sectors can differ; for instance, a difference in output per worker for differing industry sectors when production modeling includes Iron ore mining and Iron and steel mills.

Bureau of Business and Economic Research Labovitz School of Business and Economics, University of Minnesota Duluth
8
Finally, and most importantly, the relationship of Output to Employment has been set for the model by data provided by the project managers to the BBER; the modeling in this study is driven by inputs provided to the models by the best estimates of engineers and managers involved in each project. It can be noted that, for purposes of research and with more resources, the modeling methodology can be driven by data collected from surveys and post-construction values. This survey data can provide greater accuracy in regional impact assessments for the linkage between core and peripheral labor market areas, and deliver better estimates of local vs. regional purchases.
Project Time Lines and Selection of Impact Year
A time line was used in order to select an appropriate year for the industry sector’s full operations
impact (YR 2016). A significant factor influencing assumptions about construction and operations start
dates is the time necessary to complete the Environmental Impact Statement and all permitting activity
that must be completed before construction can begin. The BBER has not attempted to forecast how
long each project’s permitting might require to complete. Also note, for purposes of display in this
report, the BBER has grouped the non-ferrous start-ups to indicate the earliest construction and
operations start date that might be assumed. The time line can be found on the following page. Note:
At the time of this report, there were no non-ferrous projects poised for construction. These projects
were only in exploration phase. The timing of non-ferrous project construction and then operations is
difficult to determine or estimate. The slow economic recovery and possible difficulty in obtaining equity
and debt financing from financial markets have delayed many of the projects.

Bureau of Business and Economic Research Labovitz School of Business and Economics, University of Minnesota Duluth
9
Figure 5. The BBER’s Assumptions for Project Time Lines and Selection of Impact Year 2016*
* As noted above, this time line was used in order to select an appropriate year for the industry sector’s full
operations impact (YR 2016). A significant factor influencing assumptions about construction and operations start dates is the time necessary to complete the Environmental Impact Statement and all permitting activity that must be completed before construction can begin. The BBER has not attempted to forecast how long each project’s permitting might require to complete. Also note, for purposes of display in this report, the BBER has grouped the non-ferrous start-ups to indicate the earliest construction and operations start date that might be assumed.

Bureau of Business and Economic Research Labovitz School of Business and Economics, University of Minnesota Duluth
10
III. Findings: Ferrous Mining Impacts
In this section, the BBER reports the direct, indirect, and induced economic impacts of construction and operations activities of ferrous mining in Northeast Minnesota, measured in employment, output, and value added. Impacts are modeled for both the State of Minnesota, and the immediate region, including the counties of the Arrowhead Region and Douglas County, Wisconsin.
To provide a baseline reference, the BBER modeled the impact on the State’s economy that might be felt if ferrous mining and all its transactions had been removed from the State of Minnesota. The BBER uses IMPLAN’s most recent data, which is for year 2010, for this impact model. This provides insight into the contribution of the ferrous mining industry to the State’s economy.
Next, using employment and output projections from the mining industry, as well as assistance from representatives of the State, the BBER modeled the economic impact of proposed expansions and projects in the ferrous mining industry sector. A special sub-section of the findings covers the results of modeling ferrous mining tax impacts.
Finally, the BBER considered the possibility that not all projects will be viable and will progress to full operations status. Therefore, impacts for two development scenarios are presented, to show impact results if only half or only three quarters of projects currently proposed succeed. The 75% and 50% impacts are shown in relation to the baseline data and full implementation scenarios.
Ferrous Mining Industry’s Contribution to the State’s Economy
IMPLAN provides a model of the economy of the State of Minnesota, including ferrous mining (identified as sector 22 Iron ore mining), as presented in the section “Industry Definitions,” above. The values in the tables below are estimated from sources associated with the IMPLAN model and also identified above. In the tables below, the Value Added total measure shows that Iron ore mining contributed more than $1.9 billion in wages, rents, and profits to Minnesota’s economy. The Value Added total represents the direct value of the wages, etc., plus the additional inter-industry spending that resulted from these wages, plus any additional household spending that resulted from the direct wages and inter-industry spending.
The Output total measure shows that Iron ore mining produced more than $3 billion in local production as part of Minnesota’s economy. The Output total represents the direct value of local production, plus the additional inter-industry transactions that resulted from local production, plus any additional household spending that resulted from inter-industry production.
The Employment measure shows that Iron ore mining directly employed more than 3,900 employees (jobs—including temporary, part-time or short-term) in Minnesota. The Employment total of more than 11,000 jobs represents the direct employment in the industry sector, plus other jobs dependent on, but not part of, the Iron ore mining sector, plus any jobs created by the additional household spending and activity linked to direct and indirect jobs in the Iron ore mining industry. The IMPLAN input-output model also provides an opportunity to calculate a multiplier value associated with each of these measures. For example, the employment multiplier for Iron ore mining in the State of Minnesota of 2.8 indicates that for every job in the Iron ore mining industry, another 1.8 jobs are created as the indirect and induced effect of the mining industry’s job. In the same way, the model

Bureau of Business and Economic Research Labovitz School of Business and Economics, University of Minnesota Duluth
11
estimates that for every dollar of wages, rents, interest and profits, another $0.69 is generated through indirect and induced effects throughout the economy of the State. The impact of mining employment and the payroll associated with these jobs may be the most obvious impact; however the Output measure also shows contribution to the region and to the State through production taxes, royalties, and fees on the exported ore. Although the total economic impacts for the State are almost always greater than the impacts for the Arrowhead Region and Douglas County, Wisconsin, the importance of the mining sector to the region’s economy is proportionately greater. The following tables show the baseline impact (current operations as of 2010) of ferrous mining on the State of Minnesota and the region, in 2012 dollars.
Table 4: Minnesota Ferrous Mining, Economic Impacts, Baseline 2010
Source: IMPLAN Direct Effect Indirect Effect Induced Effect Total Effect
Value Added $1,136,832,423 $349,036,421 $435,339,232 $1,921,208,076
Output $1,711,897,209 $602,940,089 $708,088,618 $3,022,925,917
Employment 3,975 2,273 4,978 11,226
Note direct effects for Value Added, Output, and Employment result in different totals for the State and the region. The regional economy does not enjoy the same level of added indirect and induced effects. This implies, for instance, that Iron ore mining creates about 2,400 more jobs in the Metro and other parts of the State compared to the Arrowhead region and Douglas County.
Table 5: Arrowhead and Douglas County, Wisconsin, Ferrous Mining, Economic Impacts, Baseline 2010
Source: IMPLAN Direct Effect Indirect Effect Induced Effect Total Effect
Value Added $1,136,832,423 $230,153,874 $264,603,985 $1,631,590,282
Output $1,711,897,209 $345,943,615 $434,475,153 $2,492,315,978
Employment 3,975 1,273 3,547 8,795

Bureau of Business and Economic Research Labovitz School of Business and Economics, University of Minnesota Duluth
12
The top twenty-five Minnesota indirect and induced jobs dependent on Iron ore mining come from the following supporting industries:
Table 6: Iron Ore Mining Employment Impacts in Minnesota, Top Twenty-Five Detail, Baseline 2010
Source: IMPLAN
Industry Direct Indirect Induced Total
Mining iron ore 3,975 20 0 3,995
Food services and drinking places 0 37 519 556
Transport by truck 0 342 35 377
Real estate establishments 0 31 237 268
Wholesale trade businesses 0 125 141 266
Private hospitals 0 0 247 247
Electric power generation, transmission, and distribution 0 208 17 225
Offices of physicians, dentists, and other health practitioners 0 0 224 224
Nursing and residential care facilities 0 0 201 201
Nondepository credit intermediation and related activities 0 63 133 196
Retail Stores - General merchandise 0 8 172 180
Support activities for other mining 0 171 0 171
Retail Stores - Food and beverage 0 8 159 167
Management of companies and enterprises 0 140 26 166
Securities, commodity contracts, investments, and related activities 0 25 137 162
Employment services 0 57 88 145
Civic, social, professional, and similar organizations 0 18 109 127
Mining and quarrying sand, gravel, clay, and ceramic and refractory minerals
0 116 0 116
Individual and family services 0 0 107 107
Retail Stores - Motor vehicle and parts 0 8 97 105
Retail Nonstores - Direct and electronic sales 0 4 100 104
Monetary authorities and depository credit intermediation activities 0 28 73 101
Services to buildings and dwellings 0 36 56 92
Retail Stores - Miscellaneous 0 4 83 87
Architectural, engineering, and related services 0 67 17 84
Total From Top 25 3,975 1,516 2,978 8,469
As well as an additional 2,757 jobs in another 279 various sectors of the economy…
0 757 2,000 2,757
Grand Total 3,975 2,273 4,978 11,226
Jobs created as the impact of taxes are included in the model’s calculations.

Bureau of Business and Economic Research Labovitz School of Business and Economics, University of Minnesota Duluth
13
Economic Impact: Proposed Ferrous Mining Expansions and New Projects
The BBER modeled the economic impact of proposed expansions and projects in the ferrous mining industry sector. For this report, impact findings from individual projects are aggregated in the Iron ore mining sector and present an estimation of the impact of all currently proposed ferrous mining expansions and new start-up projects. The BBER relied on industry representatives and State of Minnesota representatives for its inventory of possible projects. The timeline in Figure 5 shows the BBER’s rationale for choosing the year 2016, as the first possible full operations year in which all projects might be operational.
The BBER also modeled the economic impact of the total sector activity, which combines the proposed expansions and projects with the on-going industry in the State. Tables described as “all operations” present the impacts of Iron ore mining in year 2016 (in 2012 dollars), as if all proposed expansions and new projects were at full operations and are added to the continuing impact of current (2010) Iron ore mining operations.
Minnesota Construction: Proposed Ferrous Mining Expansions and New Projects
These projects include investment in facilities improvement and maintenance. Project totals have been aggregated by year. As noted earlier, the timeline for project construction is dependent on environmental permitting and the months or years such permitting requires for approval. Construction impacts associated with possible projects are modeled as yearly totals from 2012 to 2016. Note that unlike operations impacts, construction impacts do not present annual recurring totals. Each construction year’s wages, production, and employment should be considered a snap-shot of a single year impact. Typically, construction is more labor and investment-intensive at the start of a project than in the final stages. In addition, although the construction investment adds up over time, employment does not; consider, for instance, that a construction project truck driver employed during 2012 may be continuing in the same job in 2013.
Table 7. Ferrous Mining Construction’s Value Added, Output, and Employment Impacts on the State of Minnesota 2012–2016, Proposed Expansions and New Projects
Source: IMPLAN Value Added Output Employment
2012 $744,837,822 $1,454,261,964 1,964
2013 $687,678,567 $1,342,661,101 3,079
2014 $138,277,993 $269,981,487 587
2015 $159,972,225 $312,329,163 1,258
2016 $100,988,119 $197,174,708 1,020

Bureau of Business and Economic Research Labovitz School of Business and Economics, University of Minnesota Duluth
14
Minnesota Operations: Proposed Ferrous Expansions and Mining Projects Following the assumptions made for the time line of projects, operations impacts assume full production for all proposed expansions and new projects to be in year 2016.
Table 8. Ferrous Mining Operation’s Value Added, Output, and Employment Impacts on the State of Minnesota, 2016, Proposed Expansions and New Projects
Source: IMPLAN Direct Effect Indirect Effect Induced Effect Total Effect
Value Added $1,628,764,657 $500,072,160 $623,720,164 $2,752,556,981
Output $2,452,672,657 $863,845,522 $1,014,494,252 $4,331,012,432
Employment 5,029 2,875 6,297 14,201
Minnesota Operations: All Proposed and Continuing Ferrous Mining, 2016 The table below shows the estimated impact of full operations for all proposed expansions and new projects and all continuing industry operations not considered a start-up or expansion of production capacity, for year 2016.
Table 9. Ferrous Mining Operation’s Value Added, Output, and Employment Impacts on the State of Minnesota, 2016, All Operations
Source: IMPLAN Direct Effect Indirect Effect Induced Effect Total Effect
Value Added $2,765,597,080 $849,108,581 $1,059,059,396 $4,673,765,057
Output $4,164,569,866 $1,466,785,611 $1,722,582,870 $7,353,938,349
Employment 9,004 5,148 11,275 25,427
Region Construction: Proposed Ferrous Mining Expansions and New Projects
As with the impacts for the State, these projects include investment in facilities improvement and maintenance. Project totals have been aggregated by year. As noted earlier, the time line for project construction is dependent on environmental permitting and does not forecast the months or years such permitting requires for approval. Construction impacts associated with possible projects are modeled as yearly totals from 2012 to 2016.
Table 10. Ferrous Mining Construction’s Value Added, Output, and Employment Impacts on the Arrowhead Region and Douglas County, Wisconsin, 2012–2016
Source: IMPLAN Value Added Output Employment
2012 $541,798,194 $1,159,155,347 1,620
2013 $500,220,297 $1,070,201,130 2,540
2014 $100,583,985 $215,195,384 485
2015 $116,340,981 $248,906,845 1,038
2016 $73,459,178 $157,162,954 841

Bureau of Business and Economic Research Labovitz School of Business and Economics, University of Minnesota Duluth
15
Region Operations: Proposed Ferrous Mining Expansions and New Projects Following the assumptions made for the time line of projects, operations impacts assume full production for all proposed expansions and new projects to be in year 2016.
Table 11. Ferrous Mining Operation’s Value Added, Output, and Employment Impacts on the Arrowhead Region and Douglas County, Wisconsin, Expansions and New Projects, 2016
Source: IMPLAN Direct Effect Indirect Effect Induced Effect Total Effect
Value Added $1,628,764,657 $329,746,526 $379,103,915 $2,337,615,098
Output $2,452,672,657 $495,641,041 $622,482,049 $3,570,795,747
Employment 5,029 1,611 4,487 11,127
Region Operations: All Proposed and Continuing Ferrous Mining, 2016 The table below shows the estimated impact of full operations for all proposed expansions and new projects and all continuing industry operations not considered a start-up or expansion of production capacity, for year 2016.
Table 12. Ferrous Mining Operation’s Value Added, Output, and Employment Impacts on the Arrowhead Region and Douglas County, Wisconsin, 2016, All Operations
Source: IMPLAN Direct Effect Indirect Effect Induced Effect Total Effect
Value Added $2,765,597,080 $559,900,400 $643,707,900 $3,969,205,380
Output $4,164,569,866 $841,584,656 $1,056,957,202 $6,063,111,725
Employment 9,004 2,884 8,034 19,922
FERROUS MINING TAX IMPACTS
Ferrous Mining Tax Impacts on Minnesota and the Region
During 2011 (calendar year) Minnesota’s iron mines paid $151.9 million in Production Tax, Occupation Tax, Sales and Use Tax, Income Tax, various Ad Valorem and Property Taxes and Royalties and Rentals on state minerals. The 2010 taconite production tax of more than $79 million is payable the following year. As we note below, and in order to reconcile totals for subsequent tax impacts, readers must note that $97.3 million in Production, Sales and Use, Income and various Ad Valorem Taxes were accrued in 2010. These taxes are spread between the General Fund, local units of government and schools. Approximately $17.1 million of this was support to local school districts. (See Table 14.) A further detail on interpreting the Occupation tax is to note that the occupation tax is split according to 10% for the University of Minnesota, 40% to Elementary and Secondary Education, and 50% to the General Fund (or $6,308,500 in 2010). A further breakdown of this $79 million is found in Appendix A.

Bureau of Business and Economic Research Labovitz School of Business and Economics, University of Minnesota Duluth
16
Table 13. Minnesota’s Iron Mines Direct Support for the State
Source: MN Depart. Of Revenue, MN DNR 2010 Taxes Payable in 2011
Taconite Production Tax $79,138,000 Occupation Tax $12,617,000 Sales and Use Tax $17,101,895 Income Tax(withholding on private royalties) $137,943 Various Ad Valorem and Property Taxes $902,235 Royalties and Rentals on State Iron Ore
School Trust Lands $25,696,263 University Trust Lands $15,029,345 Tax Forfeit $1,021,737 Other state accounts $277,000
Total $151,921,418
Notes for Table 13 above: All taxes are according to the Department of Revenue’s Minnesota Mining Tax Guide, November 2011 (for 2010 taxes payable in 2011).
Royalties and rentals on state iron ore are from Department of Natural Resources Mineral receipts by Account for Calendar Year 2011. Iron ore and taconite income is 97% of the State’s total mineral receipts. Royalties (2010): $128.4 million in Royalties were paid in 2010 by iron mining industry (Royalties include state and private-owned royalties.)
Occupation taxes: Occupation taxes have increased from $10.3 million in 2007 to $12.6 million in 2010.
Production and other taxes: $97.3 million in Production, Sales and Use, Income and various Ad Valorem Taxes were paid in 2010. These taxes are spread between the General Fund, local units of government and schools. Approximately $17.1 million of this was support to local school districts.
More detail on Minnesota’s Iron Mining industry’s support for education is shown below. During 2011 (calendar year) Minnesota’s Iron Mining industry paid $64.1 million towards Minnesota’s education.
Table 14. Minnesota’s Iron Mining Industry Support for Education
Source: MN Depart. Of Revenue, MN DNR School University Total
Education
School district component of Production Tax $17,094,176 $17,094,176
State iron ore royalties and rent $25,696,263 $15,029,345 $40,725,608
Occupation Tax $5,046,800 $1,261,700 $6,308,500
Totals $47,837,239 $16,291,045 $64,128,284
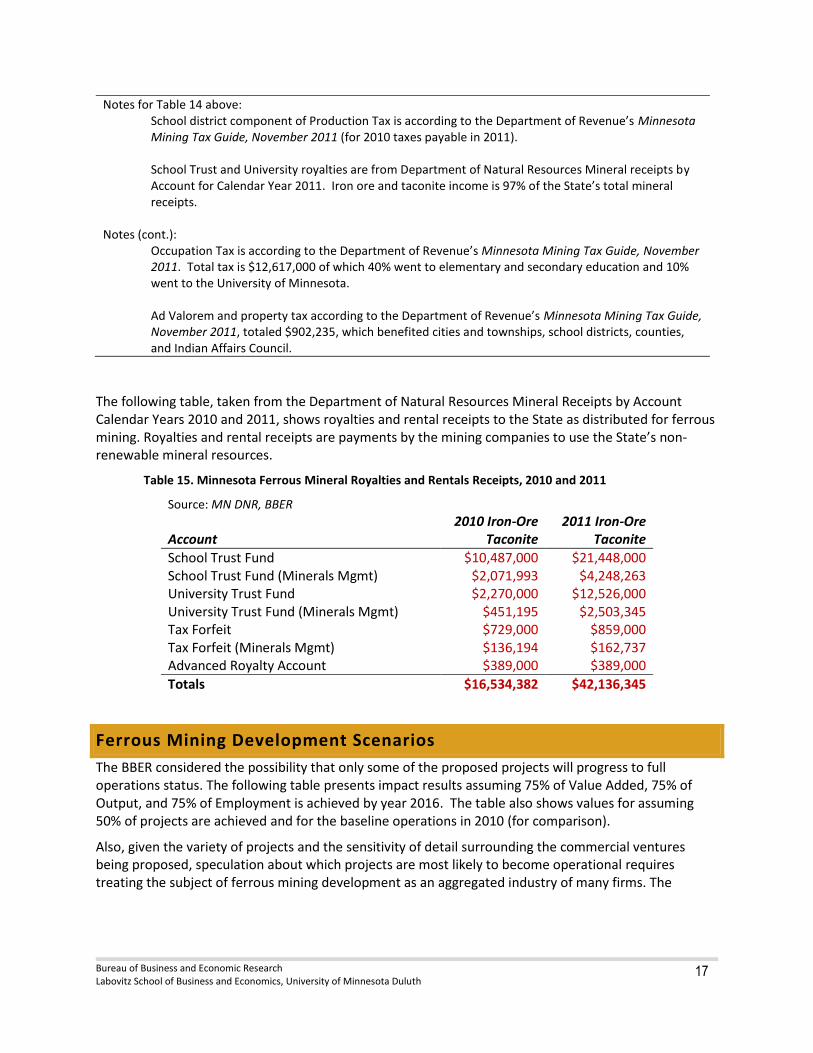
Bureau of Business and Economic Research Labovitz School of Business and Economics, University of Minnesota Duluth
17
Notes for Table 14 above: School district component of Production Tax is according to the Department of Revenue’s Minnesota Mining Tax Guide, November 2011 (for 2010 taxes payable in 2011).
School Trust and University royalties are from Department of Natural Resources Mineral receipts by Account for Calendar Year 2011. Iron ore and taconite income is 97% of the State’s total mineral receipts.
Notes (cont.):
Occupation Tax is according to the Department of Revenue’s Minnesota Mining Tax Guide, November 2011. Total tax is $12,617,000 of which 40% went to elementary and secondary education and 10% went to the University of Minnesota.
Ad Valorem and property tax according to the Department of Revenue’s Minnesota Mining Tax Guide, November 2011, totaled $902,235, which benefited cities and townships, school districts, counties, and Indian Affairs Council.
The following table, taken from the Department of Natural Resources Mineral Receipts by Account Calendar Years 2010 and 2011, shows royalties and rental receipts to the State as distributed for ferrous mining. Royalties and rental receipts are payments by the mining companies to use the State’s non-renewable mineral resources.
Table 15. Minnesota Ferrous Mineral Royalties and Rentals Receipts, 2010 and 2011
Source: MN DNR, BBER
Account
2010 Iron-Ore Taconite
2011 Iron-Ore Taconite
School Trust Fund $10,487,000 $21,448,000 School Trust Fund (Minerals Mgmt) $2,071,993 $4,248,263 University Trust Fund $2,270,000 $12,526,000 University Trust Fund (Minerals Mgmt) $451,195 $2,503,345 Tax Forfeit $729,000 $859,000 Tax Forfeit (Minerals Mgmt) $136,194 $162,737 Advanced Royalty Account $389,000 $389,000
Totals $16,534,382 $42,136,345
Ferrous Mining Development Scenarios
The BBER considered the possibility that only some of the proposed projects will progress to full operations status. The following table presents impact results assuming 75% of Value Added, 75% of Output, and 75% of Employment is achieved by year 2016. The table also shows values for assuming 50% of projects are achieved and for the baseline operations in 2010 (for comparison).
Also, given the variety of projects and the sensitivity of detail surrounding the commercial ventures being proposed, speculation about which projects are most likely to become operational requires treating the subject of ferrous mining development as an aggregated industry of many firms. The

Bureau of Business and Economic Research Labovitz School of Business and Economics, University of Minnesota Duluth
18
following tables present impact results for percentage success rates for expansion and startup projects. Possible 75% and 50% impacts are shown in relation to the baseline data and full implementation scenarios. This calculation is based on decreasing the total hypothetical impacts of value added, output, and employment by 25% and 50%.
75% or 50% Impact: Possible Ferrous Mining Projects Completed, Minnesota and the Region
Table 16. Ferrous Mining Impact on Minnesota: 75% and 50% Impact of Completion of All Proposed Expansions and New Projects
Source: IMPLAN Value Added Output Employment
100% $2,752,556,981 $4,331,012,431 14,201
75% $2,064,417,736 $3,248,259,323 10,651
50% $1,376,278,491 $2,165,506,216 7,101
Table 17. Ferrous Mining Impact on the Arrowhead Region and Douglas County, Wisconsin: 75% and 50% Impact of Completion of All Proposed Expansions and New Projects
Source: IMPLAN Value Added Output Employment
100% $2,337,615,098 $3,570,795,747 11,127
75% $1,753,211,324 $2,678,096,810 8,345
50% $1,168,807,549 $1,785,397,874 5,564
IV. Findings: Non-Ferrous Mining Impacts
In this section, the BBER reports the direct, indirect, and induced economic impacts of construction and operations activities of non-ferrous mining in Northeast Minnesota, measured in employment, output, and value added. Impacts are modeled for both the State of Minnesota, and the immediate region, including the counties of the Arrowhead Region and Douglas County, Wisconsin.
To provide a baseline reference, the BBER modeled the impact on the State’s economy that might be felt if non-ferrous mining and all its transactions had been removed from the State of Minnesota. The BBER uses IMPLAN’s most recent data, which is for year 2010, for this impact model. This provides insight to the contribution of the non-ferrous mining industry to the State’s economy.
Next, using employment and output projections from the mining industry, as well as assistance from representatives of the State, the BBER modeled the economic impact of proposed new projects in the non-ferrous mining industry sector. A special sub-section of the findings covers the results of modeling non-ferrous mining tax impacts.
Finally, the BBER considered the possibility that not all projects will be viable and will progress to full operations status. Therefore, impacts for two development scenarios are presented to show impact results if only half or only three quarters of projects currently proposed succeed. The 75% and 50% impacts are shown in relation to the baseline data and full implementation scenarios.

Bureau of Business and Economic Research Labovitz School of Business and Economics, University of Minnesota Duluth
19
Non-Ferrous Mining’s Contribution to the State’s Economy
IMPLAN provides a model of the economy of the State of Minnesota, including non-ferrous mining (identified as sector 23 copper, nickel, lead, and zinc mining), as presented in the section “Industry Definitions,” above. The values in the tables below are estimated from sources associated with the IMPLAN model and also identified above. In the tables below, the Value Added total measure shows that copper, nickel, lead, and zinc mining contributed more than $157 million in wages, rents, and profits to Minnesota’s economy. The Value Added total represents the direct value of the wages, etc., plus the additional inter-industry spending that resulted from these wages, plus any additional household spending that resulted from the direct wages and inter-industry spending. The Output total measure shows that copper, nickel, lead, and zinc mining produced more than $210 million in local production as part of Minnesota’s economy. The Output total represents the direct value of local production, plus the additional inter-industry transactions that resulted from local production, plus any additional household spending that resulted from inter-industry production. The Employment measure shows that copper, nickel, lead, and zinc mining directly employed almost 200 employees (jobs—including temporary, part-time or short-term) in Minnesota. The Employment total of more than 500 jobs represents the direct employment in the industry sector, plus other jobs dependent on, but not part of, the copper, nickel, lead, and zinc mining sector, plus any jobs created by the additional household spending and activity linked to direct and indirect jobs in the copper, nickel, lead, and zinc mining industry. The IMPLAN input-output model also provides an opportunity to calculate a multiplier value associated with each of these measures. For example, the employment multiplier for copper, nickel, lead, and zinc mining in the State of Minnesota of 3.1 indicates that for every job in the copper, nickel, lead, and zinc mining industry, another 2.1 jobs are created as the indirect and induced effect of the mining industry’s job. In the same way, the model estimates that for every dollar of wages, rents, interest and profits paid to non-ferrous mining employees and companies, another $0.41 is generated through indirect and induced effects throughout the economy of the State. The impact of mining employment and the payroll associated with these jobs may be the most obvious impact; however the Output measure also shows contribution to the region and to the State through production taxes, royalties, and fees on the exported ore. Although the total economic impacts for the State are almost always greater than the impacts for the Arrowhead Region and Douglas County, Wisconsin, the importance of mining sector to the region’s economy is proportionately greater. The following tables show the (current operations as of 2010) impact of non-ferrous mining on the State of Minnesota and the region, in 2012 dollars.

Bureau of Business and Economic Research Labovitz School of Business and Economics, University of Minnesota Duluth
20
Table 18. Minnesota Non-Ferrous Mining Economic Impacts, Baseline 2010
Source: IMPLAN Direct Effect Indirect Effect Induced Effect Total Effect
Value Added $111,689,936 $20,769,592 $24,596,460 $157,055,988
Output $136,398,301 $33,685,684 $40,004,310 $210,088,295
Employment 175 144 232 551
Note direct effects for Value Added, Output, and Employment results in different totals for the State and the region. The regional economy does not enjoy the same level of added indirect and induced effects. This implies, for instance, that copper, nickel, lead, and zinc mining creates about 50 more jobs in the Metro and other parts of the State than the Arrowhead region and Douglas County.
Table 19. Arrowhead and Douglas County, Wisconsin, Non-Ferrous Mining Economic Impacts, Baseline 2010
Source: IMPLAN Direct Effect Indirect Effect Induced Effect Total Effect
Value Added $119,445,069 $11,918,069 $23,612,982 $154,976,119
Output $136,398,301 $19,637,121 $38,794,919 $194,830,341
Employment 175 127 205 507
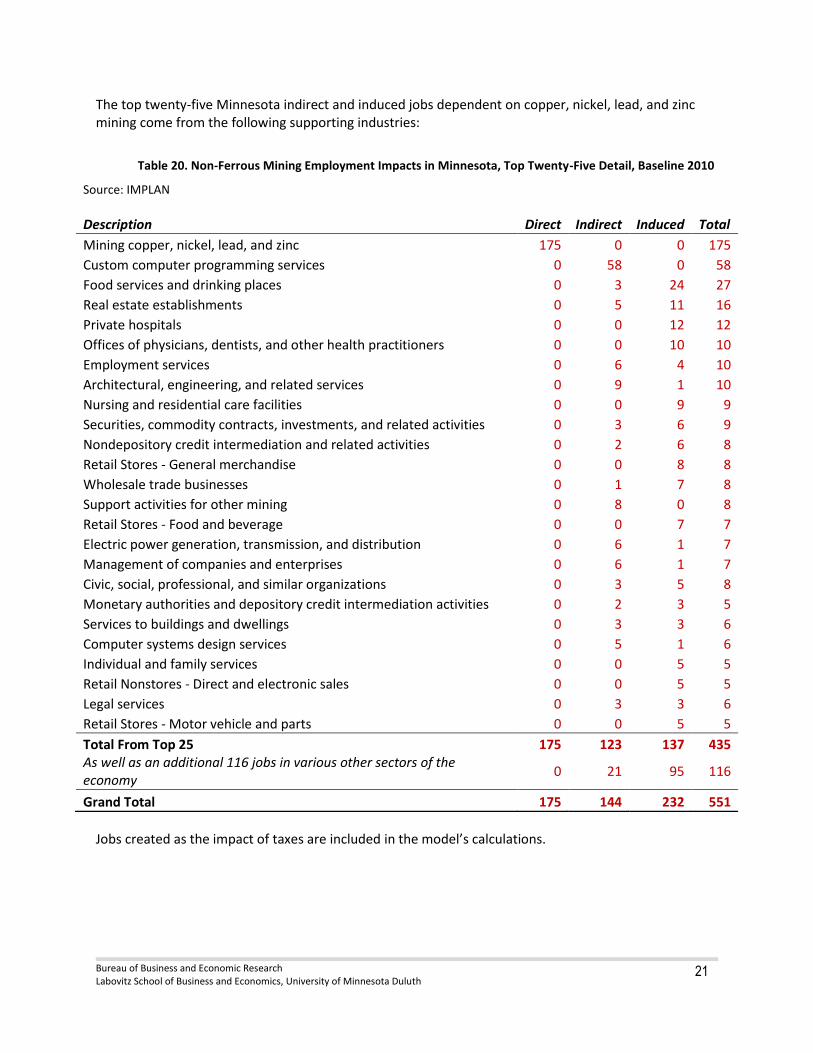
Bureau of Business and Economic Research Labovitz School of Business and Economics, University of Minnesota Duluth
21
The top twenty-five Minnesota indirect and induced jobs dependent on copper, nickel, lead, and zinc mining come from the following supporting industries:
Table 20. Non-Ferrous Mining Employment Impacts in Minnesota, Top Twenty-Five Detail, Baseline 2010
Source: IMPLAN
Description Direct Indirect Induced Total
Mining copper, nickel, lead, and zinc 175 0 0 175
Custom computer programming services 0 58 0 58
Food services and drinking places 0 3 24 27
Real estate establishments 0 5 11 16
Private hospitals 0 0 12 12
Offices of physicians, dentists, and other health practitioners 0 0 10 10
Employment services 0 6 4 10
Architectural, engineering, and related services 0 9 1 10
Nursing and residential care facilities 0 0 9 9
Securities, commodity contracts, investments, and related activities 0 3 6 9
Nondepository credit intermediation and related activities 0 2 6 8
Retail Stores - General merchandise 0 0 8 8
Wholesale trade businesses 0 1 7 8
Support activities for other mining 0 8 0 8
Retail Stores - Food and beverage 0 0 7 7
Electric power generation, transmission, and distribution 0 6 1 7
Management of companies and enterprises 0 6 1 7
Civic, social, professional, and similar organizations 0 3 5 8
Monetary authorities and depository credit intermediation activities 0 2 3 5
Services to buildings and dwellings 0 3 3 6
Computer systems design services 0 5 1 6
Individual and family services 0 0 5 5
Retail Nonstores - Direct and electronic sales 0 0 5 5
Legal services 0 3 3 6
Retail Stores - Motor vehicle and parts 0 0 5 5
Total From Top 25 175 123 137 435 As well as an additional 116 jobs in various other sectors of the economy
0 21 95 116
Grand Total 175 144 232 551
Jobs created as the impact of taxes are included in the model’s calculations.
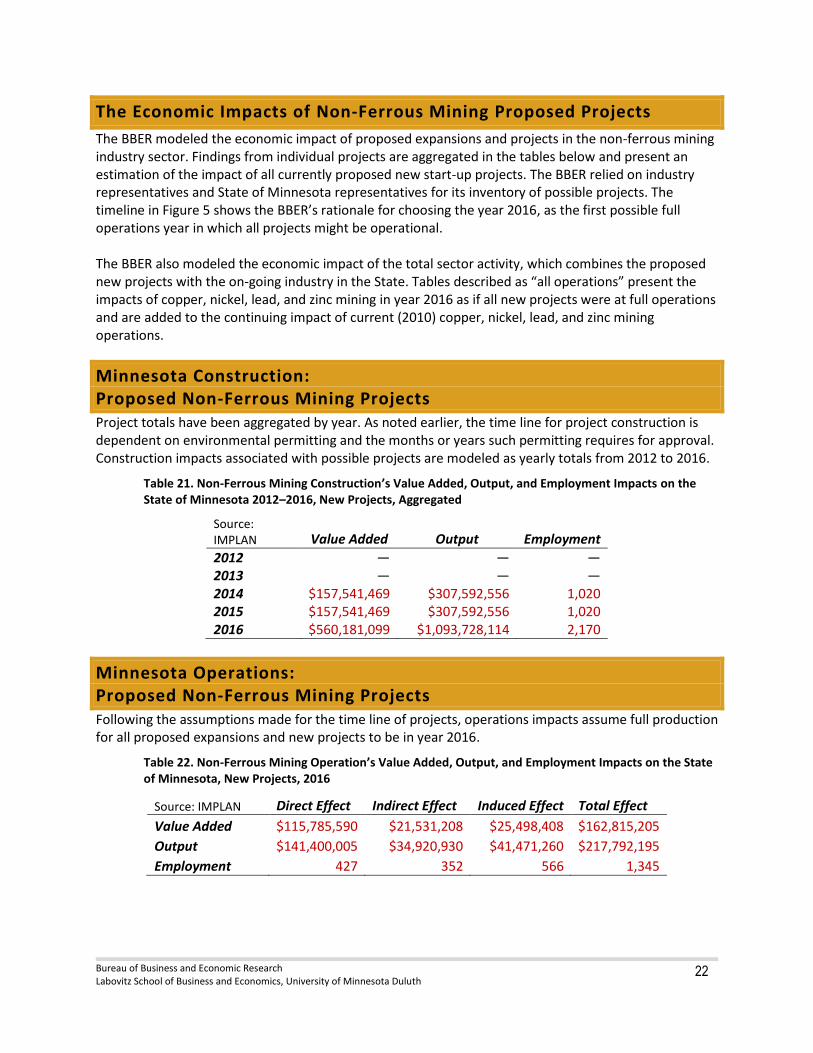
Bureau of Business and Economic Research Labovitz School of Business and Economics, University of Minnesota Duluth
22
The Economic Impacts of Non-Ferrous Mining Proposed Projects
The BBER modeled the economic impact of proposed expansions and projects in the non-ferrous mining industry sector. Findings from individual projects are aggregated in the tables below and present an estimation of the impact of all currently proposed new start-up projects. The BBER relied on industry representatives and State of Minnesota representatives for its inventory of possible projects. The timeline in Figure 5 shows the BBER’s rationale for choosing the year 2016, as the first possible full operations year in which all projects might be operational. The BBER also modeled the economic impact of the total sector activity, which combines the proposed new projects with the on-going industry in the State. Tables described as “all operations” present the impacts of copper, nickel, lead, and zinc mining in year 2016 as if all new projects were at full operations and are added to the continuing impact of current (2010) copper, nickel, lead, and zinc mining operations.
Minnesota Construction: Proposed Non-Ferrous Mining Projects Project totals have been aggregated by year. As noted earlier, the time line for project construction is dependent on environmental permitting and the months or years such permitting requires for approval. Construction impacts associated with possible projects are modeled as yearly totals from 2012 to 2016.
Table 21. Non-Ferrous Mining Construction’s Value Added, Output, and Employment Impacts on the State of Minnesota 2012–2016, New Projects, Aggregated
Source: IMPLAN Value Added Output Employment
2012 — — — 2013 — — — 2014 $157,541,469 $307,592,556 1,020 2015 $157,541,469 $307,592,556 1,020 2016 $560,181,099 $1,093,728,114 2,170
Minnesota Operations: Proposed Non-Ferrous Mining Projects Following the assumptions made for the time line of projects, operations impacts assume full production for all proposed expansions and new projects to be in year 2016.
Table 22. Non-Ferrous Mining Operation’s Value Added, Output, and Employment Impacts on the State of Minnesota, New Projects, 2016
Source: IMPLAN Direct Effect Indirect Effect Induced Effect Total Effect
Value Added $115,785,590 $21,531,208 $25,498,408 $162,815,205
Output $141,400,005 $34,920,930 $41,471,260 $217,792,195
Employment 427 352 566 1,345

Bureau of Business and Economic Research Labovitz School of Business and Economics, University of Minnesota Duluth
23
Minnesota Operations: All Proposed and Continuing Non-Ferrous Mining, 2016 The table below shows the estimated impact of full operations for all proposed new projects and all continuing industry operations for year 2016.
Table 23. Non-Ferrous Mining Operation’s Value Added, Output, and Employment Impacts on the State of Minnesota, 2016, All Operations
Source: IMPLAN Direct Effect Indirect Effect Induced Effect Total Effect
Value Added $227,475,526 $42,300,800 $50,094,868 $319,871,193
Output $277,798,306 $68,606,614 $81,475,570 $427,880,490
Employment 602 496 798 1,896
Region Construction: Proposed Non-Ferrous Mining Projects As with the impacts for the State, project totals have been aggregated by year. As noted earlier, the time line for project construction is dependent on environmental permitting and does not forecast the months or years such permitting requires for approval. Construction impacts associated with possible projects are modeled as yearly totals from 2012 to 2016.
Table 24. Non-Ferrous Mining Construction’s Value Added, Output, and Employment Impacts on the Arrowhead Region and Douglas County, Wisconsin, New Projects, Aggregated, 2012–2016
Source: IMPLAN Value Added Output Employment
2012 — — — 2013 — — — 2014 $114,596,328 $245,174,222 841 2015 $114,596,324 $245,174,222 841 2016 $407,478,088 $871,782,948 1,790
Region Operations: Proposed Non-Ferrous Mining Projects Following the assumptions made for the time line of projects, operations impacts assume full production for all new projects to be in year 2016.
Table 25. Non-Ferrous Mining Operation’s Value Added, Output, and Employment Impacts on the Arrowhead Region and Douglas County, Wisconsin, New Projects, 2016
Source: IMPLAN Direct Effect Indirect Effect Induced Effect Total Effect
Value Added $123,825,096 $12,355,096 $24,478,866 $160,659,059
Output $141,400,005 $20,357,204 $40,217,523 $201,974,731
Employment 427 310 498 1,235
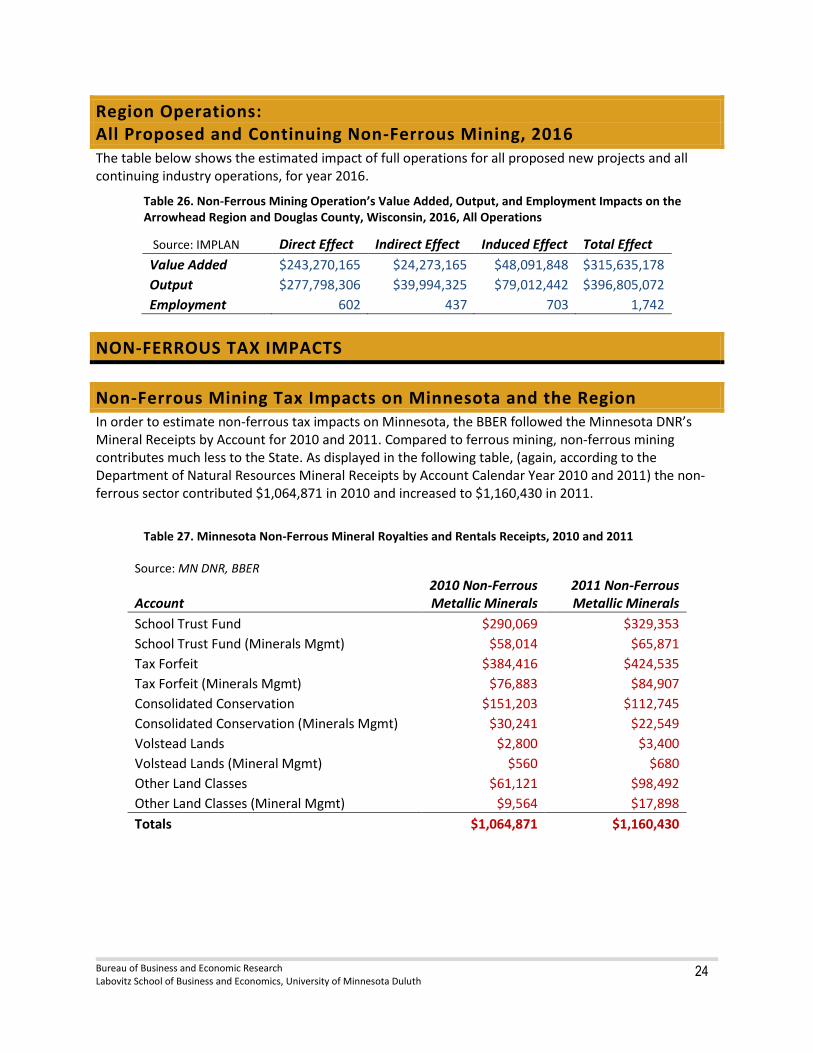
Bureau of Business and Economic Research Labovitz School of Business and Economics, University of Minnesota Duluth
24
Region Operations: All Proposed and Continuing Non-Ferrous Mining, 2016 The table below shows the estimated impact of full operations for all proposed new projects and all continuing industry operations, for year 2016.
Table 26. Non-Ferrous Mining Operation’s Value Added, Output, and Employment Impacts on the Arrowhead Region and Douglas County, Wisconsin, 2016, All Operations
Source: IMPLAN Direct Effect Indirect Effect Induced Effect Total Effect
Value Added $243,270,165 $24,273,165 $48,091,848 $315,635,178
Output $277,798,306 $39,994,325 $79,012,442 $396,805,072
Employment 602 437 703 1,742
NON-FERROUS TAX IMPACTS
Non-Ferrous Mining Tax Impacts on Minnesota and the Region In order to estimate non-ferrous tax impacts on Minnesota, the BBER followed the Minnesota DNR’s Mineral Receipts by Account for 2010 and 2011. Compared to ferrous mining, non-ferrous mining contributes much less to the State. As displayed in the following table, (again, according to the Department of Natural Resources Mineral Receipts by Account Calendar Year 2010 and 2011) the non-ferrous sector contributed $1,064,871 in 2010 and increased to $1,160,430 in 2011.
Table 27. Minnesota Non-Ferrous Mineral Royalties and Rentals Receipts, 2010 and 2011
Source: MN DNR, BBER
Account
2010 Non-Ferrous Metallic Minerals
2011 Non-Ferrous Metallic Minerals
School Trust Fund $290,069 $329,353
School Trust Fund (Minerals Mgmt) $58,014 $65,871
Tax Forfeit $384,416 $424,535
Tax Forfeit (Minerals Mgmt) $76,883 $84,907
Consolidated Conservation $151,203 $112,745
Consolidated Conservation (Minerals Mgmt) $30,241 $22,549
Volstead Lands $2,800 $3,400
Volstead Lands (Mineral Mgmt) $560 $680
Other Land Classes $61,121 $98,492
Other Land Classes (Mineral Mgmt) $9,564 $17,898
Totals $1,064,871 $1,160,430
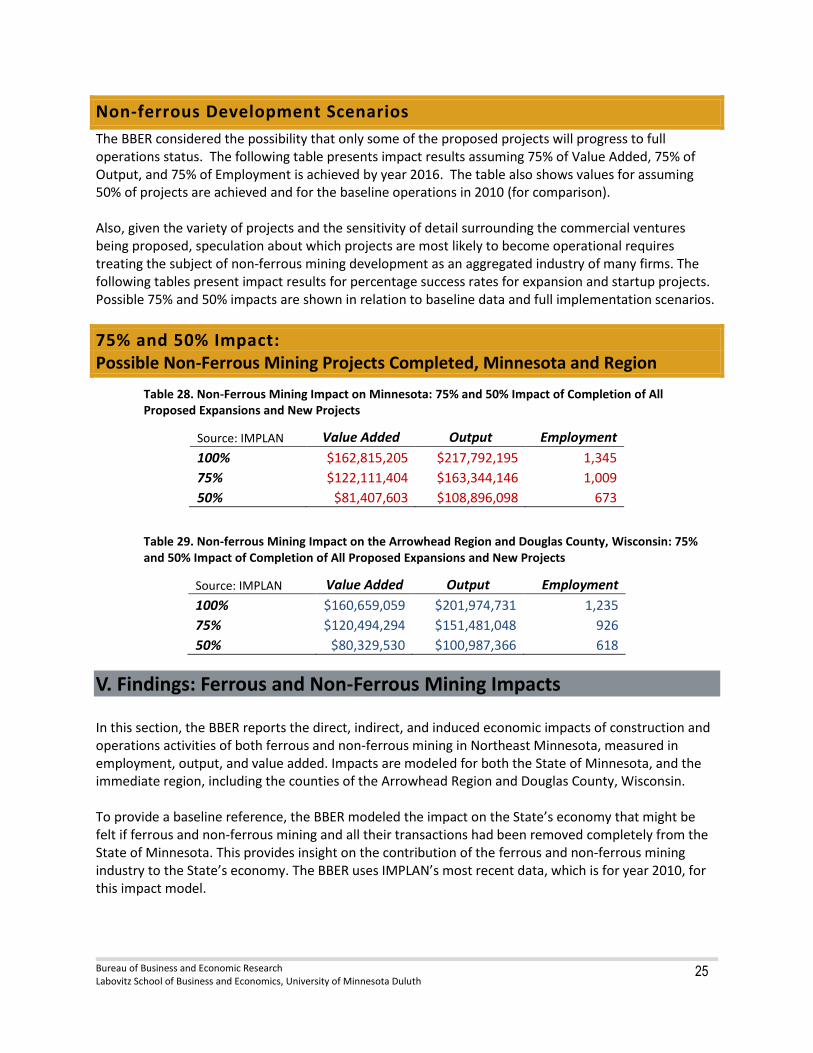
Bureau of Business and Economic Research Labovitz School of Business and Economics, University of Minnesota Duluth
25
Non-ferrous Development Scenarios
The BBER considered the possibility that only some of the proposed projects will progress to full operations status. The following table presents impact results assuming 75% of Value Added, 75% of Output, and 75% of Employment is achieved by year 2016. The table also shows values for assuming 50% of projects are achieved and for the baseline operations in 2010 (for comparison). Also, given the variety of projects and the sensitivity of detail surrounding the commercial ventures being proposed, speculation about which projects are most likely to become operational requires treating the subject of non-ferrous mining development as an aggregated industry of many firms. The following tables present impact results for percentage success rates for expansion and startup projects. Possible 75% and 50% impacts are shown in relation to baseline data and full implementation scenarios.
75% and 50% Impact: Possible Non-Ferrous Mining Projects Completed, Minnesota and Region
Table 28. Non-Ferrous Mining Impact on Minnesota: 75% and 50% Impact of Completion of All Proposed Expansions and New Projects
Source: IMPLAN Value Added Output Employment
100% $162,815,205 $217,792,195 1,345
75% $122,111,404 $163,344,146 1,009
50% $81,407,603 $108,896,098 673
Table 29. Non-ferrous Mining Impact on the Arrowhead Region and Douglas County, Wisconsin: 75% and 50% Impact of Completion of All Proposed Expansions and New Projects
Source: IMPLAN Value Added Output Employment
100% $160,659,059 $201,974,731 1,235
75% $120,494,294 $151,481,048 926
50% $80,329,530 $100,987,366 618
V. Findings: Ferrous and Non-Ferrous Mining Impacts In this section, the BBER reports the direct, indirect, and induced economic impacts of construction and operations activities of both ferrous and non-ferrous mining in Northeast Minnesota, measured in employment, output, and value added. Impacts are modeled for both the State of Minnesota, and the immediate region, including the counties of the Arrowhead Region and Douglas County, Wisconsin. To provide a baseline reference, the BBER modeled the impact on the State’s economy that might be felt if ferrous and non-ferrous mining and all their transactions had been removed completely from the State of Minnesota. This provides insight on the contribution of the ferrous and non-ferrous mining industry to the State’s economy. The BBER uses IMPLAN’s most recent data, which is for year 2010, for this impact model.
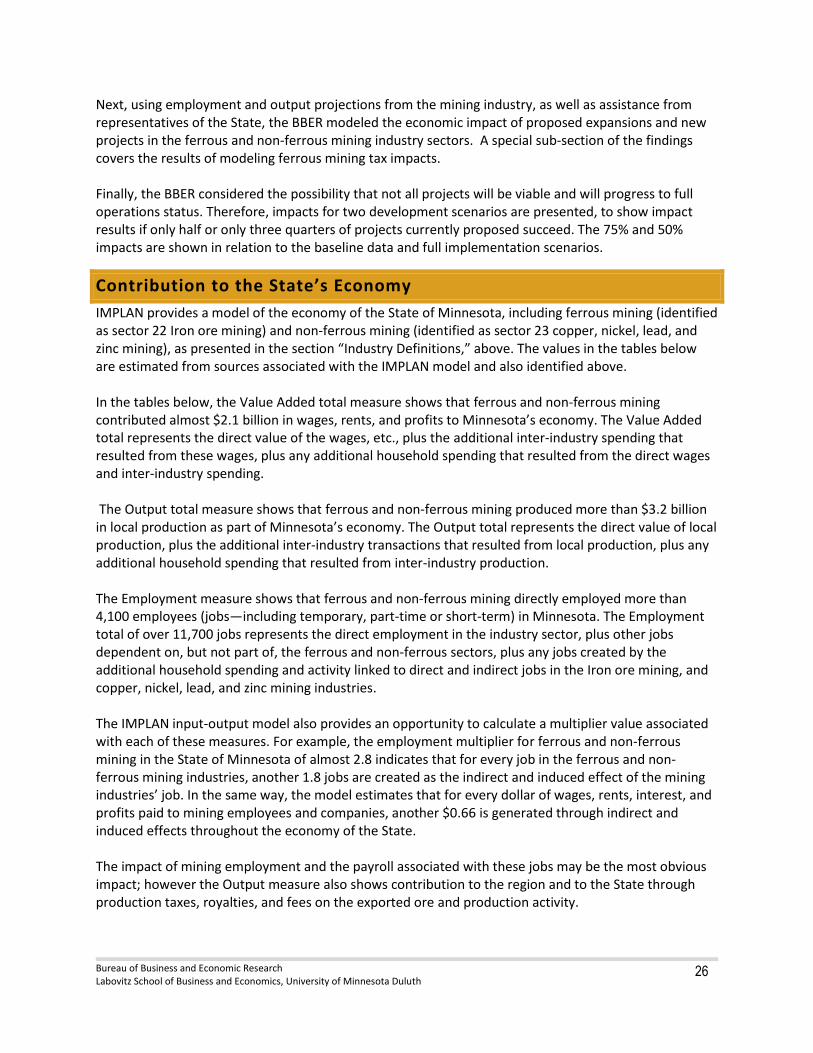
Bureau of Business and Economic Research Labovitz School of Business and Economics, University of Minnesota Duluth
26
Next, using employment and output projections from the mining industry, as well as assistance from representatives of the State, the BBER modeled the economic impact of proposed expansions and new projects in the ferrous and non-ferrous mining industry sectors. A special sub-section of the findings covers the results of modeling ferrous mining tax impacts. Finally, the BBER considered the possibility that not all projects will be viable and will progress to full operations status. Therefore, impacts for two development scenarios are presented, to show impact results if only half or only three quarters of projects currently proposed succeed. The 75% and 50% impacts are shown in relation to the baseline data and full implementation scenarios.
Contribution to the State’s Economy
IMPLAN provides a model of the economy of the State of Minnesota, including ferrous mining (identified as sector 22 Iron ore mining) and non-ferrous mining (identified as sector 23 copper, nickel, lead, and zinc mining), as presented in the section “Industry Definitions,” above. The values in the tables below are estimated from sources associated with the IMPLAN model and also identified above. In the tables below, the Value Added total measure shows that ferrous and non-ferrous mining contributed almost $2.1 billion in wages, rents, and profits to Minnesota’s economy. The Value Added total represents the direct value of the wages, etc., plus the additional inter-industry spending that resulted from these wages, plus any additional household spending that resulted from the direct wages and inter-industry spending. The Output total measure shows that ferrous and non-ferrous mining produced more than $3.2 billion in local production as part of Minnesota’s economy. The Output total represents the direct value of local production, plus the additional inter-industry transactions that resulted from local production, plus any additional household spending that resulted from inter-industry production. The Employment measure shows that ferrous and non-ferrous mining directly employed more than 4,100 employees (jobs—including temporary, part-time or short-term) in Minnesota. The Employment total of over 11,700 jobs represents the direct employment in the industry sector, plus other jobs dependent on, but not part of, the ferrous and non-ferrous sectors, plus any jobs created by the additional household spending and activity linked to direct and indirect jobs in the Iron ore mining, and copper, nickel, lead, and zinc mining industries. The IMPLAN input-output model also provides an opportunity to calculate a multiplier value associated with each of these measures. For example, the employment multiplier for ferrous and non-ferrous mining in the State of Minnesota of almost 2.8 indicates that for every job in the ferrous and non-ferrous mining industries, another 1.8 jobs are created as the indirect and induced effect of the mining industries’ job. In the same way, the model estimates that for every dollar of wages, rents, interest, and profits paid to mining employees and companies, another $0.66 is generated through indirect and induced effects throughout the economy of the State. The impact of mining employment and the payroll associated with these jobs may be the most obvious impact; however the Output measure also shows contribution to the region and to the State through production taxes, royalties, and fees on the exported ore and production activity.
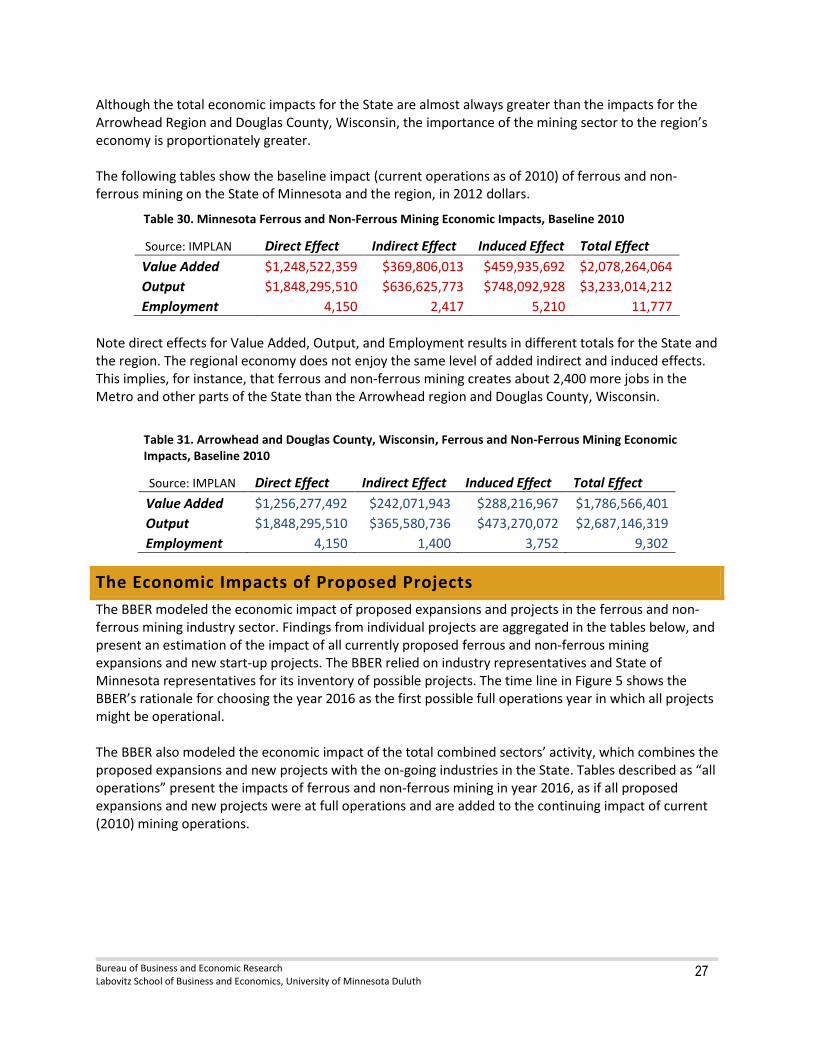
Bureau of Business and Economic Research Labovitz School of Business and Economics, University of Minnesota Duluth
27
Although the total economic impacts for the State are almost always greater than the impacts for the Arrowhead Region and Douglas County, Wisconsin, the importance of the mining sector to the region’s economy is proportionately greater. The following tables show the baseline impact (current operations as of 2010) of ferrous and non-ferrous mining on the State of Minnesota and the region, in 2012 dollars.
Table 30. Minnesota Ferrous and Non-Ferrous Mining Economic Impacts, Baseline 2010
Source: IMPLAN Direct Effect Indirect Effect Induced Effect Total Effect
Value Added $1,248,522,359 $369,806,013 $459,935,692 $2,078,264,064
Output $1,848,295,510 $636,625,773 $748,092,928 $3,233,014,212
Employment 4,150 2,417 5,210 11,777
Note direct effects for Value Added, Output, and Employment results in different totals for the State and the region. The regional economy does not enjoy the same level of added indirect and induced effects. This implies, for instance, that ferrous and non-ferrous mining creates about 2,400 more jobs in the Metro and other parts of the State than the Arrowhead region and Douglas County, Wisconsin.
Table 31. Arrowhead and Douglas County, Wisconsin, Ferrous and Non-Ferrous Mining Economic Impacts, Baseline 2010
Source: IMPLAN Direct Effect Indirect Effect Induced Effect Total Effect
Value Added $1,256,277,492 $242,071,943 $288,216,967 $1,786,566,401
Output $1,848,295,510 $365,580,736 $473,270,072 $2,687,146,319
Employment 4,150 1,400 3,752 9,302
The Economic Impacts of Proposed Projects
The BBER modeled the economic impact of proposed expansions and projects in the ferrous and non-ferrous mining industry sector. Findings from individual projects are aggregated in the tables below, and present an estimation of the impact of all currently proposed ferrous and non-ferrous mining expansions and new start-up projects. The BBER relied on industry representatives and State of Minnesota representatives for its inventory of possible projects. The time line in Figure 5 shows the BBER’s rationale for choosing the year 2016 as the first possible full operations year in which all projects might be operational. The BBER also modeled the economic impact of the total combined sectors’ activity, which combines the proposed expansions and new projects with the on-going industries in the State. Tables described as “all operations” present the impacts of ferrous and non-ferrous mining in year 2016, as if all proposed expansions and new projects were at full operations and are added to the continuing impact of current (2010) mining operations.
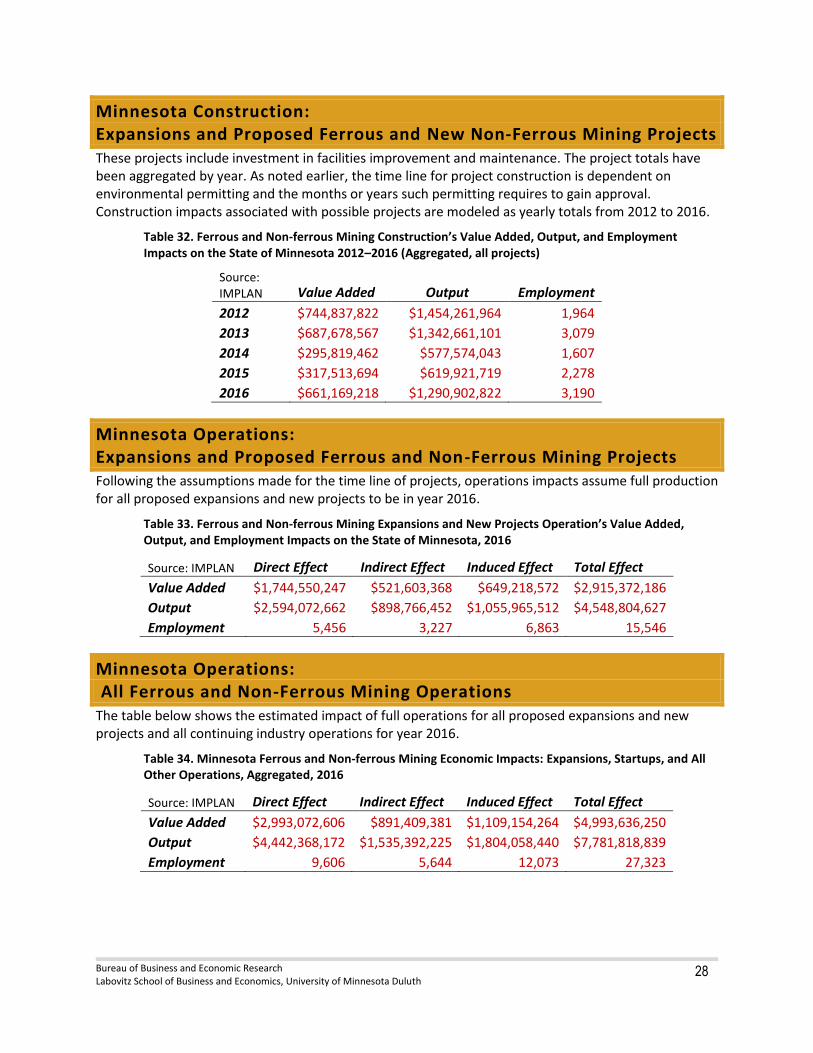
Bureau of Business and Economic Research Labovitz School of Business and Economics, University of Minnesota Duluth
28
Minnesota Construction: Expansions and Proposed Ferrous and New Non-Ferrous Mining Projects These projects include investment in facilities improvement and maintenance. The project totals have been aggregated by year. As noted earlier, the time line for project construction is dependent on environmental permitting and the months or years such permitting requires to gain approval. Construction impacts associated with possible projects are modeled as yearly totals from 2012 to 2016.
Table 32. Ferrous and Non-ferrous Mining Construction’s Value Added, Output, and Employment Impacts on the State of Minnesota 2012–2016 (Aggregated, all projects)
Source: IMPLAN Value Added Output Employment
2012 $744,837,822 $1,454,261,964 1,964
2013 $687,678,567 $1,342,661,101 3,079
2014 $295,819,462 $577,574,043 1,607
2015 $317,513,694 $619,921,719 2,278
2016 $661,169,218 $1,290,902,822 3,190
Minnesota Operations: Expansions and Proposed Ferrous and Non-Ferrous Mining Projects Following the assumptions made for the time line of projects, operations impacts assume full production for all proposed expansions and new projects to be in year 2016.
Table 33. Ferrous and Non-ferrous Mining Expansions and New Projects Operation’s Value Added, Output, and Employment Impacts on the State of Minnesota, 2016
Source: IMPLAN Direct Effect Indirect Effect Induced Effect Total Effect
Value Added $1,744,550,247 $521,603,368 $649,218,572 $2,915,372,186
Output $2,594,072,662 $898,766,452 $1,055,965,512 $4,548,804,627
Employment 5,456 3,227 6,863 15,546
Minnesota Operations: All Ferrous and Non-Ferrous Mining Operations The table below shows the estimated impact of full operations for all proposed expansions and new projects and all continuing industry operations for year 2016.
Table 34. Minnesota Ferrous and Non-ferrous Mining Economic Impacts: Expansions, Startups, and All Other Operations, Aggregated, 2016
Source: IMPLAN Direct Effect Indirect Effect Induced Effect Total Effect
Value Added $2,993,072,606 $891,409,381 $1,109,154,264 $4,993,636,250
Output $4,442,368,172 $1,535,392,225 $1,804,058,440 $7,781,818,839
Employment 9,606 5,644 12,073 27,323

Bureau of Business and Economic Research Labovitz School of Business and Economics, University of Minnesota Duluth
29
Region Construction: Expansions and Proposed Ferrous and Non-Ferrous Mining Projects As with the impacts for the State, these projects include investment in facilities improvement and maintenance. Project totals have been aggregated by year. As noted earlier, the time line for project construction is dependent on environmental permitting and does not forecast the months or years such permitting requires for approval. Construction impacts associated with possible projects are modeled as yearly totals from 2012 to 2016.
Table 35. Ferrous and Non-ferrous Mining Construction’s Value Added, Output, and Employment Impacts on the Arrowhead and Douglas County, Wisconsin, 2012–2016 (Aggregated, all projects)
Source: IMPLAN Value Added Output Employment
2012 $541,798,194 $1,159,155,347 1,620
2013 $500,220,297 $1,070,201,130 2,540
2014 $215,180,313 $460,369,606 1,326
2015 $230,937,305 $494,081,067 1,879
2016 $480,937,266 $1,028,945,902 2,631
Region Operations: Ferrous and Non-Ferrous Expansions and Proposed Projects Following the assumptions made for the time line of projects, operations impacts assume full production for all proposed expansions and new projects to be in year 2016.
Table 36. Ferrous and Non-Ferrous Mining Expansions and New Projects Operation’s Value Added, Output, and Employment Impacts on the Arrowhead and Douglas County, Wisconsin, 2016
Source: IMPLAN Direct Effect Indirect Effect Induced Effect Total Effect
Value Added $1,752,589,753 $342,101,622 $403,582,781 $2,498,274,157
Output $2,594,072,662 $515,998,245 $662,699,572 $3,772,770,478
Employment 5,456 1,921 4,985 12,362
Region Operations: All Ferrous and Non-Ferrous Mining Operations The table below shows the estimated impact of full operations for all proposed expansions and new projects and all continuing industry operations for year 2016.
Table 37. Arrowhead and Douglas County, Wisconsin, Ferrous and Non-Ferrous Mining Economic Impacts: Expansions, Startups, and All Other Operations, Aggregated, 2016
Source: IMPLAN Direct Effect Indirect Effect Induced Effect Total Effect
Value Added $3,008,867,245 $584,173,565 $691,799,748 $4,284,840,558
Output $4,442,368,172 $881,578,981 $1,135,969,644 $6,459,916,797
Employment 9,606 3,321 8,737 21,664

Bureau of Business and Economic Research Labovitz School of Business and Economics, University of Minnesota Duluth
30
Ferrous and Non-Ferrous Tax impacts
As with the ferrous and the non-ferrous tax impact discussions above, the following tables, taken from the Department of Natural Resources Mineral Receipts by Account Calendar Years 2010 and 2011, show how tax receipts to the State are distributed for both ferrous and non-ferrous mining.
Table 38. Minnesota Ferrous and Non-Ferrous Royalties and Rentals Receipts, 2010 and 2011
Source: MN DNR, BBER Account
Ferrous Iron-Ore Taconite
Non-Ferrous Metallic Minerals
2010
School Trust Fund $10,487,000 $290,069
School Trust Fund (Minerals Mgmt) $2,071,993 $58,014
University Trust Fund $2,270,000
University Trust Fund (Minerals Mgmt) $451,195
Tax Forfeit $729,000 $384,416
Tax Forfeit (Minerals Mgmt) $136,194 $76,883
Consolidated Conservation $151,203 Consolidated Conservation (Minerals Mgmt) $30,241
Volstead Lands $2,800
Volstead Lands (Mineral Mgmt) $560
Other Land Classes $61,121
Other Land Classes (Mineral Mgmt) $9,564
Advanced Royalty Account $389,000
Totals $16,534,382 $1,064,871
2011
School Trust Fund $21,448,000 $329,353
School Trust Fund (Minerals Mgmt) $4,248,263 $65,871
University Trust Fund $12,526,000
University Trust Fund (Minerals Mgmt) $2,503,345
Tax Forfeit $859,000 $424,535
Tax Forfeit (Minerals Mgmt) $162,737 $84,907
Consolidated Conservation $112,745 Consolidated Conservation (Minerals Mgmt) $22,549
Volstead Lands $3,400
Volstead Lands (Mineral Mgmt) $680
Other Land Classes $98,492
Other Land Classes (Mineral Mgmt) $17,898
Advanced Royalty Account $389,000
Totals $42,136,345 $1,160,430
Readers are referred to the Appendix A of this report for more on ferrous and non-ferrous tax information. The BBER offers in this appendix sources for ferrous and non-ferrous tax values, more detail on tax impacts and Minnesota’s School Trust Lands and Permanent University Funds (PUF), and impact modeling using IMPLAN to estimate Federal, and State and Local taxes. This appendix also shows IMPLAN tax impact comparisons for ferrous and non-ferrous mining in Minnesota and the Arrowhead Region and Douglas County, Wisconsin.

Bureau of Business and Economic Research Labovitz School of Business and Economics, University of Minnesota Duluth
31
Ferrous and Non-Ferrous Development Scenarios
The BBER considered the possibility that only some of the proposed projects will progress to full operations status. The following table presents impact results assuming 75% of Value Added, 75% of Output, and 75% of Employment is achieved by year 2016. The table also shows values for assuming 50% of projects are achieved. Also, given the variety of projects and the sensitivity of detail surrounding the commercial ventures being proposed, speculation about which projects are most likely to become operational requires treating the subject of ferrous and non-ferrous mining development as aggregated industries of many firms. The following tables present impact results for percentage success rates for the expansion and startup projects.
75% and 50% Impact: Possible Ferrous and Non-Ferrous Mining Projects Completed, Minnesota and Region
Table 39. Ferrous and Non-Ferrous Mining Impact on Minnesota: 75% and 50% Impact of Completion of All Proposed Expansions and New Projects
Source: IMPLAN Value Added Output Employment
100% $2,915,372,186 $4,548,804,627 15,546
75% $2,186,529,140 $3,411,603,470 11,660
50% $1,457,686,093 $2,274,402,314 7,773
Table 40. Ferrous and Non-Ferrous Mining Impact on the Arrowhead Region and Douglas County, Wisconsin, 75% and 50% Impact of Completion of All Proposed Expansions and New Projects
Source: IMPLAN Value Added Output Employment
100% $2,498,274,157 $3,772,770,478 12,362
75% $1,873,705,618 $2,829,577,859 9,272
50% $1,249,137,079 $1,886,385,239 6,181

Bureau of Business and Economic Research Labovitz School of Business and Economics, University of Minnesota Duluth
32
VII. Conclusions In the summary tables below, the sector totals increase as the impact moves from the base year (numbers 1 and 2) through the impact of addition of expansions and new projects (numbers 3 through 6), to the hypothetical total (number 7) with includes all impacts. The IMPLAN model’s employment multiplier value associated with impact number 7 below is 2.8. This multiplier estimates that for this grand total impact, for every job in the mining industry, another 1.8 jobs are created as the indirect and induced effect of the mining industry’s job. In the same way, for this impact, the model estimates that for every dollar of wages, rents, interest and profits, another $0.67 is generated through indirect and induced effects throughout the economy of the State.
Table 41. Summaries: Ferrous and Non-ferrous Operations Impacts on Minnesota, Baseline 2010, and Proposed Expansions and New Projects, in 2012 Dollars
Source: IMPLAN Direct Effect Indirect Effect Induced Effect Total Effect 1) 2010 Ferrous (Baseline) Value Added $1,136,832,423 $349,036,421 $435,339,232 $1,921,208,076
Output $1,711,897,209 $602,940,089 $708,088,618 $3,022,925,917
Employment 3,975 2,273 4,978 11,226
2) 2010 Non-Ferrous (Baseline) Value Added $111,689,936 $20,769,592 $24,596,460 $157,055,988
Output $136,398,301 $33,685,684 $40,004,310 $210,088,295
Employment 175 144 232 551
3) Ferrous Expansions and New Projects Value Added $1,628,764,657 $500,072,160 $623,720,164 $2,752,556,981
Output $2,452,672,657 $863,845,522 $1,014,494,252 $4,331,012,432
Employment 5,029 2,875 6,297 14,201
4) Non-Ferrous New Projects Value Added $115,785,590 $21,531,208 $25,498,408 $162,815,205
Output $141,400,005 $34,920,930 $41,471,260 $217,792,195
Employment 427 352 566 1,345
5) Total Ferrous (Expansions, New
Projects, and 2010 Baseline Operations)
Value Added $2,765,597,080 $849,108,581 $1,059,059,396 $4,673,765,057
Output $4,164,569,866 $1,466,785,611 $1,722,582,870 $7,353,938,349
Employment 9,004 5,148 11,275 25,427
6) Total Non-Ferrous (New Projects and
2010 Baseline Operations) Value Added $227,475,526 $42,300,800 $50,094,868 $319,871,193
Output $277,798,306 $68,606,614 $81,475,570 $427,880,490
Employment 602 496 798 1,896
7) Total Ferrous and Non-Ferrous
(Expansions, New Projects, and 2010 Baseline Operations)
Value Added $2,993,072,606 $891,409,381 $1,109,154,264 $4,993,636,250
Output $4,442,368,172 $1,535,392,225 $1,804,058,440 $7,781,818,839
Employment 9,606 5,644 12,073 27,323

Bureau of Business and Economic Research Labovitz School of Business and Economics, University of Minnesota Duluth
33
For the Arrowhead Region and Douglas County, Wisconsin, the IMPLAN input-output model’s employment multiplier, for this grand total impact, is 2.3. This multiplier estimates that for every job in the ferrous and non-ferrous mining industries, another 1.3 jobs are created as the indirect and induced effect of the mining industry’s job. In the same way, for this impact, the model estimates that for every dollar of wages, rents, interest, and profits, another $0.42 is generated through indirect and induced effects throughout the economy of the Region.
Table 42. Summaries: Ferrous and Non-ferrous Operations Impacts on the Arrowhead Region and Douglas County, Wisconsin, Baseline 2010, and Proposed Expansions and New Projects, in 2012 Dollars
Source: IMPLAN Direct Effect Indirect Effect Induced Effect Total Effect 1) 2010 Ferrous (Baseline) Value Added $1,136,832,423 $230,153,874 $264,603,985 $1,631,590,282
Output $1,711,897,209 $345,943,615 $434,475,153 $2,492,315,978
Employment 3,975 1,273 3,547 8,795
2) 2010 Non-Ferrous (Baseline) Value Added $119,445,069 $11,918,069 $23,612,982 $154,976,119
Output $136,398,301 $19,637,121 $38,794,919 $194,830,341
Employment 175 127 205 507
3) Ferrous Expansions and New Projects Value Added $1,628,764,657 $329,746,526 $379,103,915 $2,337,615,098
Output $2,452,672,657 $495,641,041 $622,482,049 $3,570,795,747
Employment 5,029 1,611 4,487 11,127
4) Non-Ferrous New Projects Value Added $123,825,096 $12,355,096 $24,478,866 $160,659,059
Output $141,400,005 $20,357,204 $40,217,523 $201,974,731
Employment 427 310 498 1,235
5) Total Ferrous (Expansions, New
Projects, and 2010 Baseline Operations)
Value Added $2,765,597,080 $559,900,400 $643,707,900 $3,969,205,380
Output $4,164,569,866 $841,584,656 $1,056,957,202 $6,063,111,725
Employment 9,004 2,884 8,034 19,922
6) Total Non-Ferrous (New Projects and
2010 Baseline Operations) Value Added $243,270,165 $24,273,165 $48,091,848 $315,635,178
Output $277,798,306 $39,994,325 $79,012,442 $396,805,072
Employment 602 437 703 1,742
7) Total Ferrous and Non-Ferrous
(Expansions, New Projects, and 2010 Baseline Operations)
Value Added $3,008,867,245 $584,173,565 $691,799,748 $4,284,840,558
Output $4,442,368,172 $881,578,981 $1,135,969,644 $6,459,916,797
Employment 9,606 3,321 9,122 22,049
Although the total economic impacts for the State are almost always greater than the impacts for the Arrowhead Region and Douglas County, Wisconsin, the importance of mining sector to the region’s economy is proportionately greater.

Bureau of Business and Economic Research Labovitz School of Business and Economics, University of Minnesota Duluth
34
The following graphic representations show comparisons between the 2010 baseline impacts and the hypothetical full operations with additional expansions and new projects. They compare the Value Added, Output, and Employment impacts of Minnesota versus the Arrowhead Region and Douglas County, Wisconsin.
Figure 6. Total Economic Impact of Ferrous and Non-ferrous Mining Payrolls (Value Added) In 2012 Millions of Dollars

Bureau of Business and Economic Research Labovitz School of Business and Economics, University of Minnesota Duluth
35
Figure 7. Total Economic Impact of Ferrous and Non-ferrous Mining Production (Output) in 2012 Millions of Dollars

Bureau of Business and Economic Research Labovitz School of Business and Economics, University of Minnesota Duluth
36
Figure 8. Total Economic Impact of Ferrous and Non-ferrous Mining (Employment)
References
Aylesworth, Ryan J., Dennis R. Becker, and Michael A. Kilgore. “Benchmarking Minnesota’s Environmental Review and Permitting Processes for Forestry and Mining Industries: A Comparative Assessment,” June 30, 2008, University of Minnesota.
Maki, Wilbur R., and Richard W. Lichty. Urban Regional Economics: Concepts, Tools, Applications. February 2000. Iowa State Press.
Miernyk , William. Elements of Input Output Analysis, New York, Random House, 1966.
Miller, Ronald E., and Peter D. Blair. Input-output Analysis: Foundations and Extensions, Englewood Cliffs, N.J. PrenticeHall, 1985 (out of print).
Minnesota Department of Natural Resources, Division of Lands and Minerals. Minnesota’s Permanent University Land and Fund, February 17, 2012.
Minnesota Department of Natural Resources, Division of Lands and Minerals, Transactions Section. Revenue Received from State Mineral Leases FY 1890-2011, Annual Report, April 2012.
Minnesota Department of Revenue. Mining Tax Guide, November 2011.
Olson, Doug and Scott Lindall, IMPLAN Software (Version 3) [Software]. Available from MIG, Inc., www.implan.com.
Bureau of Business and Economic Research Labovitz School of Business and Economics, University of Minnesota Duluth
A-1
Appendix A: Taxes, School Support, and the State of Minnesota’s Mineral Revenue This appendix reproduces secondary data sources for tax impact findings presented in the report, including sources for:
1) Taconite Production Tax A severance tax paid on concentrates or pellets produced by the taconite companies. The rate is determined by multiplying the prior year’s rate by the percent change in the Gross Domestic Product Implicit Price Deflator from the fourth quarter of the second preceding year to the fourth quarter of the preceding year. The rate for 2010 production was $2.380 per taxable ton. The tax revenue is distributed to various cities, townships, counties, and school districts within taconite mining areas.
2) Occupation Tax All mining companies, ferrous or non-ferrous, are subject to the Minnesota Occupation tax. This is similar to a corporate income tax. The tax revenue is credited to the general fund.
3) Sales and Use Tax All firms involved in the mining or processing of minerals are subject to the 6.875% sales and use tax on all purchases, except those qualifying for the industrial production exemption.
4) Income Tax (withholding on private royalties) All persons or companies paying royalties are required to withhold Minnesota income tax from royalty payments (6.25%) and remit the withholding tax and applicable information to the Minnesota Department of Revenue.
5) School district component of production tax 6) Various Ad Valorem and property taxes
Lands that include un-mined taconite and iron ore are subject to the ad valorem and property taxes. Lands and structures actively used for taconite production are exempt from the ad valorem tax and are subject to the production tax instead of the property tax.
This appendix also includes background information on,
7) Minnesota’s School Trust Lands, and Permanent University Funds (PUF)
Finally, this appendix includes a tax impact study from the IMPLAN model for purposes of comparison.
8) IMPLAN model tax impact comparisons for ferrous and non-ferrous mining in Minnesota and the Arrowhead Region and Douglas County, Wisconsin.

Bureau of Business and Economic Research Labovitz School of Business and Economics, University of Minnesota Duluth
A-2
1)
Taco
nit
e P
rod
uct
ion
Tax
Fi
gure
9. T
aco
nit
e P
rod
uct
ion
Tax
So
urc
e: M
inn
eso
ta M
inin
g T
ax
Gu
ide,
No
vem
ber
20
11
, p
g. 1
6.

Bureau of Business and Economic Research Labovitz School of Business and Economics, University of Minnesota Duluth
A-3
2) Occupation Tax
Figure 10. Occupation Tax Paid by Company
Source: Minnesota Mining Tax Guide, Minnesota Department of Revenue, November 2011, pg. 34

Bureau of Business and Economic Research Labovitz School of Business and Economics, University of Minnesota Duluth
A-4
3) Sales and Use Tax
Figure 11. Use Tax Paid
Source: Minnesota Mining Tax Guide, Minnesota Department of Revenue, November 2011, pg. 43
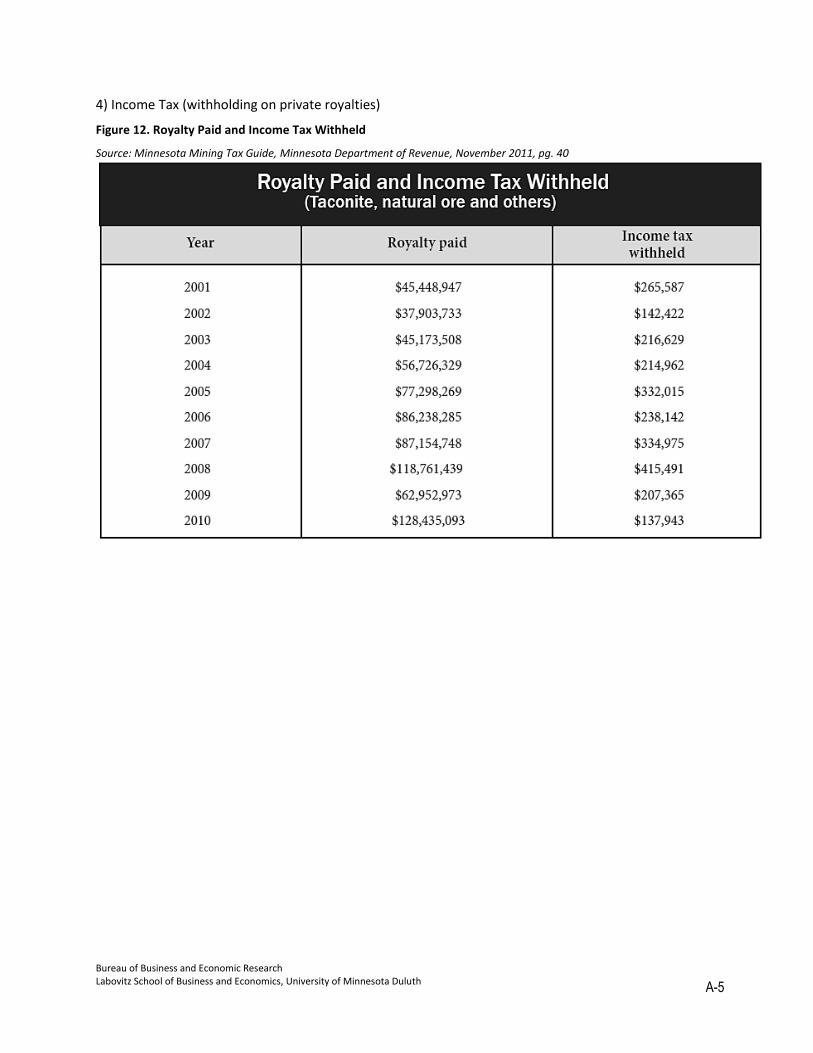
Bureau of Business and Economic Research Labovitz School of Business and Economics, University of Minnesota Duluth
A-5
4) Income Tax (withholding on private royalties)
Figure 12. Royalty Paid and Income Tax Withheld
Source: Minnesota Mining Tax Guide, Minnesota Department of Revenue, November 2011, pg. 40
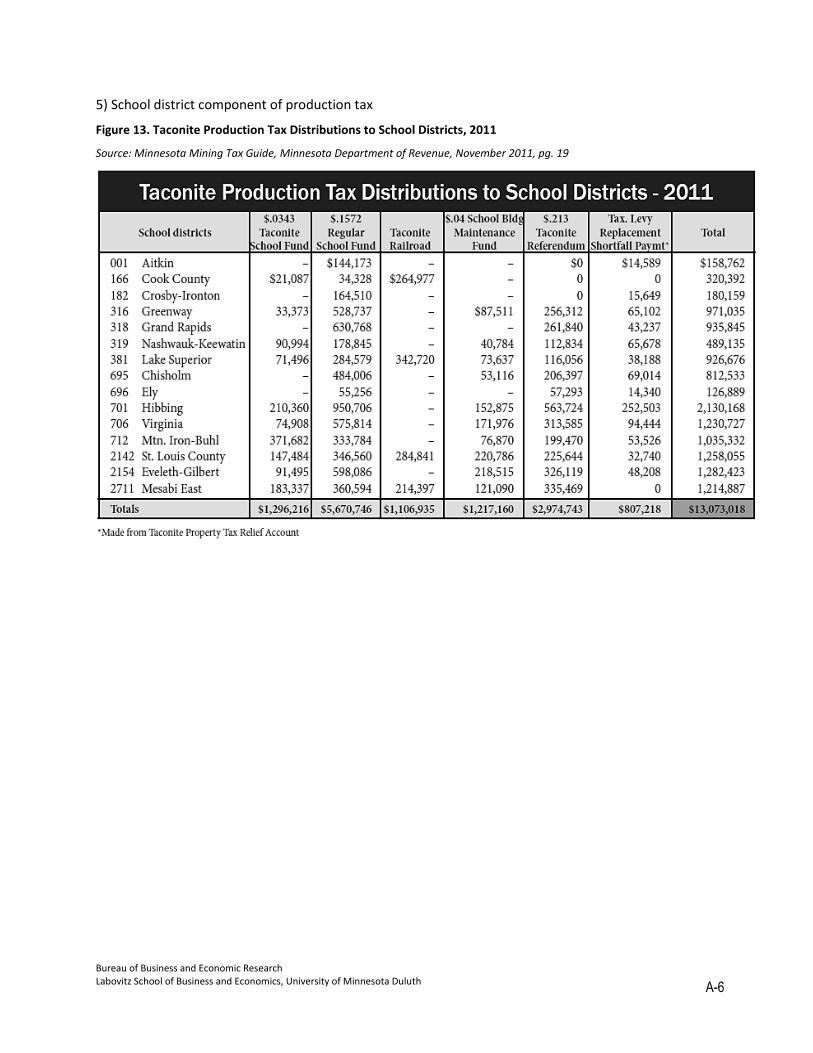
Bureau of Business and Economic Research Labovitz School of Business and Economics, University of Minnesota Duluth
A-6
5) School district component of production tax
Figure 13. Taconite Production Tax Distributions to School Districts, 2011
Source: Minnesota Mining Tax Guide, Minnesota Department of Revenue, November 2011, pg. 19
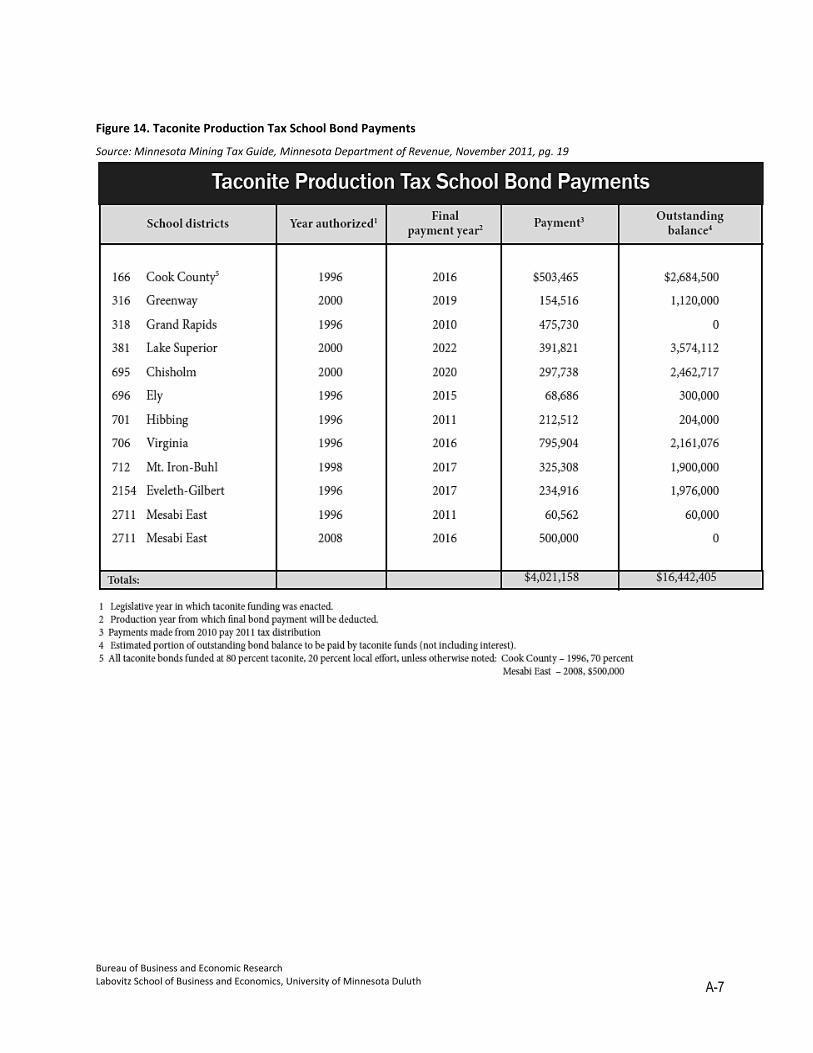
Bureau of Business and Economic Research Labovitz School of Business and Economics, University of Minnesota Duluth
A-7
Figure 14. Taconite Production Tax School Bond Payments
Source: Minnesota Mining Tax Guide, Minnesota Department of Revenue, November 2011, pg. 19
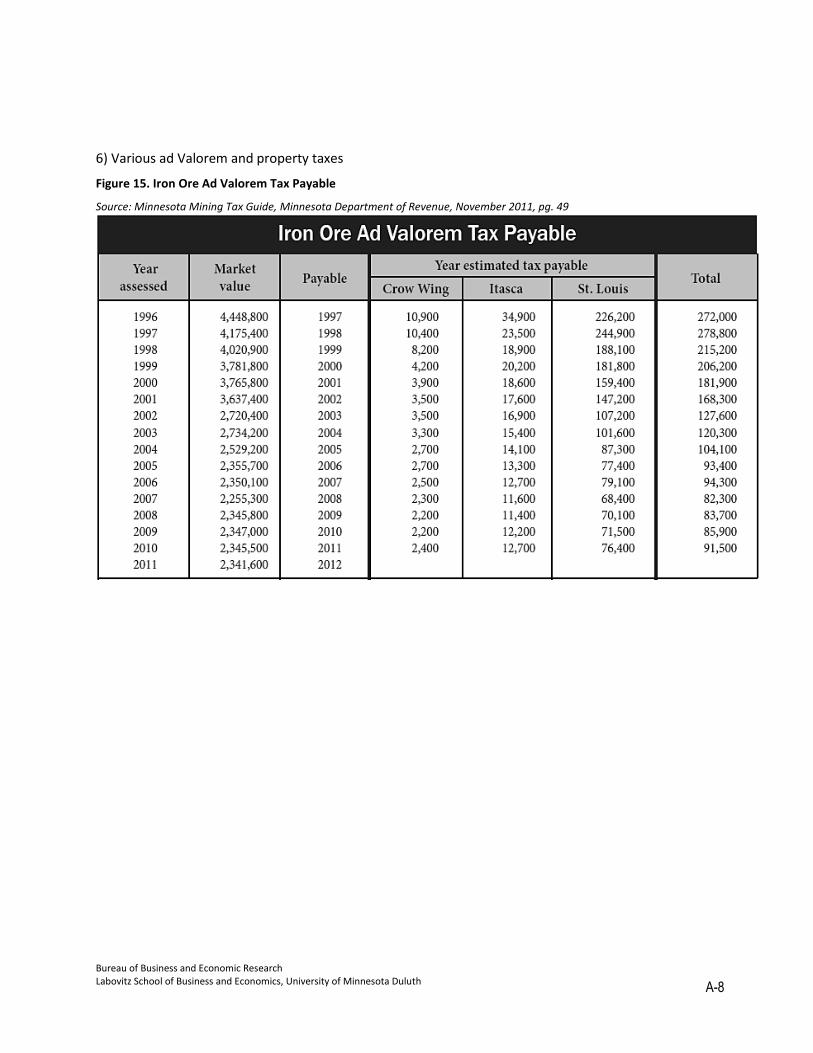
Bureau of Business and Economic Research Labovitz School of Business and Economics, University of Minnesota Duluth
A-8
6) Various ad Valorem and property taxes
Figure 15. Iron Ore Ad Valorem Tax Payable
Source: Minnesota Mining Tax Guide, Minnesota Department of Revenue, November 2011, pg. 49

Bureau of Business and Economic Research Labovitz School of Business and Economics, University of Minnesota Duluth
A-9
Figure 16. Taconite Railroad Ad Valorem Tax Assessed
Source: Minnesota Mining Tax Guide, Minnesota Department of Revenue, November 2011, pg. 50
Figure 17. Tax Collection and Distribution
Source, Minnesota Mining Tax Guide, Minnesota Department of Revenue, November 2011, pg.51

Bureau of Business and Economic Research Labovitz School of Business and Economics, University of Minnesota Duluth
A-10
Figure 18. Unmined Taconite Tax Paid
Source: Minnesota Mining Tax Guide, Minnesota Department of Revenue, November 2011, pg. 47
7) Permanent University Funds (PUF) The Minnesota Department of Natural Resources (DNR) administers more than 12 million acres of state-owned mineral rights. As of January 2012, there are 25,845 total acres of permanent university fund lands, with an additional 21,368 acres of mineral rights. The minerals management account was designed to create a $3 million principal that could be drawn upon in the event that future income generation drops. The $3 million level was reached in Fiscal Year 2007. At the end of each fiscal year the amount exceeding $3 million is distributed to the Permanent School Fund and Permanent University Fund in proportion to the revenue contributed to the minerals management account by these two land types. For Fiscal Year 2011, the Permanent University Fund will receive $1,285,875 transfer from the minerals management account.
Figure 19. FY 2011 Proceeds to be Transferred to the PUF
Source: Minnesota’s Permanent University Land and Fund, Minnesota DNR, February 2012, pg. 5

Bureau of Business and Economic Research Labovitz School of Business and Economics, University of Minnesota Duluth
A-11
Figure 20. FY 1992-2011 Mineral Lease Revenue Distribution by Account
Source: Minnesota’s Permanent University Land and Fund, Minnesota DNR, February 2012, pg. 6
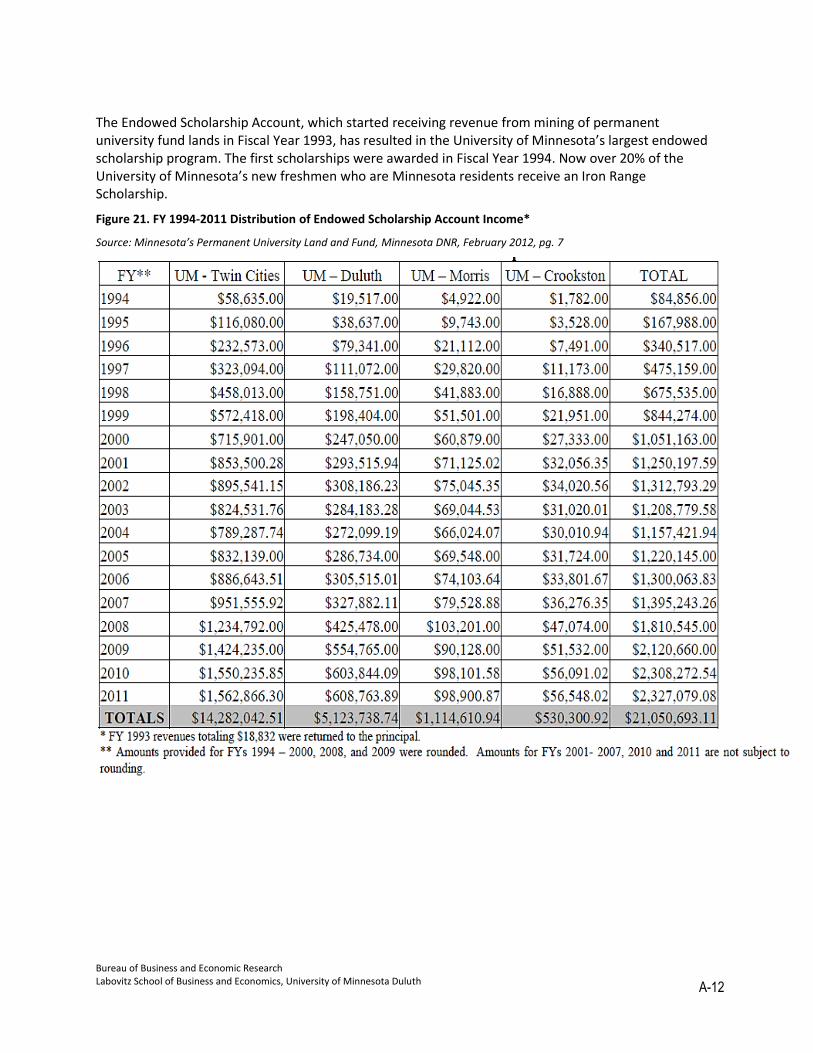
Bureau of Business and Economic Research Labovitz School of Business and Economics, University of Minnesota Duluth
A-12
The Endowed Scholarship Account, which started receiving revenue from mining of permanent university fund lands in Fiscal Year 1993, has resulted in the University of Minnesota’s largest endowed scholarship program. The first scholarships were awarded in Fiscal Year 1994. Now over 20% of the University of Minnesota’s new freshmen who are Minnesota residents receive an Iron Range Scholarship.
Figure 21. FY 1994-2011 Distribution of Endowed Scholarship Account Income*
Source: Minnesota’s Permanent University Land and Fund, Minnesota DNR, February 2012, pg. 7

Bureau of Business and Economic Research Labovitz School of Business and Economics, University of Minnesota Duluth
A-13
Distribution of Collected Royalties:
Figure 22. Mineral Revenue (in thousands) FY 2002-2011
Source: Revenue Received from State Mineral Leases, Minnesota DNR, April 2012, pg. 8
Figure 23. Revenue from Mineral Leases, FY 2010-2011
Source: Minnesota’s School Trust Lands, Minnesota DNR, March 2012, pg. 9

Bureau of Business and Economic Research Labovitz School of Business and Economics, University of Minnesota Duluth
A-14
Figure 24. School Trust Fund Gross Minerals Revenue FY 1994-2011
Source: Minnesota’s School Trust Lands, Minnesota DNR, March 2012, pg. 10
8) IMPLAN tax modeling
Source: IMPLAN, BBER
The following tax impact values are based on the existing relationships of the data found in the IMPLAN database. The general sources for that data include National Income and Product Accounts (NIPA) from the Bureau of Economic Analysis (BEA); the Bureau of the Census’s annual Consumer Expenditure Survey (CES), and the Bureau’s Annual Survey of State and Local Government Finances, as well as the BEA’s Regional Economic Information System (REIS). IMPLAN tracks tax impacts through “Employee Compensation, Proprietary Income, Household Expenditure, Enterprises (Corporations), and Indirect Business Taxes.” Federal tax impacts include “Corporate Profits Tax, Indirect Bus Tax: Custom Duty, Indirect Bus Tax: Excise Taxes, Indirect Bus Tax: Fed NonTaxes, Personal Tax: Estate and Gift Tax, Personal Tax: Income Tax, Personal Tax: NonTaxes (Fines- Fees, Social Ins Tax- Employee Contribution, and Social Ins Tax- Employer Contribution.” According to the IMPLAN model, state tax impacts include “Corporate Profits Tax, Dividends, Indirect Bus Tax: Motor Vehicle Lic, Indirect Bus Tax: Other Taxes, Indirect Bus Tax: Property Tax, Indirect Bus Tax: S/L NonTaxes, Indirect Bus Tax: Sales Tax, Indirect Bus Tax: Severance Tax, Personal Tax: Estate and Gift Tax, Personal Tax: Income Tax, Personal Tax: Motor Vehicle License, Personal Tax: NonTaxes (Fines- Fees, Personal Tax: Other Tax (Fish/Hunt), Personal Tax: Property Taxes, Social Ins Tax- Employee Contribution, and Social Ins Tax- Employer Contribution.”

Bureau of Business and Economic Research Labovitz School of Business and Economics, University of Minnesota Duluth
A-15
Readers are cautioned that comparisons with the foregoing Minnesota Department of Revenue and Minnesota Department of Natural Resources tax accounting do not compare easily with results from the IMPLAN model. However, the ability of IMPLAN to model tax impacts is demonstrated in the following comparisons for ferrous and non-ferrous mining in Minnesota and the Arrowhead Region and Douglas County, Wisconsin.
The IMPLAN tax impact is presented below for Federal and State totals.
Table 43. Ferrous Mining Tax Impact on Minnesota, 2016
Source: IMPLAN Employee
Compensation Proprietor
Income Indirect
Business Tax Households Corporations Total
Federal Govt, NonDefense $106,270,736 $6,643,855 $11,659,937 $67,672,704 $62,733,588 $254,980,820
State/Local Govt, NonEducation $1,894,478 $0 $65,727,414 $33,751,865 $10,315,824 $111,689,581
$108,165,214 $6,643,855 $77,387,351 $101,424,569 $73,049,412 $366,670,401
This table shows state and local taxes of almost $111.7 million. This amount includes taxes that are not directly attributable to production. The totals compile the direct, indirect, and induced effects of business and household spending. With the exception of indirect business taxes and sales and use taxes, these are additional taxes paid by business and workers to state and local government.
Table 44. Tax Impact Totals, Including Proposed Expansions and New Projects as Well as On-Going Ferrous and Non-Ferrous Operations, 2016
Source: IMPLAN, BBER Minnesota
Arrowhead and Douglas County,
Wisconsin
Iron ore mining:
Federal Government NonDefense $254,980,820 $215,651,408
State/Local Govt NonEducation $111,689,581 $97,895,406
Totals $366,670,401 $313,546,814
Copper, nickel, lead, and zinc mining:
Federal Government NonDefense $31,583,140 $31,869,803
State/Local Govt NonEducation $28,792,696 $23,690,264
Totals $60,375,836 $55,560,067
Ferrous and Non-Ferrous mining:
Federal Government NonDefense $286,563,960 $247,521,211
State/Local Govt NonEducation $140,482,277 $121,585,669
Totals $427,046,237 $369,106,880

Bureau of Business and Economic Research Labovitz School of Business and Economics, University of Minnesota Duluth
A-16
Appendix B: Additional Information
Readers are encouraged to remember the BBER is providing an economic impact analysis. Policy recommendations should be based on the “big picture” of total impact, and a cost-benefit analysis would be needed to assess the environmental, social, and governmental impacts of ferrous and non-ferrous mining in the State. Although a detailed cost-benefit analysis is beyond the scope of this report, a few points currently surrounding ferrous and non-ferrous mining activity in Minnesota and the Arrowhead and Douglas Counties are provided below.
1) Employment trends Employment data show the continuing importance of the mining sector.
Table 45. Minnesota Mining Employment and Payroll
Source: MN DEED Census of Employment and Wages (CEW)
Year Average Number of Employees Annual Wages
2002 5517 $273,016,618
2003 5139 $279,122,837
2004 5219 $295,623,992
2005 5132 $311,659,581
2006 5147 $335,058,894
2007 5222 $342,880,476
2008 5510 $394,811,584
2009 4419 $281,094,812
2010 5223 $384,668,356
2011 5811 $474,225,320
As a measurement of how important mining is to the Arrowhead Region, mining employment in the Region can be compared to the State. Location quotients identify the significance of an economic sector to the economic base of the state or region. When location quotients are sorted, those above 1.0 are usually considered part of the economy’s base, and therefore, exporting industries. Those less than 1.0 are supporting industries, and thus, net importers. When sorted for importance, the mining sector in the Arrowhead Region leads all other sectors, showing mining activity in the Region to be at least ten times more important than any other sector in the economy compared to the State.

Bureau of Business and Economic Research Labovitz School of Business and Economics, University of Minnesota Duluth
A-17
Table 46. Location Quotients, Arrowhead Region, Compared to the State of Minnesota, 2011
Source: IMPLAN
Arrowhead MN Location Quotient
Total, All Industries 137,866 2,604,196
Mining 339 19,191 10.10
Utilities 3,107 5,811 1.99
Public Administration 5,586 98,601 1.60
Arts, Entertainment, and Recreation 8,611 300,904 1.41
Accommodation and Food Services 1,490 14,177 1.27
Health Care and Social Assistance 2,961 126,093 1.26
Retail Trade 17,443 280,750 1.17
Construction 3,206 93,222 1.07
Other Services (except Public Administration) 398 57,199 0.98
Educational Services 4,591 136,378 0.82
Transportation and Warehousing 1,087 35,879 0.65
Finance and Insurance 3,333 128,850 0.64
Administrative and Support and Waste Management and Remediation Services
854 72,683 0.58
Real Estate and Rental and Leasing 4,032 130,774 0.57
Manufacturing 9,389 215,983 0.54
Professional, Scientific, and Technical Services 28,297 425,713 0.49
Wholesale Trade 3,630 48,621 0.44
Agriculture, Forestry, Fishing and Hunting 13,962 207,111 0.33
Management of Companies and Enterprises 4,359 84,240 0.22
Information 10,254 121,418 0.13
2) Direct and indirect benefits from the mining industry to the State of Minnesota. One way to examine the indirect and induced impacts from direct jobs in mining in St. Louis County, for example, is to show other jobs in the economy of the Region and of the State that are dependent on mining but not necessarily situated in the mining venues. This list implies occupations in industries supplying mining workers with transportation, eating and drinking establishments, healthcare providers, housing, and infrastructure, for the county, the region, and the State. In the report itself, a discussion is offered for comparing indirect and induced jobs in the region and the state, and thereby demonstrating the jobs supporting mining are outside the region but in the State.

Bureau of Business and Economic Research Labovitz School of Business and Economics, University of Minnesota Duluth
A-18
Table 47. Indirect and Induced Jobs Dependent on Iron Ore Mining Employment in Minnesota, 2010
Source: IMPLAN
Industry Direct Indirect Induced Total
Mining iron ore 3,975 20 0 3,995
Food services and drinking places 0 37 519 556
Transport by truck 0 342 35 377
Real estate establishments 0 31 237 268
Wholesale trade businesses 0 125 141 266
Private hospitals 0 0 247 247
Electric power generation, transmission, and distribution 0 208 17 225
Offices of physicians, dentists, and other health practitioners 0 0 224 224
Nursing and residential care facilities 0 0 201 201
Nondepository credit intermediation and related activities 0 63 133 196
Retail Stores - General merchandise 0 8 172 180
Support activities for other mining 0 171 0 171
Retail Stores - Food and beverage 0 8 159 167
Management of companies and enterprises 0 140 26 166
Securities, commodity contracts, investments, and related activities 0 25 137 162
Employment services 0 57 88 145
Civic, social, professional, and similar organizations 0 18 109 127
Mining and quarrying sand, gravel, clay, and ceramic and refractory minerals
0 116 0 116
Individual and family services 0 0 107 107
Retail Stores - Motor vehicle and parts 0 8 97 105
Retail Nonstores - Direct and electronic sales 0 4 100 104
Monetary authorities and depository credit intermediation activities 0 28 73 101
Services to buildings and dwellings 0 36 56 92
Retail Stores - Miscellaneous 0 4 83 87
Architectural, engineering, and related services 0 67 17 84
Total From Top 25 3,975 1,516 2,978 8,469
As well as an additional 2,757 jobs in another 279 various sectors of the economy…
0 757 2,000 2,757
Grand Total 3,975 2,273 4,978 11,226