the economic contributions of u.s. mining (2015 … · appendix a. naics definition of u.s ... the...
TRANSCRIPT

The Economic Contributions of U.S. Mining (2015 Update)
September 2016
A report prepared by the National Mining Association


TABLE OF CONTENTS
Executive Summary ........................................................................................E-1National Results .............................................................................................E-1Contribution by Mining Segment ........................................................................1Tax Payments of U.S. Mining .............................................................................1Methodology .......................................................................................................2Mining and the U.S. Economy by State ..............................................................3U.S. Coal mining by State ..................................................................................7U.S. Metal Ore Mining by State ........................................................................11U.S. Non-metallic Minerals Mining by State ....................................................15Details Regarding IMPLAN Methodology and Data Derivation on Direct Impacts ..................................................................19 Adjustments to IMPLAN Model ..............................................................19Appendix A. NAICS Definition of U.S. Mining ...................................................20Appendix B. The IMPLAN Model ......................................................................21


E-1
EXECUTIVE SUMMARYMore than 13,000 operations mine for coal, metal ores and non-metallic minerals in the United States, according to the Mine Safety and Health Administration. These mines provide the energy resources and raw materials that are essential to a growing economy.
National Results
U.S. mining directly and indirectly generated nearly 1.7 million full-time and part-time jobs in 2015, includ-ing employees and the self-employed.
• U.S. mines accounted for more than 565,000 jobs.• Jobs in other industries attributable to or induced by U.S. mining totaled more than 1.1 million.
U.S. labor income associated with U.S. mining exceeded $100 billion in 2015, which includes wages andsalaries, other employee benefits and owner-operator business (proprietors’) income.
Table E-1. Economic Contribution of U.S. Mining, 2015
Item Direct Indirect and Induced Total
Employment 565,548 1,122,816 1,688,364Labor Income (billions of dollars) $39.8 $63.9 $103.7Contribution to GDP (billions of dollars) $100.4 $120.0 $220.4Taxes Paid (billions of dollars) $18.0 $26.0 $44.0Source: Calculations based on Mine Safety & Health Administration 2015 fourth quarter employment and the IMPLAN modeling system

1
Contribution by Mining Segment
The direct contributions or value added by each of the three mining sectors identified in this report include the operationsof the mine, support activities and transportation of output from the mine.
The coal sector of U.S. mining accounted for 535,372 total jobs, $37.2 billion in total labor income and $65.6 billion in total contribution to GDP (see Table 1). Annual wages and salaries in coal mining operations (excluding support activities and transportation) averaged approximately $83,600 in 2015.1 Overall, the total jobs attributed to coal mining were responsible for approximately 32 percent of U.S. mining’s total employment contribution, 36 percent of total labor income and 30 percent of mining’s total contribution to GDP.2
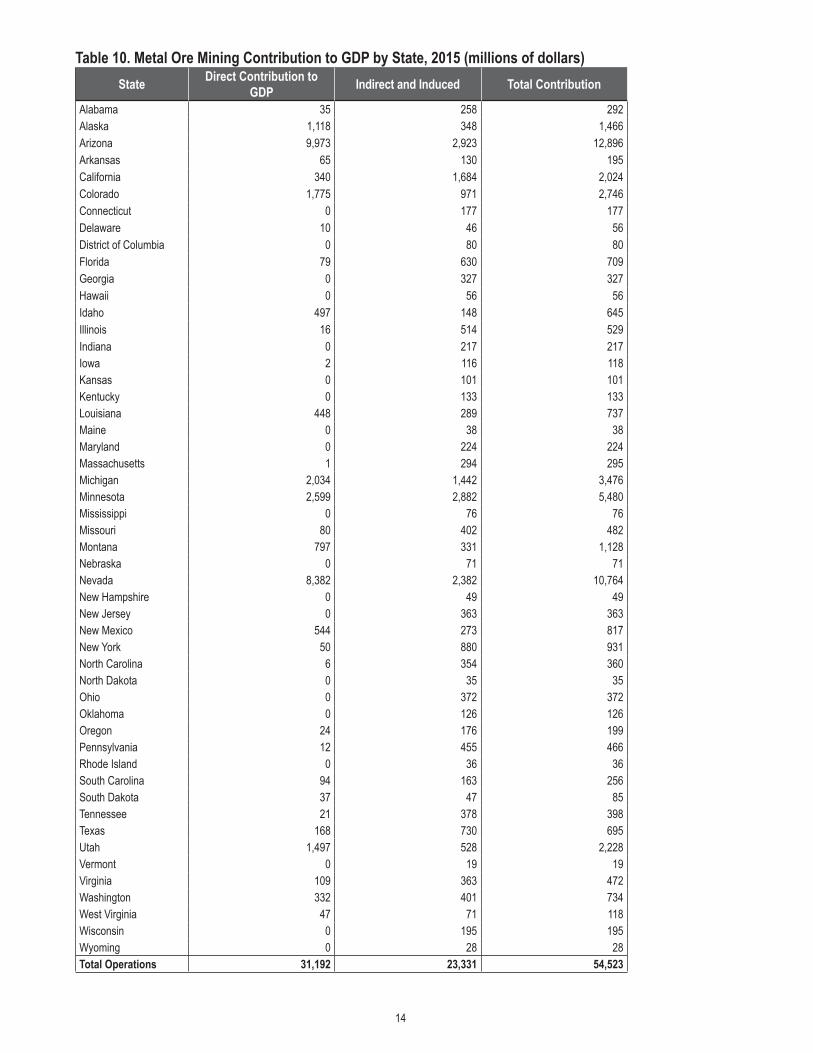
The metal ore mining segment of U.S. mining accounted for 319,797 jobs, $19.1 billion in labor compensation and $54.5 billion of GDP. Annual wages and salaries in the metal ore mining sector averaged $88,800. Metal ore mining accounted for 19 percent of total mining employment, 18 percent of labor income and 25 percent of mining’s contribution to GDP.
The non-metallic mineral mining segment of U.S. mining accounted for 833,196 jobs, $47.4 billion in labor compensation and $100.3 billion of U.S. GDP. Annual wages and salaries in the non-metallic mining sector averaged $61,800. Non-metallic mineral mining represented 49 percent of mining employment, 46 percent of labor income and 45 percent of its contribution to GDP.3
Table 1. Economic Contribution of U.S. Mining Operations by Segment
Sector Coal Mining Metal Ore Mining Non-metallic Mineral Mining Total
EmploymentDirect 146,820 92,109 326,619 565,548Indirect & Induced 388,552 227,688 506,576 1,122,816Total 535,372 319,797 833,196 1,688,364Labor Income ($billions)Direct $13.2 $7.2 $19.4 $39.8Indirect & Induced $23.9 $12.0 $28.0 $64.0Total $37.2 $19.1 $47.4 $103.7Contribution to GDP ($billions)Direct $25.6 $31.2 $43.6 $100.4Indirect & Induced $40.0 $23.3 $56.7 $120.0Total $65.6 $54.5 $100.3 $220.4
Tax Payments of U.S. Mining
Economic activity attributable to U.S. mining is taxed at the federal, state and local levels. These taxes take a variety of forms, including income taxes on company profits and employee wages, property taxes on equipment and structures and excise taxes on output. Mining activity generated an estimated $18 billion in federal, state and local taxes in 2015 that supported direct, indirect and induced taxes of $44 billion.1 Average wage and salary data from Bureau of Labor Statistics, Quarterly Census Employment and Wages, 2015. Labor income as presented in Table 1 results reflects total employee compensation (including benefits) and self-employment income for mining, support activities, and transportation attributable to mining output.2 Data derived from IMPLAN model multipliers. IMPLAN data is based on U.S. Bureau of Economic Analysis data.3 The transport of mining products, included in the figures above, represents a significant portion of these impacts. Transportation of mining output, for instance, is responsible for 210,180 direct transportation jobs and also contributes to labor income and GDP. These amounts have been distributed to coal, metal ore, and non-metallic mineral mining in Table 1.

2
Methodology
The economic contributions of U.S. mining to the domestic economy include its direct impact plus the economic activity of other industries that supply the mining industry. To quantify these linkages, we rely on the IMPLAN model, an input-output (I-O) model based on federal government data.
• Direct contributions: effects directly attributable to mining, such as the employment and output of mining companies. These effects include the transportation of mine output from the mine to the purchaser.
• Indirect contributions: effects of upstream suppliers to mining, including contractors and other companies providing inputs to mining companies, e.g. equipment manufacturers. Indirect effects also include the activity of suppliers to these companies.
• Induced contributions: spending by mining and supplier employees. Employees throughout the supply chain receive income associated with the direct and indirect activities, a portion of which is consumed. This consumption causes additional economic activity attributable to U.S. mining.
We have made adjustments to the output of the IMPLAN model to provide a more complete and accurate description of the overall contribution of U.S. mining.
See Appendix A for a more detailed description of our methodology.
This analysis can be considered conservative in that it does not include the economic or employee benefits from coal and uranium-based generation, or the manufacturing and other end-users of metal and non-metal minerals. According to the Edison Electric Institute, U.S. electricity generation directly and indirectly supported employment of more than one million people in 2015 and added $990 billion to the U.S. economy; coal and uranium are responsible for 53 percent of total electricity generation. The U.S. Geological Survey estimates that mineral commodities were transformed into $2.5 trillion worth of goods and services in 2015, an amount equal to 14 percent of the total U.S. GDP.

3
MINING AND THE U.S. ECONOMY BY STATE

4
Table 2. U.S. Mining Employment by State, 2015
StateDirect Effects Indirect and
InducedTotal
ContributionMine Workers Support Activities Transportation Total DirectAlabama 10,026 151 4,751 14,928 22,118 37,046Alaska 3,340 154 1,001 4,495 5,464 9,959Arizona 17,673 465 4,343 22,482 43,184 65,666Arkansas 3,410 18 2,409 5,837 8,079 13,916California 11,112 138 11,167 22,418 76,712 99,129Colorado 8,561 463 10,386 19,410 30,717 50,126Connecticut 908 56 678 1,642 6,760 8,402Delaware 154 0 61 215 2,133 2,348District of Columbia 0 0 0 0 2,503 2,503Florida 8,018 205 10,642 18,865 41,524 60,388Georgia 8,468 196 4,067 12,731 26,567 39,298Hawaii 441 0 275 716 2,946 3,662Idaho 3,405 327 3,382 7,114 8,169 15,283Illinois 10,070 565 7,080 17,715 47,027 64,742Indiana 9,756 193 4,977 14,926 27,054 41,980Iowa 4,036 41 1,424 5,502 7,872 13,373Kansas 2,580 9 1,660 4,249 6,577 10,826Kentucky 18,261 2,540 7,033 26,834 36,531 63,366Louisiana 3,998 151 2,372 6,521 16,386 22,907Maine 1,112 11 310 1,433 3,551 4,984Maryland 4,042 513 1,884 6,439 19,176 25,615Massachusetts 1,458 40 743 2,240 10,195 12,435Michigan 5,461 165 8,381 14,006 36,233 50,239Minnesota 9,740 605 11,767 22,112 41,376 63,488Mississippi 1,519 0 769 2,288 6,945 9,233Missouri 7,893 254 1,888 10,035 21,838 31,873Montana 5,440 209 2,900 8,549 12,489 21,038Nebraska 1,394 18 594 2,006 5,015 7,020Nevada 15,898 2,073 7,091 25,062 30,186 55,248New Hampshire 757 45 875 1,677 3,535 5,212New Jersey 1,513 97 1,312 2,922 16,608 19,531New Mexico 6,008 231 4,430 10,669 12,682 23,351New York 4,877 51 7,023 11,951 36,953 48,903North Carolina 5,655 38 1,936 7,629 23,280 30,909North Dakota 2,612 207 1,297 4,115 5,665 9,781Ohio 10,721 977 6,015 17,713 41,958 59,671Oklahoma 3,425 104 2,459 5,988 10,866 16,854Oregon 2,524 117 2,707 5,348 11,902 17,249Pennsylvania 22,538 944 16,747 40,228 82,594 122,822Rhode Island 291 11 179 481 2,099 2,580South Carolina 2,678 10 2,220 4,908 13,205 18,113South Dakota 1,374 37 590 2,001 3,213 5,214Tennessee 6,482 274 1,844 8,600 19,350 27,950Texas 22,363 508 12,279 35,151 86,997 122,147Utah 10,243 916 4,530 15,690 27,333 43,022Vermont 1,171 39 589 1,800 2,091 3,891Virginia 10,225 522 6,820 17,566 35,535 53,101Washington 3,441 116 1,450 5,008 13,837 18,845West Virginia 24,628 986 6,317 31,930 31,505 63,435Wisconsin 5,356 214 3,507 9,077 14,952 24,029Wyoming 12,850 456 11,021 24,327 21,329 45,656Total Operations 339,906 15,462 210,180 565,548 1,122,816 1,688,364

5
Table 3. U.S. Mining Labor Income by State, 2015 (millions of dollars)State Direct Contribution to
Labor Income Indirect and Induced Total Contribution
Alabama 1,108 1,023 2,130Alaska 287 260 547Arizona 1,508 2,010 3,518Arkansas 289 385 674California 1,294 6,060 7,353Colorado 1,378 1,672 3,051Connecticut 85 512 598Delaware 4 133 137District of Columbia 0 262 262Florida 758 2,631 3,388Georgia 894 1,371 2,265Hawaii 47 191 238Idaho 331 298 629Illinois 1,408 3,059 4,467Indiana 1,165 1,336 2,501Iowa 309 331 640Kansas 187 316 502Kentucky 2,022 1,633 3,655Louisiana 513 889 1,402Maine 40 158 198Maryland 435 1,312 1,747Massachusetts 139 910 1,049Michigan 1,241 2,434 3,675Minnesota 989 1,491 2,480Mississippi 130 345 475Missouri 665 1,033 1,697Montana 746 556 1,302Nebraska 130 269 399Nevada 2,454 1,705 4,159New Hampshire 84 234 318New Jersey 215 2,048 2,263New Mexico 743 564 1,307New York 642 2,731 3,374North Carolina 379 1,314 1,694North Dakota 388 297 685Ohio 1,313 2,223 3,536Oklahoma 318 555 873Oregon 324 713 1,037Pennsylvania 2,726 4,134 6,859Rhode Island 31 129 160South Carolina 284 640 924South Dakota 112 144 256Tennessee 484 926 1,411Texas 2,267 5,338 7,605Utah 1,142 1,291 2,432Vermont 85 86 171Virginia 1,599 1,970 3,568Washington 333 1,067 1,400West Virginia 2,848 1,367 4,214Wisconsin 564 672 1,236Wyoming 2,323 938 3,261Total Operations 39,758 63,966 103,724

6
Table 4. U.S. Mining Contribution to GDP by State, 2015 (millions of dollars)State Direct Contribution to
GDP Indirect and Induced Total Contribution
Alabama 2,597 2,156 4,753Alaska 1,281 604 1,884Arizona 11,963 4,626 16,589Arkansas 340 660 1,001California 3,202 10,336 13,538Colorado 4,099 3,571 7,671Connecticut 109 965 1,074Delaware 22 242 264District of Columbia 12 427 439Florida 1,481 3,894 5,375Georgia 1,103 3,019 4,123Hawaii 66 352 418Idaho 1,155 667 1,822Illinois 3,006 5,224 8,230Indiana 2,405 2,707 5,112Iowa 358 991 1,350Kansas 710 1,050 1,761Kentucky 3,603 2,774 6,377Louisiana 1,172 1,673 2,845Maine 43 275 318Maryland 630 1,494 2,124Massachusetts 263 1,825 2,088Michigan 2,931 3,436 6,367Minnesota 3,157 4,460 7,618Mississippi 197 708 905Missouri 674 1,994 2,668Montana 1,629 983 2,612Nebraska 189 549 738Nevada 9,417 3,323 12,739New Hampshire 113 384 497New Jersey 241 2,197 2,439New Mexico 1,821 1,216 3,037New York 1,317 5,714 7,032North Carolina 589 2,592 3,181North Dakota 802 613 1,414Ohio 2,792 4,087 6,879Oklahoma 903 1,193 2,097Oregon 588 1,458 2,046Pennsylvania 4,765 6,604 11,370Rhode Island 49 229 278South Carolina 701 1,001 1,702South Dakota 233 303 535Tennessee 525 1,884 2,408Texas 5,512 10,529 16,041Utah 3,011 2,309 5,320Vermont 117 215 332Virginia 3,125 3,504 6,629Washington 1,623 2,449 4,072West Virginia 5,679 2,574 8,253Wisconsin 1,745 1,946 3,691Wyoming 6,318 2,053 8,370Total Operations 100,382 120,042 220,423

7
U.S. COAL MINING BY STATE

8
Table 5. Coal Mining Employment by State, 2015
StateDirect Effects Indirect and
InducedTotal
ContributionMine Workers Support Activities Transportation Total DirectAlabama 4,322 65 2,197 6,583 11,015 17,598Alaska 120 8 40 168 696 864Arizona 531 15 167 713 4,844 5,557Arkansas 91 0 58 149 2,035 2,184California 93 0 12 105 18,600 18,705Colorado 2,398 129 1,196 3,723 9,255 12,977Connecticut 7 0 0 7 2,100 2,107Delaware 9 0 0 9 780 789District of Columbia 0 0 0 0 888 888Florida 471 16 0 487 11,775 12,262Georgia 76 0 0 76 3,753 3,829Hawaii 10 0 0 10 969 979Idaho 14 0 0 14 370 384Illinois 5,607 318 2,813 8,738 24,671 33,408Indiana 5,269 101 2,098 7,467 14,448 21,915Iowa 3 0 0 3 178 181Kansas 31 0 16 47 1,093 1,139Kentucky 14,524 1,229 4,075 19,828 26,077 45,905Louisiana 644 26 407 1,078 6,545 7,623Maine 0 0 0 0 1,160 1,160Maryland 2,008 251 126 2,385 8,443 10,827Massachusetts 2 0 0 2 1,222 1,224Michigan 40 0 40 80 10,213 10,293Minnesota 226 14 0 240 2,569 2,809Mississippi 368 0 307 675 3,471 4,146Missouri 279 12 148 439 3,965 4,405Montana 1,464 61 712 2,237 4,351 6,588Nebraska 0 0 0 0 1,339 1,339Nevada 19 0 0 19 2,128 2,147New Hampshire 8 0 0 8 888 896New Jersey 50 0 0 50 5,000 5,050New Mexico 1,263 46 604 1,914 3,479 5,393New York 22 0 0 22 9,026 9,048North Carolina 104 0 31 135 8,154 8,289North Dakota 1,620 125 657 2,402 3,557 5,959Ohio 4,393 392 1,421 6,206 17,645 23,851Oklahoma 233 7 123 363 2,645 3,008Oregon 58 0 0 58 2,390 2,448Pennsylvania 11,727 494 7,127 19,347 40,193 58,540Rhode Island 0 0 0 0 629 629South Carolina 55 0 0 55 4,048 4,103South Dakota 26 0 0 26 745 771Tennessee 646 29 69 744 3,945 4,689Texas 4,617 111 2,585 7,313 34,492 41,804Utah 2,538 228 1,076 3,842 8,909 12,751Vermont 2 0 0 2 64 66Virginia 5,316 274 2,543 8,133 16,626 24,758Washington 89 0 33 122 6,375 6,497West Virginia 22,750 908 4,848 28,505 27,667 56,172Wisconsin 25 2 0 27 828 855Wyoming 8,274 297 3,695 12,267 12,294 24,561Total Operations 102,442 5,155 39,223 146,820 388,552 535,372

9
Table 6. Coal Mining Labor Income by State, 2015 (millions of dollars)State Direct Contribution to
Labor Income Indirect and Induced Total Contribution
Alabama 578 507 1,086Alaska 11 50 61Arizona 100 278 379Arkansas 10 105 115California 7 2,000 2,007Colorado 321 548 869Connecticut 1 163 163Delaware 0 39 39District of Columbia 0 107 107Florida 24 1,000 1,024Georgia 7 234 242Hawaii 0 61 61Idaho 1 17 19Illinois 790 1,611 2,400Indiana 692 710 1,402Iowa 0 11 12Kansas 4 61 65Kentucky 1,584 1,175 2,760Louisiana 101 366 467Maine 0 44 44Maryland 170 574 744Massachusetts 0 361 361Michigan 8 653 661Minnesota 24 162 186Mississippi 48 168 216Missouri 71 221 292Montana 173 181 354Nebraska 0 80 80Nevada 2 159 161New Hampshire 0 56 56New Jersey 5 800 805New Mexico 184 165 349New York 2 731 733North Carolina 8 493 501North Dakota 242 183 426Ohio 532 950 1,482Oklahoma 30 150 180Oregon 0 139 139Pennsylvania 1,573 2,298 3,870Rhode Island 0 41 41South Carolina 3 218 222South Dakota 2 37 40Tennessee 44 229 273Texas 695 2,177 2,872Utah 315 420 735Vermont 0 3 3Virginia 921 976 1,898Washington 10 460 470West Virginia 2,637 1,178 3,815Wisconsin 2 47 50Wyoming 1,274 551 1,824
Total Operations 13,209 23,948 37,158

10
Table 7. Coal Mining Contribution to GDP by State, 2015 (millions of dollars)State Direct Contribution to
GDP Indirect and Induced Total Contribution
Alabama 1,218 1,045 2,262Alaska 23 90 113Arizona 300 525 825Arkansas 14 169 183California 9 2,885 2,893Colorado 860 1,070 1,930Connecticut 2 347 350Delaware 1 84 85District of Columbia 0 155 155Florida 33 1,134 1,167Georgia 20 652 672Hawaii 0 110 110Idaho 11 91 102Illinois 1,296 2,475 3,771Indiana 1,276 1,402 2,678Iowa 7 231 238Kansas 30 332 362Kentucky 2,528 1,851 4,379Louisiana 121 436 557Maine 0 75 75Maryland 221 664 885Massachusetts 1 575 576Michigan 6 578 584Minnesota 73 472 545Mississippi 76 340 415Missouri 105 461 566Montana 433 341 774Nebraska 0 134 134Nevada 2 184 186New Hampshire 0 95 95New Jersey 2 710 711New Mexico 405 290 695New York 5 1,690 1,696North Carolina 8 690 698North Dakota 525 349 873Ohio 889 1,493 2,382Oklahoma 74 289 363Oregon 0 312 312Pennsylvania 2,518 3,417 5,935Rhode Island 0 71 71South Carolina 3 251 254South Dakota 6 60 66Tennessee 68 506 574Texas 1,360 4,183 5,542Utah 611 715 1,326Vermont 2 41 43Virginia 1,499 1,606 3,105Washington 15 546 560West Virginia 5,206 2,253 7,459Wisconsin 23 401 425Wyoming 3,756 1,107 4,863Total Operations 25,640 39,981 65,621

11
U.S. METAL ORE MINING BY STATE

12
Table 8. Metal Ore Mining Employment by State, 2015
StateDirect Effects Indirect and
InducedTotal
ContributionMine Workers Support Activities Transportation Total DirectAlabama 46 0 39 85 1,012 1,097Alaska 2,567 118 762 3,447 2,658 6,105Arizona 13,474 356 1,934 15,764 28,882 44,646Arkansas 592 0 8 600 1,176 1,776California 1,357 21 763 2,142 14,302 16,443Colorado 2,609 141 3,074 5,824 8,666 14,491Connecticut 0 0 0 0 1,000 1,000Delaware 72 0 0 72 490 562District of Columbia 0 0 0 0 400 400Florida 214 0 642 856 7,740 8,596Georgia 0 0 0 0 2,500 2,500Hawaii 0 0 0 0 400 400Idaho 1,071 103 329 1,503 1,807 3,310Illinois 0 0 0 0 3,700 3,700Indiana 4 0 0 4 1,700 1,704Iowa 18 0 0 18 1,026 1,044Kansas 3 0 0 3 900 903Kentucky 0 0 0 0 1,100 1,100Louisiana 1,248 48 71 1,367 3,233 4,600Maine 0 0 0 0 350 350Maryland 0 0 0 0 1,600 1,600Massachusetts 0 0 0 0 2,000 2,000Michigan 1,900 59 5,717 7,675 13,836 21,511Minnesota 6,223 385 10,416 17,024 29,630 46,654Mississippi 0 0 0 0 700 700Missouri 1,061 33 77 1,172 5,018 6,189Montana 2,311 89 652 3,052 4,203 7,255Nebraska 0 0 0 0 600 600Nevada 13,298 1,733 3,543 18,575 20,470 39,044New Hampshire 0 0 0 0 400 400New Jersey 0 0 0 0 2,400 2,400New Mexico 1,919 72 297 2,288 2,883 5,171New York 98 0 9 107 5,782 5,889North Carolina 18 0 54 72 2,763 2,835North Dakota 0 0 0 0 280 280Ohio 0 0 0 0 3,000 3,000Oklahoma 0 0 0 0 1,000 1,000Oregon 39 2 5 46 353 400Pennsylvania 32 0 448 480 13,536 14,016Rhode Island 0 0 0 0 250 250South Carolina 195 0 347 542 2,145 2,687South Dakota 235 11 34 280 615 895Tennessee 1,463 59 142 1,664 4,767 6,430Texas 1,797 39 155 1,991 10,063 12,054Utah 3,550 318 410 4,278 7,971 12,249Vermont 0 0 0 0 200 200Virginia 306 14 153 473 4,354 4,826Washington 456 14 76 546 1,625 2,171West Virginia 11 0 147 158 312 469Wisconsin 0 0 0 0 1,700 1,700Wyoming 1 0 0 1 194 195Total Operations 58,188 3,616 30,305 92,109 227,688 319,797

13
Table 9. Metal Ore Mining Labor Income by State, 2015 (millions of dollars)State Direct Contribution to
Labor Income Indirect and Induced Total Contribution
Alabama 4 55 59Alaska 226 137 362Arizona 1,028 1,247 2,275Arkansas 46 60 105California 157 1,154 1,310Colorado 473 416 889Connecticut 0 77 77Delaware 0 39 39District of Columbia 0 42 42Florida 60 500 560Georgia 0 90 90Hawaii 0 40 40Idaho 48 33 81Illinois 6 283 289Indiana 0 99 99Iowa 0 4 4Kansas 0 29 29Kentucky 0 29 29Louisiana 177 189 367Maine 0 18 18Maryland 0 158 158Massachusetts 0 38 38Michigan 858 1,142 2,000Minnesota 620 813 1,433Mississippi 0 53 53Missouri 82 151 232Montana 363 216 579Nebraska 0 32 32Nevada 2,040 1,162 3,202New Hampshire 0 56 56New Jersey 0 600 600New Mexico 147 120 267New York 12 301 313North Carolina 5 187 192North Dakota 0 23 23Ohio 0 183 183Oklahoma 0 49 49Oregon 0 116 116Pennsylvania 8 227 235Rhode Island 0 17 17South Carolina 48 106 154South Dakota 18 24 42Tennessee 48 133 181Texas 162 689 851Utah 379 397 776Vermont 0 2 2Virginia 32 133 166Washington 108 253 361West Virginia 16 27 43Wisconsin 0 18 18Wyoming 0 12 12Total Operations 7,171 11,978 19,149
14
Table 10. Metal Ore Mining Contribution to GDP by State, 2015 (millions of dollars)State Direct Contribution to
GDP Indirect and Induced Total Contribution
Alabama 35 258 292Alaska 1,118 348 1,466Arizona 9,973 2,923 12,896Arkansas 65 130 195California 340 1,684 2,024Colorado 1,775 971 2,746Connecticut 0 177 177Delaware 10 46 56District of Columbia 0 80 80Florida 79 630 709Georgia 0 327 327Hawaii 0 56 56Idaho 497 148 645Illinois 16 514 529Indiana 0 217 217Iowa 2 116 118Kansas 0 101 101Kentucky 0 133 133Louisiana 448 289 737Maine 0 38 38Maryland 0 224 224Massachusetts 1 294 295Michigan 2,034 1,442 3,476Minnesota 2,599 2,882 5,480Mississippi 0 76 76Missouri 80 402 482Montana 797 331 1,128Nebraska 0 71 71Nevada 8,382 2,382 10,764New Hampshire 0 49 49New Jersey 0 363 363New Mexico 544 273 817New York 50 880 931North Carolina 6 354 360North Dakota 0 35 35Ohio 0 372 372Oklahoma 0 126 126Oregon 24 176 199Pennsylvania 12 455 466Rhode Island 0 36 36South Carolina 94 163 256South Dakota 37 47 85Tennessee 21 378 398Texas 168 730 695Utah 1,497 528 2,228Vermont 0 19 19Virginia 109 363 472Washington 332 401 734West Virginia 47 71 118Wisconsin 0 195 195Wyoming 0 28 28Total Operations 31,192 23,331 54,523

15
U.S. NON-METALLIC MINERALS MINING BY STATE

16
Table 11. Non-metallic Mineral Mining Employment by State, 2015
StateDirect Effects Indirect and
InducedTotal
ContributionMine Workers Support Activities Transportation Total DirectAlabama 5,658 87 2,515 8,259 10,091 18,351Alaska 653 28 199 880 2,110 2,991Arizona 3,668 94 2,242 6,005 9,458 15,462Arkansas 2,727 18 2,343 5,088 4,868 9,956California 9,662 117 10,392 20,171 43,810 63,982Colorado 3,554 193 6,116 9,863 12,796 22,659Connecticut 901 56 678 1,635 3,660 5,295Delaware 73 0 61 134 864 998District of Columbia 0 0 0 0 1,215 1,215Florida 7,333 189 10,000 17,522 22,009 39,531Georgia 8,392 196 4,067 12,655 20,314 32,969Hawaii 431 0 275 706 1,577 2,283Idaho 2,320 224 3,053 5,596 5,993 11,590Illinois 4,463 247 4,267 8,978 18,656 27,633Indiana 4,483 92 2,880 7,455 10,906 18,361Iowa 4,015 41 1,424 5,481 6,668 12,148Kansas 2,546 9 1,645 4,200 4,585 8,784Kentucky 3,737 311 2,958 7,007 9,354 16,360Louisiana 2,106 77 1,893 4,077 6,608 10,685Maine 1,112 11 310 1,433 2,041 3,474Maryland 2,034 262 1,758 4,055 9,133 13,188Massachusetts 1,456 40 743 2,238 6,973 9,211Michigan 3,521 106 2,624 6,251 12,184 18,435Minnesota 3,291 206 1,352 4,848 9,178 14,026Mississippi 1,151 0 462 1,613 2,774 4,387Missouri 6,553 209 1,662 8,424 12,855 21,279Montana 1,665 59 1,536 3,261 3,935 7,195Nebraska 1,394 18 594 2,006 3,076 5,081Nevada 2,581 339 3,548 6,468 7,589 14,057New Hampshire 749 45 875 1,669 2,247 3,916New Jersey 1,463 97 1,312 2,872 9,208 12,081New Mexico 2,826 113 3,528 6,467 6,319 12,786New York 4,757 51 7,014 11,822 22,145 33,967North Carolina 5,533 38 1,851 7,422 12,363 19,785North Dakota 992 82 639 1,713 1,828 3,542Ohio 6,328 585 4,595 11,507 21,313 32,820Oklahoma 3,192 97 2,336 5,625 7,221 12,846Oregon 2,427 114 2,702 5,243 9,158 14,402Pennsylvania 10,779 450 9,172 20,401 28,865 49,266Rhode Island 291 11 179 481 1,220 1,701South Carolina 2,428 10 1,873 4,312 7,012 11,324South Dakota 1,113 26 557 1,696 1,852 3,548Tennessee 4,373 186 1,633 6,192 10,638 16,830Texas 15,949 359 9,539 25,847 42,442 68,288Utah 4,155 370 3,044 7,569 10,453 18,022Vermont 1,169 39 589 1,798 1,827 3,625Virginia 4,603 234 4,124 8,961 14,556 23,517Washington 2,896 102 1,341 4,339 5,838 10,177West Virginia 1,867 78 1,322 3,267 3,527 6,794Wisconsin 5,331 213 3,507 9,050 12,424 21,475Wyoming 4,575 159 7,325 12,059 8,841 20,900Total Operations 179,276 6,691 140,653 326,619 506,576 833,196

17
Table 12. Non-metallic Mineral Mining Labor Income by State, 2015 (millions of dollars)State Direct Contribution to
Labor Income Indirect and Induced Total Contribution
Alabama 525 460 985Alaska 50 73 123Arizona 380 485 865Arkansas 234 221 454California 1,130 2,906 4,036Colorado 585 708 1,293Connecticut 85 273 357Delaware 4 55 59District of Columbia 0 113 113Florida 673 1,131 1,804Georgia 887 1,046 1,933Hawaii 47 90 137Idaho 282 247 529Illinois 612 1,166 1,778Indiana 473 527 1,000Iowa 309 316 625Kansas 182 226 408Kentucky 437 429 866Louisiana 235 334 568Maine 40 96 136Maryland 265 580 844Massachusetts 139 511 650Michigan 375 638 1,013Minnesota 345 517 862Mississippi 82 124 206Missouri 512 661 1,173Montana 210 159 369Nebraska 130 157 287Nevada 412 384 796New Hampshire 84 122 206New Jersey 210 648 858New Mexico 411 280 691New York 629 1,699 2,328North Carolina 366 635 1,000North Dakota 146 91 236Ohio 780 1,091 1,871Oklahoma 288 356 644Oregon 324 458 782Pennsylvania 1,145 1,609 2,754Rhode Island 31 71 102South Carolina 233 315 548South Dakota 92 83 175Tennessee 393 564 956Texas 1,411 2,472 3,883Utah 447 474 921Vermont 85 82 166Virginia 645 860 1,505Washington 214 355 569West Virginia 194 162 356Wisconsin 562 607 1,168Wyoming 1,050 375 1,425
Total Operations 19,377 28,040 47,418

18
Table 13. Non-metallic Mineral Mining Contribution to GDP by State, 2015 (millions of dollars)State Direct Contribution to
GDP Indirect and Induced Total Contribution
Alabama 1,344 854 2,198Alaska 140 166 305Arizona 1,691 1,178 2,868Arkansas 261 361 623California 2,853 5,768 8,621Colorado 1,464 1,531 2,995Connecticut 107 441 548Delaware 12 111 122District of Columbia 12 192 204Florida 1,369 2,130 3,499Georgia 1,083 2,041 3,124Hawaii 66 186 252Idaho 647 428 1,075Illinois 1,694 2,235 3,929Indiana 1,129 1,088 2,217Iowa 349 644 993Kansas 681 617 1,298Kentucky 1,075 790 1,865Louisiana 603 947 1,551Maine 43 162 205Maryland 409 606 1,015Massachusetts 261 956 1,217Michigan 891 1,417 2,307Minnesota 486 1,107 1,592Mississippi 121 293 414Missouri 490 1,130 1,620Montana 399 311 710Nebraska 189 344 533Nevada 1,032 757 1,789New Hampshire 113 240 353New Jersey 239 1,125 1,364New Mexico 871 653 1,524New York 1,262 3,144 4,405North Carolina 575 1,548 2,123North Dakota 277 229 506Ohio 1,903 2,221 4,124Oklahoma 830 778 1,608Oregon 565 970 1,535Pennsylvania 2,235 2,733 4,968Rhode Island 49 122 171South Carolina 604 588 1,192South Dakota 189 196 385Tennessee 436 1,000 1,436Texas 3,984 5,819 9,803Utah 902 863 1,765Vermont 114 155 269Virginia 1,516 1,536 3,051Washington 1,276 1,502 2,778West Virginia 426 251 676Wisconsin 1,722 1,349 3,071Wyoming 2,562 918 3,480Total Operations 43,550 56,729 100,279

19
Details Regarding Methodology and Data
To evaluate the overall economic contribution of U.S. mining in 2015, we followed two general steps: first, derive the direct impacts of mining using MSHA preliminary 2015 data; and second, apply the IMPLAN model’s multipliers to capture a more complete estimate of the overall impact.
Derivation on Direct Impacts
As described in the report, the IMPLAN model produces economic multipliers to calculate the overall economic contribution of U.S. mining in terms of the direct, indirect and induced impacts. For U.S. mining, the codes in the IMPLAN model align with the NAICS codes presented in the report for the definition of the U.S. mining industry (see Appendix D).
The IMPLAN model relies on employment data from the U.S. Bureau of Economic Analysis (BEA). However, the Mine Safety and Health Administration (MSHA) also collects information on mining industry employment. We believe that the MSHA data more accurately reflect the true direct employment situation of the mining industry. We have applied IMPLAN multipliers to the MSHA data to derive indirect and induced impacts and rounded employment data to the nearest 10 employees.
The BEA classifies contractor activity closely related to mining, such as contract blasting and drilling, in the “Support Activities for Mining” sector (NAICS 213113, 213114, and 213115). These codes also include some activity completed by the mine operator on a fee or contract basis. More generalized services that could be offered to a variety of industries are classified in the industry code associated with the activity, such as Construction (NAICS 23). The IMPLAN model does not break the Support Activities for Mining sector into the coal, metal and non-metallic minerals segments. We allocated the overall activity to the sectors based on national estimates from MSHA and the direct employment of mine workers in each sector.
Data on the contribution to GDP and labor income by state are derived from the IMPLAN model 2012 multipliers applied to fourth quarter 2015 MSHA data.
Adjustments to IMPLAN Model
Economic multipliers are designed to measure the overall change in production that would result from a marginal increase in a particular industry. For example, an output multiplier converts a $1 million increase in output of the mining sector into the total change in output throughout the supply chain. Because some suppliers of U.S. mining might rely on mining for inputs, a marginal change in the mining sector could lead to an additional change in mining activity attributable to the goods it provides its suppliers throughout the economy. This impact is appropriate to include when modeling a marginal change, but when evaluating the overall impact of the industry, these indirect, own-industry impacts should be excluded to prevent double-counting. Therefore, we have adjusted the IMPLAN model results to exclude any indirect or induced effects taking place in the mining industry.
I-O models capture the upstream relationships, but certain downstream impacts are not reflected in the economic multipli-ers. Some of these effects, such as the transportation of mine output to the purchaser, could be attributable to U.S. mining. To capture the economic activity associated with the transportation of mining output, we have relied on sector-specific transportation margins in the IMPLAN model. Based on these margins, we have estimated the direct, indirect, and induced economic activity associated with this activity at a state level.

20
Because IMPLAN state models capture only the indirect and induced effects within each state, the indirect and induced effects crossing state borders (“cross-state spillover effects”) are not captured by the IMPLAN state models. As such, the state-level indirect and induced impacts calculated by the IMPLAN state models must be adjusted to add up to the overall impact captured by the national model, which includes the cross-state effects. We therefore allocated the cross-state indirect and induced employment, labor income, and contribution to GDP effects across the 50 states and the District of Columbia in proportion to each state’s share of the total national employment, labor income, and contribution to GDP by industry. The state level indirect and induced effects reported throughout this study include such allocations of cross-state spillover effects.

21
Appendix A. NAICS Definition of U.S. MiningMining Division Detail NAICS Code Description
Coal Bituminous Coal and Lignite Surface MiningBituminous Coal Underground MiningAnthracite Mining
212111212112212113
This segment includes establishments engaged in: (1) mining bituminous coal, anthracite, and lignite by underground mining, auger mining, strip mining, culm bank mining, and other surface mining; (2) developing coal mine sites; and (3) beneficiating (i.e., preparing) coal.
Metal Ore Mining Iron Ore MiningGoal Ore MiningSilver Ore MiningLead Ore and Zinc Ore MiningCopper Ore and Nickel Ore MiningUranium-Radium-Vanadium Ore MiningAll Other Metal Ore Mining
212210212221212222212231212234212291212299
This segment includes establishments primarily engaged in developing mine sites or mining metallic minerals, and establishments primarily engaged in ore dressing and beneficiating operations, such as crushing, grinding, washing, etc. Beneficiating may be performed at mills operated in conjunction with the mines served or at mills operated separately.
Non-metalic Mineral Mining and Quarrying
Dimension Stone Mining/QuarryingCrushed/Broken Limestone Mining/QuarryingCrushed/Broken Granite Mining/QuarryingOther Crushed, Broken Stone Mining/QuarryConstruction Sand and Gravel MiningIndustrial Sand MiningKaolin and Ball Clay MiningClay, Ceramic, Refractory Minerals MiningPotash, Soda, and Borate Mineral MiningPhosphate Rock MiningOther Chemical and Fertilizer Mineral MiningAll Other Non-metallic Mineral Mining
212311212312212313212319212321212321212324212325212392212392212393212399
This segment includes establishments primarily engaged in developing mine sites, or in mining or quarrying non-metallic minerals (except fuels). Also included are certain well and brine operations, and preparation plants primarily engaged in beneficiating non-metallic minerals.
Support Activities for Coal, Metal, and Non-metallic Mining
Support Activities for Coal MiningSupport Activities for Metal MiningSupport Activities for Non-metallic Minerals Mining
213113213114213115
This segment includes establishments primarily engaged in providing support activities for coal, metal, and non-metallic mining (except site preparation and related construction activities) on a contract or fee basis. Exploration for coal is included in this industry. Contract activities can be performed in-house by mining operators.
Source: Census Bureau, North American Industry Classification System (NAICS)
22
Appendix B. The IMPLAN Model
IMPLAN is a well-known modeling system developed by the Minnesota IMPLAN Group for estimating economic impacts and is similar to the Regional Input-Output Modeling System developed by the U.S. Department of Commerce. The model is primarily based on government data sources. It can address a wide range of impact topics in a given region (county, state) or the country as a whole.
IMPLAN is built around an “input-output” table that relates the purchases that each industry has made from other industries to the value of the output of each industry. To meet the demand for goods and services from an industry, purchases are made in other industries according to the patterns recorded in the input-output table. These purchases in turn spark still more purchases by the industry’s suppliers, and so on. Meanwhile, employees and business owners make personal purchases out of the additional income that is generated by this process, further increasing demand that ripples through the economy. Multipliers describe these iterations. The Type I multiplier measures the direct and indirect effects of a change in economic activity. It captures the inter-industry effects only, i.e., industries buying from local industries. The SAM (Social Accounting Matrix) multiplier captures the direct and indirect effects. In addition, it also reflects induced effects (i.e. changes in spending from households as income increases or decreases due to the changes in production).

National Mining Association 101 Constitution Avenue, NW
Suite 500 EastWashington, D.C. 20001
(202) 463-2600 | www.nma.org