the economic contributions of u.s. mining (2017 update) · 2 data derived from implan model...
TRANSCRIPT

The Economic Contributions of U.S. Mining (2017 Update)
September 2018
A report prepared by the National Mining Association


TABLE OF CONTENTS
Executive Summary ........................................................................................E-1National Results .............................................................................................E-1Contribution by Mining Segment ........................................................................1Tax Payments of U.S. Mining .............................................................................1Methodology .......................................................................................................2Mining and the U.S. Economy by State ..............................................................3U.S. Coal mining by State ..................................................................................7U.S. Metal Ore Mining by State ........................................................................11U.S. Non-metallic Minerals Mining by State ....................................................15Details Regarding IMPLAN Methodology and Data Derivation on Direct Impacts ..................................................................19 Adjustments to IMPLAN Model ..............................................................19Appendix A. NAICS Definition of U.S. Mining ...................................................20Appendix B. The IMPLAN Model ......................................................................21

E-1
EXECUTIVE SUMMARYMore than 13,000 operations mine for coal, metal ores and non-metallic minerals in the United States, according to the Mine Safety and Health Administration. These mines provide the energy resources and raw materials that are essential to a growing economy.
National Results
U.S. mining directly and indirectly generated more than 1.5 million full-time and part-time jobs in 2017, including employees and the self-employed.
• U.S. mines accounted for 523,000 jobs.• Jobs in other industries attributable to or induced by U.S. mining totaled more than 1 million.
U.S. labor income associated with U.S. mining exceeded $95 billion in 2017, which includes wages andsalaries, other employee benefits and owner-operator business (proprietors’) income.
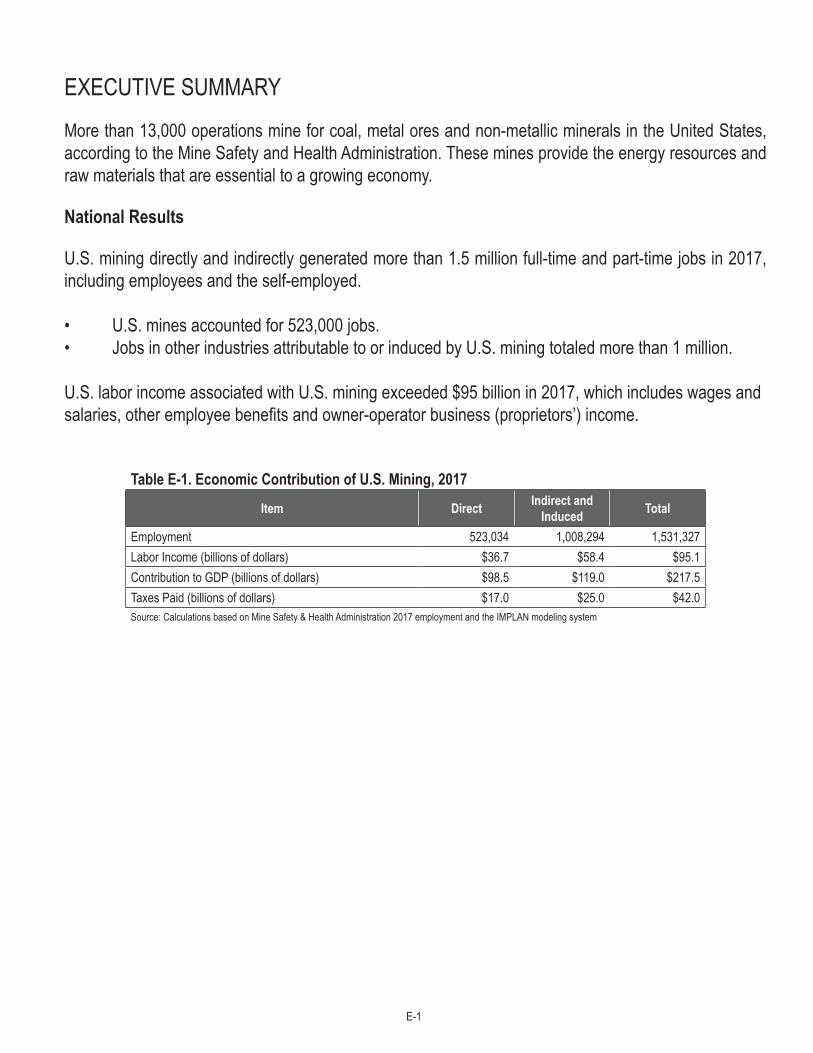
Table E-1. Economic Contribution of U.S. Mining, 2017
Item Direct Indirect and Induced Total
Employment 523,034 1,008,294 1,531,327Labor Income (billions of dollars) $36.7 $58.4 $95.1Contribution to GDP (billions of dollars) $98.5 $119.0 $217.5Taxes Paid (billions of dollars) $17.0 $25.0 $42.0Source: Calculations based on Mine Safety & Health Administration 2017 employment and the IMPLAN modeling system

1
Contribution by Mining Segment
The direct contributions or value added by each of the three mining sectors identified in this report include the operationsof the mine, support activities and transportation of output from the mine.
The coal sector of U.S. mining accounted for 419,531 total jobs, $29.6 billion in total labor income and $57.6 billion in total contribution to GDP (see Table 1). Annual wages and salaries in coal mining operations (excluding support activities and transportation) averaged approximately $86,300 in 2017.1 Overall, the total jobs attributed to coal mining were responsible for approximately 27 percent of U.S. mining’s total employment contribution, 31 percent of total labor income and 26 percent of mining’s total contribution to GDP.2
The metal ore mining segment of U.S. mining accounted for 286,524 jobs, $18.4 billion in labor compensation and $50.7 billion of GDP. Annual wages and salaries in the metal ore mining sector averaged $91,200. Metal ore mining accounted for 19 percent of total mining employment, 19 percent of labor income and 23 percent of mining’s contribution to GDP.
The non-metallic mineral mining segment of U.S. mining accounted for 825,273 jobs, $47.0 billion in labor compensation and $109.2 billion of U.S. GDP. Annual wages and salaries in the non-metallic mining sector averaged $64,600. Non-metallic mineral mining represented 54 percent of mining employment, 49 percent of labor income and 50 percent of its contribution to GDP.3
Table 1. Economic Contribution of U.S. Mining Operations by Segment
Sector Coal Mining Metal Ore Mining Non-metallic Mineral Mining Total
EmploymentDirect 118,901 81,487 322,646 523,034Indirect & Induced 300,629 205,037 502,628 1,008,294Total 419,531 286,524 825,273 1,531,328Labor Income ($billions)Direct $10.8 $6.9 $19.1 $36.7Indirect & Induced $18.9 $11.6 $27.9 $58.4Total $29.6 $18.4 $47.0 $95.1Contribution to GDP ($billions)Direct $22.3 $29.2 $47.0 $98.5Indirect & Induced $35.3 $21.5 $62.2 $119.0Total $57.6 $50.7 $109.2 $217.5
Tax Payments of U.S. Mining
Economic activity attributable to U.S. mining is taxed at the federal, state and local levels. These taxes take a variety of forms, including income taxes on company profits and employee wages, property taxes on equipment and structures and excise taxes on output. Mining activity generated an estimated $17 billion in federal, state and local taxes in 2017 that supported direct, indirect and induced taxes of $42 billion.1 Average wage and salary data from Bureau of Labor Statistics, Quarterly Census Employment and Wages, 2017. Labor income as presented in Table 1 results reflects total employee compensation (including benefits) and self-employment income for mining, support activities, and transportation attributable to mining output.2 Data derived from IMPLAN model multipliers. IMPLAN data is based on U.S. Bureau of Economic Analysis data.3 The transport of mining products, included in the figures above, represents a significant portion of these impacts. Transportation of mining output, for instance, is responsible for 197,111 direct transportation jobs and also contributes to labor income and GDP. These amounts have been distributed to coal, metal ore, and non-metallic mineral mining in Table 1.
2
Methodology
The economic contributions of U.S. mining to the domestic economy include its direct impact plus the economic activity of other industries that supply the mining industry. To quantify these linkages, we rely on the IMPLAN model, an input-output (I-O) model based on federal government data.
• Direct contributions: effects directly attributable to mining, such as the employment and output of mining companies. These effects include the transportation of mine output from the mine to the purchaser.
• Indirect contributions: effects of upstream suppliers to mining, including contractors and other companies providing inputs to mining companies, e.g. equipment manufacturers. Indirect effects also include the activity of suppliers to these companies.
• Induced contributions: spending by mining and supplier employees. Employees throughout the supply chain receive income associated with the direct and indirect activities, a portion of which is consumed. This consumption causes additional economic activity attributable to U.S. mining.
We have made adjustments to the output of the IMPLAN model to provide a more complete and accurate description of the overall contribution of U.S. mining.
See Appendix A for a more detailed description of our methodology.
This analysis can be considered conservative in that it does not include the economic or employee benefits from coal and uranium-based generation, or the manufacturing and other end-users of metal and non-metal minerals. According to the Edison Electric Institute, U.S. electricity generation directly and indirectly supported employment of more than 2.7 million people and added $880 billion to the U.S. economy; coal and uranium are responsible for 50 percent of total electricity generation. The U.S. Geological Survey estimates that mineral commodities were transformed into $2.9 trillion worth of goods and services in 2017, an amount equal to 15 percent of the total U.S. GDP.

3
MINING AND THE U.S. ECONOMY BY STATE
4
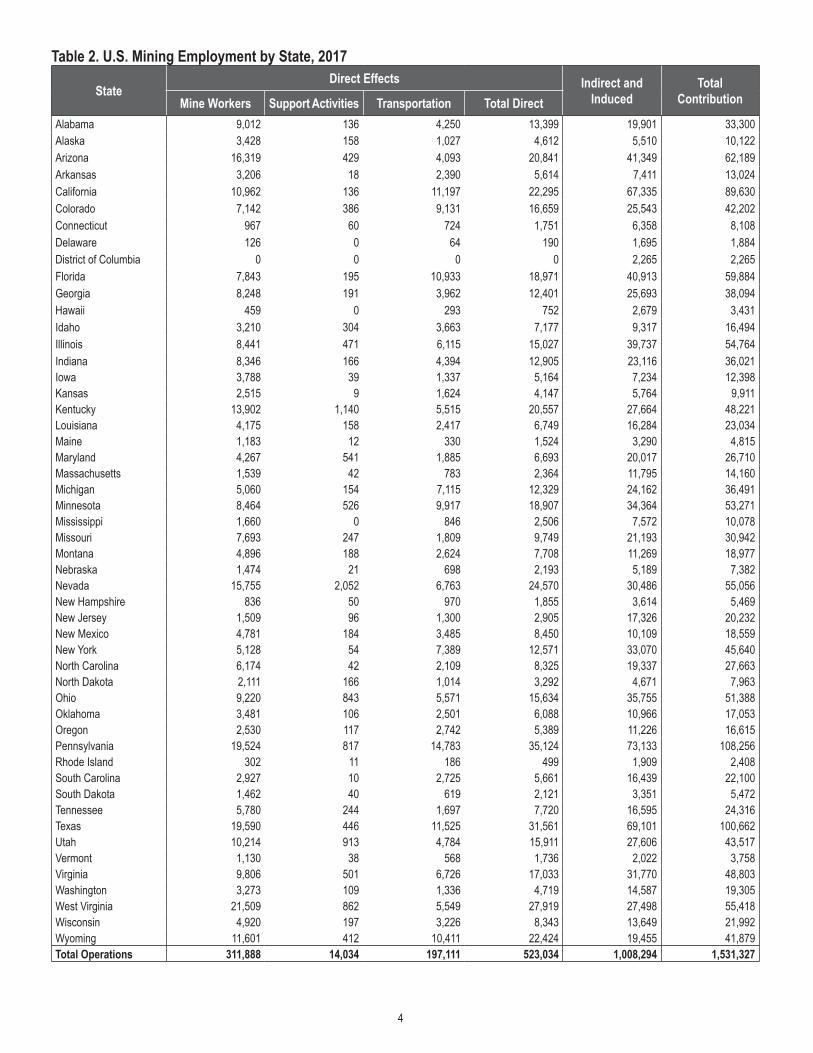
Table 2. U.S. Mining Employment by State, 2017
StateDirect Effects Indirect and
InducedTotal
ContributionMine Workers Support Activities Transportation Total DirectAlabama 9,012 136 4,250 13,399 19,901 33,300Alaska 3,428 158 1,027 4,612 5,510 10,122Arizona 16,319 429 4,093 20,841 41,349 62,189Arkansas 3,206 18 2,390 5,614 7,411 13,024California 10,962 136 11,197 22,295 67,335 89,630Colorado 7,142 386 9,131 16,659 25,543 42,202Connecticut 967 60 724 1,751 6,358 8,108Delaware 126 0 64 190 1,695 1,884District of Columbia 0 0 0 0 2,265 2,265Florida 7,843 195 10,933 18,971 40,913 59,884Georgia 8,248 191 3,962 12,401 25,693 38,094Hawaii 459 0 293 752 2,679 3,431Idaho 3,210 304 3,663 7,177 9,317 16,494Illinois 8,441 471 6,115 15,027 39,737 54,764Indiana 8,346 166 4,394 12,905 23,116 36,021Iowa 3,788 39 1,337 5,164 7,234 12,398Kansas 2,515 9 1,624 4,147 5,764 9,911Kentucky 13,902 1,140 5,515 20,557 27,664 48,221Louisiana 4,175 158 2,417 6,749 16,284 23,034Maine 1,183 12 330 1,524 3,290 4,815Maryland 4,267 541 1,885 6,693 20,017 26,710Massachusetts 1,539 42 783 2,364 11,795 14,160Michigan 5,060 154 7,115 12,329 24,162 36,491Minnesota 8,464 526 9,917 18,907 34,364 53,271Mississippi 1,660 0 846 2,506 7,572 10,078Missouri 7,693 247 1,809 9,749 21,193 30,942Montana 4,896 188 2,624 7,708 11,269 18,977Nebraska 1,474 21 698 2,193 5,189 7,382Nevada 15,755 2,052 6,763 24,570 30,486 55,056New Hampshire 836 50 970 1,855 3,614 5,469New Jersey 1,509 96 1,300 2,905 17,326 20,232New Mexico 4,781 184 3,485 8,450 10,109 18,559New York 5,128 54 7,389 12,571 33,070 45,640North Carolina 6,174 42 2,109 8,325 19,337 27,663North Dakota 2,111 166 1,014 3,292 4,671 7,963Ohio 9,220 843 5,571 15,634 35,755 51,388Oklahoma 3,481 106 2,501 6,088 10,966 17,053Oregon 2,530 117 2,742 5,389 11,226 16,615Pennsylvania 19,524 817 14,783 35,124 73,133 108,256Rhode Island 302 11 186 499 1,909 2,408South Carolina 2,927 10 2,725 5,661 16,439 22,100South Dakota 1,462 40 619 2,121 3,351 5,472Tennessee 5,780 244 1,697 7,720 16,595 24,316Texas 19,590 446 11,525 31,561 69,101 100,662Utah 10,214 913 4,784 15,911 27,606 43,517Vermont 1,130 38 568 1,736 2,022 3,758Virginia 9,806 501 6,726 17,033 31,770 48,803Washington 3,273 109 1,336 4,719 14,587 19,305West Virginia 21,509 862 5,549 27,919 27,498 55,418Wisconsin 4,920 197 3,226 8,343 13,649 21,992Wyoming 11,601 412 10,411 22,424 19,455 41,879Total Operations 311,888 14,034 197,111 523,034 1,008,294 1,531,327
5
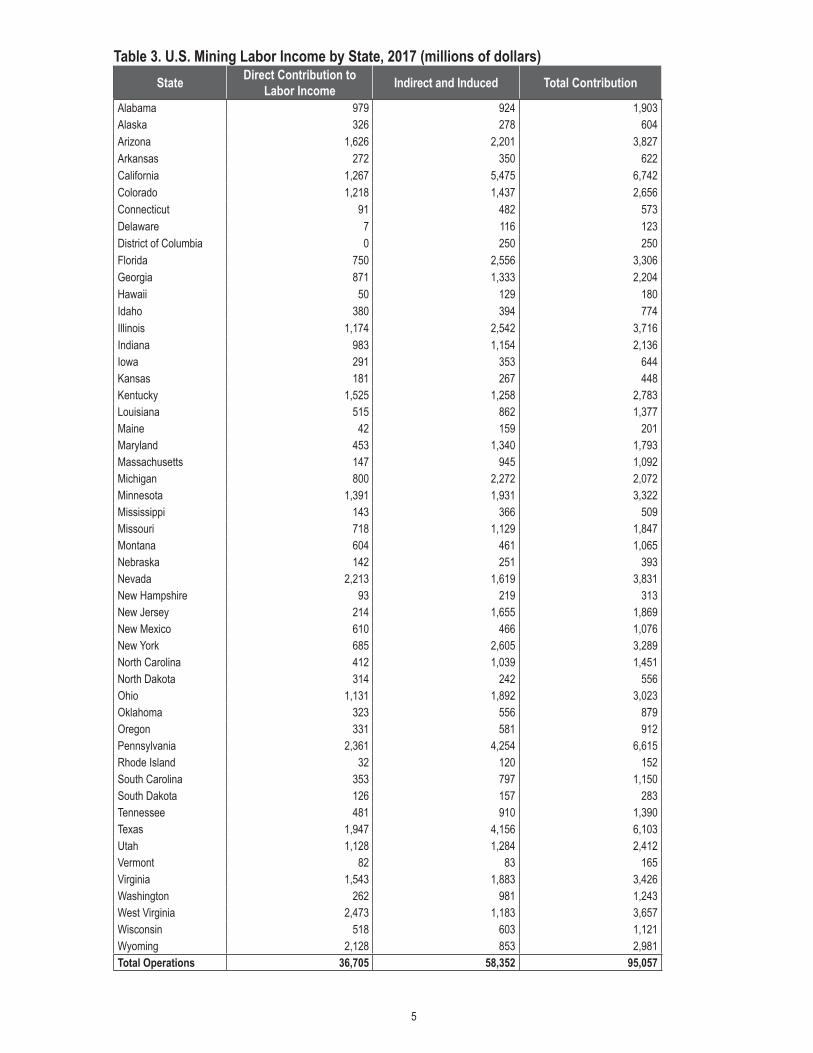
Table 3. U.S. Mining Labor Income by State, 2017 (millions of dollars)State Direct Contribution to
Labor Income Indirect and Induced Total Contribution
Alabama 979 924 1,903Alaska 326 278 604Arizona 1,626 2,201 3,827Arkansas 272 350 622California 1,267 5,475 6,742Colorado 1,218 1,437 2,656Connecticut 91 482 573Delaware 7 116 123District of Columbia 0 250 250Florida 750 2,556 3,306Georgia 871 1,333 2,204Hawaii 50 129 180Idaho 380 394 774Illinois 1,174 2,542 3,716Indiana 983 1,154 2,136Iowa 291 353 644Kansas 181 267 448Kentucky 1,525 1,258 2,783Louisiana 515 862 1,377Maine 42 159 201Maryland 453 1,340 1,793Massachusetts 147 945 1,092Michigan 800 2,272 2,072Minnesota 1,391 1,931 3,322Mississippi 143 366 509Missouri 718 1,129 1,847Montana 604 461 1,065Nebraska 142 251 393Nevada 2,213 1,619 3,831New Hampshire 93 219 313New Jersey 214 1,655 1,869New Mexico 610 466 1,076New York 685 2,605 3,289North Carolina 412 1,039 1,451North Dakota 314 242 556Ohio 1,131 1,892 3,023Oklahoma 323 556 879Oregon 331 581 912Pennsylvania 2,361 4,254 6,615Rhode Island 32 120 152South Carolina 353 797 1,150South Dakota 126 157 283Tennessee 481 910 1,390Texas 1,947 4,156 6,103Utah 1,128 1,284 2,412Vermont 82 83 165Virginia 1,543 1,883 3,426Washington 262 981 1,243West Virginia 2,473 1,183 3,657Wisconsin 518 603 1,121Wyoming 2,128 853 2,981Total Operations 36,705 58,352 95,057
6
Table 4. U.S. Mining Contribution to GDP by State, 2017 (millions of dollars)State Direct Contribution to
GDP Indirect and Induced Total Contribution
Alabama 2,324 1,962 4,287Alaska 1,301 607 1,908Arizona 11,087 4,318 15,405Arkansas 367 662 1,029California 3,643 10,400 14,043Colorado 3,779 3,350 7,129Connecticut 115 933 1,048Delaware 23 228 250District of Columbia 12 432 444Florida 1,573 3,770 5,343Georgia 1,254 3,284 4,537Hawaii 52 300 352Idaho 1,280 769 2,049Illinois 3,089 5,290 8,380Indiana 2,470 2,758 5,227Iowa 401 1,062 1,462Kansas 758 1,088 1,846Kentucky 2,869 2,231 5,099Louisiana 1,126 1,618 2,744Maine 46 279 326Maryland 639 1,466 2,105Massachusetts 295 1,925 2,220Michigan 2,416 2,989 5,405Minnesota 3,136 4,388 7,524Mississippi 196 686 882Missouri 729 2,072 2,801Montana 1,553 937 2,491Nebraska 202 569 771Nevada 9,773 3,453 13,226New Hampshire 127 408 535New Jersey 248 2,091 2,340New Mexico 1,460 954 2,415New York 1,499 5,588 7,087North Carolina 724 2,821 3,545North Dakota 745 561 1,306Ohio 2,657 3,867 6,524Oklahoma 1,027 1,265 2,292Oregon 696 1,635 2,332Pennsylvania 4,590 6,324 10,913Rhode Island 48 226 274South Carolina 738 1,034 1,773South Dakota 244 312 556Tennessee 535 1,845 2,380Texas 6,297 11,781 18,078Utah 2,744 2,155 4,899Vermont 124 211 335Virginia 3,036 3,393 6,429Washington 1,797 2,558 4,355West Virginia 5,045 2,302 7,347Wisconsin 1,862 1,960 3,822Wyoming 5,748 1,876 7,624Total Operations 98,501 118,992 217,493
7
U.S. COAL MINING BY STATE
8
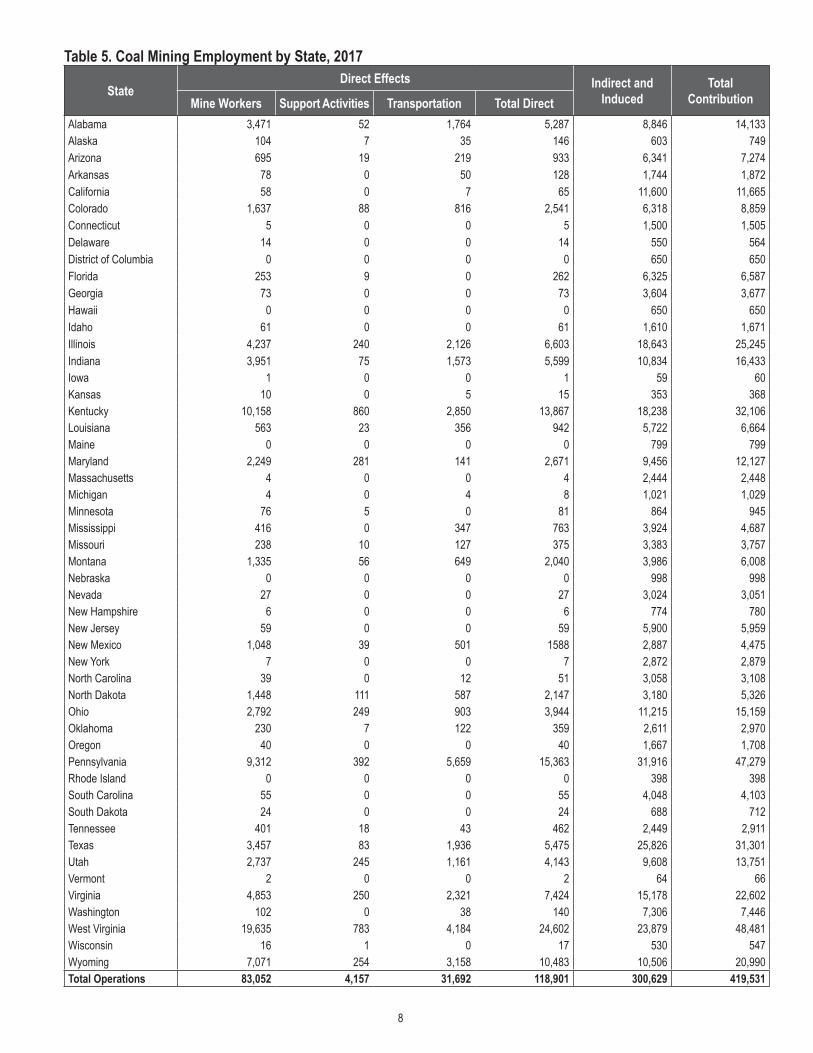
Table 5. Coal Mining Employment by State, 2017
StateDirect Effects Indirect and
InducedTotal
ContributionMine Workers Support Activities Transportation Total DirectAlabama 3,471 52 1,764 5,287 8,846 14,133Alaska 104 7 35 146 603 749Arizona 695 19 219 933 6,341 7,274Arkansas 78 0 50 128 1,744 1,872California 58 0 7 65 11,600 11,665Colorado 1,637 88 816 2,541 6,318 8,859Connecticut 5 0 0 5 1,500 1,505Delaware 14 0 0 14 550 564District of Columbia 0 0 0 0 650 650Florida 253 9 0 262 6,325 6,587Georgia 73 0 0 73 3,604 3,677Hawaii 0 0 0 0 650 650Idaho 61 0 0 61 1,610 1,671Illinois 4,237 240 2,126 6,603 18,643 25,245Indiana 3,951 75 1,573 5,599 10,834 16,433Iowa 1 0 0 1 59 60Kansas 10 0 5 15 353 368Kentucky 10,158 860 2,850 13,867 18,238 32,106Louisiana 563 23 356 942 5,722 6,664Maine 0 0 0 0 799 799Maryland 2,249 281 141 2,671 9,456 12,127Massachusetts 4 0 0 4 2,444 2,448Michigan 4 0 4 8 1,021 1,029Minnesota 76 5 0 81 864 945Mississippi 416 0 347 763 3,924 4,687Missouri 238 10 127 375 3,383 3,757Montana 1,335 56 649 2,040 3,986 6,008Nebraska 0 0 0 0 998 998Nevada 27 0 0 27 3,024 3,051New Hampshire 6 0 0 6 774 780New Jersey 59 0 0 59 5,900 5,959New Mexico 1,048 39 501 1588 2,887 4,475New York 7 0 0 7 2,872 2,879North Carolina 39 0 12 51 3,058 3,108North Dakota 1,448 111 587 2,147 3,180 5,326Ohio 2,792 249 903 3,944 11,215 15,159Oklahoma 230 7 122 359 2,611 2,970Oregon 40 0 0 40 1,667 1,708Pennsylvania 9,312 392 5,659 15,363 31,916 47,279Rhode Island 0 0 0 0 398 398South Carolina 55 0 0 55 4,048 4,103South Dakota 24 0 0 24 688 712Tennessee 401 18 43 462 2,449 2,911Texas 3,457 83 1,936 5,475 25,826 31,301Utah 2,737 245 1,161 4,143 9,608 13,751Vermont 2 0 0 2 64 66Virginia 4,853 250 2,321 7,424 15,178 22,602Washington 102 0 38 140 7,306 7,446West Virginia 19,635 783 4,184 24,602 23,879 48,481Wisconsin 16 1 0 17 530 547Wyoming 7,071 254 3,158 10,483 10,506 20,990Total Operations 83,052 4,157 31,692 118,901 300,629 419,531

9
Table 6. Coal Mining Labor Income by State, 2017 (millions of dollars)State Direct Contribution to
Labor Income Indirect and Induced Total Contribution
Alabama 464 407 872Alaska 10 43 53Arizona 131 364 495Arkansas 9 90 98California 4 1,698 1,703Colorado 219 374 593Connecticut 1 116 117Delaware 0 42 42District of Columbia 0 100 100Florida 13 724 737Georgia 7 225 232Hawaii 0 0 0Idaho 6 75 81Illinois 597 1,217 1,814Indiana 519 532 1,051Iowa 0 4 4Kansas 1 20 21Kentucky 1,108 822 1,930Louisiana 88 320 409Maine 0 40 40Maryland 190 643 834Massachusetts 0 371 371Michigan 1 65 66Minnesota 8 54 63Mississippi 54 190 244Missouri 60 189 249Montana 158 165 323Nebraska 0 50 50Nevada 3 226 228New Hampshire 0 48 48New Jersey 6 813 819New Mexico 153 137 290New York 1 233 233North Carolina 3 185 188North Dakota 217 164 380Ohio 338 603 942Oklahoma 30 148 178Oregon 0 100 100Pennsylvania 1,249 1,825 3,073Rhode Island 0 31 31South Carolina 3 218 222South Dakota 2 34 37Tennessee 27 142 170Texas 520 1,630 2,150Utah 340 453 793Vermont 0 3 3Virginia 841 891 1,732Washington 11 527 539West Virginia 2,276 1,017 3,293Wisconsin 2 30 32Wyoming 1,088 471 1,559
Total Operations 10,759 18,870 29,630

10
Table 7. Coal Mining Contribution to GDP by State, 2017 (millions of dollars)State Direct Contribution to
GDP Indirect and Induced Total Contribution
Alabama 878 753 1,631Alaska 20 77 97Arizona 232 407 639Arkansas 11 131 142California 6 2,097 2,103Colorado 688 856 1,544Connecticut 2 299 301Delaware 1 65 66District of Columbia 0 150 150Florida 26 879 905Georgia 20 647 667Hawaii 0 100 100Idaho 10 84 94Illinois 1,261 2,408 3,670Indiana 1,262 1,387 2,649Iowa 7 228 235Kansas 30 332 361Kentucky 1,787 1,309 3,096Louisiana 120 433 553Maine 0 70 70Maryland 201 604 805Massachusetts 1 570 571Michigan 5 475 480Minnesota 60 388 448Mississippi 68 305 373Missouri 86 379 465Montana 395 312 707Nebraska 0 133 133Nevada 2 180 182New Hampshire 0 90 90New Jersey 1 584 585New Mexico 333 238 571New York 4 1,389 1,394North Carolina 6 567 573North Dakota 525 345 870Ohio 800 1,344 2,144Oklahoma 61 238 298Oregon 0 310 310Pennsylvania 2,173 2,949 5,122Rhode Island 0 70 70South Carolina 3 250 253South Dakota 6 58 64Tennessee 59 440 499Texas 1,497 4,605 6,102Utah 546 639 1,186Vermont 2 34 36Virginia 1,310 1,403 2,714Washington 12 448 461West Virginia 4,545 1,966 6,511Wisconsin 19 330 349Wyoming 3,238 954 4,192Total Operations 22,320 35,311 57,632

11
U.S. METAL ORE MINING BY STATE
12
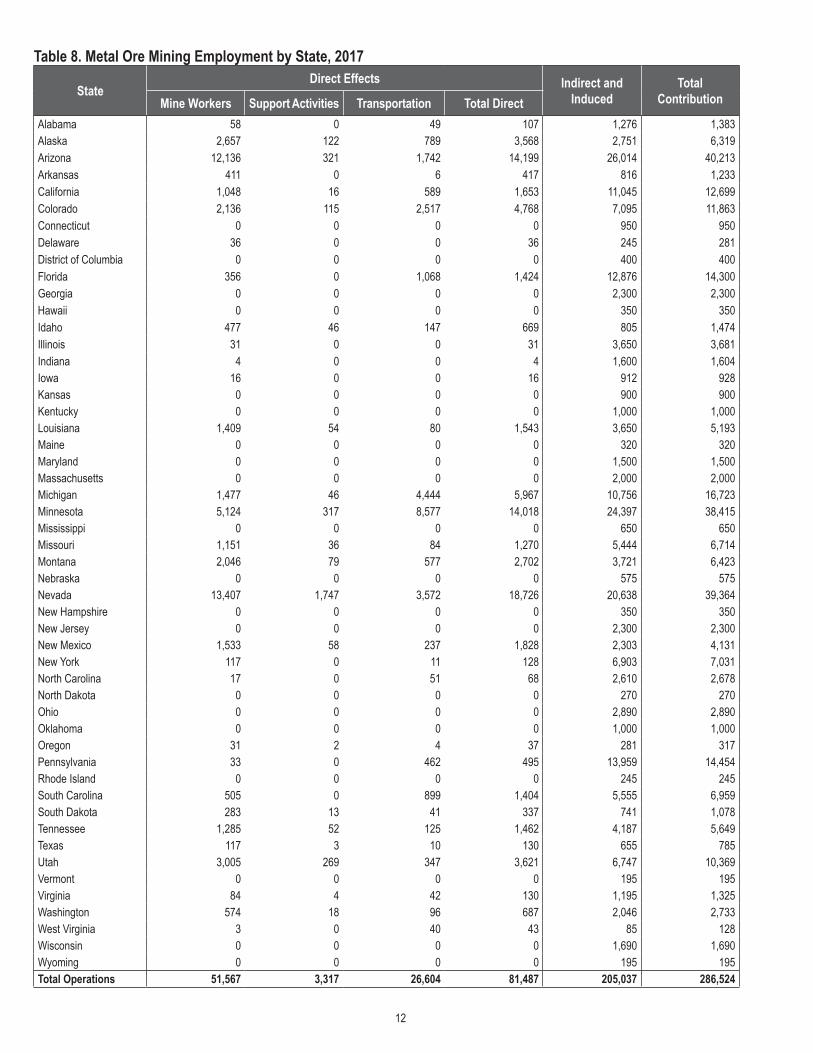
Table 8. Metal Ore Mining Employment by State, 2017
StateDirect Effects Indirect and
InducedTotal
ContributionMine Workers Support Activities Transportation Total DirectAlabama 58 0 49 107 1,276 1,383Alaska 2,657 122 789 3,568 2,751 6,319Arizona 12,136 321 1,742 14,199 26,014 40,213Arkansas 411 0 6 417 816 1,233California 1,048 16 589 1,653 11,045 12,699Colorado 2,136 115 2,517 4,768 7,095 11,863Connecticut 0 0 0 0 950 950Delaware 36 0 0 36 245 281District of Columbia 0 0 0 0 400 400Florida 356 0 1,068 1,424 12,876 14,300Georgia 0 0 0 0 2,300 2,300Hawaii 0 0 0 0 350 350Idaho 477 46 147 669 805 1,474Illinois 31 0 0 31 3,650 3,681Indiana 4 0 0 4 1,600 1,604Iowa 16 0 0 16 912 928Kansas 0 0 0 0 900 900Kentucky 0 0 0 0 1,000 1,000Louisiana 1,409 54 80 1,543 3,650 5,193Maine 0 0 0 0 320 320Maryland 0 0 0 0 1,500 1,500Massachusetts 0 0 0 0 2,000 2,000Michigan 1,477 46 4,444 5,967 10,756 16,723Minnesota 5,124 317 8,577 14,018 24,397 38,415Mississippi 0 0 0 0 650 650Missouri 1,151 36 84 1,270 5,444 6,714Montana 2,046 79 577 2,702 3,721 6,423Nebraska 0 0 0 0 575 575Nevada 13,407 1,747 3,572 18,726 20,638 39,364New Hampshire 0 0 0 0 350 350New Jersey 0 0 0 0 2,300 2,300New Mexico 1,533 58 237 1,828 2,303 4,131New York 117 0 11 128 6,903 7,031North Carolina 17 0 51 68 2,610 2,678North Dakota 0 0 0 0 270 270Ohio 0 0 0 0 2,890 2,890Oklahoma 0 0 0 0 1,000 1,000Oregon 31 2 4 37 281 317Pennsylvania 33 0 462 495 13,959 14,454Rhode Island 0 0 0 0 245 245South Carolina 505 0 899 1,404 5,555 6,959South Dakota 283 13 41 337 741 1,078Tennessee 1,285 52 125 1,462 4,187 5,649Texas 117 3 10 130 655 785Utah 3,005 269 347 3,621 6,747 10,369Vermont 0 0 0 0 195 195Virginia 84 4 42 130 1,195 1,325Washington 574 18 96 687 2,046 2,733West Virginia 3 0 40 43 85 128Wisconsin 0 0 0 0 1,690 1,690Wyoming 0 0 0 0 195 195Total Operations 51,567 3,317 26,604 81,487 205,037 286,524
13
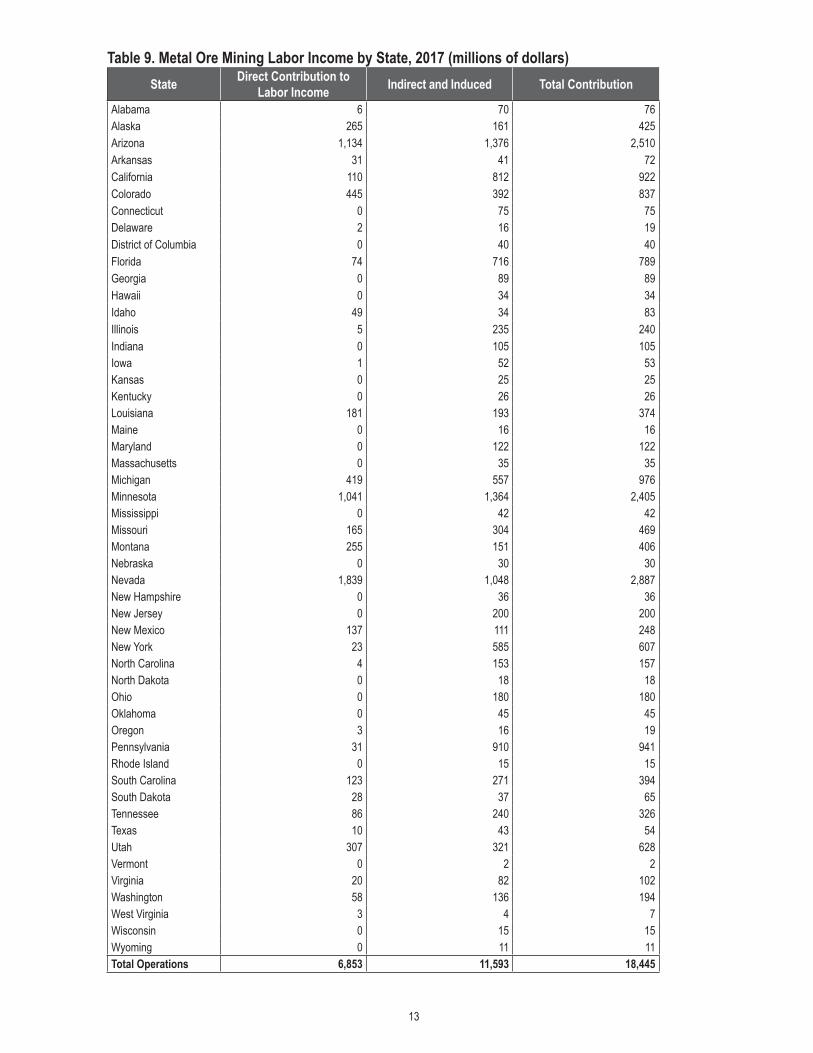
Table 9. Metal Ore Mining Labor Income by State, 2017 (millions of dollars)State Direct Contribution to
Labor Income Indirect and Induced Total Contribution
Alabama 6 70 76Alaska 265 161 425Arizona 1,134 1,376 2,510Arkansas 31 41 72California 110 812 922Colorado 445 392 837Connecticut 0 75 75Delaware 2 16 19District of Columbia 0 40 40Florida 74 716 789Georgia 0 89 89Hawaii 0 34 34Idaho 49 34 83Illinois 5 235 240Indiana 0 105 105Iowa 1 52 53Kansas 0 25 25Kentucky 0 26 26Louisiana 181 193 374Maine 0 16 16Maryland 0 122 122Massachusetts 0 35 35Michigan 419 557 976Minnesota 1,041 1,364 2,405Mississippi 0 42 42Missouri 165 304 469Montana 255 151 406Nebraska 0 30 30Nevada 1,839 1,048 2,887New Hampshire 0 36 36New Jersey 0 200 200New Mexico 137 111 248New York 23 585 607North Carolina 4 153 157North Dakota 0 18 18Ohio 0 180 180Oklahoma 0 45 45Oregon 3 16 19Pennsylvania 31 910 941Rhode Island 0 15 15South Carolina 123 271 394South Dakota 28 37 65Tennessee 86 240 326Texas 10 43 54Utah 307 321 628Vermont 0 2 2Virginia 20 82 102Washington 58 136 194West Virginia 3 4 7Wisconsin 0 15 15Wyoming 0 11 11Total Operations 6,853 11,593 18,445
14
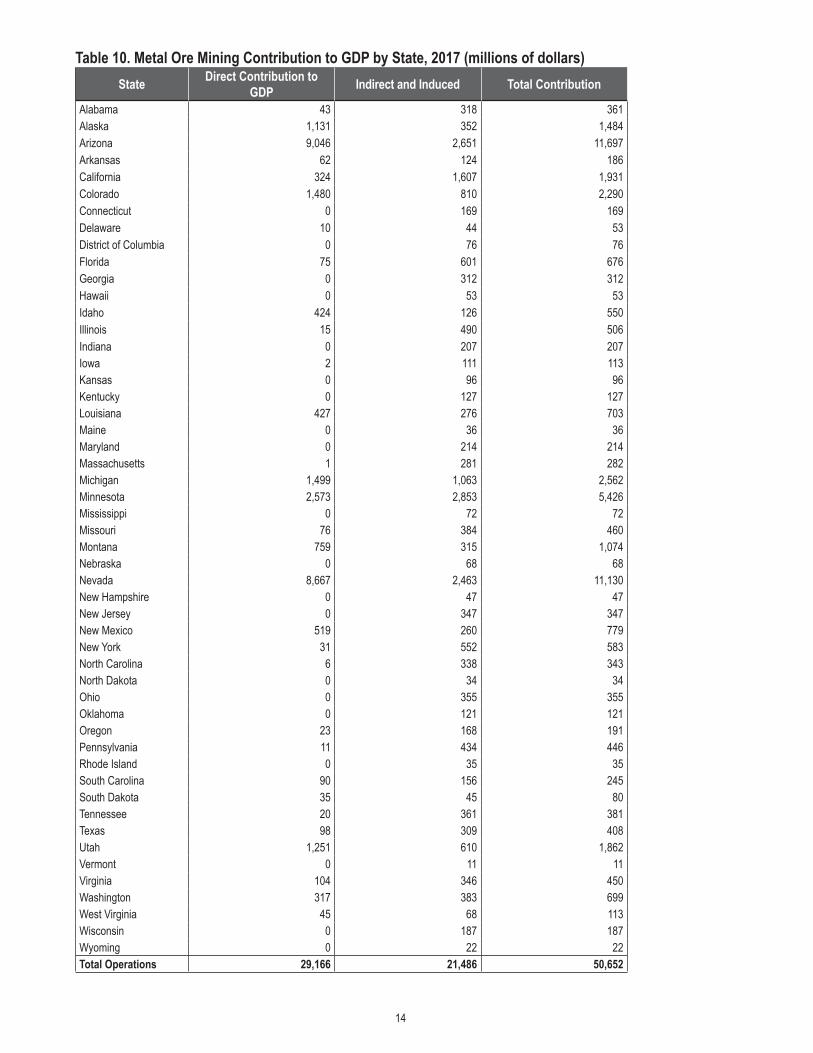
Table 10. Metal Ore Mining Contribution to GDP by State, 2017 (millions of dollars)State Direct Contribution to
GDP Indirect and Induced Total Contribution
Alabama 43 318 361Alaska 1,131 352 1,484Arizona 9,046 2,651 11,697Arkansas 62 124 186California 324 1,607 1,931Colorado 1,480 810 2,290Connecticut 0 169 169Delaware 10 44 53District of Columbia 0 76 76Florida 75 601 676Georgia 0 312 312Hawaii 0 53 53Idaho 424 126 550Illinois 15 490 506Indiana 0 207 207Iowa 2 111 113Kansas 0 96 96Kentucky 0 127 127Louisiana 427 276 703Maine 0 36 36Maryland 0 214 214Massachusetts 1 281 282Michigan 1,499 1,063 2,562Minnesota 2,573 2,853 5,426Mississippi 0 72 72Missouri 76 384 460Montana 759 315 1,074Nebraska 0 68 68Nevada 8,667 2,463 11,130New Hampshire 0 47 47New Jersey 0 347 347New Mexico 519 260 779New York 31 552 583North Carolina 6 338 343North Dakota 0 34 34Ohio 0 355 355Oklahoma 0 121 121Oregon 23 168 191Pennsylvania 11 434 446Rhode Island 0 35 35South Carolina 90 156 245South Dakota 35 45 80Tennessee 20 361 381Texas 98 309 408Utah 1,251 610 1,862Vermont 0 11 11Virginia 104 346 450Washington 317 383 699West Virginia 45 68 113Wisconsin 0 187 187Wyoming 0 22 22Total Operations 29,166 21,486 50,652
15
U.S. NON-METALLIC MINERALS MINING BY STATE

16
Table 11. Non-metallic Mineral Mining Employment by State, 2017
StateDirect Effects Indirect and
InducedTotal
ContributionMine Workers Support Activities Transportation Total DirectAlabama 5,483 84 2,437 8,005 9,779 17,783Alaska 667 29 203 899 2,155 3,054Arizona 3,488 89 2,132 5,709 8,994 14,703Arkansas 2,717 18 2,334 5,069 4,850 9,919California 9,856 119 10,601 20,576 44,690 65,266Colorado 3,369 183 5,798 9,350 12,130 21,480Connecticut 962 60 724 1,746 3,908 5,653Delaware 76 0 64 140 900 1,039District of Columbia 0 0 0 0 1,215 1,215Florida 7,234 186 9,865 17,285 21,712 38,997Georgia 8,175 191 3,962 12,328 19,789 32,116Hawaii 459 0 293 752 1,679 2,431Idaho 2,672 258 3,516 6,446 6,902 13,348Illinois 4,173 231 3,990 8,394 17,444 25,837Indiana 4,391 90 2,821 7,302 10,682 17,984Iowa 3,771 39 1,337 5,147 6,263 11,410Kansas 2,505 9 1,619 4,132 4,511 8,644Kentucky 3,744 281 2,665 6,690 8,426 15,116Louisiana 2,203 81 1,980 4,264 6,912 11,176Maine 1,183 12 330 1,524 2,171 3,696Maryland 2,018 260 1,744 4,022 9,061 13,083Massachusetts 1,535 42 783 2,360 7,351 9,712Michigan 3,579 108 2,667 6,354 12,385 18,739Minnesota 3,264 204 1,341 4,809 9,103 13,912Mississippi 1,244 0 499 1,743 2,998 4,741Missouri 6,304 201 1,599 8,104 12,367 20,470Montana 1,515 54 1,398 2,966 3,580 6,547Nebraska 1,474 21 698 2,193 3,616 5,809Nevada 2,321 305 3,191 5,816 6,825 12,641New Hampshire 830 50 970 1,849 2,490 4,339New Jersey 1,450 96 1,300 2,846 9,126 11,973New Mexico 2,200 88 2,746 5,034 4,919 9,954New York 5,004 54 7,374 12,436 23,295 35,731North Carolina 6,118 42 2,047 8,207 13,670 21,877North Dakota 663 55 427 1,145 1,222 2,367Ohio 6,428 594 4,668 11,690 21,650 33,340Oklahoma 3,251 99 2,379 5,729 7,354 13,083Oregon 2,459 116 2,738 5,312 9,279 14,591Pennsylvania 10,179 425 8,661 19,265 27,258 46,524Rhode Island 302 11 186 499 1,266 1,765South Carolina 2,367 10 1,826 4,203 6,836 11,039South Dakota 1,155 27 578 1,760 1,922 3,682Tennessee 4,094 174 1,529 5,797 9,959 15,756Texas 16,016 361 9,579 25,956 42,620 68,576Utah 4,472 398 3,276 8,146 11,250 19,397Vermont 1,128 38 568 1,734 1,763 3,497Virginia 4,869 248 4,362 9,479 15,397 24,876Washington 2,597 91 1,203 3,891 5,235 9,126West Virginia 1,871 78 1,325 3,274 3,535 6,809Wisconsin 4,904 196 3,226 8,326 11,429 19,755Wyoming 4,530 157 7,253 11,940 8,754 20,694Total Operations 177,269 6,561 138,815 322,646 502,628 825,273

17
Table 12. Non-metallic Mineral Mining Labor Income by State, 2017 (millions of dollars)State Direct Contribution to
Labor Income Indirect and Induced Total Contribution
Alabama 509 446 955Alaska 51 74 126Arizona 361 461 822Arkansas 233 220 452California 1,153 2,964 4,117Colorado 554 671 1,226Connecticut 90 291 382Delaware 4 58 62District of Columbia 0 110 110Florida 664 1,116 1,779Georgia 864 1,019 1,883Hawaii 50 95 146Idaho 325 285 609Illinois 572 1,090 1,662Indiana 464 516 980Iowa 290 297 587Kansas 180 222 402Kentucky 417 410 827Louisiana 246 349 594Maine 42 103 145Maryland 262 575 837Massachusetts 147 539 686Michigan 381 649 1,030Minnesota 342 512 855Mississippi 89 134 223Missouri 493 636 1,129Montana 191 145 336Nebraska 142 171 313Nevada 370 345 716New Hampshire 93 135 229New Jersey 209 642 851New Mexico 320 218 538New York 662 1,787 2,449North Carolina 405 702 1,106North Dakota 97 61 158Ohio 793 1,108 1,901Oklahoma 293 363 656Oregon 328 464 793Pennsylvania 1,081 1,520 2,601Rhode Island 32 74 106South Carolina 227 307 534South Dakota 96 86 182Tennessee 368 528 895Texas 1,417 2,482 3,899Utah 482 510 991Vermont 82 79 161Virginia 682 910 1,592Washington 192 318 510West Virginia 194 163 357Wisconsin 517 558 1,075Wyoming 1,039 371 1,411
Total Operations 19,093 27,890 46,983

18
Table 13. Non-metallic Mineral Mining Contribution to GDP by State, 2017 (millions of dollars)State Direct Contribution to
GDP Indirect and Induced Total Contribution
Alabama 1,404 892 2,295Alaska 150 177 327Arizona 1,809 1,260 3,069Arkansas 294 406 700California 3,312 6,696 10,008Colorado 1,611 1,684 3,295Connecticut 113 466 578Delaware 12 119 131District of Columbia 12 206 218Florida 1,472 2,290 3,762Georgia 1,234 2,324 3,558Hawaii 52 147 199Idaho 846 559 1,405Illinois 1,813 2,392 4,204Indiana 1,208 1,164 2,372Iowa 392 723 1,115Kansas 728 660 1,389Kentucky 1,081 795 1,877Louisiana 579 909 1,487Maine 46 173 220Maryland 438 648 1,086Massachusetts 293 1,074 1,367Michigan 912 1,451 2,363Minnesota 503 1,147 1,650Mississippi 128 309 436Missouri 567 1,309 1,876Montana 399 311 710Nebraska 202 368 570Nevada 1,104 810 1,914New Hampshire 127 271 398New Jersey 247 1,161 1,408New Mexico 608 456 1,064New York 1,463 3,647 5,110North Carolina 712 1,916 2,629North Dakota 220 182 402Ohio 1,857 2,168 4,025Oklahoma 966 907 1,873Oregon 674 1,158 1,831Pennsylvania 2,405 2,941 5,346Rhode Island 48 121 169South Carolina 646 629 1,275South Dakota 202 210 412Tennessee 455 1,045 1,500Texas 4,702 6,866 11,568Utah 946 906 1,852Vermont 122 166 288Virginia 1,622 1,643 3,265Washington 1,468 1,727 3,195West Virginia 455 268 724Wisconsin 1,843 1,443 3,286Wyoming 2,510 900 3,410Total Operations 47,014 62,195 109,209

19
Details Regarding Methodology and Data
To evaluate the overall economic contribution of U.S. mining in 2017, we followed two general steps: first, derive the direct impacts of mining using MSHA 2017 data; and second, apply the IMPLAN model’s multipliers to capture a more complete estimate of the overall impact.
Derivation on Direct Impacts
As described in the report, the IMPLAN model produces economic multipliers to calculate the overall economic contribution of U.S. mining in terms of the direct, indirect and induced impacts. For U.S. mining, the codes in the IMPLAN model align with the NAICS codes presented in the report for the definition of the U.S. mining industry (see Appendix D).
The IMPLAN model relies on employment data from the U.S. Bureau of Economic Analysis (BEA). However, the Mine Safety and Health Administration (MSHA) also collects information on mining industry employment. We believe that the MSHA data more accurately reflect the true direct employment situation of the mining industry. We have applied IMPLAN multipliers to the MSHA data to derive indirect and induced impacts and rounded employment data to the nearest 10 employees.
The BEA classifies contractor activity closely related to mining, such as contract blasting and drilling, in the “Support Activities for Mining” sector (NAICS 213113, 213114, and 213115). These codes also include some activity completed by the mine operator on a fee or contract basis. More generalized services that could be offered to a variety of industries are classified in the industry code associated with the activity, such as Construction (NAICS 23). The IMPLAN model does not break the Support Activities for Mining sector into the coal, metal and non-metallic minerals segments. We allocated the overall activity to the sectors based on national estimates from MSHA and the direct employment of mine workers in each sector.
Data on the contribution to GDP and labor income by state are derived from the IMPLAN model 2012 multipliers applied to 2017 MSHA and BLS data.
Adjustments to IMPLAN Model
Economic multipliers are designed to measure the overall change in production that would result from a marginal increase in a particular industry. For example, an output multiplier converts a $1 million increase in output of the mining sector into the total change in output throughout the supply chain. Because some suppliers of U.S. mining might rely on mining for inputs, a marginal change in the mining sector could lead to an additional change in mining activity attributable to the goods it provides its suppliers throughout the economy. This impact is appropriate to include when modeling a marginal change, but when evaluating the overall impact of the industry, these indirect, own-industry impacts should be excluded to prevent double-counting. Therefore, we have adjusted the IMPLAN model results to exclude any indirect or induced effects taking place in the mining industry.
I-O models capture the upstream relationships, but certain downstream impacts are not reflected in the economic multipli-ers. Some of these effects, such as the transportation of mine output to the purchaser, could be attributable to U.S. mining. To capture the economic activity associated with the transportation of mining output, we have relied on sector-specific transportation margins in the IMPLAN model. Based on these margins, we have estimated the direct, indirect, and induced economic activity associated with this activity at a state level.

20
Because IMPLAN state models capture only the indirect and induced effects within each state, the indirect and induced effects crossing state borders (“cross-state spillover effects”) are not captured by the IMPLAN state models. As such, the state-level indirect and induced impacts calculated by the IMPLAN state models must be adjusted to add up to the overall impact captured by the national model, which includes the cross-state effects. We therefore allocated the cross-state indirect and induced employment, labor income, and contribution to GDP effects across the 50 states and the District of Columbia in proportion to each state’s share of the total national employment, labor income, and contribution to GDP by industry. The state level indirect and induced effects reported throughout this study include such allocations of cross-state spillover effects.
21
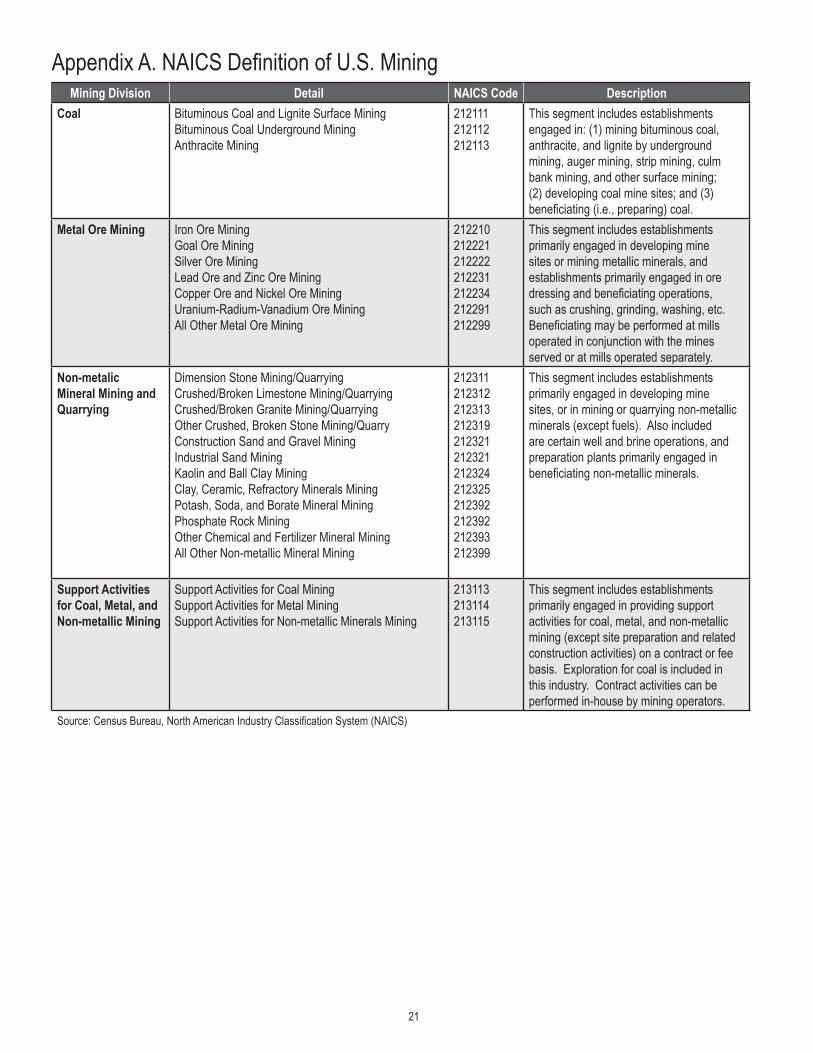
Appendix A. NAICS Definition of U.S. MiningMining Division Detail NAICS Code Description
Coal Bituminous Coal and Lignite Surface MiningBituminous Coal Underground MiningAnthracite Mining
212111212112212113
This segment includes establishments engaged in: (1) mining bituminous coal, anthracite, and lignite by underground mining, auger mining, strip mining, culm bank mining, and other surface mining; (2) developing coal mine sites; and (3) beneficiating (i.e., preparing) coal.
Metal Ore Mining Iron Ore MiningGoal Ore MiningSilver Ore MiningLead Ore and Zinc Ore MiningCopper Ore and Nickel Ore MiningUranium-Radium-Vanadium Ore MiningAll Other Metal Ore Mining
212210212221212222212231212234212291212299
This segment includes establishments primarily engaged in developing mine sites or mining metallic minerals, and establishments primarily engaged in ore dressing and beneficiating operations, such as crushing, grinding, washing, etc. Beneficiating may be performed at mills operated in conjunction with the mines served or at mills operated separately.
Non-metalic Mineral Mining and Quarrying
Dimension Stone Mining/QuarryingCrushed/Broken Limestone Mining/QuarryingCrushed/Broken Granite Mining/QuarryingOther Crushed, Broken Stone Mining/QuarryConstruction Sand and Gravel MiningIndustrial Sand MiningKaolin and Ball Clay MiningClay, Ceramic, Refractory Minerals MiningPotash, Soda, and Borate Mineral MiningPhosphate Rock MiningOther Chemical and Fertilizer Mineral MiningAll Other Non-metallic Mineral Mining
212311212312212313212319212321212321212324212325212392212392212393212399
This segment includes establishments primarily engaged in developing mine sites, or in mining or quarrying non-metallic minerals (except fuels). Also included are certain well and brine operations, and preparation plants primarily engaged in beneficiating non-metallic minerals.
Support Activities for Coal, Metal, and Non-metallic Mining
Support Activities for Coal MiningSupport Activities for Metal MiningSupport Activities for Non-metallic Minerals Mining
213113213114213115
This segment includes establishments primarily engaged in providing support activities for coal, metal, and non-metallic mining (except site preparation and related construction activities) on a contract or fee basis. Exploration for coal is included in this industry. Contract activities can be performed in-house by mining operators.
Source: Census Bureau, North American Industry Classification System (NAICS)

22
Appendix B. The IMPLAN Model
IMPLAN is a well-known modeling system developed by the Minnesota IMPLAN Group for estimating economic impacts and is similar to the Regional Input-Output Modeling System developed by the U.S. Department of Commerce. The model is primarily based on government data sources. It can address a wide range of impact topics in a given region (county, state) or the country as a whole.
IMPLAN is built around an “input-output” table that relates the purchases that each industry has made from other industries to the value of the output of each industry. To meet the demand for goods and services from an industry, purchases are made in other industries according to the patterns recorded in the input-output table. These purchases in turn spark still more purchases by the industry’s suppliers, and so on. Meanwhile, employees and business owners make personal purchases out of the additional income that is generated by this process, further increasing demand that ripples through the economy. Multipliers describe these iterations. The Type I multiplier measures the direct and indirect effects of a change in economic activity. It captures the inter-industry effects only, i.e., industries buying from local industries. The SAM (Social Accounting Matrix) multiplier captures the direct and indirect effects. In addition, it also reflects induced effects (i.e. changes in spending from households as income increases or decreases due to the changes in production).

National Mining Association 101 Constitution Avenue, NW
Suite 500 EastWashington, D.C. 20001
(202) 463-2600 | www.nma.org