advanced implan analysis to understand the economic … · advanced implan analysis to understand...
TRANSCRIPT

ADVANCED IMPLAN ANALYSIS TO UNDERSTAND THE ECONOMIC
IMPACT OF LOCAL FOOD SYSTEM INITIATIVES
Module 7
The Economics of Local Markets USDA AMS Toolkit- 2015
Module 7 Overview
This module provides technical and detailed information on how to adjust the modeling environment to be more directly reflective of conditions in your community or region, and discuss:
Why your team might want to modify IMPLAN for your economic impact study;
How to modify IMPLAN;
The data you will need in order to modify the model;
Modeling approaches for your impact assessment.
USDA AMS Toolkit- 2015 The Economics of Local Markets

At this stage of the project….
Defined its scope, goals and objectives, timeframe, resources, and regional boundaries (module 1);
Collected primary and/or secondary data (module 2 for secondary data and module 3 for primary data);
Involved a technical expert with advanced training on conducting an economic impact assessment, and knowledge of its limitations (module 5);
Considered how to carefully reflect opportunity costs and countervailing effects into your modeling efforts (module 6).
USDA AMS Toolkit- 2015 The Economics of Local Markets
Adapting your I-O Model
A careful and comprehensive local food system assessment usually involves making several adjustments to the default modeling systems, such as:
Scrutinizing the default baseline data contained in the model;
Modifying existing data where appropriate;
Amending assumptions about relationships among sectors;
Manually introducing missing or new sectors into the economy;
Distinguishing between gross and net economic effects
Although these steps can be challenging, they are necessary to create a depiction informed by your community-based conversation and planning efforts
USDA AMS Toolkit- 2015 The Economics of Local Markets
Improving on the IMPLAN platform
Though there are other types of software available for this type of analysis, IMPLAN is widely accepted
In large part due to ease with which modifications can be made.
The content of this module assumes that you are familiar with IMPLAN software and databases
For a basic overview of IMPLAN’s economic analysis structure and capacities, please refer to their website, http://implan.com
The techniques presented in this module incorporate additional data to better reflect your community
Modules 2 & 3 explained the variety of data to be collected
Here we explore how much richer your economic analysis can be in computing the value of inter-industry linkages
USDA AMS Toolkit- 2015 The Economics of Local Markets
Net Economic Impacts Occur When…
Rely on local production to offset or substitute for commodities that must be fully or partially imported
Economists refer to as import substitution (see Module 5)
Can produce sufficiently more than local demand requires and exports the remainder; or,
Increases share of locally controlled food production enterprises as share of local food sector activity grows
I.e., ownership income remains in the local community
Otherwise, changes from one kind of intra-local activity to another do not produce net economic impacts in the near-term
USDA AMS Toolkit- 2015 The Economics of Local Markets
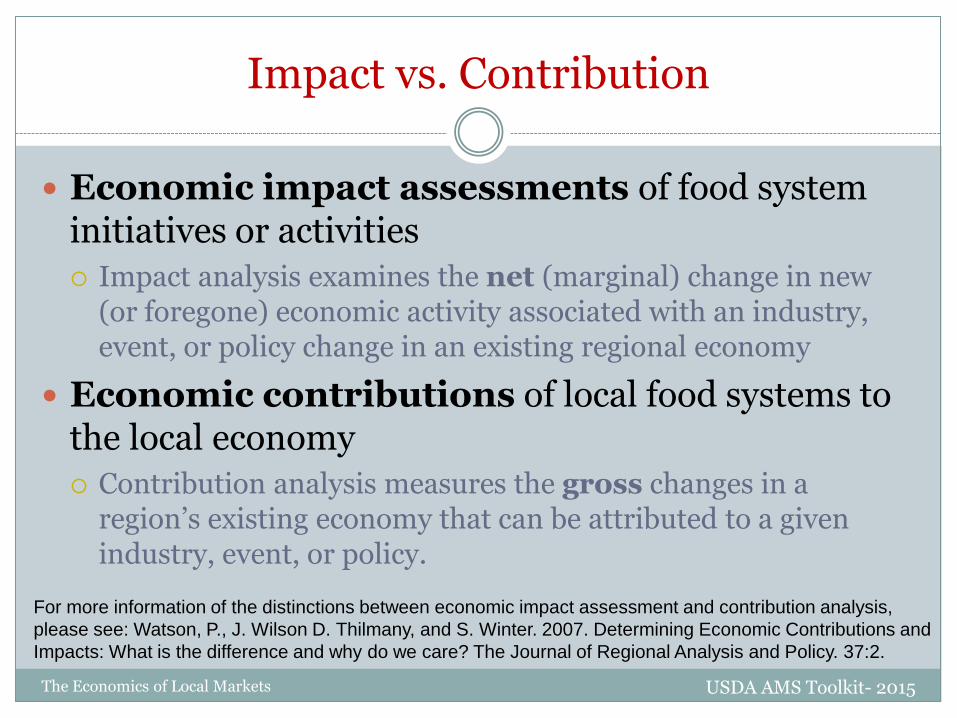
Impact vs. Contribution
Economic impact assessments of food system initiatives or activities
Impact analysis examines the net (marginal) change in new (or foregone) economic activity associated with an industry, event, or policy change in an existing regional economy
Economic contributions of local food systems to the local economy
Contribution analysis measures the gross changes in a region’s existing economy that can be attributed to a given industry, event, or policy.
USDA AMS Toolkit- 2015 The Economics of Local Markets
For more information of the distinctions between economic impact assessment and contribution analysis,
please see: Watson, P., J. Wilson D. Thilmany, and S. Winter. 2007. Determining Economic Contributions and
Impacts: What is the difference and why do we care? The Journal of Regional Analysis and Policy. 37:2.
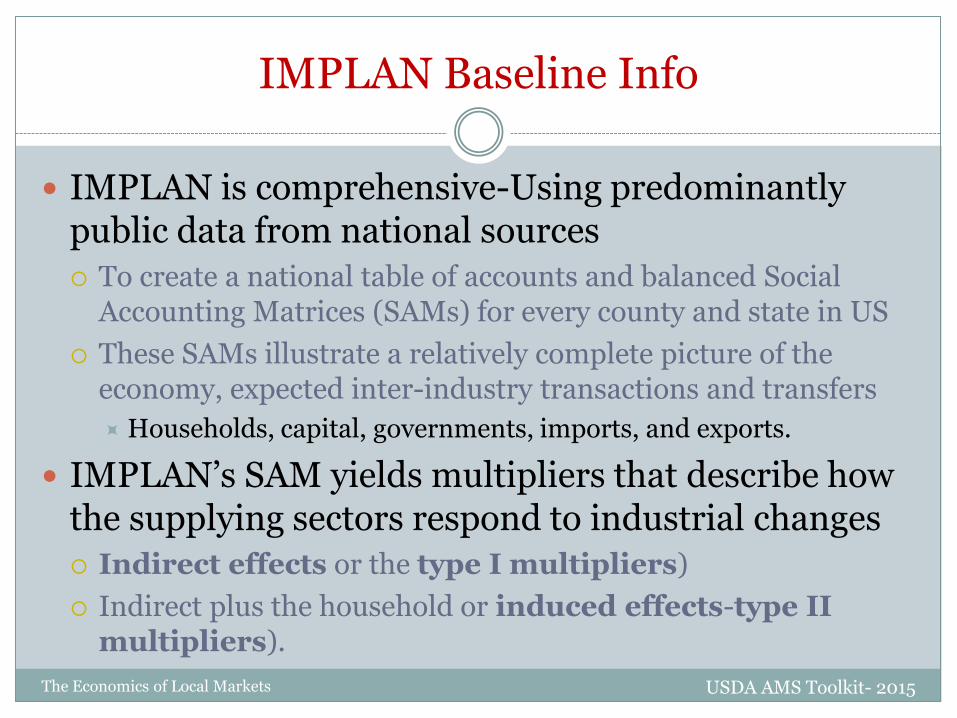
IMPLAN Baseline Info
IMPLAN is comprehensive-Using predominantly public data from national sources
To create a national table of accounts and balanced Social Accounting Matrices (SAMs) for every county and state in US
These SAMs illustrate a relatively complete picture of the economy, expected inter-industry transactions and transfers
Households, capital, governments, imports, and exports.
IMPLAN’s SAM yields multipliers that describe how the supplying sectors respond to industrial changes
Indirect effects or the type I multipliers)
Indirect plus the household or induced effects-type II multipliers).
USDA AMS Toolkit- 2015 The Economics of Local Markets
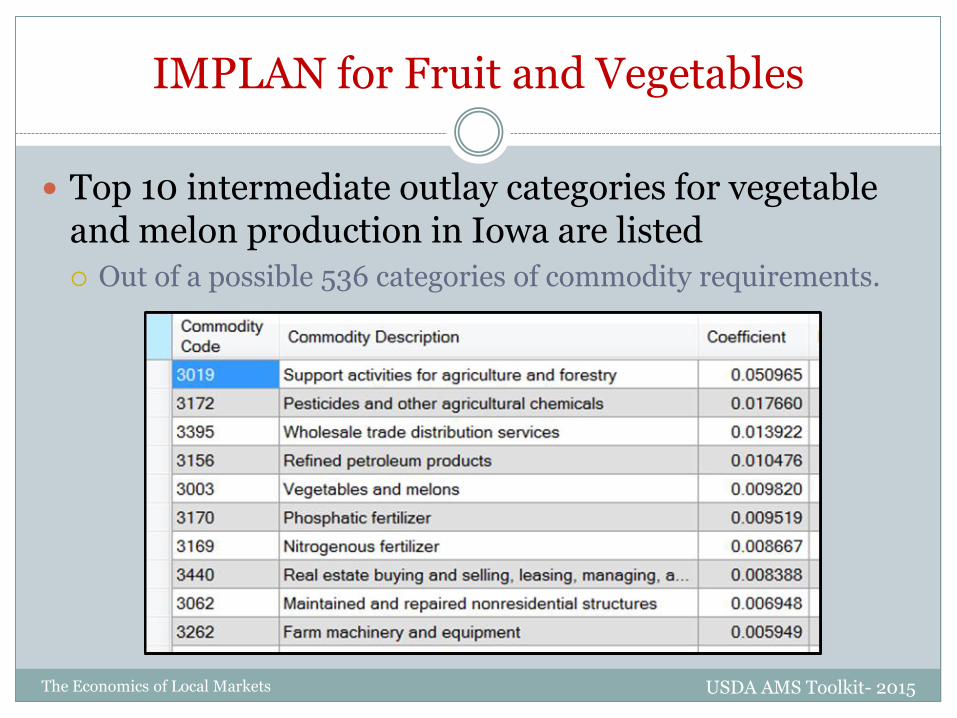
IMPLAN for Fruit and Vegetables
Top 10 intermediate outlay categories for vegetable and melon production in Iowa are listed
Out of a possible 536 categories of commodity requirements.
USDA AMS Toolkit- 2015 The Economics of Local Markets

Sectors in IMPLAN
Each IMPLAN industrial sector represented by a single, initially-fixed expenditure pattern
Economists refer to as a production function,
The sum of all inputs coefficients plus those for payments to value added equals 1.0.
Can be interpreted as each $1 of output change in vegetable and melon farming, that sector required an additional $.051 in ag support activities, nearly $.018 in ag chemicals, and so on.
For an in-depth discussion of how production functions are constructed within IMPLAN, see Lazarus, W., D. Platas, and G. Morse. 2002. IMPLAN’s Weakest Link: Production Functions or Regional Purchase Coefficients. The Journal of Regional Analysis & Policy. 32(1):33-49, and Liu, Z., and M. Warner. 2009. Understanding Geographic Differences in Child Care Multiplers: Unpacking IMPLAN’s Modeling Methodology. The Journal of Regional Analysis & Policy. 39(1):71-85.
USDA AMS Toolkit- 2015 The Economics of Local Markets

Expenditure Patterns Represent
Other sectors in the local economy
Intermediate purchases;
Employee compensation, proprietor income/returns to business owners, property type income/payments to investors, and indirect business taxes/sales taxes
Value added payments;
Other sectors outside of the local economy
Intermediate imports;
Other sources such as institutional outlays
USDA AMS Toolkit- 2015 The Economics of Local Markets

Understanding Value Added
Value added components together can be thought of conceptually as representing the dollar value the business adds in producing its own output.
As noted, value added is primarily distributed via the payments out of revenues that go to owners, workers, investors, and government.
Value added by a business is measured in practice as:
The difference between the total value in the market (revenues received for product sales) and the payments to other businesses for the inputs it must purchase from them.
USDA AMS Toolkit- 2015 The Economics of Local Markets
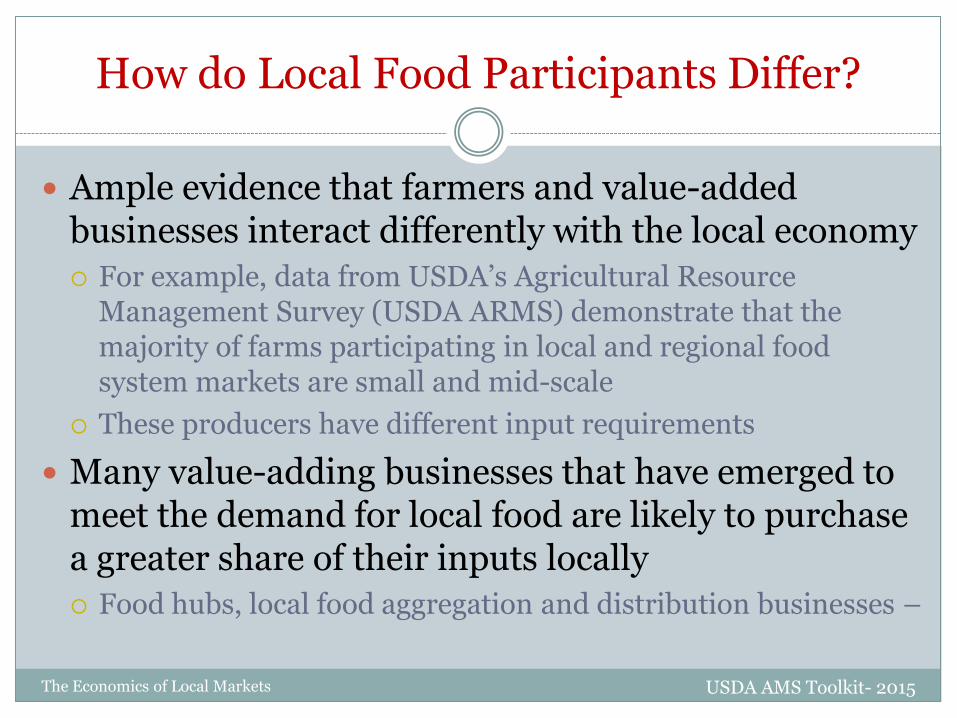
How do Local Food Participants Differ?
Ample evidence that farmers and value-added businesses interact differently with the local economy
For example, data from USDA’s Agricultural Resource Management Survey (USDA ARMS) demonstrate that the majority of farms participating in local and regional food system markets are small and mid-scale
These producers have different input requirements
Many value-adding businesses that have emerged to meet the demand for local food are likely to purchase a greater share of their inputs locally
Food hubs, local food aggregation and distribution businesses –
USDA AMS Toolkit- 2015 The Economics of Local Markets
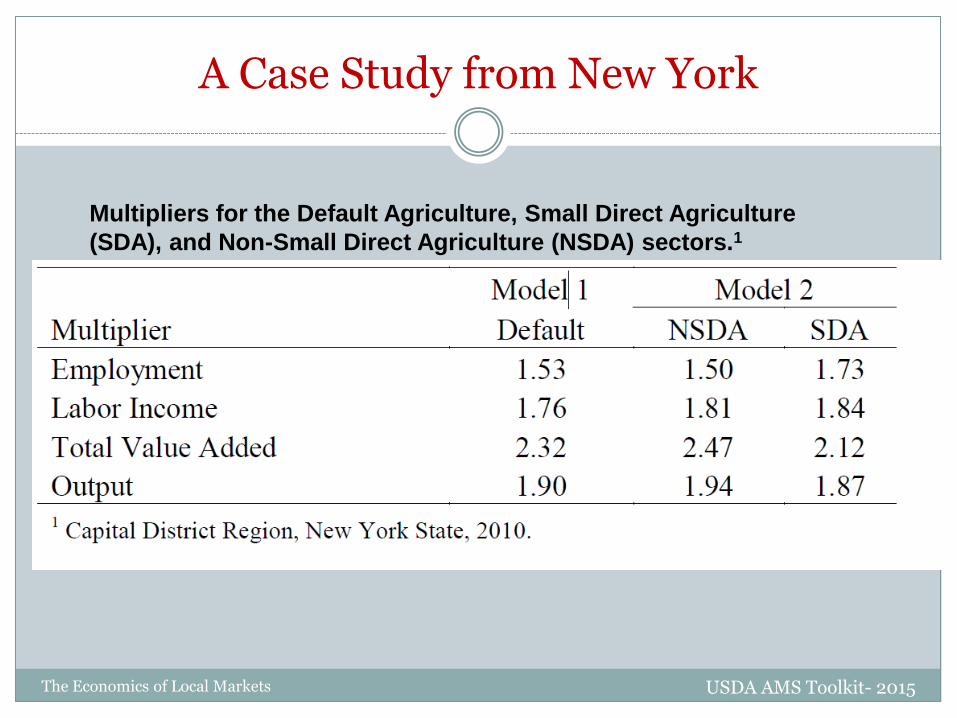
A Case Study from New York
USDA AMS Toolkit- 2015 The Economics of Local Markets
Multipliers for the Default Agriculture, Small Direct Agriculture
(SDA), and Non-Small Direct Agriculture (NSDA) sectors.1
New York Food Producers’ Activity
Modified IMPLAN to estimate the local economic impact of small- and medium-scale producers
A team of researchers from Cornell University worked with extension agents from an 11 country region to collect expenditure and sales information (labeled the SDA sector).
SDA producers have different expenditure patterns
The study created two agricultural sectors with differential expenditure patterns resulting in different economic impacts.
SDA sector had higher associated employment and labor income multipliers
The NDSA sector had larger total output and value added multipliers.
USDA AMS Toolkit- 2015 The Economics of Local Markets
Customizing the Local Food Farm Sector
Researchers, practitioners, and policymakers interested in understanding precise impacts
Within IMPLAN there are 14 sectors related to agricultural production, but farms participating in local food systems are smaller, more diversified, and assume supply chain functions
IMPLAN has weighted average values of production characteristics of common agricultural producers,
To account for expected variations one can create a new local food farm sector.
But the modification is only a valuable if it accurately reflects new economic flows – informed by place-based data
USDA AMS Toolkit- 2015 The Economics of Local Markets
Creating a New Sector
New sectors can easily be added to IMPLAN by finding one that is unpopulated in the local economy.
In many parts of the U.S., for example, there is no tobacco grown so the tobacco farming sector can be used
This sector can be renamed and populated with information to more accurately reflect the local food farm sector.
Given the new sector is empty, it needs data
Those new data can come from primary research (your interviews of local producers) or secondary research
Through creative modification of existing production functions in the IMPLAN model altered to represent production scenarios or scales that are different than the default, average values.
USDA AMS Toolkit- 2015 The Economics of Local Markets
Case Studies: Imputing Values for CO and WV
Primary data on employee compensation for farms that participate in farm-to-school programming
Gunter and Thilmany (2010) took an average of the percentage of output that employee compensation used for food and beverage retailers, as well as from vegetable, melon and fruit farming from the IMPLAN data.
Based on the assumption that the average farm-to-school farmer likely grows and sells their own products, so captured marketing activities as a proxy for retained transaction costs.
Ag sectors in study of West Virginia farmers’ markets
Hughes et al. (2008) modified payments to value added categories to reflect farmers selling at these markets are small and have a non-corporate structure
USDA AMS Toolkit- 2015 The Economics of Local Markets
Secondary Data and IMPLAN
Normally need to augment available data by collecting information from the food system businesses
Goal of the primary data collection is to come up with an average local food farm expenditure profile --not an easy task.
Important to ensure that such surveys are as representative of the targeted local producer or processor population as possible.
Surveys of convenient sources of data, like a select sub-set of program participants or advocates, likely will not adequately document operational costs fully and can lead to economic distortions when those data are run through input-output models.
USDA AMS Toolkit- 2015 The Economics of Local Markets

Study Area Data
The proper specification of study area should contain the intended population of producers and their primary labor and inputs supply territory.
Not so large as to over-describe primarily localized effects, and it should not be so small as to fail to capture key linkages.
Should include total size of the sector by:
Number of employees-Refers to the number of positions but many jobs in retail may be part-time or seasonal so 1 FTE may be many seasonal workers
Total output (value of production, usually in gross sales);
Value-added (employee compensation, proprietor income, other property type income, and indirect production taxes).
USDA AMS Toolkit- 2015 The Economics of Local Markets

Industry Production in IMPLAN
Not just important to know just the total size
But also its local inter-industry linkages which help to measure net impacts to assess whether some economic activity that previously “leaked” from the region is now captured
There are 3 parts to modifying industry production:
Customizing the industry’s average expenditure patterns (e.g., the gross absorption coefficient for each industry sector);
Customizing the commodity production to ensure that it reflects the products produced by the local food sector; and
Customizing trade flows to reflect portion of products (i.e., commodities) purchased from local sources (e.g., modifying the regional purchase coefficients)
USDA AMS Toolkit- 2015 The Economics of Local Markets

Adjusting Other Sectors
After customizing IMPLAN model, some sectors should be reduced by newly-created amount
E.g., fruit, vegetable & melon farming, animal production
This is important as the local food farm expenditures and sales are now accounted for in IMPLAN
If, for example, you are adding $1 million in output, along with all jobs and payments to labor and proprietorships, to a newly itemized ‘local foods’ vegetables production sector
Then subtract those exact values from the vegetable and melons aggregated sector so that the area economy producing those commodities is the same as before the modifications.
USDA AMS Toolkit- 2015 The Economics of Local Markets

Further Customization
Same approach can modify other industry sectors
Swenson, for example, explored economic impact of small-scale meat processing firms in Iowa, compared to the larger, more dominant meat processors in the same state.
“Small meat processing” was fundamentally different as a sub-industry to larger meat processing in Iowa.
Although the local meat processing sector produced more “jobs” per animal units harvested . . .
Plants were not as efficient and did not make as significant contribution to the local economy
Swenson, D. 2011. Exploring Small-Scale Meat Processing Expansion in Iowa. Ames, IA: Iowa State University, Leopold Center for Sustainable Agriculture. Available at: http://www.iowameatprocessors.org/LeopoldExpan.pdf
USDA AMS Toolkit- 2015 The Economics of Local Markets
Impact Assessment Scenarios
Different ways to more rigorously use IMPLAN to analyze the local economic impact
With a properly specified local foods model one can shock that sector of IMPLAN by the jobs in that sector
Estimate the multiplied-through economic contribution
A local foods scenario that involves specifying the activities that exist among producers, distributors / sellers, and different types of local consumers.
Another analyzing supply chain components of production and distribution or sales to isolate the relative economic contributions of different stages
USDA AMS Toolkit- 2015 The Economics of Local Markets
Analysis By Parts (ABP)
Trying to create an entity similar to the food hubs industry sector within IMPLAN is complicated.
Expenditure pattern similar to that of the “transit by truck” sector (335), but a food hub takes on additional supply chain functions with a different mix of inputs
The implication is that information is needed to develop a food hub sector and nature of transactions.
“Assessing the Economic Impacts of Regional Food Hubs: the Case of Regional Access” report, Schmit et al., propose utilizing an analysis-by-parts (ABP) approach in these situations.
This is also commonly called a “bill of goods” approach.
USDA AMS Toolkit- 2015 The Economics of Local Markets
Analysis by Parts
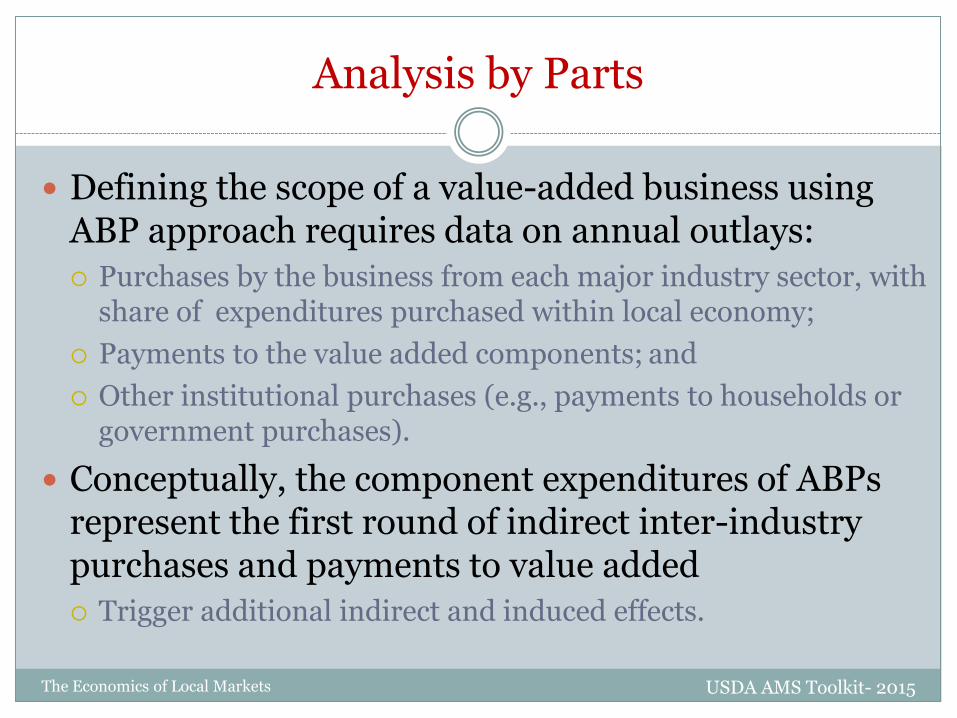
Defining the scope of a value-added business using ABP approach requires data on annual outlays:
Purchases by the business from each major industry sector, with share of expenditures purchased within local economy;
Payments to the value added components; and
Other institutional purchases (e.g., payments to households or government purchases).
Conceptually, the component expenditures of ABPs represent the first round of indirect inter-industry purchases and payments to value added
Trigger additional indirect and induced effects.
USDA AMS Toolkit- 2015 The Economics of Local Markets

Hypothetical Example of Analysis by Parts
USDA AMS Toolkit- 2015 The Economics of Local Markets
• Allocating $100,000 in hypothetical outlays • The first data column contains the hypothetical purchases. • The second is important as it allocates those expenditures
to suppliers within the region or lets them leak outside • It is important, though, in the absence of information
confirming such, purchases should not be set to 100% local
Module 7 Takeaways
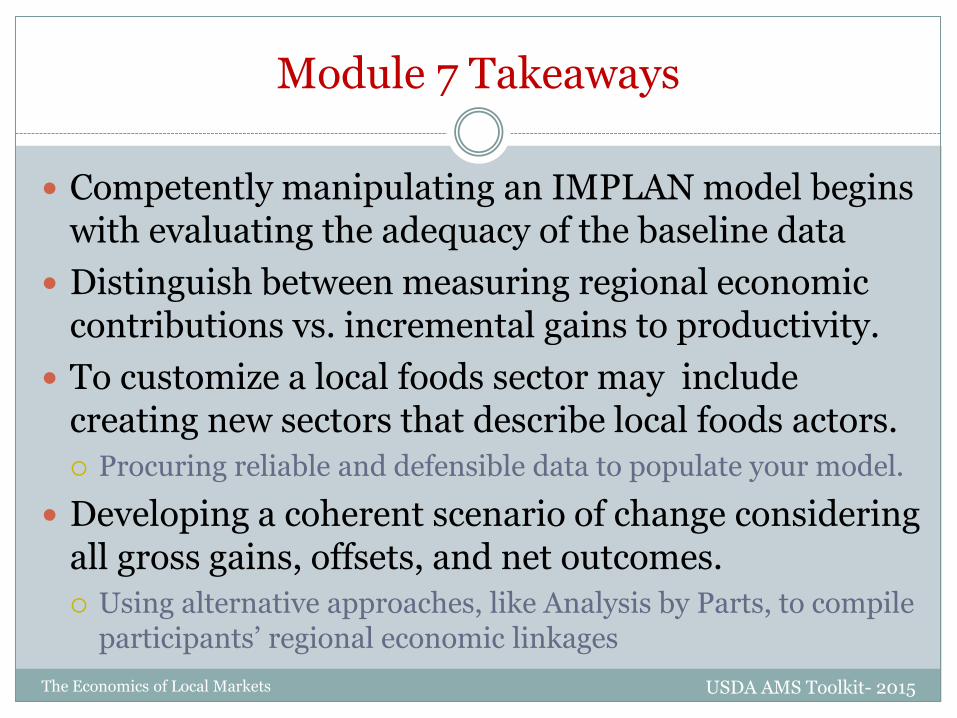
Competently manipulating an IMPLAN model begins with evaluating the adequacy of the baseline data
Distinguish between measuring regional economic contributions vs. incremental gains to productivity.
To customize a local foods sector may include creating new sectors that describe local foods actors.
Procuring reliable and defensible data to populate your model.
Developing a coherent scenario of change considering all gross gains, offsets, and net outcomes.
Using alternative approaches, like Analysis by Parts, to compile participants’ regional economic linkages
USDA AMS Toolkit- 2015 The Economics of Local Markets