the e ects of migration and ethnicity on african … · the e ects of migration and ethnicity on...
TRANSCRIPT

The Effects of Migration and Ethnicity on African Economic
Development
Mathias Iwanowsky∗
September 3, 2018
Abstract
International migration has a considerable impact on trade between nations. While sup-ported by evidence from developed countries, the effects of migration on trade are less clearcut for developing countries. Given the evidence on ethnic identity in Africa, standard es-timates based on the nationality of migrants are likely biased in developing countries. Inthis paper, I expand the standard approach to explicitly account for heterogeneous ethnic-ities migrating between countries. Using the precolonial distribution of ethnicities as aninstrument for modern day migration in Africa, I estimate a considerably larger effect onbilateral exports and economic development than previously found. I provide evidence thatethnic identification shapes bilateral trade by facilitating the flow of information, especiallyfor ethnicities who are not part of a government coalition. I discuss potential concerns ofprecolonial ethnic linkages and find no evidence of omitted variable biases caused by similarlanguages, preferences, or conflict. The results are consistent with a model of internationaltrade where cross border connections decrease the fixed costs of exporting by shared infor-mation.
Keywords: Trade, Migration, Development, Ethnicity
∗Ludwig-Maximilians-University, Ludwigstrasse 33, 80539 Munich, Germany. email: [email protected]. I benefited greatly from discussions with Konrad Burchardi, Dorothee Buhler, SerenaCocciolo, Masayuki Kudamatsu, Andreas Madestam, Stelios Michalopolous, Nathan Nunn, Torsten Persson,Thorsten Rogall, Jakob Svensson and Anna Tompsett. Thanks to the participants of the MIT Political Econ-omy Lunch, Harvard History Lunch, Brown Macro Lunch, Nordic International Trade Seminars, the Oxforddevelopment workshop, the UCL Enter Seminar and NEUDC.

1 Introduction
In recent years, researchers have started to scrutinize the historical determinants of economic un-
derdevelopment in Africa. Until recently, African economies underperformed and the arbitrary
partitioning of African ethnicities into states was identified as a contributing factor (Alesina
et al., 2016; Michalopoulos and Papaioannou, 2016; Clochard and Hollard, 2018). However,
African states are now among the fastest growing nations, which suggests that the common
assumption of the adverse effects of divided ethnicities on the development of institutions is
incomplete.
In contrast to the literature on institutions, research on migration suggests that more in-
ternational connections promote trade and growth through various channels (Burchardi et al.,
2018). Since migration is affected by bilateral trade and other unobservable factors, the liter-
ature has used past migration flows or clusters based on nationality to establish causal effects
(Munshi, 2003; McKenzie and Rapoport, 2007). Especially in Africa, such migration statistics
likely underestimate the true effect of migration, as ethnic identification plays a large role in
many parts of the economy (Hjort, 2014). However, identifying the effects of ethnic links across
African countries is challenging since migration along the same preferences that shape modern
cross-border trade imply a reverse causality problem. Hence, while ethnic links are likely to be
more important for trade and economic development, evidence for African countries is scarce.
In this paper, I combine the precolonial distribution of ethnicities in 46 continental African
countries with recent bilateral trade and migration data to find that migration and exports are
positively correlated. I overcome the reverse causality by using past migration and precolonial
ethnic connections between countries as instruments for current migration. Accounting for
ethnicity, the impact of migration on exports is more than twice as large as previously estimated.
A one percent increase in the migrant stock is associated with a 0.7 percent increase in bilateral
trade. I show that the effect of precolonial ethnic connections on trade is not affected by
specification choice, input choice, or an omitted variable bias from conflict, shared preferences,
or linguistic similarity.
Further, I exploit the randomness of borders and the precolonial distribution of ethnicities
to estimate the gains from trade. Using nighttime light data, I show that ethnic connections
lead to relative increases in wealth in more ethnically connected regions. Cross-border ethnic
connections are likely to compensate for unfavorable institutions within and between African
countries, affecting economic development more positively than previously thought.
To identify a causal effect, I use the precolonial distribution of ethnicities and their division
into separate countries by colonial powers to overcome the endogeneity problem. Contem-
1
poraneous borders in Africa were drawn by European colonial powers in the late nineteenth
century without the input of ethnic leaders. As a result, every border splits an ethnic group
and the average African country is home to more than 10 ethnic groups. As most groups speak
their own language, preserve their own historical culture, and potentially share a history of
conflict, extractive institutions have hindered economic development and harmed smaller eth-
nicities (Acemoglu et al., 2001; Burgess et al., 2015). I determine the precolonial distribution
of ethnicities in Africa by calculation the population shares of more than 800 ethnic groups and
in 46 countries (Murdock, 1959). Given that country borders in Africa were drawn randomly
with respect to ethnicities, I argue that this approach identifies a causal effect of precolonial
ethnic connections on migration, trade, and economic development.
This heterogeneity in and spatial distribution of ethnicities in African countries has long
been identified as one reason for the relative underdevelopment of African countries. The
arbitrary partitioning into states left countries without a national identity, harmed public good
provisioning, the ability to reach a consensus, and impacted the economic development of divided
groups by governmental repression and ethnic wars (Alesina et al., 2011; Michalopoulos and
Papaioannou, 2014, 2016). I complement this view and suggest that the ethnic division into
separate countries created connections that have alleviated the negative impact by fostering
cross-country trade.
In this paper, I contribute to our understanding of the importance of migration by providing
causal evidence on the impact of ethnic connections on bilateral trade flows in Africa (Bandy-
opadhyay et al., 2008; Felbermayr et al., 2010). The magnitude of the effect is at the upper end
of the estimates found in the literature for developed countries (Bandyopadhyay et al., 2008).1
However, with the exception of Felbermayr et al. (2010) and Burchardi et al. (2018), most
studies suffer from endogeneity concerns, as migrants use and benefit from clusters of existing
migrants to settle in their new country (Munshi, 2003; McKenzie and Rapoport, 2007; Battisti
et al., 2016). Accordingly, if these clusters are formed by the location choice of exporting firms
or common preferences, reverse causality issues arise. I overcome these endogeneity concerns
by using the precolonial distribution of ethnic groups and exogenous placement of borders to
uncover an unbiased effect of migration on trade for African countries.
1See also Gould (1994); Dunlevy and Hutchinson (1999); Herander and Saavedra (2005); Dunlevy (2006);White (2007); Partridge and Furtan (2008); Burchardi et al. (2018) study the US and Canada and Rauch (1999);Rauch and Trindade (2002); Felbermayr et al. (2010); Felbermayr and Toubal (2012) study Asia. (Peri andRequena-Silvente, 2010; Felbermayr et al., 2010, e.g.) include some African countries but focus on the links todeveloped countries.
2

The estimated magnitude can be attributed to endogeneity issues in previous studies, as well
as ethnic identity affecting within group information flows and between group discrimination.
First, while the estimates only reflect the impact on registered trade flows, they are affected by
the flow of information and trust within ethnic networks. Several channels and effects of ethnic
identification in Africa have been highlighted in the literature and contribute to the impact of
ethnic links. The importance of ethnicity for trust among local market vendors, price dispersion
across borders, and public goods provision has been well documented (Fafchamps, 2003; Aker
et al., 2014; Burgess et al., 2015). By using local variation and survey data, these studies offer
credible evidence at the micro level but at the cost of generality for the entire African continent.
I build on this foundation and extend their work by showing that ethnic identification shapes
trade flows between 46 African countries and promotes growth.2
Second, the estimates also providence evidence in support of an hypothesis that ethnic con-
nections in African countries are especially important due to high levels of corruption (Svensson,
2003; Dunlevy, 2006; Olken and Barron, 2009). In Africa, members of the same ethnicity have
been shown to share information, risks, bargain jointly for preferred policies, are more produc-
tive, or share income and information (Bates, 2008; Fafchamps and Gubert, 2007; de la Sierra
and Mutakumura, 2014; Hjort, 2014; Fenske and Zurimendi, 2017; Clochard and Hollard, 2018).
Ethnic identification also plays an important role in voting (Eifert et al., 2010), potentially con-
tributing to post-electoral violence in some countries (Dercon and Gutierrez-Romero, 2012). I
use data on government coalitions to show that ethnicities which are excluded from political
participation, substitute governmental institutions and use their cross-border ethnic connections
to facilitate exporting. These results on contemporaneous institutions are confirmed by using
historic variation in the political centralization of ethnicities. Moreover, I find no evidence for
competing hypotheses that conflict incidence, linguistic similarity, or shared preferences explain
the results. Instead, the evidence is most consistent with the hypothesis that networks facilitate
the sharing of information and increase trust.
In summary, this paper highlights a potential positive effect of ethnic division in Africa and
potential channels through which these effects materialize. The paper is structured as follows.
In Section 2, I discuss my empirical strategy and the data. I present the baseline estimates in
2One example of such cross-border solidarity was the temporary practice of Air Namibia, the ma-jor carrier of Namibia, having a stopover in Luanda (Angola) only to refuel due to disputes with thefuel supplier at their main airport. The airline is run by an ethnicity that has strong ties betweenthe two countries and, hence, used its credibility in Angola to buy fuel (http://www.economist.com.na/headlines/2795-air-namibia-increases-frankfurt-flights and http://hannamibia.com/uploads/pdf/
news/130305093441120.pdf). Additionally, the main supplier of jet fuel in Namibia, Engen, is South Africanand the ethnicity is only dispersed in Angola and Namibia.
3

Section 3 and show robustness in Section 4. I identify potential mechanisms in Section 5 and
conclude the paper in Section 6.
2 Empirical strategy
In work on bilateral trade, the value of bilateral exports is modeled in gravity type equations.
Here, the value of trade is correlated with the size of the exporter and importer economy as
larger economies attract more trade flows. In this framework, adding a stock or flow of mi-
grants estimates the impact of migration on bilateral trade. However, estimating the impact of
migration on bilateral trade between two developed and two developing countries is distinctly
different. While migrants from developed countries often identify themselves by their national-
ity, ethnic identification dominates nationality in many African countries. Second, emigration
from developing countries is correlated with natural, political or economic factors, leading to se-
vere endogeneity concerns. These distinct features of African countries require a generalization
of the standard empirical approach as well as exogenous variation to identify a causal effect.
2.1 Empirical framework: trade and migration
Estimating the impact of migration between developed countries, the literature uses gravity
type equations derived from theory. These gravity equations include a population stock or flow
of migrants and take the form (Anderson, 1979):
log(Xij,t) = β log(PSj,t) +Bij,t + δi + δj + εij,t (1)
Here the log of exports from the exporting country i to the importing country j, log(Xij,t),
is correlated with the population share of people from i in j (PSj,t). Controlling for exporter
(δi) and importer (δj) fixed effects and bilateral characteristics (Bij,t), β identifies the effect
of the population share on the log of exports. The elasticity β > 0 indicates that trade flows
increase if the trading partners are of the same nationality.
Implicitly, equation (1) assumes that migrants to the importing country j identify with the
nationality of their exporting country i.3 While approximately true in developed countries, the
population structures in developing countries are more diverse. African countries combine a
multitude of ethnicities, each with their own identity and separated into multiple countries.
3The underlying equation is of the form Xij,t = (Popi,i,t×Popi,j,t)β(Popi,t×Popj,t)−β . Here, the populationshare of migrants from i in the exporting country i is defined by Popi,i,t/Popi,t and equals to one in equation(1). The population share of migrants in the importing country PSj,t is then defined by the ratio Popi,j,t/Popj,t.
4

Thus, allowing for multiple ethnicities (e) from the set of ethnicities (E) in each country e ∈
Ei ⊆ E, the general form of equation (1) is given by:
log(Xij,t) = β log
E∑e∈Ei∩Ej
PSi,t,e × PSj,t,e
+Bij,t + δi + δj + εij,t (2)
where PSi,t,e ∈ [0, 1] is the population of an ethnicity e that is prevalent in each country pair
ij, relative to the population of country i at time t. This equation correlates bilateral exports
to the probability of a co-ethnic relationship (match) when randomly drawing two individuals
from each country. It captures the idea that it is easier to trade with someone from your own
ethnicity, but does not exclude the possibility of trading with other ethnicities if the country is
prosperous.
The formulation of equation (2) is supported by two factors. First, it is the empirical
equivalent of an otherwise standard model of international trade (Melitz, 2003; Chaney, 2008)
that adds an ethnicity specific fixed capturing lower entry costs into an export market for
ethnically connected firms (Appendix A).4 Second, the interpretation is equivalent to the search
and matching literature if an exporter from country i can export more cheaply if she finds an
importer in country j that is of the same ethnicity.5 Aggregating each firm’s exports then yields
the gravity type equation (2). In the search and matching literature, a match is defined when two
individuals with the same characteristics are drawn. Since these characteristics are stochastic,
the likelihood of a match is given in probabilities. Here, characteristics are distributed along
ethnic lines, and thus the fraction of the population representing an ethnicity in the importing
country is equivalent to the likelihood that an exporting firm from the exporting country finds
a match in the importing country. Then, the estimated β can be interpreted as an elasticity
that captures the change in match probability of each ethnicity when the population changes
on either side of the border.6
4These costs can be lower information costs, more reliable information about market structures or bribes, andfewer cases of fraud between business partners. In the Appendix, I show that equation (2) follows if firms face afixed cost of exporting
PS−ηi,e fij
with η ∈ [0, 1) providing concavity for the impact of fixed costs fij on the exporting firms’ profits. These fixedcosts represent costs of setting up a distribution network, informing about markets, administration and payingfor permits. A similar model has been suggested by Krautheim (2012), and the model nests the establishedstandard model of Chaney (2008) with η = 0.
5With bilateral trade data at the ethnicity level, this equation would be Xij,e,t = (PSi,t,e × PSj,t,e)γ with γbeing the elasticity. Aggregating to the exporter-importer pair yields Xij,t =
∑Ee∈Ei∩Ej (PSi,t,e × PSj,t,e)γ . As
long as γ ∈ [0, 1), the estimated coefficient β in equation (2) underestimates γ due to the concavity introducedby γ.
6Note that match probability is defined as the likelihood of randomly drawing two individuals from the sameethnicity. The probability that two randomly drawn individuals are not from the same ethnicity is non-zero, butis captured by the exporter and importer fixed effects in equation (2).
5

This interpretation is similar to the standard in equation (1), as both can be interpreted
as a probability of drawing two connected people in each country. In equation (2), however,
I incorporate the heterogeneous population structures in African countries and allow for a
large amount of subgroups within two countries that are connected. Thus, using the standard
empirical approach would identify a ‘nationality’ effect and not the true ‘ethnicity’ specific
effect, as it does not account for the variability in the exporting country.
2.2 Empirical specification and data
The empirical equivalent I estimate throughout the paper is given by:
log(Xij) = β log Ethnic Match Probabilityij +Bij + δi + δj + εij (3)
Here the ‘Ethnic Match Probability’ is defined by the sum of all ethnic match probabilities
for all ethnic groups that are prevalent in both countries PSi,e × PSj,e ∀e ∈ Ei ∩ Ej and
constitutes the measure of ethnic similarity between a country pair. Every regression follows
the standard in the trade literature and includes exporter (δi) and importer (δj) fixed effects
and, where applicable, includes exporter-importer pair characteristics (Bij).7 A positive point
estimate, β > 0, suggests that a larger population on either side of the border for a connected
ethnicity yields larger trade flows.
To identify the current population of each ethnicity in each county, I use the Ethnologue
data set with estimates on ethnic populations around the world based on a variety of sources.8
I obtain exogenous variation in ethnic shares using data containing the distribution of ethnic
groups before colonialization. The geographic data provided by Murdock (1959) has been used
to study the relationship between slavery and trust (Nunn and Wantchekon, 2011). Matching
the spatial extent of every ethnicity with grid cell population data from the United Nations
Environment Program in 1960, it approximates the population of every ethnicity in every coun-
try in 1960, a time when African countries gradually gained independence.9 To my knowledge,
I explore the possibility of inter-ethnic trade in Appendix A.1. By assuming an increasing cost of trade forethnicities that are far away from each other, I confirm the baseline estimates for the entire sample of Africancountries.
7Exporter-importer pair characteristics include log(Length of border), log(Distance between country cen-troids), dummies for speaking the same language, number of ethnic connections between the country, sharing acolonial history and a dummy that indicates whether parts of the border are determined by a river or mountains.
8www.ethnologue.com Sources in the data vary in timing and quality.9France retreated from most of its possessions in 1958–1962, Britain in 1957–1965 and Belgium in 1960–1962.
The conclusions in this paper are qualitatively robust to very coarse information on population in 1900 containedin Murdock (1959), but due to its incompleteness and the noise I do not report it here.
6

this is the first paper that combines the Murdock data with population data in the context of
international migration and trade.
I estimate the main equation at the country-pair level to avoid a Moulton (1986) type
problem of inconsistent standard errors. In every country pair, every country is observed once
as an exporter and once as an importer, to match observed migration flows. For the dependent
variable, the log of bilateral exports, I use UN comtrade data from the World Bank Integrated
Trade Systems from 1989–2014 and collapse it to the mean value of every country-pair.10 Since
the trade data do not capture unreported and informal trade, the literature has focused on price
level differences (Aker et al., 2014). I use reported trade only to attempt to estimate the effects
for all countries, taking into account that the point estimates are likely lower bounds on the
true extent of exports between countries.11
The final sample consists of 46 African countries in 91 country pairs with 182 exporter-
importer relationships that share a border. Due to unobserved trade the sample is further
reduced to 168 observations. Since the variation I intend to exploit is at the country-pair level,
I follow the conservative choice and cluster the standard errors at this level. I report esti-
mates using ordinary least squares due to the interpretative simplicity, but show the robustness
using weighted least squares, a panel estimation with country specific year fixed effects, and
the Poisson-Pseudo-Maximum-Likelihood estimator as suggested by Santos-Silva and Tenreyro
(2006).
2.3 Identification strategy
The empirical approach in the trade literature uses flows or stocks of migrants and correlates
these with bilateral exports. However, economic activity attracts trade and migration flows
in a similar fashion, leading to problems of reverse causality. Additionally, borders are not
set randomly and reflect spheres of influence and historical economic activity, such that the
direction of a potential omitted variable bias is unclear. To overcome the issue of reversed
causation and omitted variable biases, I use the historical dispersion of ethnic groups and argue
that, contrary to borders between European countries, borders between African countries are
10As this severely reduces the degrees of freedom and to weight observations by their informativeness, I showrobustness to weighting every observation with the number of times I observe trade between that pair. In orderto have a better match, I download import and export data and cross match imports and exports to generatereliable export measures. The results are robust with either inputs, but for sample-size reasons, I end up usingthe matched data.
11If the data is split up into reported or unreported trade, the true estimate will be β =(βreportedXreported
ij + βunreportedXunreportedij
)/(Xreported
ij + Xunreportedij ). As long as βreported ≤ βunreported,
I estimate a lower bound effect. Since unreported trade is much more dependent on trust, I argue that thiscondition is fulfilled.
7

placed exogenously(Michalopoulos and Papaioannou, 2014, 2016). Combined, the historical
distribution of ethnicities and exogenous placement of borders identifies a causal effect of cross-
border ethnicities on bilateral trade between African countries.
In African countries, ethnic population shares are affected by a multitude of factors. Natural
catastrophes, hunger, civil conflicts or past migration contribute to the dispersion of people
around the continent. Even without accounting for ethnic heterogeneity, these factors are
correlated with economic activity and threaten a causal identification of the ethnicity effect in
equation (3). In addition, if people migrate following a trade route because it constitutes their
best information about potential destinations, any factor that increases trade also increases
migration, leading to a problem of reverse causality.
The standard approach in the literature uses past migration to instrument for current mi-
gration as it has been shown that migrants follow their networks and settle in clusters in the
importing country (Munshi, 2003; McKenzie and Rapoport, 2007). This strategy solves the re-
verse causality problem if initial migrants were randomly placed in countries. For this approach,
I use data on bilateral migration at the country level dating back to 1960 to have some exoge-
neous variation before the time period of interest 1989–2014.12 To specifically allow for ethnic
heterogeneity and counteract any potentially remaining issues of reverse causality and omitted
variable biases, I use the precolonial distribution of ethnic tribes in Africa (Murdock, 1959).
Here, I combine the geographic location of each ethnicity with detailed grid cell population
data from the United Nations Environment Program in 1960 to obtain population estimates of
migrants and their home population at the time of independence.
Since the Murdock map shows the precolonial distribution of 833 ethnicities in Africa, se-
lective sorting prior to independence is unlikely as borders were decided by colonial powers and
not ethnic groups. However, the population figures in Murdock (1959) are estimates combined
from different sources and given by ethnicity, as opposed to by country, leading to potentially
severe measurement error. Hence, I use detailed grid cell population data at a 4.5 km resolu-
tion in 1960 which yields a reliable population estimate for the ethnic homelands just prior to
independence.
Contrary to European countries where borders reflect spheres of economic interests, African
borders were drawn in 1884 at the Berlin conference. These borders do not reflect the interest of
the ethnic groups, but the interest of the colonial powers.13 The exogeneity of these borders has
12http://databank.worldbank.org/data/reports.aspx?source=global-bilateral-migration13For example, Aker et al. (2014) argue that the border between Nigeria and Niger was set at the Berlin
Conference in 1884-1885. It was not a border reflecting geographic features but rather the political interests of
8

been extensively used in the recent literature on culture and development, price dispersion across
borders as well as ethnic fractionalization (Alesina et al., 2011; Aker et al., 2014; Michalopoulos
and Papaioannou, 2014). Most country borders today feature parts that follow either latitudinal
or longitudinal lines since the exact geography of Africa was largely unknown at the Berlin
conference (Alesina et al., 2011). Where the geography was known and country borders could
have been set to follow rivers or mountain ridges, the evidence in Figure 2 still suggests no such
pattern. Here, country borders, shown in black, rarely overlap with major rivers shown in blue.
I argue that these borders were arbitrarily drawn, do not reflect the interests of a specific
ethnicity, and divide ethnicities into more than one country. These split ethnic groups are
likely to be different from other ethnicities in terms of size or historical economic activity. In
line with Michalopoulos and Papaioannou (2013, 2016), I show in Table B.1 that an ethnicity
is more likely to be divided by a border if it is larger in terms of population or territory
or has a lower population density. Using data on historical characteristics of tribes, I show
that split ethnicities were more likely to be nomadic (column 4), but neither the size of local
communities nor historical institutions predict a future divide into more countries. Estimating
all characteristics jointly to account for correlations between variables, the area an ethnicity
covers in the Murdock data is the only determinant that robustly predicts the divide between
countries (column 8).
However, to address concerns that these correlations influence the results, I only consider
country borders where ethnicities have been split. Furthermore, I only use ethnic groups that
are split at this border when using ethnicity level characteristics in the heterogeneity analysis.
Thus, I abstract from a comparison of influential ethnicities with negligible ethnicities and use
a balanced sample across similar ethnic groups. Additionally, this procedure abstracts from
selection effects into having a shared ethnicity, and focuses on the intensive margin only.
3 The impact of migration on exports
The positive effects of migration on bilateral trade between African countries have been high-
lighted in the literature to a great extent. In this section, I provide evidence for a positive
effect of migration between developing countries on bilateral trade using two approaches. First,
I document the effect of migration on trade using the standard approach with past bilateral mi-
gration. Second, introducing baseline ethnic heterogeneity in exporting and importing countries
France and Britain. The border eventually emerged in 1906 and the resulting mixture of ethnicities shows asimilar pattern in 2008.
9
highlights a substantial downward bias as subsequent migration flows are likely to be correlated
with initial conditions that affect trade and migration.
Effects on exports The main results are presented in Table 1 where I report the endogeneous
ordinary least squares, the first stage and reduced form using the instrument, and the point
estimate from instrumenting. I estimate the impact of the stock of migrants in 1990 on the
value of bilateral exports in the period 1989–2014 for 46 countries with trade flows. In column
(1), the ordinary least squares point estimate suggests that a 1% higher migrant stock increases
bilateral exports by 0.139% (s.e. 0.024). I follow the literature, and use the migrant stock in
1960 as an instrument to obtain a causal estimate in column (2). The results suggest a small
downward bias of the OLS as the point estimates suggests an elasticity of 0.199 (s.e. 0.031). In
columns (3) and (4), I repeat the initial exercise for the sample of 44 bordering countries with
trade flows. The IV point estimate is statistically significant and implies an elasticity of 0.260
(s.e. 0.157).
The exclusion restriction in these first two specifications featuring exporting- and importing-
country fixed effects and country-pair controls requires that no unobserved country-pair char-
acteristic affects both migration and exports. In standard trade theory, however, large initial
income differences reflect productivity differences which increase exports from rich to poor and
migration from poor to rich countries as the marginal product of labor is equalized in both
countries. In this setting, more migration is negatively correlated with exports and implies a
downward bias on the OLS and the IV, when past migrant stocks are used as an instrument.
To address this potential bias, I introduce ethnic heterogeneity in columns (5)–(8) and use
the constructed initial ethnic match probability as an instrument for migration flows between
two bordering countries. The reduced form estimates suggests, that a one percent higher ethnic
match probability, calculated in precolonial times, increases modern day trade flows by 0.192%
(s.e. 0.080). Similarly, the first stage estimate indicate that higher ethnic match probabilities
imply more migrants in 1990. The resulting IV point estimate suggests that a 1% increase in
the stock of migrants increases trade flows by about 0.739% (s.e. 0.417).14 The point estimates
from the standard approach in column (4) are at least 50% smaller than the estimates using the
approach that incorporates ethnic heterogeneity to the African context (column 6). The results
suggest that migration indeed increases trade and ethnic identification is an important deter-
minant in Africa, even when observing cross-country trade. Similar to well-identified studies on
14In Appendix A.1, I extend the empirical model to allow for trade between all African ethnicities and countries.The point estimates in Table A.1 are statistically indifferent to the baseline, supporting the initial hypothesis.
10

price differences in a narrow setting, ethnic identification also influences the value of exports
and economic integration on the African continent (Aker et al., 2014).
I conclude this set of results by introducing ethnic heterogeneity in the endogenous variable.
By constructing the ethnic match probability using contemporaneous data on ethnic populations
in countries, the migration variable now contains information about ethnic heterogeneity. The
OLS estimates in column (7) suggests that a 1% higher ethnic population in the exporting
or importing country increases bilateral exports by 0.232% (s.e. 0.123). Instrumenting the
contemporaneous match probabilities with the precolonial match probabilities corroborates the
results in column (6) with a similar point estimate (0.665, s.e. 0.279).
Table 1 highlights that while migration increases bilateral trade, using past migration as an
instrument likely violates the exclusion restriction due to initial income differences that shape
both migration and trade. Properly accounting for these differences using precolonial measures
of ethnic heterogeneity then increases the estimated elasticity from 0.260 to 0.739. However,
as the degree of ethnic connectivity between two neighboring countries may impact bilateral
conflicts and politics, other violations of the exclusion restrictions are possible. I investigate this
possibility in the mechanisms section, but focus on reduced form estimates in the remainder of
the paper.
Effects on sub-national development The uniqueness of the African context allows me
to infer on the spatial distribution of the gains from trade. As bilateral trade flows, especially
in Africa, are usually between capitals or major cities, I aim at identifying whether ethnic
homelands benefit from increased exports. However, as bilateral trade is part of the national
GDP and hence hard to disentangle, I focus on sub-national gains from trade using nighttime
light emissions.
Nighttime lights in a region has been found to be a valid proxy for regional GDP (Michalopou-
los and Papaioannou, 2013; Henderson et al., 2012) and has frequently been used to study
sub-national development in Africa.15 Thus, I use nighttime luminosity to estimate the effects
of exports on the spatial distribution of the gains from trade in Table 2. A 1% increase in
exports is correlated with a 0.385% (s.e. 0.165) increase in nighttime luminosity of the ethni-
15In this study I use nighttime light data from NOAA available under http://ngdc.noaa.gov/eog/dmsp/
downloadV4composites.html. The recorded measure ranges from 0–63 and is available from 1992–2010. Ireplicate these findings at the country level in Table B.2. Average nighttime light emitted per country is astrong predictor of per capita GDP, controlling for population, country characteristics, and conflicts. Includingcountry fixed effects (column 4), a 1% higher nighttime luminosity is correlated with a 0.472% (s.e. 0.054) higherper capita GDP. Additionally, including year fixed effects confines the variation to the country-year level anddecreases the point estimate and increases the noise (column 5).
11

cally connected regions of the exporting country. Instrumenting exports with the ethnic match
probability in column (2) suggests that a one percent increase in exports increases sub-national
GDP in the ethnic homeland by 1.464% (s.e. 0.622). Following Henderson et al. (2012) and
using the time dimension in column (3) yields the same conclusion with a lower point estimate
of 0.537 (s.e. 0.223). Compared to the estimated impact of total country exports on nighttime
luminosity in the entire country (0.013, s.e. 0.006), the gains from exports induced by a larger
ethnically connected population are overwhelmingly centered inside the ethnic homeland.16 In
the remainder of Table 2, I show that the point estimates are robust when comparing equally
densely populated areas.
The results from Table 1 and 2 indicate the importance of including population heterogeneity
when studying the economic effects of migration. The impacts of migration on exports are
estimated to be about 2.5 times larger than with the conventional approach. Exports are
correlated with increased nighttime luminosity, and the spatial distribution of the gains from
trade are likely concentrated within the ethnic homelands.
4 Instrument validity
For the instrument to recuperate an unbiased estimate of the effect of migration, the exclusion
restriction of the instrument needs to be fulfilled. However, as the exclusion restriction cannot
be tested, I focus on the reduced form estimates for the remainder of the paper. In this section,
I first discuss why the instrument captures an unbiased estimate. Then, I show that these
reduced form estimates are not affected by the choice of the empirical specification, population
figures, or the underlying ethnicity data itself. Having shown the stability of the instrument, I
continue in the mechanisms section to test alternative hypotheses for the question of how ethnic
connectivity affects exports.
A causal link between migration and exports or economic outcomes is questionable if the
initial ethnic match probability has other impacts on conflict, GDP, or government coalitions
which, in turn, affect exports or nighttime luminosity. However, two identification decisions
support such an interpretation. First, I restrict my analysis to split ethnicities and, hence,
violations of the exclusion restriction must come from an intensive rather than an extensive
margin. For example, it has been shown that split ethnicities are more likely to face conflicts
and are worse of economically. Here, a violation of the identification assumption would require
16The point estimate is from the regression: log nighttime lightsi,t = β log Total exportsi,t + δi + δt + εi and isrobust to including per capita GDP.
12

that larger split ethnicities are differently affected than smaller split ethnicities, and that this
difference is correlated with exports. Second, as I include exporter and importer fixed effects
in a cross-country regression, the identification relies solely on country-pair variation. For
example, the history of conflicts within each country is captured by these fixed effects, leaving
country-pair induced conflict variation as the only confounder.
To identify which country-pair characteristics are correlated to the ethnic match probability,
I run the baseline specification using the characteristic as the dependent variable and report the
point estimates in Table 3. Country pairs with a larger ethnic match probability share longer
borders and the centroids of these countries are closer together. Moreover, these countries have
boundaries that are less random as measured by the border fractionalization index of Alesina
et al. (2011).17 However, other relevant characteristics such as the number of ethnic connections,
the judicial language, or colonial histories do not confound the estimate. Estimating all country-
pair controls jointly, the F-Statistic on joint significance is 1.572 and only the length of the shared
border remains significant at the 10% level. In the last rows of Table 3, I estimate whether the
instrument predicts conflict incidence or severity in the border region of this country pair.18
Contrary to the literature on ethnic fractionalization within a country, co-ethnic membership
across countries does not increase conflict incidences or their severity.
Having shown the validity of the instrument itself with regards to various border character-
istics, I show that the point estimate from the reduced form in column (1) of Table 4 is robust
to including country-pair controls (columns 3 and 4) and adding time varying conflict controls
(column 5). To increase the precision of the estimate and put less weight on exporter-importer-
pairs with less informational content, I weight the baseline specification with the number of
times trade is observed between the exporting and importing country in columns (2), (4), and
(5). As a result, the point estimate is unaffected and smaller standard errors indicate less noise
in the estimation. Finally, in column (6) I estimate of the baseline specification using the time
dimension in exports. Here, I include exporter and importer specific year fixed effects to capture
all time varying country characteristics. In the last columns of Table 4 I estimate the baseline
model using the Pseudo-Poisson-Maximum-Likelihood estimator proposed by Santos-Silva and
Tenreyro (2006). In all columns (2)-(8), the point estimates are statistically indifferent to the
baseline specification in column (1).
17The fractionalization index is derived from a regression varying the size of boxes needed to cover the border:log(square count) = α− β log(squaresize). Intuitively, the number of squares needed to cover a straight line canbe approximated by square size−1. Any deviation will lead to a number −1 − δ and a higher fractionalizationindex.
18Conflict data from the Uppsala Conflict Data Program.
13

In Table 5, I control for various measures of the not ethnically connected population to rule
out the possibility that alternative measures of population affect the precision of the instrument.
Including the log population and the non-ethnic match probability in column (4), the point es-
timate is virtually identical to the baseline reported in column (1). However, as the population
data or the underlying Murdock-maps are potentially incorrectly drawn close to country bor-
ders, there may exist ethnicities that are incorrectly coded as split between countries. I drop
ethnicities with a population share of less than 1% in columns (5)–(7) and show that while the
point estimates increase, they are not statistically different from the baseline.
As a last robustness test, I draw upon the Geo-Referencing of Ethnic Groups (GREG) from
the Atlas Narodov Mira created by Russian scientists and digitized by Weidmann et al. (2010).
It shows the geographic dispersion of ethnicities around the world in 1960 and has been used to
study ethnic inequality before. While the two ethnic match probabilities are strongly correlated,
the Murdock map captures more ethnicities at an earlier point in time and, hence, more likely
to fulfill the orthogonality assumption of the instrumental variable estimation. However, as the
GREG map is closer to independence, it is likely that it captures the ethnic composition more
accurately. I repeat the specification tests as well as the IV estimations in Table 6. As the
input is closer in time to the independence of countries and features fewer ethnic groups, the
point estimates are larger and as robust as the original Murdock input. Furthermore, the IV
estimations on exports (column 6) and night time luminosity (column 7) show similar magnitude
as the baseline.
In sum, the results of the robustness suggest a stable relationship between the ethnic match
probability and bilateral trade between African countries. Controlling for border characteristics,
the estimate suggest that a 1% higher initial ethnic match probability increased trade by about
0.2% in the long run.
5 Mechanisms
To provide evidence on how co-ethnic matches can affect bilateral trade I test four compet-
ing hypotheses. The first hypothesis considers the equator belt where many ethnicities were
economically active before independence. In that case, the instrument would only confirm pre-
existing trade patterns in sectors that have been trading long before independence. The second
hypothesis concerns the effects of conflict in Africa. If cross-border ethnic links reduce conflict
incidences, it might raise economic activity and explain the results. The third hypothesis is
that ethnic match probabilities only capture similarities in languages which are larger between
ethnically connected countries. Hence, it is possible that the main impact of migration on trade
14

is via reducing language barriers. Then omitting linguistic similarity constitutes an omitted
variable bias. The fourth hypothesis concerns the literature on the economic effects of institu-
tions in Africa. It is possible that ethnicities with historically stronger institutions are more
likely to participate in contemporaneous governments and instead of using their network, use
government institutions to facilitate trade.
Pre-existing trade patterns I approach the first hypothesis of trade in preference goods
that predates independence from three angles: (i) show that the effect of ethnic matches is
stable across all sectors, (ii) document that these ethnic matches increase the amount of goods
traded as well as the number of sectors in which they are traded, and (iii) demonstrate that no
country from the equator belt has a large impact on the estimation. Combined, these results
indicate that co-ethnic connections do not only reflect trade in preference goods and likely
increase the flow of information across countries. This hypothesis is supported by the evidence
on the extensive margins of trade, as more sectors are actively trading.
The effect on increased trade might only capture pre-existing trade patterns for habitual
goods or document a similarity of preferences for certain goods. Such preference goods were
likely traded already before the independence of countries and, hence, the external validity
of the impact of migration on exports would be limited. As it is likely that these goods are
concentrated in the agricultural sector and not in other sectors, I evaluate the reduced form
impact in all sectors in Figure 4. Here, as the instrument has no differential impact in the
agricultural sector as compared to other sectors, a preference driven story is not supported
by the data at hand. Also, if preference goods are more likely to be traded undetected, the
point estimates presented here are lower bounds of the true impact of cross-border ethnicities
on economic outcomes.
In contrast, the largest impacts are found in industrial sectors where information and trust
are more important than preferences. If these co-ethnic connections do facilitate trade via
decreasing information costs, exports should be more diverse in areas with larger ethnic match
probabilities. In Table 7, I provide evidence in favor of decreasing information costs using data
disaggregated into two-digit industries (SIC-2) for 1989–2014 and four-digit industries (SIC-4)
for 2010–2014. Country pairs with larger ethnic match probabilities have more sectors actively
trading. Compared to the relevant mean, we observe about 2-3% more sectors actively trading,
suggesting that ethnic connections across countries in Africa increase trade at the extensive
margin as well.
As the densely populated equator belt contains many ethnicities across many countries which
were economically active before colonization, the instrument might reflect this initial economic
15
activity. In Figure 3, I omit individual countries from the baseline specification to estimate
their impact in the regression. The low point estimates for Angola and Zambia indicate that
these countries have larger effects than the remaining countries. However, since the country
borders for Angola are mostly straight lines and neither country belongs to the belt, Figure 3
provides no evidence in favor of a hypothesis based on pre-existing trade patterns.
Since the ethnic match probability affects all sectors and increases the number of sectors
trading, a hypothesis based on pre-existing trade routes based on preferences is unlikely. This
conclusion is supported by the result that no country from a densely populated area with a rich
history of trade affects the point estimates significantly.
Conflict In the second hypothesis, I test whether an increased ethnic connectedness is asso-
ciated with less conflict, which, in turn, increases the economic activity (Table 8). In addition
to the null result on country wide conflict severity when testing for balance (Table 3), I use
geocoded conflict data from the Uppsala Conflict Data Program and identify conflict intensity
inside the homelands of cross-border ethnicities. If ethnic connectedness increases trade by
reducing conflict incidence, the interaction of ethnic match probability with conflict incidence
should have a positive point estimate and decrease the main estimate. However, including the
interaction with conflict incidence or conflict severity in the exporter country, importer country,
or both jointly, does not affect the point estimate on ethnic connectedness throughout Table
8 and all interaction effects are insignificant, suggesting no heterogeneous effects. Addition-
ally, I find no evidence that the ethnic match probability predicts conflict (last row). In sum,
the evidence from Table 8 suggests no direct channel of ethnicities affecting conflict and hence
exports.
Linguistic similarity In the third hypothesis, I argue that two more ethnically connected
countries are likely to have more similar languages and cultures. Then, an increased ethnic
match probability might just reflect countries that are trading more because of similarity, and
not because of migration or ethnicities. To obtain a measure beyond sharing a judicial language,
I use data from Spolaore and Wacziarg (2015) that captures the linguistic similarity between a
subset of country pairs in Africa as a measure between zero and one. In this subset, the point
estimate is largely unchanged from the baseline with controls (Table 9, column 1). As suspected,
a larger ethnic match probability is associated with a larger linguistic similarity (column 2).
However, including the level effect and the interaction with the ethnic match probability does
not affect the point estimate. To test the hypothesis that ethnically more connected regions
trade more because of linguistic similarity, I report the interaction term in column (4). Here,
16

the point estimates are unaffected and the point estimate on the interaction is insignificant,
suggesting no heterogeneous effects of linguistic similarity.
Combining the previous three hypothesis: (i) the positive effects on the extensive margin
of trade, (ii) the null-effect on conflict and, (iii) linguistic similarity, the evidence suggests
that ethnic connections between countries are likely to work by providing information and
increasing trust between business partners. However, as government institutions should alleviate
problems of mistrust between business partners, the question remains whether these government
institutions complement or substitute ethnic connections across country borders.
Government participation and institutions It is entirely possible that governments build
on their ethnic connections to foster trade. However, it is equally likely that ethnicities trade
with their counterparts in other countries, as they are actively discriminated against or excluded
from power. I use data from the Ethnic Power Relations data set to identify the political status
of cross-border ethnicities in Africa in Table 10 (Wimmer et al., 2009).19 Unfortunately, the
sample is severely reduced, but the main effect is robust to any definition of political status
(columns 2–4). While the political status variable ranges from being discriminated to being the
dominant ethnicity (column 2), I vary the definitions to increase power and show robustness
(columns 3 and 4). Using the definitions of the data, the impact of being discriminated or
being a senior partner is lower compared to the baseline of ethnic groups as junior partners.
This suggests that on the one hand, ethnicities at least need some economic freedom, and on
the other hand, ethnic groups use the tools of the government when they are at their disposal.
Ethnic groups with considerable political power have a 60% lower impact on exports, which
implies that they either use their political power to foster trade with other countries, or trade
more within their own country. As the former is picked up by the country fixed effects, and the
latter is unobservable, I cannot disentangle the two. However, it is clear that ethnicities that
are not an influential part of government coalitions are likely to have a large effect on trade.
Whether ethnicities are part of governmental coalitions is likely influenced by their precolo-
nial institutions. If an ethnic group had the organizational structure to manage cities and a
political system, it is likely to take part in politics and coalitions. I use data from Michalopoulos
and Papaioannou (2013) on precolonial ethnic institutions and show that while the point esti-
mate is not affected when controlling for such institutions, the interaction effects on political
centralization confirm the results from contemporaneous governmental coalitions (Table 11).
19I exclusively focus on cross-border ethnicities, as I am interested in their political status, and not the statusof an ethnicity that is not split, or irrelevant for this country pair.
17

Historically, more politically centralized ethnicities have a smaller effect on contemporaneous
exports, likely because they are more likely to participate in governments.20 In turn, if these
ethnic groups then use government institutions to foster their economic development, this will
explain the decreased impact on trade when they are part of government coalitions.
Country pairs with many cross-border ethnic groups are likely to have similar preferences and
hence, their governments might work to form preferential trade agreements which are conducive
to trade. Indeed, larger ethnic match probabilities are associated with more preferential trade
agreements (Table 12, column 1) which, in turn, facilitate trade (column 2). However, including
the endogeneous formation of preferential trade agreements (column 4), or interacting it with the
instrument, does not affect the point estimate of ethnic match probabilities. The insignificant
interaction suggests no heterogeneous effects of preferential trade agreements, which is consistent
with the results on government coalitions, indicating that ethnic groups inside ruling coalitions
are more likely to rely on institutions, rather than their connections, to facilitate trade.21
Consistent with a model of international trade, where ethnic migration decreases the fixed
cost of exporting, a higher likelihood of ethnic matches across country pairs is associated with
more trading along the intensive and extensive margin. Every sector of trade benefits, consistent
with a hypothesis where ethnic networks across countries decrease information costs or increase
the enforcement of cross country contracts. When these ethnicities are part of government
coalitions, evidence suggests that institutions act as substitutes to such networks and become
more important.
6 Conclusion
In this paper, I provide two pieces of evidence that add to our understanding of African eco-
nomic development. First, I document the positive effects of migration on bilateral exports and
African economic development. The estimated effects of migration on trade are larger in large
parts due to the African context, where ethnic identification is a key determinant in economic
transactions. The second result concerns the reduced form effect of how ethnic connectedness
between countries increases exports. I provide evidence against hypotheses based on preferences,
conflict, and linguistic similarity, and show that the most likely mechanism is government exclu-
20Cross referencing the data from Wimmer et al. (2009) and Michalopoulos and Papaioannou (2013) only leadsto 103 ethnicities in 15 countries. More historically centralized ethnicities are 50% more likely to have gainedpower in the years 1989–2010. The results are not shown.
21The same conclusion is drawn when using the number of border crossings per country pair as an indicator ofthe ‘willingness to trade’. While increasing trade, the point estimate of the instrument remains unchanged andI find no evidence of an heterogeneous effect.
18

sion. Ethnicities which are excluded from government participation show the strongest impacts
on trade. I argue that ethnicities divert their economic activity to other countries when they
are being discriminated against. In line with research on price dispersion (Aker et al., 2014), I
find evidence in favor of information being transmitted and higher within-group trust that fa-
cilitates transactions. In light of the vast amount of research done on the negative development
outcomes of the ‘scramble for Africa’ (Alesina et al., 2016; Michalopoulos and Papaioannou,
2016), this paper provides evidence for a more nuanced view on its outcomes in Africa.
References
Acemoglu, D., S. Johnson, and J. A. Robinson (2001). The colonial origins of comparative
development: An empirical investigation. American Economic Review 91 (5), 1369–1401.
Aker, J. C., M. W. Klein, S. A. O’Connell, and M. Yang (2014). Borders, ethnicity and trade.
Journal of Development Economics 107 (1), 1–16.
Alesina, A., W. Easterly, and J. Matuszeski (2011). Artificial states. Journal of the European
Economic Association 25, 246–277.
Alesina, A., S. Michalopoulos, and E. Papaioannou (2016). Ethnic inequality. Journal of
Political Economy .
Anderson, J. E. (1979). A theoretical foundation for the gravity equation. American Economic
Review 69 (1), 106–116.
Axtell, R. L. (2001). Zipf distribution of U.S. firm sizes. Science 293 (5536), 1818–1820.
Bandyopadhyay, S., C. c. Coughlin, and H. J. Wall (2008). Ethnic networks and US exports.
Review of International Economics 16, 199–213.
Bates, R. H. (2008). When Things Fell Apart: State Failure in Late-Century Africa. Cambridge
University Press.
Battisti, M., G. Peri, and A. Romiti (2016). Dynamic effects of co-ethnic networks on immi-
grants’ economic success. NBER Working Paper (22389).
19

Burchardi, K., T. Chaney, and T. Hassan (2018). Migrants, ancestors, and investments. The
Review of Economic Studies.
Burgess, R., R. Jedwab, E. Miguel, A. Morjaria, and G. Pardo i Miguel (2015). The value
of democracy: Evidence from road building in Kenya. American Economic Review 105 (6),
1817–1851.
Chaney, T. (2008). Distorted gravity: The intensive and extensive margins of international
trade. American Economic Review 98 (4), 1707–1721.
Chaney, T. (2016). Liquidity constrained exporters. Journal of Economic Dynamics and Con-
trol 72, 141–154.
Clochard, G. and G. Hollard (2018). Africa’s growth tragedy, 20 years on. Working Paper .
de la Sierra, R. S. and J.-P. Z. Mutakumura (2014). On the impact of states: Contract enforce-
ability and ethnic institutions in East Congo. Working Paper .
Dercon, S. and R. Gutierrez-Romero (2012). Triggers and characteristics of the 2007 Kenyan
electoral violence. World Development 40 (4), 731–744.
Dunlevy, J. A. (2006). The influence of corruption and language on the protrade effect of
immigrants: Evidence from the American states. Review of Economics and Statistics 88 (1),
182–186.
Dunlevy, J. A. and W. K. Hutchinson (1999). The impact of immigration on American import
trade in the late nineteenth and ealry twentieth centuries. Journal of Economic History 59,
1043–1062.
Eifert, B., E. Miguel, and D. N. Posner (2010). Political competition and ethnic identification
in Africa. American Journal of Political Science 54 (2), 494–510.
Fafchamps, M. (2003). Ethnicity and networks in African trade. Contributions to Economic
Analysis and Policy 2 (1).
Fafchamps, M. and F. Gubert (2007). Risk sharing and network formation. American Economic
Review 97 (2), 75–79.
Felbermayr, G. J., B. Jung, and F. Toubal (2010). Ethnic networks, information, and interna-
tional trade: Revisiting the evidence. Annals of Economics and Statistics 98 (4), 41–70.
20

Felbermayr, G. J. and F. Toubal (2012). Revisiting the trade-migration nexus: Evidence from
new OECD data. World Development 40 (5), 928–937.
Fenske, J. and I. Zurimendi (2017, Dec). Oil and ethnic inequality in nigeria. Journal of
Economic Growth 22 (4), 397–420.
Gould, D. M. (1994). Immigrant links to the home country: Empirical implications for U.S.
bilateral trade flows. Review of Economics and Statistics 76, 302–316.
Grossman, G. M., E. Helpman, and A. Szeidl (2006). Optimal integration strategies for the
multinational firm. Journal of International Economics 70 (1), 216–238.
Henderson, J., A. Storeygard, and D. N. Weil (2012). Measuring economic growth from outer
space. American Economic Review 102 (2), 994–1028.
Herander, M. G. and L. A. Saavedra (2005). Exports and the structure of immigrant-based
networks: The role of geographic proximity. Review of Economics and Statistics 87, 323–335.
Hjort, J. (2014). Ethnic divisions and production in firms. Quarterly Journal of Eco-
nomics 129 (4), 1899–1946.
Krautheim, S. (2012). Heterogenous firms, exporter networks and the effect of distance on
international trade. Journal of International Economics 87 (1), 27–35.
McKenzie, D. and H. Rapoport (2007). Network effects and the dynamics of migration and
inequality: Theory and evidence from Mexico. Journal of Development Economics 84, 1–24.
Melitz, M. J. (2003). The impact of trade on intra-industry reallocations and aggregate industry
productivity. Econometrica 71 (6), 1695–1725.
Michalopoulos, S. and E. Papaioannou (2013). Pre-colonial ethnic institutions and contempo-
rary African development. Econometrica 81 (1), 113–152.
Michalopoulos, S. and E. Papaioannou (2014). National institutions and subnational develop-
ment in Africa. Quarterly Journal of Economics 129 (1), 151–213.
Michalopoulos, S. and E. Papaioannou (2016). The long-run effects of the scramble for Africa.
American Economic Review 106 (7), 1802–1848.
Moulton, B. (1986). Random group effects and the precision of regression estimates. Journal
of Econometrics 32 (3), 385–397.
21

Munshi, K. (2003). Networks in the modern economy: Mexican migrants in the U.S. labor
market. Quarterly Journal of Economics 118 (2), 549–599.
Murdock, G. (1959). Africa: Its Peoples and Their Culture History. New York: McGraw-Hill.
Nunn, N. and D. Puga (2012). Ruggedness: The blessing of bad geography in Africa. Review
of Economics and Statistics 94 (1), 20–36.
Nunn, N. and L. Wantchekon (2011). The slave trade and the origins of mistrust in Africa.
American Economic Review 101 (7), 3221–3252.
Olken, B. and P. Barron (2009). The simple economics of extortion: Evidence from trucking in
Aceh. Journal of Political Economy 117 (3), 417–452.
Partridge, J. and H. Furtan (2008). Immigration wave effects on Canada’s trade flows. Canadian
Public Policy 34 (2), 193–214.
Peri, G. and F. Requena-Silvente (2010). The trade creation effect of immigrants: Evidence
from the remarkable case of Spain. Canadian Journal of Economics 43 (4), 1433–1459.
Rauch, J. E. (1999). Networks versus markets in international trade. Journal of International
Economics 48, 7–35.
Rauch, J. E. and V. Trindade (2002). Ethnic Chinese networks in international trade. Review
of Economics and Statistics 84 (1), 116–130.
Santos-Silva, J. and S. Tenreyro (2006). The log of gravity. Review of Economics and Statis-
tics 88 (4), 641–658.
Spolaore, E. and R. Wacziarg (2015). Ancestry, language and culture. Working Paper .
Svensson, J. (2003). Who must pay bribes and how much? Evidence from a cross section of
firms. Quarterly Journal of Economics 118 (1), 207–230.
Weidmann, N. B., J. K. Rød, and L.-E. Cedermann (2010). Representing ethnic groups in space:
A new dataset. Journal of Peace Research 47 (4).
White, R. (2007). Immigrant-trade links, transplanted home bias and network effects. Applied
Economics 39, 839–852.
Wimmer, A., L.-E. Cederman, and B. Min (2009). Ethnic politics and armed conflict. A con-
figurational analysis of a new global dataset. American Sociological Review 74 (2), 316–337.
22

Appendix
Figure 1: Input data
Identification assumption i): Variation in the main explanatory variable. This figure shows thedistribution of ethnicities before colonization as recorded by (Murdock, 1959). Every countryfeatures at least one split ethnicity, and every border splits at least one ethnicity.
Figure 2: Rivers as confounders
Identification assumption ii): Borders were set without sufficient knowledge of local geography.As an example, while rivers are easily observable, most country borders have no rivers (black)and only few contain parts of a river (red).
23

Figure 3: Sensitivity analysis
Point estimates from leaving out individual countries from the baseline specification.
Figure 4: Heterogeneity across sectors
Identifying the impact of the ethnic match probabilities on bilateral trade in various sectors.
24
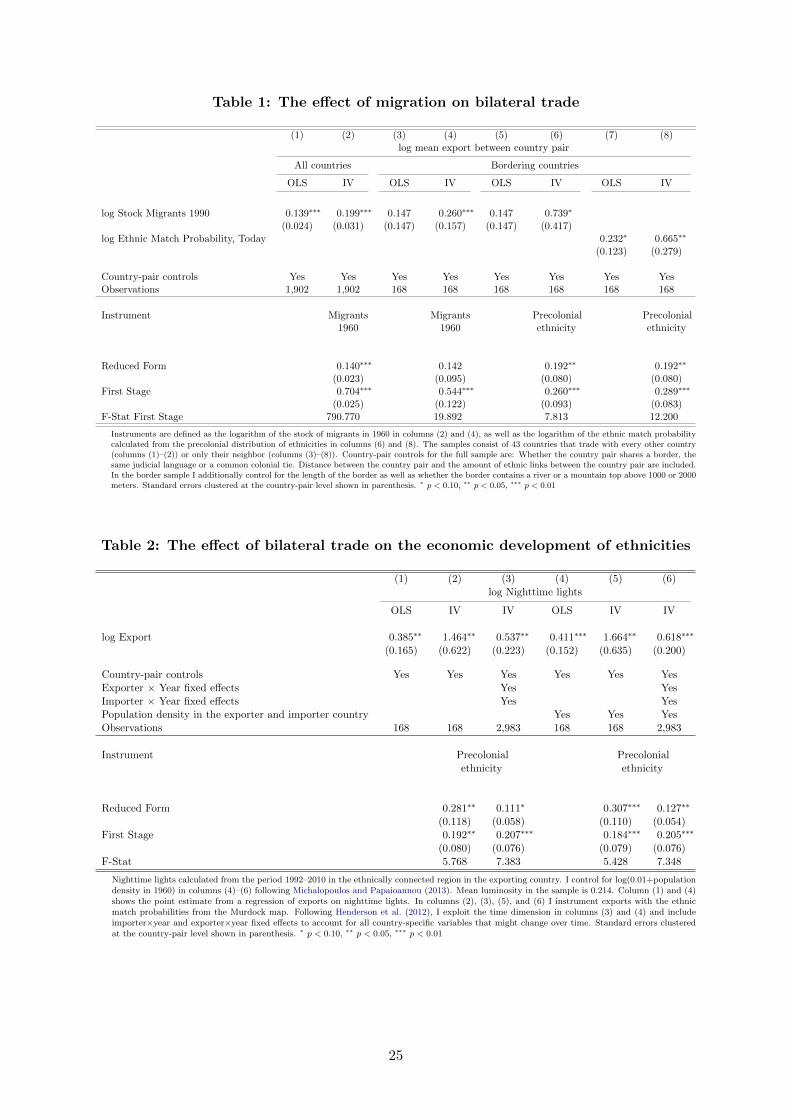
Table 1: The effect of migration on bilateral trade
(1) (2) (3) (4) (5) (6) (7) (8)log mean export between country pair
All countries Bordering countries
OLS IV OLS IV OLS IV OLS IV
log Stock Migrants 1990 0.139∗∗∗ 0.199∗∗∗ 0.147 0.260∗∗∗ 0.147 0.739∗
(0.024) (0.031) (0.147) (0.157) (0.147) (0.417)log Ethnic Match Probability, Today 0.232∗ 0.665∗∗
(0.123) (0.279)
Country-pair controls Yes Yes Yes Yes Yes Yes Yes YesObservations 1,902 1,902 168 168 168 168 168 168
Instrument Migrants1960
Migrants1960
Precolonialethnicity
Precolonialethnicity
Reduced Form 0.140∗∗∗ 0.142 0.192∗∗ 0.192∗∗
(0.023) (0.095) (0.080) (0.080)First Stage 0.704∗∗∗ 0.544∗∗∗ 0.260∗∗∗ 0.289∗∗∗
(0.025) (0.122) (0.093) (0.083)F-Stat First Stage 790.770 19.892 7.813 12.200
Instruments are defined as the logarithm of the stock of migrants in 1960 in columns (2) and (4), as well as the logarithm of the ethnic match probabilitycalculated from the precolonial distribution of ethnicities in columns (6) and (8). The samples consist of 43 countries that trade with every other country(columns (1)–(2)) or only their neighbor (columns (3)–(8)). Country-pair controls for the full sample are: Whether the country pair shares a border, thesame judicial language or a common colonial tie. Distance between the country pair and the amount of ethnic links between the country pair are included.In the border sample I additionally control for the length of the border as well as whether the border contains a river or a mountain top above 1000 or 2000meters. Standard errors clustered at the country-pair level shown in parenthesis. ∗ p < 0.10, ∗∗ p < 0.05, ∗∗∗ p < 0.01
Table 2: The effect of bilateral trade on the economic development of ethnicities
(1) (2) (3) (4) (5) (6)log Nighttime lights
OLS IV IV OLS IV IV
log Export 0.385∗∗ 1.464∗∗ 0.537∗∗ 0.411∗∗∗ 1.664∗∗ 0.618∗∗∗
(0.165) (0.622) (0.223) (0.152) (0.635) (0.200)
Country-pair controls Yes Yes Yes Yes Yes YesExporter × Year fixed effects Yes YesImporter × Year fixed effects Yes YesPopulation density in the exporter and importer country Yes Yes YesObservations 168 168 2,983 168 168 2,983
Instrument Precolonialethnicity
Precolonialethnicity
Reduced Form 0.281∗∗ 0.111∗ 0.307∗∗∗ 0.127∗∗
(0.118) (0.058) (0.110) (0.054)First Stage 0.192∗∗ 0.207∗∗∗ 0.184∗∗∗ 0.205∗∗∗
(0.080) (0.076) (0.079) (0.076)F-Stat 5.768 7.383 5.428 7.348
Nighttime lights calculated from the period 1992–2010 in the ethnically connected region in the exporting country. I control for log(0.01+populationdensity in 1960) in columns (4)–(6) following Michalopoulos and Papaioannou (2013). Mean luminosity in the sample is 0.214. Column (1) and (4)shows the point estimate from a regression of exports on nighttime lights. In columns (2), (3), (5), and (6) I instrument exports with the ethnicmatch probabilities from the Murdock map. Following Henderson et al. (2012), I exploit the time dimension in columns (3) and (4) and includeimporter×year and exporter×year fixed effects to account for all country-specific variables that might change over time. Standard errors clusteredat the country-pair level shown in parenthesis. ∗ p < 0.10, ∗∗ p < 0.05, ∗∗∗ p < 0.01
25

Table 3: Instrument validity: Covariate checks
Mean Std. Dev. Observations β s.e.
Country-pair controls:log Border length 6.405 0.715 168 0.114∗∗∗ (0.037)log Distance 6.052 1.805 168 −0.148∗ (0.088)Border with eiver 0.601 0.491 168 0.022 (0.022)# ethnic connections 3.548 1.999 168 0.114 (0.115)Same judicial language 0.161 0.368 168 0.005 (0.029)Shared colonial history 0.411 0.493 168 −0.004 (0.018)log Border fractionalization −0.004 0.026 168 0.002∗∗ (0.001)Border with mountain top ≥ 1000m 0.536 0.500 168 0.021 (0.029)Border with mountain top ≥ 2000m 0.173 0.379 168 0.010 (0.017)
F-Stat on joint significance: 1.572Conflict controls:log Conflicts 6.039 1.760 168 0.043 (0.047)log Civilian deaths 7.366 2.322 168 0.043 (0.065)log Deaths 7.156 2.918 168 0.033 (0.083)log Unknown deaths 6.731 2.672 168 0.030 (0.066)
F-Stat on joint significance (incl. border country-pair controls): 1.765
I report β from the regression of the ethnic match probability on the variable in the first column. Fractionalizationmeasure by Alesina et al. (2011). Conflict data from the Uppsala Conflict Data Program. Standard errors clusteredat the country-pair level shown in parenthesis. ∗ p < 0.10, ∗∗ p < 0.05, ∗∗∗ p < 0.01
Table 4: The effect of ethnic matches on bilateral exports: Sensitivity to specification
log Exports Exports
(1) (2) (3) (4) (5) (6) (7) (8)
log Ethnic Match Probability 0.135∗ 0.135∗∗∗ 0.192∗∗ 0.175∗∗∗ 0.201∗∗∗ 0.236∗∗∗ 0.118∗ 0.127∗∗
(0.073) (0.050) (0.080) (0.049) (0.047) (0.072) (0.067) (0.062)[0.061] [0.046] [0.060] [0.042] [0.040] [0.039]
Weighted by observed trade Yes Yes Yes YesCountry-pair controls Yes Yes Yes Yes Yes YesConflict controls Yes YesExporter- and importer-year fixed effects YesPPML estimation PPML PPMLObservations 168 3,287 168 3,287 3,287 3,287 168 3,287
Every column shows the point estimate from a regression of ethnic match probabilities on exports. In columns (1) and (2) I estimate the unrestricted, plainmodel with exporter- and importer-country fixed effects. In columns (3)–(8) I include the following country-pair controls: Whether the country pair sharesa border, the same judicial language or a common colonial tie. Distance between the country pair and the amount of ethnic links between the country pairare included. Characteristics of the border feature the length of the border as well as whether the border contains a river or a mountain top above 1000 or2000 meters. In column (5) I include time varying conflict controls that include the logged amount of conflict, civilian casualties, total deaths, and unknowndeaths. In column (6) I include exporter an importer specific year fixed effects to account for all time varying characteristics and regress on the value ofexports in any year between 1989 and 2014. In columns (7) and (8) I estimate the Pseudo-Poisson-Maximum-Likelihood method as suggested in Santos-Silvaand Tenreyro (2006). In columns (2), (4), (5), and (8), I weight every observation with the amount of positive trade observed in the time span 1989–2014to put more weight on observations with more informational content. Standard errors clustered at the country-pair level shown in parenthesis and two-wayclustered standard errors for the exporter and importer country shown in brackets. ∗ p < 0.10, ∗∗ p < 0.05, ∗∗∗ p < 0.01
26

Table 5: Robustness to various population measures and cutoffs
log Exports
Including non ethnic population Excluding minorities in the country pair
(1) (2) (3) (4) (5) (6) (7)
log Ethnic Match Probability 0.192∗∗ 0.196∗∗ 0.189∗∗ 0.194∗∗ 0.268∗ 0.262∗ 0.249∗
(0.080) (0.085) (0.083) (0.091) (0.151) (0.150) (0.128)log Non-Ethnic Population (Exporting Country) 0.161 0.163
(0.139) (0.142)log Non-Ethnic Population (Importing Country) −0.193 −0.192
(0.129) (0.129)log Non-Ethnic Match Probability −0.061 −0.041
(0.180) (0.206)
Country-pair controls Yes Yes Yes Yes Yes Yes YesCutoff in exporting Country: ≥1% ≥1%Cutoff in importing Country: ≥1% ≥1%Observations 168 168 168 168 168 168 168Country pairs with ethnic connections: 152 154 125
Every column shows the point estimate from a regression of ethnic match probabilities on exports. In columns (1)–(7) I include the following country-pair controls:Whether the country pair shares a border, the same judicial language or a common colonial tie. Distance between the country pair and the amount of ethnic linksbetween the country pair are included. Characteristics of the border feature the length of the border as well as whether the border contains a river or a mountaintop above 1000 or 2000 meters. In columns (2) and (4) I include the log population in the exporting and importing country that is not ethnically connected betweenthe countries. In columns (3) and (4) I construct the Non-Ethnic Match Probability in the same way I construct the main explanatory variable. In columns (5)–(7)I exclude ethnicities who make up less than 1% of the population in the exporting or importing country. Standard errors clustered at the country-pair level shownin parenthesis. ∗ p < 0.10, ∗∗ p < 0.05, ∗∗∗ p < 0.01
Table 6: Different input variable: Geo-Referencing of Ethnic Groups (1960)
log Exports log Nighttime lights
(1) (2) (3) (4) (5) (6) (7)
log Ethnic Match Probability, 1960 0.353∗∗∗ 0.297∗∗∗ 0.301∗∗∗ 0.246∗∗∗ 0.389∗∗∗
(0.131) (0.088) (0.107) (0.076) (0.087)log Ethnic Match Probability, Today 0.831∗∗
(0.361)log Exports 0.346∗∗
(0.133)
Weighted by observed trade Yes Yes YesCountry-pair controls Yes Yes Yes Yes YesConflict controls YesIV estimation IV IVControlling for population density YesObservations 164 3,201 164 3,201 3,201 164 164F-Stat 9.665 6.543
Every column shows the point estimate from a regression of ethnic match probabilities on exports. In columns (1) and (2) I estimate the unrestricted,plain model with exporter- and importer-country fixed effects. In columns (3)–(7) I include the following country-pair controls: Whether the countrypair shares a border, the same judicial language or a common colonial tie. Distance between the country pair and the amount of ethnic links betweenthe country pair are included. Characteristics of the border feature the length of the border as well as whether the border contains a river or a mountaintop above 1000 or 2000 meters. In column (5) I include time varying conflict controls that include the logged amount of conflict, civilian casualties,total deaths, and unknown deaths. In columns (2), (4), and (5), I weight every observation with the amount of positive trade observed in the timespan 1989–2014 to put more weight on observations with more informational content. In column (7) I control for population density in the exporterand importer country separately as suggested by Henderson et al. (2012). Standard errors clustered at the country-pair level shown in parenthesis. ∗
p < 0.10, ∗∗ p < 0.05, ∗∗∗ p < 0.01
27

Table 7: Extensive margin of trade: More sectors active in trading
# Sectors trading
SIC-2, 1989-2014 SIC-4, 2000-2014
(1) (2) (3) (4)
log Ethnic Match Probability 0.244∗∗∗ 0.027∗∗∗ 9.705∗∗ 0.147∗∗∗
(0.060) (0.008) (4.037) (0.033)# of Ethnic Connections 0.017 0.005 1.685 0.007
(0.110) (0.011) (5.062) (0.022)
Country-pair controls Yes Yes Yes YesYear fixed effects Yes Yes Yes YesPoisson estimation Yes YesMean # active sectors 11.417 11.417 267.016 267.016Observations 3,287 3,287 925 925
Every column shows the point estimate from a regression of ethnic match probabilitieson exports. In columns (1)–(4) I include year fixed effects and the following country-paircontrols: Whether the country pair shares a border, the same judicial language or acommon colonial tie. Distance between the country pair and the amount of ethnic linksbetween the country pair are included. Characteristics of the border feature the lengthof the border as well as whether the border contains a river or a mountain top above1000 or 2000 meters. In columns (2) and (4) I account for the count structure of thedata and use a poisson maximum likelihood estimation. Standard errors clustered at thecountry-pair level shown in parenthesis. ∗ p < 0.10, ∗∗ p < 0.05, ∗∗∗ p < 0.01
28

Table 8: Heterogeneous effects: Conflict and the effect of ethnic matches on bilateralexports
log Exports
(1) (2) (3) (4) (5) (6) (7) (8) (9)
log Ethnic Match Probability 0.149∗ 0.183∗ 0.158 0.204∗∗ 0.170 0.186 0.153∗∗ 0.206∗∗∗ 0.170∗∗
(0.085) (0.092) (0.096) (0.102) (0.104) (0.115) (0.075) (0.077) (0.072)× Exporter Conflicts 0.019 0.023
(0.029) (0.025)× Importer Conflicts 0.004 −0.008
(0.037) (0.037)× Exporter Deaths −0.004 −0.011
(0.022) (0.019)× Importer Deaths 0.006 0.012
(0.026) (0.027)× Exporter Civilian 0.018 0.020
(0.018) (0.018)× Importer Civilian −0.007 −0.011
(0.023) (0.019)
Level effect included Yes Yes Yes Yes Yes Yes Yes Yes Yes
Country-pair controls Yes Yes Yes Yes Yes Yes Yes Yes Yes
Observations 168 168 168 168 168 168 168 168 168
Exogeneity T-statistic: −0.423 −0.213 −1.422 −1.213 0.330 0.436
Every column shows the point estimate from a regression of ethnic match probabilities on exports, including the conflict data from the Uppsala ConflictData Program. In columns (1)–(3) I include the level and interaction effect of conflict incidence inside the ethnic homeland in the exporting- and importingcountry as defined by the Murdock maps. In columns (4)–(6) I include the level and interaction effect of the amount of deaths inside the ethnic homeland inthe exporting- and importing country as defined by the Murdock maps. In columns (7)–(9) I include the level and interaction effect of the amount of civiliansdead inside the ethnic homeland in the exporting- and importing country as defined by the Murdock maps. In the last row I present the t-statistic from theregression of ethnic match probability on the relevant conflict variable in the exporting- and importing country. In columns (1)–(7) I include the followingcountry-pair controls: Whether the country pair shares a border, the same judicial language or a common colonial tie. Distance between the country pairand the amount of ethnic links between the country pair are included. Characteristics of the border feature the length of the border as well as whether theborder contains a river or a mountain top above 1000 or 2000 meters. Standard errors clustered at the country-pair level shown in parenthesis. ∗ p < 0.10,∗∗ p < 0.05, ∗∗∗ p < 0.01
Table 9: Heterogeneous effects: Linguistic similarity and the effect of ethnic matches onbilateral exports
log Exports Linguistic Similarity log Exports
(1) (2) (3) (4)
log Ethnic Match Probability 0.226∗∗∗ 0.004∗ 0.222∗∗∗ 0.170∗∗
(0.075) (0.002) (0.075) (0.067)Linguistic Similarity 2.356 13.695
(7.272) (8.648)Linguistic Similarity × log Ethnic Match Probability 1.009
(0.609)
Country-pair controls Yes Yes YesObservations 137 137 137 137
Every column shows the point estimate from a regression of ethnic match probabilities on exports. Linguistic Similarity is definedas 1- weighted distance of language as in Spolaore and Wacziarg (2015). Its mean is 0.155 with a standard deviation of 0.107. Incolumns (1), (3), and (4) I include the following country-pair controls: Whether the country pair shares a border, the same judiciallanguage or a common colonial tie. Distance between the country pair and the amount of ethnic links between the country pair areincluded. Characteristics of the border feature the length of the border as well as whether the border contains a river or a mountaintop above 1000 or 2000 meters. Standard errors clustered at the country-pair level shown in parenthesis. ∗ p < 0.10, ∗∗ p < 0.05, ∗∗∗
p < 0.01
29

Table 10: Heterogeneous effects: Government participation and the effect of ethnic matcheson bilateral exports
log Exports
(1) (2) (3) (4)
log Ethnic Match Probability 0.454∗∗∗ 0.659∗∗∗ 0.676∗∗∗ 0.510∗∗∗
(0.112) (0.178) (0.177) (0.142)× Discriminated −0.549∗∗∗
(0.197)× Irrelevant −0.120
(0.425)× Powerless −0.355∗∗
(0.175)× Regional Autonomy −0.200
(0.417)× Senior Partner −0.727∗∗∗
(0.166)× Dominant Ethnicity 0.147
(0.425)× Discriminated −0.430∗∗
(0.206)× Minority or Powerless −0.335∗∗
(0.166)× Senior Partner, Regional Autonomy, or Dominant −0.524∗∗∗
(0.175)× Senior Partner, Regional Autonomy, or Dominant −0.294∗∗∗
(0.108)
Country-pair controls Yes Yes Yes YesYear fixed effects Yes Yes Yes YesObservations 1,282 1,282 1,284 1,284
Every column shows the point estimate from a regression of ethnic match probabilities on exports. Here I matchthe Murdock ethnicities to the ones reported in the ethnic power relations data set (Wimmer et al., 2009) and onlyuse county-pairs where I could match at least one ethnicity. In column (1) I estimate the baseline model in this sub-sample. Columns (3)–(4) are variations of Column (2) with broader definitions of government relations to increasepower. The omitted category in columns (2) and (3) is ‘Junior Partner’ and in columns (4) ‘Discriminated’, ‘Irrel-evant’, ‘Powerless’, and ‘Junior Partner’ In columns (1)–(4) I include the following country-pair controls: Whetherthe country pair shares a border, the same judicial language or a common colonial tie. Distance between the countrypair and the amount of ethnic links between the country pair are included. Characteristics of the border feature thelength of the border as well as whether the border contains a river or a mountain top above 1000 or 2000 meters.Standard errors clustered at the country-pair level shown in parenthesis. ∗ p < 0.10, ∗∗ p < 0.05, ∗∗∗ p < 0.01
30

Table 11: Heterogeneous effects: Historical institutions and the effect of ethnic matcheson bilateral exports
log Exports
(1) (2) (3) (4) (5)
log Ethnic Match Probability 0.182∗ 0.183∗ 0.197∗∗ 0.249∗∗∗ 0.242∗∗
(0.093) (0.092) (0.088) (0.092) (0.099)Ethnicities had Cities 0.262 0.243 0.297
(0.690) (1.166) (1.145)× Ethnicities had Cities −0.003 0.026
(0.189) (0.194)Political Centralization −0.178 −1.882∗∗ −1.884∗∗
(0.513) (0.877) (0.899)× Political Centralization −0.212∗∗ −0.207∗∗
(0.093) (0.099)
Country-pair controls Yes Yes Yes Yes YesObservations 164 164 164 164 164
Every column shows the point estimate from a regression of ethnic match probabilities on exports. Datataken from Michalopoulos and Papaioannou (2013) and coded as follows. ‘Ethnicities had Cities’: If atleast one ethnicity that crosses the border historically had permanent or complex settlements. ‘PoliticalCentralization’ If at least one ethnicity that crosses the border historically had a jurisdictional levelbeyond the local level: Centralized Tribe≥2. ‘Centralized Tribe’ is the count variable of jurisdictionallevel beyond the local level (range: 0-3). In columns (1)–(5) I include the following country-paircontrols: Whether the country pair shares a border, the same judicial language or a common colonialtie. Distance between the country pair and the amount of ethnic links between the country pairare included. Characteristics of the border feature the length of the border as well as whether theborder contains a river or a mountain top above 1000 or 2000 meters. Standard errors clustered atthe country-pair level shown in parenthesis. ∗ p < 0.10, ∗∗ p < 0.05, ∗∗∗ p < 0.01
31

Table 12: Heterogeneous effects: Preferential trade agreements
PTA log Exports
(1) (2) (3) (4) (5)
log Ethnic Match Probability 0.018∗ 0.222∗∗∗ 0.218∗∗∗ 0.196∗∗∗
(0.009) (0.045) (0.044) (0.038)Preferential Trade Agreement 0.403∗ 0.262 1.014∗
(0.235) (0.200) (0.538)× Preferential Trade Agreement 0.116
(0.073)
Country-pair controls Yes Yes Yes Yes YesYear fixed effects Yes Yes Yes Yes YesObservations 3,012 3,012 3,012 3,012 3,012
Every column shows the point estimate from a regression of ethnic match probabilities on exports usingthe panel dimension of the data. In columns (1)–(5) I include the following country-pair controls: Whetherthe country pair shares a border, the same judicial language or a common colonial tie. Distance betweenthe country pair and the amount of ethnic links between the country pair are included. Characteristics ofthe border feature the length of the border as well as whether the border contains a river or a mountaintop above 1000 or 2000 meters. Standard errors clustered at the country-pair level shown in parenthesis.∗ p < 0.10, ∗∗ p < 0.05, ∗∗∗ p < 0.01
32

A Technical Appendix
In this section, I derive a model of international trade with firm and ethnic heterogeneity to
provide a motivation for the main estimation equation (2). My framework draws on Chaney
(2008) and nests the standard model while remaining tractable.
The economy consists of N countries which contain a subset e ∈ E of predefined ethnici-
ties. Not every ethnicity is present in every country. Furthermore, every economy produces a
homogeneous composite good q0, as well as horizontally differentiated goods q(ω). Any firm of
ethnicity e ∈ E producing a heterogeneous good ω ∈ Ω from country i ∈ N , uses its ethnic
counterpart e′ ∈ E in country j ∈ N to maximize the expected profits from selling in market
j ∈ N according to:
πij,ee′(ω) = pij(ω)qij(ω)− cij,ee′(ω) (4)
Where the price of a good pij(ω) is country specific, as is the demand for a good qij(ω).22 τij > 1
represent variable trade costs, denoted as “iceberg trade costs”. A firm needs to produce τij
goods in order to sell one unit in country j. The cost of producing a good cij,ee′(ω) is assumed
to be ethnic dependent in home e and foreign e′ and of the form:
cij,ee′(ω) =τijϕqij(ω) +
(Lj,e′
Lj
)−ηfij (5)
Here, ϕ denotes productivity which every firm draws from a Pareto distribution G(ϕ) =
1 − ϕ−γ .23 γ represents the degree of firm heterogeneity, with increasing values denoting de-
creasing firm heterogeneity. Firms learn about their productivity when drawing from G(ϕ) and,
subsequently, decide to pay country pair specific fixed costs fij in order to serve market j.24
These fixed costs are mitigated by the fraction of the population in country j that is of the same
ethnicity e′ = e ∈ E as the owner of the firm.25 I call the effect of the fraction(Lj,e′Lj
)−ηthe
network effect of ethnic ties. This fraction lies within the unit interval and raised to the power
22Although Aker et al. (2014) show that ethnicities affect the prices between two countries, I assume thatthis is a result of a supply or demand shock. However, including a demand shock here would create a simpledemand shift in the gravitiy equation. Alternatively, one could divide the product space into goods consumed byethnicities which would yield a result similar to including different sectors.
23Following the literature standard I use the Pareto distribution as it mirrors the empirical distributions well(Axtell, 2001) and is notational convenient.
24The cost of producing a good are wages times cij,ee′(ω). Due to the production in the freely traded homoge-neous good q0 wages in both sectors are normalized to unity to simplify the expressions. Furthermore, since thereare infinitely many possible firms of each ethnicity, I can characterize the costs of producing variety ω simply bythe ethnicity and the productivity of the firm ϕ.
25A similar approach has been undertaken by Krautheim (2012) where the fraction is the number of domesticfirms active in the destination market. In the following, I assume that every ethnicity has at least one member inevery country. I can relax this assumption and assume that there is an additional fixed cost to pay when dealingwith non co-ethnic members. The results are robust.
33

of η ∈[0, σ−1
γ
)that gives the importance of ethnic networks in decreasing the fixed costs of
exporting. It can be interpreted as a decreased costs of acquiring information about the market
structure in the destination country or market demand. Alternatively, its interpretation permits
lower payments to government officials because of ethnic ties or it serves a proxy for the general
trust-worthiness of a society. Empirical evidence by Grossman et al. (2006) suggests that factors
like cultural distance and institutional development are particular relevant for the fixed cost of
exporting. Ethnic networks should then be beneficial when firms try to circumvent bureaucratic
hurdles. The larger the hurdles, the larger should be the impact of ethnic networks.
In every country, households maximize their utility according to:
U = q1−µ0
(∫ω∈Ω
q(ω)σ−1σ dω
) σσ−1
µ
(6)
That is, they consume a freely traded homogeneous good q0 and consume every available variety
of the heterogeneous good ω. The share of income spent on the heterogeneous good is given
by µ and the elasticity of substitution is given by σ > 1. Standard results lead to a pricing of
pij(ϕ) = σσ−1
τijϕ and a demand:
qij(ϕ) = pij(ϕ)−σP σ−1j µ
(1 +
Π
L
)Lj . (7)
Here,(1 + Π
L
)Lj denotes the fraction of world capital Π and labor L income that belongs
to country j.26 Hereof, a fraction µ is spend on heterogeneous goods. Combining the profit
function, pricing and demand yield the ethnicity dependent productivity cutoff above which
firms start to export due to non-negative profits πij,ee′ ≥ 0:
ϕ∗ij,ee′ =
(σ
σ − 1
)τijPj
[µ
σ
(1 +
Π
L
)Lj
] 11−σ
(Lj,e′
Lj
) η1−σ
f1
σ−1
ij (8)
The price index Pj can be solved explicitly by summing all prices from all exporting countries
together, taking their productivity cutoffs into account.27 Then, the productivity cutoff can be
expressed in terms of primitives:
ϕ∗ij,ee′ =
[γ
γ − (σ − 1)
] 1γ[µ
σ
(1 +
Π
L
)]− 1γ
Lη−1γ
j
τijθjf
1σ−1
ij (Lj,e′)η
1−σ (9)
26Due to the sector that produces the homogeneous goods, wages are driven down to unity.
27Pj =
(∑Nk=1 Lk
∑e∈E
∫∞ϕ∗kj,ee′
(σσ−1
τkjϕ
)1−σdG(ϕ)
) 11−σ
.
34

As in Chaney (2008), the total foreign population decreases the cutoff due to market size
effects Lη−1γ
j . This effect is dampened by ηγ because the ethnic population has a stronger effect
on the cutoff than the total population.28 θ denotes the multilateral resistance term that
approximates how distant a market is in comparison to all other markets.29 Equation (9)
suggests that much of the ethnic network effect will work through the extensive margin of
trade. If the fixed costs of exporting are higher due to corruption, the cutoff for ethnically
connected and non-connected firms increases, but to a lesser extent for the former group.30
In order to obtain a testable equation, I aggregate individual demand31 to an network
extended gravity equation:
Xij = µ
(1 +
Π
L
)Ljf
σ−1−γσ−1
ij
(τijθj
)−γ ∑e∈Ei∩Ej
Li,e(Lj,e′)η(σ−1−γ)
1−σ (10)
Total exports between any pair of countries increase in market size µ(1 + Π
L
)Lj and mul-
tilateral resistance θ and decrease in variable trade cost τij and fixed costs fij . The network
term is increasing the total trade flows since ν ≡ η(σ−1−γ)1−σ ∈ [0, 1) in order to obtain interior
solutions for the system of equations.32 If the number of ethnicities is greater then the number
of countries, the system of equations is under-identified and individual parameters in ν cannot
be identified. A way around is to assume specific values for ν and conduct sensitivity analy-
ses. Specifically, if ν takes on the value one, the ethnic network variable leads to a search and
matching interpretation and gives the likelihood that two randomly selected firms from both
countries are of the same ethnicity, when controlling for population size.
The introduction of ethnic heterogeneity in the framework of Melitz (2003) and Chaney
(2008) introduced a second source of heterogeneity that creates a particular feature regarding
28The original cutoff in Chaney (2008) can be recovered by setting η = 0. The effect of the foreign ethnicpopulation is greater since η
γ< η
σ−1due to the assumption γ > σ − 1 that guarantees interior solutions.
29θj =
[∑Nk=1 f
σ−1−γσ−1
kj τ−γkj∑e∈E Lk,e(Lj,e)
η(σ−1−γ)1−σ
]− 1γ
. A popular example is the comparison between Por-
tugal and Spain with New Zealand and Australia. Similar in terms of GDP, the latter trade relatively more witheach other due to their distance to all other markets in the world.
30Putting it differently, in a world where all the fixed cost consist of corruption and trust, the ethnic networksare paramount to exporting. We should observe only ethnically connected firms. A similar exercise can be doneby changing the cost function into a part which is ethnic dependent (trust and corruption) and a part that isnon ethnic dependent. Then ethnic networks do not matter when there is no ethnic dependent fixed costs, butmatter a lot when there is no non ethnic dependent fixed cost.
31Xij = Li∑e′=e∈E
Li,eLi
∫∞ϕ∗ij,ee′
dG(ϕ), whereLi,eLi
is the ethnic fraction in country i. An alterna-
tive summation would be to include the non ethnic population in foreign and their cutoffs: Xij =
Li
[∑e∈Ei∩Ej
Li,eLi
∫∞ϕ∗ij,ee′
dG(ϕ) +∑e′ 6=Ei∩Ej
Li,eLi
∫∞ϕ∗ij,ee′
dG(ϕ)
]. The second term would be condensed to the
part in Chaney (2008).32I further require that γ > (σ − 1) and η < (σ−1)
γto guarantee an interior solution.
35

export decisions. Firms owned by an ethnic minority might first export to other markets and
only later serve their home market. This feature is similar to capital-constraint firms that
cannot export in Chaney (2016) and implies imperfect selection into exporting. Firms that
export might have lower productivity than firms that do not and, thus, create welfare losses.
The empirical equivalent of this equation is given by:
log(Xij,t) = β log
E∑e∈i∩j
Li,e(Lj,e′)η(σ−1−γ)
1−σ
+Bij,t + δi + δj + εij,t (11)
Since the importer and exporter fixed effect also capture population in each country and
(Lj × Li)−1 = − logLj − logLi one can rewrite the equation as:
log(Xij,t) = β log
E∑e∈i∩j
Li,eLi×
(Lj,e′)η(σ−1−γ)
1−σ
Lj
+Bij,t + δi + δj + εij,t (12)
which as η(σ−1−γ)1−σ → 1 approaches equation (2). This equation can be interpreted as a search
and matching model, where the population in the importing country has to incur a penalty,
thus needs a larger population to have the same effect on trade as the exporting population.
A.1 Inter-ethnic Trade
So far I assumed that connections can only exist within ethnicities and neglected the possibilities
of inter-ethnic connections. Here, I relax this initial assumption and assume that every ethnicity
has an implicit (weak) ranking of every other ethnicity. Then, for every ethnicity I can order the
other ethnicities according to the cost they have to incur in order to conduct business with them.
This cost is similar to the fixed costs discussed earlier, in the sense that it reflects learning costs
between ethnicities. Therefore, I assume there exists a matrix FE×E that reflects this ordering
between every possible combination of ethnicities. The cost of producing and exporting are
then given by:
cij,ee′(ϕ) =τijϕqij(ϕ) +
(Lj,e′
Lj
)−ηfijfij,ee′ (13)
with fij,ee′ being an element from FE×E . Here bilateral fixed costs are disentangled from
ethnic specific cost. Every firm has to incur bilateral fixed costs to set up the firm, but also
36

have to invest in ethnic relations in order to mitigate the additional ethnic specific fixed costs.33
The gravity equation is then given by:
Xij = Ljµ
(1 +
Π
L
)f
1− γσ−1
ij
(τijθj
)−γ ∑e∈E∩E′
Li,e(Lj,e′)η(σ−1−γ)
1−σ f1− γ
σ−1
ij,ee′ (14)
Now, the effect of ethnic match probabilities is not only measured within ethnicities, but also
between ethnicities. If the fixed costs of creating ties between ethnicities are low enough, this
specification should fit the data better. Combining the findings on the extensive margin formu-
lation and the ethnic specific fixed costs, ethnicities have a two fold effect on trade flows. They
increase the number of firms exporting in distrustful environments by affecting the extensive
margin. However, trade volumes between two countries are negatively affected by the ethnic
specific fixed costs. Then if these fixed costs represent trust or corruption issues, the above
model puts a strong emphasis on reducing corruption and increase trust among ethnicities.
Table A.1: Inter-ethnic networks: Using the distance between ethnicities to proxy for thecost it takes to create trust
log Exports
Border Sample Entire Africa
(1) (2) (3) (4) (5) (6) (7) (8)
log Stock Migration 1990 0.096 0.436∗ 0.139∗∗∗ 0.692∗∗∗
(0.126) (0.228) (0.024) (0.023)log Distance weighted Match Probability 1.192∗∗ 2.734∗∗∗ 2.067∗∗∗ 2.986∗∗∗
(0.593) (0.617) (0.071) (0.079)
Country-pair controls Yes Yes Yes Yes Yes Yes Yes YesIV estimation IV IVObservations 168 168 168 168 1,902 1,902 1,902 1,902F-Test 19.651 1421.488
Country-pair controls included: Distance between the country pair and the amount of ethnic links between the country pair are included. I additionallycontrol for sharing a colonial history, same language, or a border. Standard errors clustered at the country-pair level shown in parenthesis. ∗ p < 0.10,∗∗ p < 0.05, ∗∗∗ p < 0.01
33The basic model is a special case of this case where the off diagonal elements of FE×E are assumed to be sohigh that only within ethnicity connections can occur.
37

B Online Appendix
In order to substantiate claims made in the main text, this sections contains two tables that
show the correlations between various characteristics of ethnicities and their probability of being
split between countries (Table B.1), and the correlations between nighttime luminosity and gdp
(Table B.2).
Table B.1: Determinants of being divided: Historical characteristics of Ethnic groups inMurdock (1959)
Tribe is divided between two or more countries
(1) (2) (3) (4) (5) (6) (7) (8)
log Population in 1960 0.041∗∗∗ 0.008 0.015(0.013) (0.015) (0.021)[0.011] [0.011] [0.017]
log Ethnic Area 0.109 0.138∗∗∗
(0.019) (0.022)[0.013] [0.016]
log Population Density −0.031∗∗ −0.050∗∗∗
(0.015) (0.021)[0.011] [0.014]
Cities −0.087 −0.084 −0.046(0.055) (0.059) (0.060)[0.050] [0.051] [0.049]
Mean Size of Local Communities 0.013 0.020∗ 0.004(0.012) (0.011) (0.011)[0.011] [0.011] [0.011]
Political Centralization 0.036 0.038 −0.072(0.055) (0.053) (0.050)[0.051] [0.051] [0.051]
Geographic Controls Yes Yes Yes Yes Yes Yes Yes YesObservations 833 833 833 441 441 441 441 441Adjusted R-squared 0.022 0.086 0.014 0.017 0.014 0.011 0.038 0.134
Every column shows the point estimate from a regression on the probability of an ethnicity being divided between two or more countries. GeographicControls include latitude, longitude, and their product. log Population in 1960 taken from UNEP SIOUX grid cell data. log Ethnic Area is thetotal expansion area of an ethnicity as given by the Murdock map. Data in columns (4)–(8) taken from Michalopoulos and Papaioannou (2013)and coded as follows. ‘Cities’: If at least one ethnicity that crosses the border historically had permanent or complex settlements. ‘PoliticalCentralization’ If at least one ethnicity that crosses the border historically had a jurisdictional level beyond the local level: Centralized Tribe≥2.‘Centralized Tribe’ is the count variable of jurisdictional level beyond the local level (range: 0-3). Standard errors corrected for spatial correlationwithin 500km shown in parenthesis. Lower cutoffs decrease the standard errors to the robust standard errors level shown in brackets. Symbolsreflect the significance level for spatially corrected standard errors: ∗ p < 0.10, ∗∗ p < 0.05, ∗∗∗ p < 0.01
1

Table B.2: Nighttime lights as a predictor for per capita GDP
log GDP, per capita
(1) (2) (3) (4) (5)
log Average Nighttime lights 0.380∗∗∗ 0.557∗∗∗ 0.553∗∗∗ 0.472∗∗∗ 0.162(0.057) (0.051) (0.053) (0.054) (0.162)
# Ethnicities −0.003 −0.003(0.008) (0.008)
Ruggedness 0.012 0.013(0.055) (0.055)
log country area 0.575∗∗∗ 0.574∗∗∗
(0.064) (0.066)log population in 1960 −0.608∗∗∗ −0.608∗∗∗
(0.098) (0.099)log # Conflicts 0.016 0.018 −0.037∗∗ −0.019
(0.039) (0.040) (0.016) (0.015)log # Civilian Casualties −0.026 −0.021 0.007 0.001
(0.027) (0.026) (0.012) (0.011)
Country Fixed Effects Yes YesYear fixed effects Yes YesObservations 893 874 874 893 893
Average Nighttime lights calculated in the period 1992–2010. # determined by the amount of tribesfrom the Murdock map in a country. Ruggedness taken from Nunn and Puga (2012). Conflicts andCasualties taken from the Uppsala Conflict Database. Standard errors clustered at the country levelshown in parenthesis. ∗ p < 0.10, ∗∗ p < 0.05, ∗∗∗ p < 0.01
2