the dynamic flow air visualization around the
TRANSCRIPT

The dynamic flow air visualization around the petrochemistry petroleum coke plant
MIHAI ŢÃLU
University of Craiova Faculty of Mechanics
Dept. of Applied Mechanics 165 Calea Bucuresti Street, 200585 Craiova
ROMANIA.
DUMITRU BOLCU University of Craiova Faculty of Mechanics
Dept. of Applied Mechanics 165 Calea Bucuresti Street, 200585 Craiova
ROMANIA.
ŞTEFAN ŢÃLU Technical University of Cluj-Napoca.
Faculty of Mechanics Dept. of Descriptive Geometry and E.G.
103-105 B-dul Muncii, 400641 Cluj-Napoca ROMANIA.
AURELIAN SIPOS Croydon College
Dept. of Mathematics & Science College Road
Croydon CR9 1DX United Kingdom
Abstract: - This paper focuses on the simulation and visualization of the 3D aerodynamics flow around the petrochemistry petroleum coke plant. The spatial distributions fields of the velocity, pressure and air density to the impact (collisions) with the structure of installation are given. The numerical simulations permit to simulate real conditions in order to improve accuracy and reliability of predictions. A finite element program was used for analysis and simulation. This may be used in the Computational Fluid Dynamics (CFD) process for the fast and efficient system design. Key-Words: - petrochemistry, petroleum coke plant, aerodynamical flow, numerical simulation, FEM, CFD 1 Introduction Petroleum coke is a carbonaceous solid derived from oil refinery coker. The main uses of petroleum coke include fuel, manufacture of anodes for electrolytic cell reduction of alumina, direct use as chemical carbon source for manufacture of elemental phosphorus, calcium carbide, & silicon carbide and manufacture of graphite [1].
A most used method in petrochemistry industry to obtain the petroleum coke is the tardy carbon – producing. For example in U.S.A. 90 % from the petroleum production coke is based on this method.
In Romania the tardy method of carbon-producing is also frequently used. This types of installations can be found in Romania on the petrochemistry platforms from Darmanesti, Borzesti, Brazi, Midia, Ploiesti and Onesti [2].
An important mechanical stress taken in the design calculus is the eolian loading. This solicitation is tied to the aerodynamically flow around the exterior surface of installation that generates a complex spatial fields of pressure, velocity, density and temperature, which lies at the base of the calculus for eolian force.
The determination of these fields represents a difficult problem and its solving is made using the Mechanics of the Viscose Fluids, individualise on case of the aerodynamically flow around the bodies with complex geometry [3], [4], [5].
In present paper is taken into consideration the physical sizes involved in the Navier-Stokes equation used to describe the dynamical flow of the real fluids [6], [7], [8].
The paper gives the results of study made with aid of the Finite Element Method (F.E.M.) tied to the determination of the spatial distributions of the fields of velocity, pressure and density of air around the surface of the petroleum coke plant [2]. 2 The 3D model of the petroleum coke plant The study is made using the F.E.M. concerning the aerodynamically flow around the petroleum coke plant with a production equal with mC = 385 tones / 48 hours, which is in exploitation beginning with
9th WSEAS International Conference on AUTOMATION and INFORMATION (ICAI'08), Bucharest, Romania, June 24-26, 2008
ISBN: 978-960-6766-77-0 164 ISSN 1790-5117

1996 year in Romania on the petrochemistry platform of oil distillery Onesti.
In design of this type of installation for carbon-producing in groups, there are four identical sections which alternatively work in cycles by 48 hours [2].
Because the plant dimensional sizes are relative big 28000 x 6000 x 6000 mm3 and the geometry is also complex, in paper are given some details of 3D model conceived using the SolidWorks 2007 software [9], starting from the executions drawings of the installation presented in [2].
In figure 1 is shown the frontal view and the top view of the ensemble of installation where is marked the major components.
In fig. 2 is presented the isometric view of the assembling dome – spherical bottom and in fig. 3 a detail view of a reinforcing and supporting ring of the isolation covered together with the nervures of reinforcing.
Figure 1. The petroleum coke plant
taper bottom
support
cylindrical body
spherical bottom
dome
Figure 2. The spherical bottom
spherical bottom
dome
Figure 4 The cylindrical body
Figure 5 The view of assembling taper bottom and support of plant
taper bottom
support
connection of probe
shell ring nervure
reinforcing ring
Figure 3. The view of reinforcing and supporting ring of the isolation
9th WSEAS International Conference on AUTOMATION and INFORMATION (ICAI'08), Bucharest, Romania, June 24-26, 2008
ISBN: 978-960-6766-77-0 165 ISSN 1790-5117
In fig. 4 is shown the isometric view of the cylindrical body that is compound by 9 shell rings.
In fig. 5, fig. 6 and fig. 7 is presented the assembly of taper bottom – metal support of the installation and other two details in axial sections of the support of plant.
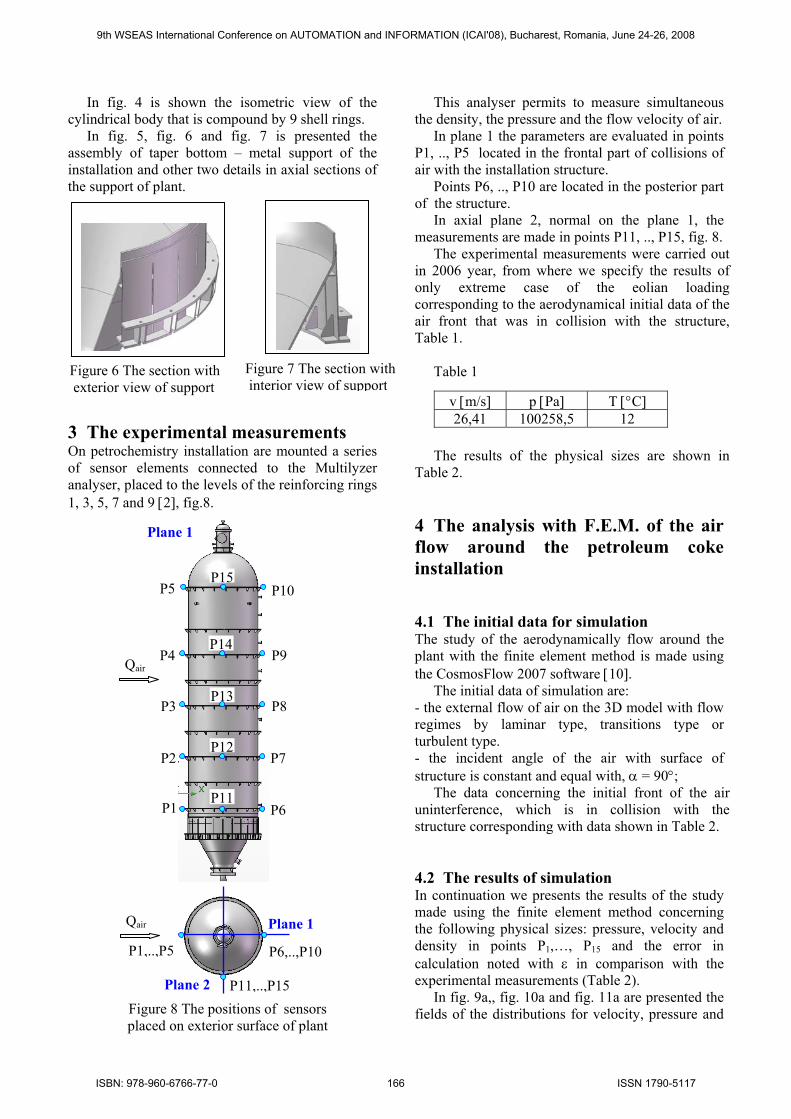
3 The experimental measurements On petrochemistry installation are mounted a series of sensor elements connected to the Multilyzer analyser, placed to the levels of the reinforcing rings 1, 3, 5, 7 and 9 [2], fig.8.
This analyser permits to measure simultaneous the density, the pressure and the flow velocity of air.
In plane 1 the parameters are evaluated in points P1, .., P5 located in the frontal part of collisions of air with the installation structure.
Points P6, .., P10 are located in the posterior part of the structure.
In axial plane 2, normal on the plane 1, the measurements are made in points P11, .., P15, fig. 8.
The experimental measurements were carried out in 2006 year, from where we specify the results of only extreme case of the eolian loading corresponding to the aerodynamical initial data of the air front that was in collision with the structure, Table 1.
Table 1
The results of the physical sizes are shown in
Table 2. 4 The analysis with F.E.M. of the air flow around the petroleum coke installation 4.1 The initial data for simulation The study of the aerodynamically flow around the plant with the finite element method is made using the CosmosFlow 2007 software [10].
The initial data of simulation are: - the external flow of air on the 3D model with flow regimes by laminar type, transitions type or turbulent type. - the incident angle of the air with surface of structure is constant and equal with, α = 90°;
The data concerning the initial front of the air uninterference, which is in collision with the structure corresponding with data shown in Table 2. 4.2 The results of simulation In continuation we presents the results of the study made using the finite element method concerning the following physical sizes: pressure, velocity and density in points P1,…, P15 and the error in calculation noted with ε in comparison with the experimental measurements (Table 2).
In fig. 9a,, fig. 10a and fig. 11a are presented the fields of the distributions for velocity, pressure and
v [m/s] p [Pa] T [°C] 26,41 100258,5 12
Figure 6 The section with exterior view of support
Figure 7 The section with interior view of support
Figure 8 The positions of sensors placed on exterior surface of plant
Plane 1
P6
P7
P8
P9
P10
P1
P12
P13
P14
P15
P11
Plane 1
Plane 2
Qair
P2
P3
P4
P5
Qair
P6,..,P10
P11,..,P15
P1,..,P5
9th WSEAS International Conference on AUTOMATION and INFORMATION (ICAI'08), Bucharest, Romania, June 24-26, 2008
ISBN: 978-960-6766-77-0 166 ISSN 1790-5117
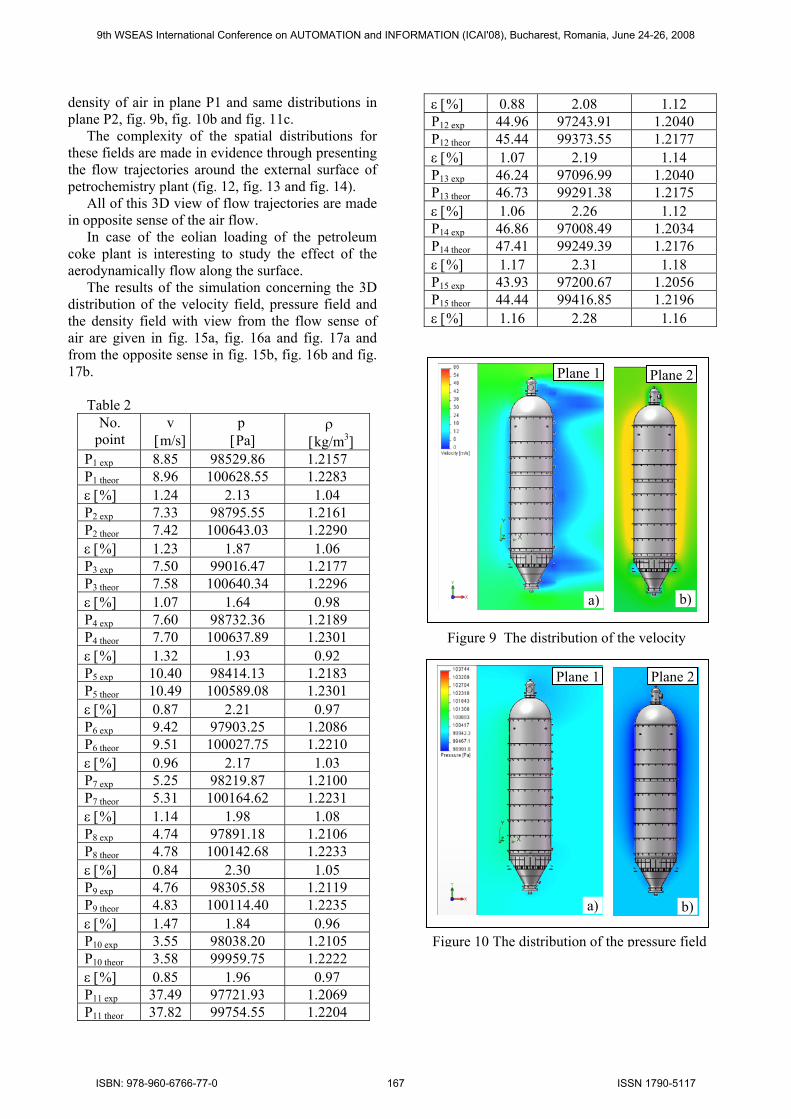
density of air in plane P1 and same distributions in plane P2, fig. 9b, fig. 10b and fig. 11c.
The complexity of the spatial distributions for these fields are made in evidence through presenting the flow trajectories around the external surface of petrochemistry plant (fig. 12, fig. 13 and fig. 14).
All of this 3D view of flow trajectories are made in opposite sense of the air flow.
In case of the eolian loading of the petroleum coke plant is interesting to study the effect of the aerodynamically flow along the surface.
The results of the simulation concerning the 3D distribution of the velocity field, pressure field and the density field with view from the flow sense of air are given in fig. 15a, fig. 16a and fig. 17a and from the opposite sense in fig. 15b, fig. 16b and fig. 17b.
Table 2 No.
point v
[m/s] p
[Pa] ρ
[kg/m3] P1 exp 8.85 98529.86 1.2157 P1 theor 8.96 100628.55 1.2283 ε [%] 1.24 2.13 1.04 P2 exp 7.33 98795.55 1.2161 P2 theor 7.42 100643.03 1.2290 ε [%] 1.23 1.87 1.06 P3 exp 7.50 99016.47 1.2177 P3 theor 7.58 100640.34 1.2296 ε [%] 1.07 1.64 0.98 P4 exp 7.60 98732.36 1.2189 P4 theor 7.70 100637.89 1.2301 ε [%] 1.32 1.93 0.92 P5 exp 10.40 98414.13 1.2183 P5 theor 10.49 100589.08 1.2301 ε [%] 0.87 2.21 0.97 P6 exp 9.42 97903.25 1.2086 P6 theor 9.51 100027.75 1.2210 ε [%] 0.96 2.17 1.03 P7 exp 5.25 98219.87 1.2100 P7 theor 5.31 100164.62 1.2231 ε [%] 1.14 1.98 1.08 P8 exp 4.74 97891.18 1.2106 P8 theor 4.78 100142.68 1.2233 ε [%] 0.84 2.30 1.05 P9 exp 4.76 98305.58 1.2119 P9 theor 4.83 100114.40 1.2235 ε [%] 1.47 1.84 0.96 P10 exp 3.55 98038.20 1.2105 P10 theor 3.58 99959.75 1.2222 ε [%] 0.85 1.96 0.97 P11 exp 37.49 97721.93 1.2069 P11 theor 37.82 99754.55 1.2204
ε [%] 0.88 2.08 1.12 P12 exp 44.96 97243.91 1.2040 P12 theor 45.44 99373.55 1.2177 ε [%] 1.07 2.19 1.14 P13 exp 46.24 97096.99 1.2040 P13 theor 46.73 99291.38 1.2175 ε [%] 1.06 2.26 1.12 P14 exp 46.86 97008.49 1.2034 P14 theor 47.41 99249.39 1.2176 ε [%] 1.17 2.31 1.18 P15 exp 43.93 97200.67 1.2056 P15 theor 44.44 99416.85 1.2196 ε [%] 1.16 2.28 1.16
Figure 9 The distribution of the velocity
Plane 2Plane 1
a) b)
Figure 10 The distribution of the pressure field
Plane 1 Plane 2
a) b)
9th WSEAS International Conference on AUTOMATION and INFORMATION (ICAI'08), Bucharest, Romania, June 24-26, 2008
ISBN: 978-960-6766-77-0 167 ISSN 1790-5117

Figure 11 The distribution of the density field
Plane 1 Plane 2
a) b)
Figure 12 The 3D flow trajectories with mark of the velocity field
Figure 13 The 3D flow trajectories with mark of the pressure field
Figure 14 The 3D flow trajectories with mark of the density field
Figure 15 The distribution of air velocity on the surface of the petroleum coke plant
b)a)
Figure 16 The distribution of air pressure on the surface of the petroleum coke plant
a) b)
9th WSEAS International Conference on AUTOMATION and INFORMATION (ICAI'08), Bucharest, Romania, June 24-26, 2008
ISBN: 978-960-6766-77-0 168 ISSN 1790-5117

5 Conclusion Experimental we established that the effect of the eolian loadings on the surface of petroleum coke plant are no uniform on whole surface.
From the aerodynamical flow analysis resulting that the variations of the velocity, pressure and density fields presented nonuniform 3D distribution, which are confirm by the theoretical results of simulation with aid of the finite element method give in table 2, 2D plots from fig. 9, to fig. 11 and 3D plots from fig. 12 to fig. 17.
The complex geometry of the external surface for the petrochemistry plant disturbing in totality without exceptions the distribution fields of velocity, pressure and density, over the structure or under the structure (see the dynamical flow into the support or over the assembly dome – spherical bottom) on the lateral parts of installation and in the posterior zone, fig. 9 to fig. 14.
The error in calculus for this method applied in the aerodynamically study is acceptable ε < 3%, justifiable by accepting the hypothesis of the dynamical uniform flow of air front which is in collision with the structure, the constant angle of impact equal with α = 90°, the accuracy of the 3D model of structure and the precision of the computational programme. 6 Acknoledgements This work has partly been funded by the Romanian Ministry of Education, Research and Youth, through The National University Research Council, Grant PN–II–ID–PCE–2007–1, code ID_1107, 2007 -
2010, “The development of a database with representations of complex surfaces and objects using engineering graphics. Applications in art and technique”. References: [1] Gary J.H., Handwerk G.E, Petroleum Refining
Technology and Economics, 2nd Edition, Marcel Dekker, Inc, 1984.
[2] Rizea N., Contribuţii la calculul de fluaj şi oboseală al învelişurilor subţiri cu aplicaţie la aparatura petrochimică, Teză de doctorat, 2008, Universitatea Petrol–Gaze din Ploieşti, Romania.
[3] Dalyand B.J., Harlow F.H., Transport equations in Turbulence. Phys. Fluids, 1970.
[4] Reynolds A.J., Curgeri turbulente în tehnică, Ed. Tehnică, Bucureşti, 1982.
[5] Abramovici G.N., Teoriia turbulentnih strui. Moskva, Fizmatghiz, 1970.
[6] Marciuc G.I., Metode de analiză numerică, Ed. Academiei R.S.R., 1983.
[7] Idelcik I.E., Îndrumător pentru calculul rezistenţelor hidraulice, Ed. Tehnică, Bucureşti, 1984.
[8] Kiselev P.G.., Îndreptar pentru calcule hidraulice, Ed. Tehnică, Bucureşti, 1988.
[9] **** User guide SolidWorks 2007 software. [10] **** User guide CosmosFlow 2007 software.
Figure 17 The distribution of air density on the surface of the petroleum coke plant
a) b)
9th WSEAS International Conference on AUTOMATION and INFORMATION (ICAI'08), Bucharest, Romania, June 24-26, 2008
ISBN: 978-960-6766-77-0 169 ISSN 1790-5117