real-time incremental visualization of dynamic ultrasound volumes...
TRANSCRIPT
Real-Time Incremental Visualization of DynamicUltrasound Volumes Using Parallel BSP Trees
William F. Garrett, Henry Fuchs, Mary C. Whitton, and Andrei StatePUBLISHED IN THE PROCEEDINGS OF VISUALIZATION ’96
Department of Computer Science1
University of North Carolina at Chapel Hill
ABSTRACTWe present a method for producing real-time volumevisualizations of continuously captured, arbitrarily-oriented 2Darrays (slices) of data. Our system constructs a 3Drepresentation on-the-fly from incoming 2D ultrasound slicesby modeling and rendering the slices as planar polygons withtranslucent surface textures. We use binary space partition(BSP) tree data structures to provide non-intersecting,visibility-ordered primitives for accurate opacity accumulationimages. New in our system is a method of using parallel, time-shifted BSP trees to efficiently manage the continuouslycaptured ultrasound data and to decrease the variability in imagegeneration time between output frames. This technique i semployed in a functioning real-time augmented reality systemthat a physician has used to examine human patients prior tobreast biopsy procedures. We expect the technique can be usedfor real-time visualization of any 2D data being collected froma tracked sensor moving along an arbitrary path.
CR Categories and Subject Descriptors: E.1 [DataStructures]: Trees, I.3.1: [Hardware Architecture]: Three-dimensional displays, I.3.7 [Three-Dimensional Graphics andRealism]: Color, shading, shadowing, and texture and Visibleline/surface algorithms, J.3 [Life and Medical Sciences]:Medical information systems.
Additional Keywords and Phrases: Augmented reality,ultrasound echography, 3D medical imaging, BSP tree.
1 INTRODUCTIONUltrasound echography is a popular imaging modality for manymedical applications including fetal and cardiologicalexaminations. We are developing an augmented reality systemfor use in ultrasound-guided needle biopsy of the breast (Plate1). As the anatomy being examined is inherently threedimensional, the physician would often like to see the datarendered as a volume rather than as the 2D cross-sectionalimages (slices) generated by most ultrasound machines.Although 3D ultrasound acquisition systems are availablecommercially, they are not widely used. The 3D systems areproblematic for applications such as breast biopsy because theapparatus may obstruct the physician’s access to the patient’sbody. 2D acquisition systems are likely to remain commonmany years, so it is fruitful to investigate real-time renderingof data from this class of sensors.
Our goal is to provide the physician with a volumerepresentation of ultrasound data displayed in real time as shescans a patient with a hand-held 2D ultrasound probe. Therendering portion of our system must address three problems:the arbitrary position and orientation of the ultrasound data,the continuous capture of new data that must be combined with
older data for display, and the need for real-time operation.Plate 2, showing a hand scanned in a tank of water, illustrateshow 3D shape can be recognizably represented in opacityaccumulation images of multiple slices. Plate 3 illustrates thechallenge of rendering a combination of older and newer datawhen scanning a moving target, in this case a closed handopening during the scan.
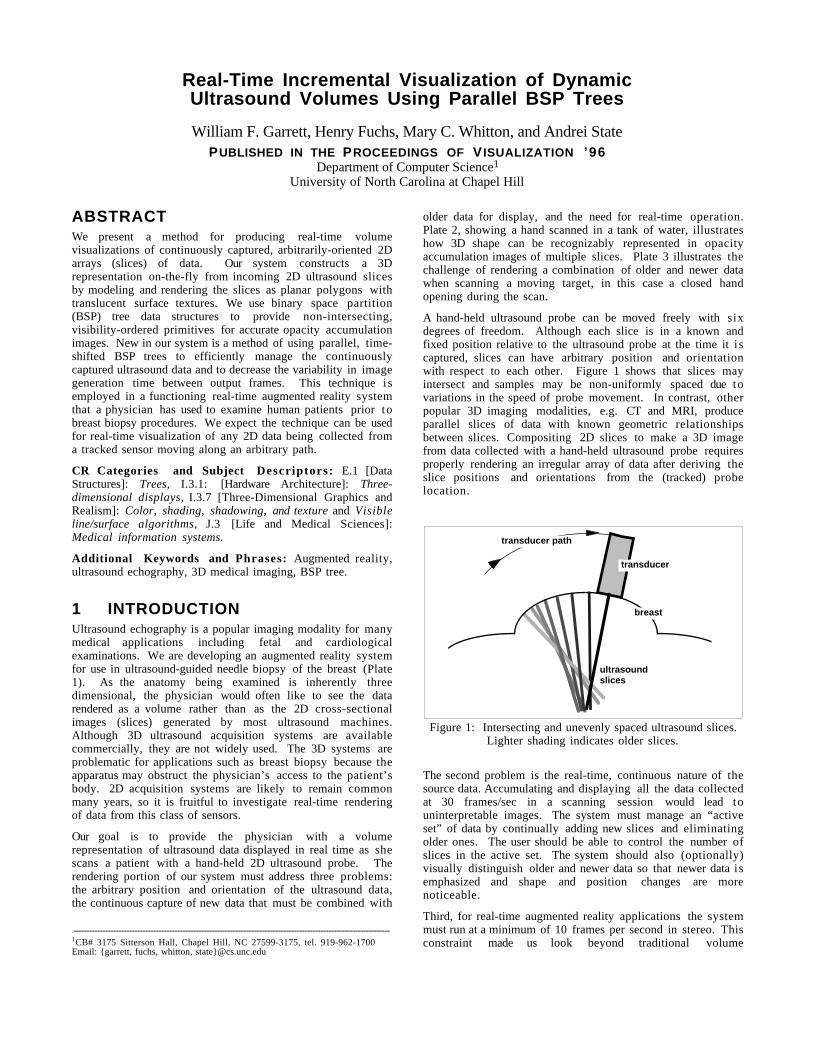
A hand-held ultrasound probe can be moved freely with sixdegrees of freedom. Although each slice is in a known andfixed position relative to the ultrasound probe at the time it i scaptured, slices can have arbitrary position and orientationwith respect to each other. Figure 1 shows that slices mayintersect and samples may be non-uniformly spaced due tovariations in the speed of probe movement. In contrast, otherpopular 3D imaging modalities, e.g. CT and MRI, produceparallel slices of data with known geometric relationshipsbetween slices. Compositing 2D slices to make a 3D imagefrom data collected with a hand-held ultrasound probe requiresproperly rendering an irregular array of data after deriving theslice positions and orientations from the (tracked) probelocation.
Figure 1: Intersecting and unevenly spaced ultrasound slices.Lighter shading indicates older slices.
The second problem is the real-time, continuous nature of thesource data. Accumulating and displaying all the data collectedat 30 frames/sec in a scanning session would lead touninterpretable images. The system must manage an “activeset” of data by continually adding new slices and eliminatingolder ones. The user should be able to control the number ofslices in the active set. The system should also (optionally)visually distinguish older and newer data so that newer data i semphasized and shape and position changes are morenoticeable.
Third, for real-time augmented reality applications the systemmust run at a minimum of 10 frames per second in stereo. Thisconstraint made us look beyond traditional volume
------------------------------------------------------------------------------------------------------------------------1CB# 3175 Sitterson Hall, Chapel Hill, NC 27599-3175, tel. 919-962-1700Email: {garrett, fuchs, whitton, state}@cs.unc.edu
transducer path
transducer
breast
ultrasoundslices
visualization methods which require computationallyexpensive data resampling.
In [State 1996] we described an augmented reality system thatmerges ultrasound rendering with live images of the physicalenvironment. The work reported here enabled the 3D real-timevolume visualization in that system, but was described onlybriefly in that paper. The method is extended and analyzedhere.
2 BACKGROUNDOur work builds on previous research in volume rendering,ultrasound visualization, and BSP trees. Of particular relevanceis research on using textures and hardware texture acceleratorsto render volumes and research using polygonal primitives torepresent ultrasound slices.
2.1 Volume RenderingVolume rendering methods, like rendering methods in general,can be divided into two categories: backward-mappingmethods (e.g., ray casting [Tuy 1984], where the image planeis mapped onto the data, and forward-mapping methods (e.g.,splatting [Westover 1990]) where data is mapped to screenspace. Most methods require (re)sampling data to a regular 3Dgrid or compiling adjacency information for irregular grids.Moreover, to render with translucency (e.g., “Levoy rendering”[Levoy 1988] or simple opacity accumulation), the volumemust be sampled in back-to-front or front-to-back order forproper compositing.
Most computers are not powerful enough to resample and renderlarge, screen-filling datasets (2563 voxels) at interactive rates(10 Hz or better) but many modern computers do offer hardwareacceleration for rendering textured polygons. Cullip andNeumann [Cullip 1994] proposed a simple method for using thetexture-rendering capabilities of a Silicon GraphicsRealityEngine for volume rendering. Stein, Becker, and Max[Stein 1994] demonstrate how the volume rendering method ofcell projection [Shirley 1990] can be implemented withhardware-assisted texture mapping. Cabral, Cam, and Foran[Cabral 1994] provide some of the mathematical foundationsfor generating volume-rendered images with texture-mappinghardware.
2.2 Ultrasound Visualization SystemsThune and Olstad [Thune 1991] presented a system forcapturing time-varying 3D ultrasound data using a restrictedmotion (rotation only) ultrasound probe and rendering imagesoff-line. Sakas and Walter [Sakas 1995] built a system forvisualizing 3D ultrasound data, characterized by the use of amotor-driven ultrasound probe, multi-step filtering, and veryhigh visual quality. Their technique includes space-fillinginterpolation between ultrasound slices during volumereconstruction.
State, et. al. [State 1994] generated a sequence of imagesshowing a moving observer’s view of a reconstructed volume (afetus) within a pregnant patient. The researchers collectedtime-stamped data from a tracker on a freely movable hand-heldultrasound probe, a tracker on the user’s head, and images froma head-mounted video camera. The animation, althoughshowing lower volume reconstruction quality than [Sakas1995], simulated what a real-time augmented-reality
visualization running on a more-powerful future machine mightdisplay to a user.
Bajura, Fuchs, and Ohbuchi [Bajura 1992] introduced theconcept of rendering ultrasound slices as polygon-like objectsin an early real-time augmented reality system. The systemdisplayed intersecting, opaque primitives via z-buffering. Theresearchers exploited the hardware accelerated sphere primitiveof Pixel Planes 5 and approximated a textured polygon byrendering an array of small, intersecting spheres each centeredon a sample point on the ultrasound slice and colored with thevalue of that sample point.
Ohbuchi, Chen, and Fuchs [Ohbuchi 1992] developed a systemthat incrementally resampled and rendered (via ray casting)ultrasound slice data. This work was expanded to a primitiveaugmented-reality system that ran at near-real-time frame rates(~1Hz) on the Pixel-Planes 5 graphics multicomputer [State1994, State 1995]. The present work can best be described asimproving on the results of that system by using new renderingalgorithms and a different hardware platform to achieve real-time frame rates (10-15 Hz).
2.3 BSP TreesA binary space partition (BSP) tree is a data structure formanaging planar polygons in 3D. Intersecting polygons aredivided into non-intersecting fragments as the tree is built.The structure can be traversed to produce non-intersectingprimitives in low-to-high visibility order for any givenviewpoint [Fuchs 1980].
BSP trees are most appropriate for static geometry with amoving viewpoint; the tree is built once and traversed manytimes [Fuchs 1983]. One serious drawback in using BSP treeswith a changing data set is that while adding new objectsrequires only inserting the new primitive(s) into the tree (aninexpensive operation), removing geometry may requirerebuilding the entire tree (discussed in greater detail in 4.1).[Chrysanthou 1996] shows how the rebuilding can sometimesbe avoided by recombining the subtrees that remain after apiece of geometry is removed.
2.4 ContributionOur work makes two contributions. First, it demonstrates real-time volume representations of sets of arbitrarily orientedslices of ultrasound data using BSP trees and texturing on astandard, commercial high-end graphics workstation. Second,it presents a method of parallel BSP trees to manage adynamically changing set of ultrasound data and to minimizevariation in per-frame BSP tree management times for moreconsistent overall frame rendering times.
3 RENDERING TEXTURED SLICESUltrasound echography data is captured from the scanner as alive, gray scale video image and is placed in texture memory atthe start of the rendering loop in our application. Although theechography data is both generated by the ultrasound machineand captured by our system as 2D imagery, the samples(pixels/texels) are not planar samples. The region actuallysampled is nominally wedge shaped (with the thicker end awayfrom the ultrasound probe) due to the spreading characteristicsof the sound waves used in echography. Thus each value in the2D ultrasound image represents contributions from the values
through the wedge.
In the interest of rendering speed, our rendering method doesnot reconstruct the volume or otherwise address the issue ofdata values in the space between slices. We model eachultrasound slice as a planar polygon and render it directly, withthe ultrasound video image applied to it as a translucent texture.Ultrasound scans often comprise many closely-spaced slices,which diminishes the effect of neglecting inter-slice regions.Thus, although composed only of 2D polygons, our real-timeimages produce recognizable 3D structures.
The precise size, shape, position, and orientation of the sliceof ultrasound data relative to the ultrasound probe i spredetermined by a one-time calibration procedure [State1994]. We track the ultrasound probe with a highly accuratemechanical tracker (FARO Technologies Metrecom IND-1).The probe calibration data, combined with the real-timetracking information, gives the 3D position and orientation ofeach polygon representing an ultrasound slice.
Proper opacity-accumulation compositing (one of therendering modes implemented in our system) requires that slicepolygons be non-intersecting and be presented in low-to-highvisibility order (i.e., if polygon A obscures polygon B fromthe current viewpoint, B must be rendered before A). We use theBSP tree data structure for the slice polygons because it meetsboth these requirements.
We generate our volume representations by rendering polygonsfrom the BSP tree with the appropriate textures applied. Usingthe various texturing modes of the Silicon GraphicsRealityEngine2 we can duplicate traditional volume renderingalgorithms such as opacity accumulation and maximumintensity projection. We also use the texture lookup tables toadjust the brightness and opacity mappings for betterdiscrimination of the target in our visualization.
One of the stated goals of the visualization is to provide amethod of weighting data by age so that moving targets can beviewed. We implemented our system with exponential age-based attenuation (Plate 3).
Since the image is completely re-rendered from the BSP treeduring every frame, we are able to attenuate slice imageintensities and opacities as a rendering effect. Each slicepolygon is time-stamped as the slice is captured from theultrasound system. As each slice is inserted into the BSP treeand split into fragments, the slice's time stamp is propagatedto the fragments. During tree traversal for rendering, the timestamps are used to compute each fragment’s age and attenuatethe polygon’s brightness accordingly. The original slice data,stored in texture memory, are not modified.
4 DUAL BSP TREESBSP trees work well for static data sets viewed fromdynamically changing viewpoints. Our goal, however, is real-time visualization of the n most recently captured slices from acontinuous data stream. This active set of data changes everyframe, one new slice arrives and one old slice expires at eachtime step.
4.1 Continuously Captured DataWhile adding new geometric primitives to a BSP tree requiresonly inserting the new primitives into the tree, removing ageometric primitive often requires rebuilding the entire sub-tree
beneath the nodes that are deleted. As an alternative torebuilding, expired slices can be flagged as “invisible” and notrendered during traversal, but such an operation doesn’t reducethe number of nodes in the tree. The constantly growingnumber of nodes causes greater fragmentation of newly-insertedgeometry. Inserting into large trees is expensive, so the treemust occasionally be rebuilt to eliminate the expired nodes.
Despite the drawback of periodic rebuilding, BSP trees areattractive for our application since most of the slice polygonsin one frame are present in the next. For example, if the activedata set comprises 100 slices, 99% of the contents (99 slices)are displayed in the next frame. It pays to maintain a structureacross time steps.
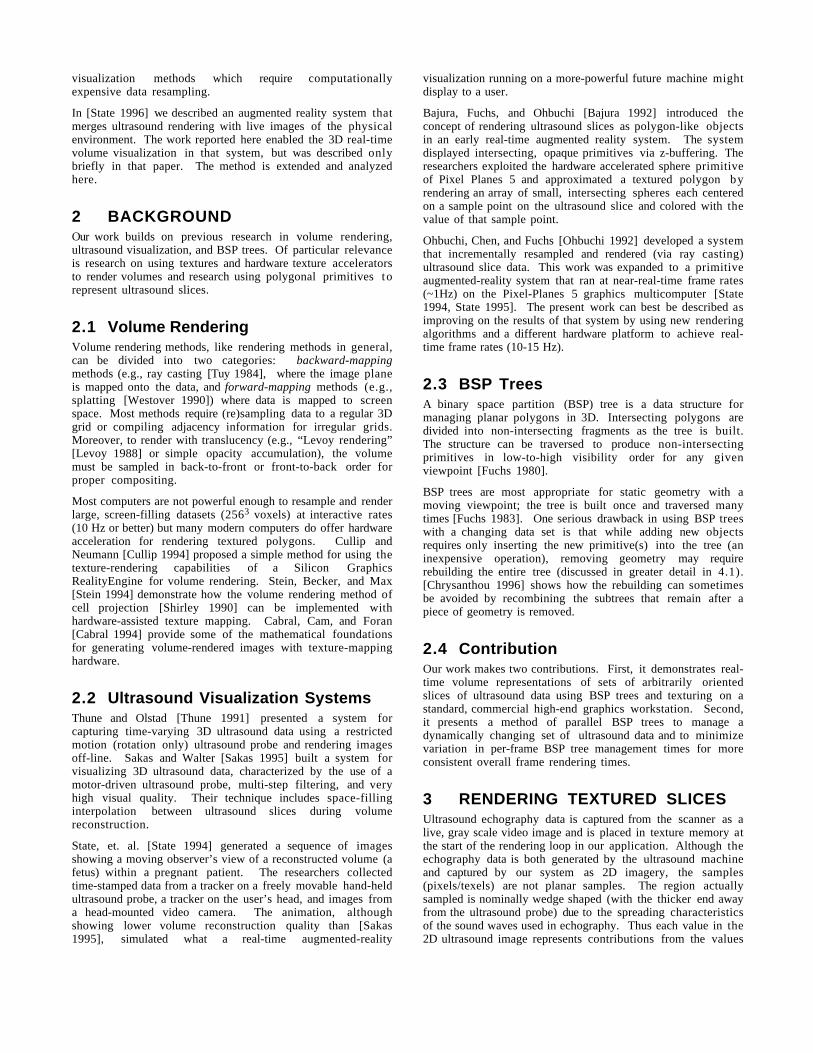
We solve the problem of deleting and rebuilding bymaintaining two parallel BSP trees, out of phase in time.Consider that we want to render the n most recent slices everyframe. When we start the system, we initialize an active treeand insert one slice into it in each of the first n-1 frames (timesteps) of the system. At frame n-1, we start a replacement treeand insert slices into both trees through frame 2n-2. Note thatafter the slice insertion at time step 2n-1 the replacement treewill have n slices — the number needed to render the active set.Since rendering takes place after insertion, the first tree can bereinitialized at the end of step 2n-2 and the replacement treebecomes the active tree. Figure 2 illustrates this process foractive set size n=4.
After startup all slices are inserted into both the active andreplacement trees. Because of the way the trees overlap, eachhas a maximum of 2n-2 slices inserted before it is reinitialized.Each tree is active for display for n-1 frames and flags n-2slices as expired before the trees are swapped and the older treeis reinitialized.
TimeStep
Slices inTree A
Slices inTree B
SlicesDisplayed
TreeUsed forDisplay
1 1 - 1 A2 1-2 - 1-2 A3 1-3 - 1-3 A4 1-4 4 1-4 A5 1-5 4-5 2-5 A6 1-6 4-6 3-6 A7 7 4-7 4-7 B8 7-8 4-8 5-8 B9 7-9 4-9 6-9 B
10 7-10 10 7-10 A11 7-11 10-11 8-11 A12 7-12 10-12 9-12 A13 13 10-13 10-13 B14 13-14 10-14 11-14 B15 13-15 10-15 12-15 B16 13-16 16 13-16 A17 13-17 16-17 14-17 A.... .... .... .... ....
Figure 2: Behavior of dual BSP tree with an active set of n=4.Except for start-up in steps 1 through 3, the system always
displays the 4 most recent samples. After start-up, the activeBSP tree switches every third step. The double lines between
cells indicate when the trees are reinitialized.
It is easy to see that the value of n (the number of slicesdisplayed in each frame) can be changed interactively. If n i sincreased, we simply delay switching to the replacement treeand continue growing the existing trees to the new values of nand 2n. Decreasing n can be accommodated by switching andstarting the replacement tree early.
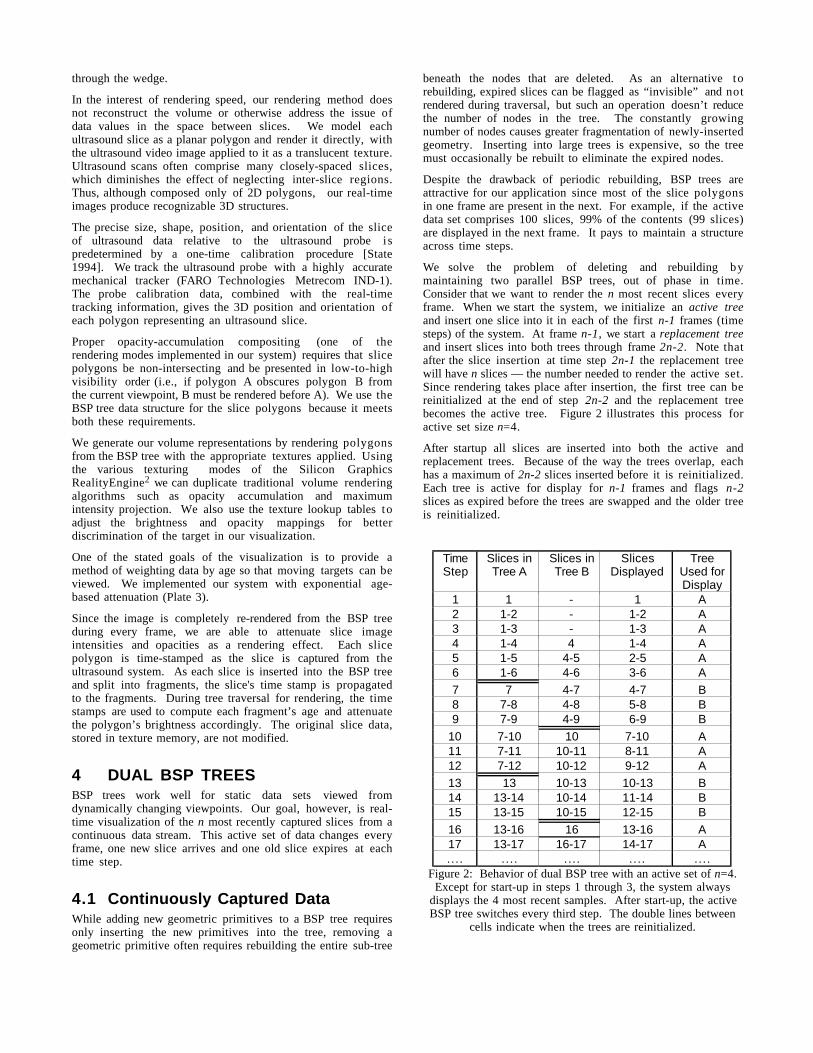
4.2 Analysis of Dual BSP TreesA major requirement of our real-time system is to have aconsistent update rate for the images presented to the user.Using a single BSP tree data structure for a changing data setrequires that the tree be rebuilt occasionally. Figures 3 and 4show that tree rebuilding (every nth frame after startup) causesspikes in the per-frame tree management time, thus making theframe update rate uneven.
The dual-tree approach amortizes the cost of rebuilding bymaking two insertions per frame: one into the active tree andone into the replacement tree. While each frame time i sslightly longer, this scheme results in more evencomputational load per frame and a lower upper-limit on theper-frame tree management time.
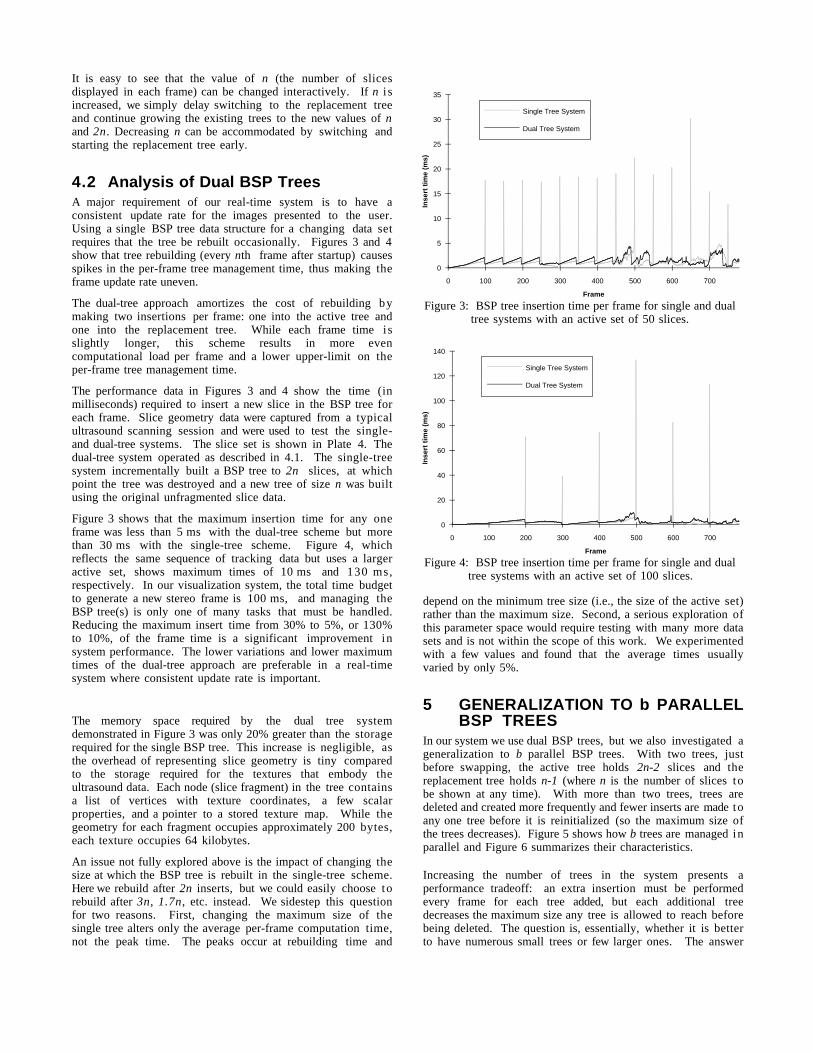
The performance data in Figures 3 and 4 show the time (inmilliseconds) required to insert a new slice in the BSP tree foreach frame. Slice geometry data were captured from a typicalultrasound scanning session and were used to test the single-and dual-tree systems. The slice set is shown in Plate 4. Thedual-tree system operated as described in 4.1. The single-treesystem incrementally built a BSP tree to 2n slices, at whichpoint the tree was destroyed and a new tree of size n was builtusing the original unfragmented slice data.
Figure 3 shows that the maximum insertion time for any oneframe was less than 5 ms with the dual-tree scheme but morethan 30 ms with the single-tree scheme. Figure 4, whichreflects the same sequence of tracking data but uses a largeractive set, shows maximum times of 10 ms and 130 ms,respectively. In our visualization system, the total time budgetto generate a new stereo frame is 100 ms, and managing theBSP tree(s) is only one of many tasks that must be handled.Reducing the maximum insert time from 30% to 5%, or 130%to 10%, of the frame time is a significant improvement insystem performance. The lower variations and lower maximumtimes of the dual-tree approach are preferable in a real-timesystem where consistent update rate is important.
The memory space required by the dual tree systemdemonstrated in Figure 3 was only 20% greater than the storagerequired for the single BSP tree. This increase is negligible, asthe overhead of representing slice geometry is tiny comparedto the storage required for the textures that embody theultrasound data. Each node (slice fragment) in the tree containsa list of vertices with texture coordinates, a few scalarproperties, and a pointer to a stored texture map. While thegeometry for each fragment occupies approximately 200 bytes,each texture occupies 64 kilobytes.
An issue not fully explored above is the impact of changing thesize at which the BSP tree is rebuilt in the single-tree scheme.Here we rebuild after 2n inserts, but we could easily choose torebuild after 3n, 1.7n, etc. instead. We sidestep this questionfor two reasons. First, changing the maximum size of thesingle tree alters only the average per-frame computation time,not the peak time. The peaks occur at rebuilding time and
depend on the minimum tree size (i.e., the size of the active set)rather than the maximum size. Second, a serious exploration ofthis parameter space would require testing with many more datasets and is not within the scope of this work. We experimentedwith a few values and found that the average times usuallyvaried by only 5%.
5 GENERALIZATION TO b PARALLELBSP TREES
In our system we use dual BSP trees, but we also investigated ageneralization to b parallel BSP trees. With two trees, justbefore swapping, the active tree holds 2n-2 slices and thereplacement tree holds n-1 (where n is the number of slices tobe shown at any time). With more than two trees, trees aredeleted and created more frequently and fewer inserts are made toany one tree before it is reinitialized (so the maximum size ofthe trees decreases). Figure 5 shows how b trees are managed inparallel and Figure 6 summarizes their characteristics.
Increasing the number of trees in the system presents aperformance tradeoff: an extra insertion must be performedevery frame for each tree added, but each additional treedecreases the maximum size any tree is allowed to reach beforebeing deleted. The question is, essentially, whether it is betterto have numerous small trees or few larger ones. The answer
Frame
Inse
rt t
ime
(ms)
0
5
10
15
20
25
30
35
0 100 200 300 400 500 600 700
Single Tree System
Dual Tree System
Figure 3: BSP tree insertion time per frame for single and dualtree systems with an active set of 50 slices.
Frame
Inse
rt t
ime
(ms)
0
20
40
60
80
100
120
140
0 100 200 300 400 500 600 700
Single Tree System
Dual Tree System
Figure 4: BSP tree insertion time per frame for single and dualtree systems with an active set of 100 slices.
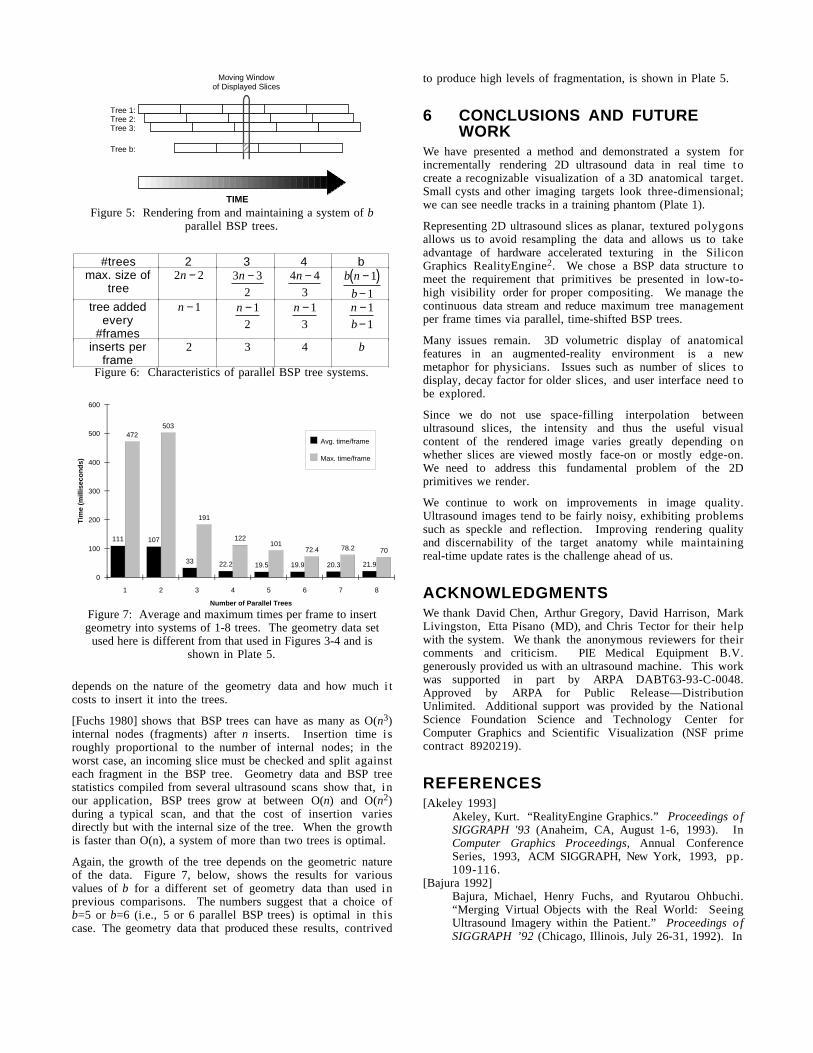
depends on the nature of the geometry data and how much i tcosts to insert it into the trees.
[Fuchs 1980] shows that BSP trees can have as many as O(n3)internal nodes (fragments) after n inserts. Insertion time i sroughly proportional to the number of internal nodes; in theworst case, an incoming slice must be checked and split againsteach fragment in the BSP tree. Geometry data and BSP treestatistics compiled from several ultrasound scans show that, inour application, BSP trees grow at between O(n) and O(n2)during a typical scan, and that the cost of insertion variesdirectly but with the internal size of the tree. When the growthis faster than O(n), a system of more than two trees is optimal.
Again, the growth of the tree depends on the geometric natureof the data. Figure 7, below, shows the results for variousvalues of b for a different set of geometry data than used inprevious comparisons. The numbers suggest that a choice ofb=5 or b=6 (i.e., 5 or 6 parallel BSP trees) is optimal in thiscase. The geometry data that produced these results, contrived
to produce high levels of fragmentation, is shown in Plate 5.
6 CONCLUSIONS AND FUTUREWORK
We have presented a method and demonstrated a system forincrementally rendering 2D ultrasound data in real time tocreate a recognizable visualization of a 3D anatomical target.Small cysts and other imaging targets look three-dimensional;we can see needle tracks in a training phantom (Plate 1).
Representing 2D ultrasound slices as planar, textured polygonsallows us to avoid resampling the data and allows us to takeadvantage of hardware accelerated texturing in the SiliconGraphics RealityEngine2. We chose a BSP data structure tomeet the requirement that primitives be presented in low-to-high visibility order for proper compositing. We manage thecontinuous data stream and reduce maximum tree managementper frame times via parallel, time-shifted BSP trees.
Many issues remain. 3D volumetric display of anatomicalfeatures in an augmented-reality environment is a newmetaphor for physicians. Issues such as number of slices todisplay, decay factor for older slices, and user interface need tobe explored.
Since we do not use space-filling interpolation betweenultrasound slices, the intensity and thus the useful visualcontent of the rendered image varies greatly depending onwhether slices are viewed mostly face-on or mostly edge-on.We need to address this fundamental problem of the 2Dprimitives we render.
We continue to work on improvements in image quality.Ultrasound images tend to be fairly noisy, exhibiting problemssuch as speckle and reflection. Improving rendering qualityand discernability of the target anatomy while maintainingreal-time update rates is the challenge ahead of us.
ACKNOWLEDGMENTSWe thank David Chen, Arthur Gregory, David Harrison, MarkLivingston, Etta Pisano (MD), and Chris Tector for their helpwith the system. We thank the anonymous reviewers for theircomments and criticism. PIE Medical Equipment B.V.generously provided us with an ultrasound machine. This workwas supported in part by ARPA DABT63-93-C-0048.Approved by ARPA for Public Release—DistributionUnlimited. Additional support was provided by the NationalScience Foundation Science and Technology Center forComputer Graphics and Scientific Visualization (NSF primecontract 8920219).
REFERENCES[Akeley 1993]
Akeley, Kurt. “RealityEngine Graphics.” Proceedings o fSIGGRAPH '93 (Anaheim, CA, August 1-6, 1993). InComputer Graphics Proceedings, Annual ConferenceSeries, 1993, ACM SIGGRAPH, New York, 1993, pp.109-116.
[Bajura 1992]Bajura, Michael, Henry Fuchs, and Ryutarou Ohbuchi.“Merging Virtual Objects with the Real World: SeeingUltrasound Imagery within the Patient.” Proceedings o fSIGGRAPH ’92 (Chicago, Illinois, July 26-31, 1992). In
Tree 1:Tree 2:Tree 3:
Tree b:
TIME
Moving Windowof Displayed Slices
Figure 5: Rendering from and maintaining a system of bparallel BSP trees.
#trees 2 3 4 bmax. size of
tree 2 2n −
3 32
n −
4 43
n −
b nb
−( )−
11
tree addedevery
#frames
n −1
n −12
n −13
nb
−−
11
inserts perframe
2 3 4 b
Figure 6: Characteristics of parallel BSP tree systems.
Number of Parallel Trees
Tim
e (m
illis
eco
nd
s)
0
100
200
300
400
500
600
1 2 3 4 5 6 7 8
21.920.319.919.522.233
107111
7078.272.4101
122
191
503472
Avg. time/frame
Max. time/frame
Figure 7: Average and maximum times per frame to insertgeometry into systems of 1-8 trees. The geometry data set
used here is different from that used in Figures 3-4 and isshown in Plate 5.

Computer Graphics 26, 2 (July 1992), 203-209.[Cabral 1994]
Cabral, B., Cam, N., and Foran, J. “Accelerated VolumeRendering and Tomographic Reconstruction UsingTexture Mapping Hardware.” Proceedings of the 1994Symposium on Volume Visualization (Washington, DC,October 17-18,1994), pp. 91-98.
[Chrysanthou 1996]Chrysanthou, Yiorgos. “Shadow Computation for 3DInteraction and Animation.” Ph.D. Thesis, University o fLondon (January 1996).
[Cullip 1994]Cullip, Timothy and Ulrich Neumann. “AcceleratingVolume Reconstruction With 3D Texture Hardware.” UNCTechnical Report TR93-027 (May 1994).
[Fuchs 1980]Fuchs, Henry, Zvi Kedem, and Bruce Naylor. “On VisibleSurface Generation by a Priori Tree Structures.”Proceedings of SIGGRAPH ’80 (July 1980). In ComputerGraphics 14, 3 (July 1980), 124-133.
[Fuchs 1983]Fuchs, Henry, Gregory Abram, and Eric Grant. “NearReal-time Shaded Display of Rigid Objects.” Proceedingsof SIGGRAPH ’83 (July 1983). In Computer Graphics17, 3 (July 1983), 65-72.
[Herman 1979]Herman, Gabor and Hsun Kao Liu. “Three-DimensionalDisplay of Human Organs from Computed Tomograms.”Computer Graphics and Image Processing, 1979, 1-21.
[Lengyel 1995]Lengyel, Jed, Donald Greenberg, and Richard Popp.“Time-Dependent Three-Dimensional IntervascularUltrasound.” Proceedings of SIGGRAPH 95 (LosAngeles, CA, August 6-11, 1995). In Computer GraphicsProceedings, Annual Conference Series, 1995, ACMSIGGRAPH, pp. 457-464.
[Levoy 1988]Levoy, Marc. “Display of Surfaces from Volume Data.”IEEE Computer Graphics and Applications 8, 5 (May1988), 29-37.
[Nelson 1993]Nelson, Thomas and Todd Elvins. “Visualization of 3DUltrasound Data.” IEEE Computer Graphics andApplications (November 1993), 50-57.
[Ohbuchi 1992]Ohbuchi, Ryutaro, David Chen, and Henry Fuchs.“Incremental Volume Reconstruction and Rendering for3D Ultrasound Imaging.” SPIE Vol. 1808 Visualizationin Biomedical Computing 1992, 312-323.
[Ohbuchi 1994]Ohbuchi, Ryutarou. “Incremental Acquisition andVisualization of 3D Ultrasound Images.” Ph.D. Thesis.UNC 1994-0362 (1994).
[Sakas 1995]Sakas, Georgios and Stefan Walter. “Extracting Surfaces
from Fuzzy 3D-Ultrasound Data.” Proceedings o fSIGGRAPH 95 (Los Angeles, CA, August 6-11, 1995). InComputer Graphics Proceedings, Annual ConferenceSeries, 1995, ACM SIGGRAPH, pp. 465-474.
[Shirley 1990]Shirley, Peter and Allan Tuchman. “A PolygonalApproach to Direct Scalar Volume Rendering.” ComputerGraphics 24, 5 (November 1990), 63-70.
[State 1994]State, Andrei, David Chen, Chris Tector, Andrew Brandt,Hong Chen, Ryutarou Ohbuchi, Mike Bajura, and HenryFuchs. “Case Study: Observing a Volume Rendered Fetuswithin a Pregnant Patient.” Proceedings of IEEEVisualization ’94 (Washington, DC, October 17-21,1994).
[State 1995]State, Andrei, Jonathan McAllister, Ulrich Neumann,Hong Chen, Timothy Cullip, David Chen, and HenryFuchs. “Interactive Volume Visualization on aHeterogeneous Message-Passing Multicomputer.”Proceedings of the 1995 Symposium on 3D InteractiveGraphics (Monterrey, CA, April 9-12, 1995), pp. 69-74.
[State 1996]State, Andrei, Mark Livingston, William Garrett, GentaroHirota, Mary Whitton, Etta Pisano, and Henry Fuchs.“Technologies for Augmented-Reality Systems:Realizing Ultrasound-Guided Needle Biopsies.”Proceedings of SIGGRAPH 96 (New Orleans, Lousiana,August 4-9, 1996). In Computer Graphics Proceedings,Annual Conference Series, 1996, ACM SIGGRAPH.
[Stein 1994]Stein, Clifford M., Barry Becker, and Nelson Max.“Sorting and Hardware Assisted Rendering for VolumeVisualization.” Proceedings of 1994 Symposium onVolume Visualization (Washington, DC, October 17-18,1994), pp. 83-89.
[Thune 1991]Thune, Nils and Bjørn Olstad. “Visualizing 4-D MedicalUltrasound Data.” Proceedings of Visualization 1991(San Diego, CA, October 22-25, 1991), 210-215.
[Tuy 1984]Tuy, Heang, and Lee Tan Tuy. “Direct 2-D Display of 3-DObjects.” IEEE Computer Graphics and Applications 4 ,10 (November 1984), 29-33.
[Westover 1990]Westover, Lee. “Footprint Evaluation for VolumeRendering.” Proceedings of SIGGRAPH ’90 (August1990). In Computer Graphics 24, 4 (1990), 367-376.
[Watkin 1993]Watkin, K., L. Baer, S. Mathur, R. Jones, S. Hakim, I.Diouf, B. Nuwayhid, and S. Khalife. “Three-DimensionalReconstruction and Enhancement of Arbitrarily Orientedand Positioned 2D Medical Ultrasonic Images.” IEEECanadian Electrical and Computer Engineering:Proceedings (1993), 1188-1195.
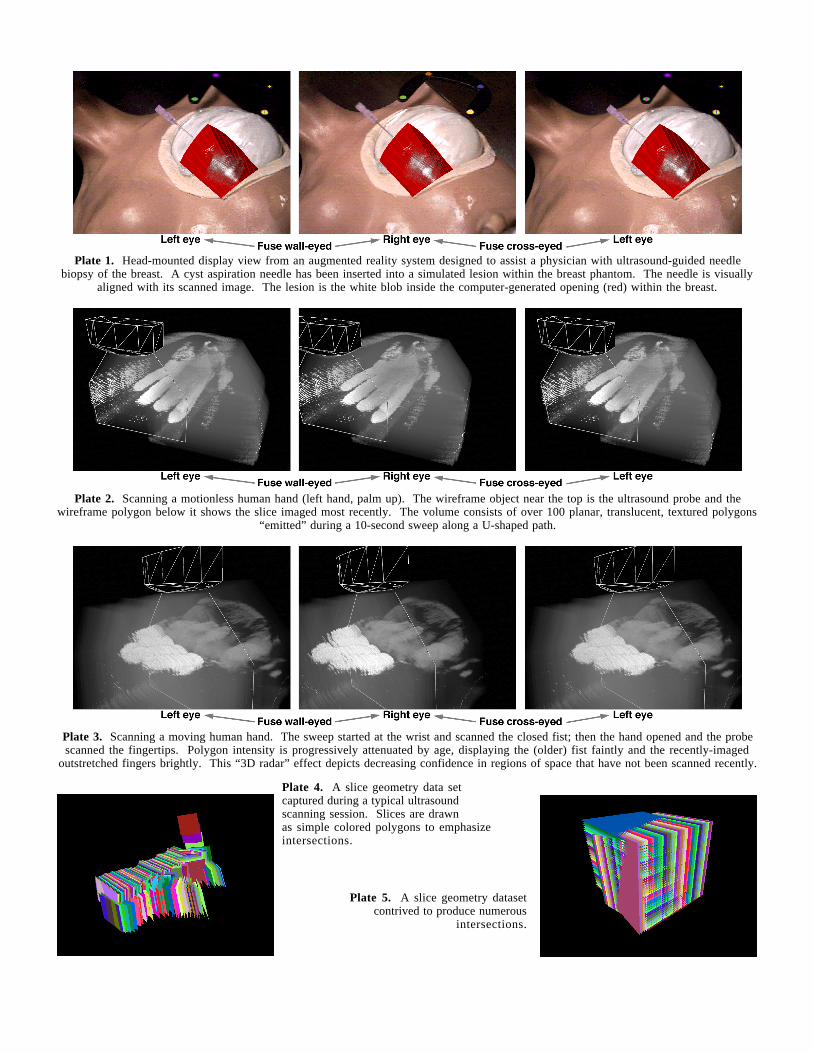
Plate 1. Head-mounted display view from an augmented reality system designed to assist a physician with ultrasound-guided needlebiopsy of the breast. A cyst aspiration needle has been inserted into a simulated lesion within the breast phantom. The needle is visually
aligned with its scanned image. The lesion is the white blob inside the computer-generated opening (red) within the breast.
Plate 2. Scanning a motionless human hand (left hand, palm up). The wireframe object near the top is the ultrasound probe and thewireframe polygon below it shows the slice imaged most recently. The volume consists of over 100 planar, translucent, textured polygons
“emitted” during a 10-second sweep along a U-shaped path.
Plate 3. Scanning a moving human hand. The sweep started at the wrist and scanned the closed fist; then the hand opened and the probescanned the fingertips. Polygon intensity is progressively attenuated by age, displaying the (older) fist faintly and the recently-imaged
outstretched fingers brightly. This “3D radar” effect depicts decreasing confidence in regions of space that have not been scanned recently.
Plate 4. A slice geometry data setcaptured during a typical ultrasoundscanning session. Slices are drawnas simple colored polygons to emphasizeintersections.
Plate 5. A slice geometry datasetcontrived to produce numerous
intersections.