the driving force behind the boom and bust in construction ... · the driving force behind the boom...
TRANSCRIPT

WP/13/181
The Driving Force behind the Boom and Bust in Construction in Europe
Yan Sun, Pritha Mitra, and Alejandro Simone
© 2013 International Monetary Fund WP/13/181
IMF Working Paper
European Department
The Driving Force behind the Boom and Bust in Construction in Europe
Prepared by Yan Sun, Pritha Mitra, and Alejandro Simone1
Authorized for distribution by Bas Bakker
August 2013
Abstract
This paper studies the factors behind pro-cyclical but widely varying construction shares (as a percent of GDP) across countries, with a strong focus on European countries. Using a dataset covering 48 countries (including advanced and emerging economies within and outside Europe) for 1990-2011, we find that country’s geography, demographics, and economic conditions are the key determinants of a norm around which actual construction shares revolve in a simple AR(1) and error-correction process. The empirical results show that in many European countries, construction shares overshoot relative to their norms before the recent global crisis, but they have fallen significantly since the crisis. Nevertheless, there is still room for further adjustment in construction shares in some countries which may weigh on economic recovery.
JEL Classification Numbers: E01, E23, E32, L74, N64
Keywords: Construction, Business Cycle, Error-correction, European Growth
Author’s E-Mail Address:[email protected]
1 We would like to thank Rodrigo Valdes for suggesting the topic for research, and for many insightful comments while he was at the European Department of the IMF. We also thank Cristina Cheptea for helping assembling part of the dataset used in the research. Comments from Bas Bakker and seminar participants in the IMF’s European Department are also gratefully acknowledged.
This Working Paper should not be reported as representing the views of the IMF. The views expressed in this Working Paper are those of the author(s) and do not necessarily represent those of the IMF or IMF policy. Working Papers describe research in progress by the author(s) and are published to elicit comments and to further debate.

2
Contents Page
Executive Summary ...................................................................................................................4
I. Introduction ............................................................................................................................5
II. Literature Review ................................................................................................................11
III. Data Set and Main Methodology .......................................................................................12
IV. What Do the Results Reveal? ............................................................................................16A. Advanced Europe ....................................................................................................16 B. Central, Eastern, and Southeastern Europe .............................................................17
V. Conclusion ..........................................................................................................................18
Tables
1. Advanced economies: Norm Equation Estimation Results .................................................202. Emerging and Developing Economies: Norm Equation Estimation Results .......................213. Advanced Economies: Dynamic Equation EstimationRresults ...........................................254. Emerging and Developing Economies: Dynamic Equation Estimation Results .................25
Figures
1. Europe: GDP Growth and Construction ................................................................................62. Europe: Unemployment and Construction .............................................................................63. Share of Construction in GDP, 1980–2011 ...........................................................................74. Advanced Europe: Share of Construction in GDP, 1980–2011 ............................................75. CESEE: Share of Construction in GDP, 1980–2011 .............................................................86: Advanced Economies: Construction Share ............................................................................8 7. Emerging Economies: Construction Share ............................................................................98. Construction Share in Selected Advanced European Countries ..........................................109. Selected Advanced European Countries: Construction Share .............................................2210. Selected CESEE European Countries: Construction Share ...............................................2311. Europe: Construction Share, Deviation from Norm in 2007 .............................................2412. Europe: Cumulative Adjustment in Construction Share ....................................................2613. Europe: Deviation from Medium-Term Fundamental in Construction Shares .................27
Appendices
Table A1. List of Countries Included in the Sample ...............................................................28 Table A2. List of Data and Its Sources ....................................................................................29 Table A3. Heterogeneity test results ........................................................................................29

3
Table A4. Advanced Economies: Alternative Estimation for Construction Norm Equation ..30 Table A5. Emerging Economies: Alternative Estimation for Construction Norm Equation ..31 Table A6a. Structural Difference Test Results (Including Real Credit) ..................................32 Table A6b. Structural Difference Test Results (Including Interest Rate) ................................33 References ................................................................................................................................34

4
EXECUTIVE SUMMARY
For many European countries, construction shares (in percent of GDP) have varied greatly before and during the recent economic crisis. Construction shares increased, some to very high levels, during the boom period. For example, during 2000-08 the real estate boom in Ireland, Spain, and Cyprus was synonymous with a construction boom, which boosted growth. In emerging Europe, similar overheating also took place in the Baltic countries, and to a lesser extent, Croatia. The process has largely reversed itself in these countries since the crisis. For most countries, the deep recession has been accompanied by a collapse in construction activities and a sharp decline in construction shares. Empirical results established in this paper provide insights on the driving forces behind the changes in construction shares. We show that actual construction shares revolve around a norm that is determined by country-specific fundamentals, in an auto-regressive, error-correcting process. The fundamentals include geography, demographics, and economic conditions such as income level, credit conditions, and stock market performance. The results offer a compelling narrative on the seemingly volatile and wide varying adjustment process of construction shares experienced in Europe. During the boom, many countries overshoot the norm. After the crisis, the process has reversed and many countries have undershot the norm. But for some countries, the adjustment has fallen short of the model’s predictions. Over the medium-term, constructions shares are likely to recover in many European countries, but some may see further declines ahead. When economic conditions normalize over the medium term, Greece, Iceland, and Ireland in advanced Europe, and Latvia, Lithuania, Hungary, and Ukraine in emerging Europe may see a recovery in their construction shares. But construction shares could decline further in Spain, the United Kingdom, Romania, and the Slovak Republic. The improvement in construction shares, or lack of it, will have serious implications for the speed of recovery in economic activity and for employment.

5
I. INTRODUCTION
Construction plays a unique role in economic growth and is often a key barometer of economic conditions. Construction increases a country’s physical infrastructure (including housing stocks) which is a critical factor for long-term growth. The performance of the construction sector both affects and is influenced by general economic conditions. Although generally small in size compared to other sectors, its activity has a large impact on output and employment of the whole economy given its close inter-linkages with other sectors. Before the recent crisis, in many European countries, an increase in construction shares was closely associated with strong growth.2 Figure 1 shows the correlation between changes in construction (as a percent of GDP) to average GDP growth for both advanced and emerging Europe countries for the period of 1980-2007.3 For both groups of countries, the very high elasticity between changes in construction share and GDP growth, at around 0.37-0.4, is striking.4 Higher construction activity before the crisis was also associated with a lower unemployment rate (Figure 2). For advanced Europe, it appears that on average, a one percentage point increase in the construction share (as a percent to GDP) was associated with about a one percentage point reduction in the unemployment rate. The reduction is somewhat smaller, but still sizable, in Central, Eastern, and Southeastern Europe (CESEE). According to the European Construction Industry Federation (2012), in 2011, construction industry is the biggest industrial employer in Europe, counting for 30.7% of industrial employment (and 7% of Europe’s total employment). In recent years, Europe has had one of the largest variations in construction shares in the world (Figure 3). Variation within Europe is also high compared with other regions. For example, advanced Europe has many positive outliers in terms of construction shares
2 In this paper, the construction share refers to the value added of contrition industry as a share of GDP. The statistics are generally from national account’s data on value-added by industry. The value added of construction industry is not the same as construction spending (on housing or non-housing structures). Construction share in value-added is generally smaller (and generally more stable) than the share of construction spending as a ratio to GDP as construction spending includes imports related to construction. In countries that had experienced a construction boom, increase in imports related to construction also contributed to an increase in the current account deficit. This observation is pointed out to us by Bas Bakker.
3 Czech Republic, Slovak Republic, Estonia, and Slovenia which have attained advanced economy status (e.g. in the IMF’s WEO classification) are grouped in this paper with the rest of the CESEE countries because for the majority of the period under investigation, they were classified as emerging economies.
4 The fact that construction ties closely with the performance of general economic activity is not unique to the European experience. Boldrin et al (2013) also documents how the interlinkages of construction with other sectors in the U.S. economy propagated the impact of changes in the demand of residential investment, hence amplifying the effect on the overall U.S. economy.

6
compared with other advanced economies. In fact, among European countries, Spain, Lithuania, and Iceland, had pre-crisis construction shares over 10 percent of GDP (Figure 4 and 5). Since the global economic crisis, construction shares have dramatically declined from their peak but the pace of decline varies. Some of the countries, including Ireland, Iceland, and Latvia, saw a decline of around 5 percentage points of GDP from 2007-2011 (Figure 6 and For others, such as Spain and Cyprus, the decline is sizable, but less severe.5
Figure 1. Europe: GDP Growth and Construction
United KingdomUnited KingdomUnited KingdomUnited KingdomUnited KingdomUnited KingdomUnited KingdomUnited KingdomUnited KingdomUnited KingdomUnited KingdomAustriaAustriaAustriaAustriaAustriaAustriaAustriaAustriaAustriaAustriaAustriaAustriaAustriaAustriaAustriaAustriaAustriaAustriaAustriaAustriaBelgiumBelgiumBelgiumBelgiumBelgiumBelgiumBelgiumBelgiumBelgiumBelgiumBelgiumBelgiumBelgium
DenmarkDenmarkDenmarkDenmarkDenmarkDenmarkDenmarkDenmarkDenmarkDenmarkDenmarkDenmarkDenmarkDenmarkDenmarkDenmarkDenmarkDenmarkFranceFranceFranceFranceFranceFranceFranceFranceFranceFranceFranceFranceFranceFranceFranceFranceFranceFranceFranceFranceFranceFranceFranceFranceFranceFranceFranceFranceGermanyGermanyGermanyGermanyGermanyGermanyGermanyGermanyGermanyGermanyGermanyGermanyGermanyGermanyGermanyGermanyGermany
ItalyItalyItalyItalyItalyItalyItalyItalyItalyItalyItalyItalyItalyItalyItalyItalyItalyItalyItalyItalyItalyItalyItalyItalyItalyItalyItalyItaly
NetherlandsNetherlandsNetherlandsNetherlandsNetherlandsNetherlandsNetherlandsNetherlandsNetherlandsNetherlandsNetherlandsNetherlandsNetherlandsNetherlandsNetherlandsNetherlandsNetherlandsNetherlandsNetherlandsNetherlands
NorwayNorwayNorwayNorwayNorwayNorwayNorwayNorwayNorwayNorwayNorwayNorwayNorwayNorwayNorwayNorwayNorwayNorwayNorwayNorwayNorwayNorwayNorwayNorwayNorwayNorwayNorwayNorway
SwedenSwedenSwedenSwedenSwedenSwedenSwedenSwedenSwedenSwedenSwedenSwedenSwedenSwedenSweden
SwitzerlandSwitzerlandSwitzerlandSwitzerlandSwitzerlandSwitzerlandSwitzerlandSwitzerlandSwitzerlandSwitzerlandSwitzerlandSwitzerlandSwitzerlandSwitzerlandSwitzerlandSwitzerlandSwitzerlandSwitzerlandSwitzerlandSwitzerlandSwitzerlandSwitzerlandSwitzerlandSwitzerlandSwitzerlandSwitzerlandSwitzerlandSwitzerland
FinlandFinlandFinlandFinlandFinlandFinlandFinlandFinlandFinlandFinlandFinlandFinlandFinlandFinlandFinlandFinlandFinlandFinland
GreeceGreeceGreeceGreeceGreeceGreeceGreeceGreece
IcelandIcelandIcelandIcelandIcelandIcelandIcelandIcelandIcelandIcelandIcelandIcelandIcelandIcelandIcelandIcelandIcelandIcelandIcelandIcelandIcelandIcelandIcelandIcelandIcelandIcelandIcelandIceland
IrelandIrelandIrelandIrelandIrelandIrelandIrelandIreland
PortugalPortugalPortugalPortugalPortugalPortugalPortugalPortugalPortugalPortugalPortugalPortugalPortugal SpainSpainSpainSpainSpainSpainSpainSpain
CyprusCyprusCyprusCyprusCyprusCyprusCyprusCyprusCyprusCyprusCyprusCyprusCyprus
y = 2.54 + .356 x
R 2 = 0.51
12
34
5A
vera
ge G
DP
Gro
wth
(19
80-2
007)
, per
cent
-2 0 2 4Change in share of construction 1980-2007
Advanced Europe
TurkeyTurkeyTurkeyTurkeyTurkeyTurkeyTurkeyTurkeyTurkeyTurkey
AlbaniaAlbaniaAlbaniaAlbaniaAlbaniaAlbaniaAlbaniaAlbaniaAlbaniaAlbania
BulgariaBulgariaBulgariaBulgariaBulgariaBulgariaBulgariaBulgariaBulgariaBulgaria
Russian FederationRussian FederationRussian FederationRussian FederationRussian FederationUkraineUkraineUkraineUkraineUkraineUkraineUkraine
Czech RepublicCzech RepublicCzech RepublicCzech RepublicCzech RepublicCzech RepublicCzech RepublicCzech RepublicCzech RepublicCzech Republic
Slovak RepublicSlovak RepublicSlovak RepublicSlovak RepublicSlovak RepublicSlovak RepublicSlovak RepublicSlovak RepublicSlovak RepublicSlovak Republic
EstoniaEstoniaEstoniaEstoniaEstoniaEstoniaEstoniaEstoniaEstoniaEstonia
LatviaLatviaLatviaLatviaLatviaLatviaLatviaLatviaLatviaLatvia
SerbiaSerbiaSerbiaSerbiaSerbiaSerbiaSerbia
HungaryHungaryHungaryHungaryHungaryHungaryHungaryHungaryHungaryHungary
LithuaniaLithuaniaLithuaniaLithuaniaLithuaniaLithuaniaLithuaniaLithuaniaLithuaniaLithuania
CroatiaCroatiaCroatiaCroatiaCroatiaCroatiaCroatiaCroatiaCroatiaCroatia
SloveniaSloveniaSloveniaSloveniaSloveniaSloveniaSloveniaSlovenia
Macedonia, FYRMacedonia, FYRMacedonia, FYRMacedonia, FYRMacedonia, FYR
Bosnia and HerzegovinaBosnia and HerzegovinaBosnia and HerzegovinaBosnia and HerzegovinaBosnia and HerzegovinaBosnia and HerzegovinaBosnia and HerzegovinaBosnia and HerzegovinaBosnia and Herzegovina
PolandPolandPolandPolandPolandPolandPolandPolandPolandPolandRomaniaRomaniaRomaniaRomaniaRomaniaRomaniaRomaniaRomaniaRomaniaRomania
y = 4.12 + .405 x R
2 = 48.45
34
56
7A
vera
ge G
DP
gro
wth
(19
98-2
007)
, per
cent
-2 0 2 4 6 8Change in share of construction 1998-2007
CESEE
Source: Haver Analytics, Author's calculations.
Figure 2. Europe: Unemployment and Construction
5 The latest 2012 data show that construction shares fell further to 8.3 percent of GDP in Spain and 5.7 percent of GDP in Cyprus.
United KingdomUnited KingdomUnited KingdomUnited KingdomUnited KingdomUnited KingdomUnited KingdomUnited KingdomUnited KingdomUnited KingdomUnited Kingdom
AustriaAustriaAustriaAustriaAustriaAustriaAustriaAustriaAustriaAustriaAustriaAustriaAustriaAustriaAustriaAustriaAustriaAustriaAustriaAustria
BelgiumBelgiumBelgiumBelgiumBelgiumBelgiumBelgiumBelgiumBelgiumBelgiumBelgiumBelgiumBelgium
DenmarkDenmarkDenmarkDenmarkDenmarkDenmarkDenmarkDenmarkDenmarkDenmarkDenmarkDenmarkDenmarkDenmarkDenmarkDenmarkDenmarkDenmark
FranceFranceFranceFranceFranceFranceFranceFranceFranceFranceFranceFranceFranceFranceFranceFranceFranceFranceFranceFranceFranceFranceFranceFranceFranceFranceFranceFrance
GermanyGermanyGermanyGermanyGermanyGermanyGermanyGermanyGermanyGermanyGermanyGermanyGermanyGermanyGermanyGermanyGermany
ItalyItalyItalyItalyItalyItalyItalyItalyItalyItalyItalyItalyItalyItalyItalyItalyItalyItalyItalyItalyItalyItalyItalyItalyItalyItalyItalyItaly
NetherlandsNetherlandsNetherlandsNetherlandsNetherlandsNetherlandsNetherlandsNetherlandsNetherlandsNetherlandsNetherlandsNetherlandsNetherlandsNetherlandsNetherlandsNetherlandsNetherlandsNetherlandsNetherlandsNetherlandsNorwayNorwayNorwayNorwayNorwayNorwayNorwayNorwayNorwayNorwayNorwayNorwayNorwayNorwayNorwayNorwayNorwayNorwayNorwayNorwayNorwayNorwayNorwayNorwayNorwayNorwayNorwayNorway
SwedenSwedenSwedenSwedenSwedenSwedenSwedenSwedenSwedenSwedenSwedenSwedenSwedenSwedenSweden
SwitzerlandSwitzerlandSwitzerlandSwitzerlandSwitzerlandSwitzerlandSwitzerlandSwitzerlandSwitzerlandSwitzerlandSwitzerlandSwitzerlandSwitzerlandSwitzerlandSwitzerlandSwitzerlandSwitzerlandSwitzerlandSwitzerlandSwitzerlandSwitzerlandSwitzerlandSwitzerlandSwitzerlandSwitzerlandSwitzerlandSwitzerlandSwitzerlandFinlandFinlandFinlandFinlandFinlandFinlandFinlandFinlandFinlandFinlandFinlandFinlandFinlandFinlandFinlandFinlandFinlandFinland
GreeceGreeceGreeceGreeceGreeceGreeceGreeceGreece
IcelandIcelandIcelandIcelandIcelandIcelandIcelandIcelandIcelandIcelandIcelandIcelandIcelandIcelandIcelandIcelandIcelandIcelandIcelandIcelandIcelandIcelandIcelandIcelandIcelandIcelandIcelandIceland
IrelandIrelandIrelandIrelandIrelandIrelandIrelandIreland
PortugalPortugalPortugalPortugalPortugalPortugalPortugalPortugalPortugalPortugalPortugalPortugalPortugal
SpainSpainSpainSpainSpainSpainSpainSpain
CyprusCyprusCyprusCyprusCyprusCyprusCyprusCyprusCyprusCyprusCyprusCyprusCyprus
y = 1.06 - .688 x R
2 = 0.25
-20
24
6C
hang
e in
une
mpl
oym
ent r
ate
(198
0-2
007)
-2 0 2 4Change in share of construction 1980-2007
Advanced Europe
TurkeyTurkeyTurkeyTurkeyTurkeyTurkeyTurkeyTurkeyTurkeyTurkey
AlbaniaAlbaniaAlbaniaAlbaniaAlbaniaAlbaniaAlbaniaAlbaniaAlbaniaAlbania
BulgariaBulgariaBulgariaBulgariaBulgariaBulgariaBulgariaBulgariaBulgariaBulgariaRussian FederationRussian FederationRussian FederationRussian FederationRussian Federation
UkraineUkraineUkraineUkraineUkraineUkraineUkraine
Czech RepublicCzech RepublicCzech RepublicCzech RepublicCzech RepublicCzech RepublicCzech RepublicCzech RepublicCzech RepublicCzech RepublicSlovak RepublicSlovak RepublicSlovak RepublicSlovak RepublicSlovak RepublicSlovak RepublicSlovak RepublicSlovak RepublicSlovak RepublicSlovak Republic
EstoniaEstoniaEstoniaEstoniaEstoniaEstoniaEstoniaEstoniaEstoniaEstonia
LatviaLatviaLatviaLatviaLatviaLatviaLatviaLatviaLatviaLatvia
SerbiaSerbiaSerbiaSerbiaSerbiaSerbiaSerbia
HungaryHungaryHungaryHungaryHungaryHungaryHungaryHungaryHungaryHungary
LithuaniaLithuaniaLithuaniaLithuaniaLithuaniaLithuaniaLithuaniaLithuaniaLithuania
CroatiaCroatiaCroatiaCroatiaCroatiaCroatiaCroatiaCroatiaCroatiaCroatia
SloveniaSloveniaSloveniaSloveniaSloveniaSloveniaSloveniaSloveniaMacedonia, FYRMacedonia, FYRMacedonia, FYRMacedonia, FYRMacedonia, FYR
Bosnia and HerzegovinaBosnia and HerzegovinaBosnia and HerzegovinaBosnia and HerzegovinaBosnia and HerzegovinaBosnia and HerzegovinaBosnia and HerzegovinaBosnia and HerzegovinaBosnia and Herzegovina
PolandPolandPolandPolandPolandPolandPolandPolandPolandPoland RomaniaRomaniaRomaniaRomaniaRomaniaRomaniaRomaniaRomaniaRomaniaRomania
y = -.719 - .852 x
R 2 = 0.26
-10
-50
510
Cha
nge
in u
nem
ploy
men
t rat
e (1
998-
200
7)
-2 0 2 4 6 8Change in share of construction 1998-2007
CESEE
Source: Haver Analytics, Author's calculations.

7
Figure 3. Share of Construction in GDP, 1980-2011 (in percent of GDP)
Figure 4. Advanced Europe: Share of Construction in GDP, 1980-2011 (in percent of GDP)
05
1015
20S
hare
of c
onst
ruct
ion
(no
min
al)
Emerging and Developing Advanced
AFR APD EUR MCD WHD AFR APD EUR MCD WHD
Note: The upper (lower) adjacent value is the number that is closest to the point which is 1.5 inter-quartilerange (IQR)--i.e. 1.5*(q[75]-q[25]) from the 75 (25) percent quartile.
Source: Haver Analytics, and Author's calculation.
24
68
1012
Sha
re o
f con
stru
ctio
n (n
om
ina
l)
Aus
tria
Bel
giu
m
Cyp
rus
Den
mar
k
Fin
land
Fra
nce
Ger
ma
ny
Gre
ece
Ice
lan
d
Irel
and
Isra
el
Italy
Net
herla
nds
Nor
way
Por
tuga
l
Sp
ain
Sw
ede
n
Sw
itzer
land
Un
ited
Kin
gdo
m
Note: The upper (lower) adjacent value is the number that is closest to the point which is 1.5 inter-quartilerange (IQR)--i.e. 1.5*(q[75]-q[25]) from the 75 (25) percent quartile.
Source: Haver Analytics, and Author's calculation.
8
Figure 5. CESEE: Share of Construction in GDP, 1980-2011 (in percent of GDP)
Figure 6: Advanced Economies: Construction Share (in percent of GDP)
05
1015
Sha
re o
f co
nstr
uctio
n (n
omin
al)
Alb
ania
Bos
nia
and
He
rzeg
ovi
na
Bul
garia
Cro
atia
Cze
ch R
epub
lic
Est
onia
Hun
gary
Lat
via
Lith
uan
ia
Mac
edo
nia,
FY
R
Po
land
Ro
ma
nia
Ru
ssia
n F
ede
ratio
n
Ser
bia
Slo
vak
Re
publ
ic
Slo
veni
a
Tur
key
Ukr
ain
e
Note: The upper (lower) adjacent value is the number that is closest to the point which is 1.5 inter-quartilerange (IQR)--i.e. 1.5*(q[75]-q[25]) from the 75 (25) percent quartile.
Source: Haver Analytics, and IMF staff calculation.
05
1015
Ca
na
da
Sp
ain
Au
stra
lia
Cyp
rus
Ice
lan
d
Ire
lan
d
Un
ited
Kin
gd
om
Ko
rea
, R
ep
.
Ne
w Z
ea
lan
d
Au
stri
a
Po
rtu
ga
l
Fin
lan
d
Gre
ece
Ita
ly
Fra
nce
Ne
the
rla
nd
s
No
rwa
y
Be
lgiu
m
Sw
itze
rlan
d
De
nm
ark
Un
ited
Sta
tes
Sw
ed
en
Ge
rma
ny
Sin
ga
po
re
2007 2011
Source: Haver Analytics.

9
Figure 7. Emerging Economies: Construction Share (in percent of GDP)
With these stylized facts as a background, this paper first explores the link between construction shares and country-specific fundamentals. We determine what the “normal” level of construction share is for a given set of fundamentals; and explain the high construction shares in Europe during the boom and their decline since the crisis. Using a dataset of both European and non-European countries, we find the most important fundamentals driving the “norm” are demographics, geography, and economic conditions such as per capita income, credit conditions, and stock market performance. We then identify the adjustment dynamics of construction share around its norm. We find that the pace of adjustment of actual construction shares around the norm are driven by the size of the deviation from the norm, and the previous period’s change in construction shares themselves. This auto-regressive, error-correcting process explains the distinctly high and low growth periods of construction shares. The gradual auto-regressive adjustment process also explains the pro-cyclicality of construction shares. 6
6 The change in construction share suggests that construction is highly pro-cyclical. A rising construction share during the boom time means construction grows faster than GDP, and a sharp decline during the recession reverses the process.
05
1015
Alb
an
ia U
ga
nd
a L
ithu
an
ia U
nite
d A
rab
Em
irat
es
Ka
zakh
sta
n E
sto
nia
La
tvia
Ecu
ad
or
Ro
ma
nia
In
dia
In
do
ne
sia
Slo
vak
Re
pu
blic
Sri
La
nka
Ba
ng
lad
esh
Slo
ven
ia V
ietn
am
Co
lom
bia
Cro
atia
Me
xico
Bu
lga
ria
Gh
an
a G
eo
rgia
Aze
rba
ijan
Po
lan
d C
zech
Re
pu
blic
Mo
rocc
o H
on
du
ras
Ch
ile C
hin
a A
rge
ntin
a M
ace
do
nia
, F
YR
Qa
tar
Ma
urit
ius
Ira
n,
Isla
mic
Re
p.
Pa
na
ma
Gu
ate
ma
la C
ost
a R
ica
Om
an
Ru
ssia
n F
ed
era
tion
Tu
rke
y B
osn
ia a
nd
He
rze
go
vin
a H
un
ga
ry B
ots
wan
a S
au
di A
rab
ia J
ord
an
Ph
ilip
pin
es
Se
rbia
Tu
nis
ia U
kra
ine
Bra
zil
Uru
gu
ay
El S
alv
ad
or
Eg
ypt,
Ara
b R
ep
. K
en
ya T
ha
ilan
d M
ala
ysia
So
uth
Afr
ica
Bo
livia
Ku
wa
it N
ige
ria
2007 2011
Source: Haver Analytics.

10
Predictions for medium term adjustment in construction shares based on the empirical results are encouraging, but raise concerns too. Many European countries’ construction shares are now below their medium-term norms. This suggests that as economic conditions normalize, construction shares are likely to recover. However, a few countries such as Spain, Romania, which had experienced a strong boom in construction before the crisis, have not yet fully adjusted after the crisis (Figure 8). This forebodes a painful adjustment yet to come which will likely weigh on the already weak economic situation of these countries.
Figure 8. Construction Share in Selected European Countries (In percent of GDP)
24
68
1012
1980 1990 2000 2010
Spain
24
68
1012
1980 1990 2000 2010
Ireland
24
68
1012
1980 1990 2000 2010
Iceland
24
68
1012
1980 1990 2000 2010
Cyprus
24
68
1012
1980 1990 2000 2010
Croatia
24
68
1012
1980 1990 2000 2010
Romania
24
68
1012
1980 1990 2000 2010
Latvia
24
68
1012
1980 1990 2000 2010
Hungary
In p
erce
nt o
f G
DP
Source: Haver Analytics.

11
The remainder of the paper is organized as follows. Section II provides a brief review of the related literature. Section III describes the dataset and the main methodology. Section IV presents the empirical results, and Section V concludes.
II. LITERATURE REVIEW
Most of the cyclical patterns in construction are similar to the business-cycle characteristics of investment in the macro-economic literature. For example, in a comprehensive study of 71 post-war US macro-economic time series, Stock and Watson (1999) found that investment in structure, especially residential structure is highly volatile and pro-cyclical. They also noted that employment in contract and construction is more than twice as volatile as the cyclical component of real GDP.7 These similarities are not a coincidence since construction activity is a type of investment. Construction, as recorded in national accounts, includes housing construction, construction of business structure, and infrastructure related construction. Investment (including in business structure) is typically driven by factors such as general economic conditions, stock market performance, and credit conditions. With intuition traced back to Keynes’s General Theory, Brainard and Tobin (1968) proposed that the ratio—famously known as Tobin’s q—of market valuation of capital assets to their replacement cost is a superior reliable indicator for investment decisions than the rate of interest.8 Blanchard, Rhee, and Summers (1998), however, found that empirically, firm fundamentals such as profit, dividend are a better gauge that market valuation to explain firm level investment. Credit conditions also matter because firms generally face liquidity constraint. Housing construction is driven by demographic trends, household income, housing prices or rent, and credit conditions. Demand for residential housing is influenced by the housing services provided from residential housing, and the process is similar to the demand of other consumer durables (as described in Chow (1957)). In addition to factors like housing price and rent which affect demand, demographic characteristics such as population growth, household formation, and household income are also key deterministic factors. Geography also plays a role. It affects the cost of construction. For example, countries with high population densities would require more high- rise buildings, whose construction costs
7 Basu and Taylor (1999) and Bergman, Bordo, and Jonung (1998) presented similar results with a longer time period and a wider set of countries. Agresti and Mojon (2001) focused on business cycle in the Euro area countries and found that investment was also procyclical.
8 The first formulation where q appeared is in Tobin (1969).
12
are steeper than low-rise buildings (Tan, 1999, Gat, 1995). Also countries endowed with popular tourism destinations will require more tourism infrastructure to accommodate tourism demand and therefore higher construction needs. Different approaches have been developed to explain the time series behavior of investment—in particular the distributed lag feature of investment. Jorgensen (1969) suggested delivery lag as the reason for pro-cyclicality of aggregate investment. This approach is generalized into the adjustment cost approach, where the level of investment is constrained by adjustment costs associated with investment, as formulated e.g. in Mussa (1977) and also Hayashi (1982). Kydland and Prescott (1982) used a time to build technology to generate co-moments of investment with output. Researchers have documented a distinct relationship between stages of economic growth and demand for construction. As noted in Bon (1992), and also supported in Ruddock and Lopes (2006), the so called “Bon curve” claims that construction demand is low in less developed economies. During their expansion phase, the growth in construction outstrips the rest of the economy and therefore increases as a share of GDP. As the economy approaches maturity, the rate of increase in construction slows and as a result the construction share (as a percent to GDP) declines.
III. DATA SET AND MAIN METHODOLOGY
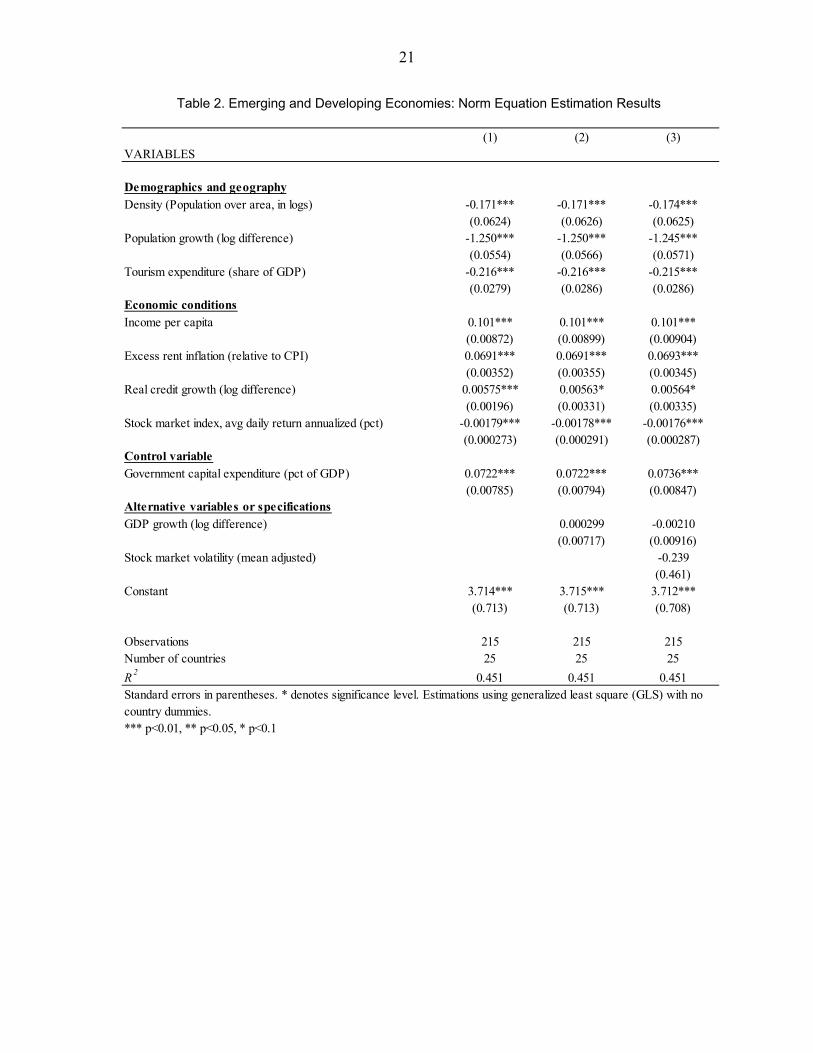
We incorporate three elements of the literature summarized above to analyze the cross-country and time-varying differences in construction shares, particularly in Europe. First, the compiled dataset includes potential explanatory variables related to geography, demographics, and economic conditions. Second, the modeling and estimation attempts to capture the pro-cyclicality through a distributive lag and an error-correction process (similar to the adjustment cost approach). Finally, advanced economies and emerging economies are treated separately given the long-term shifts in construction shares as economies develop. The dataset includes annual data for over 23 advanced economies and 25 emerging economies, spanning a period from the middle of 1990 to 2011. The full list of countries is in the appendix table A1. The data span varies across countries because of missing The countries are separated into two groups (advanced and emerging economies) with estimation performed separately following different specifications for each type of economy.9 Following the literature, we identify—and collect data on—three sets of country specific variables. They are related to geography, demographics, and economic conditions.
9 The hypothesis of structural homogeneity across economies (advanced and emerging) was tested and rejected (see table A3).
13
Geographic variables include population density, and whether the country contains popular tourist destinations. For the latter, we use tourism expenditure (in percent of GDP) as a Demographic variables include population growth, dependency ratio, and share of urban population. Variables related to economic conditions include level of per capita income, excess rent inflation (above CPI inflation), unemployment rate, credit conditions (interest rate or private sector credit growth), and stock market performance (return and volatility of main stock market index). Since national accounts data do not distinguish private and public related construction activities, we also include government capital expenditure (in percent of GDP) as a control variable.10 Because public capital expenditure may react differently to some of factors listed earlier—particularly economic conditions, including the government capital expenditure variable will help mitigate the potential missing variable bias. The variables applied in the analysis are limited by data availability. For example, we would like to use housing price as an explanatory variable, but there are no consistent and reliable housing price data available for a large enough set of countries. As a remedy, we use data on excess rent inflation (which is the difference between rent inflation and headline inflation). Details on data and their sources are provided in appendix Table A2. Data on the stock of business or housing structures would have permitted a stock-and-flow approach to modeling, but they are not easily available. We model the construction share as following an autoregressive (AR), error-correction process. For country i and time t, its construction share yit is governed by the following relationships. First, there is construction share norm which is related to k country-specific fundamental variables of , , … , , where ⋯ (1) The short-run dynamics of actual yit then follows an error correction process: ⋯ ⋯ (2) where ⋯ , is the deviation from the norm. In reality, yit
norm is unobserved. So it has to be estimated indirectly. Rather than specify it as some smoothed version of yit, we instead apply the two-step procedure proposed by Engel
10 This variable is based on construction spending so its coverage does not accord strictly with that of the value-add construction share.

14
and Granger (1987), and estimate the equation (1) using yit directly. The estimates from this equation generate an error correction component (EC)—also called deviation from the norm. The EC term acts as a lever in the second equation on the short-run dynamics. Equation (2) models the change in construction share as a function of its own past dynamics, as well as the deviation from the norm in the previous period (ECt-1). This set up, as noted by Engel and Granger (1987), is equivalent to modeling yit as an AR process, when yit is stationary. The estimation of equation (1) is done using a panel based generalized least square (GLS) method to control for cross country heterogeneity. Given the wide variation across countries, the issue of cross-section heterogeneity is a serious concern, and its existence are confirmed by the test results of cross-section heterogeneity (see Appendix table A3). Estimation results show that, as expected, demographics, geography, and economic conditions are the main factors determining construction shares. The results of different specifications of eq. (1) are shown in Table 1-2 for advanced and emerging economies separately. For both types of economies, a core set of variables appear to have significant explanatory power. The signs of the coefficients are in line with what theory would predict and the coefficients are stable across different specifications, although there are differences between the two types of economies.11 Here are the results discussed in more detail:
Higher population density generally raises the construction share for both types of economies. This is likely because of the higher cost of building high-density structure as noted earlier.
Countries having attractive tourism destinations would understandably require more
infrastructure for tourist accommodation, and have higher construction shares. This is evident for both types of economies.12
For advanced economies, the dependency ratio negatively affects the construction share. Dependency ratio affects construction through a few different and possibly competing channels. For example, a population with a high dependency ratio will have higher number of families. This will tend to increase demand for residential
11 The norm equation is also estimated using fixed effects and random effects to check for robustness (appendix Table A3-4). They show that fixed and random effects estimation results are not satisfactory which are expected given the presence of cross-section heterogeneity.
12 It should be pointed out that tourism expenditure is not a perfect proxy and it would be better to use the stock of tourism infrastructure. High tourism expenditure does not necessarily mean permanently higher construction shares since after an initial period of construction, the stock of tourism infrastructure would be adequate to meet demand.

15
housing. On the other hand, high dependency ratio reduces household earning and thus housing affordability, depressing demand for housing. Our results suggest that overall, a higher dependency ratio may reduce housing affordability enough that demand for construction is reduced.
For emerging economies, population growth is a significant explanatory variable, and is also significant for advanced economies in some specifications.13
On economic conditions, higher per capita income, excess rent inflation, more favorable credit conditions, a booming stock market, and less volatile stock market performance generally contributes to higher construction shares. These variables are significant for both advanced and emerging economies. As discussed earlier, these variables affect the investment demand in business and residential structures through different channels. Higher per capita income (and lower unemployment rate for advanced economies) directly boosts household income. Easier credit conditions such as lower interest rate (or higher credit growth as proxied for emerging economies) reduce the liquidity and financing constraints for business and households. A booming and less volatile, stock market stimulates investment by increasing Tobin’s q for firms, and by increasing household wealth and investment demand. Rapidly rising rent—in excess of general inflation—would boost investment for residential housing since it makes house ownership more attractive, and also increases the return on residential investment for commercial developers.
As a control variable, government capital expenditure is significant, reflecting the
large portion of government capital investment in infrastructure. Other control variables such as global real GDP growth, or a country’s own GDP growth are not significant.
To illustrate the results of the norm equation, we show in Figures 9 and 10, a decomposition of the estimated construction share norm for a few selected European countries. The results are presented as differences relative to a reference country (Germany for advanced Europe and Czech Republic for CESEE countries.), and they demonstrate the major components for construction share norm (in relative importance).14 In Cyprus, for example, the main factors behind its high construction share norm (relative to Germany) were tourism expenditure, government capital expenditure, and lower pre-crisis unemployment. In Ireland, before the crisis, a few factors including high tourism expenditure, low unemployment and high excess 13 Other demographic variables such as ratio of urban population, share of population age 25-49 are also significant for advanced economies in certain specifications.
14 For advanced European countries, differences in the contribution of interest rate and stock market variables are very minor (less than 0.1 percentage point of GDP) and are not shown.
16
rent inflation, high dependency ratio, as well as government capital expenditure contributed to a relatively high construction share norm. Since the crisis, the construction share norm has fallen significantly, in line with high unemployment, decline in per capita income, and a fall in rent inflation. For Spain, the fundamentals suggested a relatively small difference in the construction share norm (of less than 2 percent) with that of Germany (before the crisis), as the positive affect of high tourism expenditure and high government capital expenditure are offset by higher unemployment rate, lower per capital income, and higher population density, even though the actual construction shares were much higher than Germany’s. Nevertheless, the large gap between actual and the norm for Spain suggests that Spain is somewhat an outlier in this group. Having estimated the construction share norm equation, the error-correction dynamic equation (2) is estimated, and the results are shown in Table 3–4. The chosen specification of the construction share norm equation is the first specification in Table 1–2 for the two types of economies respectively. Results of the dynamic equation (2) show that changes in construction share can be well captured by a relatively simple AR(1), error-correction process. For both types of economies, the estimation is done using the dynamic panel estimation method proposed in Arellano and Bond (1991). The second lag of construction share and error-correction term are not significant, and the Arellano-Bond test statistics for autocorrelation in first differences are well behaved, suggesting no further correlation in the differenced residuals. The coefficients of the error-correction terms for both types of economies are remarkably similar at 0.3. This suggests that for each period, about a third of the previous period’s gap between the construction share norm and actual level of construction share are corrected in the current period. On the other hand, the AR(1) coefficients are positive, and are 0.46 and 0.3 respectively for the two type of economies.
IV. WHAT DO THE RESULTS REVEAL?
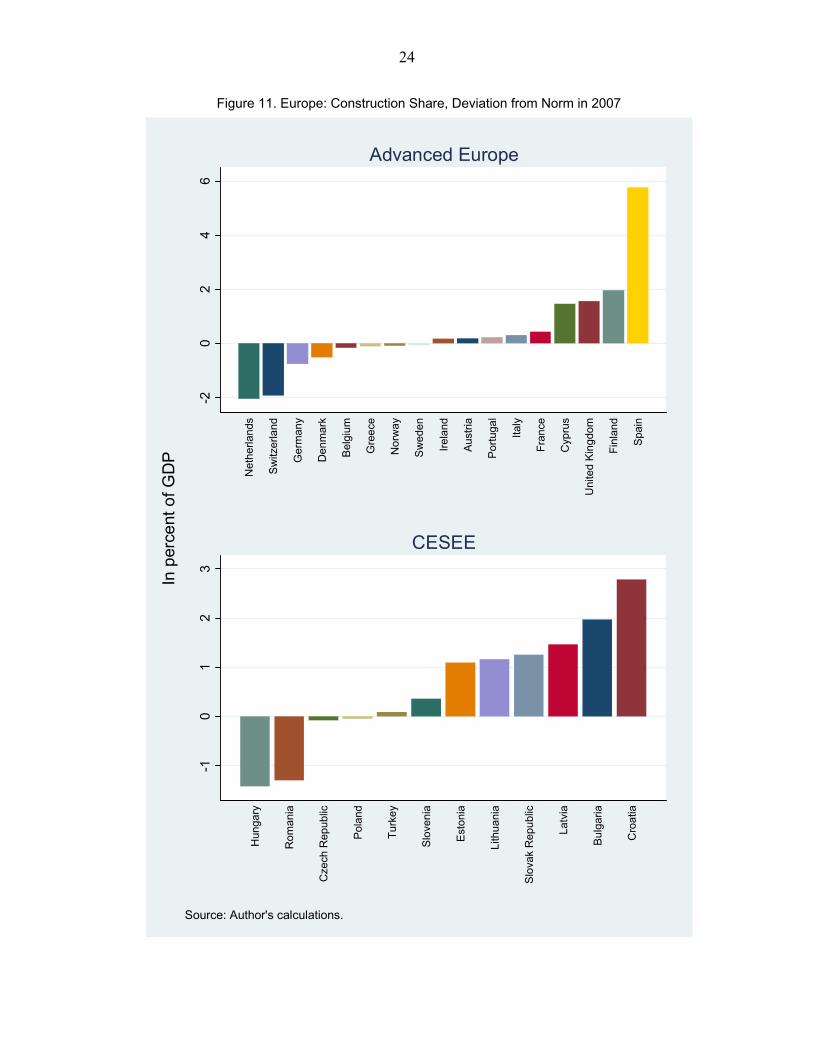
A. Advanced Europe
At the peak of the boom, construction shares in several European countries appear to be above the norm based on country specific fundamentals and economic conditions (Figure The actual construction share significantly exceeded its norm in Spain, Finland, Cyprus, and United Kingdom; a few others like Netherland, Switzerland were below the norm.15 Most striking is Spain, where the actual share exceeded the norm by close to six percentage points of GDP. On the other hand, Ireland’s construction share peaked in 2006 (exceeding the norm
15 Vermeulen and Rouwendal (2007) found that government regulation of land use was the main factor restricting housing supply (and high housing price) in the Netherlands, which may explain the persistently lower actual construction share relative to the construction share norm in the Netherlands.
17
by about 1.7 percentage points of GDP) but fell sharply in 2007 as its economy succumbed to crisis. The decline in construction share since the global crisis appears to be mostly in line with model predictions. In Figure 12, we present the cumulative adjustment in construction share since 2008 predicted by equation (2), using actual data for explanatory variables except for the construction share itself. Some of the model predictions are quite close to the actual change observed since 2008. For Austria, Norway, Sweden, Belgium, Italy, France, UK, Iceland, and France, the difference is less than 2 percentage points of GDP. For Spain, Ireland, the Netherlands, Cyprus, Switzerland, and Greece, there is a large gap between the predicted adjustment and actual adjustment. Spain stands out as the actual decline in its construction share has been more benign than predicted by the model. On the other hand, in Ireland and Cyprus, the actual decline has been much larger than the decline predicted by the model. For the Netherlands and Switzerland, while the model predicted an increase in construction share, the actual change is either very small (Switzerland) or close to zero (the Netherlands). For Greece, the actual decline is also larger and sharper than model predictions. For Portugal, Denmark, Germany, Austria, Norway, Sweden, Belgium, France, and the United Kingdom, the small changes in construction shares are very close to that predicted by the model. By 2011, we have seen a divergence between the actual construction share and the potential level of medium-term norm in a couple of countries (Figure 13). The medium-term norms are calculated for each country assuming all explanatory variables revert to the average of 2000–2011 level or to the 2017 level using IMF’s 2013 Spring WEO projections, and they are compared with actual construction shares of 2011.16 The figure shows that for Finland, Spain, and the United Kingdom, the actual construction share was above the predicted medium-term norm. This would signal that construction shares are likely to adjust downwards over the medium-term. On the other hand, it appears that for Ireland, Greece, the Netherlands, and Germany, the 2011 level of construction shares may be below the medium-term norm, and there is room for it to increase over the medium-term.17 For Portugal, Sweden, Italy, and Norway, the 2011 level of construction shares is close to their medium-term norms.
B. Central, Eastern, and Southeastern Europe
For CESEE countries, the results suggest a similar pre-crisis boom in construction, resulting in overshooting of the construction share norm in a few countries. Before the crisis, Croatia,
16 Projections for Cyprus are based on the European Commission’s Winter 2012 forecasts.
17 The recent crisis in Cyprus could result in a much lower medium-term norm than presented here as Cyprus faces a drastic change in its growth model and a reduction in long-term growth potential after the recent crisis.

18
Bulgaria, the three Baltic countries (Estonia, Latvia, and Lithuania), and Slovak Republic had a strong boom in construction that exceeded the norm determined by their country specific fundamentals. At the peak of boom (2007), the difference is over 1 percentage point of GDP for these countries, and close to 3 percent for Croatia. On the other end of the spectrum, Hungary and Romania appeared to be below the norm in 2007.18 The pace of adjustment since the 2008 crisis has varied in the CESEE as in advanced Europe. For countries like Lithuania and Latvia, the actual decline has been more severe than projected by the model. For Ukraine, Hungary, and Serbia, and to a less extent, Slovenia, Czech Republic, and Turkey, the actual decline is not severe, but was the opposite of the increase predicted by the model. For Estonia, Poland, and Bulgaria, the adjustment in construction shares is close to what is predicted by the model. On the other hand, in Croatia, Romania, and Slovak Republic, the actual decline or increase in construction share is either smaller than or opposite of model predictions. Looking forward, construction shares could further change over the medium-term for a few of the CESEE countries. For example, in Ukraine, Serbia, Latvia, Lithuania, and Hungary, the 2011 level of construction share is below the medium-term norm, which suggests room for increase over the medium-term. On the other hand, for Slovak Republic and Romania, and to a lesser extent, Croatia, Bulgaria, and Estonia, the 2011 level is above the medium-term norm. This overshooting indicates that there is a very real possibility that construction share may adjust downward in these countries over the medium-term.
V. CONCLUSION
We have shown that changes in construction shares revolve around a norm that is determined by country specific characteristics. These characteristics, or fundamentals, include a country’s geography, demographics, and economic conditions. The pro-cyclical nature of construction shares can be captured by a simple AR(1) error-correction process.19 Based on these empirical results, there is clear evidence of overshooting during the 2000–07 construction booms in Europe. Many countries such as Spain, Ireland, the Baltic countries, Croatia, and Romania experienced strong construction booms. In these countries, construction shares exceeded their norms for a sustained period.
18 During the period of 1980-2007, the average deviation from estimated norm was high in Croatia, Estonia, Bulgaria, and Romania, but low in Hungary.
19 The definition of construction may not be the same across countries, and it may have also changed over time for some countries. But these caveats should have relatively small impact on the results of the paper since the panel estimation adjusts for cross county heterogeneity.

19
Since the crisis, this process has been largely reversed but the pace has not been uniform. The decline in construction shares took place in most of the European countries accompanying the economic recession. In some economies, such as Ireland, Cyprus, Latvia, and Lithuania, the decline has been steeper than predicted by the model. In some other countries like Ukraine and Hungary, there was a decline instead of the increase predicted by the model. In many countries, including Austria, Sweden, Belgium, Italy, France, the U.K., Poland, and Bulgaria, the adjustment is closely in line with model projections. In Spain and Cyprus, the actual changes are smaller than expected, and construction shares actually increased in Slovak Republic and Romania in contrast to the predicted declines. Further adjustment may be in store for some economies before they reach their projected medium-term norms. While many countries could expect construction shares to recover as economy conditions normalize, this would not be the case for all. Construction shares in Spain, Finland, and Romania may need to decline further before being fully aligned with their medium-term norms. For Spain in particular, the large gap indicates that such a decline in construction activity would weigh heavily on its economic activity and employment.

20
Table 1. Advanced Economies: Norm Equation Estimation Results
(1) (2) (3) (4) (5) (6)VARIABLES
Demographics and geographyDependency Ratio (pct) -0.0980*** -0.0988*** -0.0812*** -0.163*** -0.103*** -0.0716***
(0.00944) (0.00936) (0.00969) (0.0218) (0.00964) (0.0138)Density (Population over area, in logs) 0.503*** 0.503*** 0.621*** -0.214*** 0.487*** 0.202***
(0.0256) (0.0257) (0.0279) (0.0258) (0.0232) (0.0410)Tourism expenditure (share of GDP) 0.295*** 0.295*** 0.306*** 0.392*** 0.263*** 0.351***
(0.0151) (0.0151) (0.0149) (0.0221) (0.0163) (0.0158)Economic conditionsIncome per capita 0.00643*** 0.00676*** 0.00710*** -0.0138*** 0.00778*** -0.00368
(0.00151) (0.00144) (0.00117) (0.00250) (0.00152) (0.00275)Excess rent inflation (relative to CPI) 0.0617*** 0.0566*** 0.0749*** 0.000357 0.0441*** 0.0241
(0.0176) (0.0178) (0.0151) (0.0204) (0.0170) (0.0178)Unemployment rate (pct) -0.168*** -0.166*** -0.153*** -0.0314** -0.148*** -0.152***
(0.0115) (0.0116) (0.0108) (0.0160) (0.0126) (0.0142)Interest rate (pct) -0.0342*** -0.0349*** -0.0496*** 0.00673 -0.0330***
(0.00991) (0.00990) (0.00949) (0.0145) (0.00913)Stock market index, avg daily return annualized (pct) -0.00145*** -0.00157*** -0.000537 -2.26e-05 -0.000930** -0.000187
(0.000512) (0.000504) (0.000342) (0.000710) (0.000467) (0.000689)Stock market volatility (mean adjusted) -0.883** -1.279*** -0.554** 0.776** -0.915*** -0.289
(0.353) (0.456) (0.219) (0.364) (0.326) (0.390)Control variableGovernment capital expenditure (pct of GDP) 0.440*** 0.442*** 0.480*** 0.0629* 0.399*** 0.252***
(0.0224) (0.0227) (0.0226) (0.0330) (0.0248) (0.0315)Global GDP at market exchange rate (% change) -0.0178
(0.0144)Alternative variables or specificationsPopulation growth (log difference) 0.434***
(0.0772)Ratio of population age 25-49 -24.50***
(2.568)Share of urban population (pct) -0.0108***
(0.00261)Real credit growth (log difference) 0.00355
(0.00476)Constant 14.05*** 14.15*** 13.85*** 19.62*** 14.93*** 10.20***
(0.471) (0.472) (0.443) (1.884) (0.455) (0.657)
Observations 273 273 273 238 253 253Number of countries 23 23 23 22 23 23
R2
0.193 0.193 0.188 0.510 0.176 0.299
*** p<0.01, ** p<0.05, * p<0.1Standard errors in parentheses. * denotes significance level. Estimations using generalized least square (GLS) with no country dummies.
21
Table 2. Emerging and Developing Economies: Norm Equation Estimation Results
(1) (2) (3)VARIABLES
Demographics and geographyDensity (Population over area, in logs) -0.171*** -0.171*** -0.174***
(0.0624) (0.0626) (0.0625)Population growth (log difference) -1.250*** -1.250*** -1.245***
(0.0554) (0.0566) (0.0571)Tourism expenditure (share of GDP) -0.216*** -0.216*** -0.215***
(0.0279) (0.0286) (0.0286)Economic conditionsIncome per capita 0.101*** 0.101*** 0.101***
(0.00872) (0.00899) (0.00904)Excess rent inflation (relative to CPI) 0.0691*** 0.0691*** 0.0693***
(0.00352) (0.00355) (0.00345)Real credit growth (log difference) 0.00575*** 0.00563* 0.00564*
(0.00196) (0.00331) (0.00335)Stock market index, avg daily return annualized (pct) -0.00179*** -0.00178*** -0.00176***
(0.000273) (0.000291) (0.000287)Control variableGovernment capital expenditure (pct of GDP) 0.0722*** 0.0722*** 0.0736***
(0.00785) (0.00794) (0.00847)Alternative variables or specificationsGDP growth (log difference) 0.000299 -0.00210
(0.00717) (0.00916)Stock market volatility (mean adjusted) -0.239
(0.461)Constant 3.714*** 3.715*** 3.712***
(0.713) (0.713) (0.708)
Observations 215 215 215Number of countries 25 25 25
R2
0.451 0.451 0.451
*** p<0.01, ** p<0.05, * p<0.1
Standard errors in parentheses. * denotes significance level. Estimations using generalized least square (GLS) with no country dummies.

22
Figure 9. Selected Advanced European Countries: Construction Share (Actual, norm, and components of the norm)
Source: Author's calculaton. Note. All variables shown are relative to Germany (used as a reference country), based on estimation. For example, the norm shown is the difference of the norm vis-a-vis the norm of
Germany. Contributions from interest rate and stock market variables are less than 0.1 percent of GDP and are not shown.
-2
-1
0
1
2
3
4
5
6
7
8
9
2000 2002 2004 2006 2008 2010
Cyprus
-3
-2
-1
0
1
2
3
4
2000 2002 2004 2006 2008 2010
Greece
-4
-3
-2
-1
0
1
2
3
4
5
6
2000 2002 2004 2006 2008 2010
Ireland
-1
-0.5
0
0.5
1
1.5
2
2.5
2000 2002 2004 2006 2008 2010
Italy
-2
-1
0
1
2
3
4
2000 2002 2004 2006 2008 2010
Portugal
-4
-2
0
2
4
6
8
10
2000 2002 2004 2006 2008 2010
Spain

23
Figure 10. Selected CESEE European Countries: Construction Share (Actual, norm, and components of the norm)
Source: Author's calculaton. Note. All variables shown are relative to Czech Republic (used as a reference country), based on estimation. For example, the norm shown is the difference of the norm vis-a-vis the norm of Czech Republic.
-5
-4
-3
-2
-1
0
1
2
3
2000 2002 2004 2006 2008 2010
Croatia
-6
-5
-4
-3
-2
-1
0
1
2
3
4
2000 2002 2004 2006 2008 2010
Estonia
-2.5
-2
-1.5
-1
-0.5
0
0.5
1
1.5
2000 2002 2004 2006 2008 2010
Hungary
-4
-3
-2
-1
0
1
2
3
4
2000 2002 2004 2006 2008 2010
Latvia
-2
-1.5
-1
-0.5
0
0.5
1
1.5
2
2000 2002 2004 2006 2008 2010
Poland
-5
-4
-3
-2
-1
0
1
2
3
2000 2002 2004 2006 2008 2010
Ukraine
24
Figure 11. Europe: Construction Share, Deviation from Norm in 2007
-20
24
6
Net
herla
nds
Sw
itzer
land
Ger
man
y
Den
mar
k
Bel
gium
Gre
ece
Nor
way
Sw
eden
Irel
and
Aus
tria
Por
tuga
l
Italy
Fra
nce
Cyp
rus
Uni
ted
Kin
gdom
Fin
land
Spa
in
Advanced Europe
-10
12
3
Hun
gary
Rom
ania
Cze
ch R
epub
lic
Pol
and
Tur
key
Slo
veni
a
Est
onia
Lith
uani
a
Slo
vak
Rep
ublic
Latv
ia
Bul
garia
Cro
atia
CESEE
In p
erce
nt o
f G
DP
Source: Author's calculations.

25
Table 3. Advanced Economies: Dynamic Equation Estimation Results
Table 4. Emerging and Developing Economies: Dynamic Equation Estimation Results
(1) (2)VARIABLES
Δyt-1 0.342* 0.456***
(0.179) (0.121)
Δyt-2 -0.0283
(0.103)
EC t-1 -0.147 -0.308***
(0.111) (0.0684)
EC t-2 -0.216
(0.132)Constant 0.256 0.231
(0.210) (0.181)
Observations 206 229Number of countries 23 23Arellano-Bond test for AR(1) 0.00618 0.00559Arellano-Bond test for AR(2) 0.731 0.883
*** p<0.01, ** p<0.05, * p<0.1Standard errors in parentheses. * denotes significance level.
Note. Error correction term (EC) is based on GLS estimation of specification (1) in Table 2.
(1) (2)VARIABLES
Δyt-1 0.415*** 0.292***
(0.100) (0.0681)
Δyt-2 -0.184
(0.139)
EC t-1 -0.378*** -0.309***
(0.0725) (0.0577)
EC t-2 0.109
(0.0878)Constant 0.241*** 0.246***
(0.0850) (0.0880)
Observations 143 166Number of countries 22 23Arellano-Bond test for AR(1) 0.0260 0.0609Arellano-Bond test for AR(2) 0.197 0.964
*** p<0.01, ** p<0.05, * p<0.1Standard errors in parentheses. * denotes significance level.
Note. Error correction term (EC) is based on GLS estimation of specification (1) in Table 2.

26
Figure 12. Europe: Cumulative Adjustment in Construction Share (Relative to projection from 2008)
-10
-50
5
Ire
lan
d
Net
her
lan
ds
Cyp
rus
Sw
itze
rlan
d
Gre
ece
Po
rtug
al
De
nm
ark
Ge
rma
ny
Au
stri
a
Nor
way
Sw
eden
Be
lgiu
m
Ita
ly
Fra
nce
Un
ited
Kin
gdom
Fin
lan
d
Spa
in
Advanced Europe
-4-2
02
46
Ukr
ain
e
Lith
uan
ia
Hu
nga
ry
Lat
via
Ser
bia
Slo
ven
ia
Cze
ch R
epub
lic
Tu
rke
y
Est
on
ia
Po
lan
d
Bul
gari
a
Cro
atia
Ro
man
ia
Slo
vak
Rep
ublic
CESEE
In p
erc
en
t of G
DP
Note. Projected adjustment based on estiamted error correction model and actual observations.of independent variables in 2008-2011.Source: Author's calculations.
pred. actual pred.-act.

27
Figure 13. Europe: Deviation from Medium-Term Fundamental in Construction Shares
24
68
10
Sp
ain
Fin
lan
d
Gre
ece
Fra
nce
Ice
land
Ita
ly
Sw
ede
n
No
rwa
y
Po
rtu
gal
De
nm
ark
Un
ited
Kin
gdo
m
Be
lgiu
m
Ge
rma
ny
Irel
and
Au
stri
a
Ne
ther
lan
ds
Sw
itze
rlan
d
Cyp
rus
Advanced Europe
24
68
10
Cro
atia
Bu
lga
ria
Est
on
ia
Tu
rke
y
Hu
nga
ry
Slo
ven
ia
Cze
ch R
epu
blic
Ukr
ain
e
Se
rbia
Po
lan
d
Slo
vak
Re
pub
lic
Lat
via
Lith
uan
ia
Ro
man
ia
CESEE
In p
erc
en
t of G
DP
Note. The medium-term norm is calculated assuming some explanatory variables revertto the average of 2000-2011 level and others at WEO projected 2017 level.Source: Author's calculations.
Actual 2011 medium-term norm Norm 2011
28
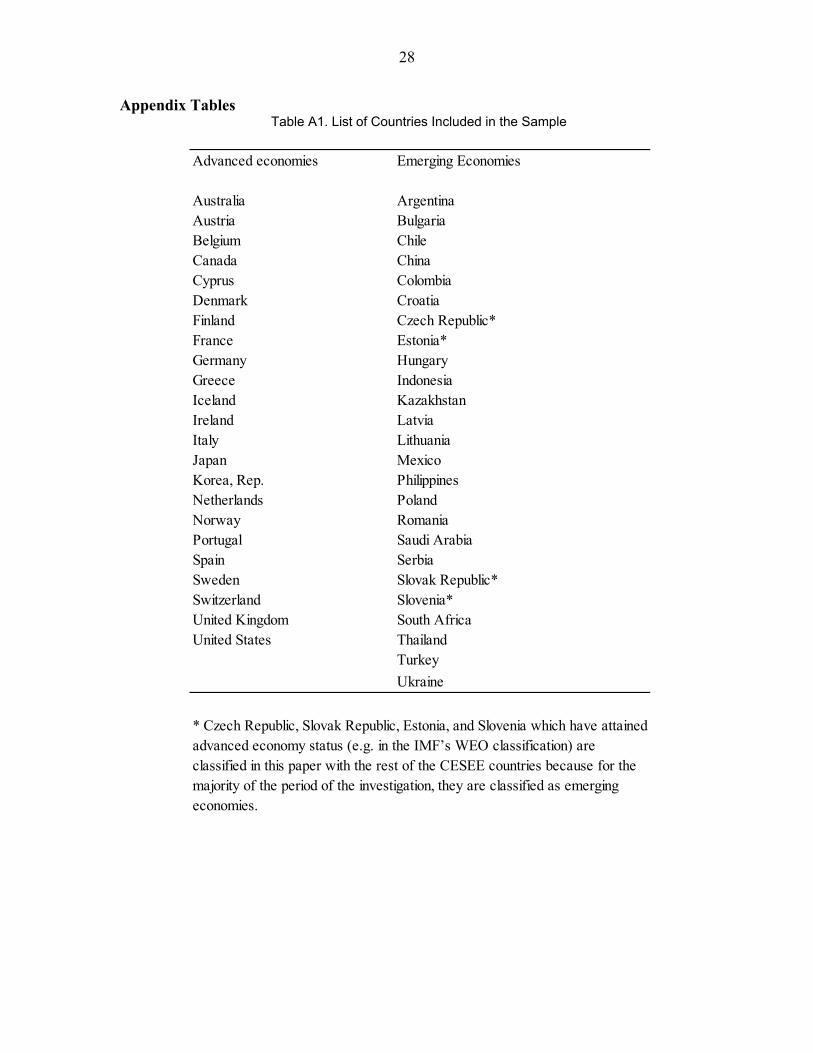
Appendix Tables Table A1. List of Countries Included in the Sample
Advanced economies Emerging Economies
Australia ArgentinaAustria BulgariaBelgium ChileCanada ChinaCyprus ColombiaDenmark CroatiaFinland Czech Republic*France Estonia*Germany HungaryGreece IndonesiaIceland KazakhstanIreland LatviaItaly LithuaniaJapan MexicoKorea, Rep. PhilippinesNetherlands PolandNorway RomaniaPortugal Saudi ArabiaSpain SerbiaSweden Slovak Republic*Switzerland Slovenia*United Kingdom South AfricaUnited States Thailand
Turkey
Ukraine
* Czech Republic, Slovak Republic, Estonia, and Slovenia which have attained advanced economy status (e.g. in the IMF’s WEO classification) are classified in this paper with the rest of the CESEE countries because for the majority of the period of the investigation, they are classified as emerging economies.

29
Table A2. List of Data and Its Sources
Table A3. Heterogeneity test results
Variable Source
Population IFSShare of urban population OECDRatio of age 25-49 OECDDependency ratio World Development IndexArea CIA World Fact BookGDP WEOConstruction (Value added) Have Analytics, OECD, EurostatInterest rate IFS (lending rate, various definitions), World Development IndexPrivate Sector Credit (Nominal) IFS and Haver Analytics (various definitions)Unemployment rate WEO, Haver AnalyticsGlobal GDP growth WEOCPI: Rent for housing Haver AnalyticsCPI Haver AnalyticsTourism expenditure World Development Index, World BankIncome per capita (in US dollars) WEOGovernment capital expenditure AMECO (Europeans Commission), World Development IndexStock market index Bloomberg, World Development IndexStock market index volatility (mean adjusted) Calculated (based on daily stock market index data)
Advanced EconomiesEmerging and Developing Economies
Specification (1) in Table 1 Specification (1) in Table 2
Null hypthoesis No heterogeneity in panel No heterogeneity in panel
Likelihood-ratio (LR) χ2(22) χ
2(24)
LR statistic 462.33 162.71
Prob > χ2 0 0

30
Table A4. Advanced Economies: Alternative Estimation for Construction Norm Equation
(1) (2) (3)
VARIABLES GLS Fixed effect Random Effect
Dependency ratio (pct) -0.0980*** -0.118 -0.134**
(0.00944) (0.0717) (0.0558)
Density (Population over area, in logs) 0.503*** -0.880 -0.640
(0.0256) (6.461) (0.427)
Excess rent inflation (relative to CPI) 0.0617*** 0.0411*** 0.0418***
(0.0176) (0.00757) (0.00862)
Tourism expenditure (share of GDP) 0.295*** 0.0349 0.0884
(0.0151) (0.220) (0.169)
Income per capita 0.00643*** 0.0332** 0.0299***
(0.00151) (0.0151) (0.00927)
Unemployment rate (pct) -0.168*** -0.268*** -0.261***
(0.0115) (0.0343) (0.0492)
Interest rate (pct) -0.0342*** 0.0141 0.00501
(0.00991) (0.0586) (0.0377)
Stock market index, avg daily return annualized (pct) -0.00145*** 0.00343*** 0.00310***
(0.000512) (0.00106) (0.00112)
Stock market volatility (mean adjusted) -0.883** 0.00659 0.135
(0.353) (0.333) (0.313)
Government capital expenditure (pct of GDP) 0.440*** 0.342 0.345*
(0.0224) (0.210) (0.188)
Constant 14.05*** 3.221 6.098
(0.471) (58.12) (3.730)
Observations 273 273 273
Number of countries 23 23 23
*** p<0.01, ** p<0.05, * p<0.1
Data source: Haver Analytics.
Standard errors in parentheses. * denotes significance level. Estimations using generalized least square (GLS) with no country
dummies.

31
Table A5. Emerging Economies: Alternative Estimation for Construction Norm Equation
(1) (2) (3)VARIABLES GLS Fixed effect Random Effect
Density (Population over area, in logs) -0.171*** 1.004 -0.0193(0.0624) (8.906) (0.361)
Population growth (log difference) -1.250*** -0.0668 -0.235(0.0554) (0.498) (0.274)
Excess rent inflation (relative to CPI) 0.0691*** 0.0336** 0.0338**(0.00352) (0.0133) (0.0136)
Tourism expenditure (share of GDP) -0.216*** -0.0987 -0.109(0.0279) (0.131) (0.0920)
Real credit growth (log difference) 0.00575*** 0.00999 0.0109*(0.00196) (0.00725) (0.00622)
Stock market index, avg daily return annualized (pct) -0.00179*** -0.00163* -0.00173**(0.000273) (0.000811) (0.000849)
Income per capita 0.101*** 0.127*** 0.129***(0.00872) (0.0376) (0.0328)
Government capital expenditure (pct of GDP) 0.0722*** 0.147 0.106(0.00785) (0.115) (0.0761)
Constant 3.714*** 14.14 4.465(0.713) (85.67) (3.877)
Observations 215 215 215Number of countries 25 25 25
*** p<0.01, ** p<0.05, * p<0.1Standard errors in parentheses. * denotes significance level. Estimations using generalized least square (GLS) with no country dummies.
32
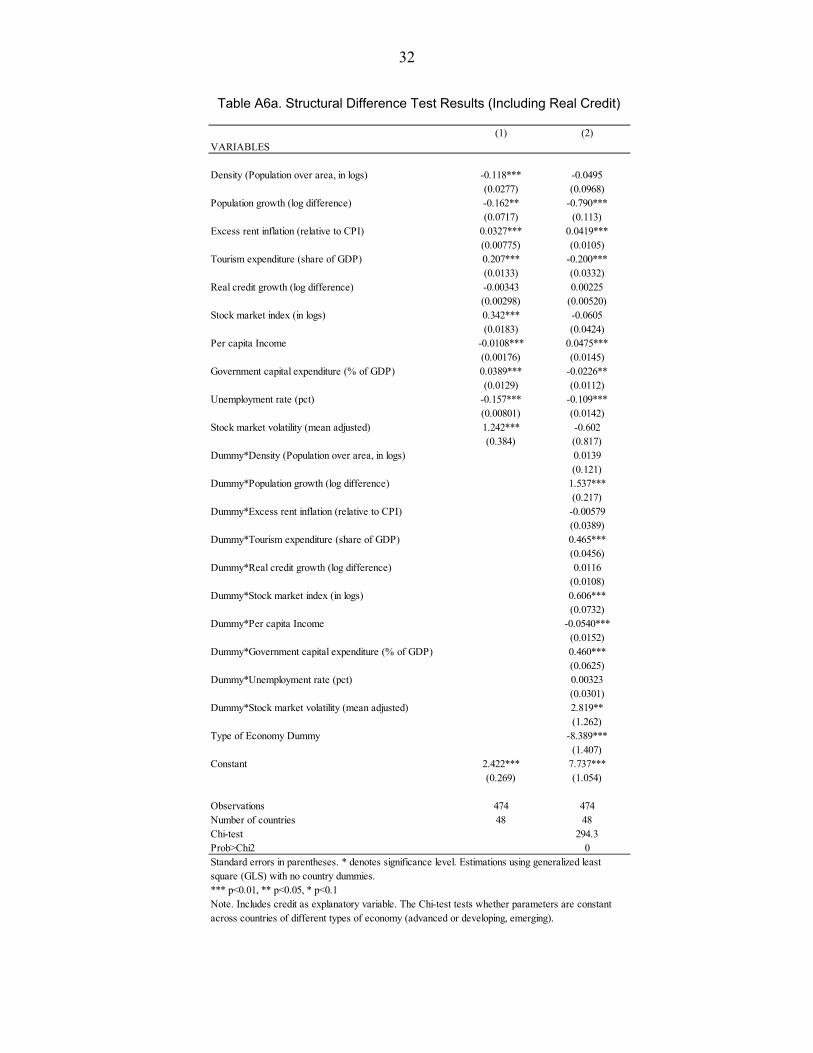
Table A6a. Structural Difference Test Results (Including Real Credit)
(1) (2)VARIABLES
Density (Population over area, in logs) -0.118*** -0.0495(0.0277) (0.0968)
Population growth (log difference) -0.162** -0.790***(0.0717) (0.113)
Excess rent inflation (relative to CPI) 0.0327*** 0.0419***(0.00775) (0.0105)
Tourism expenditure (share of GDP) 0.207*** -0.200***(0.0133) (0.0332)
Real credit growth (log difference) -0.00343 0.00225(0.00298) (0.00520)
Stock market index (in logs) 0.342*** -0.0605(0.0183) (0.0424)
Per capita Income -0.0108*** 0.0475***(0.00176) (0.0145)
Government capital expenditure (% of GDP) 0.0389*** -0.0226**(0.0129) (0.0112)
Unemployment rate (pct) -0.157*** -0.109***(0.00801) (0.0142)
Stock market volatility (mean adjusted) 1.242*** -0.602(0.384) (0.817)
Dummy*Density (Population over area, in logs) 0.0139(0.121)
Dummy*Population growth (log difference) 1.537***(0.217)
Dummy*Excess rent inflation (relative to CPI) -0.00579(0.0389)
Dummy*Tourism expenditure (share of GDP) 0.465***(0.0456)
Dummy*Real credit growth (log difference) 0.0116(0.0108)
Dummy*Stock market index (in logs) 0.606***(0.0732)
Dummy*Per capita Income -0.0540***(0.0152)
Dummy*Government capital expenditure (% of GDP) 0.460***(0.0625)
Dummy*Unemployment rate (pct) 0.00323(0.0301)
Dummy*Stock market volatility (mean adjusted) 2.819**(1.262)
Type of Economy Dummy -8.389***(1.407)
Constant 2.422*** 7.737***(0.269) (1.054)
Observations 474 474Number of countries 48 48Chi-test 294.3Prob>Chi2 0
*** p<0.01, ** p<0.05, * p<0.1Note. Includes credit as explanatory variable. The Chi-test tests whether parameters are constant across countries of different types of economy (advanced or developing, emerging).
Standard errors in parentheses. * denotes significance level. Estimations using generalized least square (GLS) with no country dummies.
33
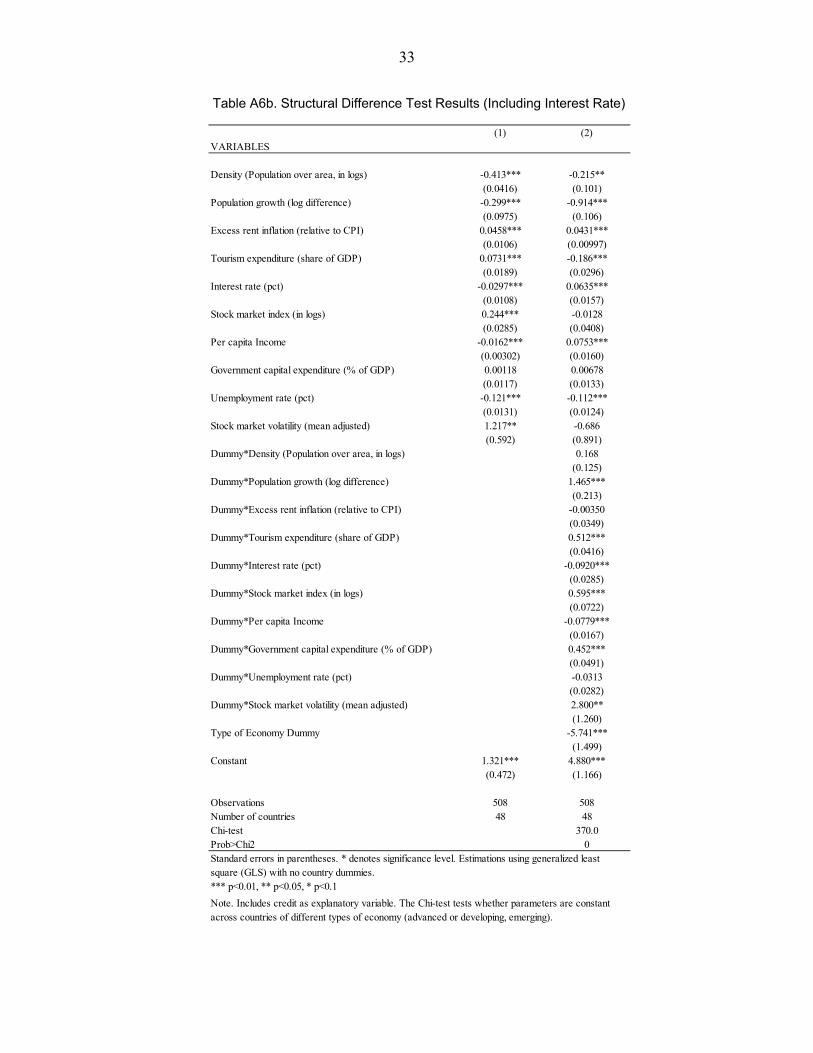
Table A6b. Structural Difference Test Results (Including Interest Rate)
(1) (2)VARIABLES
Density (Population over area, in logs) -0.413*** -0.215**(0.0416) (0.101)
Population growth (log difference) -0.299*** -0.914***(0.0975) (0.106)
Excess rent inflation (relative to CPI) 0.0458*** 0.0431***(0.0106) (0.00997)
Tourism expenditure (share of GDP) 0.0731*** -0.186***(0.0189) (0.0296)
Interest rate (pct) -0.0297*** 0.0635***(0.0108) (0.0157)
Stock market index (in logs) 0.244*** -0.0128(0.0285) (0.0408)
Per capita Income -0.0162*** 0.0753***(0.00302) (0.0160)
Government capital expenditure (% of GDP) 0.00118 0.00678(0.0117) (0.0133)
Unemployment rate (pct) -0.121*** -0.112***(0.0131) (0.0124)
Stock market volatility (mean adjusted) 1.217** -0.686(0.592) (0.891)
Dummy*Density (Population over area, in logs) 0.168(0.125)
Dummy*Population growth (log difference) 1.465***(0.213)
Dummy*Excess rent inflation (relative to CPI) -0.00350(0.0349)
Dummy*Tourism expenditure (share of GDP) 0.512***(0.0416)
Dummy*Interest rate (pct) -0.0920***(0.0285)
Dummy*Stock market index (in logs) 0.595***(0.0722)
Dummy*Per capita Income -0.0779***(0.0167)
Dummy*Government capital expenditure (% of GDP) 0.452***(0.0491)
Dummy*Unemployment rate (pct) -0.0313(0.0282)
Dummy*Stock market volatility (mean adjusted) 2.800**(1.260)
Type of Economy Dummy -5.741***(1.499)
Constant 1.321*** 4.880***(0.472) (1.166)
Observations 508 508Number of countries 48 48Chi-test 370.0Prob>Chi2 0
*** p<0.01, ** p<0.05, * p<0.1
Note. Includes credit as explanatory variable. The Chi-test tests whether parameters are constant across countries of different types of economy (advanced or developing, emerging).
Standard errors in parentheses. * denotes significance level. Estimations using generalized least square (GLS) with no country dummies.
34
References Agresti, A. and Mojon, B. (2001), “Some stylized facts on the euro area business cycle”,
Working Paper 95, European Central Bank. Arellano, M. and Bond, S. (1991), “Some tests of specification for panel data: Monte Carlo
evidence and an application to employment equations”. Review of Economic Studies, 58:277-297.
Basu, S. and Taylor, A (1999), “Business cycles in international historical perspective”,
Journal of Economic Perspectives, Vol. 13, No. 2, pages 45-68. Bergman, U M, Bordo, M. D., and Jonung, L (1998), “Historical evidence on business
cycles: the international experience”, in Fuhrer, J and Schuh, S (eds), Beyond shocks: what causes business cycles?, Federal Reserve Bank of Boston, Conference Series No. 42.
Blanchard, O., Rhee, C., and Summers, L. (1993) “The Stock Market, Profit, and Investment”. Quarterly Journal of Economics 108 (1), pp.115–136.
Boldrin, M., Garriga, C., Peralta-Alva, A., and Sánchez, J M. (2013), “Reconstructing the
Great Recession”, Federal Reserve Bank of St. Louis, Working Paper 2013-006A Bon, R (1992) “The future of international construction: secular patterns of growth and
decline”, Habitat International, 16(3), 119-28. Brainard, W. C. and J. Tobin (1968), “Pitfalls in Financial Model Building”, American Economic Review (Papers and Proceedings), 58, May, pp. 99-122. Chow, Gregory C. (1957) Demand for Automobiles in the United States: A Study in
Consumer Durables. North-Holland Publishing Co. Gat, D. (1995), “Optimal Development of a Building Site”, Journal of Real Estate Finance
and Economics, Vol. 11, pp. 77-84. Engle, R.F. and C.W.J. Granger (1987), “Cointegration and Error-Correction:
Representation, Estimation, and Testing”, Econometrica 55 (1) (March), pp. 251-276. European Construction Industry Federation (2012), Annual Report, Brussels,
http://www.fiec.org/DocShare/Common/GetFile.asp?PortalSource=152&DocID=14760&mfd=off&pdoc=1&direct=on

35
Hayashi, F. (1982), “Tobin's Marginal q and Average q: A Neoclassical Interpretation”, Econometrica, 50 (1)(January), pp. 213-24.
Jorgensen, D. (1963), “Capital Theory and Investment Behavior”, The American Economic
Review, 53 (2), Papers and Proceedings of the Seventy-Fifth Annual Meeting of the American Economic Association, (May), pp. 247-259.
Jorgensen, D. (1965), “Anticipations and Investment Behavior”, in The Brookings Quarterly
Econometric Model of the United States, ed. By J. S. Duesenberry et al. Chicago: Rand McNally.
Kydland, F. and Prescott, E., (1982) “Time to Build and Aggregate Fluctuations”,
Econometrica, 50 (6) (November), pp. 1345-1370. Mussa, M. (1977), “External and Internal Adjustment Costs and the Theory of Aggregate and
Firm Investment,” Economica, 44, pp.163-178. Ruddock, L and J Lopes (2006), “The construction sector and economic development: the
Bon curve”, Construction Management and Economics, 24, 717-723. Stock, J. and Watson, M. (1999), “Business cycle fluctuations” in U.S. macroeconomic time
series”, in Taylor, J. and Woodford M., (editors), Handbook of Macroeconomics. Elsevier Science.
Tan, W. (1999), “Construction Costs and Building Height”, Construction Management and
Economics, Vol. 17, pp. 129-132. Tobin, J. (1969), “A general equilibrium approach to Monetary Theory”, Journal of Money,
Credit, and Banking, 1, pp.15-29.
Vermeulen, W. and Rouwendal, J. (2007), Housing Supply and Land Use Regulation in the Netherlands, Tinbergen Institute Discussion Paper No. 07-058/3. Available at SSRN: http://ssrn.com/abstract=1003955%20 or http:/dx.doi.org/10.2139/ssrn.1003955