the double-gap life expectancy forecasting model · 5/27/2016 · forecast: female and male life...
TRANSCRIPT

The Double-Gap Life Expectancy Forecasting Model
Marius Pascariu
Max-Planck Odense Center on the Biodemography of AgingUniversity of Southern Denmark
IAA Mortality Working Group meeting, St.Petersburg
May 27, 2016
Pascariu, Canudas-Romo & Vaupel (MaxO) DGM May 27, 2016 1 / 19
Pascariu, Canudas-Romo & Vaupel (MaxO) DGM May 27, 2016 2 / 19

Classification of the forecasting models
Expectations
Used in the form of expert opinions, targeting of life expectancy andscenarios.
Extrapolative methods
Assume that future trends will essentially be a continuation of the past.
Explanatory methods
Are based on structural or causal epidemiological models of certain causesof death involving known risk factors.
Pascariu, Canudas-Romo & Vaupel (MaxO) DGM May 27, 2016 3 / 19

The Double-Gap Life Expectancy Forecasting Model- Pascariu M., Canudas-Romo V. and Vaupel J.W.
Pascariu, Canudas-Romo & Vaupel (MaxO) DGM May 27, 2016 4 / 19

Objectives
Better forecasts
Female and male population modelled together
International context recognition
Pascariu, Canudas-Romo & Vaupel (MaxO) DGM May 27, 2016 5 / 19

Data
Human Mortality Database (2015)
Historical period: 1950 - 2010
Number of countries: 38
Pascariu, Canudas-Romo & Vaupel (MaxO) DGM May 27, 2016 6 / 19

Record life expectancy at birth
Pascariu, Canudas-Romo & Vaupel (MaxO) DGM May 27, 2016 7 / 19
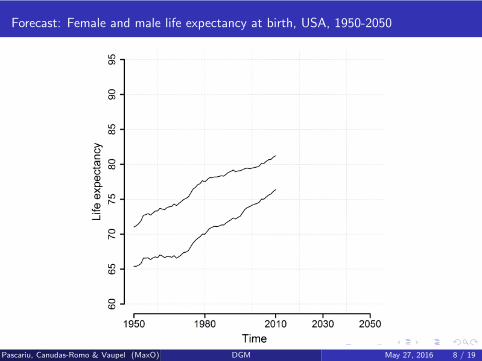
Forecast: Female and male life expectancy at birth, USA, 1950-2050
Pascariu, Canudas-Romo & Vaupel (MaxO) DGM May 27, 2016 8 / 19

Forecast: Female and male life expectancy at birth, USA, 1950-2050
Pascariu, Canudas-Romo & Vaupel (MaxO) DGM May 27, 2016 9 / 19

Forecast: Female and male life expectancy at birth, USA, 1950-2050
Pascariu, Canudas-Romo & Vaupel (MaxO) DGM May 27, 2016 10 / 19

Forecast: Female and male life expectancy at birth, USA, 1950-2050
Pascariu, Canudas-Romo & Vaupel (MaxO) DGM May 27, 2016 11 / 19

Forecast: Female and male life expectancy at birth, USA, 1950-2050
Pascariu, Canudas-Romo & Vaupel (MaxO) DGM May 27, 2016 12 / 19

Forecast: Female and male life expectancy at age 65, USA, 1950-2050
Pascariu, Canudas-Romo & Vaupel (MaxO) DGM May 27, 2016 13 / 19

Results
Forecasts of life expectancy in 2050, with 80% prediction intervals. Themodels were evaluated on data from the period 1950-2010.
AGE 0 AGE 65
Model Indicator Females Males Sex gap Females Males Sex gap
DGMex ,2050 89.58 86.28 3.30 25.53 22.97 2.56
80%PI (88.56-90.59) (84.9-87.62) (1.95-4.68) (24.73-26.25) (21.77-24.16) (1.37-3.76)
LCex ,2050 86.39 81.86 4.53 24.17 21.12 3.05
80%PI (85.67-87.19) (81.23-82.47) - (23.38-24.94) (20.58-21.65) -
CBDex ,2050 - - - 24.39 21.36 3.03
80%PI - - - (23.29-25.58) (20.47-22.27) -
ex ,2010 81.22 76.38 4.84 20.52 17.91 2.61
Pascariu, Canudas-Romo & Vaupel (MaxO) DGM May 27, 2016 14 / 19

Forecasting gaps
D-gap: The gaps to best practice trend
OdDk,x ,t = µk,x︸︷︷︸Drift
+
p∑i=1
φiOdDk,x ,t−i︸ ︷︷ ︸
Regression
+ ε(1)k,x ,t +
q∑j=1
θjε(1)k,x ,t−j︸ ︷︷ ︸
Smoothed noise
G-gap: The sex-gap
G ∗k,x ,t =
β0 + β1Gk,x ,t−1 + β2Gk,x ,t−2︸ ︷︷ ︸Autoregresive model
+ β3(efk,x ,t − τ)+︸ ︷︷ ︸Level associated with
life expectancywhere the gapstarts narrowing
+ε(2)k,x ,t ,
Gk,x ,t−1 + ε(3)k,x ,t︸ ︷︷ ︸
Random walk
for efk,x ,t > A.
Pascariu, Canudas-Romo & Vaupel (MaxO) DGM May 27, 2016 15 / 19

The gaps at age 0 and 65
Pascariu, Canudas-Romo & Vaupel (MaxO) DGM May 27, 2016 16 / 19

Accuracy
Average accuracy over four evaluation periods, computed based on predictions of the lifeexpectancy at birth and at age 65. Evaluation periods: 1985-2010, 1990-2010, 1995-2010 and2000-2010.
ME MAPE
Country Model AGE 0 AGE 65 AGE 0 AGE 65
FEMALES
USA
DGM -0.7990 -0.2950 1.00% 2.01%
LC -0.4958 -0.3889 0.71% 2.68%
CBD - -0.4031 - 2.70%
38 HMD
DGM -0.2161 0.4132 1.21% 3.22%
LC 0.3264 0.3407 0.89% 3.07%
CBD - 0.3320 - 3.12%
MALES USA
DGM 0.1997 0.7989 0.39% 4.71%
LC 0.7682 0.7083 1.04% 4.16%
CBD - 0.6804 - 3.99%
38 HMD
DGM 0.0942 0.7643 1.76% 5.41%
LC 1.2874 0.8037 2.21% 5.79%
CBD - 0.7806 - 5.69%
.
ME =
mean(ωk,x,t
)MAPE =
mean(|100×
ωk,x,t
ek,x,t|)
Pascariu, Canudas-Romo & Vaupel (MaxO) DGM May 27, 2016 17 / 19

Conclusions
The current approach combines separate forecasts to obtain the maleand female life expectancy levels
The results are coherent with the best-practice trend and correlated
The forecasting model proves robustness
Back-testing results are excellent!
vsdfsWhat’s next:
Decomposition of life expectancy into age-specific death rates
Pascariu, Canudas-Romo & Vaupel (MaxO) DGM May 27, 2016 18 / 19

Thank you!
Pascariu, Canudas-Romo & Vaupel (MaxO) DGM May 27, 2016 19 / 19