the developmental dynamics of marmoset monkey vocal … · marmoset monkey vocal production ......
TRANSCRIPT
coordinated activity of these networks in thestriatal function, and, therefore, they may partic-ipate in its dysfunction in brain disorders. Ourresults demonstrate the existence of functionalastro-neuronal networks that comprise subpop-ulations of astrocytes, neurons, and synapsesbelonging to specific brain circuits, which maydifferentially control specific circuit activity throughselective signaling between particular astrocytesand neurons.
REFERENCES AND NOTES
1. A. Araque et al., Neuron 81, 728–739 (2014).2. C. Eroglu, B. A. Barres, Nature 468, 223–231 (2010).3. M. M. Halassa, P. G. Haydon, Annu. Rev. Physiol. 72, 335–355
(2010).4. G. Perea, M. Navarrete, A. Araque, Trends Neurosci. 32,
421–431 (2009).5. A. Volterra, J. Meldolesi, Nat. Rev. Neurosci. 6, 626–640
(2005).6. G. Perea, A. Araque, Science 317, 1083–1086 (2007).7. C. Agulhon, T. A. Fiacco, K. D. McCarthy, Science 327,
1250–1254 (2010).8. T. A. Fiacco et al., Neuron 54, 611–626 (2007).9. B. C. Shonesy et al., Nat. Neurosci. 16, 456–463 (2013).10. A. C. Kreitzer, R. C. Malenka, Nature 445, 643–647
(2007).11. W. Shen, M. Flajolet, P. Greengard, D. J. Surmeier, Science 321,
848–851 (2008).12. M. Uchigashima et al., J. Neurosci. 27, 3663–3676 (2007).13. V. Chevaleyre, K. A. Takahashi, P. E. Castillo, Annu. Rev.
Neurosci. 29, 37–76 (2006).14. A. C. Kreitzer, R. C. Malenka, Neuron 60, 543–554
(2008).15. R. L. Albin, A. B. Young, J. B. Penney, Trends Neurosci. 12,
366–375 (1989).16. L. M. Suárez et al., Biol. Psychiatry 75, 711–722 (2014).17. S. Ares-Santos, N. Granado, I. Espadas, R. Martinez-Murillo,
R. Moratalla, Neuropsychopharmacology 39, 1066–1080(2014).
18. M. Gómez-Gonzalo et al., Cereb. Cortex (2014).19. M. Navarrete, A. Araque, Neuron 68, 113–126 (2010).20. R. Min, T. Nevian, Nat. Neurosci. 15, 746–753 (2012).21. M. Navarrete et al., PLOS Biol. 10, e1001259 (2012).22. M. A. Di Castro et al., Nat. Neurosci. 14, 1276–1284
(2011).23. J. Petravicz, T. A. Fiacco, K. D. McCarthy, J. Neurosci. 28,
4967–4973 (2008).24. T. Fellin et al., Neuron 43, 729–743 (2004).25. M. Navarrete, A. Araque, Neuron 57, 883–893 (2008).26. G. Perea, A. Araque, J. Neurosci. 25, 2192–2203 (2005).27. G. Cui et al., Nature 494, 238–242 (2013).28. A. V. Kravitz et al., Nature 466, 622–626 (2010).29. I. Ruiz-DeDiego, B. Mellstrom, M. Vallejo, J. R. Naranjo,
R. Moratalla, Biol. Psychiatry 77, 95–105 (2015).30. V. M. André et al., J. Neurosci. 31, 1170–1182 (2011).
ACKNOWLEDGMENTS
We thank D. Redish, W. Buño, A. Díez, and R. Gómez for helpfulcomments; J. Lerma and A. Valero for valuable help; B. Pro fortechnical assistance; and J. Chen (University of California–SanDiego) and A. Zimmer (University of Bonn) for providing IP3R2
−/−
and CB1R−/− mice, respectively. A.A. was supported by Cajal BlueBrain, the Human Frontier Science Program (grant RGP0036/2014), the Wallin family, and V. and L. Han. Support for this workwas also provided by the Ministerio de Economía y Competitividadof Spain (grants BFU2013-47265-R, CSD2010-00045, and RYC-2012-12014 to G.P. and grants SAF2013-48532-R and CB06/05/0055 to R.Mo.) and by the Juan de la Cierva Program (grant JCI-2010-07693 to R.Ma.). Data described in the paper are archived atthe Instituto Cajal (Madrid, Spain). The authors declare nocompeting financial interests.
SUPPLEMENTARY MATERIALS
www.sciencemag.org/content/349/6249/730/suppl/DC1Materials and MethodsFigs. S1 to S7References (31–39)
28 January 2015; accepted 17 June 201510.1126/science.aaa7945
LANGUAGE DEVELOPMENT
The developmental dynamics ofmarmoset monkey vocal productionD. Y. Takahashi,1,2* A. R. Fenley,1,2 Y. Teramoto,1 D. Z. Narayanan,1,2 J. I. Borjon,1,2
P. Holmes,1,3 A. A. Ghazanfar1,2,4*
Human vocal development occurs through two parallel interactive processes thattransform infant cries into more mature vocalizations, such as cooing sounds andbabbling. First, natural categories of sounds change as the vocal apparatus matures.Second, parental vocal feedback sensitizes infants to certain features of thosesounds, and the sounds are modified accordingly. Paradoxically, our closest livingancestors, nonhuman primates, are thought to undergo few or no production-relatedacoustic changes during development, and any such changes are thought to beimpervious to social feedback. Using early and dense sampling, quantitative trackingof acoustic changes, and biomechanical modeling, we showed that vocalizations ininfant marmoset monkeys undergo dramatic changes that cannot be solely attributedto simple consequences of growth. Using parental interaction experiments, wefound that contingent parental feedback influences the rate of vocal development.These findings overturn decades-old ideas about primate vocalizations and showthat marmoset monkeys are a compelling model system for early vocal developmentin humans.
Human vocal development is the outcomeof interactions among an infant’s develop-ing body and nervous system and his orher experience with caregivers (1, 2). In-fant cries decline over the first 3 months
as they transition into preverbal vocalizations(3). The rates of these transitions are influencedby social feedback: Contingent responses of care-givers spur the development of more mature vo-calizations (4). In contrast, nonhuman primatevocalizations are widely viewed as undergoinglittle or no production-related acoustic changesduring development, and any such changes areattributed solely to passive consequences ofgrowth (5).We tracked the vocal development ofmarmoset
monkeys (Callithrix jacchus; n = 10)—a voluble,cooperative breeding species (6)—from the firstpostnatal day (P1) until they produced adultlikecalls at 2 months of age. Recordings were takenat least twice weekly in two contexts: undirected(social isolation) and directed (with auditory,but not visual, contact with their mother orfather). Such early and dense sampling is nec-essary to accurately capture developmentalchanges in marmosets because this species de-velops rapidly (7). Each recording session beganwith ~5 min in the undirected context followedby ~15 min in the directed context, with mothersand fathers alternating between each session.In the undirected context, infants exhibited a
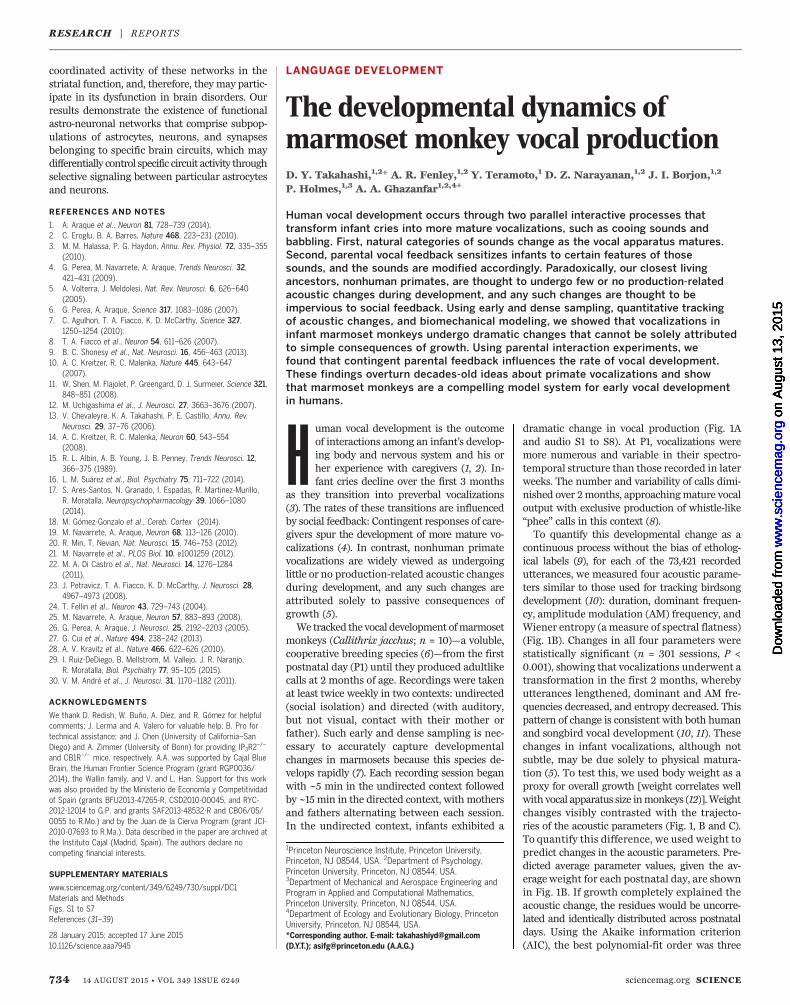
dramatic change in vocal production (Fig. 1Aand audio S1 to S8). At P1, vocalizations weremore numerous and variable in their spectro-temporal structure than those recorded in laterweeks. The number and variability of calls dimi-nished over 2months, approachingmature vocaloutput with exclusive production of whistle-like“phee” calls in this context (8).To quantify this developmental change as a
continuous process without the bias of etholog-ical labels (9), for each of the 73,421 recordedutterances, we measured four acoustic parame-ters similar to those used for tracking birdsongdevelopment (10): duration, dominant frequen-cy, amplitude modulation (AM) frequency, andWiener entropy (a measure of spectral flatness)(Fig. 1B). Changes in all four parameters werestatistically significant (n = 301 sessions, P <0.001), showing that vocalizations underwent atransformation in the first 2 months, wherebyutterances lengthened, dominant and AM fre-quencies decreased, and entropy decreased. Thispattern of change is consistent with both humanand songbird vocal development (10, 11). Thesechanges in infant vocalizations, although notsubtle, may be due solely to physical matura-tion (5). To test this, we used body weight as aproxy for overall growth [weight correlates wellwith vocal apparatus size inmonkeys (12)].Weightchanges visibly contrasted with the trajecto-ries of the acoustic parameters (Fig. 1, B and C).To quantify this difference, we used weight topredict changes in the acoustic parameters. Pre-dicted average parameter values, given the av-erageweight for each postnatal day, are shownin Fig. 1B. If growth completely explained theacoustic change, the residues would be uncorre-lated and identically distributed across postnataldays. Using the Akaike information criterion(AIC), the best polynomial-fit order was three
734 14 AUGUST 2015 • VOL 349 ISSUE 6249 sciencemag.org SCIENCE
RESEARCH | REPORTS
1Princeton Neuroscience Institute, Princeton University,Princeton, NJ 08544, USA. 2Department of Psychology,Princeton University, Princeton, NJ 08544, USA.3Department of Mechanical and Aerospace Engineering andProgram in Applied and Computational Mathematics,Princeton University, Princeton, NJ 08544, USA.4Department of Ecology and Evolutionary Biology, PrincetonUniversity, Princeton, NJ 08544, USA.*Corresponding author. E-mail: [email protected](D.Y.T.); [email protected] (A.A.G.)
on
Aug
ust 1
3, 2
015
ww
w.s
cien
cem
ag.o
rgD
ownl
oade
d fr
om
on
Aug
ust 1
3, 2
015
ww
w.s
cien
cem
ag.o
rgD
ownl
oade
d fr
om
on
Aug
ust 1
3, 2
015
ww
w.s
cien
cem
ag.o
rgD
ownl
oade
d fr
om
on
Aug
ust 1
3, 2
015
ww
w.s
cien
cem
ag.o
rgD
ownl
oade
d fr
om
on
Aug
ust 1
3, 2
015
ww
w.s
cien
cem
ag.o
rgD
ownl
oade
d fr
om
for all residues related to the acoustic parame-ters (Fig. 1D). To account for possible nonlinearrelationships between growth and acoustic pa-rameters, we log-transformed the weight andacoustic parameters. The log-transformed weightdid not predict the log-transformed acoustic pa-rameters (fig. S1, A to C). Thus, simple patternsof growth (linear or nonlinear) do not accuratelypredict acoustic changes in infant marmosetvocalizations.A subset of the early vocalizations of humans
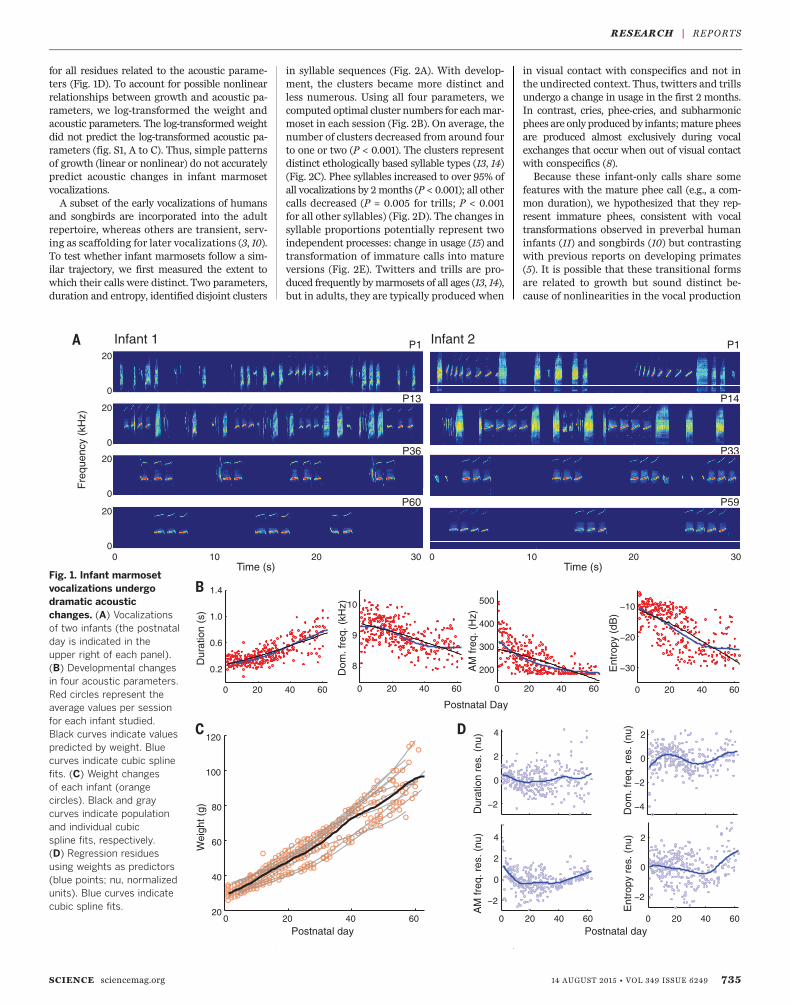
and songbirds are incorporated into the adultrepertoire, whereas others are transient, serv-ing as scaffolding for later vocalizations (3, 10).To test whether infant marmosets follow a sim-ilar trajectory, we first measured the extent towhich their calls were distinct. Two parameters,duration and entropy, identified disjoint clusters
in syllable sequences (Fig. 2A). With develop-ment, the clusters became more distinct andless numerous. Using all four parameters, wecomputed optimal cluster numbers for eachmar-moset in each session (Fig. 2B). On average, thenumber of clusters decreased from around fourto one or two (P < 0.001). The clusters representdistinct ethologically based syllable types (13, 14)(Fig. 2C). Phee syllables increased to over 95% ofall vocalizations by 2months (P < 0.001); all othercalls decreased (P = 0.005 for trills; P < 0.001for all other syllables) (Fig. 2D). The changes insyllable proportions potentially represent twoindependent processes: change in usage (15) andtransformation of immature calls into matureversions (Fig. 2E). Twitters and trills are pro-duced frequently bymarmosets of all ages (13, 14),but in adults, they are typically produced when
in visual contact with conspecifics and not inthe undirected context. Thus, twitters and trillsundergo a change in usage in the first 2 months.In contrast, cries, phee-cries, and subharmonicphees are only produced by infants;mature pheesare produced almost exclusively during vocalexchanges that occur when out of visual contactwith conspecifics (8).Because these infant-only calls share some
features with the mature phee call (e.g., a com-mon duration), we hypothesized that they rep-resent immature phees, consistent with vocaltransformations observed in preverbal humaninfants (11) and songbirds (10) but contrastingwith previous reports on developing primates(5). It is possible that these transitional formsare related to growth but sound distinct be-cause of nonlinearities in the vocal production
SCIENCE sciencemag.org 14 AUGUST 2015 • VOL 349 ISSUE 6249 735
RESEARCH | REPORTS
0 10 20 30 0 10 20 30
0
20
Time (s) Time (s)
Fre
quen
cy (
kHz)
Infant 1 Infant 2
Postnatal Day
Dur
atio
n (s
)
Dom
. fre
q. (
kHz)
AM
freq
. (H
z)
Ent
ropy
(dB
)
P1
P13
P36
P60
P1
P14
P33
P59
0
20
0
20
0
20
20
40
60
80
100
120
0 20 40 60Postnatal day
Wei
ght (
g)
0 20 40 60
0.2
0.6
1.0
1.4
0 20 40 60
8
9
10
0 20 40 60
200
300
400
500
0 20 40 60
−30
−20
−10
−2
0
2
4
−4
−2
0
2
0 20 40 60
−2
0
2
4
0 20 40 60
−2
0
2
Postnatal day
Dur
atio
n re
s. (
nu)
Dom
. fre
q. r
es. (
nu)
AM
freq
. res
. (nu
)
Ent
ropy
res
. (nu
)
Fig. 1. Infant marmosetvocalizations undergodramatic acousticchanges. (A) Vocalizationsof two infants (the postnatalday is indicated in theupper right of each panel).(B) Developmental changesin four acoustic parameters.Red circles represent theaverage values per sessionfor each infant studied.Black curves indicate valuespredicted by weight. Bluecurves indicate cubic splinefits. (C) Weight changesof each infant (orangecircles). Black and graycurves indicate populationand individual cubicspline fits, respectively.(D) Regression residuesusing weights as predictors(blue points; nu, normalizedunits). Blue curves indicatecubic spline fits.
system (16). This would suggest that a singlebiomechanical mechanism generates cries,phees, and the transitional forms and that thetransitional calls result from smooth changesthrough a parameter space. To test this idea,we developed a model based on one that suc-cessfully reproduces syllable types in zebrafinch song but that is nonspecific with regardto songbird versus mammalian vocal anat-omy (Fig. 3A) (17). Our simulations verifiedthat the model can reproduce the marmosetcall types described above (Fig. 3, B to E). Thesimulations also revealed the underlying bio-mechanics corresponding to different calls atdifferent levels of pressure (respiratory pow-er) and laryngeal muscle tension (Fig. 3F).Broadband cries were produced at low pres-sure and muscle tension, where small varia-tions cause large changes in spectral contentbecause of nonlinear vocal fold dynamics. Pheesoccurred at higher pressures and tensions, andsubharmonic phees occurred in an interme-diate region, supporting their classification as
transitional calls. Rapid switching between highand low pressure and tension states producedthe phee-cries. Throughout, linear changes inpressure and tension produced nonlinear acous-tic effects.To test the model’s overall validity and the
prediction that respiration during cries is lessstable than during phees, we measured respira-tory activity via electromyography (EMG) in fiveP1 infants. We investigated whether different res-piratory patterns underlie cries and phees withsimilar intersyllable intervals (Fig. 3, G and I).The EMGsignalsweremore uniformacross pheesthan across cries (Fig. 3, H and J), as quantifiedby the cost of dynamic time warping (DTW) (18).For each infant, the mean DTW costs for pheeswere smaller than they were for cries (P < 0.001)(Fig. 3K). Therefore, phee syllables at least partlyresult from more stable respiration; immaturerespiratory control leads mainly to cries early inlife, consistent with the model prediction. Over-all, these data support our hypothesis that criesare immature phees.
Thus, although vocal acoustic changes weredramatic, physiological growth could explain thetransition from cries to phees, as improved res-piratory and/or laryngeal control modulates spec-tral parameters (Fig. 1B), reducing the entropy.However, if the cries-to-phees transition was sole-ly driven by physical maturation, it would beimpervious to social feedback. Yet, consistentwith a role for vocal feedback in guiding de-velopment, marmoset monkeys exhibit a devel-opmental pattern of FoxP2 expression in theirthalamocortical-basal ganglia circuit (19) that isanalogous to that of songbirds and humans (20).This suggests thatmarmoset infantsmay use thiscircuit to guide their phee-call development throughreward-based parental feedback, as birds and hu-mans do (21). To assess the effect of parent-infantvocal interactions in marmosets, we quantifiedtheir vocal exchanges in the directed context,where infants and their mother or father were inauditory, but not visual, contact.Infant and parent vocalizations were parsed
into whole multisyllabic calls according to the
736 14 AUGUST 2015 • VOL 349 ISSUE 6249 sciencemag.org SCIENCE
RESEARCH | REPORTS
Postnatal day
phee
cryphee-cry
twittertrill
subharmonic
#clu
ster
s
0
1
.5
1
3
5
7
9
Duration (s)
Ent
ropy
(dB
)E
ntro
py (
dB)
0 0.8
0
10
200 0.4
0
10
20
0 0.8
0 0.8
0 0.8
Fre
quen
cy (
kHz)F
requ
ency
(kH
z)
Time (s)
Time (s)
Time (s)Time (s)
0
10
20
Time (s)
different context
twitter trill
cry
phee-cry
phee
0 0.8Time (s)
subharmonic0
10
20
0
10
20
−30
−20
−10
0
0.5 1
−30
−20
−10
0
0.5 1 0.5 1 0.5 10 0 0 0
P1 P14 P33 P59
P1 P13 P36 P60
0 0.25 0.5
−20
−10
0
0 20 40 60
Pro
port
ion
0 20 40 60
Duration (s)
Ent
ropy
(dB
)
Postnatal day
0 0.40
10
20
0 0.8Fre
quen
cy (
kHz)
Time (s)Time (s)
Infant 1
Infant 2
Infant 1 - P1
Fig. 2. A subset of infant marmoset calls transform into adultlike phee calls. (A) Probability maps of duration and entropy for the infants in Fig. 1A.Lighter colors indicate higher probabilities. (B) Distribution of cluster numbers by developmental age. Warmer colors indicate more frequent occurrences ofcluster numbers.The red line is the regression fit. (C) Correspondence between clusters and different syllable types for a marmoset at P1. (D) Developmentalchanges in the proportion of call types. Colors in (C) indicate the same call types as in (D). (E) Twitters and trills change in usage, whereas cries, phee-cries, andsubharmonic phees are hypothesized to transition to phee calls.

bimodal distribution of their intersyllable inter-vals (8). We recorded 8800 infant phees, 11,798infant cries, and 6567 adult phees, of which 2512were contingent responses to infant phees [thosefalling within a turn-taking interval as seen inadults (8)]. Parents produced mostly phee calls(>98%). Typical examples of infant phee and cryproduction during interactions over the first2 months and the phee/cry ratio across days areshown in Fig. 4, A and B. As in the undirectedcontext (Fig. 2D), cries gave way to phees, but thetransition occurred rapidly. For each infant, weused the point where the phee/cry ratio firstcrossed zero to mark the transition day (Fig.
4C). Transitions were typically sharp, but theirtiming varied substantially across infants (~10to 40 postnatal days). If physiological growthcompletely explained the cries-to-phees transi-tion, the weight-change rate and the timing of thetransition (zero-crossing) daywould be correlated.However, we found no significant correlation (n =10 infants, t test, P = 0.684) (Fig. 4D); growthalone cannot explain the timing of the cries-to-phees transition.We then investigated whether parental re-
sponses to infant vocalizations affect the timingof the cries-to-phees transition. This would explain,at least partially, its variability across infants.
Infants could be influenced by contingent re-sponses only or by the total number of adultvocalizations that they hear. The fraction of in-fant phees that elicited contingent parental pheeresponses before the zero-crossing day correlatedsignificantly with the timing of the zero-crossingday (n = 10 infants, t test, P = 0.005) (Fig. 4E).Proportions of noncontingent parental calls (91.5%of all calls on average) were not significantlycorrelated with this timing (n = 10 infants, t test,P = 0.558) (Fig. 4F). Therefore, contingent vocalresponses from parents influence the timing ofthe cries-to-phees transition by reinforcing theproduction of phee calls.
SCIENCE sciencemag.org 14 AUGUST 2015 • VOL 349 ISSUE 6249 737
RESEARCH | REPORTS
Larynx(vocal folds)
Upper vocaltract
Lungs
Psound(t)
Pin(t)
Fre
quen
cy (
kHz)
0
10
20
Time (s)
Fre
quen
cy (
kHz)
0 0.2 0.4 0.60
10
20
Time (s)0 0.2 0.4 0.6
Time (s)0 0.2 0.4 0.6
Time (s)0 0.2 0.4
0.10 0.25 0.50 1.000.10
0.25
0.50
1.00
Air pressure (au)
Mus
cle
tens
ion
(au)
cry
subharmonic
phee
phee
-cry
Time (s)
Am
plitu
de (
nu)
20
10
0Freq
uenc
y (k
Hz)
Time (s)
Am
plitu
de (
nu)
Time (s)
pheecry
DT
W c
ost
Subject1 2 3 4 5
Infant 1 - P1
Infant 2 - P1
***
******
***
***
0
20
40
60
0 1 2−1
0
1
0 1 2
0 1 2 3−1
0
1
0 1 2 3
0 .1 .2 .3 .4−1
0
1
0 .1 .2 .3 .4
0 .1 .2 .3 .4−1
0
1
0 .2 .4 .6
20
10
0
Time (s)
Time (s) Time (s)
Am
plitu
de (
nu)
Freq
uenc
y (k
Hz)
Time (s) Time (s)
Am
plitu
de (
nu)
Fig. 3. Biomechanical model of vocal folds can reproduce infant marmo-set calls. (A) Main elements of the vocal tract and respective model rep-resentations, where Pin(t) is pressure at the inlet to the vocal tract, Psound(t) ispressure upon exit from themouth, and × is the displacement of the vocal fold.Gray arrows show airflow. (B to E) Top: Representative recordings of a cry (B),subharmonic phee (C), phee-cry (D), and phee (E); bottom: correspondingmodel simulations. (F) Changing air pressure and muscle tension produces
different calls (au, arbitrary units). (G and I) Top:Three-syllable phees (left) andcries (right) for two marmosets; bottom: their corresponding EMG activities.(H and J) Respiratory EMG activity during call production. Curves are thepurple and gray segments from (G) and (I), aligned at the syllable onset ofphees and cries, respectively. (K) Average DTWcost on P1 for five marmosets.Central light-colored bars show means, rectangles show standard deviations,and asterisks indicate significant differences (P < 0.001).

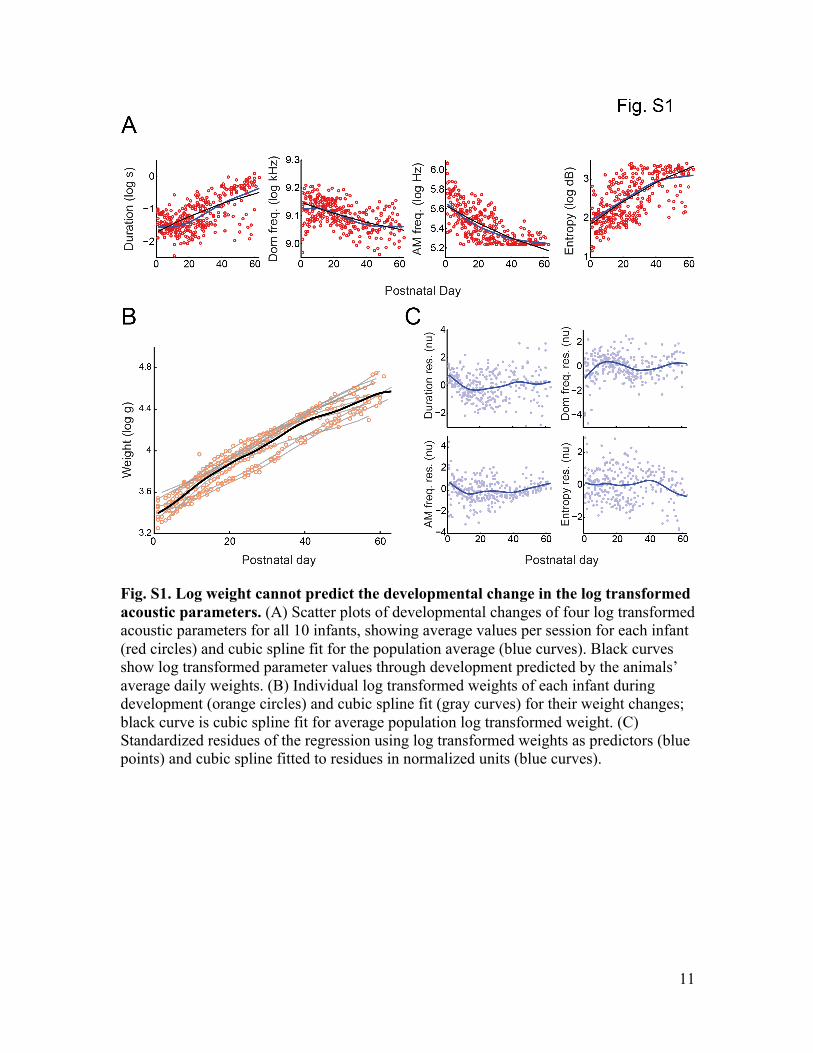
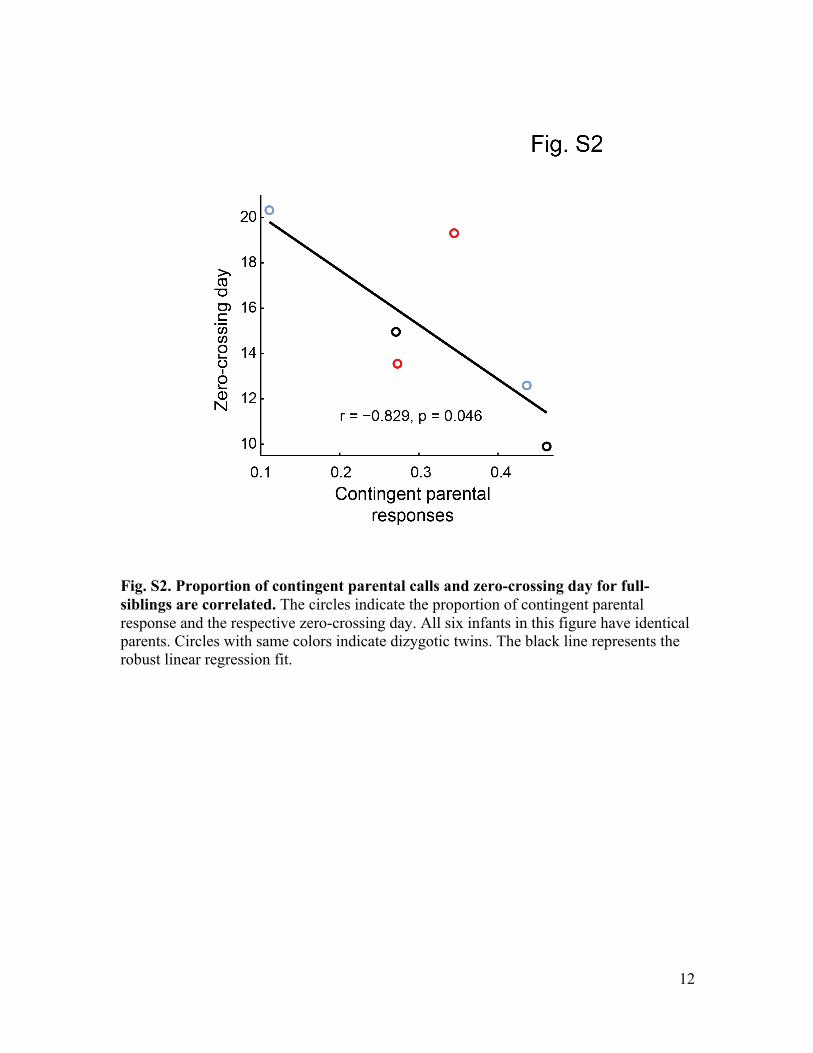
We address two possible caveats to this con-clusion. First, it is possible that, through sharedgenetics, fast-transitioning infants are born tomore vocally interactive parents. To test this, wecorrelated the frequency of contingent parentalcalls and the zero-crossing day for six full siblingsborn from the same parents. If shared genet-ics were driving the result, then there wouldbe no correlation between contingent paren-tal responses and the zero-crossing day. Wefound, however, that there remained a statisti-cally significant correlation (n = 6 infants, P =0.046) (fig. S2).Moreover, we found no differencebetween the slopes of the regressions for thefull-siblings and all-infants data (test for equal-ity, P = 0.953).Second, it is possible that changing patterns of
infant calling are due to changes in parental calloutput. The phee-call production rates of eachinfant’s parents during development are shownin Fig. 4G; neither parent changed their produc-tion rates (mother, P = 0.132; father, P = 0.235).Based on these analyses, we conclude that thecries-to-phees transition is influencedby contingentresponses from parents, not by shared geneticsor changes in parental vocal output.Our findings demonstrate that infant marmo-
set calls undergo dramatic changes during thefirst 2 months of life, transforming from criesinto mature, adultlike phee calls. The timing ofthis transition is partly attributable to matura-tion but is also influenced by contingent pa-rental vocal feedback. This is consistent withpreverbal vocal development in humans, whereby
(i) natural categories of sounds change asrespiratory, laryngeal, and facial componentsmature, and (ii) in parallel, vocal feedback sen-sitizes infants to certain features of thosesounds, and the sounds are modified accord-ingly. Our findings contrast with previous re-ports that nonhuman primate vocalizationsundergo little or no postnatal change and areimpervious to social feedback (5). The complexand socially dependent vocal development weobserved in marmoset monkeys may be a nec-essary condition of the vocal learning observedin humans.
REFERENCES AND NOTES
1. E. Thelen, in Biological and Behavioral Determinants ofLanguage Development, N. A. Krasnegor, D. M. Rumbaugh,R. L. Schiefelbusch, M. Studdert-Kennedy, Eds.(Lawrence Erlbaum Associates, Hillsdale, NJ, 1991),pp. 339–362.
2. L. Byrge, O. Sporns, L. B. Smith, Trends Cogn. Sci. 18,395–403 (2014).
3. D. K. Oller, The Emergence of the Speech Capacity (LawrenceErlbaum Associates, Mahwah, NJ, 2000).
4. M. H. Goldstein, A. P. King, M. J. West, Proc. Natl. Acad. Sci. U.S.A.100, 8030–8035 (2003).
5. S. E. R. Egnor, M. D. Hauser, Trends Neurosci. 27, 649–654(2004).
6. J. I. Borjon, A. A. Ghazanfar, Brain Behav. Evol. 84, 93–102(2014).
7. A. de Castro Leão, A. Duarte Dória Neto, M. B. C. de Sousa,Comput. Biol. Med. 39, 853–859 (2009).
8. D. Y. Takahashi, D. Z. Narayanan, A. A. Ghazanfar, Curr. Biol.23, 2162–2168 (2013).
9. D. Lipkind, O. Tchernichovski, Proc. Natl. Acad. Sci. U.S.A. 108,15572–15579 (2011).
10. O. Tchernichovski, P. P. Mitra, T. Lints, F. Nottebohm, Science291, 2564–2569 (2001).
11. E. Scheiner, K. Hammerschmidt, U. Jurgens, P. Zwirner,J. Voice 16, 509–529 (2002).
12. W. T. Fitch, J. Acoust. Soc. Am. 102, 1213–1222(1997).
13. B. M. Bezerra, A. Souto, Int. J. Primatol. 29, 671–701(2008).
14. A. L. Pistorio, B. Vintch, X. Wang, J. Acoust. Soc. Am. 120,1655–1670 (2006).
15. A. M. Elowson, C. T. Snowdon, C. Lazaro-Perea, Behaviour 135,643–664 (1998).
16. W. T. Fitch, J. Neubauer, H. Herzel, Anim. Behav. 63,407–418 (2002).
17. A. Amador, Y. S. Perl, G. B. Mindlin, D. Margoliash, Nature 495,59–64 (2013).
18. J. A. Kogan, D. Margoliash, J. Acoust. Soc. Am. 103, 2185–2196(1998).
19. M. Kato et al., Brain Lang. 133, 26–38 (2014).20. I. Teramitsu, L. C. Kudo, S. E. London, D. H. Geschwind,
S. A. White, J. Neurosci. 24, 3152–3163 (2004).21. S. Syal, B. L. Finlay, Dev. Sci. 14, 417–430
(2011).
ACKNOWLEDGMENTS
We thank L. Kelly for providing comments on an earlier draft.This work was supported by a Pew Latin American Fellowship(D.Y.T.), a Brazilian Science Without Borders Fellowship(D.Y.T.), an NSF Graduate Fellowship (J.I.B.), and theJames S. McDonnell Scholar Award (A.A.G). Data for eachfigure are available in the supplementary materials.
SUPPLEMENTARY MATERIALS
www.sciencemag.org/content/349/6249/734/suppl/DC1Materials and MethodsSupplementary TextFigs. S1 and S2References (22–29)Audio S1 to S8Supplementary Data
13 March 2015; accepted 12 June 201510.1126/science.aab1058
738 14 AUGUST 2015 • VOL 349 ISSUE 6249 sciencemag.org SCIENCE
RESEARCH | REPORTS
0
50
100
150
0 10 20 30 40 50 600
100
200
-1
-.5
0
.5
1
Num
ber
of c
alls
Phe
e/cr
y ra
tio
zero crossing
phee
cry
0 10 20 30 40 50 60
Phe
e/cr
y ra
tio
-1
-.5
0
.5
1
0 10 20 30 40 50 60Postnatal day
r = -0.879, p = 0.002
Contingent parentalresponses
r = 0.285, p = 0.427
Non-contingent parentalresponses
Postnatal day
Phe
e ca
ll ra
te (
calls
/min
)
0
3
6
0 20 40 600
3
6
Mothers
Fathers
Postnatal day Postnatal day0.4 0.6 0.8
r = −0.055, p = 0.892
0 0.1 0.2 0.3 0.4 0.85 0.9 0.95 1
Zer
o-cr
ossi
ng d
ay
15
20
25
30
35
40
10
Zer
o-cr
ossi
ng d
ay
15
20
25
30
35
40
10
Zer
o-cr
ossi
ng d
ay
15
20
25
30
35
40
10
Weight change (g/day)
Fig. 4. Transition from cry to phee is influenced by contingent parental calls. (A) Numbers of cries and phees over 2 months for a single infant.(B) Phee/cry ratio for the infant in (A) across days. (C) Phee/cry ratios (gray curves) and zero-crossing days (red ticks) for each infant and for thepopulation (black curve). Black and gray curves in (B) and (C) are cubic spline fits. (D) Correlation between the weight-change rate and the zero-crossingday among infants. (E and F) Correlations between the zero-crossing day and the proportion of contingent and noncontingent parental responses,respectively. (G) Rates of individual parental phee-call production during infant development (gray) and the population average (black).
www.sciencemag.org/content/349/6249/734/suppl/DC1
Supplementary Materials for
The developmental dynamics of marmoset monkey vocal production D. Y. Takahashi, * A. R. Fenley, Y. Teramoto, D. Z. Narayanan, J. I. Borjon, P. Holmes,
A. A. Ghazanfar*
*Corresponding author. Email: [email protected] (D.Y.T.); [email protected] (A.A.G.)
Published 14 August 2015, Science 349, 734 (2015) DOI: 10.1126/science.aab1058
This PDF file includes:
Materials and Methods Supplementary Text Figs. S1 and S2 Captions for Audio S1 to S8 Captions for Supplementary Data
Other Supporting Online Material for this manuscript includes the following: (available at www. sciencemag.org/content/349/6249/734/suppl/DC1)
Audio S1 to S8 Supplementary Data as a zipped archive
2
Materials and Methods Subjects All experiments were performed in compliance with the guidelines of the Princeton University Institutional Animal Care and Use Committee. The subjects used in the study were 15 infants and 6 adults (3 male-female pairs, > 2 years old), captive common marmosets (Callithrix jacchus) housed at Princeton University. Ten infants (all members of twin sets with three twin sets from the same parents) participated in the undirected and directed calls experiment during the first two months of postnatal period. Another five infants (one set of twins, one set of triplets) were used for respiratory electromyography (EMG) experiments on the first postnatal day. The colony room is maintained at a temperature of approximately 27°C and 50-60% relative humidity, with 12L:12D light cycle. Marmosets live in family groups; all were born in captivity. They had ad libitum access to water and were fed daily with standard commercial chow supplemented with fruits and vegetables. Additional treats (peanuts, cereal, dried fruits and marshmallows) were used prior to each session to transfer the animals from their home-cage into a transfer cage. Experimental setup Beginning on their first postnatal day, we recorded the vocalizations of marmoset monkey infants in two different contexts: undirected (i.e., social isolation) and directed (with auditory, but not visual, contact with their mother or father). Early in life, infants are always carried by parent. Thus, the parent carrying the infant(s) was first lured from the home cage into a transfer cage using treats. The infant marmoset was then gently separated from the adult and taken to the experiment room where it was placed in a second transfer cage on a flat piece of foam. Avoiding separation longer than 30 minutes in one day and alternating with shorter sessions for undirected experiments (~ 5 min) minimized the stress caused by separation to the infant. The vocalizations we observed were identical in type to those produced when the infant is naturally separated from parents (e.g., when parents push them off or when they transfer them to the other parent for carrying or feeding). The cage rested on a table (.66m in height) in one of two opposing corners of the room. The testing corner was counterbalanced across sessions. A speaker was placed at a third corner equidistant from both testing corners and pink noise (amplitude decaying inversely proportional to frequency) was broadcast at ~45 dB (at 0.88m from speaker) in order to mask occasional noises produced external to the testing room. An opaque curtain made of black clothes divided the room to visually occlude the subject from the other corner. A digital recorder (ZOOM H4n Handy Recorder) was placed directly in front of the transfer cage at a distance of .76m. Audio signals were acquired at a sampling frequency of 96kHz. Every session typically consisted of two consecutive undirected experiments (one twin followed by the other) and one directed experiment (just one of the twins on a given day). Each session started with the undirected experiments lasting ~5 minutes each one. The number of undirected experiments with at least one call production was 40, 38, 38, 38, 37, 39, 19, 15, 16, 21 (10 infants, 301 sessions, 73,421 utterances). The order of the infants was counterbalanced. As soon as the undirected experiment was finished, one of the parents
3
was brought to the experiment room and put into the opposing corner of the room. A second digital recorder (ZOOM H4n Handy Recorder) was placed directly in front of the parent at a distance of .76m from the transfer cage. During this setup procedure and throughout the directed experiment, the opaque curtain prevented the infant and the parent from having visual contact. The directed experiment lasted for ~15 min. The order of which parent participated in the interaction was counterbalanced. If the parent took more than 15 minutes to be lured for the directed calls experiment, the experiment was aborted to avoid any excessive separation stress on infants and parents. The number of directed experiments for each infant was 17, 13, 13, 18, 24, 24, 22, 21, 21, 22 (195 sessions). Detection of calls To determine the onset and offset of a syllable, a custom made MATLAB® routine automatically detected the onset and offset of any signal that differed from the background noise at specific frequency range. To detect the differences, we first bandpass filtered the entire recording signal between 6 and 10kHz. This corresponds to the dominant frequency of marmoset calls, i.e., the frequency with highest power, which is not necessarily the fundamental frequency (F0), i.e., the lowest frequency of the periodic components of the sound. Second, we resampled the signal to 1kHz sampling rate, applied the Hilbert transform and calculated the absolute value to obtain the amplitude envelope of the signal. The amplitude envelope was further low pass filtered to 50Hz. A segment of the recording without any call (silent) was chosen as a comparison baseline. The 99th percentile of the amplitude value in the silent period was used as the detection threshold. Sounds with amplitude envelope higher than the threshold were considered a possible vocalization. Finally, to ensure that sounds other than call syllables were not included, a researcher verified whether each detected sound was a vocalization or not based on the spectrogram. Quantification of acoustic parameters After detecting the onset and offset of calls, a custom made MATLAB® routine calculated the duration, dominant frequency, amplitude modulation frequency, and Wiener entropy of each syllable. The duration of syllable is the difference between the offset and onset of the vocalization detected by our custom made program discussed above. The dominant frequency of a syllable was calculated as the average frequency at which the spectrogram had maximum power. The spectrogram was calculated using a FFT window of 1024 points, Hanning window, with 50% overlap. The amplitude modulation frequency was calculated in the following way. First, the signal was bandpass filtered between 6 to 10kHz and then a Hilbert transform was applied. The absolute value of the resulting signal gives us the amplitude envelope of the modulated signal. Finally, the amplitude modulation frequency was calculated as the dominant frequency of the amplitude envelope. The Wiener entropy is the logarithm of the ratio between the geometric and arithmetic means of the values of power spectrum for different frequencies (10). The Wiener entropy represents how broadband the power spectrum of a signal is. The closer the signal is to white noise, the higher will be the value of Wiener entropy. A cubic spline curve was fitted to the population data using MATLAB® csaps function. To verify if the parameters changed during development, we fitted a robust linear regression
4
(robustfit) using MATLAB® robustfit. We used the two-sided t-test for the nullity of the slope to verify the statistical significance of the slope of the linear regression (n = 301 sessions). A cubic spline curve was fitted to individual and population weight to show the almost linear growth curve.
To test if body weight, which is a highly correlated to vocal tract length (12), can predict the observed acoustic changes, we fitted a robust linear regression to each of the acoustic parameter using the weight as predictor. The robust linear regression and the respective residuals were calculated for each infant separately (n = 45, 42, 43, 36, 37, 37, 14, 12, 13, 16 days of weight measurements for each infant). A cubic spline curve was fitted to the all residuals for all infants. To test for presence of nonlinearity in the residuals, we used Akaike Information Criterion (AIC) to select the order of the best polynomial fit on the residuals. We used the polydeg routine to calculate AIC (http://www.biomecardio.com/matlab/polydeg.html). To obtain the predicted average population values for each acoustic parameter, we calculated the robust linear regression between the parameter values and weights for the population data. Then, we plotted the parameter value predicted for the average population weight for each postnatal day. To take into account possible polynomial nonlinearity in the relationship between the weight and acoustic parameters we applied the log transform to the weight and the acoustic parameters. The Wiener entropy is negative valued, therefore, we applied the log transform to the absolute value of the Wiener entropy. If the variables are related by some polynomial equation (e.g., y = a*x^p), the log transform will linearize the relationship (e.g., log(y) = p log(x) + log(a)) and then standard linear statistical inference can be applied. Once the data was log transformed, we repeated the same procedure applied to non-transformed data to test if body weight can predict the observed acoustic changes. Clustering analysis of the acoustic parameters To calculate the number of clusters for each session and subject, we used the spectral clustering algorithm (22) on the four acoustic parameters (duration, dominant frequency, amplitude modulation frequency, Wiener entropy). We used the implementation by Ingo Bürk (MATLAB® file exchange #34412) for the spectral clustering analysis. Sessions with less than 20 calls were excluded because clustering algorithm was not reliable (259 session were included in the analysis). To determine the optimal number of clusters, we used slope statistics (23). We calculated the probability distribution of the optimal number of clusters chosen by slope statistics for all sessions and infants to show how the number of clusters changes during development. We fitted a robust linear regression to the number of clusters versus postnatal day. The statistical significance of the slope of the linear regression was measured using the two-sided t-test for the nullity of the regression slope (n = 259 sessions). Classification of type of call syllables Each automatically detected call was manually classified as phee, phee-cry, subharmonic-phee, cry, twitter, and trill, based on the spectro-temporal profile measured by the spectrogram. To ensure validity of our classification procedure, 10 sessions chosen at random were classified by two different individual and compared. The classification matched in more than 99.9% of the call syllables. The six call types show very distinct spectro-temporal profiles and can be easily classified by eye (13, 14). Briefly, phee is a

5
tonelike long call with F0 at around 7-10kHz; twitter is a short upward FM sweep; trill is defined by sinusoidal-like FM throughout the entire call; cry is a broad-band call, with F0 around 600Hz; phee-cry is a combination of phee and cry in any order, with each component lasting at least 50ms. A subharmonic-phee is similar to phee, but with a strong harmonic component around 3.5-5kHz. We classified a call as subharmonic-phee if the harmonic component around 3.5-5kHz is visible for at least 50 ms. For each session and subject, the proportion of each type of call (Fig. 2D) was calculated as the sum of all durations of each type of syllable divided by the sum of all durations of phee, phee-cry, subharmonic-phee, cry, twitter, and trill. We calculated the cubic spline curve for the development of the proportion of each type of syllable using MATLAB® csaps. To statistically test the significance of the developmental change (increase or decrease), we fitted a robust linear regression and applied the two-sided t-test to verify the nullity of regression slope. Biophysical model of vocal production To model vocal production, we adapted and extended a biomechanical model that was introduced to study song generation in zebra finch (17). This was derived from previous models developed to understand the biomechanics of human speech (24), using nonlinear coordinate changes to produce a simple “normal form” (25). With appropriate parameter choices, detailed below, the resulting model is adequate to describe primate vocal production. The vocal production apparatus is simplified into three parts: the respiratory system, the vibratory system (syrinx in birds, larynx in primates), and the filtering/resonance system (the supra-glottal vocal tract). The respiratory and vibratory systems are reduced to the following differential equations that describe the displacement x and velocity y of the vocal folds
𝑥 = 𝑦, 𝑦 = −𝛼 𝑡 𝛾! − 𝛽 𝑡 𝛾!𝑥 − 𝛾!𝑥! − 𝛾𝑥!𝑦 + 𝛾!𝑥! − 𝛾𝑥𝑦, (1)
where γ > 0 is a time constant and two additional dimensionless parameters α(t) and β(t), that may vary with time (t) or remain constant, respectively represent sub-glottal air pressure and laryngeal muscle tension. This single mass model, like that of (24), assumes that the vocal folds move symmetrically and support a traveling wave of fixed shape. We note that particular relationships among passive nonlinear stiffness and dissipation parameters must be assumed to obtain the form (1) with only 3 parameters. Vocal fold vibrations are then translated into sound pressure changes in the supra-glottal vocal tract using the equation
𝑃!" 𝑡 = 𝑐!𝑥 𝑡 + 𝑐!𝑥 𝑡 − 𝑐!𝑥 𝑡 − 𝑟𝑃!" 𝑡 − 𝑇 , (2) where c1, c2, c3 are positive constants and T is the time taken for sound to travel through the supra-glottal vocal tract to the mouth and, after reflection, back to the vocal folds. The constants cj are coefficients of the leading terms of a Taylor series expansion for the incoming pressure as a function of flow velocity, as determined from vocal fold displacement, velocity and acceleration (25). The reflection coefficient r < 1 describes the amplitude change in the reflected pressure wave 𝑟𝑃!" 𝑡 − 𝑇 that returns to interact with the incoming signal 𝑃!" 𝑡 . The resulting sound pressure emitted at the mouth is therefore
6
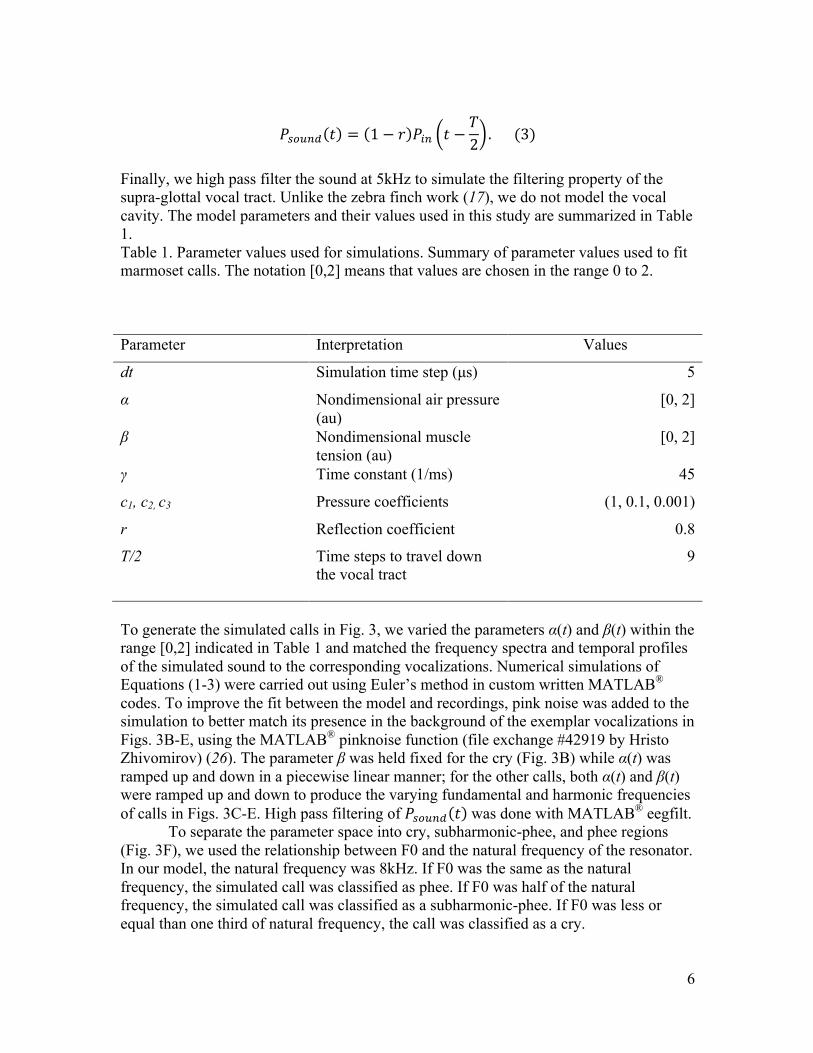
𝑃!"#$% 𝑡 = 1− 𝑟 𝑃!" 𝑡 −𝑇2 . (3)
Finally, we high pass filter the sound at 5kHz to simulate the filtering property of the supra-glottal vocal tract. Unlike the zebra finch work (17), we do not model the vocal cavity. The model parameters and their values used in this study are summarized in Table 1. Table 1. Parameter values used for simulations. Summary of parameter values used to fit marmoset calls. The notation [0,2] means that values are chosen in the range 0 to 2. Parameter Interpretation Values
dt Simulation time step (µs) 5
α Nondimensional air pressure (au)
[0, 2]
β Nondimensional muscle tension (au)
[0, 2]
γ Time constant (1/ms) 45
c1, c2, c3 Pressure coefficients (1, 0.1, 0.001)
r Reflection coefficient 0.8
T/2 Time steps to travel down the vocal tract
9
To generate the simulated calls in Fig. 3, we varied the parameters α(t) and β(t) within the range [0,2] indicated in Table 1 and matched the frequency spectra and temporal profiles of the simulated sound to the corresponding vocalizations. Numerical simulations of Equations (1-3) were carried out using Euler’s method in custom written MATLAB® codes. To improve the fit between the model and recordings, pink noise was added to the simulation to better match its presence in the background of the exemplar vocalizations in Figs. 3B-E, using the MATLAB® pinknoise function (file exchange #42919 by Hristo Zhivomirov) (26). The parameter β was held fixed for the cry (Fig. 3B) while α(t) was ramped up and down in a piecewise linear manner; for the other calls, both α(t) and β(t) were ramped up and down to produce the varying fundamental and harmonic frequencies of calls in Figs. 3C-E. High pass filtering of 𝑃!"#$% 𝑡 was done with MATLAB® eegfilt.
To separate the parameter space into cry, subharmonic-phee, and phee regions (Fig. 3F), we used the relationship between F0 and the natural frequency of the resonator. In our model, the natural frequency was 8kHz. If F0 was the same as the natural frequency, the simulated call was classified as phee. If F0 was half of the natural frequency, the simulated call was classified as a subharmonic-phee. If F0 was less or equal than one third of natural frequency, the call was classified as a cry.
7
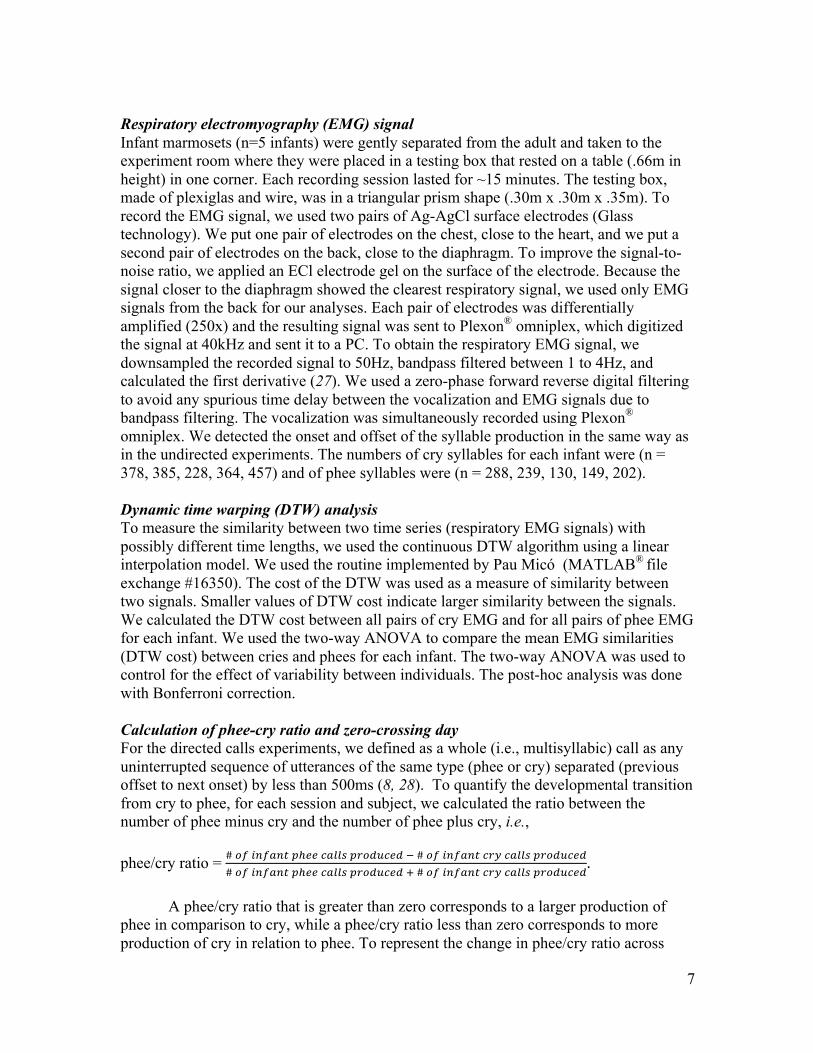
Respiratory electromyography (EMG) signal Infant marmosets (n=5 infants) were gently separated from the adult and taken to the experiment room where they were placed in a testing box that rested on a table (.66m in height) in one corner. Each recording session lasted for ~15 minutes. The testing box, made of plexiglas and wire, was in a triangular prism shape (.30m x .30m x .35m). To record the EMG signal, we used two pairs of Ag-AgCl surface electrodes (Glass technology). We put one pair of electrodes on the chest, close to the heart, and we put a second pair of electrodes on the back, close to the diaphragm. To improve the signal-to-noise ratio, we applied an ECl electrode gel on the surface of the electrode. Because the signal closer to the diaphragm showed the clearest respiratory signal, we used only EMG signals from the back for our analyses. Each pair of electrodes was differentially amplified (250x) and the resulting signal was sent to Plexon® omniplex, which digitized the signal at 40kHz and sent it to a PC. To obtain the respiratory EMG signal, we downsampled the recorded signal to 50Hz, bandpass filtered between 1 to 4Hz, and calculated the first derivative (27). We used a zero-phase forward reverse digital filtering to avoid any spurious time delay between the vocalization and EMG signals due to bandpass filtering. The vocalization was simultaneously recorded using Plexon® omniplex. We detected the onset and offset of the syllable production in the same way as in the undirected experiments. The numbers of cry syllables for each infant were (n = 378, 385, 228, 364, 457) and of phee syllables were (n = 288, 239, 130, 149, 202). Dynamic time warping (DTW) analysis To measure the similarity between two time series (respiratory EMG signals) with possibly different time lengths, we used the continuous DTW algorithm using a linear interpolation model. We used the routine implemented by Pau Micó (MATLAB® file exchange #16350). The cost of the DTW was used as a measure of similarity between two signals. Smaller values of DTW cost indicate larger similarity between the signals. We calculated the DTW cost between all pairs of cry EMG and for all pairs of phee EMG for each infant. We used the two-way ANOVA to compare the mean EMG similarities (DTW cost) between cries and phees for each infant. The two-way ANOVA was used to control for the effect of variability between individuals. The post-hoc analysis was done with Bonferroni correction. Calculation of phee-cry ratio and zero-crossing day For the directed calls experiments, we defined as a whole (i.e., multisyllabic) call as any uninterrupted sequence of utterances of the same type (phee or cry) separated (previous offset to next onset) by less than 500ms (8, 28). To quantify the developmental transition from cry to phee, for each session and subject, we calculated the ratio between the number of phee minus cry and the number of phee plus cry, i.e., phee/cry ratio = # !" !"#$"% !!!! !"##$ !"#$%&'$ ! # !" !"#$"% !"! !"##$ !"#$%&'$
# !" !"#$"% !!!! !"##$ !"#$%&'$ ! # !" !"#$"% !"# !"##$ !"#$%&'$.
A phee/cry ratio that is greater than zero corresponds to a larger production of
phee in comparison to cry, while a phee/cry ratio less than zero corresponds to more production of cry in relation to phee. To represent the change in phee/cry ratio across
8
development, we fitted a cubic spline curve to the data and the resulting curve was called phee/cry ratio curve. We called zero- crossing day the first point at which the phee/cry ratio curve was equal to zero, transitioning from a negative phee/cry ratio to a positive phee/cry ratio. The idea of the zero-crossing day is that it quantifies how fast each infant transition from cry abundant initial period to phee dominated later period. We tested if the rate of weight change before the zero-crossing day could predict the change in phee/cry ratio. For this, we first calculated the difference between two consecutive weight measurements and divided by the number of days between the measurements. This gives us the local rate of weight change. The rate of weight change was calculated as the average of local rate of weight changes before the zero-crossing day. If there were any monotonic relationship between the weight change and the timing of transition from cries to phees, we would expect a significant Spearman correlation (r) between the rate of weight change and the zero-crossing day. We also calculated the robust linear regression curve and the two-sided t-test of the nullity of regression slope (n = 10 infants). Contingent/non-contingent vs zero crossing day A parental call was classified as contingent response to an infant call if the onset of parental call was separated by less than 5s from the offset of the infant call and there is no other call between both calls (8, 29). To test if the contingent parental responses were related with how fast the infants transition from cry to phee, we calculated the correlation between the proportion of infant phees for which the parents responded before the zero-crossing day (total number of contingent parental responses before the zero-crossing day divided by the total number of infant phees in the period) and the zero-crossing day. To calculate the correlation, we included only the proportion of contingent parental responses that happened before the zero-crossing day to be consistent with the causal ordering where the possible cause (contingent parental response) happens before the effect (zero-crossing day). We calculated the robust linear regression curve and used a two-sided t-test to verify if the slope of the regression was significantly different from zero (n = 10 infants). We also calculated the Spearman correlation to measure the strength of interaction. As a control for the contingent response calls, we tested if the non-contingent parental calls were related with how fast the infants transition from cry to phee. To do this, we calculated the Spearman correlation between the proportion of parental phees that were not contingent before the zero-crossing day (total number of non-contingent parental phees before the zero-crossing day divided by the total number of parental phees in the period) and the zero-crossing day. We also calculated the robust linear regression curve and the two-sided t-test of the nullity of regression slope. To account for the possibility that the observed correlation between the proportion of infant phees for which the parents responded and the zero-crossing-day is a consequence of genetics, we calculated, for six infants that had identical parents, the Spearman correlation between the proportion of infant phees for which the parents responded before the zero-crossing day and the zero-crossing-day. Because of small sample size, to test the nullity of Spearman correlation, we used the exact permutation test, splitting the proportion of ties. We also tested if the coefficients of the robust linear regression using the data for all infants and for the six infants with same parents were statistically different. For this, we applied a bootstrap test, in which we randomly resampled with replacement six infants and calculated the coefficients of the robust linear fit between the

9
proportion of phees for which parents responded and the zero-crossing day. We repeated this procedure 10,000 times and calculated the p-value under the null hypothesis of equality of coefficients.
To verify if there was any significant change in parental vocal output during infant development, we calculated the rate of parental phee call production. For each parent (mother and father), we calculated the rate of phee production during vocal interaction with each infant. We fitted for each parent-infant pair a cubic spline curve (MATLAB® csap) to represent the trajectory of phee production during infant development. We also fitted a cubic spline curve to the population data of phee production for the mother and father. To verify if there is any systematic change in the phee production rate during infant development, we fitted a robust linear regression and used the two-sided t-test of the nullity of regression slope (n = 98 sessions for mother and n = 97 sessions for father).

10
Supplementary Text Growth is not linearly related to changes in acoustic parameters In the main text, we showed that the overall growth measured by weight is not linearly correlated with the developmental change of acoustic parameters. It is still possible that a higher order polynomial relationship could capture better the relationship between the acoustic parameters and weight. A standard way to infer possible non-linear relationship is to use log transforms of the variables. In this way, if the variables are related by some polynomial equation (e.g., y = a*x^p), the log transform will linearize the relationship (e.g., log(y) = p log(x) + log(a)) and then standard linear statistical inference can be applied. Fig. S1B shows that log weight changes visibly contrast with trajectories of the log transformed acoustic parameters (fig. S1A). To quantify this difference, we used log weight to predict changes in the four log transformed acoustic parameters. Black curves in fig. S1A represent predicted average parameter values given the average weight for each postnatal day and fig. S1C shows residues of these predictions. If growth completely explained the acoustic parameters, the residues should be uncorrelated and identically distributed across postnatal days. Using Akaike Information Criterion (AIC), the order of the best polynomial fit was 3 for all residues related to the four acoustic parameters (Fig. 1D, main text). These results are very similar to the results without the log transforms and the conclusion is exactly the same. To show this, we calculated the correlation between the residues for original and log transformed variables, respectively, for duration, dominant frequency, amplitude modulation frequency, and Wiener entropy (Spearman correlation = 0.943, 0.974, 0.963, -0.956; p < 0.001 for all four parameters).
11
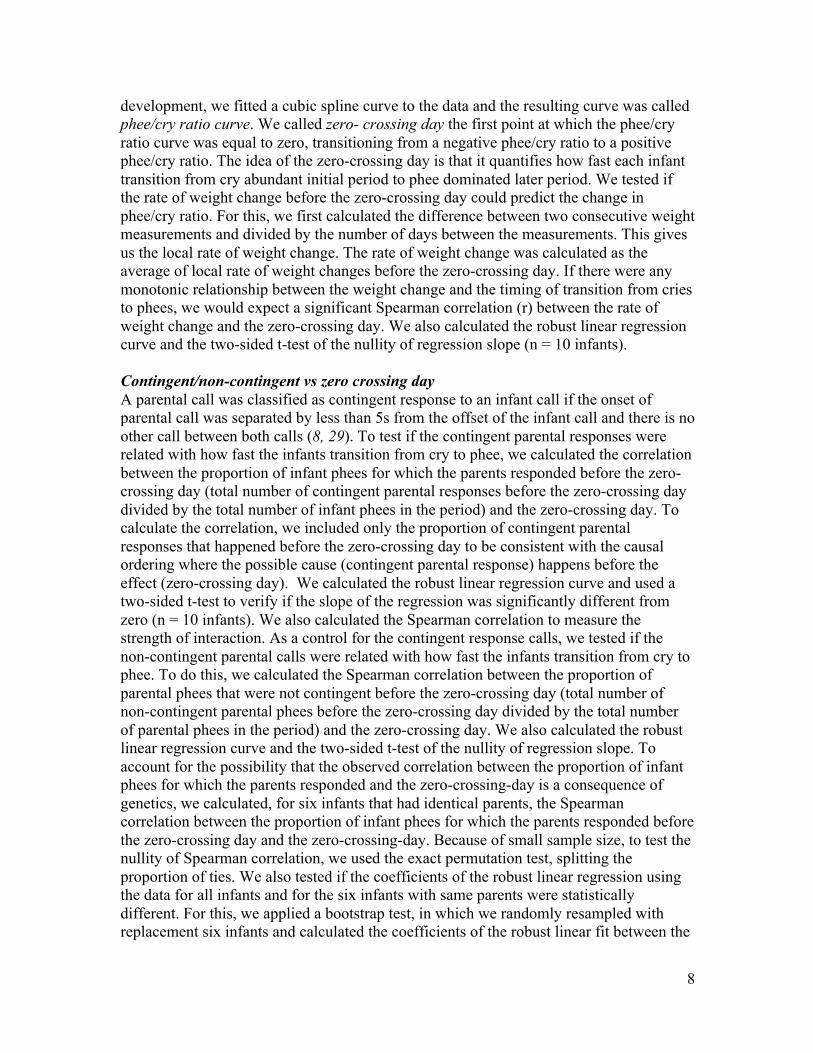
Fig. S1. Log weight cannot predict the developmental change in the log transformed acoustic parameters. (A) Scatter plots of developmental changes of four log transformed acoustic parameters for all 10 infants, showing average values per session for each infant (red circles) and cubic spline fit for the population average (blue curves). Black curves show log transformed parameter values through development predicted by the animals’ average daily weights. (B) Individual log transformed weights of each infant during development (orange circles) and cubic spline fit (gray curves) for their weight changes; black curve is cubic spline fit for average population log transformed weight. (C) Standardized residues of the regression using log transformed weights as predictors (blue points) and cubic spline fitted to residues in normalized units (blue curves).
12
Fig. S2. Proportion of contingent parental calls and zero-crossing day for full-siblings are correlated. The circles indicate the proportion of contingent parental response and the respective zero-crossing day. All six infants in this figure have identical parents. Circles with same colors indicate dizygotic twins. The black line represents the robust linear regression fit.

13
References (22-29) 22. von Luxburg, U. A tutorial on spectral clustering. Statistics and Computing 17, 395-416 (2007). 23. Fujita, A., Takahashi, D. Y. & Patriota, A. G. A non-parametric method to estimate the number of clusters. Computational Statistics & Data Analysis 73, 27-39 (2014). 24. Titze, I. R. The physics of small‐amplitude oscillation of the vocal folds. The Journal of the Acoustical Society of America 83, 1536-1552 (1988). 25. Perl, Y. S., Arneodo, E. M., Amador, A., Goller, F. & Mindlin, G. B. Reconstruction of physiological instructions from zebra finch song. Physical Review E 84, 051909 (2011). 26. Kasdin, J. Discrete simulation of colored noise and stochastic processes and 1/fa power law noise generation. Proceedings of the IEEE 83, 802-827 (1995). 27. Clancy, E. A. Electromyogram amplitude estimation with adaptive smoothing window length. IEEE Transactions on Biomedical Engineering 46, 717-729 (1999). 28. DiMattina, C. & Wang, X. Virtual vocalization stimuli for investigating neural representations of species-specific vocalizations. Journal of Neurophysiology 95, 1244-1262 (2006). 29. Miller, C. T. & Wang, X. Sensory-motor interactions modulate a primate vocal behavior: antiphonal calling in common marmosets. Journal of comparative physiology A 192, 27-38 (2006).

14
Audio S1 – S8 Sound files corresponding to the spectrograms in Fig. 1A which illustrate the dramatic changes in vocal output of infant marmosets over the course of 2 months in the undirected (social isolation) context. Audio S1 to S4 correspond to the spectrograms for Infant 1 at P1, P13, P36, and P60, respectively. Audio S5 to S8 correspond to the spectrograms for Infant 2 at P1, P14, P33, and P59, respectively. Supplementary data Data set used to plot the figures and calculate the statistics in the article. SupplementaryData.zip file contains six .mat files that we describe below. 1) AcousticParameter_Development.mat (Figs. 1B, 1D, 2A, 2B, 2C)
• ParameterValuePerSubjDay(Subject, Day, Params) gives the average acoustic parameter value of Params (1 = duration, 2 = dominant frequency, 3 = AM frequency, 4 = Wiener entropy) for each Subject (marmoset 1 to 10) at Day (postnatal day 1 to 63). It returns NaN if there was no recording for that Day and Subject.
• ParameterValuePerSubjDaySyllable{Subject}{Session}(Syllable, Params) gives the parameter value of Params (1 to 4) for each Syllable and Subject (1 to 10) at Session. The corresponding dates for the Session are given by the postnatal days that are not NaN in ParameterValuePerSubjDay.
• ParameterName{Params} gives the name of parameters corresponding to Params. 2) Weights.mat (Figs. 1C, 1D)
• Weightdata{Subject}(Session, [Day Weight]) gives for each Subject (1 to 10) and Session the corresponding Day (postnatal day) and Weight.
3) CallDuration_Development.mat (Fig. 2D)
• TotDurationCall{Subject}{Type}(Session) gives the total duration (sum of the duration of all calls in a session) for each Session and given Type (1= Phee, 2 = Twitter, 3 = Trill, 4 = Cry, 5 = Subharmonic-phee, 6 = Phee-cry).
• CallName{Type} gives the name of the call type for each Type. 4) DTW.mat (Fig. 3K)
• DTWdist{Type}{Subject} returns the DTW costs for all the pair of syllables for each Type (1 = Phee, 2 = Cry) and Subject (1 to 5).
• CallType{Type} gives the name of the call type for each Type. 5) PheeCryTransition.mat (Figs. 4A, 4B, 4C, 4D, 4E, 4F)
• ContingentParentalResp(Subject) gives the proportion of infant calls for which the parents responded before the zero-crossing day for each Subject (1 to 10)

15
• NonContingentParentalResp(Subject) gives the proportion of non-contingent parental calls before the zero-crossing day for each Subject (1 to 10).
• Cry{Subject}(Session) gives the total number of cries produced in Session for each Subject (1 to 10).
• Phee{Subject}(Session) gives the total number of phees produced in Session for each Subject (1 to 10).
• PheeCryRatio{Subject}(Session) gives the phees-cry ratio for each Session and Subject (1 to 10).
• PostnatalDay{Subject}(Session) gives the corresponding postnatal day for each Session and Subject (1 to 10).
• RateWeightChange(Subject) gives the rate of weight change for each Subject (1 to 10).
• ZeroCrossingDay(Subject) gives the zero-crossing day for each Subject (1 to 10). 6) MotherFatherCallRate.mat (Fig. 4G)
• MotherPheeCallRate(Session) gives the number of phees produced per minute by the mother in a Session (1 to 98).
• MotherPND(Session) gives the postnatal day of each Session for the mother (1 to 98).
• FatherPheeCallRate(Session) gives the number of phees produced per minute by the father in a Session (1 to 97).
• FatherPND(Session) gives the postnatal day of each Session for the father (1 to 97).