the design and testing of an axial compressor having a...
TRANSCRIPT
., ...
LIBRARY !~OYAL " ..... -,v,+'~ ET ESTABL!SI'+'~,,'=-N
M I N I S T R Y O F S U P P L Y
AERONAUTICAL RESEARCH COUNCIL : REPORTS A N D MEMORANDA
The Design and Testing of an Axial Compressor having a Mean Stage
Temperature Rise of 3 ° deg C " " B y .
A. D. S. CARTER, S. J . AN1)REWS ,and E. A. FIELDER
LONDON
Cro~m Copyright Reserved
H E R MAJESTY'S STATIONERY OFFICE
1957 F I V E S H I L L I N G S N E T
R. & M. No. 2985 (16,775)
A.R.C. Technical Report
The Design and Testing of an Axial Compressor having a Mean Stage Temperature Rise of 3 o des C
By A. D. S. CA~TER, S. J. ANDREWS and E. A. FIELDER
COMMUNICATED BY THE PRINCIPAL DIRECTOR Or SCIEHTIHC RESEARCH (AIR), IVIINISTRY OF SUPPLY
Reports and Memoranda Wo. 2985* 2Vovember, 1953
Summary.--This report describes a compressor which was designed to give a mean stage temperature rise of 30 des C. I t has six stages so that the overall pressure ratio at the design point is 4.5 : 1. Full details of the factors which led to the form adopted and of the design itself are given in the report.
The test results fully substantiated the design assumptions. In particular, using standard design data, it is possible to achieve temperature rises of about 30 deg C without sacrificing unduly any desirable performance features. Such temperature rises were considerably above those being used at the time this work was carried out, and are in fact substantially above the mean value used in present-clay designs.
Details of the stage characteristics and the matching of the compressor have been given in the report, together with some other points of special interest.
1. Introduction.--In 1944 the National Gas Turbine Establ ishment--or Power Jets (Research & Development) Ltd., as it then was--s tar ted design work on an advanced form of axial com- pressor, later known by the serial reference 109. The compressor was subsequently built and tested, the results substantiating in a large measure the design objectives. Although the complete design details and the test results have received limited circulation and certain information generally published (Ref. 1), no formal report of the design details and test results has been made. This report has therefore been prepared to provide comprehensive design and test data and to serve as a reference for further comparative work now proceeding on the compressor.
2. Description of Compressor.--2.1. Design Features.--The salient feature of the design was an a t tempt to increase the mean stage temperature rise from an average contemporary value of somewhat less than 20 des C, to the highest possible value compatible with the cascade da ta then available. The design s tudy showed that a rise of 30 des C per stage was about the limit. Assuming an overall adiabatic efficiency of 85 per cent, it seemed that a pressure ratio of about 4.5 : 1 could be obtained from a six-stage compressor. A mass flow of 70 lb/sec was adopted to give a compressor of suitable size for the existing test facilities.
A constant outside or rotor tip diameter was desirable to maintain the highest possible blade speeds in the later stages. Assuming an inside/outside diameter ratio at inlet to the first stage of 0.6, this being the lower limit of contemporary practice, it was found that the performance outlined above could be obtained from a compressor 24.34 in. in outside diameter running at 9,500 r.p.m. This gives a rotor tip blade velocity of 1,010 ft/sec. The mass flow corresponds to 21.7 lb/sec/sq ft frontal area, neglecting casing thickness.
*N.G.T.E. Report R.148, received 15th May, 1954.
1 A .
Previous work had shown that the maximum stage temperature rise would be obtained using a fluid outlet angle of about 35 deg (see Ref. 2). However, this would have entailed a weight/ power ratio and outside diameter in excess of their minimum values. Since the work was being carried out primarily for aircraft engine application, this was considered undesirable. An outlet angle of 25 deg was finally adopted. This value entailed little loss in stage temperature rise, and gave the minimum weight/power ratio, together with an outside diameter approaching the minimum value (see Fig. 97 of Ref. 2). These figures have since been checked using the latest cascade data. The new calculation would suggest that the maximum stage temperature rise is hardly affected by outlet angle, at least over the range 20 to 35 deg.
With the type of high-speed design envisaged, a blade twist approaching constant reaction was obviously desirable. A compromise between constant reaction and half vortex was adopted in which the Much number at inlet to the stator was constant along the blade length. With the assumption of a radially constant axial velocity this gave the now well known 'constant c~3' blade twist. The section of 50 per cent reaction was kept at the mean diameter for all stages. The Much numbers at the mean diameter are 0.72 at the first stage and 0.70 at the last. The highest Much number is 0.8 at the first-stage rotor tip.
The blades themselves were designed for zero incidence at all sections. A parabolic camber-line was used for the first time in a compressor. It was believed that the higher throat areas associated with these blades would be beneficial. The deviation rule was substantially the same as that given in Ref. 3. Both rotor and stator blades were tapered in thickness from root to tip, but the chords were kept constant. For manufacturing purposes the blade sections were defined at two stations, one near the root and the other near the tip of the blade. Intermediate sections were obtained by a linear interpolation between these datum sections.
In estimating the stage temperature rise a constant work done factor of 0.86 was used through- out. The annulus heights were determined from the mean mass flow on the basis of a constant axial velocity. No allowance was made for the growth of the boundary layer on the annulus walls.
It will be appreciated from the above comments that the simplest possible design assumptions were made throughout. It was hoped to achieve the high performance only by pushing existing design methods and data to the limit, the ephemeral attractions of over-elaboration being firmly resisted.
The mechanical design and construction of the compressor is not representative of either aircraft or industrial technique. It was dictated largely by the possible experimental work that was envisaged, and by the manufacturing facilities available. For example, it was anticipated that the aerodynamic design innovations could result in a serious mismatching of the stages and a consequent loss of efficiency--though this fear subsequently proved unfounded. Hence the mechanical design was such that all the stages could be tested separately if necessary, or alterna- tively any group of stages could be tested. Provision was als0 made for adding two more stages to the compressor though an eight-stage version has not yet been tested. A further feature of the design was a provision permitting shrouding to be used on the stators in place of the s imple radial clearance adopted in the original design. This feature also has not been incorporated in any design so far. All these features resulted'in a compressor that was somewhat heavier than normal aircraft practice.
The blade chord lengths were reduced in successive stages to give the same gas bending stress for each row. This was about 4½ tons/sq in. at the desig n point with standard inlet conditions. The direct centrifugal stress varied from 12½ tons/sq in. in the first-stage rotor blade to 5 tons/sq in. in the sixth. The axial length of the compressor over all the blade rows (including the I.G.V's) is 18.1 inches. The blades were manufactured by the lost wax process, tile rotors being cast in Vitallium and the stators in H.R. Crown Max. They are thus not representative of compressor practice.
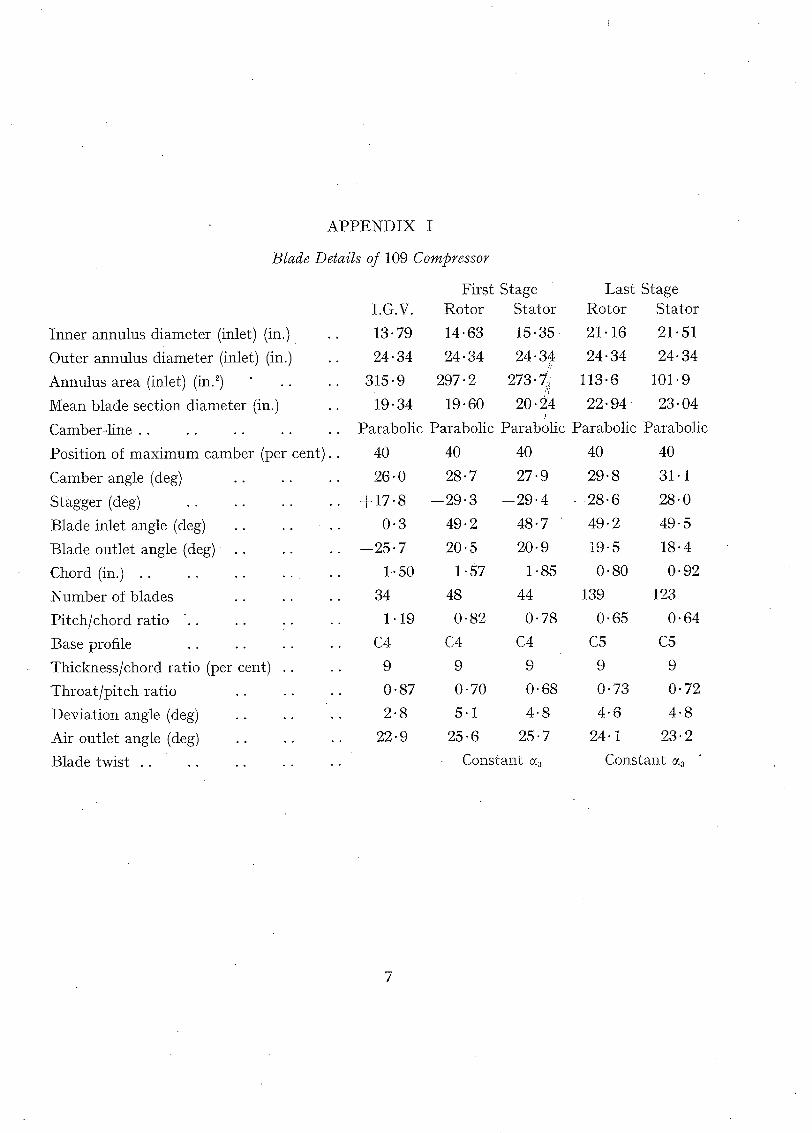
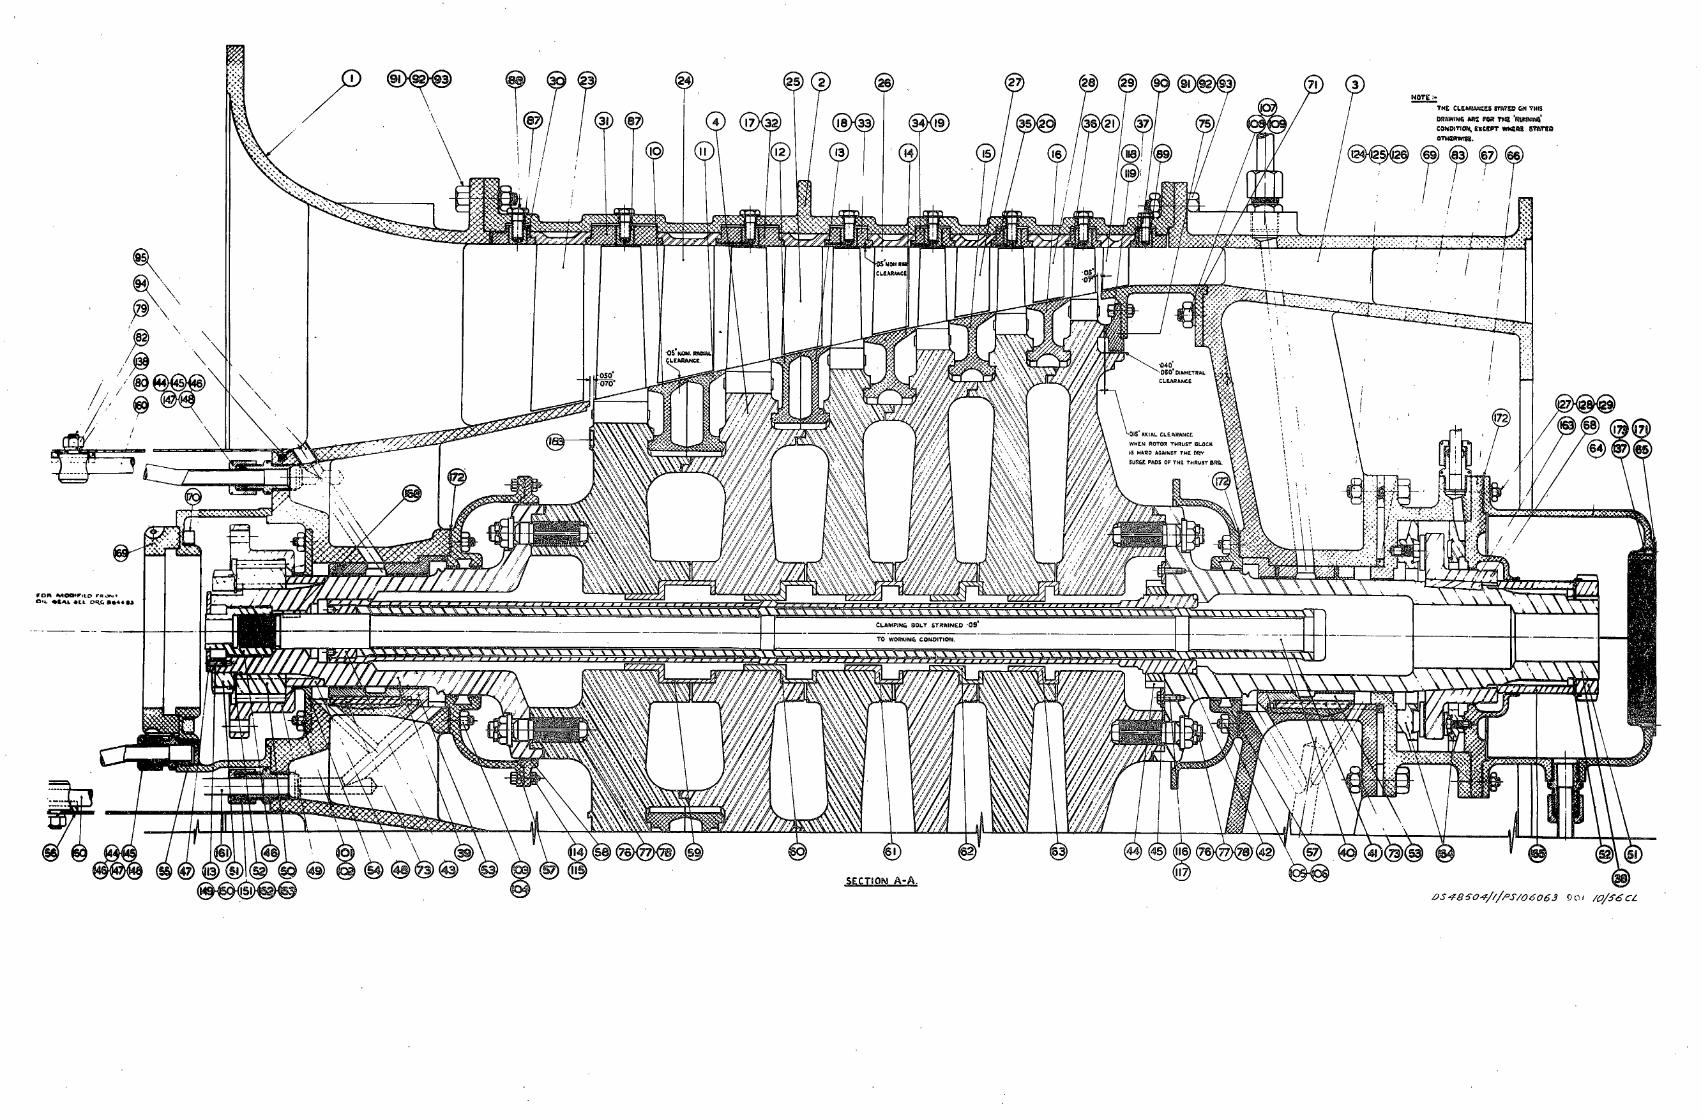
A drawing showing the general arrangement of the compressor is reproduced in Fig. 1. Details of the blading are given in Appendix I.
2
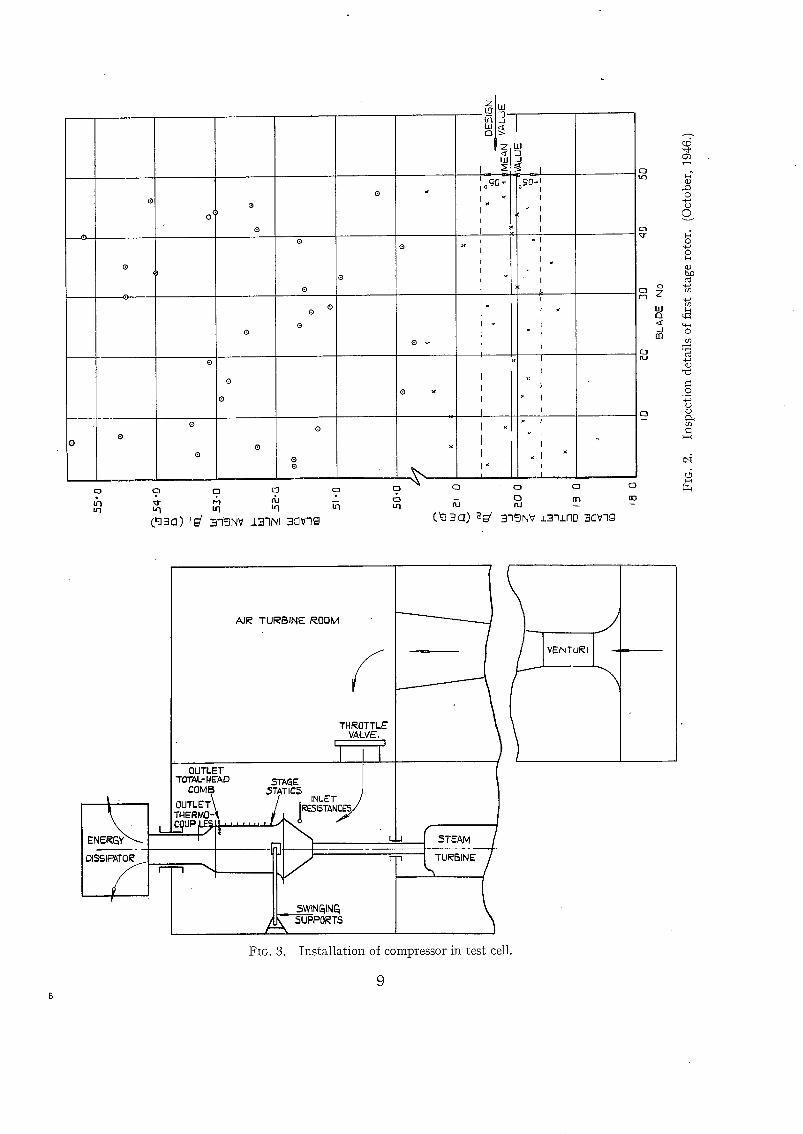
2.2. Manufacturing Errors a~d Blade Details of Test Compressor.--It is well known that small changes in blade angles can have a marked effect on compressor performance. The 109 com- pressor was built to be within the standard N.G.T.E. manufactur'_ng tolerances, but a number of errors were present. The compressor was accepted with these errors to expedite the tests. For checking purposes most of the blades in stage 1 rotor were examined in detail. A plot of the derb/ed blade inlet and outlet angles is shown in Fig. 2. It will be observed that the blade outlet angles, which determine the performance, are generally within a i 0.5 deg band, though a few are as far out as 4- 1-2 deg. The scatter appears quite random. Sample blades were also examined from the other rows. The error in the blade outlet angles for each row has been tabulated in Appendix IIa. In general the measured blade angles are less than the design, though in view of the limited number of blades inspected it is doubtful if any quantitative data can be deduced.
Since these measurements were taken the compressor has been completely stripped, and rebuilt with new discs suitable for 9verspeed testing. No detail measurements of blade angle were taken at the time of the rebuild, though the only difference would be due to the disc fir tree broachings and such differences should be very small. Quite recently the blading of this build of the compressor was re-inspected using the very latest techniques. The details of this examination are given in Appendix II(b). This inspection confirms that the blade outlet angles are generally lower than design, especially in the earlier stages. The arithmetic mean of the error in all rows is 0.4 deg. An estimation of the performance of the compressor based on this inspection reports shows that the design pressure ratio of 4.5 : 1 should be obtained at a flow of about 72 lb/sec instead of at the design value of 70.0 lb/sec.
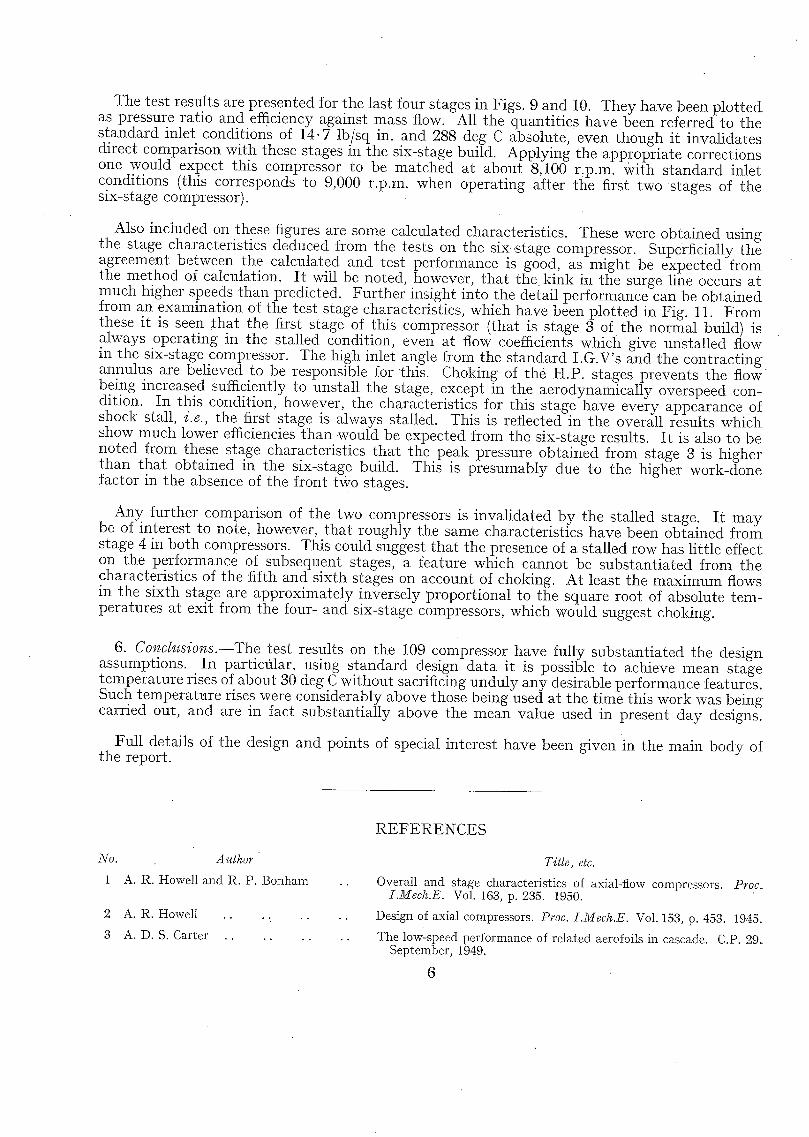
3. Test Technique.--The location of the 109 compressor in the test cell is shown in Fig. 3. The air path to the compressor inlet is also indicated on this figure. The compressor was mounted in a swung frame so that the power input could be measured by the torque reaction on the stator casing. Unfortunately, the precimeter used for this purpose was only considered reliable for one set of tests. In addition to the torque measurements, however, the temperature rise over the blading was measured directly. Resistance elements were used at inlet, and four thermocouples equally spaced around the annulus at outlet.
To allow for velocity profiles, total pressures were measured by four combs of five pitots equally spaced around the annulus. Each tube was placed at the centre of equal annulus areas, and an arithmetic mean was taken as the total pressure at the comb. Wall statics were used to measure static pressures. The location of all the instrumentation is shown in Fig. 3.
Themass flow was measured by a calibrated venturi at entry to the test cell as shown in Fig. 3. A correction for leakage into the cell when operating at sub-atmospheric inlet pressures had to bemade . The maximum correction was about 5 per cent of the total mass flow.
In addition to the overall measurements, the static pressure at the casing was measured between each stage to obtain some indication of the stage operating conditions. Two points located diametrically opposite each other were employed for this purpose. The arithmetic mean of these was taken as the static pressure between the rows.
It is considered that the absolute accuracy of the major performance parameters are: mass: flow 4- 2 per cent, efficiency 4- 2 per cent, and pressure 4- 1 per cent.
In order to keep within the power limitations of the existing test facilities, it was necessary to. resort to inlet throttling at the higher speeds. One effect of this was to reduce the gas bending stress below the design values, which were based on standard entry conditions. In addition the test Reynolds number was reduced below the design value. As the inlet throttling was only appreciable at the higher flows it is not considered to have had any significant effect on the performance, though the efficiency may perhaps be some one per cent below the value that would be obtained with standard entry conditions. The table overleaf gives the mean cell conditions for each speed ~n the series II tests, and indicates the degree of throttling employed.
3
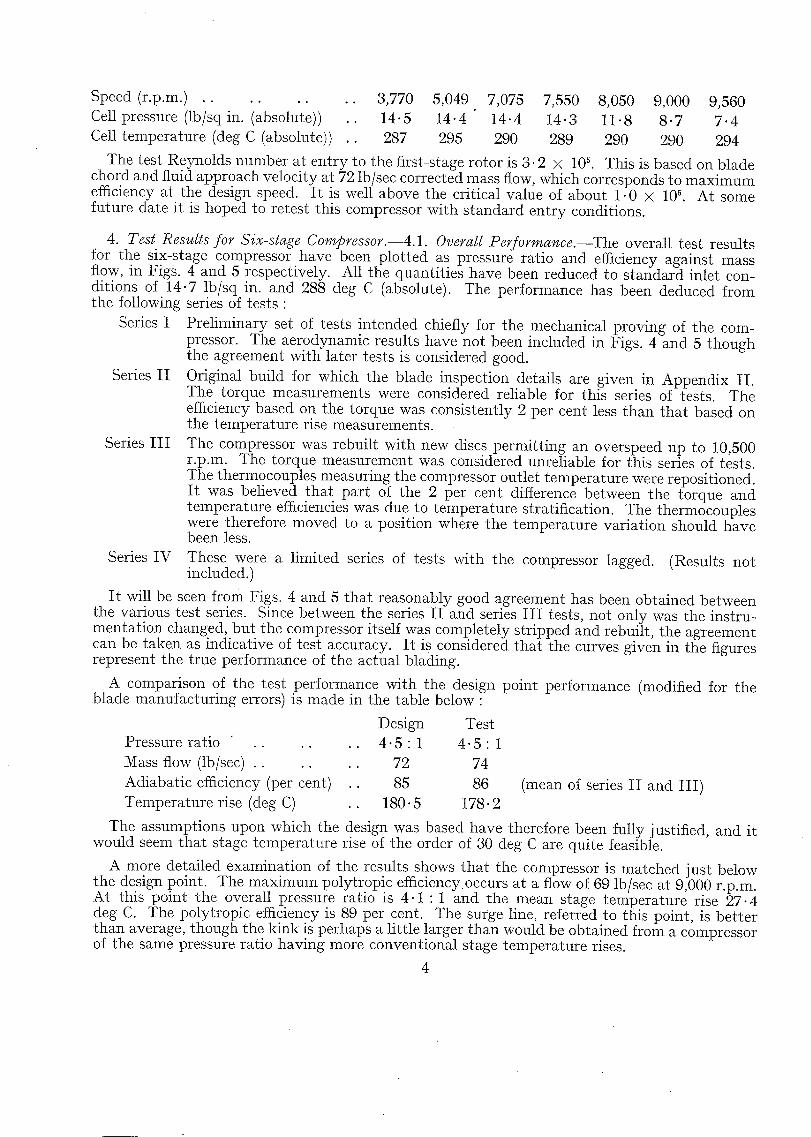
Speed (r.p.m.) . . . . . . . . 3,770 5,049 7,075 7,550 8,050 9,000 9,560 Cell pressure (lb/sq in. (absolute)) .. 14.5 14.4 14.4 14.3 11.8 8.7 7.4 Cell temperature (deg C (absolute)) .. 287 295 290 289 290 290 294
The test Reynolds number at entry to the first-stage rotor is 3.2 × 10 ~. This is based on blade chord and fluid approach velocity at 72 lb/sec corrected mass flow, which corresponds to maximum efficiency at the design speed. It is well above the critical value of about 1.0 × 10 ~. At some future date it is hoped to retest this compressor with standard entry conditions.
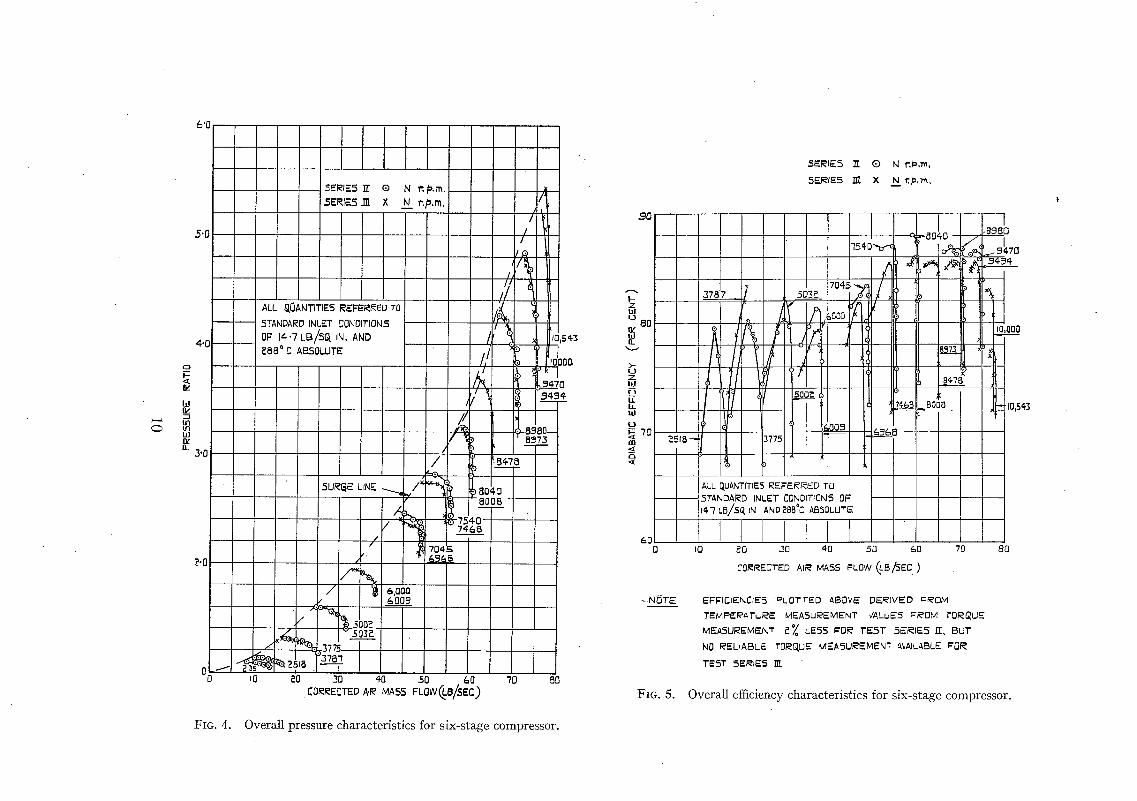
4. Test Results for Six-stage Compressor.--4.1. Overall Performance.--The overall test results for the six-stage compressor have been plotted as pressure ratio and efficiency against mass flow, in Figs. 4 and 5 respectively. All the quantities have been reduced to standard inlet con- ditions of 14.7 lb/sq in. and 288 deg C (absolute). The performance has been deduced from the following series of tests :
Series I Preliminary set of tests intended chiefly for the mechanical proving of the com- pressor. The aerodynamic results have not been included in Figs. 4 and 5 though the agreement with later tests is considered good.
Series II Original build for which the blade inspection details are given in Appendix II. The torque measurements were considered reliable for this series of tests. The efficiency based on the torque was consistently 2 per cent less than that based on the temperature rise measurements.
Series III The compressor was rebuilt with new discs permitting an overspeed up to 10,500 r.p.m. The torque measurement was considered unreliable for this series of tests. The thermocouples measuring the compressor outlet temperature were repositioned. It was believed that part of the 2 per cent difference between the torque and temperature efficiencies was due to temperature stratification. The thermocouples were therefore moved to a position where the temperature variation should have been less.
Series IV These were a limited series of tests with the compressor lagged. (Results not included.)
It will be seen from Figs. 4 and 5 that reasonably good agreement has been obtained between the various test series. Since between the series II and series III tests, not only was the instru- mentat ion changed, but the compressor itself was completely stripped and rebuilt, the agreement can be taken as indicative of test accuracy. It is considered that the curves given in the figures represent the true performance of the actual blading.
A comparison of the test performance with the design point performance (modified for the blade manufacturing errors) is made in the table below :
Design Test Pressure ratio . . . . . . 4.5 : 1 4.5 : 1 Mass flow (lb/sec) . . . . . . 72 74 Adiabatic efficiency (per cent) .. 85 86 Temperature rise (deg C) .. 180.5 178.2
(mean of series II and III)
The assumptions upon which the design was based have therefore been fully justified, and it would seem that stage temperature rise of the order of 30 deg C are quite feasible.
A more detailed examination of the results shows that the compressor is matched just below the design point. The maximmn polytropic efficiency occurs at a flow of 69 1b/see at 9,000 r.p.m. At this point the overall pressure ratio is 4.1 : 1 and the mean stage temperature rise 27-4 deg C. The polytropic efficiency is 89 per cent. The surge line, referred to this point, is better than average, though the kink is perhaps a little larger than would be obtained from a compressor of the same pressure ratio having more conventional stage temperature rises.
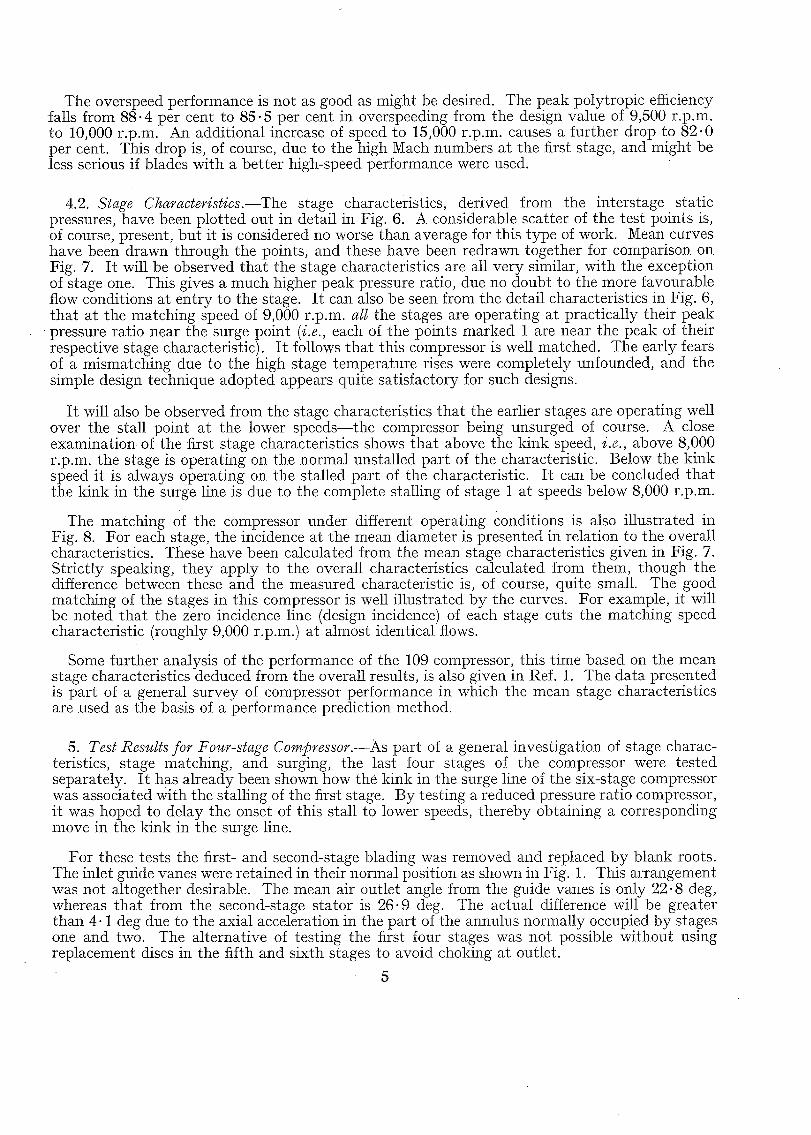
The overspeed performance is not as good as might be desired. The peak polytropic efficiency falls from 88-4 per cent to 85.5 per cent in overspeeding from the design value of 9,500 r.p.m. to 10,000 r.p.m. An additional increase of speed to 15,000 r.p.m, causes a further drop to 82.0 per cent. This drop is, of course, due to the high Math numbers at the first stage, and might be less serious if blades with a better high-speed performance were used.
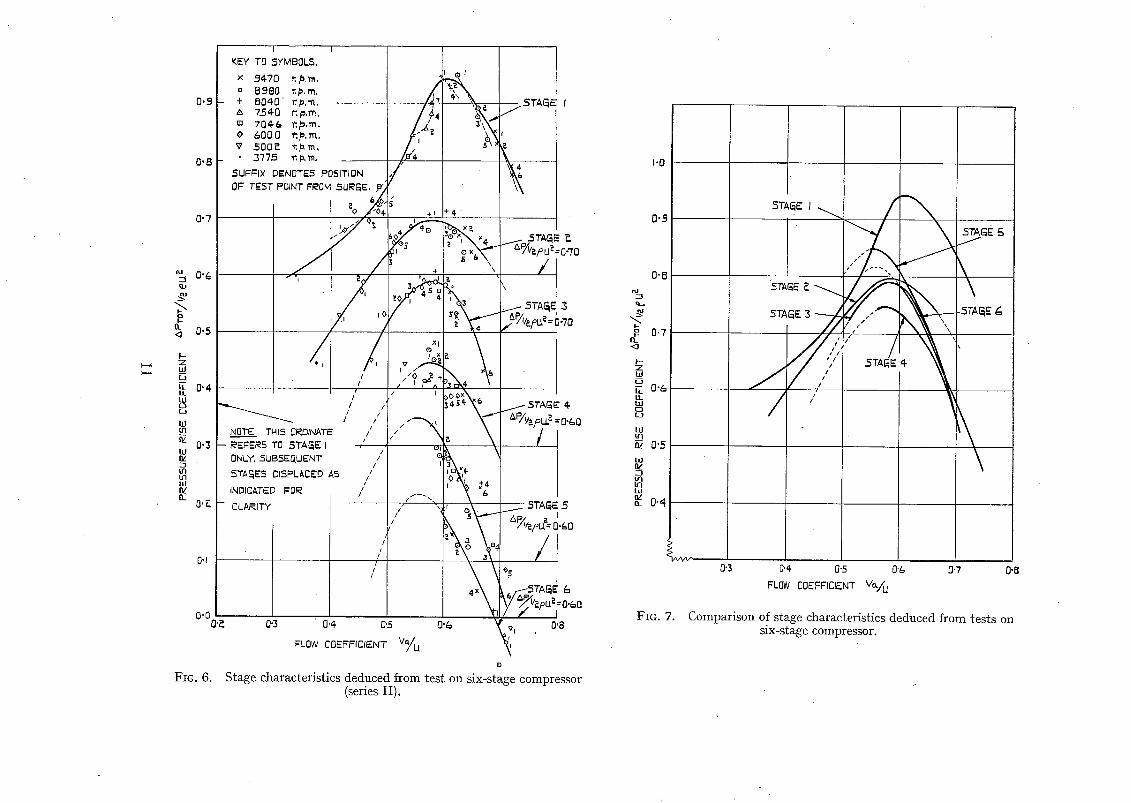
4.2. Stage Characteristics.--The stage characteristics, derived from the interstage static pressures, have been plotted out in detail in Fig. 6. A considerable scatter of the test points is, of course, present, but it is considered no worse than average for this type of work. Mean curves have been drawn through the points, and these have been redrawn together for comparison on Fig. 7. I t will be observed that the stage characteristics are all very similar, with the exception of stage one. This gives a much higher peak pressure ratio, due no doubt to the more favourable flow conditions at entry to the stage. I t can also be seen from the detail characteristics in Fig. 6, that at the matching speed of 9,000 r.p.m, all the stages are operating at practically their peak
-pressure ratio near the surge point (i.e., each of the points marked 1 are near the peak of their respective stage characteristic). I t follows tha t this compressor is well matched. The early fears of a mismatching due to the high stage temperature rises were completely unfounded, and the simple design technique adopted appears quite satisfactory for such designs.
I t will also be observed from the stage characteristics that the earlier stages are operating well over the stall point at the lower speeds--the compressor being unsurged of course. A close examination of the first stage characteristics shows that above the kink speed, i.e., above 8,000 r.p.m, the stage is operating on the normal unstalled part of the characteristic. Below the kink speed it is always operating on the stalled part of the characteristic. I t can be concluded tha t the kink in the surge line is due to the complete stalling of stage 1 at speeds below 8,000 r.p.m.
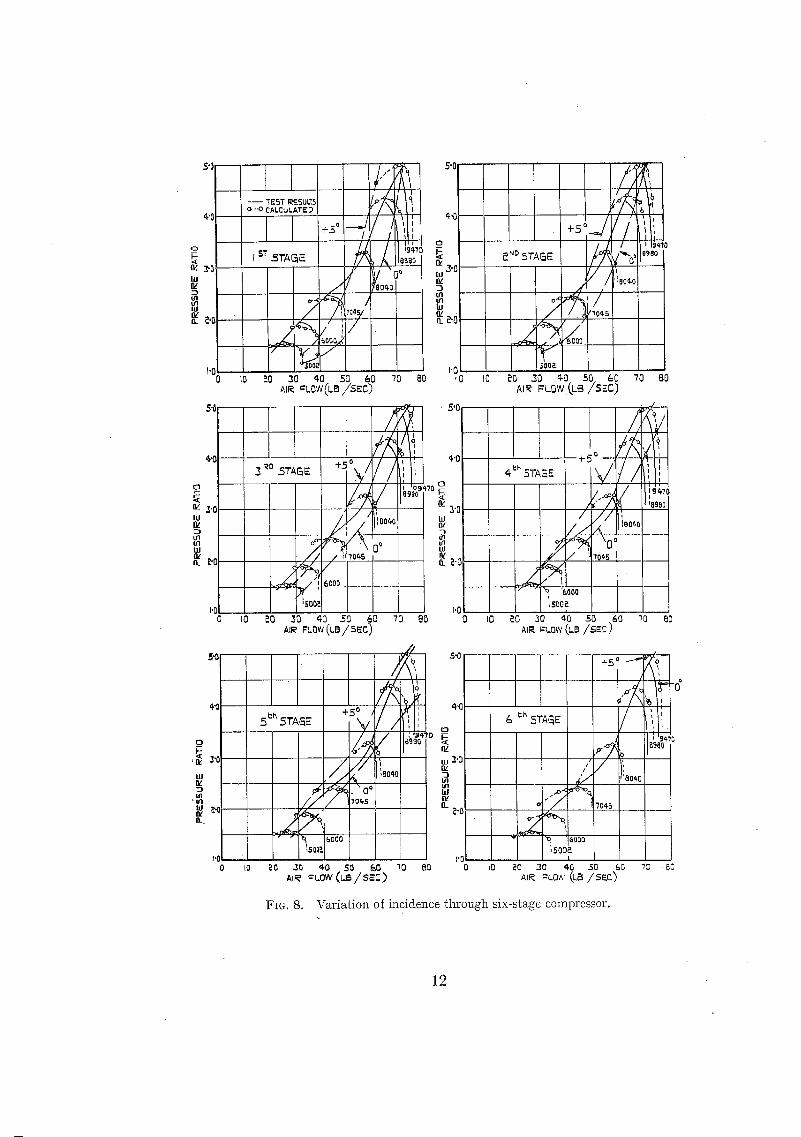
The matching of the compressor under different operating Conditions is also illustrated in Fig. 8. For each stage, the incidence at the mean diameter is presented in relation to the overall characteristics. Tt~ese have been calculated from the mean stage characteristics given in Fig. 7. Strictly speaking, they apply to the overall characteristics calculated from them, though the difference between these and the measured characteristic is, of course, quite small. The good matching of the stages in this compressor is well illustrated by the curves. For example, it will be noted that the zero incidence line (design incidence) of each stage cuts the matching speed characteristic (roughly 9,000 r.p.m.) at almost identical flows.
Some further analysis of the performance of the 109 compressor, this time based on the mean stage characteristics deduced from the overall results, is also given in Ref. 1. The data presented is part of a general survey of compressor performance in which the mean stage characteristics are used as the basis of a performance prediction method.
5. Test Results for Four-stage Compressor.--As part of a general investigation of stage charac- teristics, stage matching, and surging, the last four stages of the compressor were tested separately. I t has already been shown how the kink in the surge line of the six-stage compressor was associated With the stalling of the first stage. By testing a reduced pressure ratio compressor, i t was hoped to delay the onset of this stall to lower speeds, thereby obtaining a corresponding move ill the kink in the surge line.
For these tests the first- and second-stage blading was removed and replaced by blank roots. The inlet guide vanes were retained in their normal position as shown in Fig. 1. This arrangement was not altogether desirable. The mean air outlet angle from the guide vanes is only 22.8 deg, whereas that from the second-stage stator is 26.9 deg. The actual difference will be greater than 4- 1 deg due to the axial acceleration in the part of the annulus normally occupied by stages one and two. The alternative of testing the first four stages was not possible without using replacement discs in the fifth and sixth stages to avoid choldng at outlet.
5
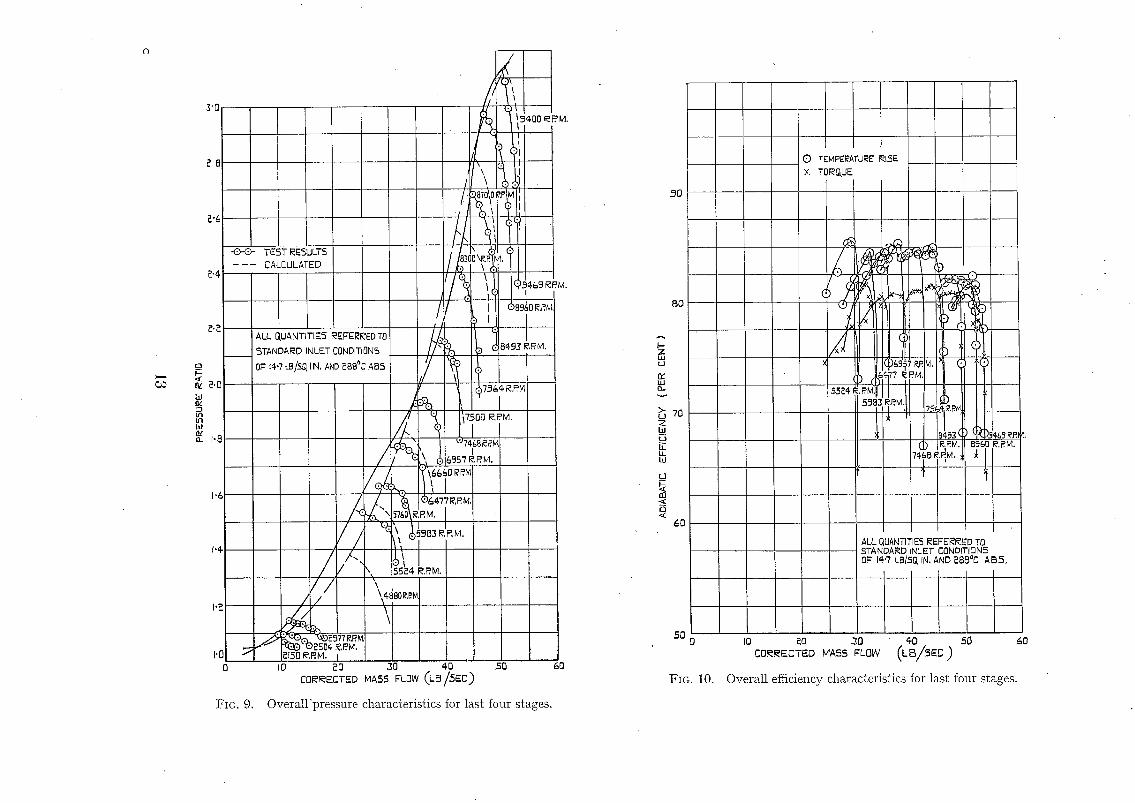
The test results are presented for the last four stages in Figs. 9 and 10. They have been plotted as pressure ratio and efficiency against mass flow. All the quantities have been referred to the standard inlet conditions of 14.7 lb/sq in. and 288 deg C absolute, even though it invalidates direct comparison with these stages in the six-stage build. Applying the 'appropriate corrections one would expect this compressor to be matched at about 8,100 r,p.m. With standard inlet conditions (this corresponds to 9,000 r.p.m, when operating after the first two stages of the six-stage compressor).
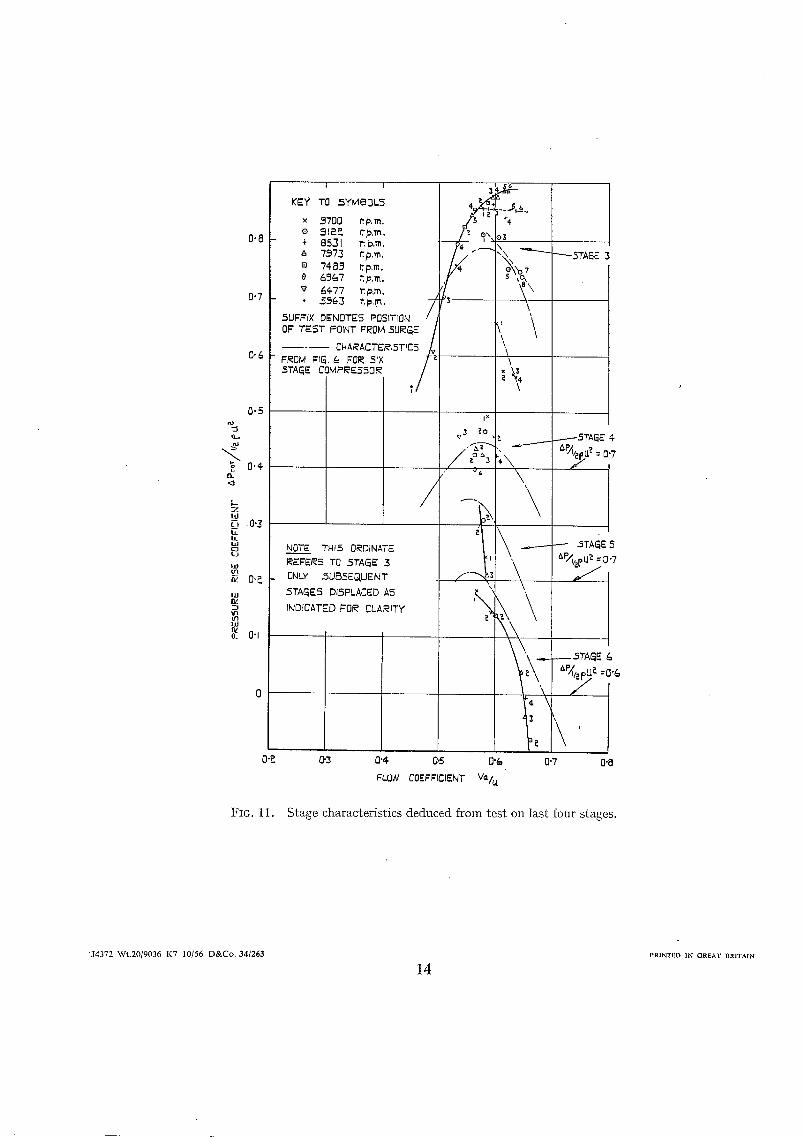
Also included on these figures are some calculated characteristics. These were obtained using the stage characteristics deduced from the tests on the six-stage compressor. Supei~ficially the agreement between the calculated and test performance is good, as might be expected from the method of calculation. I t will be noted, however, that t he kink in the surge line occurs at much higher speeds than predicted. Further insight into the detail performance can be obtained from an examination of the test stage characteristics, which have been plotted in Fig. 11. From these it is seen ~hat the first stage of this compressor (that is stage 3 of the normal build) is always operating in the stalled condition, even at flow coefficients which give unstalled flow m the six-stage compressor. The high inlet angle from the standard I.G.V's and the contracting annulus are believed to be responsible for this. Choking of the H.P. stages prevents the f low being increased sufficiently to unstall the stage, except in the aerodynamically overspeed con- dition. In this condition, however, the characteristics for this stage have every appearance of shock stall, i.e., the first stage is always stalled. This is reflected in the overall results which show much lower efficiencies than would be expected from the six-stage results. It is also to be noted from these stage characteristics that the peak pressure obtained from stage 3 is higher than that obtained in the six-stage build. This is presumably due to the higher work-done factor in the absence of the front two stages.
Any further comparison of the two compressors is invalidated by the stalled stage. I t may be of interest to note, however, that roughly the same characteristics have been obtained from stage 4 in both compressors. This could suggest that the presence of a stalled row has little effect on the performance of subsequent stages, a feature which cannot be substantiated from the characteristics of the fifth and sixth stages on account of choking. At least the maximum flows in the sixth stage are approximately inversely proportional to the square root of absolute tem- peratures at exit from the four- and six-stage compressors, which would suggest choking.
6. Comhts ions . - -The test results on the 109 compressor have fully substantiated the design assumptions. In particular, using standard design data it is possible to achieve mean stage temperature rises of about 30 deg C without sacrificing unduly any desirable performance features. Such temperature rises were considerably above those being used at the time this work was being carried out, and are in fact substantially above the mean value used in present day designs.
k
Full details of the design and points of special interest have been given in the main body of the report.
No. Author
1 A . R . Howell and R. P. Bonham
2 A.R. Howell
3 A . D . S . Carter . . . . . . . .
REFERENCES
Title, etc.
Overall and stage characteristics of axial-flow compressors. Proc. I.Mech.E. Vol. 163, p. 235. 1950.
Design of axial compressors. Proc. I.Mech.E. Vol. 153, p. 453. 1945.
The low-speed performance of related aerofoils in cascade. C.P. 29. September, 1949.
6
A P P E N D I X I
Blade Details of 109 Compressor
Inner annulus d iameter (inlet) ( in . )
Outer annulus diameter (inlet) (in.)
Annulus area (inlet) (in?) . .
Mean blade section diameter (in.)
Camber-line . . . . . . . .
Posit ion of m a x i m u m camber (per cent) .
Camber angle (deg) . . . .
Stagger (deg) ..
Blade inlet angle (deg)
Blade outlet angle (deg) ~
Chord (in.) . . . .
Number of blades
P i tch /chord ratio ..
Base profile . .
Thickness/chord ratio (per cent)
Throa t /p i tch ratio . .
Devia t ion angle (deg) . .
Air outlet angle (deg) ..
Blade twist . . . . . .
First Stage Last Stage I.G.V. Rotor Stator Rotor Stator
13.79 14-63 1 5 . 3 5 21.16 21.51
24.34 24.34 24-34 24.34 24.34
315.9 297.2 273"~i i 113.6 101.9
19.34 19.60 20.24 2 2 . 9 4 23.04 s
Parabolic Parabolic Parabolic Parabolic Parabolic
40 40 40 40 40
26.0 28.7 27.9 29.8 31- 1
+ 1 7 . 8 - - 2 9 . 3 - - 2 9 . 4 - -28 .6 - -28 .0
O. 3 49.2 48.7 49.2 49.5
- -25-7 20.5 20.9 19-5 18.4
1- 50 1- 57 1.85 O. 80 O. 92
34 48 44 139 123
1.19 O. 82 O- 78 O. 65 O. 64
C4 C4 C4 C5 C5
9 9 9 9 9
O. 87 O- 70 O. 68 O. 73 O. 72
2 .8 5"1 4"8 4"6 4"8
22.9 25.6 25.7 24.1 23.2
Constant oq C o n s t a n t o%
7
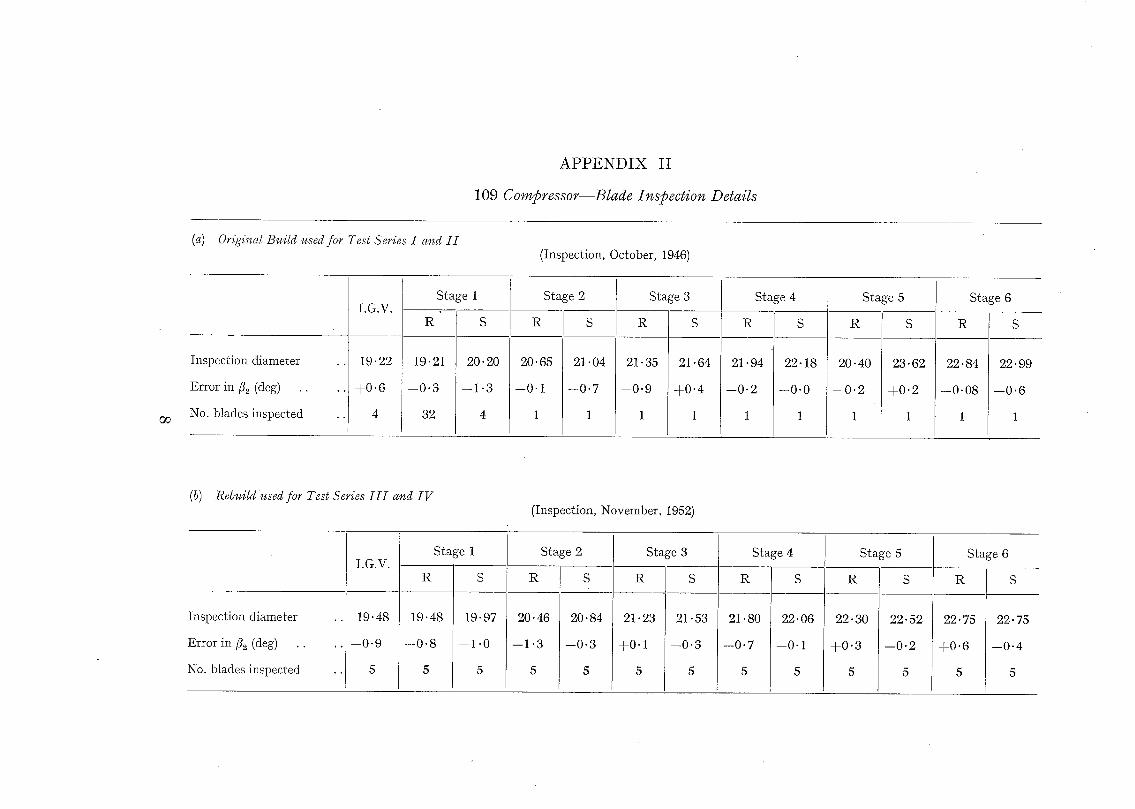
APPENDIX II
109 Compressor--Blade Inspection Details
(~) Origi~¢al Build used for Test Series I and I7 (Inspection, October, 1946)
oo
Inspection diameter
Error in/~2 (deg) . .
No. blades inspected
I.G.V.
19.22
+ 0 . 6
Stage 1
R S
19.21 20-20
- -0 .3 --1 "3
32 4
R
20.65
--0.I
I
Stage 2
21.04
- -0 .7
Stage 3
R S
21-35 21.64
--O.9 + 0 . 4
1 1
Stage 4 Stage 5
R
21 "94
--0"2
1
22- 18
--0 0
R
20- 40
- - 0 . 2
S
23.62
+0.2
1
Stage 6
R
22. $4
- -0 .08
1
22.99
- -0 .6
(b) Rebuild used for Test Series [ I [ and I V (Inspection, November, 1952)
Inspection diameter
Error in/~2 (deg) . .
No. blades inspected
I.G.V.
19.48
- -0 .9
5
Stage 1
R S
19.48 19-97
- - 0 . 8 - -1 .0
5 5
Stage 2
R S
20.46 20- 84
- -1-3 - -0 .3
5 5
Stage 3
R S
2t-23 21.53
+0 .1 - -0 .3
5 5
Stage 4
R S
21.80 22.06
--0"7 --0.1
5 5
Stage 5
R [ S
22-30 22.52
+ 0 . 3 - -0 .2
5 5
Stage 6
R S
22.75 22.75
+ 0 . 6 - -0 .4
5 5
\ , \
\
\ \ \ \
\
\
~LAMPJ~ 00£.T STRAtNF~D "OS'
"~0 WORKING C0~)]TIO~I.
~',X'~Y,,
'040' ",,060" DIJ~[TR~. CLF.ARAN~.[
) T ~ THI~b~T DL0~K
i
L
i, t
/ ,
NOTE :*
Ds 4,95"o4///:s/o6o63 ~ ~, /0/:6 CL
----0-
o lh u-i
o (
@
o
®
®
®
®
®
® ®
o
® ®
(3 (::3 c3 o
(.L-JaQ) ~i~' 37~NV 1371NI 3(::]V78
I
o 90 - I I I
I I
y2 ,W wlJ
I
I
i
I I I
I
I
I
I I
I
I
I I
I
Q c2~
o
, i i
i
i
i
I I
I
I
J ) I
I
J i
i
i '< i
i
o (:3 cD c> 07 0o i J.-} - -
C~:~d,) ~ ' 37~NV ±371n0 ~riv7g
t ~
W 121
£3
CD
~b
O
O
,2
(~ISSIPA~" - r
AIR TURBINE ROOM
/ IvE-T
I I
I I OUTLET
TOTAL- HEAD 5TA~E COMB 3TATIC~ j
OUTLET\ / INL.ET ] TNERMO-, / IRES LSTAN,~
5W~NC~ING ~ 5UPPOI~TS
f
L J 5TEAM
r ~ 7 I ~
FIo. 3. Installation of compressor in test cell.
9 B
6'P
54
BO
5ERIE5 :E E) N f'.p,m.
5ERIE.5 Tn X __N ?.p.m.
o F-
W
m W
44
3.0
}
-p z ttl iJ
80 O~ w IL
>- U z ba
11 b_ 111 t3
70
¢3
?'0
0 0 ,o ~o ~o ,~o _so ~o 70 8o
CORR~ECTED A4~ MA55 FLOW~B/SEC)
60 0
FIG. 5.
I0 ~0 30 40 50 &O
CO,~RECTED AI~ MASS PLOW {LB/SEC )
?0 80
EFFICIENCIE5 'mLOTrED 4BOYE DERIVED =ROM
TEMPE~AT~J~E MEA5ut~EMENT CALUE5 ~ I D M /;ORQ, UE
MEASU,~EMENT ,~% LESS .='Ol~ TE5T SERIF-.5 n" BUT
NO I~EL,ABL£ I"O~GUE MEASUL~EMEN ~ ~AILABLE ~0~
TE5T 5ELSIE5 m
Overall efficiency characteristics for six-stage compressor.
FIG. 4. Overall pressure characteristics for six-stage compressor.
%
% P
l- Z W IJ h tl. LLI E) {.3
111 El
W
:3 In trl ttl
(L
0.9
0"8
0"7
0%
0"5
0"4
0"3
0'E
(].~
FIG. 6.
0'0 0"~
I I
KEY TO SYMBOLS.
x ..9470 r .A~. / ' ^ ' P ~ o 8 9 8 0 st>.m, Z
A 75¢0 ~p,m, /~, ~\.
o 6000 *:.p.m. v 50o~ *:,p.m, z
_ • 377.5 ~.p.m. _~LIFI=I× DENOTES POSiTiON OF TEST POINT FI~(]M .SURGE. J~/
"e ~ t ~ x 4
J I " 4 I' "t ~ .5"rA~E 3
, ,¢ s~ " L,/AP~Ie.fU ~= "70
~P//a =o.ao NOTE TML50~,DINATE i x / /
-- E~E'RS TO STA(~E I ,/ / / / ,~ \ ONLY. _SU~SEO, LJENT // e 5TAraE5 DI,BPLAOED A5 /
INDIGATED ~0~ / CLARITY /, ",:~ ¢ ' / 5TA~
/ 4x ~ *5 ~,...ISTA~( 6
, 7 ?/~puL-o.~o
0"3 0'4 0'5 0% % 0'8
FLOW COEFFICIENT Va/u
Stage characteristics deduced from test on six-stage compressor (series n).
%
g
<3
F- 7Z IB o E It, l.u Q [ J
I'0
0"9
0"8
(]'7
0"6
tl/ tq 0'5
bLI . oz 2 3
0-4
!!ii ,' , 15TAI~E (,
,> > "l~J,..~^
0'3 0'¢ 0.5 0'6 0"7 O'B FLOW COEFFICIENT V~./U
FIG. 7. Comparison of stage characteristics deduced from tests on six-stage compressor.
.90
~'0
O~ 't.O
Iv
tit
I'C
13
O~ 3"0
nt "-i tan
tu
5"0
~'0
o
n¢ i ~"
i
H tO ~0 30 ~'0 -~0 60 70 80 ' 0 I O
,.o :i 3 mo .STAQE , ;
8900 ?n
4,41,°. o ~ / 0 o / ?0¢5 ©"
ISO0~ FO
0 iO ~0 30 40 50 60 70 80 A~ ~co~ O-~/~c)
5¢
~NO 5TAQ£ //~
, / "~0¢5
Y
L , Ifi¢' 0 ~/ O~ ~'~o
eo ~o ,o so 6o 7o 8o Ac~ ~.Ow (Ls/sEe)
,804.0 '8980
-i " "q '6000
', $00 £.
Io eo 30 40 50 &O "I0 80
o
~[Z 3'0
uJ IE
u1 ' in
5 ~ 5"rAQE +5o~X// /~
~ !=-o i/S? :,o~s
tO ~0 30 4-0 50 60 70 80
o Q
. -o.
& i::h 5TA~E
89@0
I'O / ' )':ao~o
I o 7o¢5
~ '16000 soo= i
0 I0 ~C 30 40 -~0 &O "~0 - 80 ~,R =Low. (LS/s~c)
FIG. 8. Variation of incidence through six-stage compressor.
12
3'
W
I n 11]
n i'
FIG. 9.
Io ~0 30 4o so &o ~0~ECTED ~Ass ~Lo~ (~B/sEc)
Overall 'pressure characteristics for last four stages.
80
tu ~J
1,1 13-
h 7o bl
h_
hl
r n
6e
3G 0
Fro. 10.
I0 ~o 30 4O 50 C0~ECTED MASS FLOW (LB/,E0)
~0
Overall efficiency characteristics for last four stages.
%
0- <3
l-- Z bJ
tL h IJJ
ttl ~z t/q it3 td
0'8
8"7
O'&
0.5
0'¢
0"3
O'P.
0"I
O.F'
FIG. 1 i .
I I 3 ~ 5 6
KEY TO 5Y~80L5 4 ~ _ × .9700 r.p.m, e / ~ " r %' o 91eP- r:p.'m, f z e,,,jo ~
- ¢ a531 r.O,m. ] 4 . ~ x 7973 np,m,
o 69(=7 ~p.m.
• 5~63 r.p,m, 7 L 9UFFIX DENOTE5 P0StTIr}N //
- - - - - CRARACTERISTIC5 FROM FIQ, & FOR 5tX 7 -~ %,, 3TAC~E COMPE~ESSOR /
7 - -
"----3TARE .
NOTE T1415 ORDINATE REFERS TO STAGE .3 ONLY -SUBSEQLIENT 5TACaES DI5PLACED A5 INDICATED FOR CLARITY
03 0'4
~LOW
/
93 ~o ._------3TAQE 4 / o% ¼",~
.STA~E
f " ~ \ -
5TARE AP~?. ={
• i
0'5 0 % 0"7 0"8
COEFFICIENT va/a
Stage character is t ics deduced from tes t on last four stages.
'J4372 Wt.20/9036 K7 10/56 D&Co. 34/263
14 PRINTED 1N GREAT BRITAIN
R. & M . No. 2985
Publications of the Aeronautical Research Council
ANNUAL TECHNICAL REPORTS OF T H E AERONAUTICAL RESEARCH C O U N C I L (BOUND VOLUMES)
1939 Vol. I. Aerodynami~ Genera], Performance, Airscrews, Engines. SOS. (5Is. 9d.) Vol. II. Stability and Control, Flutter and Vibration, Instruments, Structures, Seaplanes, etc.
63 s. (64 s. 9d.) 194oAero and Hydrodynamics, Aerofoils, Airscrews, Engines, Flutter, Icing, Stability and Control,
Structures, and a miscellaneous section. Sos. (5IS. 9d.)
I941 Aero and Hydrodynamics, Aerofoils, Airscrews, Engines, Flutter, Stability and Control, Structures. 63 s. (64 s. 9d.)
1942 Vol. I. Aero and Hydrodynamics, Aerofoils, Airscrews, Engines. 75 s. (76s. 9d.) Vol. II. Noise, Parachutes, Stability and Control, Structures, V!bration, Wind Tunnels. 47 s. 6d.
(49s. 3~.) 1943 Vol. I. Aerodynamics, Aerofoils, Airscrews. Sos. (81s. 9d.)
Vol. II. Engines, Ftutter, Materials ~, Parachutes, Performance, Stability and Control, Structures. 9os. (92s. 6d.)
1944 Vol. I. Aero and Hydrodynamics, Aerofoils, Aircraft, Airscrews, Controls. 84s. ' (86s. 3d.) Vol. II. l~lutter and Vibration, Materials, Miscellaneous, Navigation, Parachutes, Performance,
Plates and Panels, Stability, Structures, Test Equipment, Wind Tunnels. 84 s. (86s. 3d.) 1945 Vo]. I. Aero and Hydrodynamics, Aerofoils. I3OS. (I32S. 6d.)
Vol. II. Aircraft, Airscrews, Controls. I3OS. (I32S. 6d.) Vol. III. Flutter and Vibration, Instruments, Miscellaneous, Parachutes, Plates and Panels,
Propulsion. I3OS (132s. 3d.) Vol. IV. Stability, Structures, Wind tunnels, Wind Tunnel Technique. I3OS. (I32s. 3d.)
ANNUAL REPORTS OF THE AERONAUTICAL RESEARCH C O U N C I L ~
1937 2s. (2s. 2d.) 1938 IS. 6d. (Is. 8d.) 1939-48 3 s. (3 s. 3d.) INDEX TO ALL REPORTS AND MEMORANDA PUBLISHED IN THE ANNUAL TECHNICAL
REPORTS, AND SEPARATELY ~ ~ ~ ~- April, 195o . . . . . R. & M. No. 26oo. 2s. 6d. (2s. 8d.)
AUTHOR INDEX TO ALL REPORTS AND MEMORANDA OF THE AERONAUTICAL RESEARCH COUNCIL--
I9O9-January, I954 - - - R, & M. No. 2570. 15s. (i5s. 6d.)
INDEXES TO THE TECHNICAL REPORTS OF THE AERONAUTICAL RESEARCH COUNCIL--
December I, 1 9 3 6 - June 30, 1939. July I, 1939 - - June 30, 1945. - July I, 1945 - - June 30, 1946. - July I, 1 9 4 6 - December 31, 1946. January I, 1947 - - June 3o, 1947. -
R. & M. No. 185o. R. & M. No. I950. R. & M. No. 2050. R. & M. No. 215o. R. & M. No. 225o.
xs. 3d. (is. 5d.) IS. (is. 2d.) 1s. (is. 2d.) xs. 3,/. (is. 5d.) is. ,3d. (is. sd.)
PUBLISHED REPORTS AND MEMORANDA OF THE AERONAUTICAL RESEARCH COUNCIL--
Between Nos. 2251-2349. - - R. & M. No. 2350. IS. 9 d. (IS. xxd.) Between Nos. 2351-2449. - - R. & M. No. 245o. 2s. (2s. 2d.) t3etween Nos. 2451-2549. - - R. & M. No. 2550. 2s. 6d. (2s. 8d.) Between Nos. 2551-2649. - - R. & M. No. 265o., 2s. 6d. (~s. 8d.)
Prices in brackas i~wlude postage
H E R M A J E S T Y ' S S T A T I O N E R Y O F F I C E York House, Kingsway, London W.C.2; 423 Oxford Street, London W.! ;
13a Castl~ Street, Edinburgh 2; 39 King Street, Manchester 2; 2 Edmund Streot, Birmingham 3; 109 St. Mary Stroot, Cardiff; Tower Lane,'Bristol 1 ; 80 Chichester Street. Belfast, or through ~ny bookaellev
S.O. Code No. 23-2985
R. & M . No. 2985